Abstract
Based on a pre-constructed simplified chemical reaction mechanism for afterburning in exhaust plumes, this study integrates a gas–solid two-phase combustion flow model with numerical radiative transfer calculations to systematically explore the optimization of computational domains for exhaust plume simulations and reveal the regulatory mechanisms of flight parameters affecting on plume evolution. The results demonstrate that as altitude increases, the plume expands overall, the afterburning zone shifts rearward, and the peak radiation brightness is delayed but with a slight enhancement. Conversely, increasing flight velocity leads to axial elongation and radial compression of the plume, reduced afterburning intensity, and an overall decrease in radiative intensity. This study establishes a correlation between solid rocket motor flight parameters and plume dynamics, providing theoretical and practical guidance for suppressing infrared signature signals in solid rocket motors and designing multifunctional propellant formulations.
1. Introduction
The plume of a solid rocket motor is a high-temperature, high-speed, multi-component free jet of the propellant that is emitted into the environment after combustion in the combustion chamber and accelerated and expanded through the nozzle [1]. Usually, the hot gas emitted through the nozzle contains unburned fuel-rich components (such as CO, H2, etc.), which will mix with the surrounding air and undergo a secondary combustion reaction (i.e., re-ignition), significantly raising the temperature level of the plume [2], thereby enhancing the infrared radiation intensity of the plume and reducing the stealth performance of the rocket motor. Its structural form, parameter distribution, and development process strongly depend on the motor type and flight condition parameters. As shown in Figure 1, in a high-temperature environment, common components in the plume of a solid rocket motor (such as CO2, H2O, etc.) emit radiation with band-selective properties [3].
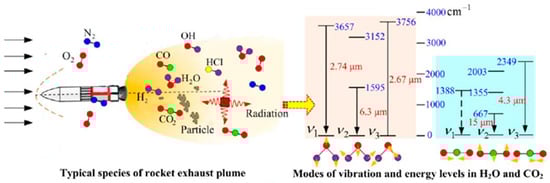
Figure 1.
Schematic diagram of principle of motor plume radiation [3].
The numerical methods for calculating the plume in different altitude regions can mainly be divided into two categories: (1) When the altitude exceeds 40 km and the Knudsen number (Kn) is greater than 0.01, the air is sufficiently rarefied and no longer meets the continuity assumption. Therefore, the Direct Simulation Monte Carlo method (DSMC) needs to be used to find a solution. (2) Solid rocket motors operating at low altitudes (<40 km) are solved using N-S equations. The research subject of this article focuses on solid rocket motors used for medium and low-altitude operations. Ozawa et al. [4] used the GASP CFD solver to consider carbon black particles and studied the radiation characteristics of the Atlas motor’s plume at different heights. Chemical reactions were taken into account in the calculation. The results showed that re-ignition had a significant impact on the motor plume. Stowe et al.’s [5] research indicated that flight speed has a significant influence on radiation characteristics. The coupling and decoupling calculation methods of flow radiation have little effect on the numerical values of radiation in the results. Parameters such as nozzle configuration affect the radiation characteristics by influencing plume structure. Watts [6] used a combined numerical and experimental research method to evaluate the advantages and disadvantages of different turbulence models in calculating the motor plume flow field. The results showed that the standard k-ε model performed best in calculating the shock structure of the plume. Murty et al. [7] calculated the plume characteristics of a multi-nozzle motor. The plume would form a complex wave system structure in free air.
Most of the current solid propellants use aluminum-containing composites. The primary combustion products are CO, CO2, H2, H2O, N2, HCl, and Al2O3. It can be considered that the reaction mechanism of the plume re-ignition consists of the H2/O2 combustion system, the CO/O2 combustion system, the NOx system, and the Cl system [8,9,10].
In the combustion system of H2/CO, the most well known is the C1/C2 - GRI reaction mechanism [11], developed by the US Gas Research Center and verified over many years; it has been widely applied and has now been iterated to “GRI-Mech 3.0”, which includes 53 components and 327 reactions. Regarding the combustion reactions of the Cl system, the research focus is mainly on the gas phase reaction mechanism of the AP/HTPB system. O. P. Korobeinichev et al. [12] proposed a chemical reaction mechanism with 35 components and 58 steps for the combustion of AP/HTPB propellants. Jeppson et al. [8] combined the above research results and proposed an AP/HTPB reaction mechanism with 36 components and 72 steps which can more accurately describe the combustion heat release process. Richard et al. [13] used a 23-component 35-step reaction mechanism in the calculation of afterburner re-ignition. The results showed that HOx and NOx did not generate in the afterburner, and HCl in the afterburner was converted into Cl2 and Cl and further reacted with ozone O3. Zou Yuxuan [14] calculated the influence laws of different chemical reaction mechanisms on the calculation of plume combustion and simplified the chemical reaction mechanism. They believed that the content of NOx in plume combustion was extremely low but required more computing resources. A simplified reaction mechanism without considering nitrogen oxides was established.
Sun et al. [15] analyzed a large number of calculations for missile plume under different flight conditions and obtained the change rule of flight parameters affecting missile motor plume. At the same Mach number, an increase in flight altitude is accompanied by an increase in missile plume boundary; at the same flight altitude, as the flight Mach number increase, the missile plume boundary decreases. The missile plume structure also varies drastically with the change in flight parameters.
This paper is based on the established simplified mechanism of a chemical reaction applicable to the rekindling of the plume, the numerical calculation method for two-phase flow of Al2O3 considering the phenomena of collision and solidification, and the calculation method for radiation parameters of gas–particle coupling. Firstly, we analyze and explain how to choose the appropriate calculation domain under different working conditions and calculation targets; then, we introduce the calculation geometric model and mesh adopted in this article; and finally, we analyze the influences of the incoming flow parameter on the calculation of the plume, which provides a good basis for identifying the target characteristic signal and studying the thermal feedback of the rocket body. Finally, the influence of the incoming flow parameters on the plume calculation is analyzed to provide a reference value for target characteristic signal identification and thermal feedback analysis of the rocket body.
2. Calculation Methods
2.1. Numerical Calculation Methods for Two-Phase Combustion Flow
The research objective of this paper is the plume of medium–low-altitude solid rocket motors. The flight altitude does not exceed 80 km, the Knudsen number (Kn) is less than 0.1, and the continuity assumption is satisfied. Therefore, N-S equations are used for the continuous phase solution.
In the equation, U represents the conserved variable, while E, F, G, Ev, Fv, and Gv are the inviscid/viscous fluxes in three directions, and S is the discrete phase source term and chemical reaction source term.
Watts [6] conducted numerical calculations and experimental comparisons, and concluded that the standard k-ε model has advantages over the k-ω model in calculating the plume of solid motors, predicting shock wave structures and axial positions. Therefore, in this paper, the standard k-ε model is adopted to calculate the turbulent terms, and the gas phase combustion process is calculated using the concept model of vortex dissipation (EDC).
For the discrete phase calculation method, this paper starts from the momentum and energy equations of a single particle, and based on the DPM model, it completes the coupling between the discrete phase and the continuous phase by calculating the particle flux within each grid.
The form of the discrete phase momentum control equation is as follows:
In the equation, m represents mass, u represents velocity, ρ represents density, d represents particle diameter, and Fadd represents additional force. In [16], due to the large pressure gradient in the nozzle, it was considered necessary to take the pressure gradient force into account in the additional force. The subscript p represents particles, and the subscript f represents fluid. From the above equation, it can be seen that the core issue of the momentum equation calculation is the drag force model, i.e., the theoretical calculation of CD.
The form of the discrete phase energy control equation is as follows:
In the equation, cp represents specific heat capacity, h represents the convective heat transfer coefficient, and A represents the heat exchange surface area.
2.2. Atmospheric Far-Field Boundary Conditions and Simplified Mechanism of Plume Chemical Reactions
This article uses the NASA standard atmospheric model [17] for calculation. The calculation results are shown in Figure 2. The specific expressions are as follows:
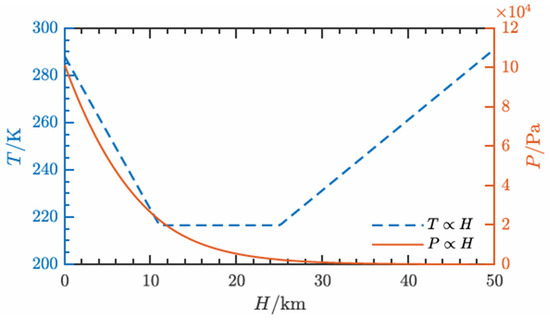
Figure 2.
Atmospheric temperature and pressure at different altitudes.
We refer to the simplified mechanism of chemical reactions established by Zou Yuxuan [14]. The simplified mechanism shown in Table 1 is adopted for the calculation of plume re-ignition of solid rocket motors in this article.

Table 1.
The simplified plume chemical reaction mechanism (K = ATnexp(−Ea/RT)) [14].
2.3. Numerical Calculation Methods for Two-Phase Radiation
The radiation of the plume high-temperature gas mainly comes from the polar molecules produced by the combustion of the propellant. The components selected for the radiation calculation are CO2, H2O, CO, HCl, NO, and OH. For the overall radiation characteristics of the high-temperature gas, the line-by-line calculation method is adopted. At the wavenumber η, the spectral absorption coefficient
is as follows:
where Si,Line is the integrated intensity of the i-th spectral line (cm−2), F is the line shape function of the spectral line (cm), and η0i is the wave number at the center of the i-th spectral line in the computational domain. The spectral line shape adopts the Vogit line shape:
where y = αL/αD, representing Lorentz and Doppler lines, respectively.
Then, the average equivalent parameter method is used to integrate and average the spectral absorption rate over the full spectrum range, obtaining the average full-spectrum absorption rate. The total absorption coefficient is calculated by combining pressure and component concentration. Gas has two effects on incident radiation: scattering and absorption. In engineering calculations, the scattering effect is relatively weak, so only the absorption coefficient of gas needs to be considered. The specific Planck mean absorption coefficient population model (PMAC) [18] is expressed as follows:
where Cabs,gas(κ) is the absorption coefficient of gas ash; p is the gas pressure (atm); Xi is the mole fraction of the i-th component; κp,i is the pressure absorption coefficient of the i-th component; Ibη is the blackbody radiation intensity at wave number η. The blackbody radiation force is calculated according to Planck’s law.
The complex refractive indices of aluminum, liquid alumina, and solid alumina are calculated using the Drude model [19], Kuzimin model [20], and Aufimov model [21], respectively. The calculation models are shown in Equations (10) to (15).
The Drude model for calculating the complex refractive index of aluminum:
where:
The Kuzimin model for calculating the complex refractive index of liquid alumina:
The Anfimov model for calculating the complex refractive index of γ-phase alumina:
where:
After obtaining the complex refractive index of aluminum/alumina through an optical model, the Mie theory is used to obtain the radiation characteristics of individual particles. The absorption coefficient Qabs,λ, scattering coefficient Qsca,λ, attenuation coefficient Qext,λ, and scattering phase function Φλ of particles are expressed as follows:
where χ is the scale parameter of the particle, with χ = π d/λ; Re represents taking the real part of a complex number; θ is the scattering angle; S1 and S2 are the scattering functions.
2.4. Analysis of the Plume Calculation Domain
The calculation domain of the plume is characterized by multiples of the characteristic length, and the characteristic length De is generally defined as the diameter of the nozzle outlet. The descriptions in the following text are all carried out in multiples of the feature length. The corresponding De length of the calculation model in this article is 0.023 m. Table 2 presents the computational domains of various tail flames over the past few years.
Table 2.
Statistical analysis of computational domain sizes for plume external flow fields.
According to the existing literature [15,22,23,24,25,26,27,28,29,30,31,32,33,34,35,36], for two-dimensional axisymmetric examples, the value is generally taken as 200 × 120 De. Due to the high symmetry of the motor plume, this paper chooses a two-dimensional model for calculation.
The size of the plume itself depends on factors such as the geometric parameters of the nozzle, the chamber pressure of the combustion chamber, the flight altitude, and the incoming flow velocity. Therefore, for the actual plume calculation, the calculation target should be clearly defined, the motor configuration and far-field parameters should be selected, and a trial calculation should be conducted first with a coarser grid. Then, the calculation domain should be divided based on the calculation results to minimize the calculation domain as much as possible while meeting the calculation requirements. Finally, the grid is refined according to the determined calculation domain to carry out the actual plume calculation.
In order to evaluate plume intensity under different incoming flow conditions, it is defined by normalizing the flow field velocity v and temperature T as follows:
Among them,
and
, where i represents the position of the dimensionless residual velocity, the infinity sign represents temperature, and the 0 subscript refers to the exit parameters at the center of the nozzle, from the flow to the far-field parameters.
The motor plume exhibits a highly symmetric structure and is analyzed in both axial and radial directions. Along the axial direction, the intensity of the plume is the highest, showing a trend of fluctuation first and then gradually decreasing to the far-field condition. Therefore, only the intensity change at the center of the plume in the axial direction needs to be analyzed; while in the radial direction of the plume, due to the nozzle being in an under-expanded state and further expanding in the air, there is a wave structure, so the intensity changes in the radial direction at different axial positions need to be analyzed separately. With a given calculation accuracy, the appropriate calculation domain size can be obtained.
Taking height and incoming flow velocity as the dependent variables affecting the size of the plume calculation domain, the plume values are calculated. We take an incoming flow condition of 30 km, Ma 1, and an HTPB propellant ϕ50 standard motor with 17% aluminum content as an example for analyzing the domain size required for calculation. According to the above idea, a trial calculation for the coarse mesh using a large calculation domain is carried out first. In this section, the characteristic scale of the coarse mesh calculation domain is taken as 4000 × 200 (92,000 mm × 4600 mm), with a two-dimensional structured grid containing 320,000 grid cells.
The temperature and velocity distribution of the plume axis is shown in Figure 3. Overall, it fluctuates near the nozzle and then decreases to the far-field parameters (p∞ = 1161.2 Pa, v∞ = 313.06 m/s, T∞ = 231.59 K). The excess temperature and velocity are calculated, and the rear half of the axis is cut. The results are shown in Figure 3. When the calculation accuracy is 1%, the excess temperature decreases more slowly; so, the size of its axial calculation domain is 625 De.
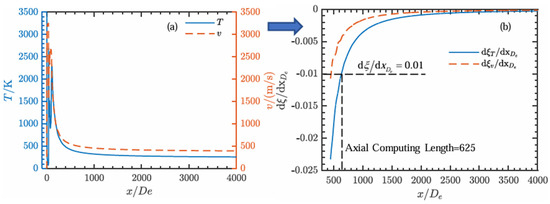
Figure 3.
(a) Axial velocity and temperature profiles in plume flow fields; (b) differential analysis of excess parameters along plume axis.
Since the tangential direction of the plume is affected by both its expansion and the incoming flow parameters, plume analysis is rather complex. Two axial sections are selected and refined near the nozzle. The overall uniformly distributed intercepts are defined as x = [linspace(0,9200,10)∪linspace(9200,92000,10)] × De, where linspace(a,b,c) generates c linearly spaced points from a to b, totaling 19 intercepts. Taking the temperature in the radial direction as an example, the calculation results are shown in Figure 4. Among them, Figure 4a shows the temperature distribution on different sections. It can be seen that near the midline of the plume, the temperature fluctuates greatly. As the radial distance increases, the temperature gradually decreases. The differential of the excess temperature is solved, and the calculation result is shown in Figure 4b. The axial calculation domain of the plume needs to satisfy the condition of the differential of the excess parameter at each position being reduced to 0.01. The corresponding radial length of the calculation domain required for the calculation accuracy is 153 De.
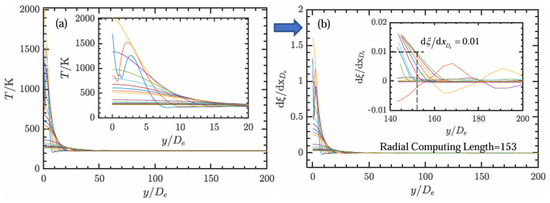
Figure 4.
(a) Temperature distribution across plume cross-sectional planes; (b) corresponding excess temperature differential.
Therefore, for this working condition, the calculation accuracy ‘dξ/dx < 1%’ is taken as the criterion, and the size of the calculation domain that satisfies the accuracy requirement is 625 × 153 De. According to the above method, the program for analyzing the plume calculation domain was calculated in batches and written out. The minimum calculation domain of the obtained plume that meets the accuracy requirement is shown in Table 3. It can be observed that there is a clear regularity between the plume calculation domain and the incoming flow velocity and flight altitude. Height affects the back pressure and far-field temperature, and thereby influences the degree of plume expansion. Therefore, as the height increases, both the axial and radial calculation domains of the plume need to increase. When the height rises by 10 km, the average increase in the axial calculation domain of the plume is 61.2%, and the average increase in the radial calculation domain is 119.9%. The influence of the incoming flow velocity on the plume is mainly reflected in the elongation of the plume. With the increase in the incoming flow velocity, the axial calculation domain of the plume increases and the radial calculation domain decreases. When the velocity increases by 1 Ma, the average axial calculation domain of the plume increases by 10.1% and the average radial calculation domain decreases by 53.9%. However, since the far-field parameters change nonlinearly with height and Mach number, the reference value of the average rate of change is relatively low.
Table 3.
The minimum plume calculation domain that meets the accuracy requirement (De).
The computational domain sizes adopted in the subsequent sections on the influence laws of changing height and speed in this paper are as follows: 625 × 153 De and 338 × 95 De, respectively.
2.5. Analysis of Grid Independence
The benchmark example of 10 km, Ma 1, and an HTPB propellant containing 17% aluminum was selected for the grid independence calculation, and the size of the plume calculation domain was 625 × 153 De.
The focus of this paper is the non-equilibrium reaction field of the plume. Therefore, the plume temperature, the concentration of OH characterizing combustion, and the main components of gas radiation, CO2 and H2O, are taken as parameters for grid independence analysis. The number of grid cells contained in the rough, medium, and good grid scales is 16 w, 24 w, and 35 w respectively, and they are densified inside the motor and near the nozzle outlet where the plume changes sharply.
It can be seen from Figure 5 and Figure 6 that the calculation results of the rough grid scale and the medium grid scale differ greatly. With further refinement of the grid, the change in the calculation results is relatively small. The calculation results of the medium grid scale are in good agreement with those of the good grid scale. Meanwhile, considering the calculation accuracy and calculation cost, the medium grid scale is sufficient to meet the requirements of the numerical calculation. Therefore, the numerical simulation work in this paper is carried out on a medium grid scale.
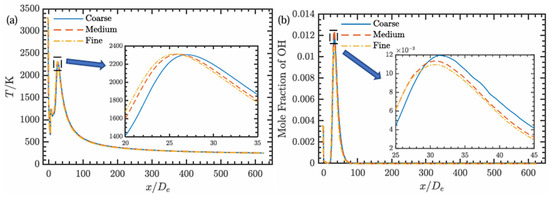
Figure 5.
Plume axis parameters for different grids: (a) temperature; (b) OH mole concentration.
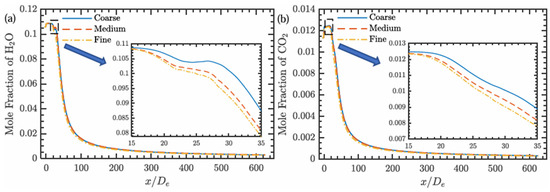
Figure 6.
Plume axis parameters for different grids: (a) H2O molar concentration; (b) CO2 mole concentration.
3. Results
3.1. Effects of Flight Altitude on Plume Characteristics
During the operation of solid rocket motors, the atmospheric pressure and temperature change greatly at different flight altitudes, which have a great influence on the flow and re-ignition of the plume. According to Equations (4) and (5) in Section 2.2 of the far-field parameter calculation formula, the specific data of atmospheric far-field conditions are shown in Table 4. It is generally believed that the atmosphere below 100 km belongs to the homogeneous layer, the percentage of oxygen is basically unchanged, and the volume fraction is about 21%.
Table 4.
Far-field conditions corresponding to different heights.
Other calculation conditions are as follows: an incoming flow velocity of Ma 1, an HTPB propellant containing 17% aluminum, a gas temperature of 3314 K, with the components shown in Table 5, a combustion chamber pressure of 6 MPa, with the particle size reference in [24], and an R-R distribution with an average particle size of 5.38 µm.
Table 5.
Mole fractions of components at nozzle outlet of different types of propellant motors.
First of all, we must consider that the two-phase plume flow field of re-ignition is jointly affected by multiple factors, mainly air expansion, particle lag, air mixing re-ignition, etc. The basic flow field parameters at different heights are shown in Figure 7, Figure 8 and Figure 9. Near the nozzle outlet, due to the temperature and speed lag of alumina, there is no complex Mach node structure on the plume axis at 0 km. The two-phase flow lag of high-temperature and low-speed particles is the main factor.
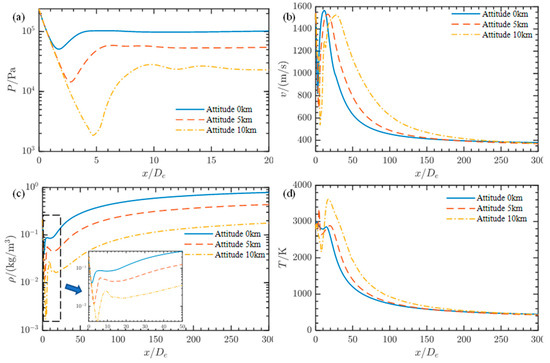
Figure 7.
Comparison of basic flow field parameters of plume axis at different heights: (a) pressure; (b) velocity; (c) density; (d) temperature.
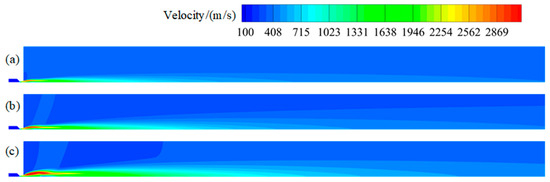
Figure 8.
Velocity contour maps of plume at different altitudes: (a) 0 km; (b) 5 km; (c) 10 km.
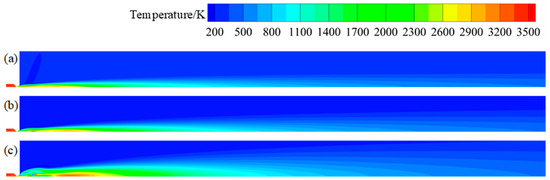
Figure 9.
Temperature contour maps of plume at different altitudes: (a) 0 km; (b) 5 km; (c) 10 km.
Then, the gas continues to expand in the air, forming the first Mach disk; the speed decreases sharply, the kinetic energy of the jet is transformed into internal energy, and the temperature of the plume rises rapidly after the formation of the Mach disk. Finally, the speed recovers and the temperature falls back. With the increase in flight height, the Mach disk increases, the degree of under-expansion is intensified, and the temperature and speed caused by the sudden change become more obvious.
Continuing along the axis, temperature shows a second obvious peak, which is caused by the re-ignition of gas and air mixing. As the flight height increases, the position of temperature rise moves backward and the degree increases. Finally, the temperature, pressure, velocity, and other parameters of the plume gradually decrease, close to the far-field parameters, and it can be clearly observed that with the increase in height, the axial and radial width of the plume increases.
Figure 10, Figure 11 and Figure 12 show the contour maps of some components and the axial component distribution of the plume. First of all, OH can represent the degree of re-ignition of the plume, and the impact of flight height on re-ignition of the plume can be more clearly observed. Using an OH mass fraction of 0.5% as the standard, the re-ignition starting position of the 0 km, 5 km, and 10 km axis is 12.21, 16.62, and 21.37 De, respectively. The duration is 21.91, 26.65, and 38.70 De; as flight altitude increases, the re-ignition areas shift backward by 36.1% and 28.6%, and the re-ignition intervals expand by 21.6% and 45.2%. From the mass fraction contour map of OH, the regional distribution of re-ignition can be seen. Near the nozzle outlet, gas and air begin to mix under combustion, but the overall reaction degree is low. With the development of flow, the reaction degree increases gradually and reaches a peak in the core area of the axis downstream of the plume.
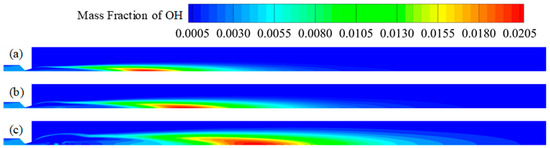
Figure 10.
Contour maps of OH mass fraction in plume at different altitudes: (a) 0 km; (b) 5 km; (c) 10 km.
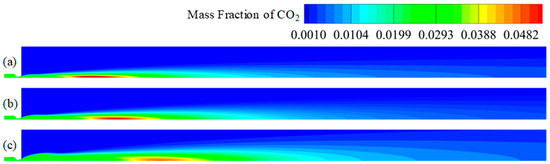
Figure 11.
Contour maps of CO2 mass fraction in plume at different altitudes: (a) 0 km; (b) 5 km; (c) 10 km.
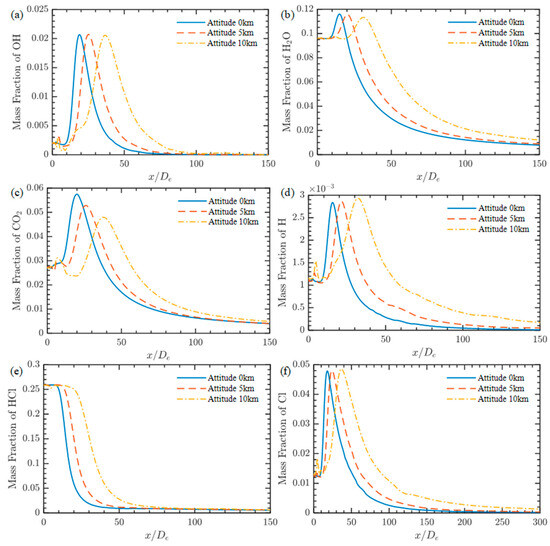
Figure 12.
Mass fraction of components along plume axis at different heights: (a) OH; (b) H2O; (c) CO2; (d) H; (e) HCl; (f) Cl.
The main components of radiation, H2O and CO2, also have rising peaks in the corresponding intense re-ignition area. At the same time, the motor nozzle outlet gas contains a high HCl content, which participates in the reaction in the plume re-ignition, is decomposed to produce a large number of Cl atoms, and gradually diffuses in the atmosphere. In the upper atmosphere, Cl atoms participate in the reactions Cl + O3→C1O + O2, which will destroy atmospheric ozone, potentially causing environmental pollution. Ross’s observation of Titan IV launch space found that the motor plume caused 40% ozone depletion [37].
Figure 13 shows the axis distribution of gas and particle absorption coefficients in the plume. It can be seen that the overall gas absorption coefficient is high, and there is a peak value in the re-ignition region. As flight altitude increases, the gas absorption coefficient decreases, which is determined by the selected model. Therefore, the calculated gas absorption coefficient is reduced. The radiation parameters of the particles are mainly concentrated near the nozzle outlet and are generally low.
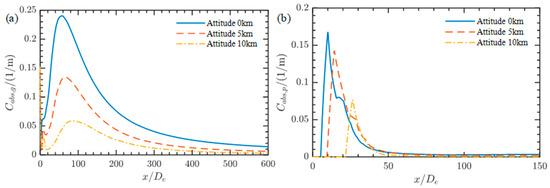
Figure 13.
Distribution of radiation absorption coefficients of plume axis at different heights: (a) gas; (b) particles.
The final calculation results of radiation intensity are shown in Figure 14. The radiation intensity is mainly affected by radiation parameters and temperature. Therefore, as flight altitude increases, the re-ignition area shifts backward, the reaction degree increases, and the corresponding peak radiation intensity area shifts backward by 24, 42, and 55 De, respectively. The peak values increase slightly to 9.4, 9.7, and 10.1 MW/m2.
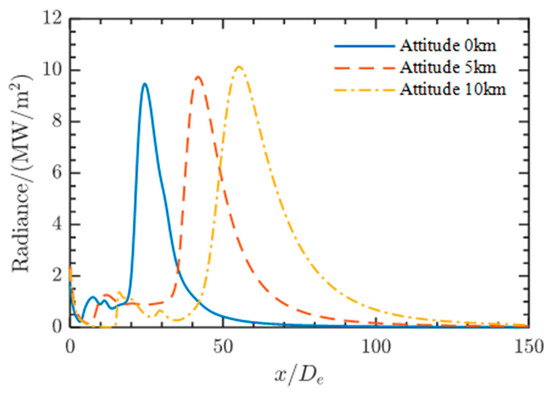
Figure 14.
Radiation intensity of plume axis at different heights.
3.2. Effects of Flight Velocity on Plume Characteristics
During the flight of solid rockets, the flight speed will change with the design trajectory; so, it is necessary to analyze the plume at different flight speeds. At the same time, the projectile body itself is in relative motion with the incoming flow, so changing the incoming flow speed is computationally equivalent to changing the flight speed of the motor’s plume. In this section, calculations and analyses are conducted at a height of 5 km and with incoming velocities ranging from Ma 1 to Ma 5.
First of all, the increase in flight Mach number has an axial lengthening effect on the whole plume, while the increase in dynamic pressure between the environment and the plume plays a radial compression role. Figure 15 shows the change curve of flow field parameters of the plume axis with different Mach numbers. According to Figure 15a,b, it can be clearly seen that the plume velocity changes according to the same trend under different Mach numbers. Figure 15c shows that an increase in Mach number leads to an increase in flow pressure outside the plume, thereby reducing the degree of under-expansion at the axis position. Figure 15d shows the temperature distribution of the plume axis. It can be seen that the peak temperature of the plume axis caused by re-ignition decreases with the increase in Mach number. This is because the movement speed of the far-field free flow relative to the gas increases, and the amount of oxygen diffused to the core area of the plume to participate in the mixed combustion decreases, thus slowing down the degree of re-ignition to a certain extent. At the same time, the overall temperature of the plume decreases, the high-temperature area elongates, and the peak value shifts back. This is because the free incoming flow temperature is much lower than the plume temperature, which will reduce the heat of the plume. Therefore, the higher the flying Mach number, the stronger the cooling effect of fast-moving air on the plume.
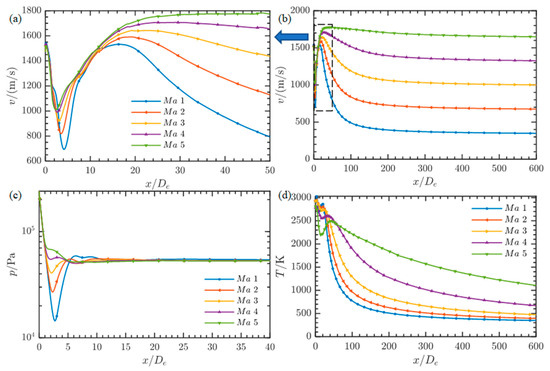
Figure 15.
Comparison of basic flow field parameters of plume axis at different flight speeds: (a) speed (near the nozzle outlet); (b) speed (entire field); (c) pressure; (d) temperature.
As shown in Figure 16, different Mach numbers have little influence on the changing trend of the plume velocity, and there is an obvious two-phase flow lag near the plume axis. When the Mach number of the incoming flow is high, the plume quickly reaches a state of equilibrium with the incoming flow. As shown in Figure 17, the influence of flight Mach number on the shape of the plume can be seen more clearly. With the increase in Mach number, the plume is compressed and elongated as a whole, and Figure 17a,b show the first Mach disk in the plume. However, with the increase in speed, the wave structure in the plume basically disappears and the re-ignition core region is weakened as a whole.
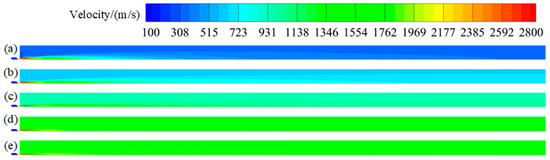
Figure 16.
Velocity contour maps of plume at different flight speeds: (a) Ma 1; (b) Ma 2; (c) Ma 3; (d) Ma 4; (e) Ma 5.
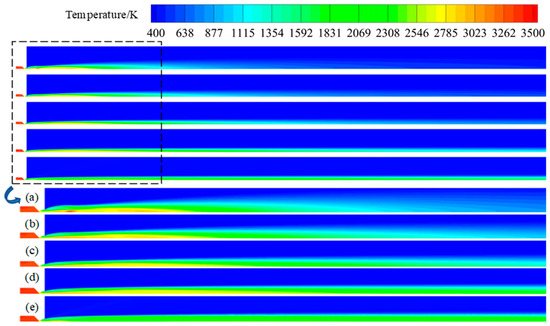
Figure 17.
Temperature contour maps of plume at different flight speeds and local enlargements: (a) Ma 1; (b) Ma 2; (c) Ma 3; (d) Ma 4; (e) Ma 5.
In order to further analyze the impact of flight speed on the re-ignition of the plume, the components of the plume axis are shown in Figure 18, where the OH concentration reflects the degree of re-ignition of the plume. Taking 0.5% OH as the standard, the position change of the re-ignition core area is shown in Table 6. As the Mach number increases, the nonlinear rear part of the plume re-ignition core moves backward, and the length of the core increases by 64.7%, 49.1%, 87.7%, and 84.3%. The trends of changes in other components are basically the same, with the change rate of components decreasing and the reaction peak value decreasing.
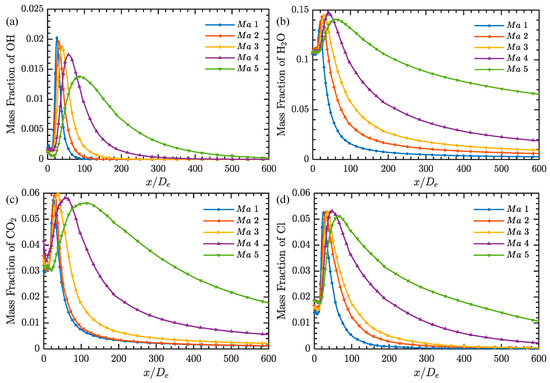
Figure 18.
Component mass fractions of plume axis at different flight speeds: (a) OH; (b) H2O; (c) CO2; (d) Cl.
Table 6.
The variation in the re-ignition core area position at different flight Mach numbers.
Figure 19 and Figure 20 show the contour maps of the mass fraction of OH and CO2 in the plume at different flight speeds. They figures better show the change trend of the plume after increasing the flight speed; moreover, the overall spatial distribution law is unchanged, showing the effects of axial elongation and radial compression.
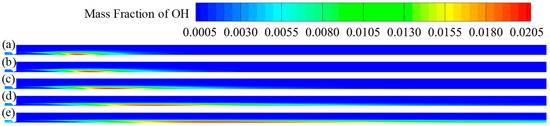
Figure 19.
Contour maps of OH mass fraction in plume at different flight speeds: (a) Ma 1; (b) Ma 2; (c) Ma 3; (d) Ma 4; (e) Ma 5.
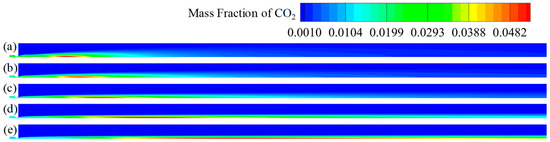
Figure 20.
Contour maps of CO2 mass fraction in plume at different flight speeds; (a) Ma 1; (b) Ma 2; (c) Ma 3; (d) Ma 4; (e) Ma 5.
Figure 21 shows the changes in gas and particle absorption coefficients on the plume axis at different flight speeds. The gas absorption coefficients show an overall decrease, with a trend of a backward peak value, which is particularly obvious under conditions of Ma 4 and 5, where the peak value is 72% lower than that under conditions of Ma 3. For the absorption coefficient of particles, the peak position does not change much, and the subsequent reduction process gradually slows down with the increase in Mach number. This is because the particles are mainly located near the plume axis, and the particles at the nozzle outlet are less affected by the free incoming flow. Subsequently, with the diffusion of particles and the mixing of the incoming flow and the plume, the particle absorption coefficient decreases as a whole and moves along the axis.
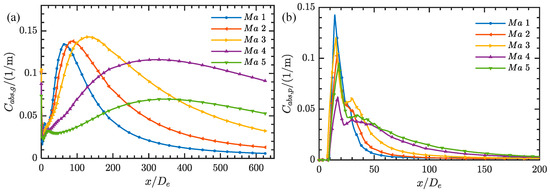
Figure 21.
Distribution of radiation absorption coefficients of plume axis at different flight speeds: (a) gas; (b) particles.
The calculation results of the radiation intensity along the tail flame axis at different flight speeds are shown in Figure 22. They exhibit a clear pattern. As the Mach number increases, the radiation intensity of the tail flame decreases, and the peak radiation area shifts backward. The peak radiation intensities are 10.01, 7.47, 6.43, 5.53, and 4.47 MW/m2.
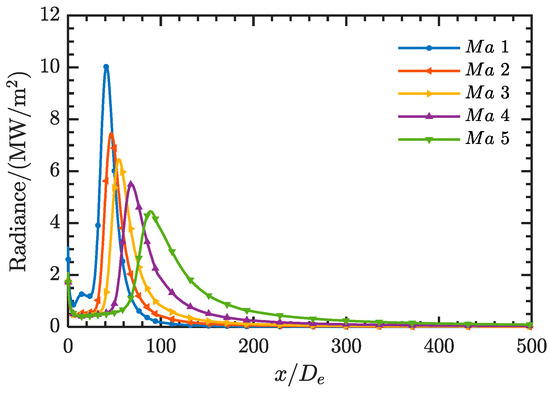
Figure 22.
Radiation intensity of plume axis at different flight speeds.
4. Conclusions
(1) This paper conducts an analysis on the size of the calculation domain for the plume of solid rocket engines. It defines the excess temperature and velocity. It is believed that when the rate of change in the excess parameters in the axial and radial directions is less than 1%, the calculation domain meets the accuracy requirements. For every 10 km increase in altitude, the axial size of the calculation domain expands by 61.2% and the radial size expands by 119.9%, and for every 1 Ma increase in speed, the axial size of the calculation domain expands by 10.1% and the radial size shrinks by 53.9%.
(2) With an OH mass fraction of 0.5% as the re-ignition standard, the re-ignition starting position of the 0 km, 5 km, and 10 km axis is 12.21, 16.62, and 21.37 De, respectively. The duration is 21.91, 26.65, and 38.70 De; as the flight altitude increases, the re-ignition areas shift backward by 36.1% and 28.6%, and the re-ignition intervals expand by 21.6% and 45.2%. Moreover, the reaction intensity increases. Correspondingly, the peak radiation intensity areas move backward by 24, 42, and 55 μm. The peak values increase slightly to 9.4, 9.7, and 10.1 MW/m2.
(3) Taking 0.5% OH as the standard, as the Mach number increases, the nonlinear rear part of the plume re-ignition core moves backward, and the length of the core increases by 64.7%, 49.1%, 87.7%, and 84.3%. The trends of changes in other components are basically the same, with the change rate of components decreasing and the reaction peak value decreasing. The corresponding peak radiation intensities are 10.01, 7.47, 6.43, 5.53, and 4.47 MW/m2.
Author Contributions
Conceptualization, Y.L.; Methodology, M.P. and Y.Z.; Validation, R.Z.; Investigation, Y.B.; Data curation, M.P.; Writing—original draft, M.P.; Writing—review & editing, Y.L. All authors have read and agreed to the published version of the manuscript.
Funding
This work was financially supported by the Shaanxi Province QinChuangyuan “Scientist Engineer” Team Construction Project, under grant number 2023KXJ-119.
Data Availability Statement
The original contributions presented in this study are included in the article. Further inquiries can be directed to the corresponding author.
Conflicts of Interest
The authors declare no conflicts of interest.
References
- Higgins, C.J.; Smithson, T.; Coxhill, I.; Fournier, P.; Ringuette, S. Characterising the Infrared Signature of a Liquid Propellant Engine Plume. In Proceedings of the 52nd AIAA/SAE/ASEE Joint Propulsion Conference, Salt Lake City, UT, USA, 25–27 July 2016. [Google Scholar] [CrossRef]
- Yang, Z.; Envelope, J.Z.P.; Shan, Y. Effects of forward-flight speed on plume flow and infrared radiation of IRS-integrating helicopter-ScienceDirect. Chin. J. Aeronaut. 2022, 35, 155–168. [Google Scholar] [CrossRef]
- Niu, Q. Phenomenology Study on High-Speed Target Radiation in Continuous-Flow Regime. Northwestern Polytechnical University, Xi’an, China, 2019. [Google Scholar]
- Ozawa, T.; Garrison, M.B.; Levin, D.A. Accurate Molecular and Soot Infrared Radiation Model for High-Temperature Flows. J. Thermophys. Heat Transf. 1971, 21, 19–27. [Google Scholar] [CrossRef]
- Stowe, R.; Ringuette, S.; Fournier, P.; Smithson, T.; Pimentel, R.; Alexander, D.; Link, R. Effect of flight and motor operating conditions on infrared signature predictions of rocket exhaust. Int. J. Energet. Mater. Chem. Propuls. 2015, 14, 29–56. [Google Scholar] [CrossRef]
- Watts, D. Assessing Computational Fluid Dynamics Turbulence Models for Rocket Exhaust Plume Simulation. In Proceedings of the 52nd AIAA/SAE/ASEE Joint Propulsion Conference, Salt Lake City, UT, USA, 25–27 July 2016. [Google Scholar] [CrossRef]
- Murty, M.S.R.C.; Chakraborty, D. Plume Interaction and Base Flow Analysis of a Twin Engine Flight Vehicle. J. Inst. Eng. (India) Ser. C 2017, 98, 379–385. [Google Scholar] [CrossRef]
- Jeppson, M.B.; Beckstead, M.W.; Jing, Q. A kinetic model for the premixed combustion of a fine AP/HTPB composite propellant. Proceeding of the 36th AIAA Aerospace Sciences Meeting and Exhibit, Reno, NV, USA, 12–15 January 1998. [Google Scholar]
- Tanner, M.W. Multidimensional Modeling of Solid Propellant Burning Rates and Aluminum Agglomeration and One-Dimensional Modeling of RDX/GAP and AP/HTPB. Ph.D. Thesis, Brigham Young University, Provo, UT, USA, 2008. [Google Scholar]
- Davis, S.G.; Joshi, A.V.; Wang, H. An optimized kinetic model of H2/CO combustion. Proc. Combust. Inst. 2005, 30, 1283–1292. [Google Scholar] [CrossRef]
- Smith, G.P.; Golden, D.M.; Frenklach, M.; Moriarty, N.W.; Eiteneer, B.; Goldenberg, M.; Bowman, C.T.; Hanson, R.K.; Song, S.; Gardiner, W.C., Jr.; et al. GRI-Mech 3.0. [DB/OL]. 1999. Available online: https://www.me.berkeley.edu/gri_mech/ (accessed on 4 August 2025).
- Korobeinichev, O.P.; Ermolin, N.E.; Chernov, A.A.; Emel’yanov, I.D. Flame structure, kinetics and mechanism of chemical reactions in flames of mixed composition based on ammonium perchlorate and polybutadiene rubber. Combust. Explos. Shock. Waves 1992, 28, 366–371. [Google Scholar] [CrossRef]
- Denison, M.R.; Lamb, J.J.; Bjorndahl, W.D.; Wong, E.Y.; Lohn, P.D. Solid Rocket Exhaust in the Stratosphere: Plume Diffusion and Chemical Reactions. J. Spacecr. Rocket. 1994, 31, 435–442. [Google Scholar] [CrossRef]
- Zou, Y. Calculation of Non-Equilibrium Reactive Plume Characteristics for Solid Rocket Motors. Master’s Thesis, Northwestern Polytechnical University, Xi’an, China, 2024. [Google Scholar]
- Sun, Z.; Xu, D.; He, G. Effect of flight status parameters on missile motor plume. J. Solid Rocket. Technol. 2005, 3, 188–191. [Google Scholar]
- Yang, W.; Kuang, L.; Chu, K.; Liu, P. Study of Gas-Particle Flow in Solid Rocket Motor Based on Computational Fluid Method-Discrete Element Method. J. Propuls. Technol. 2019, 40, 1546–1553. [Google Scholar] [CrossRef]
- NASA TM-X-74335; U.S. Standard Atmosphere. NTRS: Chicago, IL, USA, 1976. Available online: https://ntrs.nasa.gov/citations/19770009539 (accessed on 4 August 2025).
- Philippe, R.; Anouar, S. Updated band model parameters for H2O, CO2, CH4 and CO radiation at high temperature. Ternational J. Heat Mass Transf. 2012, 55, 3349–3358. [Google Scholar]
- Harrison, J.; Brewster, M.Q. Simple model of thermal emission from burning aluminum in solid propellants. Thermophys. Heat Transf. 2009, 23, 630–634. [Google Scholar] [CrossRef]
- Kuzmin, V.A.; Maratkanova Zagray, I.A. Modeling of thermal radiation of heterogeneous combustion products in model solid rocket engine plume. Procedia Eng. 2017, 206, 1801–1807. [Google Scholar] [CrossRef]
- Anfimov, N.; Karabadyak, G.; Khmelinin, B.; Plastinin, Y.; Rodionov, A. Analysis of mechanisms and nature of radiation from aluminum oxide in different phase states in solid rocket exhaust plumes. Proceeding of the AIAA 28th Thermophysics, Orlando, FL, USA, 6–9 July 1993. [Google Scholar]
- Na, J.; Yang, L.; Li, W.; Zhang, M.; Cui, M. Modeling and analysis of wake flame temperature field characteristics of solid rocket engine. Transducer Microsyst. Technol. 2023, 42, 10–13+18. [Google Scholar]
- She, S.; Li, F.; Wang, B.; Zhang, X.; Fan, F. Real-Time Simulation of Plume Infrared Image Based on Particle System. Syst. Simul. Technol. 2022, 18, 285–290. [Google Scholar]
- Bao, X.; Yv, X.; Wamg, Z.; Mao, H.; Xiao, Z. Effects of Flight Height on Flow and Radiation Characteristics of Solid Rocket Two-Phase Plume. J. Propuls. Technol. 2021, 42, 569–577. [Google Scholar]
- Wang, Z.; Song, Z.; Zhang, B.; Li, J.; Xv, C. Variation law of flow field and radiation characteristics of solid plume with flight state. J. Southeast Univ. (Nat. Sci. Ed.) 2021, 51, 1040–1048. [Google Scholar]
- Paoli, R.; Poubeau, A.; Cariolle, D. Large-Eddy Simulations of a Reactive Solid Rocket Motor Plume. Am. Inst. Aeronaut. Astronaut. 2020, 58, 1639–1656. [Google Scholar] [CrossRef]
- Zhao, Y.H.; Bao, Y.Y.; Zhao, Y.; Ding, Y.; Chen, J.; Wang, J. Solid rocket plume temperature and heat flux measurements. J. Solid Rocket. Technol. 2018, 41, 289–294. [Google Scholar]
- Huang, Z.; Li, X.; Feng, Y.; Guo, Y.; Ma, D. Infrared radiation characteristics of aircraft exhaust system with binary rectangle nozzle. Laser Infrared 2017, 47, 460–464. [Google Scholar]
- Zhang, X. Research on the Infrared Radiation Characteristic of Hypersonic Aircraft Plume. Master’s Thesis, Harbin Institute of Technology, Harbin, China, 2017; p. 16. [Google Scholar]
- Niu, Q.; Gao, W.; Sun, Y.; Dong, S. Study on Influence of High-Energy Explosive Components on Infrared Radiation Signature of Air to Air Missile Plume. J. Ordnance Equip. Eng. 2021, 42, 1–7. [Google Scholar]
- Vuorinen, V.; Yu, J.; Tirunagari, S.; Kaario, O.; Larmi, M.; Duwig, C.; Boersma, B.J. Large-eddy simulation of highly underexpanded transient gas jets. Phys. Fluids 2013, 25, 016101. [Google Scholar] [CrossRef]
- Feng, Y.S.; Li, X.X.; Lu, Y.; Jin, W. Numerical Calculation of Infrared Radiation Characteristics of the Exhaust Plume Outside a Rectangular Nozzle. Acta Armamentarii 2013, 34, 437–442. [Google Scholar]
- Liu, Z.; Shao, L.; Wang, Y.; Sun, X. Influence on Afterburning on Infrared Radiation of Solid Rocket Exhaust Plume. Acta Opt. Sin. 2013, 33, 40–47. [Google Scholar]
- Hu, S. Research on the Flow Field and Acoustic Field Characteristics of Supersonic Gas Jet in Solid Rocket Mortors. Northwestern Polytechnical University, Xi’an, China, 2012; p. 45. [Google Scholar]
- Wang, W.C.; Li, S.P.; Zhang, Q.; Wang, N.F.; He, D.W. Research on the calculation method of infrared signature of rocket motor exhaust plume. J. Propuls. Technol. 2010, 31, 423–427. [Google Scholar]
- Zhang, G.X.; Zhou, W.M.; Zhang, G.C. Study on characteristics of flow field in exhaust plume for SRM. J. Solid Rocket Technol. 2008, 31, 19–23. [Google Scholar]
- Ross, M.N.; Benbrook, J.R.; Sheldon, W.R.; Zittel, P.F.; McKenzie, D.L. Observation of Stratospheric Ozone Depletion in Rocket Exhaust Plumes. Nature 1997, 390, 62–64. [Google Scholar]


Disclaimer/Publisher’s Note: The statements, opinions and data contained in all publications are solely those of the individual author(s) and contributor(s) and not of MDPI and/or the editor(s). MDPI and/or the editor(s) disclaim responsibility for any injury to people or property resulting from any ideas, methods, instructions or products referred to in the content. |
© 2025 by the authors. Licensee MDPI, Basel, Switzerland. This article is an open access article distributed under the terms and conditions of the Creative Commons Attribution (CC BY) license (https://creativecommons.org/licenses/by/4.0/).