1. Introduction
Cross-eye jamming is an electronic countermeasure method based on the principle of angular glint [
1] for monopulse radar. This method typically consists of two interference antennas, which emit two equal-amplitude and opposite-phase interference signals. Through the cancellation of interference between the two signals, phase wavefront distortion is generated at the radar. Consequently, the radar continues to search in the direction of the wavefront, deviating from the target direction and resulting in an angle measurement error [
2,
3,
4,
5].
However, the prerequisite for effective interference to be implemented by cross-eyes is that the two interfering signals must be close-to-equal amplitude and opposite phase. This is too strict for hardware requirements in practical implementation. Researchers have developed enhanced methods like retrodirective cross-eye [
6,
7,
8,
9,
10,
11,
12,
13] and multi-source retrodirective cross-eye [
14,
15,
16,
17,
18,
19,
20,
21]. These advancements have enhanced the cross-eye’s tolerance to harsh parameters and have reduced its degree of freedom. However, these methods continue to confront challenges such as stringent phase parameter tolerance, interference effects constrained by platform corners, and an excessive number of interference loops or antennas, which hinder their practical applicability. Concurrently, the military confidentiality of cross-eye jamming technology and the stringent hardware parameters of cross-eye jamming systems have led to a paucity of published research on cross-eye interference experiments. The extant literature on the subject is limited to two-source retrodirective cross-eye jamming experiments by du Plessis [
22,
23,
24] and a traditional two-source cross-eye jamming experiment by Lee [
25]. Consequently, there is a significant need for the development of new monopulse radar jamming methods that exhibit higher universality and greater phase tolerance.
In order to enhance the strict parameter tolerance requirements for cross-eye jamming from two sources and the limitations of the multi-source cross-eye interference system, which is too complex and difficult to implement, Y. Ning et al. [
26]. proposed a multivariate vector synthesis interference method based on the principle of testing the angle measurement accuracy of the seeker in a radio-frequency hard-in-the-loop simulation system [
27,
28]. This method is based on a typical cross-eye structure, and by introducing a third unit, the degree of freedom of the interference system is improved, expanding the interference range from one-dimensional to two-dimensional planes. This technology greatly improves the optional range and breadth of interference, and, due to the increased freedom of the interference system, this type of interference method has higher phase parameter tolerance and a better interference effect.
This paper proposes and conducts a jamming experiment utilizing phase comparison monopulse radar angle measurement, with the objective of verifying the validity of the theory of multiple-antenna synthetic interference. A comprehensive overview of the experimental system’s calibration and testing procedures is provided. The experimental results substantiate the efficacy and feasibility of multiple-antenna synthetic interference technology in practical applications. The findings of this study provide both theoretical support and indicator reference for the subsequent construction of practical multiple antenna synthetic interference systems.
2. Mathematical Theory of Multiple Antennas Synthesis Interference Theory
The triple constitutes the fundamental physical model that employs three antennas as the minimum unit in the theory of synthesizing equivalent radiation centers using multiple antennas. Control of synthetic interference technology is achieved by simultaneously feeding the same frequency signal to the antenna units in the array, thereby enabling the triplet antenna to obtain an equivalent radiation center. The position of the equivalent radiation center in space depends on the feeding amplitude and phase parameters of the triplet antenna. Through hardware adjustments of the triplet antenna’s amplitude and phase values, multiple antennas can be utilized to control the position of the equivalent radiation center. This theoretical framework finds application in the simulation of radar target echoes.
The Poynting vector method is utilized to address this component of the project from the standpoint of energy flow density. The subsequent derivation is specific to this approach.
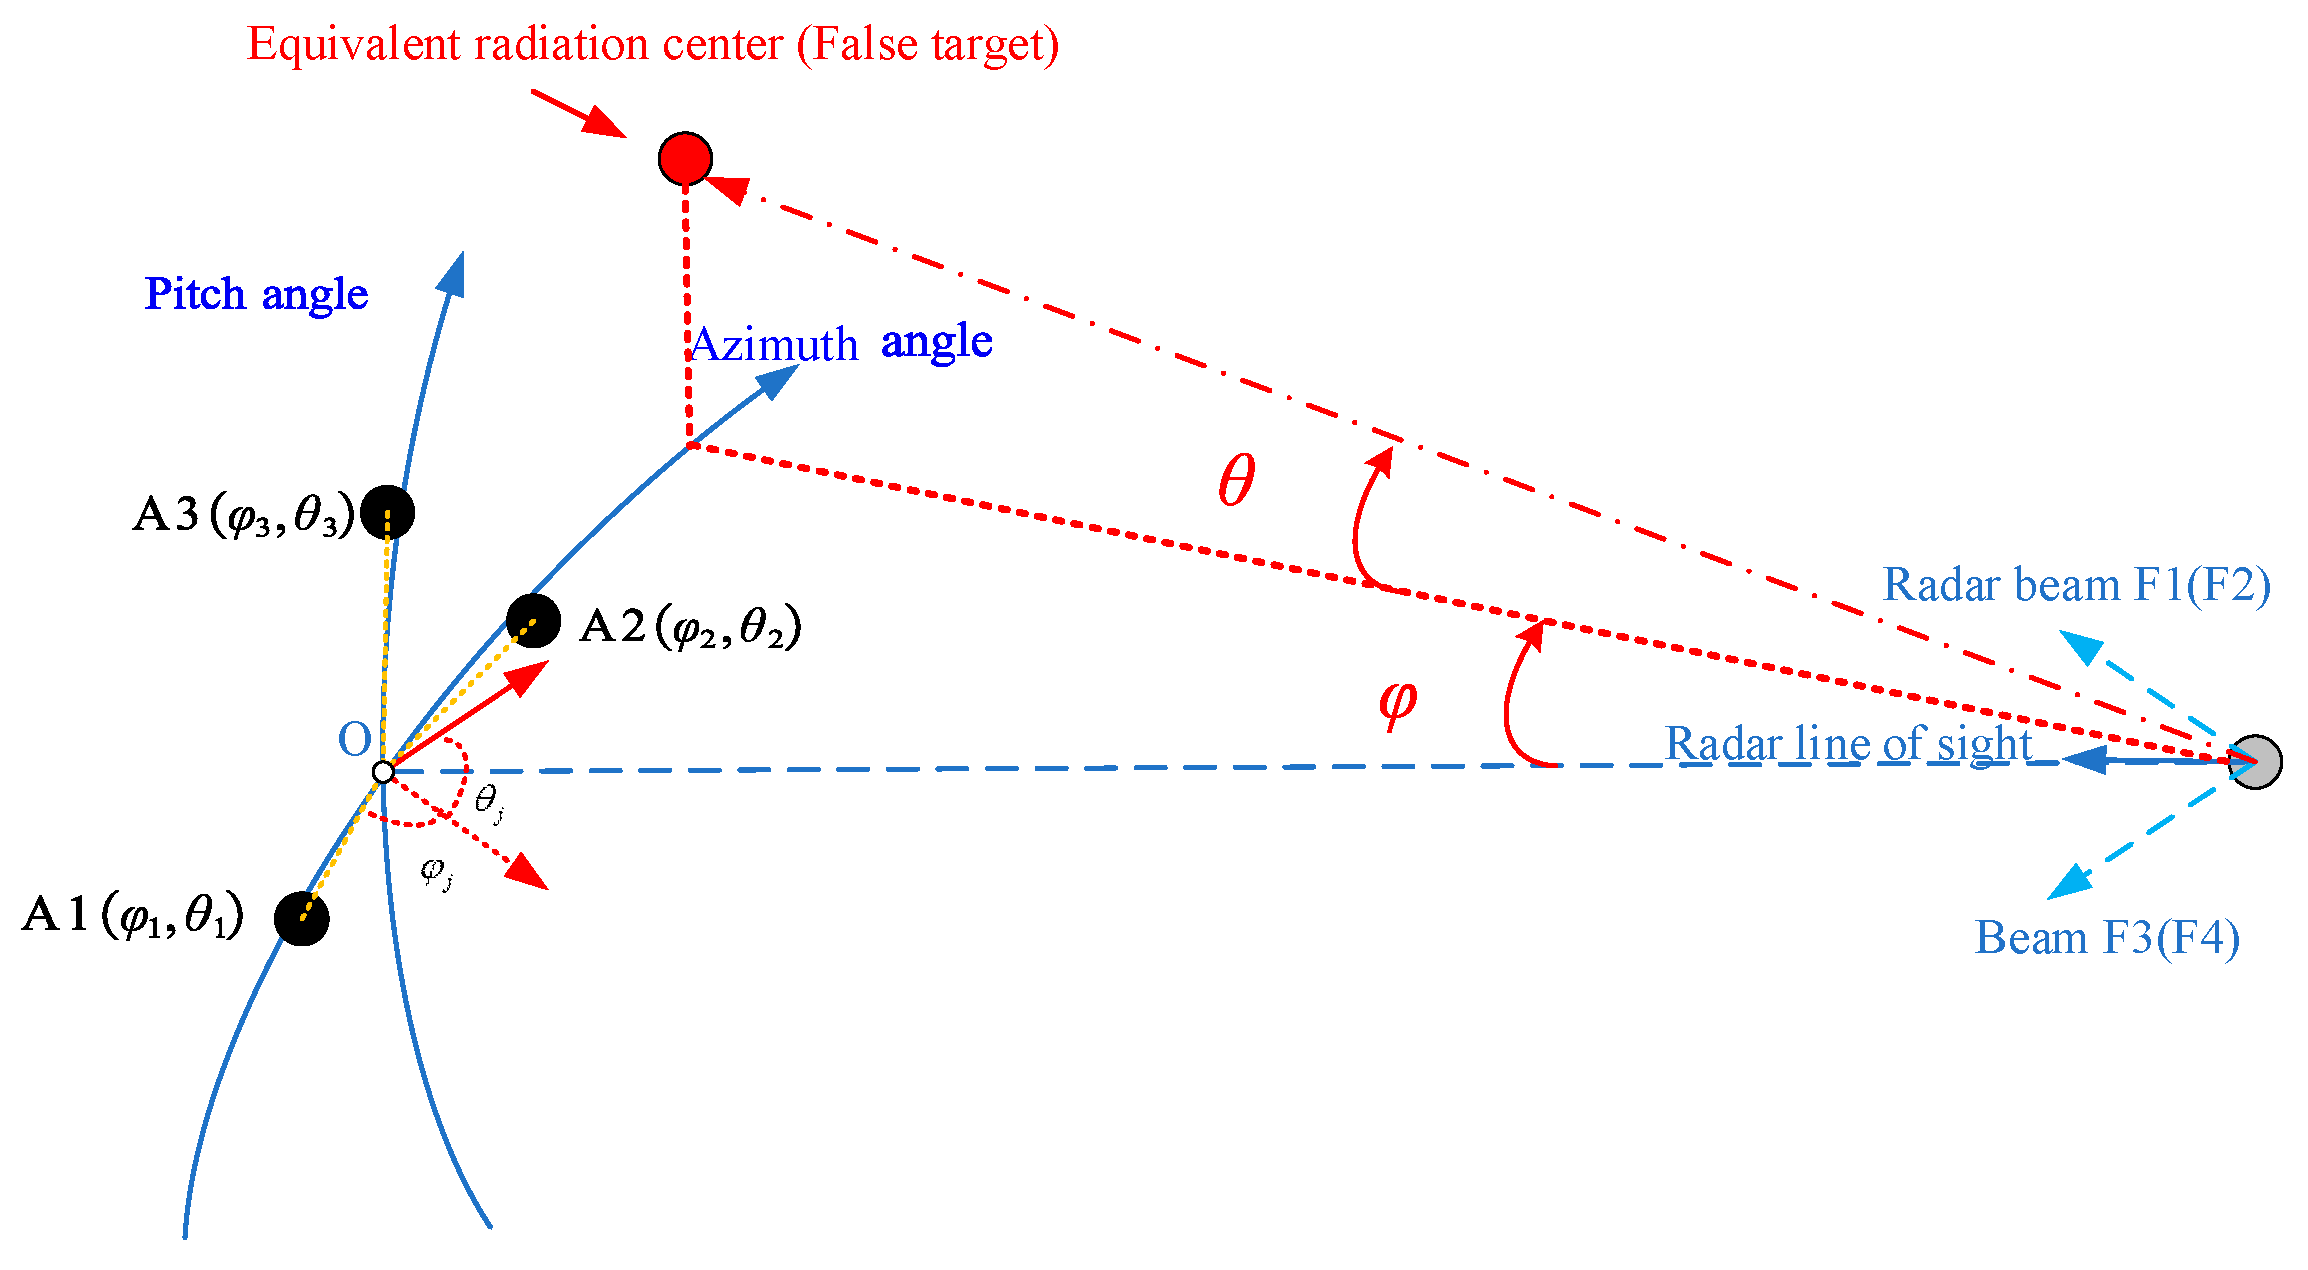
Firstly, place the triplet antenna into a spherical coordinate system with the radar as the origin. The specific model diagram is shown in
Figure 1. The figure shows three antennas of a triplet, which form a triangle on a two-dimensional plane. The horizontal axis of the coordinate system is the azimuth direction, and the vertical axis is the elevation direction. The coordinates of the three antennas in the spherical coordinate system are also shown in
Figure 1.
The transformation relationship between spherical coordinates and Cartesian coordinate systems defined in this article is
Assuming the direction of the electric field is
, according to the propagation direction of the electromagnetic field, the direction of the magnetic field is
. Under the assumption of negligible coupling between the antennas, the expressions for the electric and magnetic fields at the center of the ball in a Cartesian coordinate system are as follows (the direction of the electric and magnetic fields is represented by the constant unit vectors
,
,
in a Cartesian coordinate system):
is the signal amplitude when reaching the center of the radar position;
is the phase of the signal reaching the center of the radar position,
i = 1, 2, 3;
represents the impedance of spatial waves. As shown in
Figure 1, assuming that the coordinates of the jamming antennas A1, A2, A3 in this spherical coordinate system are
,
,
, respectively, the coordinate at the center O point of the jamming platform is
.
According to the formula of the average Poynting vector
,
Combining Equations (2) and (3), the X, Y, and Z components of the Poynting vector
at the receiver of the radar in the Cartesian coordinate system are solved. According to Equation (1), convert the Cartesian coordinate system back to the spherical coordinate system defined as shown in
Figure 1, and obtain the coordinates
of the apparent false target (equivalent radiation center) in this spherical coordinate system as follows:
As illustrated in
Figure 2, the schematic diagram delineates the position of the equivalent radiation center. The physical meaning of the equivalent radiation center is as follows: the radar determines the position of the target radiation source based on the normal direction of the distorted phase plane. However, in actuality, there is no real radiation source present. Consequently, the equivalent radiation center can be regarded as a radar-perceived false target.
Further derivation can be made for Equation (4) by defining the amplitude ratio
,
based on the signal amplitude value of interference antenna A1.
Set the feeding phases of the three interfering antennas to
,
, and
. Based on the phase of antenna A1, the phase difference of antenna A2 and A3 is
,
; combine Equations (1)–(3) and (5), and simplify to obtain
When the radar follows the target platform,
,
,
,
,
,
are all small. Therefore, we can make an approximation:
In order to correspond to the angle of the interference antenna set in the monopulse radar interference scenario in reference [
26], let
,
,
,
. Then from (4), the azimuth of equivalent radiation center can be expressed as
The jamming gain
for monopulse radar in reference [
26] can be expanded into the following form:
Comparing Equation (8) with Equation (9), there is
. The physical meaning of
or
is the azimuth angle of the apparent false target. Apparent false target refers to a target that the radar believes to be measured, but it does not truly exist and is virtual. The aforementioned derivation results reveal that, under identical interference scenario parameters and approximation relationships, the monopulse radar angle measurement principle and the azimuth interference deception angle determined by the Poynting vector method have the same physical meaning. The two derivation findings are identical, confirming the accuracy of the multiple-antenna synthesis interference mathematical model. Similarly, the formula for the pitch angle jamming gain
can be derived, which is the same as the derivation results by the phase comparison and amplitude comparison method in [
26].
3. Computational Analysis of the Law of the Amplitude Phase and the Synthesis Signal
The initial simulation parameter settings are shown in
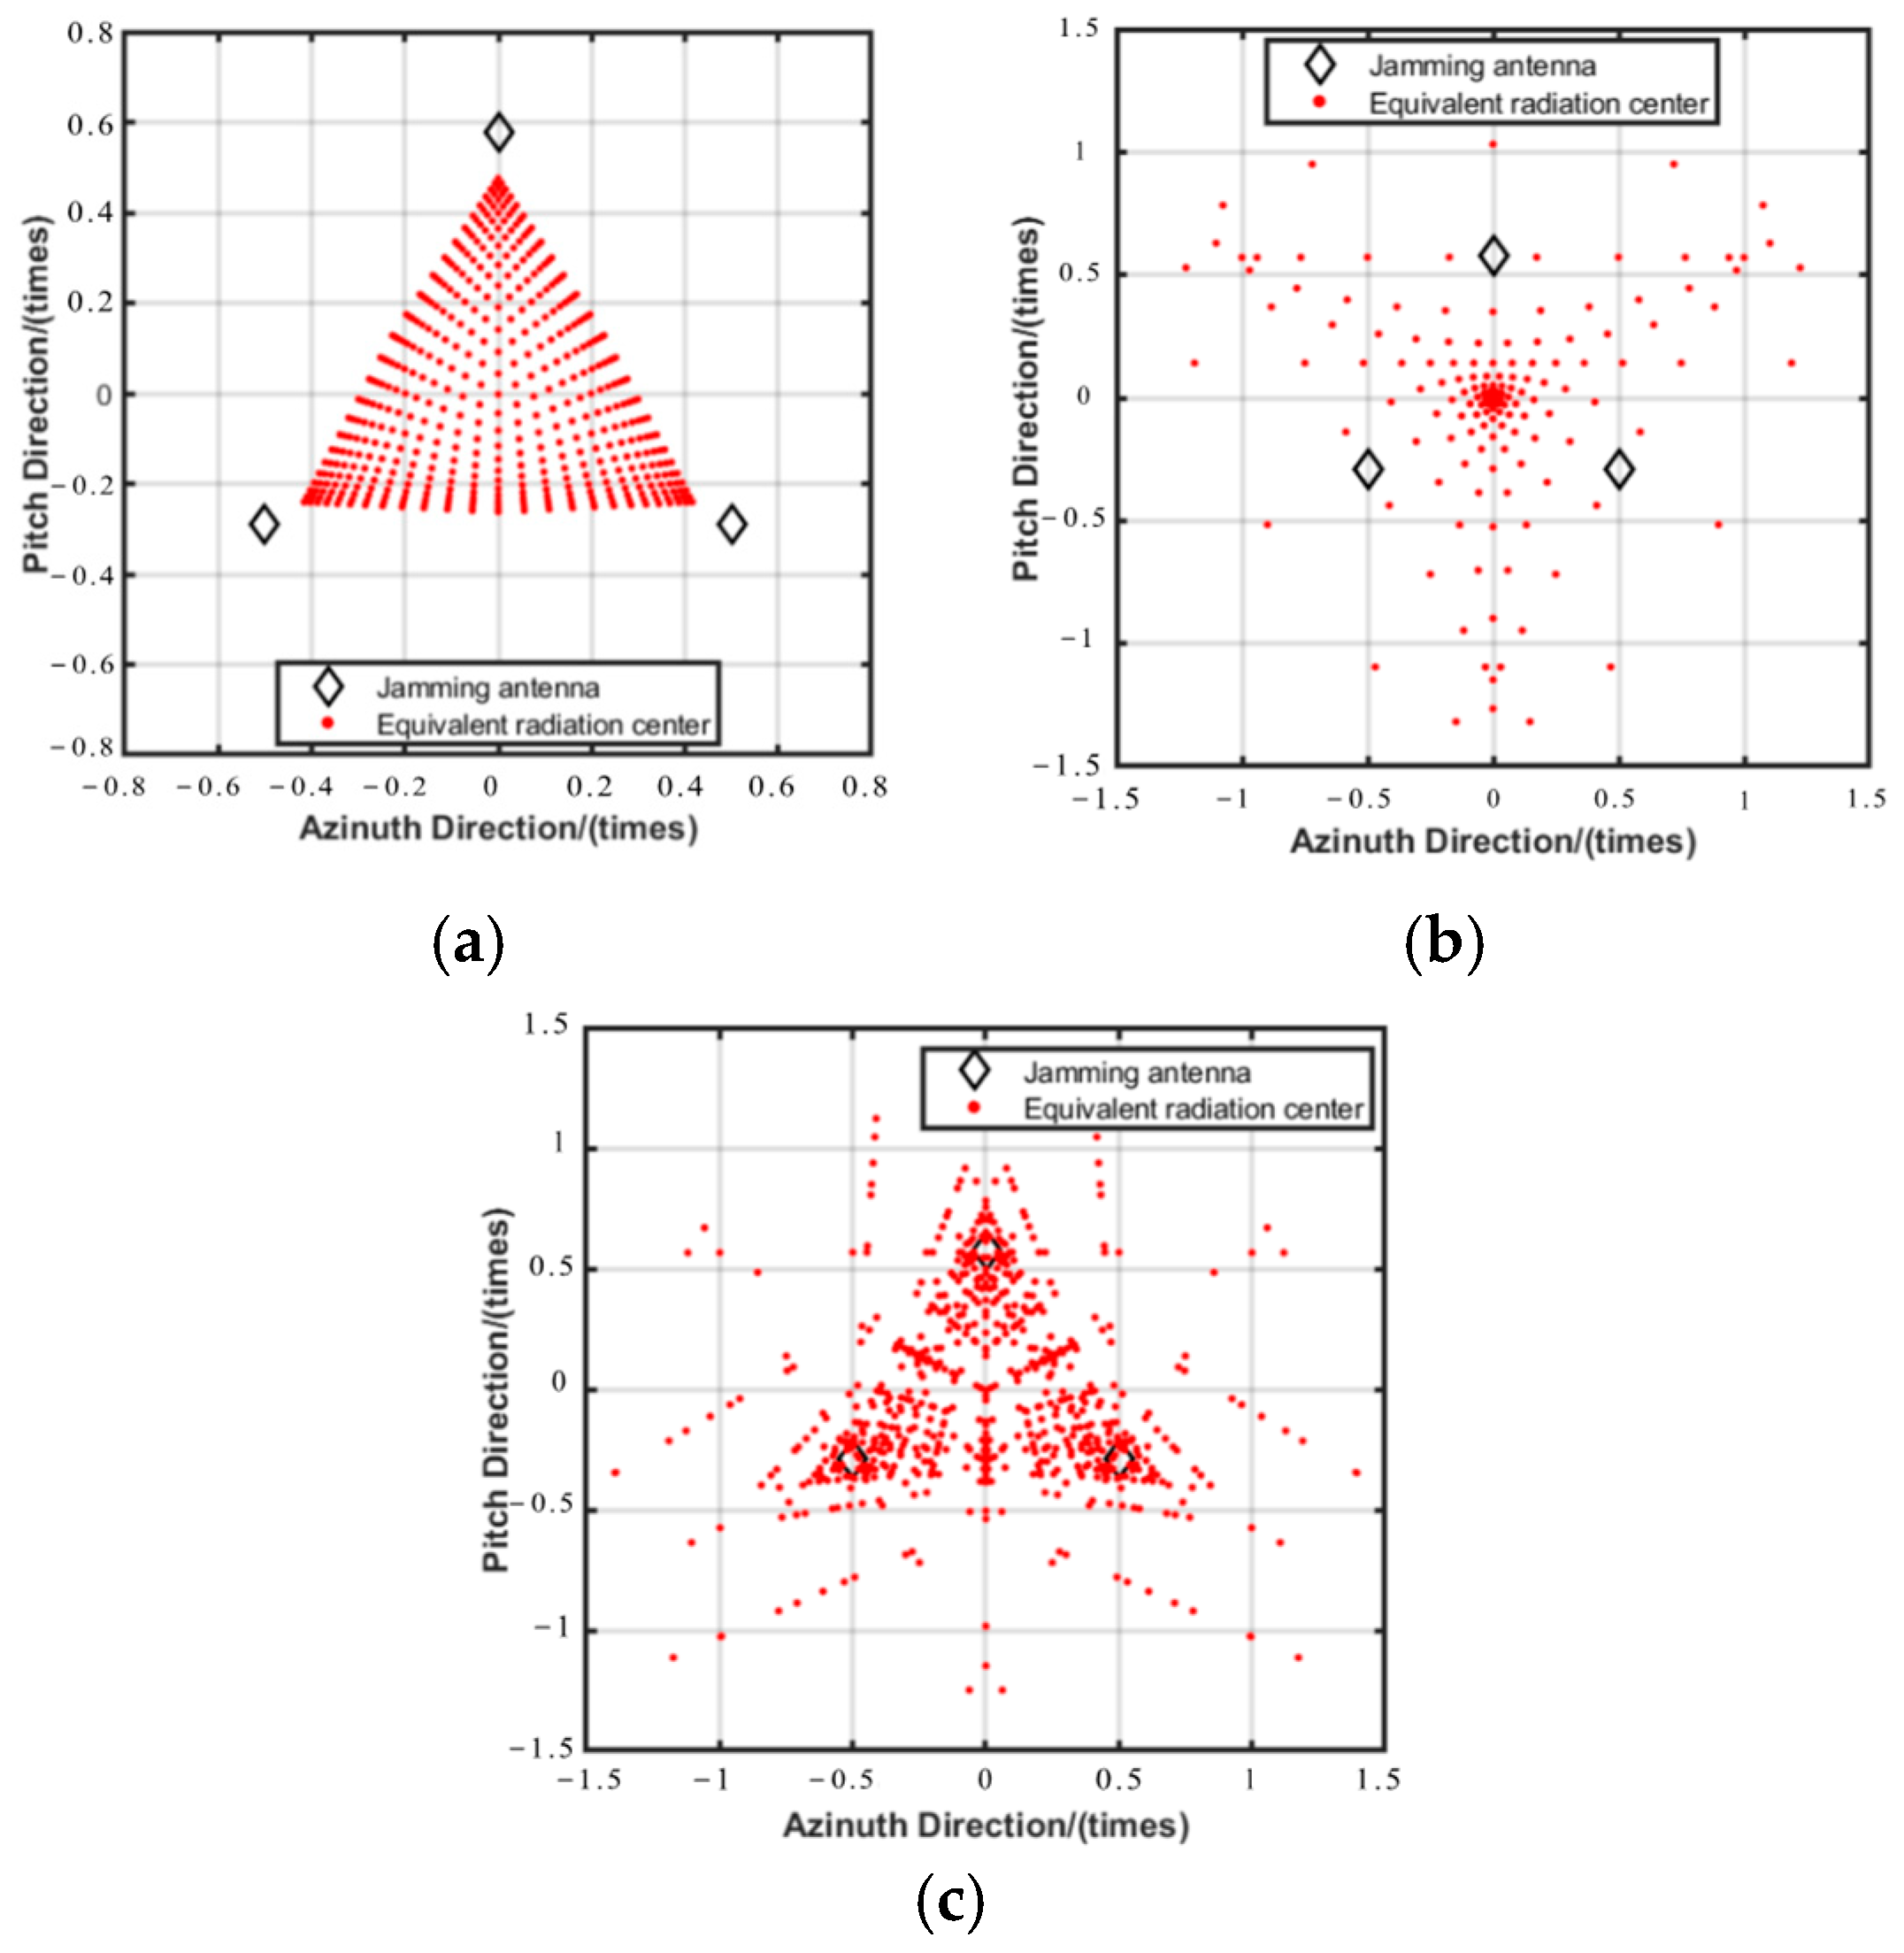
Table 1. The black small square represents the position of the antenna unit, the red dot represents the position of the equivalent scattering center, the horizontal coordinate represents the azimuth angle, and the vertical coordinate represents the elevation angle. The variation range of the apparent false target position corresponding to the multivector composite interference when antennas A2 and A3 change according to different rules, with antenna A1 as the reference, is shown in
Figure 3.
Figure 3a shows the distribution of the false target position when the feed phase difference of three antennas is 0°, and the amplitude ratio of antenna A2 and antenna A3 to antenna A1 varies in steps of 0.1 within the range of 0–1; (b) represents the distribution of three antennas with an amplitude ratio of 1 and a phase difference of 5° in increments between 0 and 360°; (c) represents the distribution of antenna A2 and antenna A3 when the amplitude ratio of antenna A1 is stepped in steps of 0.1, and the phase difference changes in steps of 5° simultaneously.
In summary, when the phase of a triplet is the same and only the amplitude is changed, the scattering center does not exceed the range of the triplet. When phase changes are added, the scattering center extends beyond the range of the triplet. Therefore, this method can be used to synthesize signals from antenna arrays over a greater range with fewer antenna units and can be used to simulate false targets on radar.
4. Experiment of Multiple Antennas Synthetic Interference
According to mathematical theory and the vector network analyzer, a multivariable vector control interference synthesis apparent false target experiment was conducted in a laboratory. This section provides a detailed account of the content and experimental results.
4.1. Experimental System
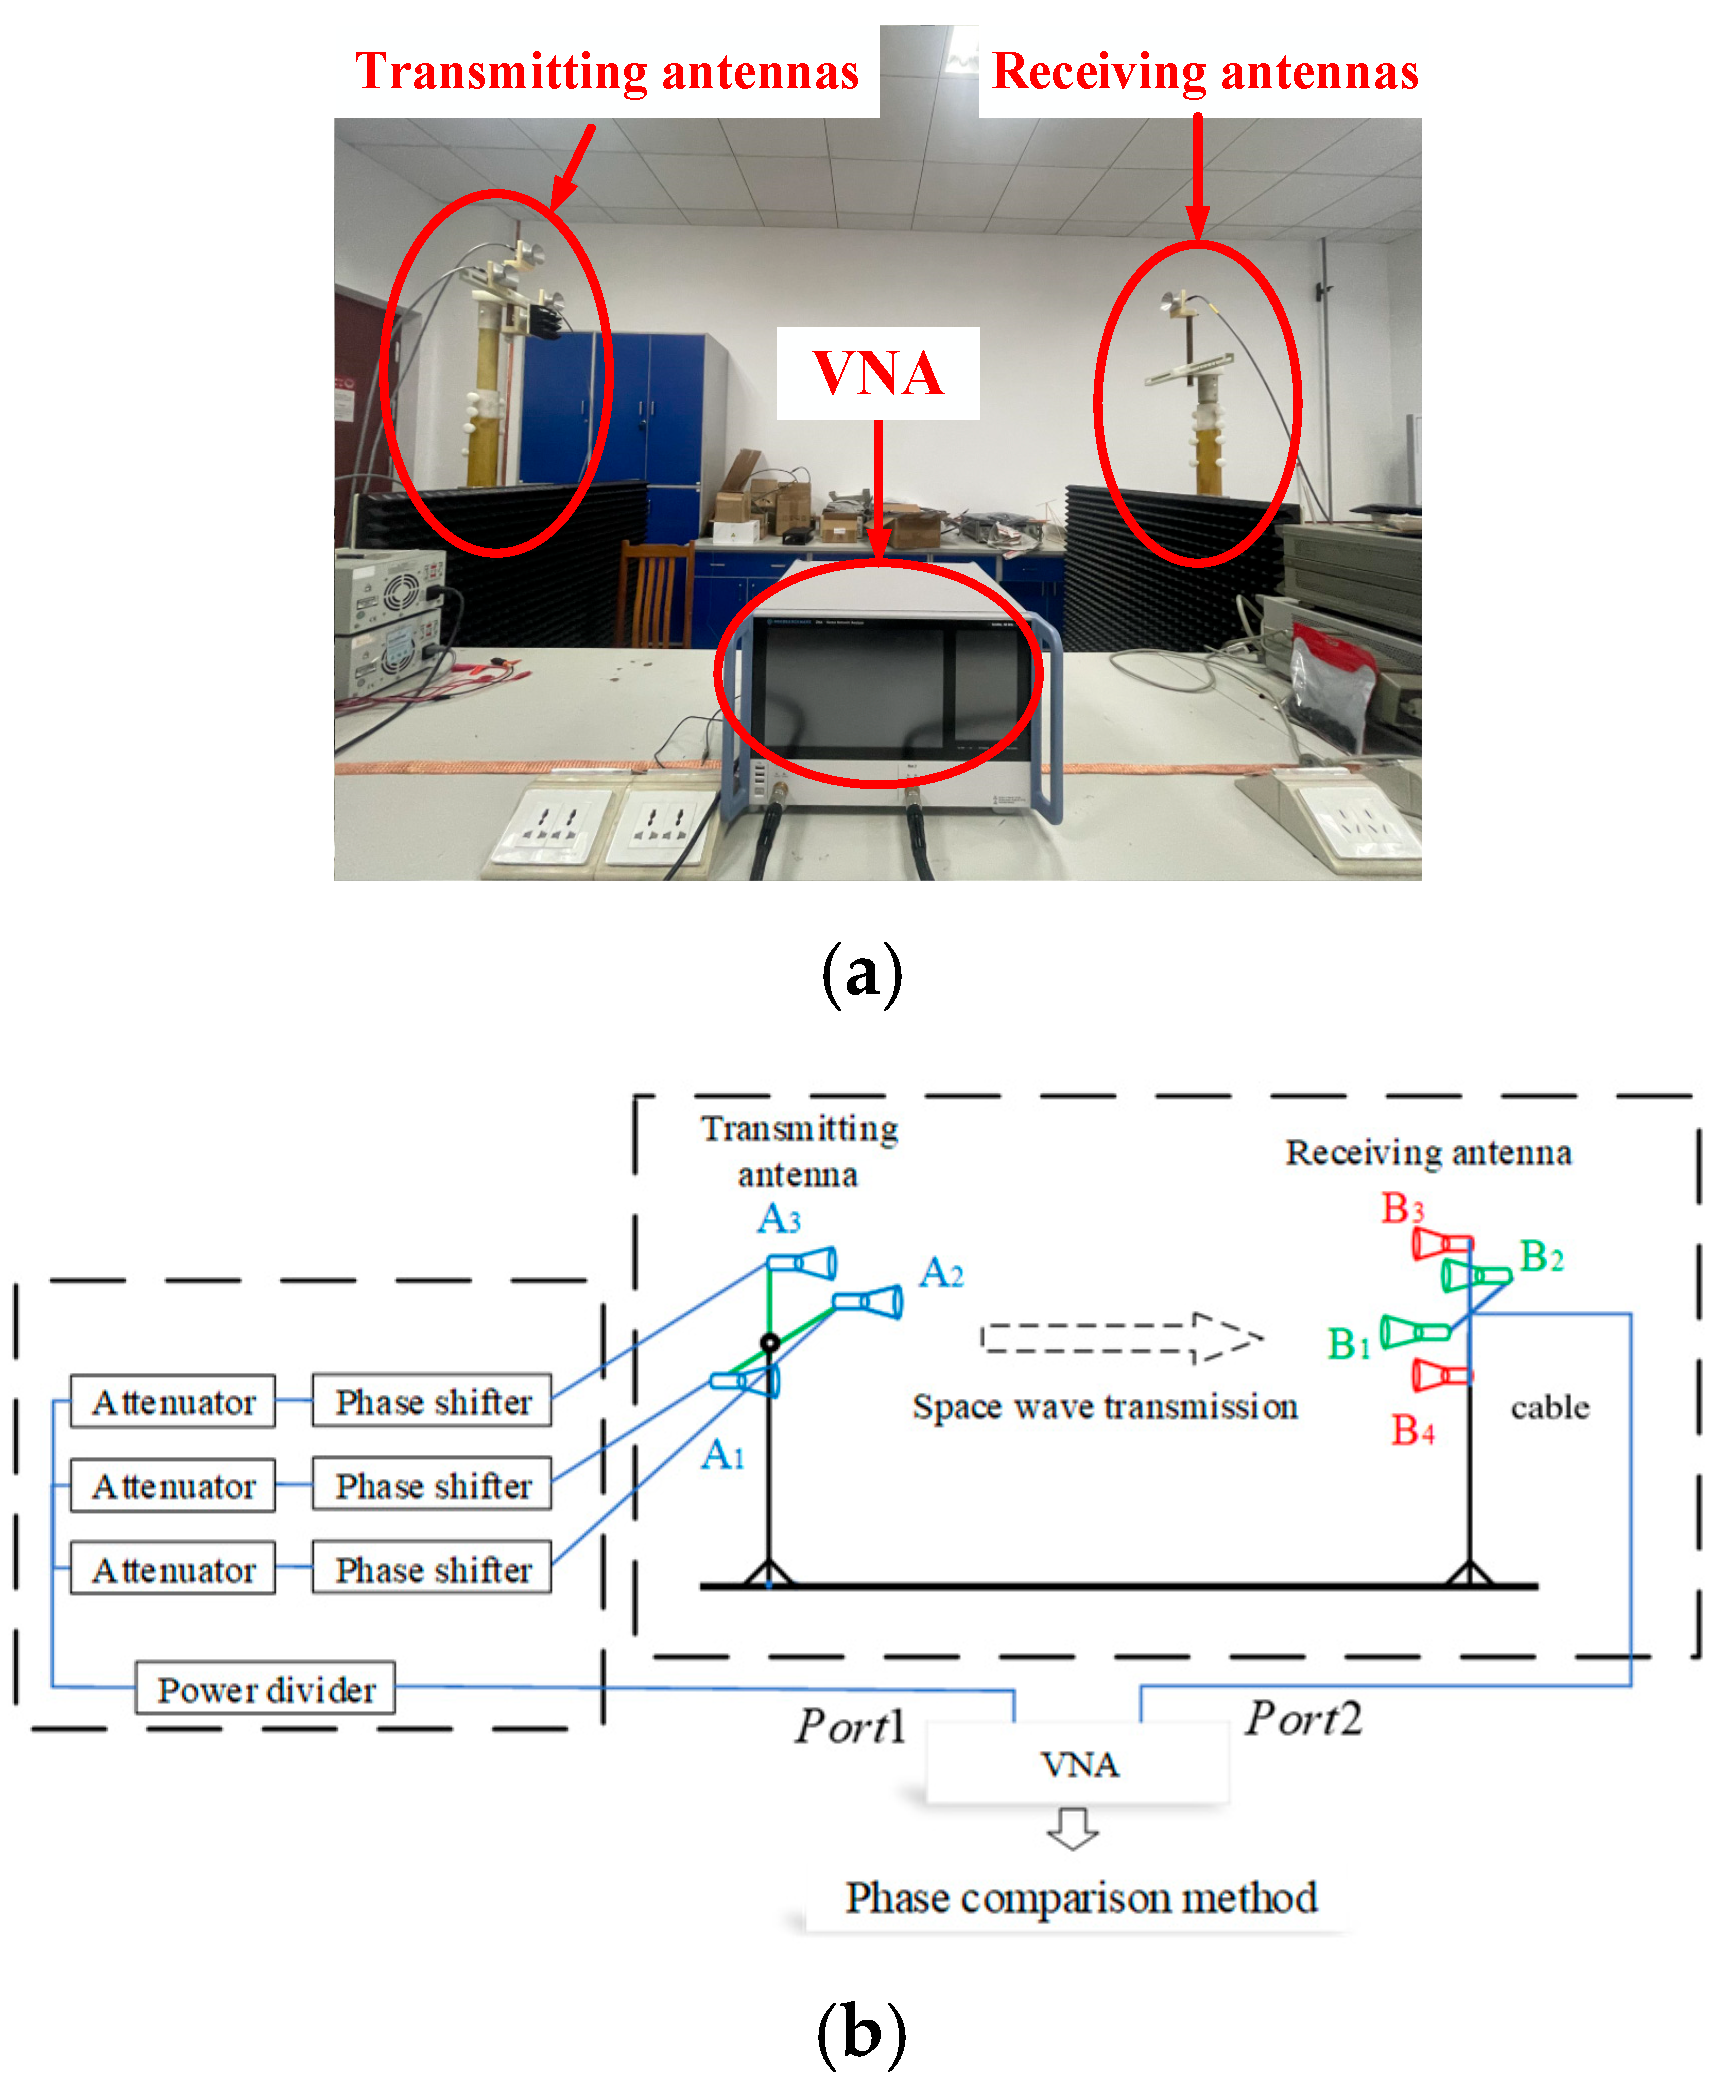
As illustrated in
Figure 4, the experimental platform for X-band (8.3 GHz) jamming comprised a schematic framework divided into two primary modules: the transmit system module and the receive system module. Among them, the main components of the transmitting system module were Port1 of the transmitting end of the vector network analyzer ZNA50, cables, an amplitude–phase control panel, and transmitting antennas; the main components of the receiving system module were a receiving antenna, cables, and Port2 of the receiving port of the vector network. The core module of the whole system was the amplitude–phase control panel, which mainly contained 1 one-point-four power divider + 3 digital attenuators + 3 analog phase shifters. Its function included two points: (1) to divide multiple signals to simulate interference signals and platform echo signals; (2) to achieve precise regulation of feed amplitude and phase. The software version used for calculation and plotting is Matlab R2019a.
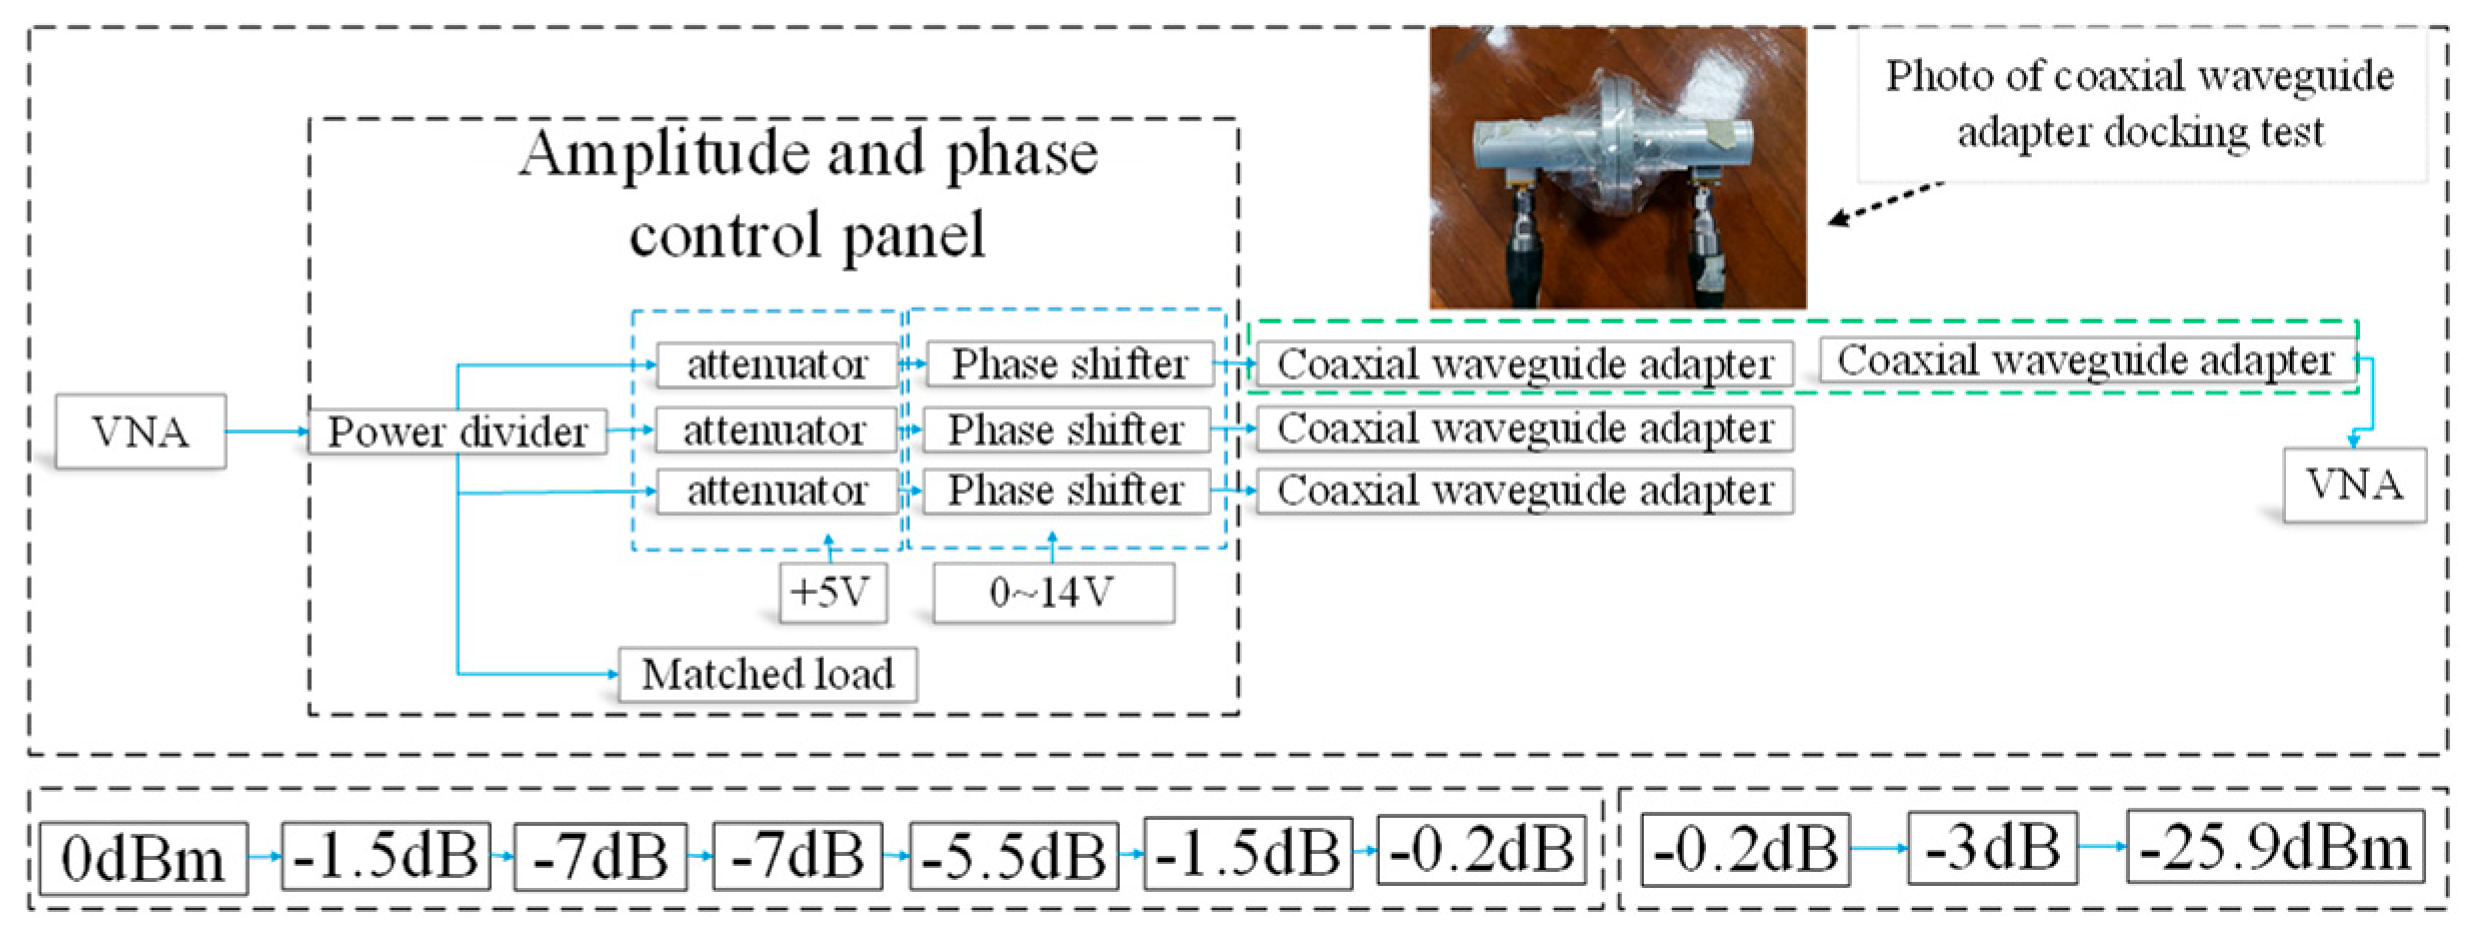
As illustrated in
Figure 5, the block diagram of the cascade insertion loss test of the amplitude–phase control panel indicates that the insertion loss of each port of the power divider is approximately 7.0 dB; the insertion loss of each attenuator is about 5.5 dB. The insertion loss of each phase shifter is approximately 7 dB, and the insertion loss of the phase shifter increases by 2~2.5 dB after the application of different DC bias voltages. Consequently, the insertion loss of the amplitude–phase control panel can reach 21~21.5 dB.
4.2. Calibration and Goniometric Experiments with Phase Comparison Method
The vector network analyzer (VNA) employed in the laboratory was a two-port VNA manufactured by Rohde and Schwarz. One of the ports functions as the transmitter port, while the other serves as the receiver port, thereby transforming the VNA into a “transceiver”. This configuration facilitates phase comparison goniometry experiments based on the VNA. The amplitude and phase of the incoming wave signal are received using the same antenna in different positions at the receiving end to simulate the phase comparison radar goniometry.
In the experiment, the actual length of the baseline of the phase comparison antenna was
. The block diagram of the experiment principle is shown in
Figure 4. In order to simulate antennas B1 and B2 in the horizontal azimuth direction, it is necessary to set the center receiving antenna for B0. The approach to be taken is to move B0 horizontally left and right by ±45 mm. Similarly, to simulate antenna B3 and B4 at the vertical pitch direction, B0 should be moved vertically up and down by ±45 mm.
In the case of a parallel configuration of the aperture surface of the transmitting antenna and the receiving antenna, with both positioned on the same axis, the antenna A0 transmits the electromagnetic wave at the far field near the plane wave. The amplitude and phase values of the receiving antennas B0, B1, B2, B3, B4 are found to be almost identical. The calibration process is thus deemed to be complete.
To verify the feasibility of using the above experimental method to simulate phase comparison monopulse radar angle measurement, this section proposes a phase comparison method for measuring the azimuth of a single point source. The experimental steps are as follows:
Step 1: Perform azimuth calibration. Ensure phase difference (distance) is equal from transmitter A0 to receiving antennas B1 and B2.
Step 2: By physically moving the transmitting end trolley horizontally for a distance, move A0 to a position with an angle of
in the receiving antenna B0 azimuth direction. At this point, the true angular position of A0 relative to B0 is shown in
Figure 6.
Step 3: The phase values of antennas B1 and B2 are measured, and then the phase difference
is calculated by subtracting them. Calculate the azimuth angle
through the phase comparison method. The measurement results are shown in
Figure 6 and
Table 2.
The calculation result is
It can be considered that . This result verifies the feasibility of using a single receiving antenna at different positions to simulate phase comparison monopulse radar angle measurement, which lays the foundation for subsequent interference verification experiments.
4.3. Experimental Study on Multiple Vector Control Interference Synthesis of False Visual Targets
The parameter settings of the interference experiment scenario are shown in
Table 3. The physical experimental setup and the experimental principle block diagram are shown in
Figure 4.
The false target points that were tested in the experiment were divided into two types: those in the azimuth direction and those in the elevation direction.
4.3.1. Azimuth Direction Apparent False Target Measurement Point Experiment
A total of four points were measured, including two false target points on the positive axis and two false target points on the negative axis in the azimuth direction. The feed amplitude and phase of other antennas are based on the amplitude and phase of A1 and adjusted accordingly. The amplitude and phase feed of each antenna can be detailed in
Table 4. The experimental test results are detailed in
Table 5.
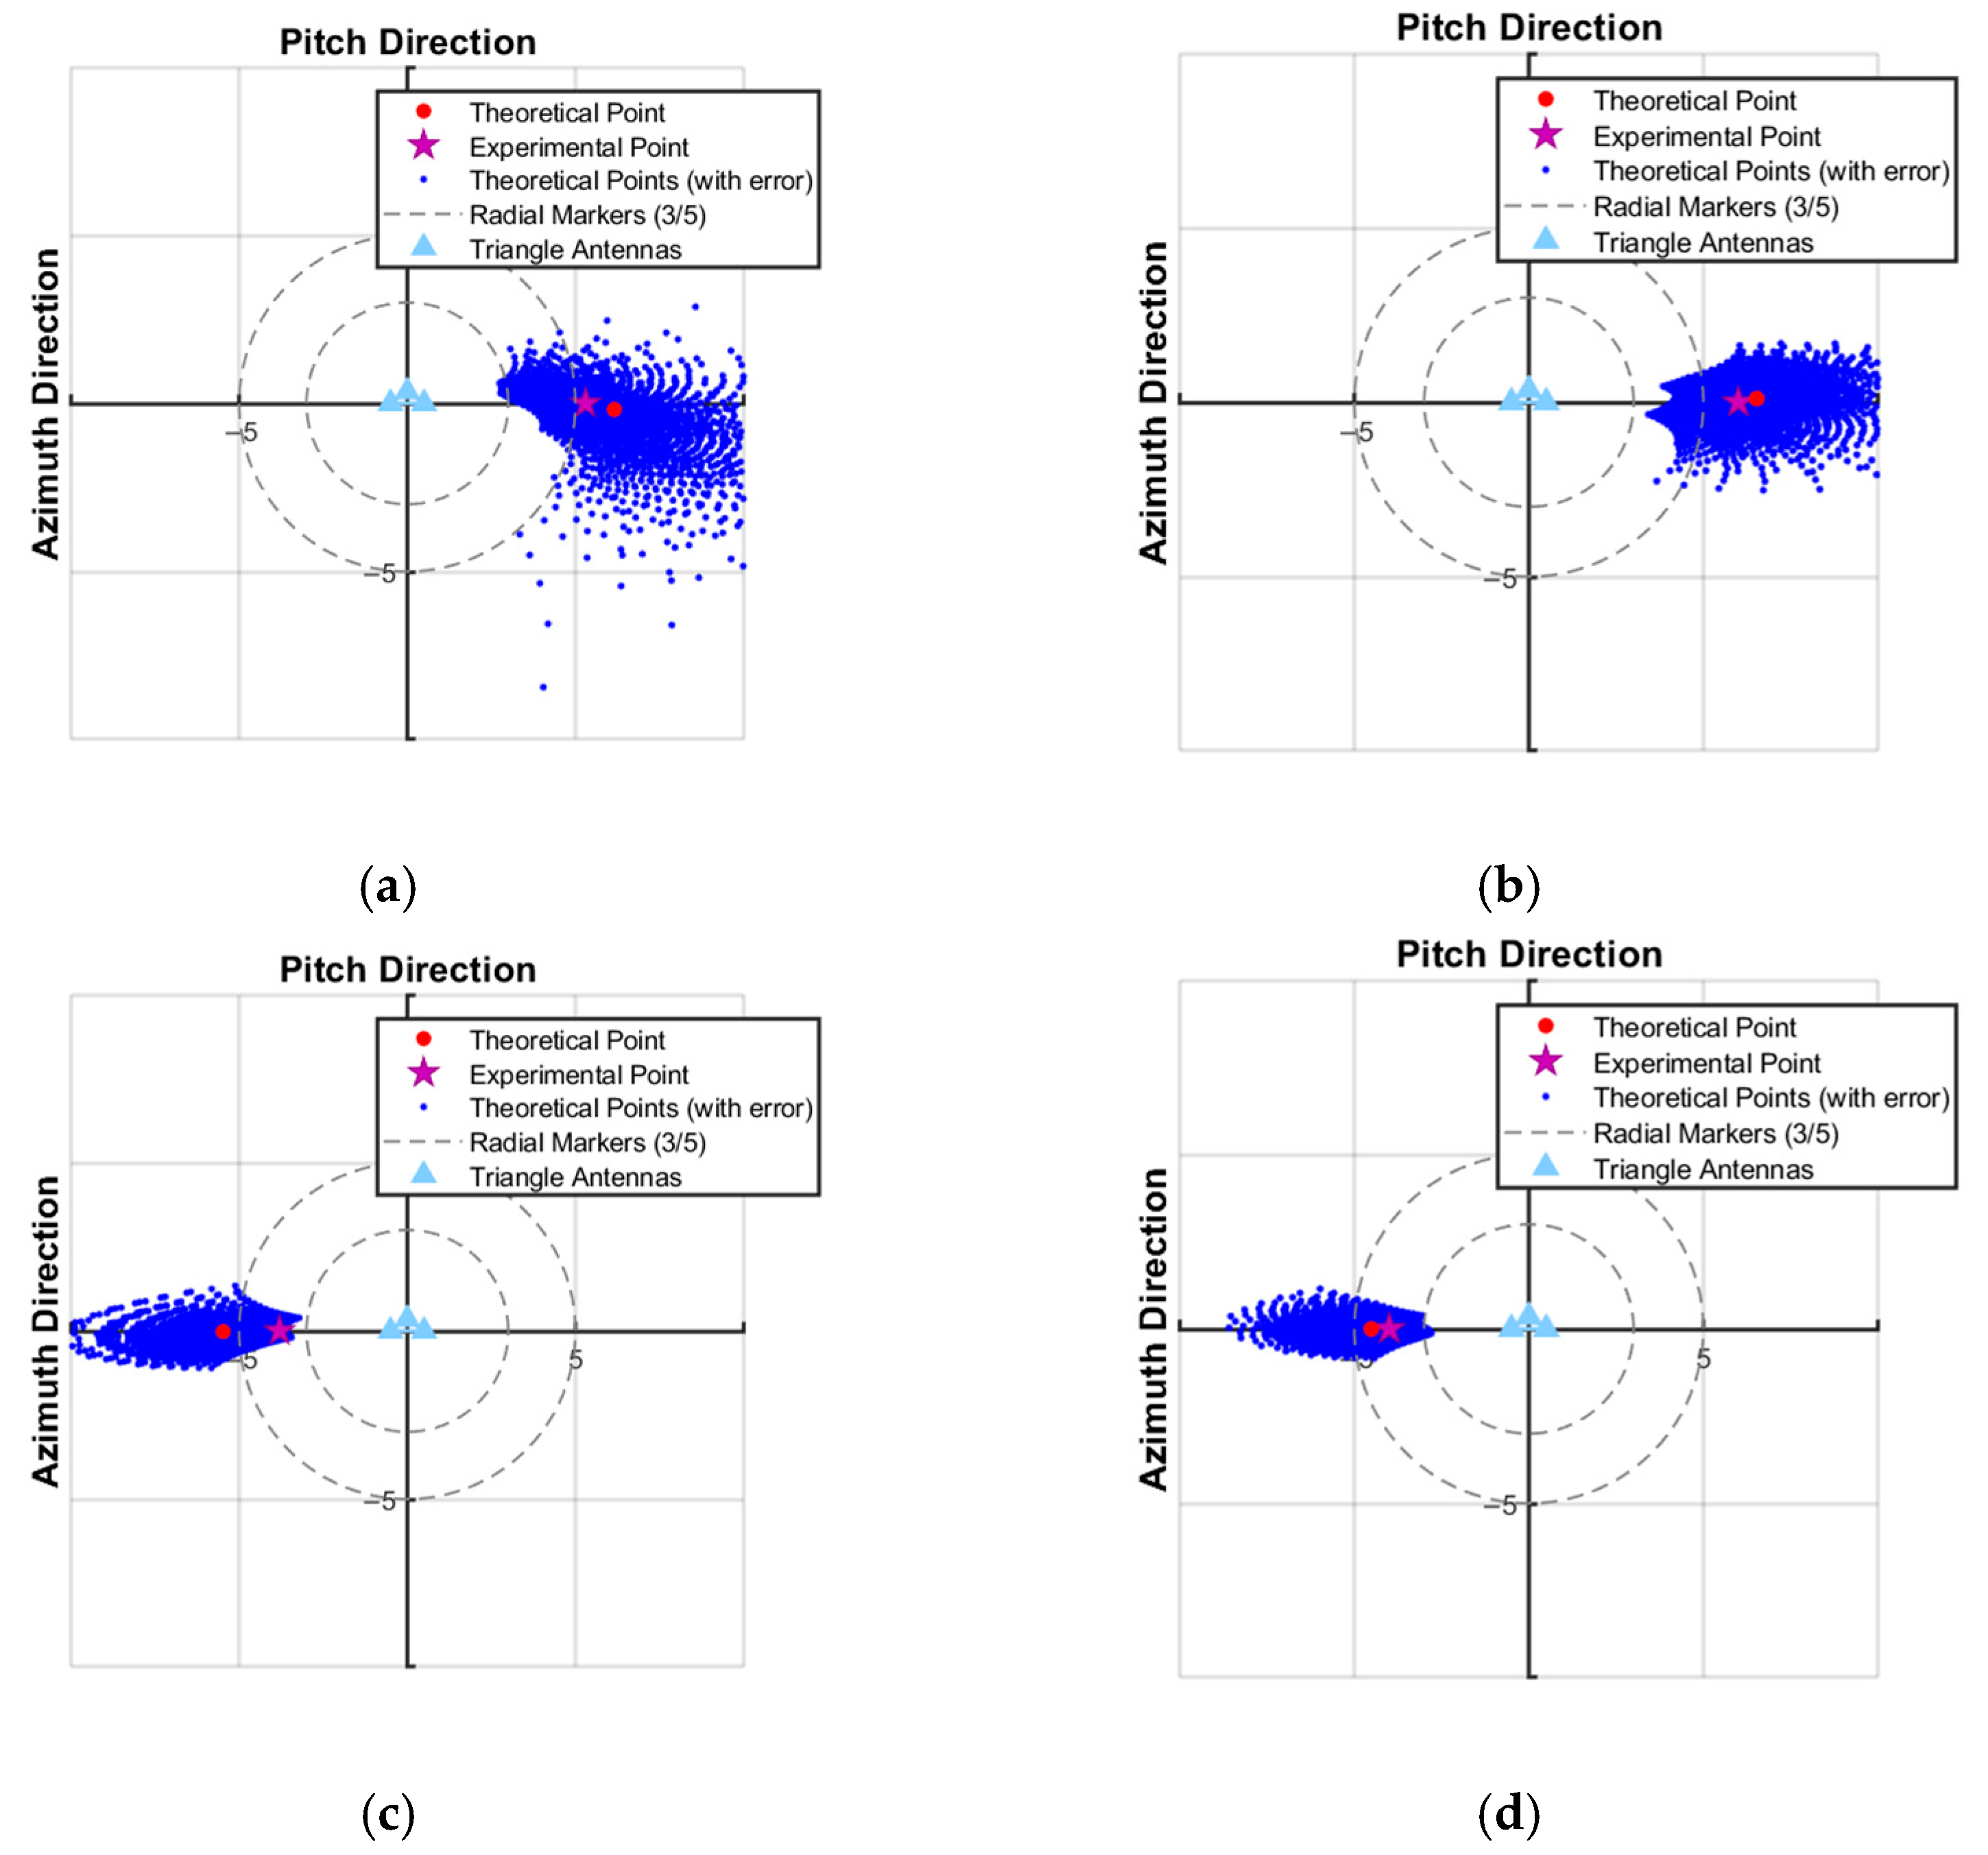
In
Figure 7, the red dot represents the theoretical position of the false target, the red star represents the experimental position of the false target, and the blue dots represent the possible position of false target when a certain range of amplitude–phase error is added. The experimental results show that the test points basically match the theoretical points, which confirms the correctness and validity of the mathematical theory and illustrates the feasibility of the multiple-antenna synthetic interference technique.
4.3.2. Experiment on Measuring False Targets in the Direction of Pitch Angle
Similarly, four points of false targets are measured in the pitch direction, including two false target points on the positive axis and two false target points on the negative axis. The feed amplitude and phase of other antennas are based on the amplitude and phase of A1 and adjusted accordingly. The amplitude and phase feed of each antenna are detailed in
Table 6. The experimental test results are detailed in
Table 7.
Figure 8 shows a graph of the theoretical point compared with the experimental point.

