Article

Optimization of Biaxial Tensile Specimen Shapes on Aerospace Composite with Large Deformation

1
School of Aerospace Engineering, Beijing Institute of Technology, Beijing 100081, China
2
Chongqing Innovation Center, Beijing Institute of Technology, Beijing 100081, China
3
Zhi Jian Lab, The PLA Rocket Force University of Engineering, Xi’an 710025, China
*
Author to whom correspondence should be addressed.
Aerospace 2025, 12(7), 587; https://doi.org/10.3390/aerospace12070587
Submission received: 26 May 2025 / Revised: 24 June 2025 / Accepted: 25 June 2025 / Published: 29 June 2025
(This article belongs to the Special Issue Advanced Composite Materials in Aerospace)

Abstract

This study focuses on optimizing cruciform specimen configurations for the biaxial tensile testing of soft composite materials used in the aerospace industry under conditions of large deformation. A comprehensive evaluation system based on stress–strain uniformity and load transfer efficiency was established, and the stability of these metrics during the tensile process was analyzed. Using finite element simulation and multi-parameter analysis, the main parameter set affecting specimen performance was identified. The influence of different parameters on stress–strain uniformity and load transfer efficiency was investigated. Based on the optimization criteria, an optimized planar cross-shaped specimen configuration was developed. This configuration demonstrated excellent performance stability during deformation, with final stress uniformity error controlled to within 2.2%. The final strain uniformity error was maintained at 2.9%. The fluctuation range of load transfer efficiency did not exceed 1.5%. This study provides guidelines for designing specimens for large deformation testing of soft composite materials and can be used as a reference for future work on optimizing specimens.

1. Introduction

In the environment of aerospace equipment, the service materials are required to adapt to complex loading conditions. Soft composite materials, such as silicone rubber, polyurethane, and solid propellants, have demonstrated significant utility in aerospace applications including dynamic sealing systems, vibration damping mechanisms, flexible structural components, and propulsion system elements [1,2,3,4,5]. These materials belong to a class of composites characterized by two or more components exhibiting exceptional deformation capabilities. Their remarkable strain capacity enables efficient energy dissipation through mechanical deformation, significantly enhancing their performance in complex loading environments. The Young’s modulus of soft materials with large deformation typically ranges from 1 to 100 MPa [6]. The stress–strain curves of these materials are mainly characterized by a section of linear elastic and a section of nonlinear elastic [7,8,9]. Materials are subjected to complex loads in service, thereby placing them in a biaxial or multiaxial stress state. The assessment of biaxial tension is typically conducted using a cruciform specimen. Cruciform tensile specimens are extensively utilized in the plane biaxial testing of metals and composites. However, it should be noted that these materials are predominantly characterized by their high hardness and small tensile deformation capacity [10,11,12,13,14], and there are few reports on the optimal design of cruciform specimens for soft materials The local large deformation, size manufacturing process, and clamping difficulty of soft materials all need to be considered in the specimen design. Therefore, the cruciform configuration optimization design of soft composite materials with large deformation must be conducted.
The cruciform configuration is characterized by a rounded corner design, slits on the arms, and a thinning of the gauge area [15,16,17,18]. The rounded corner design can reduce stress concentration at the corner [19] and increase the strain level in the gauge area [20]. Slits on the arms can enhance the uniformity of stress and strain in the gauge area and reduce the measurement error of stress [21,22]. Helfenstein et al. [23] proposed cruciform-slitted specimens of soft materials of large deformation and demonstrated that slitting the arms significantly enhanced the uniformity of deformation in the gauge area. Jia et al. [16] studied cruciform specimens for solid propellants, with the finding that the separation of the tensile arms reduced the interference of off-axis loads, and enhanced both the stress level and uniformity. Hanabusa et al. [24] and Men et al. [14] concentrated on the metal planar configuration, studied the effect of the size parameters of cruciform specimens (including the number of slits, slit length, slit width, fillet radius, and thickness) and optimized the configurations. However, due to material characteristics, it is particularly uncertain whether it applies to soft materials. Thinning the gauge area can increase the stress and strain levels in the gauge area [15,25,26,27]. Many studies have also proposed different thinning shapes to meet the mechanical testing requirements under different stress conditions [27,28,29]. Thinning needs process technologies such as machining or mold casting. These techniques are challenging to manufacture and demand a high degree of precision. In addition, after thinning, the load transfer is lost due to the constraint of the tensile arms and the transition section of thinning. This condition causes difficulty in accurately determining the stress components in the gauge area.
Several researchers have proposed various optimization criteria based on the cruciform configuration design, including the uniformity of stress and strain in the gauge area, the effective failure location, the load transfer efficiency, and the repeatability of results [15]. Zhao et al. [30] designed a split-arm cruciform specimen based on soft materials, which achieves a load transfer efficiency of 100% from the clamping end to the center area. Demmerle et al. [12] measured the uniformity of the stress distribution in the center area, the deviation between the true stress and the nominal stress, and the location of stress concentration based on the standard deviation of the stress in the center area. Hanabusa et al. [24] determined the optimal geometry parameters and strain measurement positions of specimens through finite element analysis and established a stress error criterion based on the average stress and local stress in the center area. Jalocha et al. [31] established the stress and strain transfer coefficient from the arm end to the center, assuming that the stress and strain fields at the arm end and the center were linearly related. Seibert et al. [32] defined the specimen’s biaxial validity based on the strain’s standard deviation in the center area. The assessments of cruciform configurations in the above studies are based on the tensile end-state, and there are few reports on the stability of specimen performance during tensile process.
The center thinning design of soft materials requires mold casting and curing during the manufacturing process, rather than mechanical processing methods such as turning or milling. Mechanical processing can cause initial damage to the material that is difficult to assess. Release agents are used to prevent the material from adhering to the mold. However, residual release agents may remain in the form of an oily surface film, which may affect subsequent Digital Image Correlation (DIC) analysis. Since DIC relies on high-precision image analysis, any surface contamination (such as grease, dust, or residues) may interfere with the analysis process. Additionally, the configuration parameters and preparation difficulties of soft materials differ from those of hard materials like metals. Therefore, a planar configuration that is easy to manufacture and has good tensile properties is required.
This paper investigates an easily manufacturable planar cross-shaped structure based on an optimized combination of dimensional parameters. By establishing evaluation criteria, including stress uniformity, strain uniformity, load transfer efficiency, and stability of indicators under tension, combined with finite element simulation and multi-parameter analysis, the influence of each dimensional parameter on the performance of the specimen is analyzed. Ultimately, an optimized planar cruciform specimen with uniform deformation, stable load transfer efficiency, and suitability for soft material manufacturing is obtained.

2. Material and Shape Parameters

2.1. Material

The tested material was an HTPB-based three-component propellant, consisting of ammonium perchlorate (AP), aluminum powder (Al), and binder (HTPB). Its main components are as follows: 60.5 wt% ammonium perchlorate (AP), 17 wt% aluminum powder (Al), 20 wt% HTPB binder, and 2.5 wt% of other additives. The density is 1846 kg/m3, and the Poisson’s ratio is 0.49. The material was fabricated into standard uniaxial tensile specimens and tested according to GJB 771.107-93 [33]. The detailed composition and content of each component are presented in Table 1. And the fitting result of the material parameters for the Ogden model is shown in Figure 1. The tests were all done in an air-conditioned room at 25 °C.
The material parameters were fitted based on the tensile loading data by using the Ogden model. The fitting formula is as follows:
σ = μ 1 λ α 1 1 λ α 1 2 1 ,
where λ represents the extension ratio. After fitting the data, the material parameters are μ 1 is 1.894 and α 1 is 1.258. The fitting result is shown in Figure 1.

2.2. Parameters

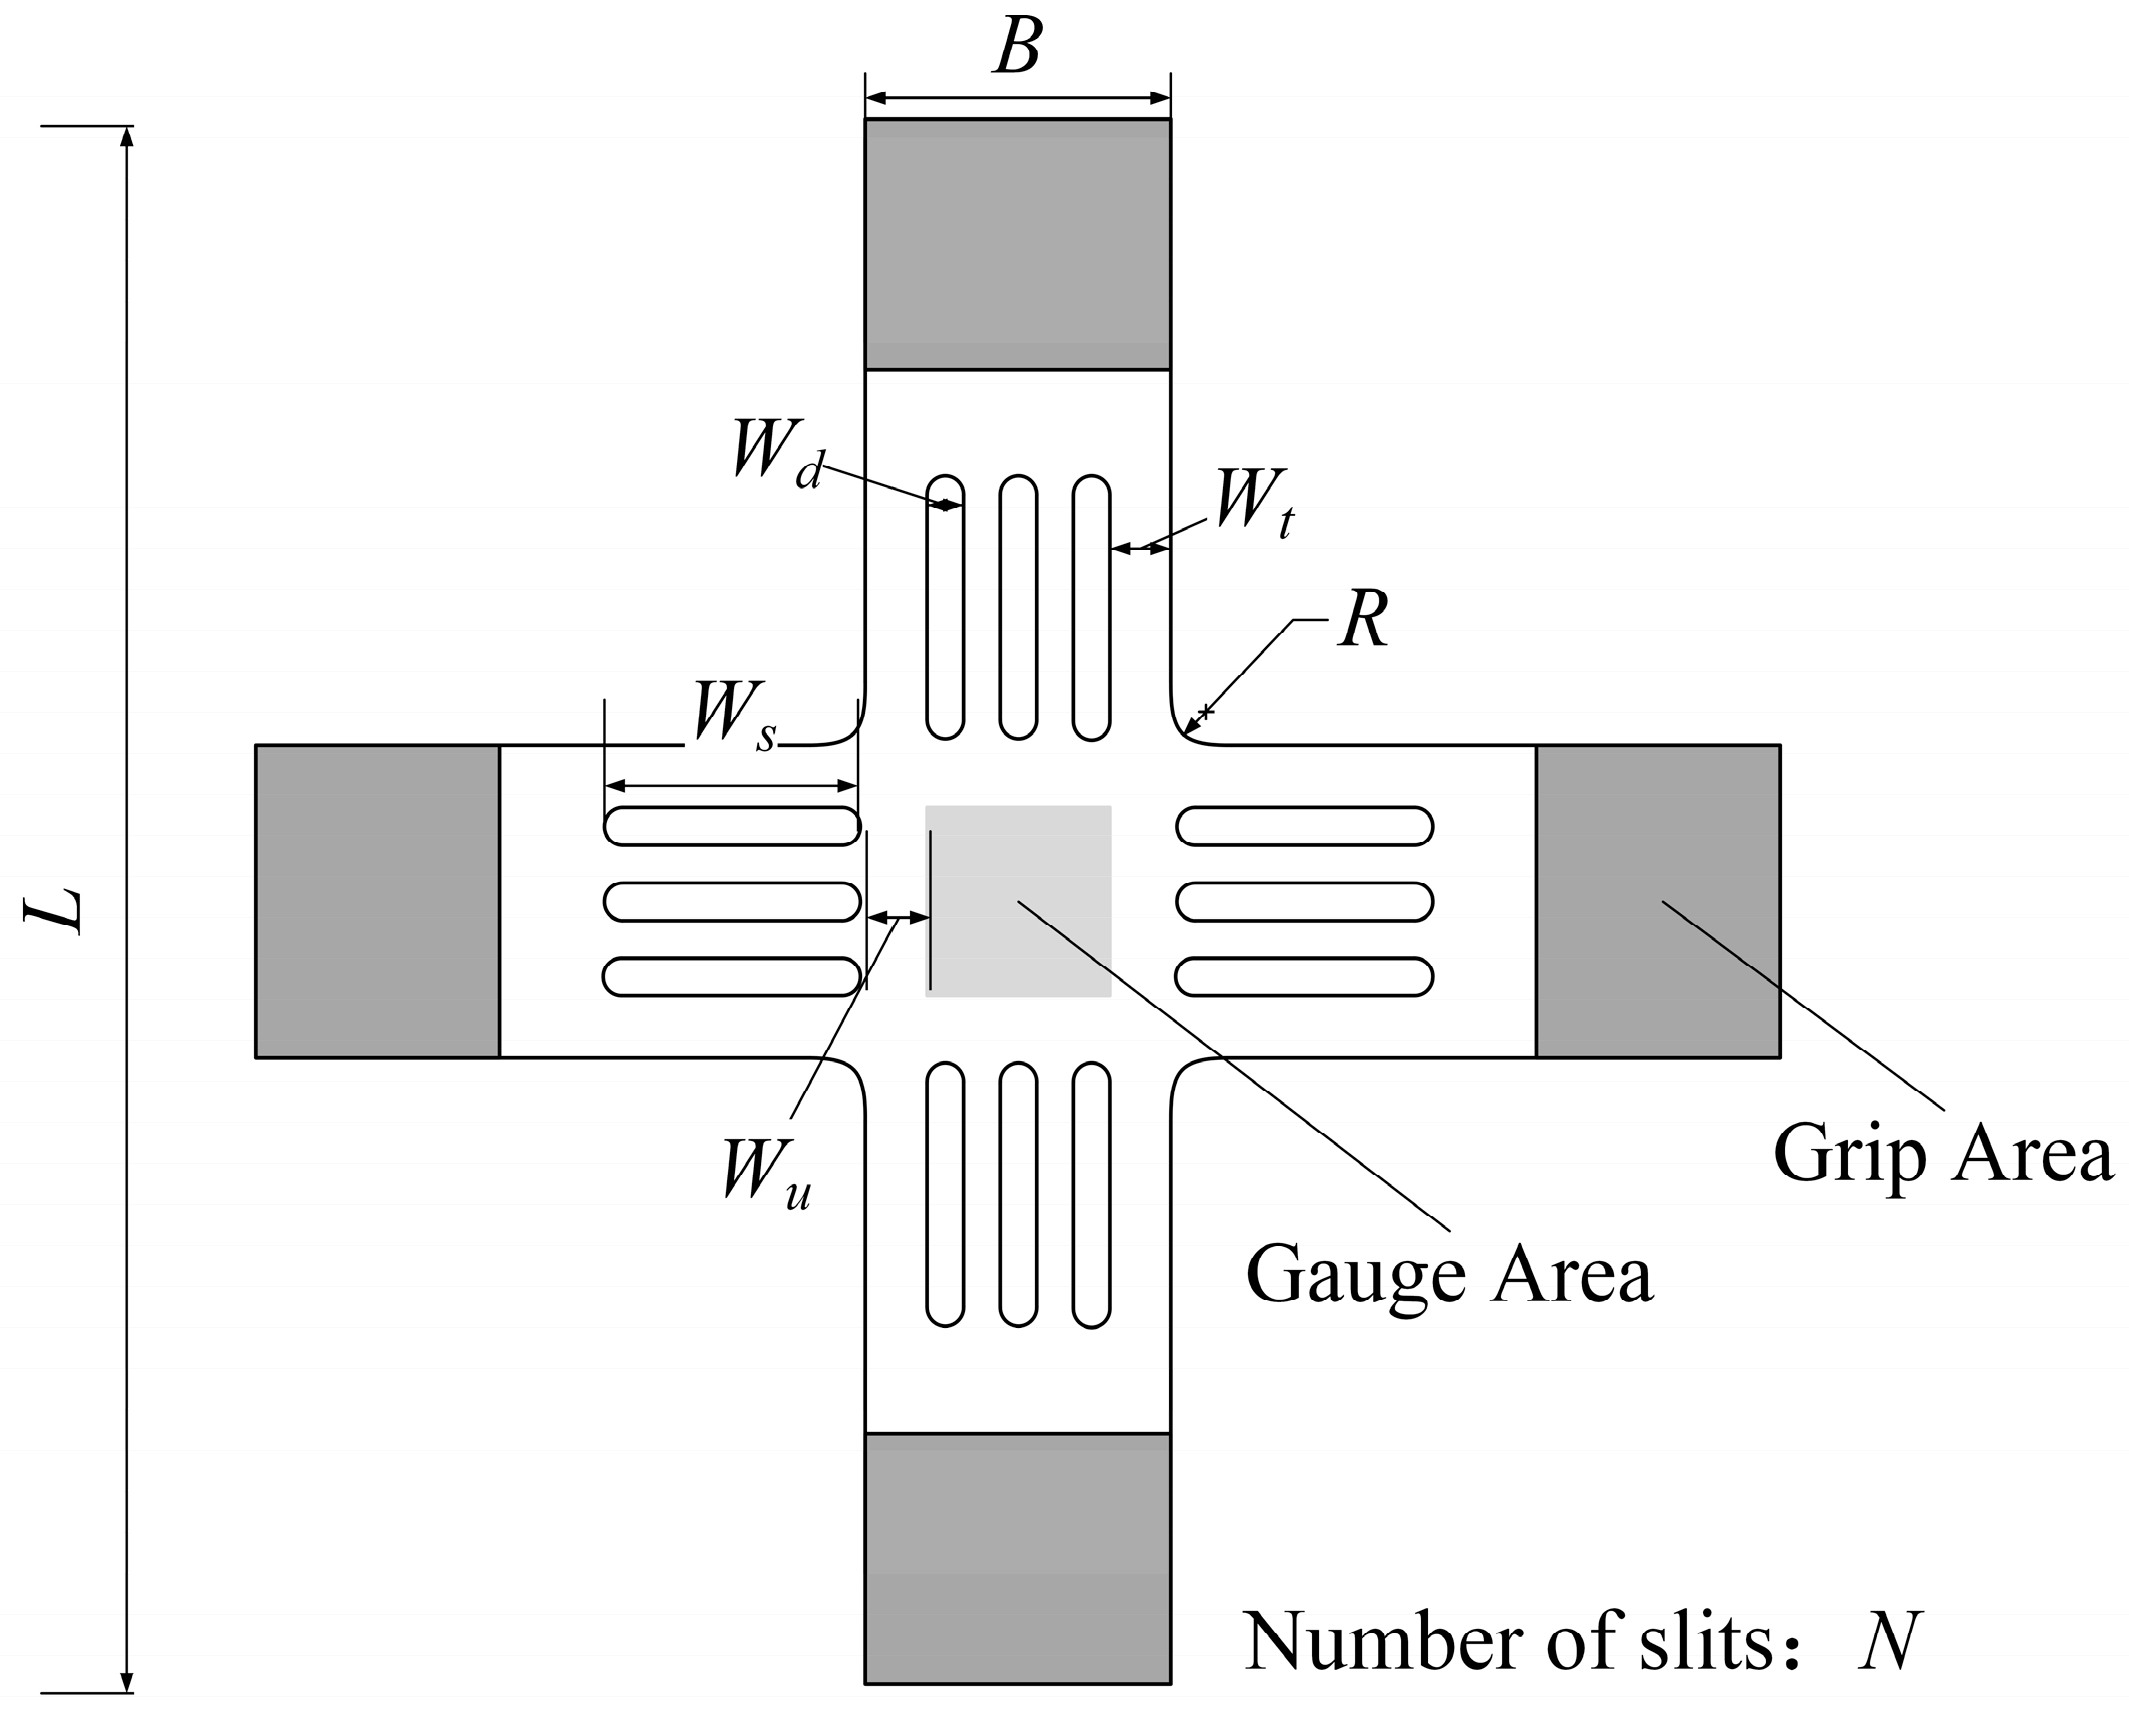
The cruciform configuration chose the planar cruciform configuration, which took the total width (L), arm width (B), and thickness (h) as fixed parameters, while the number of slits (N), slit edge distance (Wt), slit width (Wd), slit length (Ws), slit end distance (Wu) and fillet radius (R) were regarded as variable parameters. The schematic of parameters is shown in Figure 2, and the value range is listed in Table 2. (description of symbols and ranges of dimension parameters). Considering the manufacturing precision of the specimens, a sampling interval of 0.5 mm was adopted.
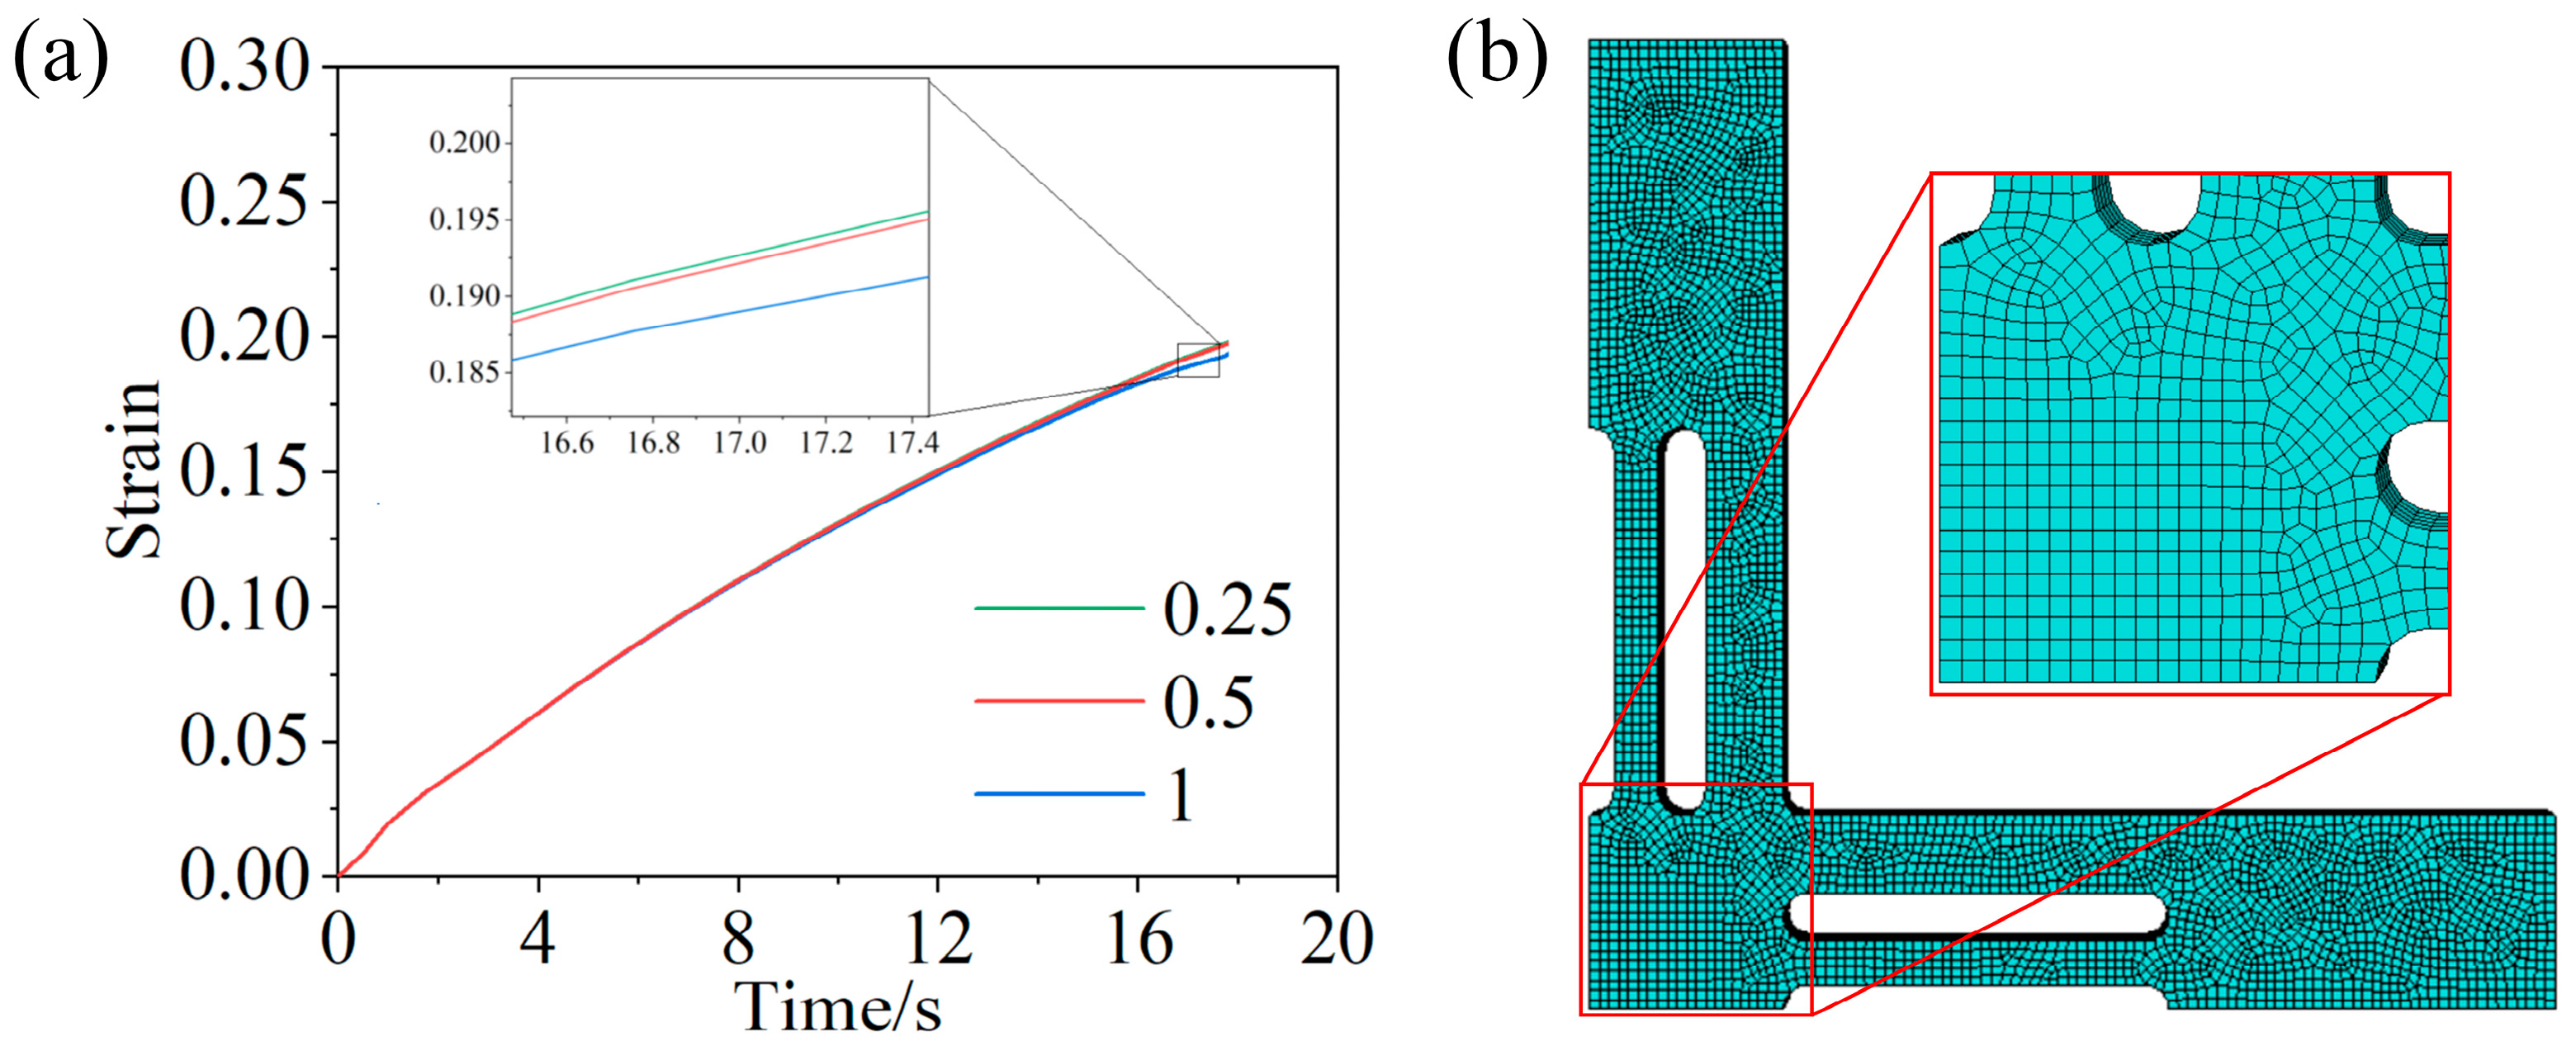
In the simulation calculation, the specimen was replaced with a rectangular area, with a width of 20 mm. According to the proportion relationship between the optimal observation range and the arm width of the biaxial specimen [14], the width of the central gauge area was selected as 12 mm, which is 0.6 times the arm width. The thickness of the solid propellant cruciform specimen was concentrated at 5 mm [4,16,31,34], such that the fixed thickness value of the specimen in this study was set to 5 mm. The structures used for the finite element simulation results all adopt 1/8 models with symmetrical boundaries applied. In finite element simulations, to eliminate the influence of mesh size on the analysis results, a mesh independence study was conducted considering the geometric dimensions. The mesh type employed was the Continuum 3D 8-Node Reduced-Integration Hybrid (C3D8RH) element. The strain results at the center under different mesh sizes are illustrated in Figure 3a, with the numerically convergent mesh size range identified as 0.25–1 mm. Therefore, balancing mesh density, result accuracy, and computational efficiency, a mesh size of 0.5 mm was adopted for subsequent simulations. Figure 3b is the diagram of the grid structure, in which the ratio of grid size to specimen thickness is 0.1.

3. Optimization Method

In this study, the error coefficients of stress and strain uniformity and load transfer efficiency were used as indicators to evaluate the cruciform specimen. Meanwhile, the stability of indicators during deformation was considered.

3.1. Multi-Objective Evaluation Indicator and Criterion

3.1.1. Uniformity of Stress and Strain

The error coefficients of stress–strain uniformity are established based on the standard deviation. Firstly, the mean stress and strain values in the gauge area are calculated from the maximum principal stress value and the maximum principal strain value. The formulas are as follows:
σ a v g = 1 T i = 1 n t i σ m , i ,
ε a v g = 1 T i = 1 n t i ε m , i ,
where σ a v g is the average value of maximum principal stress in the gauge area. ε a v g is the average value of maximum principal strain in the gauge area. σ m , i is the maximum principal stress value of unit i in the gauge area. ε m , i is the maximum principal strain value of unit i in the gauge area. T is the area of the gauge area, t i is the surface area of unit i in the gauge area after deformation, and n is the number of units in the gauge area. Then, the standard deviations of stress and strain are further calculated as follows:
s σ = 1 S i = 1 n s i ( σ m , i σ a v g ) 2 ,
s ε = 1 S i = 1 n s i ( ε m , i ε a v g ) 2 ,
where s σ is the standard deviation of stress and s ε is the standard deviation of strain. s i is the unit area and S is the total area of the gauge area. Considering the influence of the magnitude of stress and strain, the distribution error coefficient is normalized by dividing the mean value of stress and strain. A smaller value corresponds to higher stress or strain uniformity. The formulas are as follows:
e σ = s σ σ a v g ,
e ε = s ε ε a v g ,
where e σ is the error coefficient of stress uniformity and e ε is the error coefficient of strain uniformity. In the specified central gauge area, the final uniformity error should not exceed 5% based on considering the level of stress and strain. Further, the variation amplitude should not exceed 10%, taking into account the uniformity changes in tensile deformation. In summary, the established criteria are given as follows:
e f i n a l 0.05 max ( e ) min ( e ) 0.1 ,
where e f i n a l is the final uniformity error after deformation is complete max ( e ) and min ( e ) are the maximum and minimum uniformity errors during deformation, respectively.

3.1.2. Load Transfer Efficiency

Based on the tensile arm load and the central section load, the load transfer efficiency α was established to evaluate the tensile load loss of the specimen. A larger ratio means higher load transfer efficiency of the specimen. The formulas are as follows:
α = F c F = j = 1 m F c , j i = 1 n F i ,
where F and F c are the resultant forces on the arm end section and the central section of the specimen. F i and F c , j are the joint forces on the corresponding section. n and m are the number of nodes on the corresponding section.
The central stress of a biaxial tensile specimen is difficult to measure directly, and it is usually estimated by using the force measured at the clamp. The coefficient cannot be determined solely on the end state because of the variation in the coefficient during tensile deformation. Therefore, the specimen design can be evaluated beforehand to determine whether the load transfer efficiency of the configuration has good stability. The variation amplitude of the load transfer efficiency of the optimized specimen in tensile is no more than 0.05, and the established criteria are as follows:
max ( α ) min ( α ) 0.05 ,
where max ( α ) and min ( α ) are the maximum and minimum load transfer efficiency during deformation, respectively.

3.2. Multi-Parameter Analysis

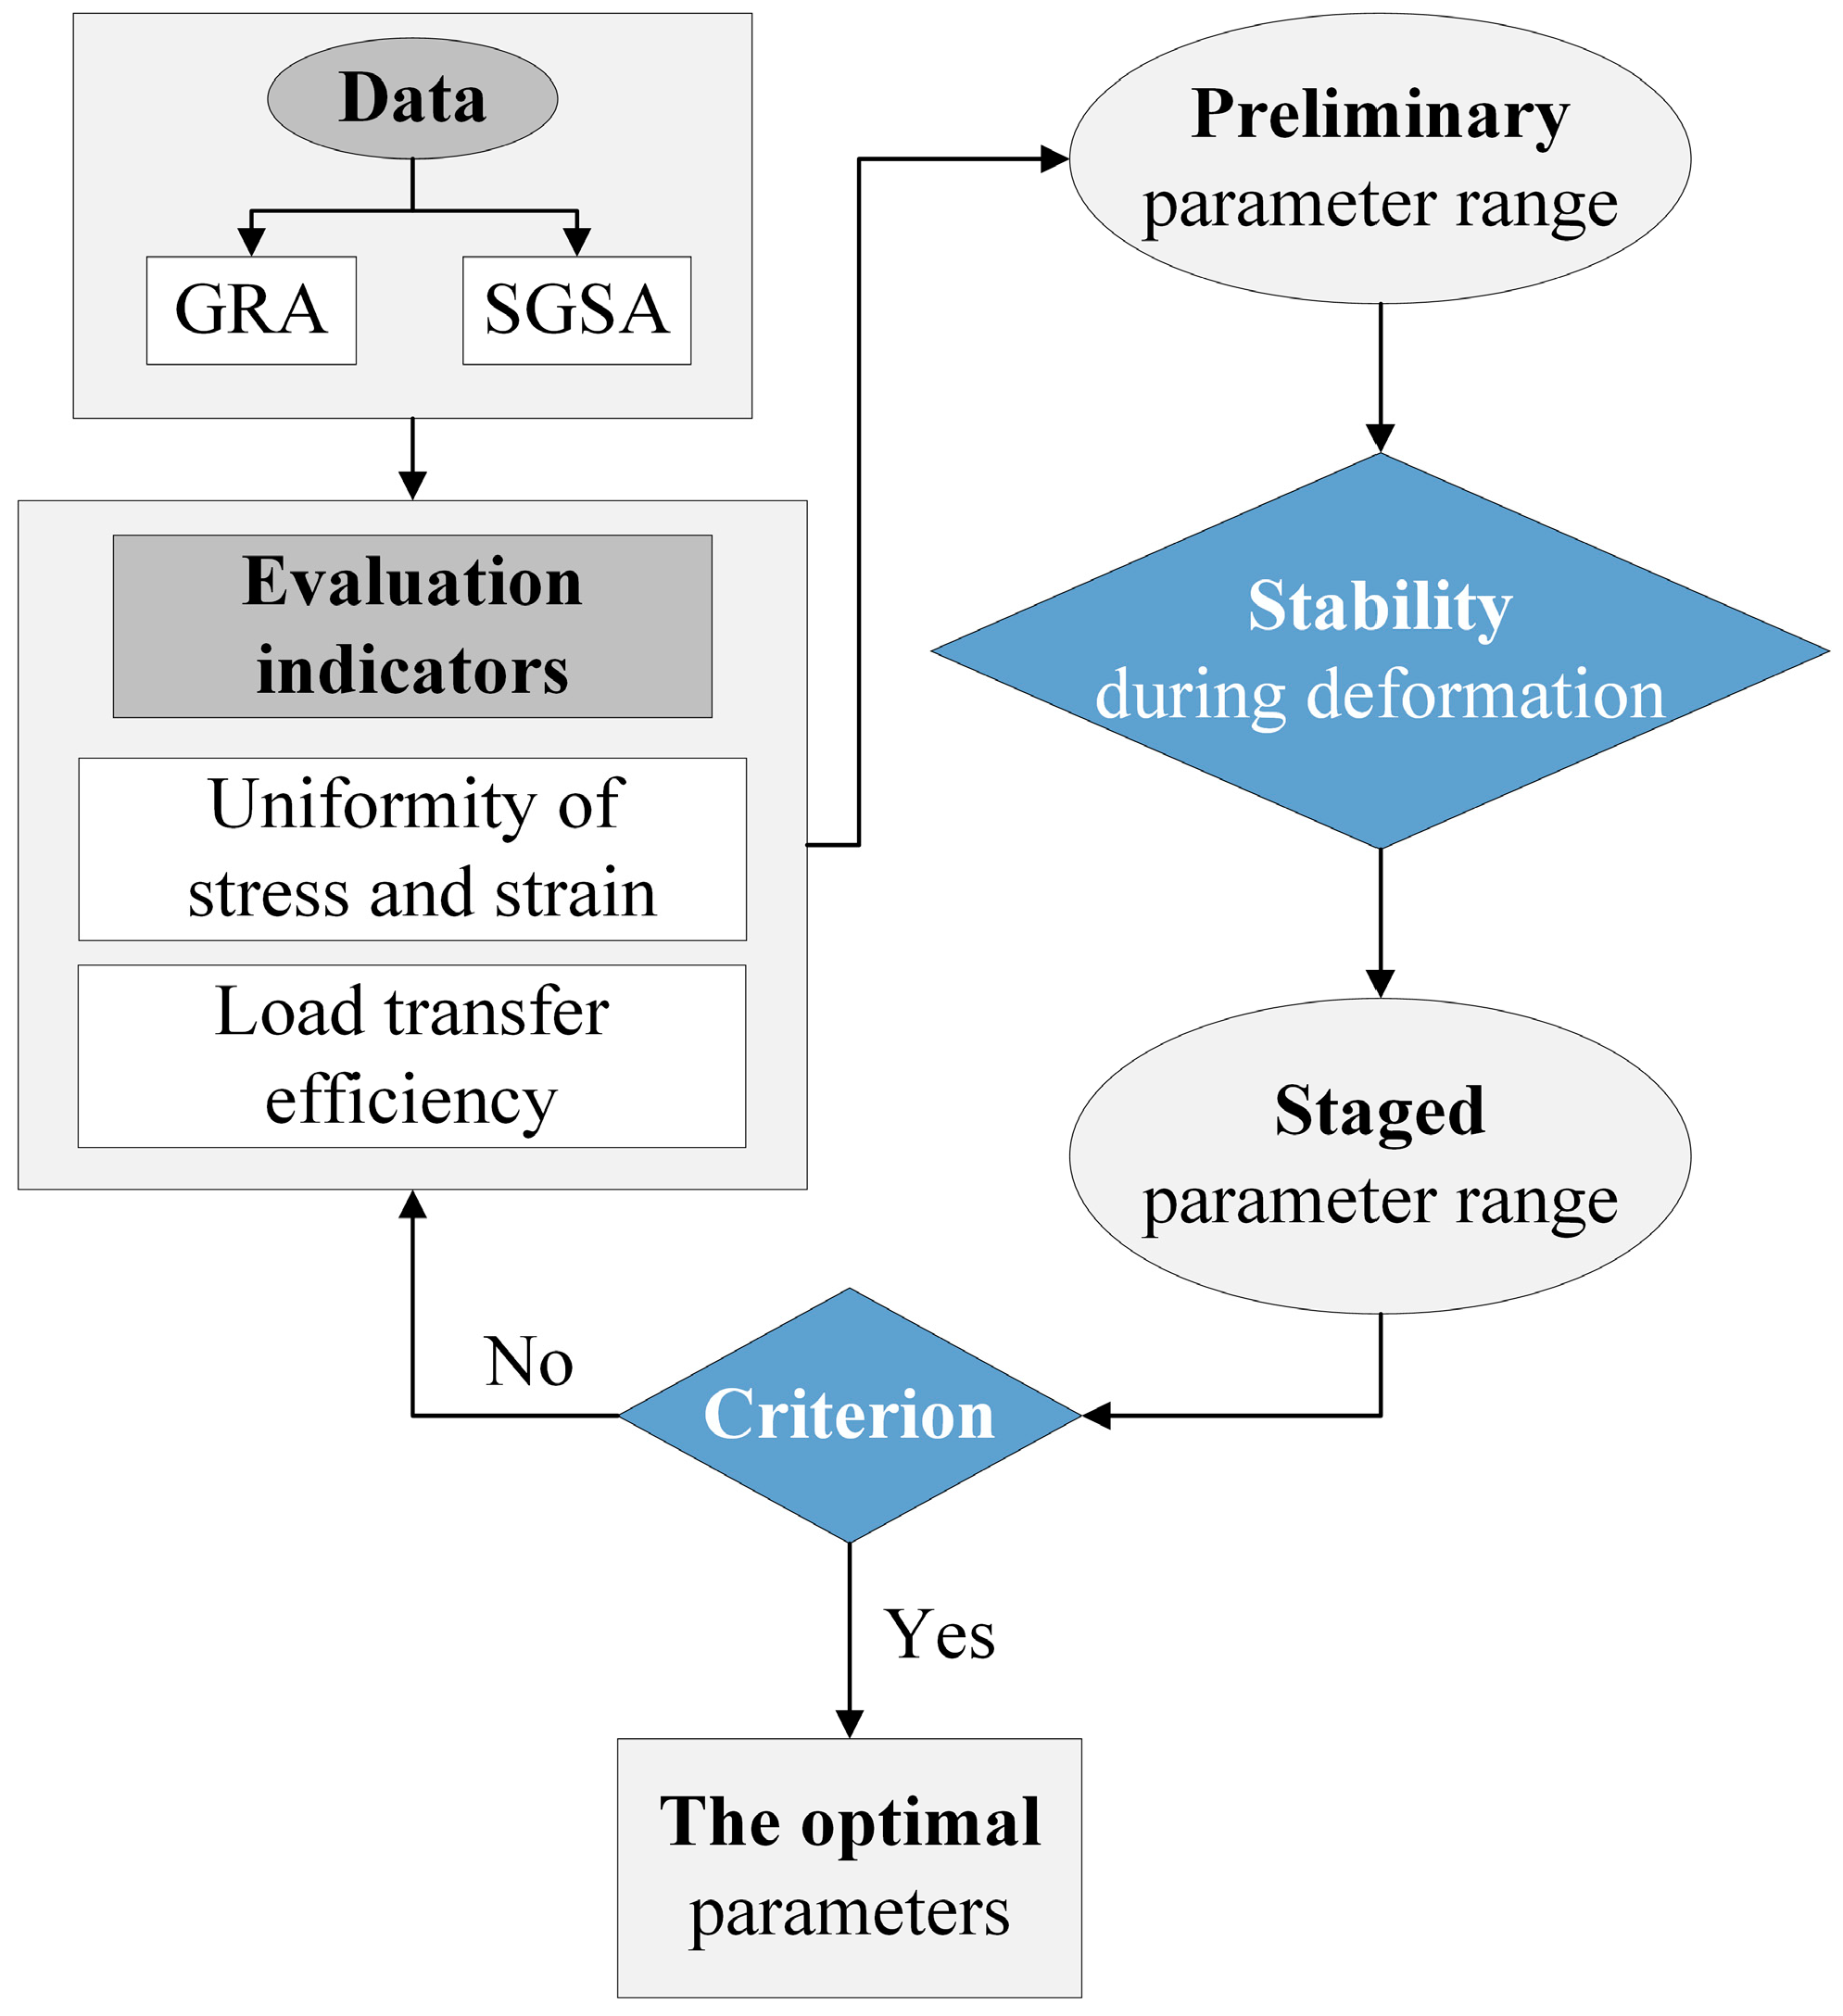
Given the large number of parameters and the continuous value space in this study, the Optimized Latin Hypercube Sampling (OLHS) was first used to uniformly sample points in the multi-dimensional space for obtaining the parameter combination set. Combined with finite element simulation, the indicator coefficients of different parameter combinations were calculated to obtain the parameter target response data set required for subsequent analysis. Based on this data set, the Grey Relational Analysis (GRA) method was introduced to quantitatively evaluate the correlation between each parameter and different optimization indicators, as well as to obtain the principal parameters set. Furthermore, the Second-Order Sobol Global Sensitivity Analysis (SGSA) was used to quantitatively analyze the interaction between parameters and study the influence degree of parameter combinations under different indicators. The analysis process is shown in Figure 4.
OLHS is an improved space-filling experimental design approach. It iteratively adjusts the initial sampling points by using an optimization algorithm to minimize the spatial correlation among sample points, which more effectively covers the entire parameter space.
GRA is a mathematical method for measuring the similarity between various factors of a system based on its dynamic change trend. The formula is given as follows [35]:
Δ i ( k ) = x 0 * ( k ) x i * ( k ) γ i ( k ) = Δ min + ρ Δ max Δ i ( k ) + ρ Δ max Γ i = 1 n k = 1 n γ i ( k ) ,
where k represents the case number, x 0 * ( k ) is the characteristic value of simulation results, x i * ( k ) is the corresponding normalized value. Δ i ( k ) is the absolute difference. Δ min and Δ max , respectively, represent the maximum and minimum values in Δ i ( k ) . γ i ( k ) is the gray correlation of k . Γ i is the final gray correlation.
SGSA is a global sensitivity analysis method based on variance decomposition. It is used to assess the degree of influence of the interaction between pairs of size parameters on each indicator. The formula is as follows:
V i j = V a r X i X j ( Ε X ~ i , j Y | X i , X j ) V i V j S i j = V i j V a r ( Y ) ,
where X i and X j are the different parameters, V i j is the variance component caused by the interaction between X i and X j . V a r ( Y ) is the total variance of indicator Y . V i and V j represent the first-order sensitivity indicators of the model variance, and E X denotes the expectations of all parameters other than X i and X j . S i j is the second-order Sobol sensitivity indicator.

3.3. Optimization Process

In this study, approximately 1500 data sets were extracted based on OLHS for multi-parameter sensitivity analysis to figure out the main parameter set. Based on the results of the analysis, research on the influence of each main parameter on configuration performance was conducted.
The modelling, simulation, and indicator calculation steps were integrated into a Python script called the evaluation program. Different parameter values were selected in the program to generate a centrally symmetric geometric structure, which is one-eighth of the original size. The simulation section involved setting materials, boundary conditions, and loads, after which the job was submitted to complete the simulation. In the calculation section, stress and strain data for each node within the specified gauge area and the load data of section nodes were extracted and used to calculate indicators according to Section 3.1. The above process involves calling ABAQUS through a Python program to output the calculation results and obtain the preliminary optimized parameter range. Next, the stability of the indicators during the deformation process of the configuration comprising parameters within this range is optimized again to determine the final optimized parameter range. The optimization process is shown in Figure 4.

4. Results and Discussion

4.1. Validation of the Effectiveness of the Evaluation Program

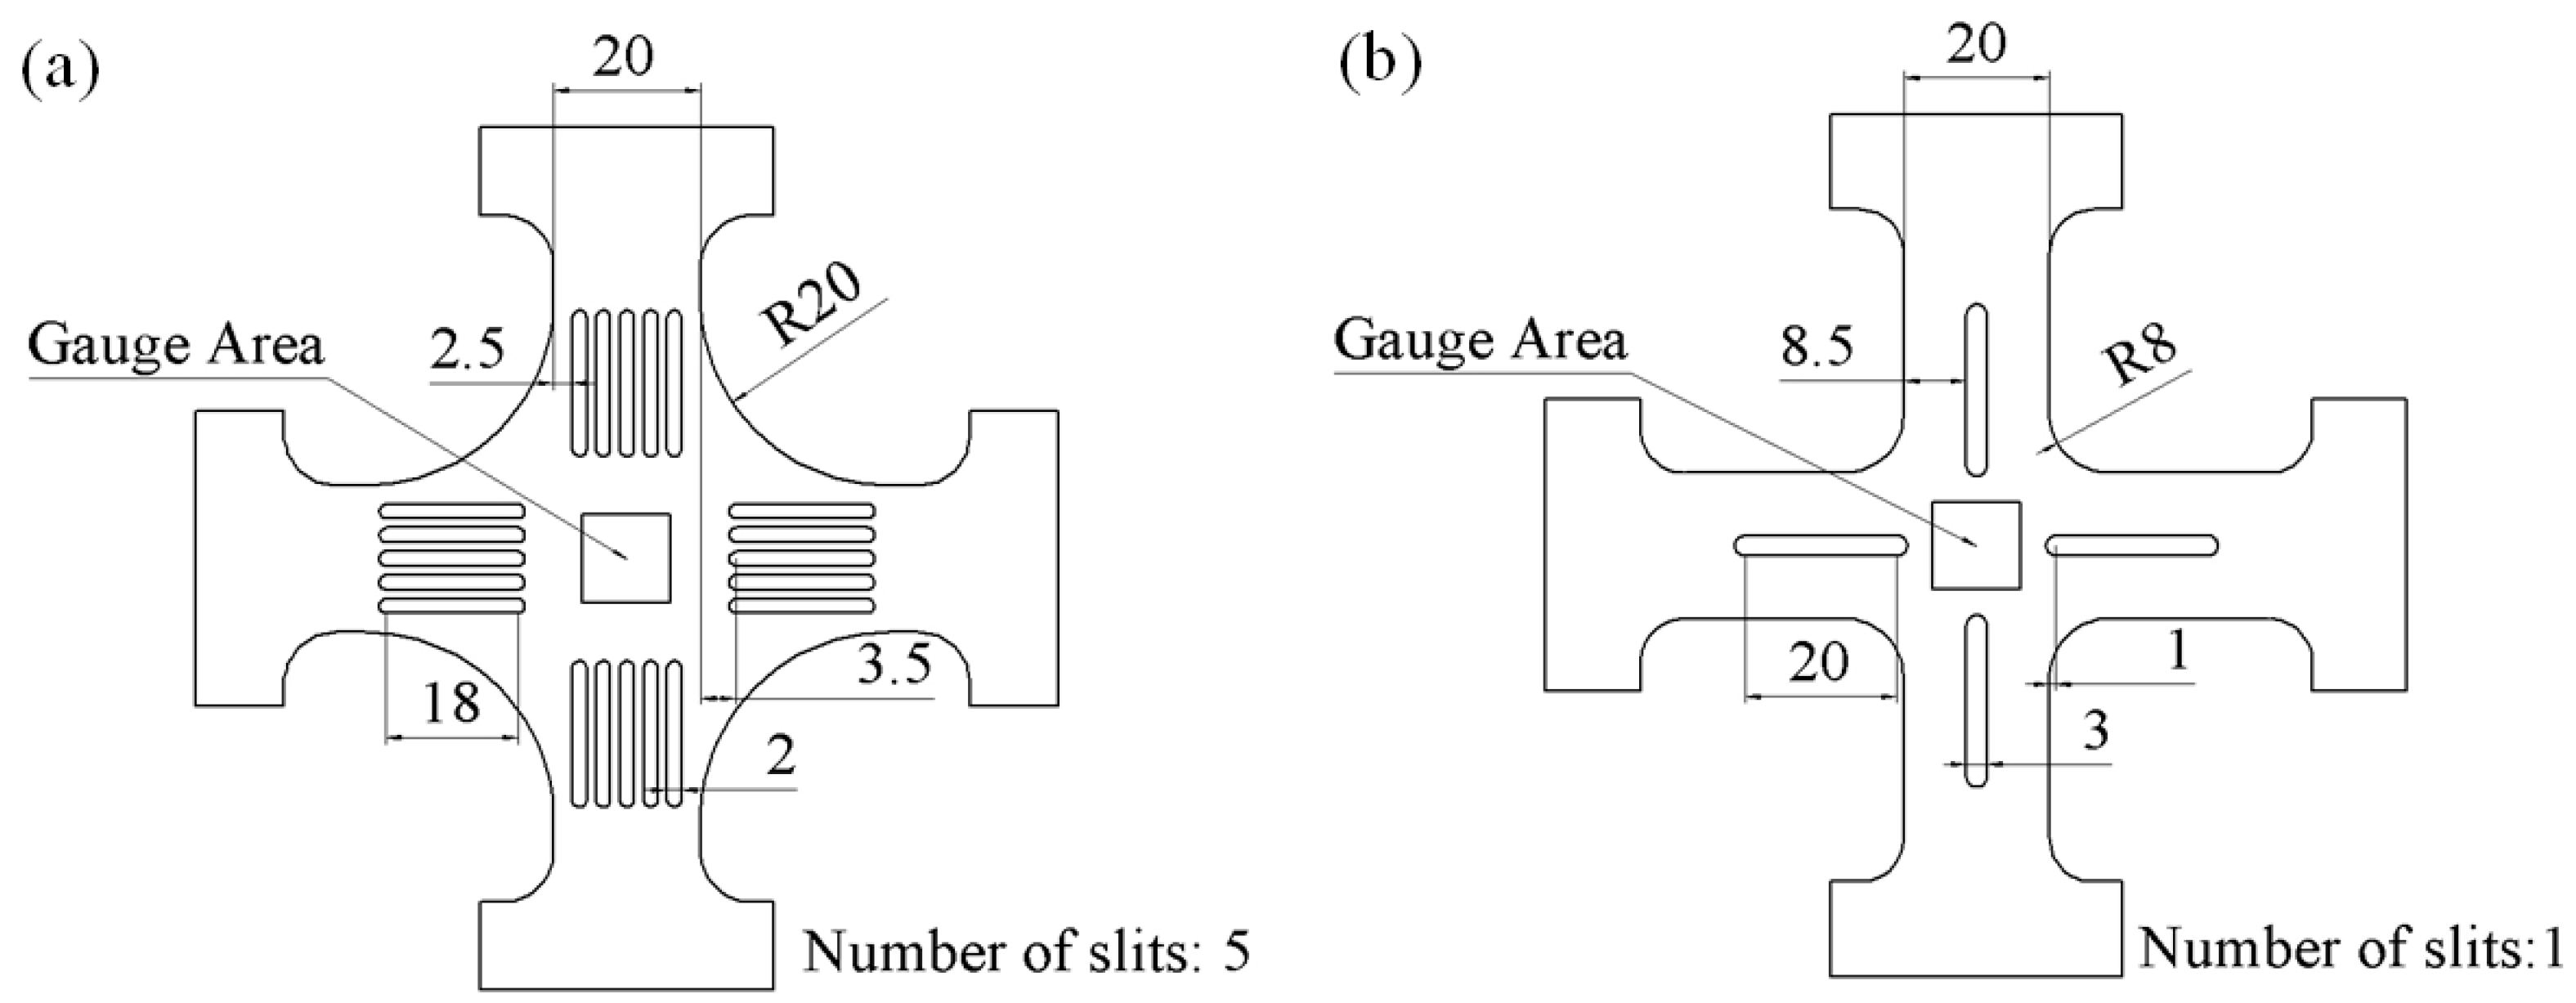
This section randomly selects a combination configuration (Figure 5) that satisfies the size parameter range to experimentally verify the accuracy of the program calculation indicators in Section 3.3. Three sets of parallel tests were conducted for each configuration, with the final results obtained from the mean values. The uniaxial stretching standard of propellant in GJB 771.107-93 is 100 mm/min, its scale distance is 70 mm, and the estimated strain rate is 0.02/s, which falls within the scope of quasi-static analysis. Using the same strain rate applied to biaxial tensile specimens, in this paper, the specimen length is 100 mm, and combined with the strain rate conversion, the tensile rate is about 120 mm/min. Each test is repeated three times for consistency. Before the test, spray uniform white paint on the surface of the specimen, then make random speckles with black paint.
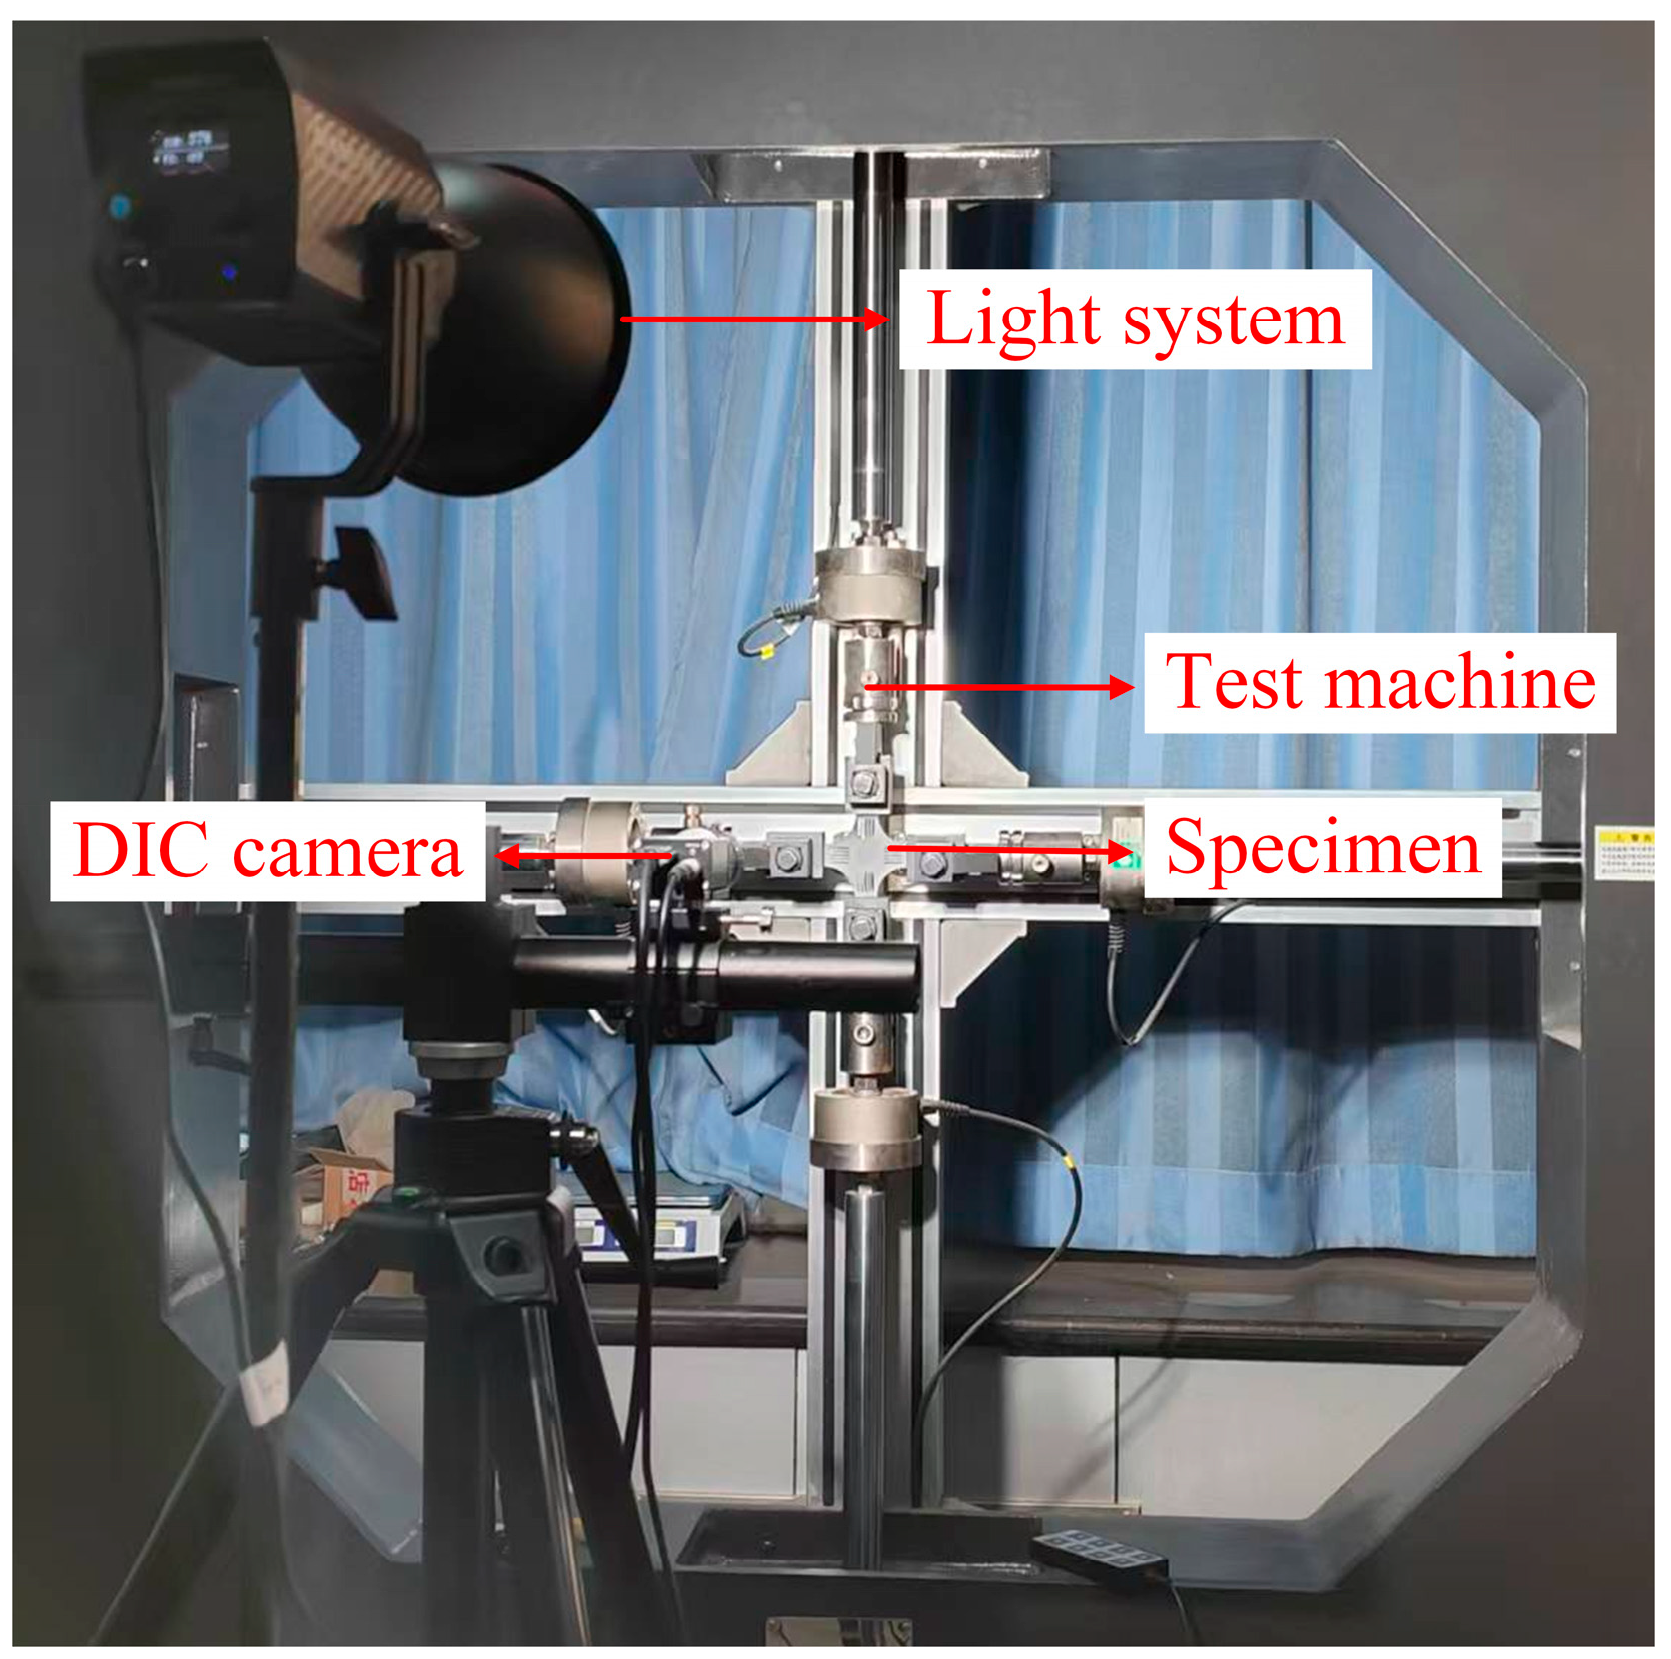
The test was conducted on an HZSZL-5000 testing machine (HONGZHUO, Xi’an, China), as shown in Figure 6. The displacement accuracy of the testing machine is 0.01 mm, and the load accuracy is 0.01 N. The DIC system (Revealer-PMLAB) includes a high-resolution digital camera which records frames with a resolution of 4096 × 3000 pixels and 8-bit depth at a 10 Hz acquisition frequency during the tensile test, accompanied by a sufficient side LED lighting system. The strain measurement accuracy is 50 μm, with a subset size of 50 px, a step size of 25 px, and a reprojection error of 0.29 px. A calibration plate with a 12 × 9 grid of dots spaced 7 mm apart was used for calibration. These test setups provide accurate and stable analysis results for tensile deformation.
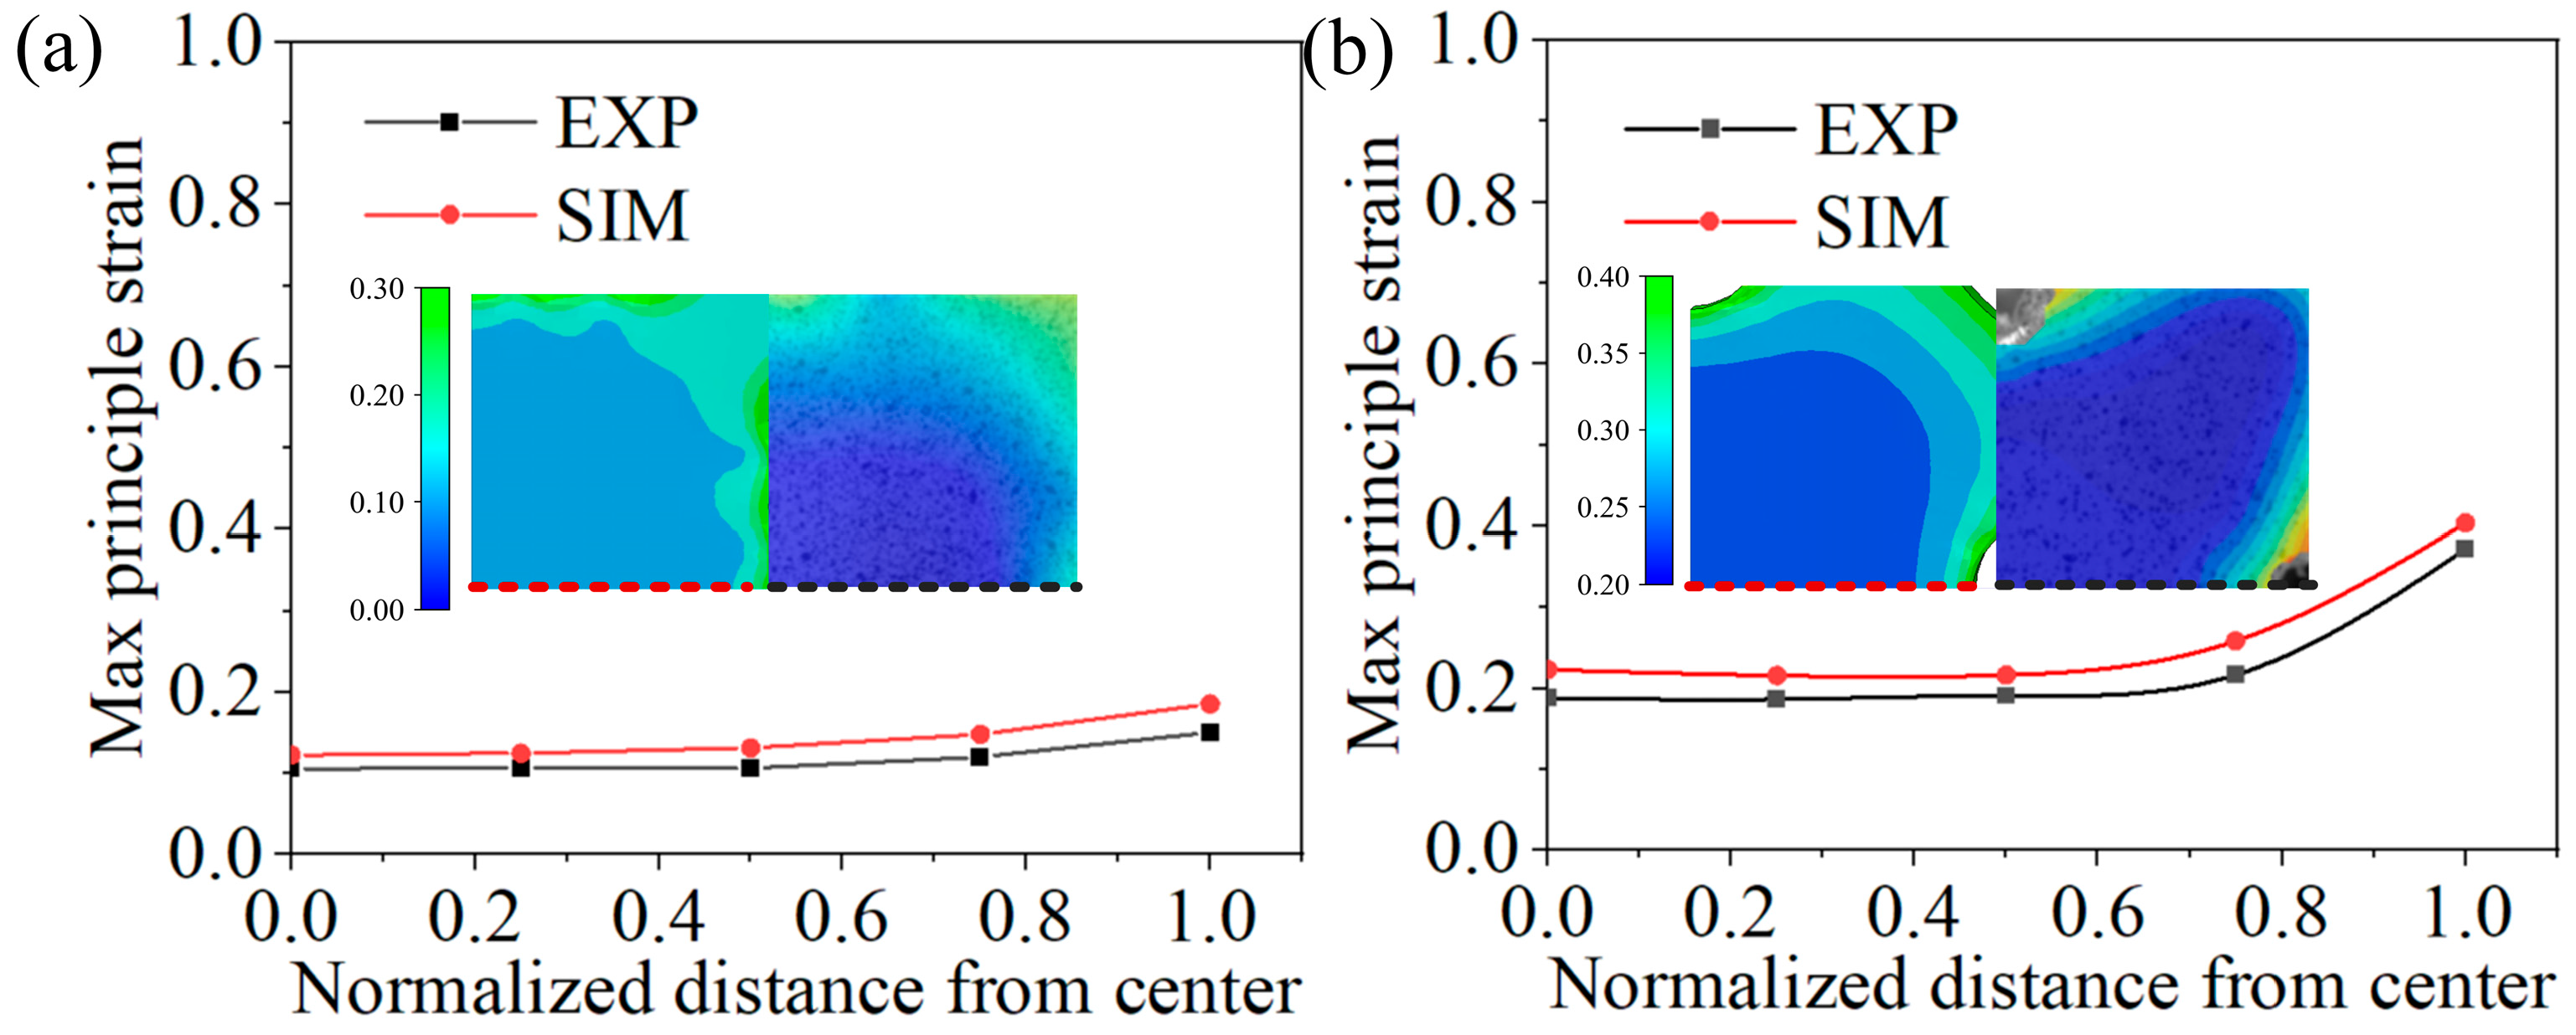
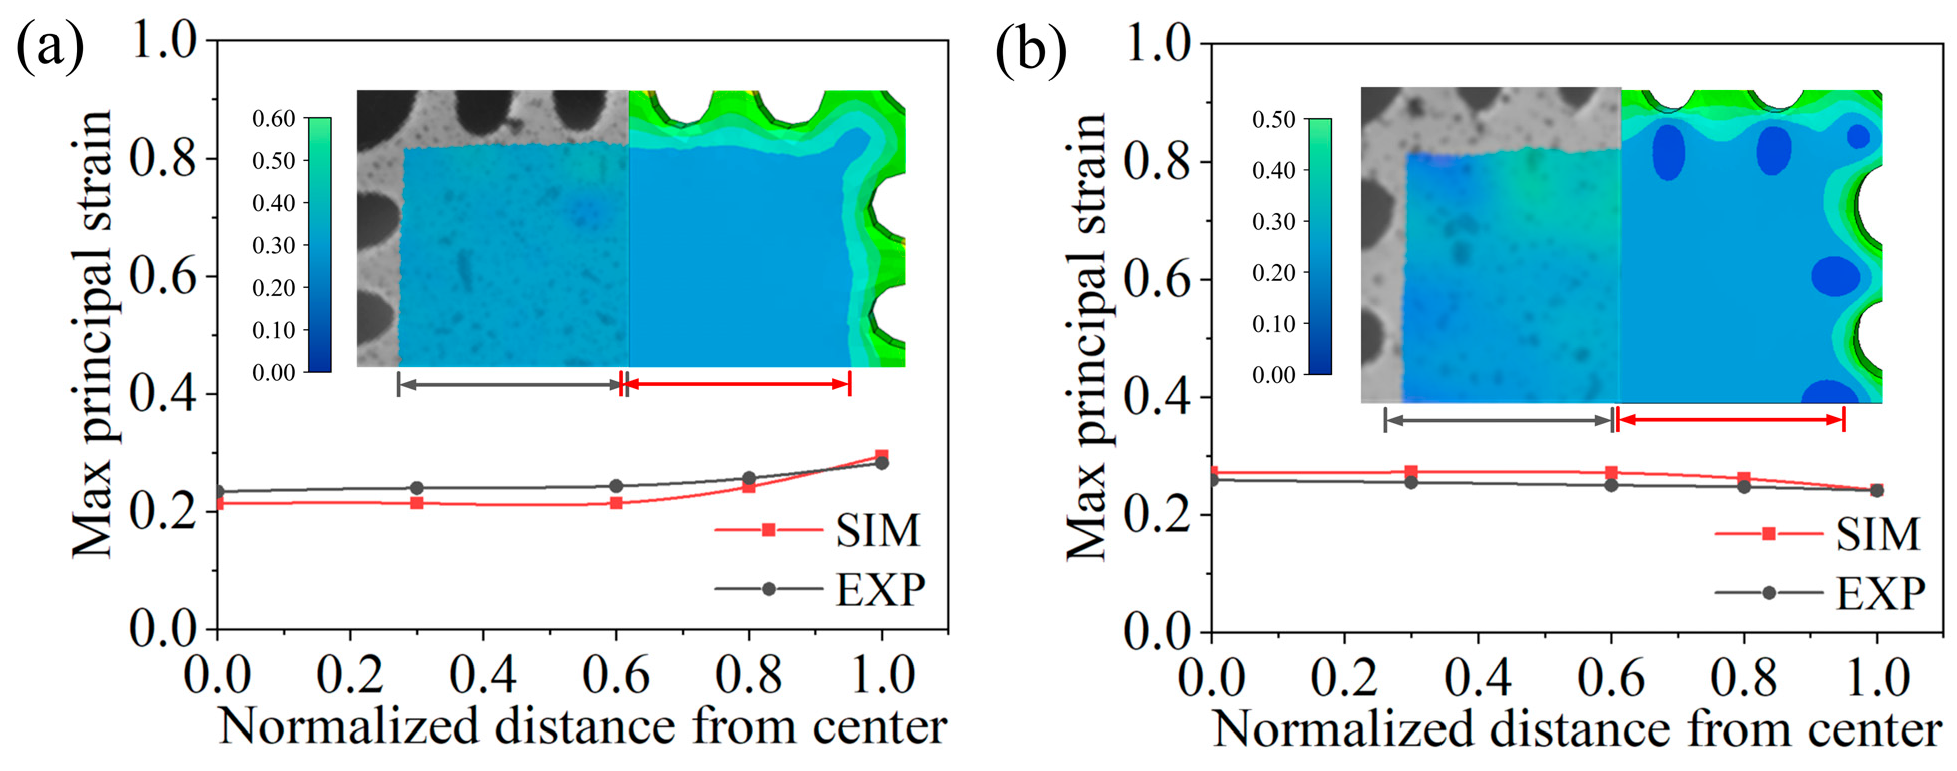
The gauge area in the image was divided into units. The maximum principal strain values in these units were then extracted and used to calculate the strain distribution error coefficient using the methods described in Section 3. Define a line from the center point to the edge in the quarter center area, as shown by the dashed line in Figure 7 (red for simulation, black for experiment). Points were uniformly sampled along this line, and strain data corresponding to the positions of the points were extracted to plot strain evolution diagrams along the line. As can be seen, the simulation results and experimental results show basically consistent trends, while the experimental values are slightly lower than the simulation values overall. This is considered to be due to slippage errors in the experimental clamping. Subsequent optimizations will be based on the results of the simulation analysis, after which the optimized samples will be tested again for verification.

4.2. Parameter Correlation and Sensitivity Analysis

As shown in Figure 8, the correlation degrees of each parameter with different evaluation indicators were ranked. The uniformity of strain stress and the load transfer efficiency were evaluated (Figure 8a–c). It can be seen that the comprehensive ranking of the grey correlation degrees of each parameter is Wd > N > WsWt > R > Wu. Wu is consistently in last place in the correlation ranking under each indicator and is therefore ignored in the optimization process. The synergy effect between parameters under each indicator was also analyzed (see Figure 9). When evaluating the uniformity of strain, Ws and R occupy the dominant position with a sensitivity of 0.30. In assessing the uniformity of stress, N and Wt both stand out with a sensitivity of 0.15. When analyzing the efficiency of load transfer, the interaction effect between parameters is weak, and the sensitivity is lower than 0.05 for all parameters. The value indicates that the interaction effect of parameters does not need to be considered under this evaluation indicator.
In summary, the parameters to be optimized are Wd, N, Ws, Wt, and R. The main consideration is the interaction effects of N and Wt, and Ws and R. Accordingly, the following analysis will be conducted in the order of optimization: N, Wd, Wt and Ws and R.

4.3. Influence of Parameters During Large Deformation

4.3.1. Influence of the Number and Width of Slits

Figure 10 illustrates the stress–strain distribution when the slit number (N) varies from 1 to 5. As N increases, the stress and strain distribution gradually become more uniform, as shown in Figure 10a–c, f–h. However, the tensile arm’s effective load-bearing capacity decreases, resulting in higher stress and strain levels and premature failure, as shown in Figure 10d,e, as well as Figure 10i,j. Meanwhile, stress levels in the strain region decrease significantly in Figure 10e. Therefore, the optimal N is 3 or 4.
Figure 11 shows the effect of the number of slits (N) and slit width (Wd) on each indicator. As can be seen in Figure 11a,b, for a given value of N, e σ and e ε first decrease and then increase as Wd rises. The optimal slit width range for different numbers of slits is the same, with all values reaching their lowest point near 2 mm. As shown in Figure 11c, the values of α are above 50% and increase gradually. However, when N is 1 or 2, changing Wd has little effect on improving α .
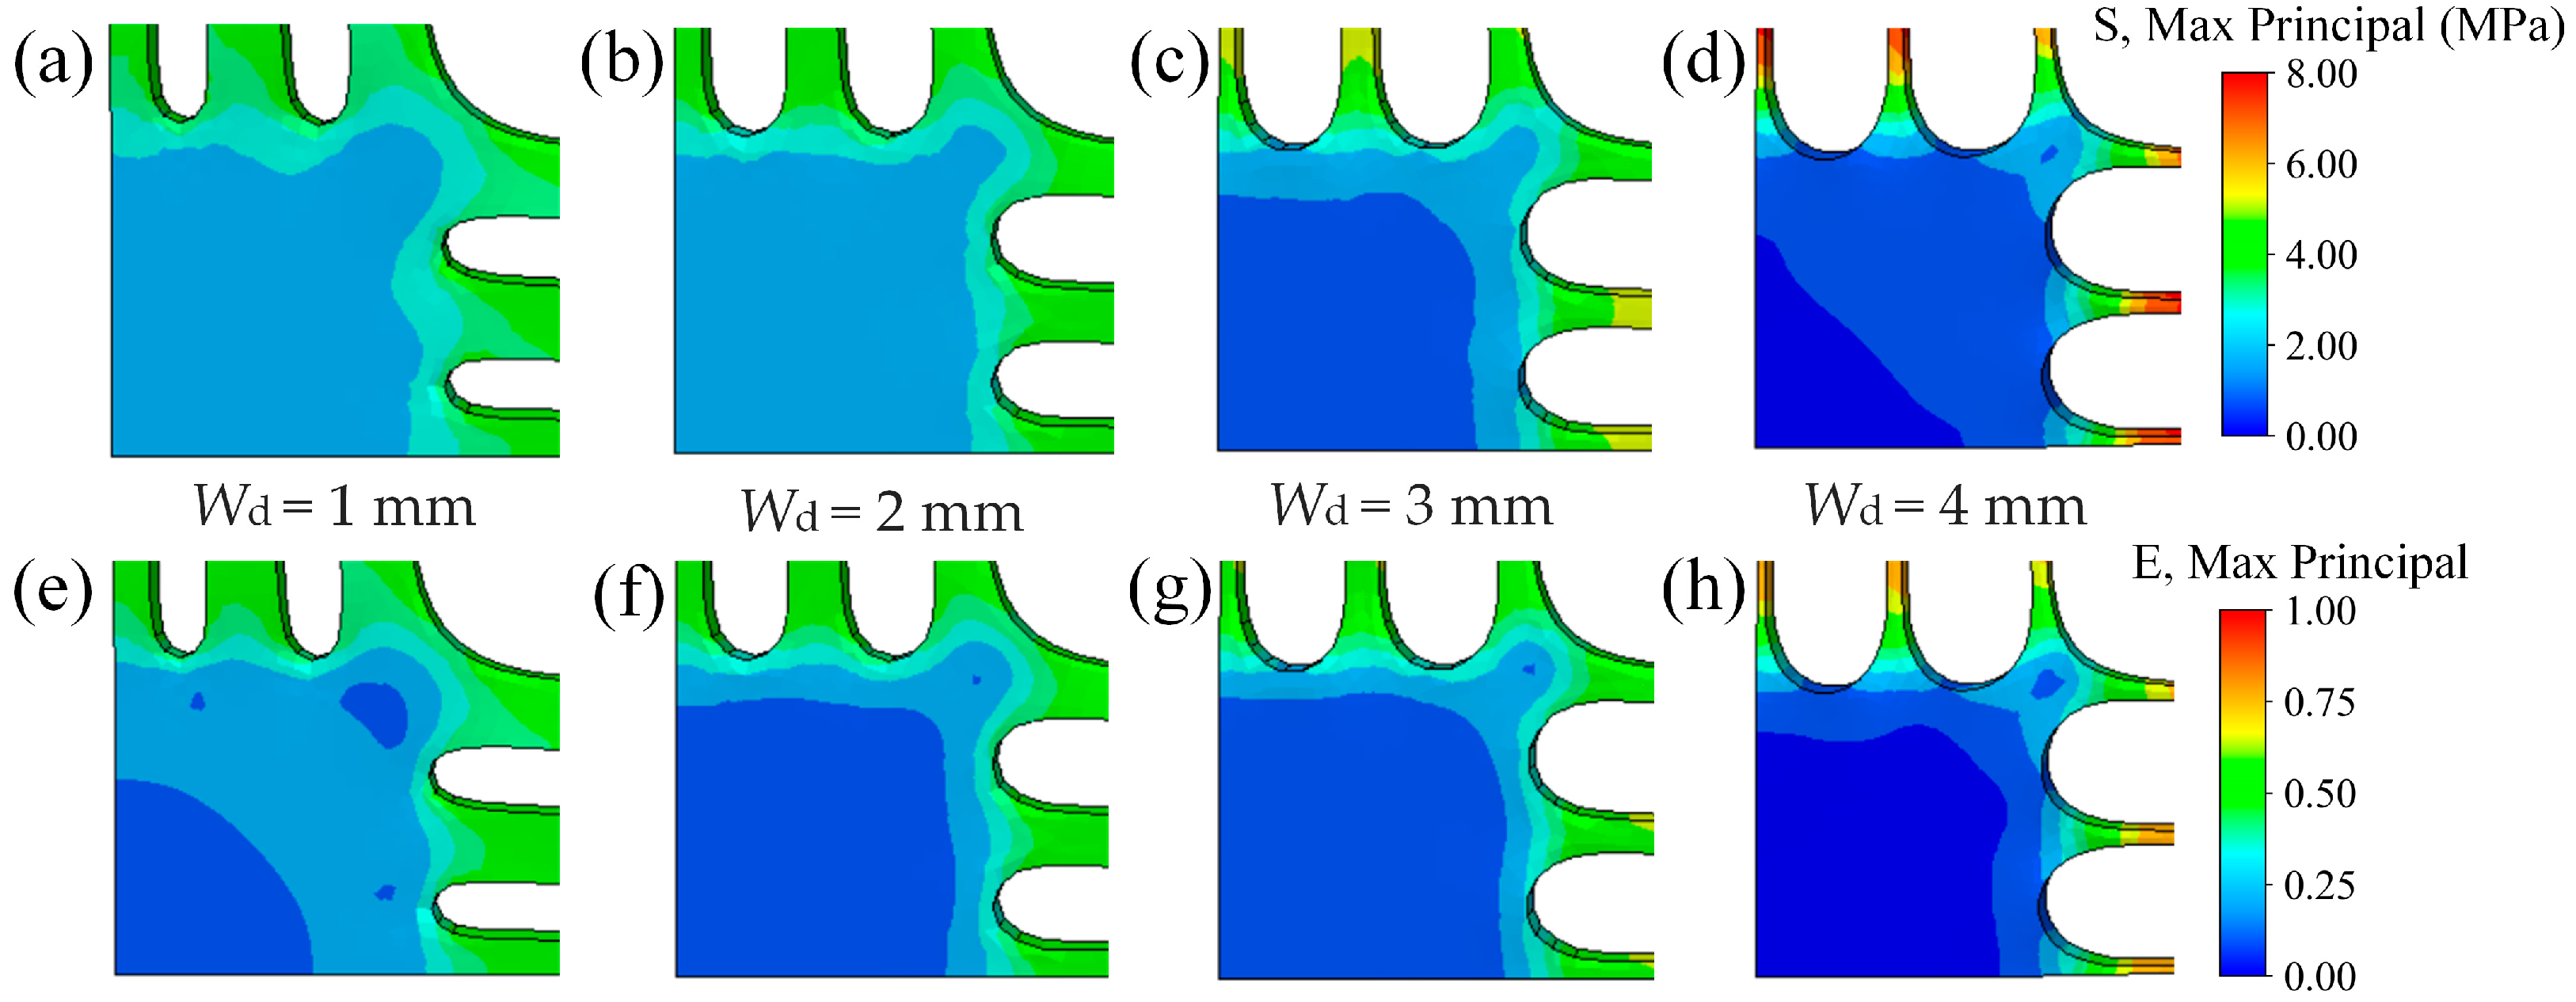
According to Figure 12, a slit width that is too large will lead to a reduction in the effective bearing cruciform-sectional area, a decline in the stiffness of the tensile arm, and a decrease in the stress and strain values in the gauge area. This is consistent with the effect of increasing N, so Wd must be adapted to a specific range of N values. The initial selections are N = 3 and Wd = [2.0, 3.0] mm, and N = 4 and Wd = [1.5, 2.5] mm.
Based on the mentioned parameter range, Figure 13 and Figure 14 illustrate the impact of Wd on various indicators during deformation when N equals 3 and 4, respectively. ε a v g represents the average strain of the gauge area. Both e σ and e ε decrease during deformation except for Wd = 2.0 mm (N = 3) and Wd = 1.5 mm (N = 4). α rapidly decreases at first before stabilizing under all conditions. When N = 3 and Wd = 2.5 mm (Figure 13), the mean values of e σ and e ε are 8% and 3%, respectively, and the variation amplitudes are 4% and 1%, respectively. When N = 4 and Wd = 2.0 mm (Figure 14), the mean values of e σ and e ε are 6% and 3%, respectively, and the variation amplitudes are 2% and 1%, respectively. These two conditions demonstrate good stability throughout the deformation process, and the final values of ε a v g and α are high. Furthermore, α gradually becomes stable after 10% strain. Thus, the optimization parameter combinations in this section are N = 3, Wd = 2.5 mm, and N = 4, Wd = 2.0 mm.

4.3.2. Influence of Slit Edge Distance

Figure 15 shows the change rule of each indicator under combinations of different slit numbers (N) and slit edge distances (Wt), based on the values of parameters in Section 4.3.1. As can be seen in Figure 15a,b, e σ and e ε are minimized at specific values of Wt. The smaller the value of N, the smaller the corresponding optimal Wt. The relative variation in the α of each parameter is small, with a value of less than 5%. For a given N, a small Wt value means that the material distribution at the rounded corner is reduced, resulting in deformation localization. Meanwhile, a large Wt value leads to uneven bearing arm widths involved in load transfer, affecting the uniform load input to the center. Therefore, an appropriate Wt value can be designed to reduce stress concentration at rounded corners. Thus, N can be set to either 3 or 4 and Wt to either [3.0, 4.5] mm or [2.0, 3.5] mm.
Figure 16 and Figure 17 show how the above parameters change in the indicators during tensile deformation. The variation law of α with ε a v g is the same for the two parameter combinations: initially decreases and stabilizes in Figure 16c and Figure 17c. The mean values of e ε and e σ are minimized when Wt = 4.0 mm and N = 3 in Figure 16a,b. In particular, e ε decreases slightly in the early stage and remains at 12% in the later stage, with a variation of 4%. Meanwhile, e σ remains essentially constant during deformation, with an average value of 6% and a variation of 1%. Figure 17a,b shows that, under the conditions N = 4 and Wt = 2.5 mm, the minimum values of e σ and e ε are also reached. In this case, the mean values of e σ and e ε are 5% and 3%, respectively, while the variation amplitudes are 8% and 3%. Therefore, N = 3 and Wt = 4.0 mm, as well as N = 4 and Wt = 2.5 mm, are used as the optimization parameters in this section.

4.3.3. Influence of Slit Length and Fillet Radius

Figure 18 shows that increasing the fillet radius (R) and slit length (Ws) can reduce the e σ and e ε , and that both remain stable when Ws reaches 15 mm, as shown in Figure 18a,b. The configuration’s α can be improved by increasing Ws, as shown in Figure 18c. The calculation results also show that configurations with a small R and large Ws or a large R and small Ws can achieve the same distribution error level.
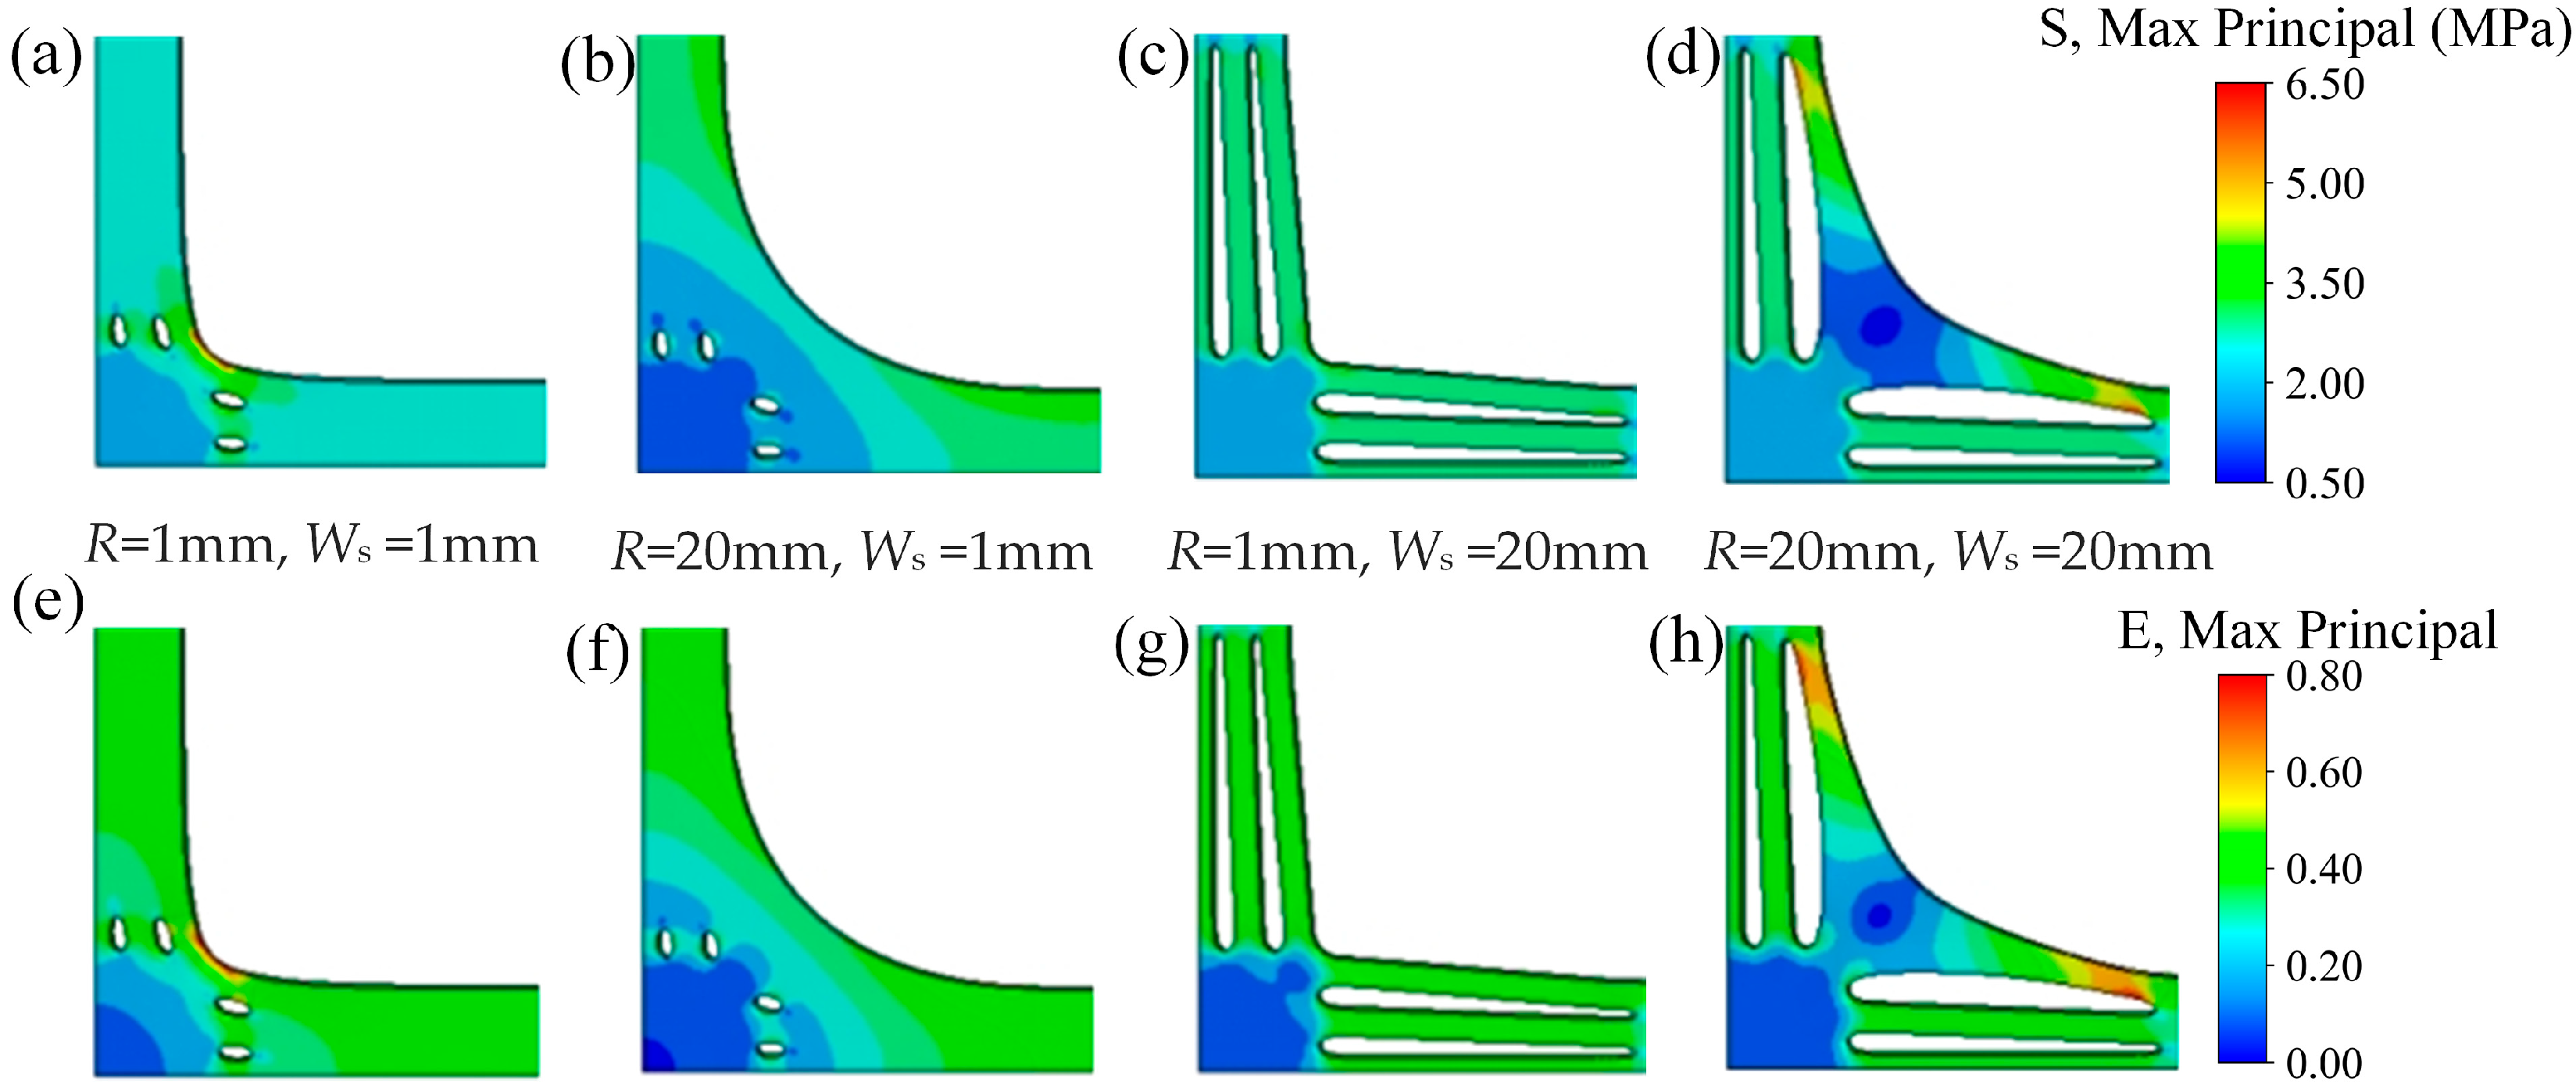
As shown in Figure 19, increasing the radius of the fillet or the length of the slit can alleviate the stress concentration between the stretching arms. However, the presence of large rounded corners and long slits simultaneously results in stress concentration being transferred to the end of the outer slit. Increasing R leads to an excessive distribution of materials at the rounded corners and an excessive sharing of different axial loads. This results in lateral stresses, reducing the efficiency of load transfer and the stress–strain level in the gauge area. Therefore, to avoid stress concentration at the rounded corner and reduction in the gauge area level, a design combining a small fillet radius and a long slit is considered. The initial parameter range is R = [1, 5] mm and Ws = 15 mm.
Figure 20 and Figure 21 illustrate the variations in each indicator throughout the tensile deformation process, based on the selected parameter range. When N = 3, all configurations exhibit values of e ε exceeding 10%. When N = 4, changes in R have a minimal impact on the error, which decreases for all configurations during the tensile process (Figure 21). The respective mean values of the measures are 5% and 3%. When R = 3 mm, the variation amplitudes are at their smallest, with values of 8% and 3%. In summary, N = 4 and R = 3 mm were selected as the final optimization parameters.

4.3.4. Optimal Parameters of the Cruciform Specimen

Under the conditions of stress–strain level, uniformity, and stability of load transfer efficiency, the optimized parameters are shown in Table 3. The evaluation indicators of optimized configuration during deformation are shown in Figure 22. During biaxial tensile deformation, the strain coefficient decreased from 10% at the start of stretching to a final value of 2.9%, with a variation amplitude of 7.1%. The stress coefficient decreased from 4.8% at the start of stretching to 2.2% at the end. The variation amplitudes are the values of 2.6%. Both were less than the prescribed uniformity tolerance. The variation in amplitude of load transfer efficiency is 1.5%, stabilizing at 56%.
The advantage of using cross-shaped specimens is that they allow for easier proportional stretching. In the experimental validation section, therefore, the optimized specimens will be tested using a constant-speed tensile method with strain ratios of 1:1 and 1:2. Charts will be plotted to illustrate trends in stress, strain, and triaxial stress as a function of relative position, with measurements taken along the horizontal line from center to edge within the 1/4 central region. Figure 23 shows the strain and evolution diagrams along the centerline for both the experiment and simulation, indicating good consistency between the two. Figure 24 and Figure 25 demonstrate that stress, strain, and stress triaxiality exhibit stable behavior within the measurement region as the relative position changes. The area of the relatively uniform region has also expanded beyond the initially defined region. This expansion aims to minimize the boundary effect on stress distribution in the central test region.

4.4. Further Discussion

Based on the above results, an increase in the number of slits improves uniformity in the gauge area by reducing the lateral stiffness of the arm, which was also proved by research [24,36]. The number should be considered alongside the width and edge width of slits (Wd and Wt). This study further found that increasing the number of slits or the width has the same effect on the performances: increased stress and strain uniformity, and improved load transfer efficiency. However, if the number or width is too large, this can lead to significant narrowing of the load-bearing arm and premature failure. Therefore, the specific combination of number and width of slits must be tailored to the material-specific mechanical properties.
Meanwhile, increasing the fillet radius does relieve stress concentration and improve the uniformity of strain, which is the same with the research [19]. This study further found that increasing the fillet radius reduces load transfer efficiency. For the slit type configuration, the fillet radius needs to be considered alongside the slit length. Based on the results of this study, on the one hand, a large fillet radius or a long slit can improve stress–strain uniformity in the gauge area, but the two designs cannot be in one configuration at the same time. On the other hand, a small fillet radius and a short slit can both improve the load transfer efficiency of the specimen. However, considering that a large fillet radius will share the center load due to material distribution, the stress–strain level in the gauge area decreases. Therefore, the combination of a long slit and a small fillet radius is a more reasonable design.
The stress in the gas is a constant value [30,31,37]. However, according to the result of this study, it is clear that the efficiency is not constant during the tensile process. Constant efficiency leads to inaccuracy of the stress data process. Therefore, the stability of the specimen performance in the tensile process has been fully considered for the optimized configuration in this study, which can improve the accuracy with which the region is estimated from the tensile load, transfer efficiency, and geometrical relationship [4,38], because measurement of stress is not as straightforward as strain measurement using equipment. Combined with the large deformation character of soft material, the exact value of the load transferred to the gauge area is unknown. Studies usually define this efficiency y for stress data.

5. Conclusions

This study presents an optimization of biaxial tensile cruciform specimens for soft composite materials with large deformation characteristics. The key findings are summarized as follows:
(1)
An evaluation system for soft composites was developed, combining stress–strain uniformity in the gauge area and load transfer efficiency, with stability analysis during deformation as the novelty
(2)
The optimized specimen achieved high mechanical stability, with average stress and strain distribution errors during deformation of 5% and 3%, respectively, which decreased at 2.2% and 2.9%, respectively. The stable load transfer efficiency with the variation did not exceed 1.5%.
(3)
The dominant factors affecting the specimen performance are the slit width (Wd) and the number of slits (N), which are the most critical, and the influencing order is Wd > N > WsWt > R. Meanwhile, these parameters have a nonlinear effect on load transfer during the tensile process.
(4)
Slit placement enhanced gauge area uniformity but reduced load transfer efficiency by 50%, necessitating future improvements in clamping and efficiency.

Author Contributions

Conceptualization, H.L. and J.W.; methodology, H.L.; validation, J.W.; formal analysis, H.L.; investigation, H.L. and J.W.; data curation, J.W.; writing—original draft preparation, H.L.; writing—review and editing, X.W. and X.L.; supervision, X.W. and X.L.; funding acquisition, J.W. All authors have read and agreed to the published version of the manuscript.

Funding

The fund is supported by the Open Fund of Zhijian Laboratory (Rocket Force University of Engineering), No.2023-ZJSYS-KF01-04.

Data Availability Statement

The original contributions presented in the study are included in the article; further inquiries can be directed to the corresponding author.

Acknowledgments

All authors who contributed to this study are gratefully acknowledged.

Conflicts of Interest

The authors declare no conflicts of interest.

Abbreviations

The following abbreviations are used in this manuscript:
DICDigital Image Correlation
GRAGrey Relational Analysis
SGSAThe Second-Order Sobol Global Sensitivity Analysis
OLHSThe Optimized Latin Hypercube Sampling

References

  1. Jiang, S.; Yong, Z. Modulation of Mechanical Properties of Silica-Filled Silicone Rubber by Cross-Linked Network Structure. Polymers 2024, 16, 2304. [Google Scholar] [CrossRef] [PubMed]
  2. Porter, C.; Zaman, B.; Pazur, R. A Critical Examination of the Shelf Life of Nitrile Rubber O-Rings Used in Aerospace Sealing Applications. Polym. Degrad. Stab. 2022, 206, 110199. [Google Scholar] [CrossRef]
  3. Maurya, A.K.; De Souza, F.M.; Gupta, R.K. Polyurethane and Its Composites: Synthesis to Application. In ACS Symposium Series; Gupta, R.K., Ed.; American Chemical Society: Washington, DC, USA, 2023; Volume 1452, pp. 1–20. [Google Scholar] [CrossRef]
  4. Azoug, A.; Thorin, A.; Nevière, R.; Pradeilles-Duval, R.-M.; Constantinescu, A. Influence of Orthogonal Prestrain on the Viscoelastic Behaviour of Highly-Filled Elastomers. Polym. Test. 2013, 32, 375–384. [Google Scholar] [CrossRef]
  5. Soni, R.; Verma, R.; Kumar Garg, R.; Sharma, V. A Critical Review of Recent Advances in the Aerospace Materials. Mater. Today Proc. 2024, 113, 180–184. [Google Scholar] [CrossRef]
  6. Zhou, L.-Y.; Fu, J.; He, Y. A Review of 3D Printing Technologies for Soft Polymer Materials. Adv. Funct. Mater. 2020, 30, 2000187. [Google Scholar] [CrossRef]
  7. Sasso, M.; Palmieri, G.; Chiappini, G.; Amodio, D. Characterization of Hyperelastic Rubber-like Materials by Biaxial and Uniaxial Stretching Tests Based on Optical Methods. Polym. Test. 2008, 27, 995–1004. [Google Scholar] [CrossRef]
  8. Destrade, M.; Saccomandi, G.; Sgura, I. Methodical Fitting for Mathematical Models of Rubber-like Materials. Proc. R. Soc. A 2017, 473, 20160811. [Google Scholar] [CrossRef]
  9. Large Deformation Isotropic Elasticity: On the Correlation of Theory and Experiment for Compressible Rubberlike Solids. Proc. R. Soc. Lond. A 1972, 328, 567–583. [CrossRef]
  10. Lu, Z.; Zhao, J.-Y.; Zhou, C.-Y.; He, X.-H. Optimization Design of a Small-Sized Cruciform Specimen for Biaxial Fatigue Testing. Metals 2020, 10, 1148. [Google Scholar] [CrossRef]
  11. Deng, N.; Kuwabara, T.; Korkolis, Y.P. Cruciform Specimen Design and Verification for Constitutive Identification of Anisotropic Sheets. Exp. Mech. 2015, 55, 1005–1022. [Google Scholar] [CrossRef]
  12. Demmerle, S.; Boehler, J.P. Optimal Design of Biaxial Tensile Cruciform Specimens. J. Mech. Phys. Solids 1993, 41, 143–181. [Google Scholar] [CrossRef]
  13. Baptista, R.; Infante, V.; Madeira, J.F.A. Optimization of a Cruciform Specimen for Fatigue Crack Growth under in and Out-of-Phase in-Plane Biaxial Loading Conditions. Mech. Adv. Mater. Struct. 2023, 30, 1649–1666. [Google Scholar] [CrossRef]
  14. Men, M.; Meng, B.; Wan, M. Investigation on the Biaxial Tensile Testing Method for Metal Foil Using Cruciform Specimen. Theor. Appl. Fract. Mech. 2024, 133, 104577. [Google Scholar] [CrossRef]
  15. Baptista, R.; Claudio, R.A.; Reis, L.; Madeira, J.F.A.; Guelho, I.; Freitas, M. Optimization of Cruciform Specimens for Biaxial Fatigue Loading with Direct Multi Search. Theor. Appl. Fract. Mech. 2015, 80, 65–72. [Google Scholar] [CrossRef]
  16. Jia, Y.; Zhang, W.; Zhang, W. Optimal design and examination study of biaxial tensile specimens for solid propellant. J. Propuls. Technol. 2011, 32, 737–740. [Google Scholar] [CrossRef]
  17. Yu, Y.; Wan, M.; Wu, X.-D.; Zhou, X.-B. Design of a Cruciform Biaxial Tensile Specimen for Limit Strain Analysis by FEM. J. Mater. Process. Technol. 2002, 123, 67–70. [Google Scholar] [CrossRef]
  18. Esmaeili, A.; George, D.; Masters, I.; Hossain, M. Biaxial Experimental Characterizations of Soft Polymers: A Review. Polym. Test. 2023, 128, 108246. [Google Scholar] [CrossRef]
  19. Lamkanfi, E.; Van Paepegem, W.; Degrieck, J. Shape Optimization of a Cruciform Geometry for Biaxial Testing of Polymers. Polym. Test. 2015, 41, 7–16. [Google Scholar] [CrossRef]
  20. Zhang, R.; Shao, Z.; Shi, Z.; Dean, T.A.; Lin, J. Effect of Cruciform Specimen Design on Strain Paths and Fracture Location in Equi-Biaxial Tension. J. Mater. Process. Technol. 2021, 289, 116932. [Google Scholar] [CrossRef]
  21. Yang, X.; Wu, Z.R.; Yang, Y.R.; Pan, Y.; Wang, S.Q.; Lei, H. Optimization Design of Cruciform Specimens for Biaxial Testing Based on Genetic Algorithm. J. Mater. Eng. Perform. 2023, 32, 2330–2343. [Google Scholar] [CrossRef]
  22. Cheng, C.; Wan, M.; Meng, B.; Zhao, R.; Han, W.P. Size Effect on the Yield Behavior of Metal Foil under Multiaxial Stress States: Experimental Investigation and Modelling. Int. J. Mech. Sci. 2019, 151, 760–771. [Google Scholar] [CrossRef]
  23. Helfenstein, J.; Hollenstein, M.; Mazza, E. Investigation on the Optimal Specimen Design for Planar-Biaxial Materials Testing of Soft Materials. In Constitutive Models for Rubber VI; CRC Press: Boca Raton, FL, USA, 2010; pp. 371–376. [Google Scholar] [CrossRef]
  24. Hanabusa, Y.; Takizawa, H.; Kuwabara, T. Numerical Verification of a Biaxial Tensile Test Method Using a Cruciform Specimen. J. Mater. Process. Technol. 2013, 213, 961–970. [Google Scholar] [CrossRef]
  25. Jin, L.; Fang, Q.; Yan, X.; Hu, Q. Biaxial Tensile Mechanical Properties of HTPB Solid Propellant. Int. J. Aerosp. Eng. 2023, 2023, 2407730. [Google Scholar] [CrossRef]
  26. Luo, Y.-M.; Nguyen, T.T.; Attar, H.; Chevalier, L.; Lesueur, F. A New Biaxial Apparatus for Tensile Tests on Poly Ethylene Terephthalate Optimized Specimen at Stretch Blow Molding Conditions. Polym. Test. 2022, 113, 107676. [Google Scholar] [CrossRef]
  27. Gerke, S.; Adulyasak, P.; Brünig, M. New Biaxially Loaded Specimens for the Analysis of Damage and Fracture in Sheet Metals. Int. J. Solids Struct. 2017, 110–111, 209–218. [Google Scholar] [CrossRef]
  28. Wei, Z.; Harting, M.; Gerke, S.; Brünig, M. Ductile Damage Analysis under Extreme Low-Cycle Biaxial Shear Loadings: Experiments and Simulations. Int. J. Solids Struct. 2025, 313, 113292. [Google Scholar] [CrossRef]
  29. Hou, Y.; Lee, M.-G.; Lin, J.; Min, J. Experimental Characterization and Modeling of Complex Anisotropic Hardening in Quenching and Partitioning (Q&P) Steel Subject to Biaxial Non-Proportional Loadings. Int. J. Plast. 2022, 156, 103347. [Google Scholar] [CrossRef]
  30. Zhao, X.; Berwick, Z.C.; Krieger, J.F.; Chen, H.; Chambers, S.; Kassab, G.S. Novel Design of Cruciform Specimens for Planar Biaxial Testing of Soft Materials. Exp. Mech. 2014, 54, 343–356. [Google Scholar] [CrossRef]
  31. Jalocha, D.; Constantinescu, A.; Nevière, R. Prestrained Biaxial DMA Investigation of Viscoelastic Nonlinearities in Highly Filled Elastomers. Polym. Test. 2015, 42, 37–44. [Google Scholar] [CrossRef]
  32. Seibert, H.; Scheffer, T.; Diebels, S. Biaxial Testing of Elastomers: Experimental Setup, Measurement and Experimental Optimisation of Specimen’s Shape. Tech. Mech. Eur. J. Eng. Mech. 2014, 34, 72–89. [Google Scholar] [CrossRef]
  33. GJB 771.107-93; Test Method for Performance of Propellant Tensile Strength Test of Solid Propellant. COSTIND: Beijing, China, 1993.
  34. Ranjan, R.; Murthy, H.; Bhowmik, D.; Sadavarte, V.S. Behaviour of Composite Solid Propellant under Biaxial Tensile Loading. Polym. Test. 2023, 124, 108054. [Google Scholar] [CrossRef]
  35. Deng, J.-L. Control Problems of Grey Systems. Syst. Control Lett. 1982, 1, 288–294. [Google Scholar] [CrossRef]
  36. Kahraman, H.; Haberstroh, E. Direction-Dependent and Multiaxial Stress-Softening Behavior of Carbon Black–Filled Rubber. Rubber Chem. Technol. 2014, 87, 139–151. [Google Scholar] [CrossRef]
  37. Wang, Q.; Wang, G.; Wang, Z.; Qiang, H.; Wang, X.; Li, S.; Zhu, Z. Biaxial Tensile Test and Meso Damage Numerical Simulation of HTPB Propellant. Sci. Rep. 2022, 12, 17635. [Google Scholar] [CrossRef]
  38. Siddiqui, A.H.; Tiwari, P.; Patil, J.P.; Tewari, A.; Mishra, S. Yield Locus and Texture Evolution of AA7475-T761 Aluminum Alloy under Planar Biaxial Loading: An Experimental and Analytical Study. J. Alloys Compd. 2024, 1000, 175115. [Google Scholar] [CrossRef]
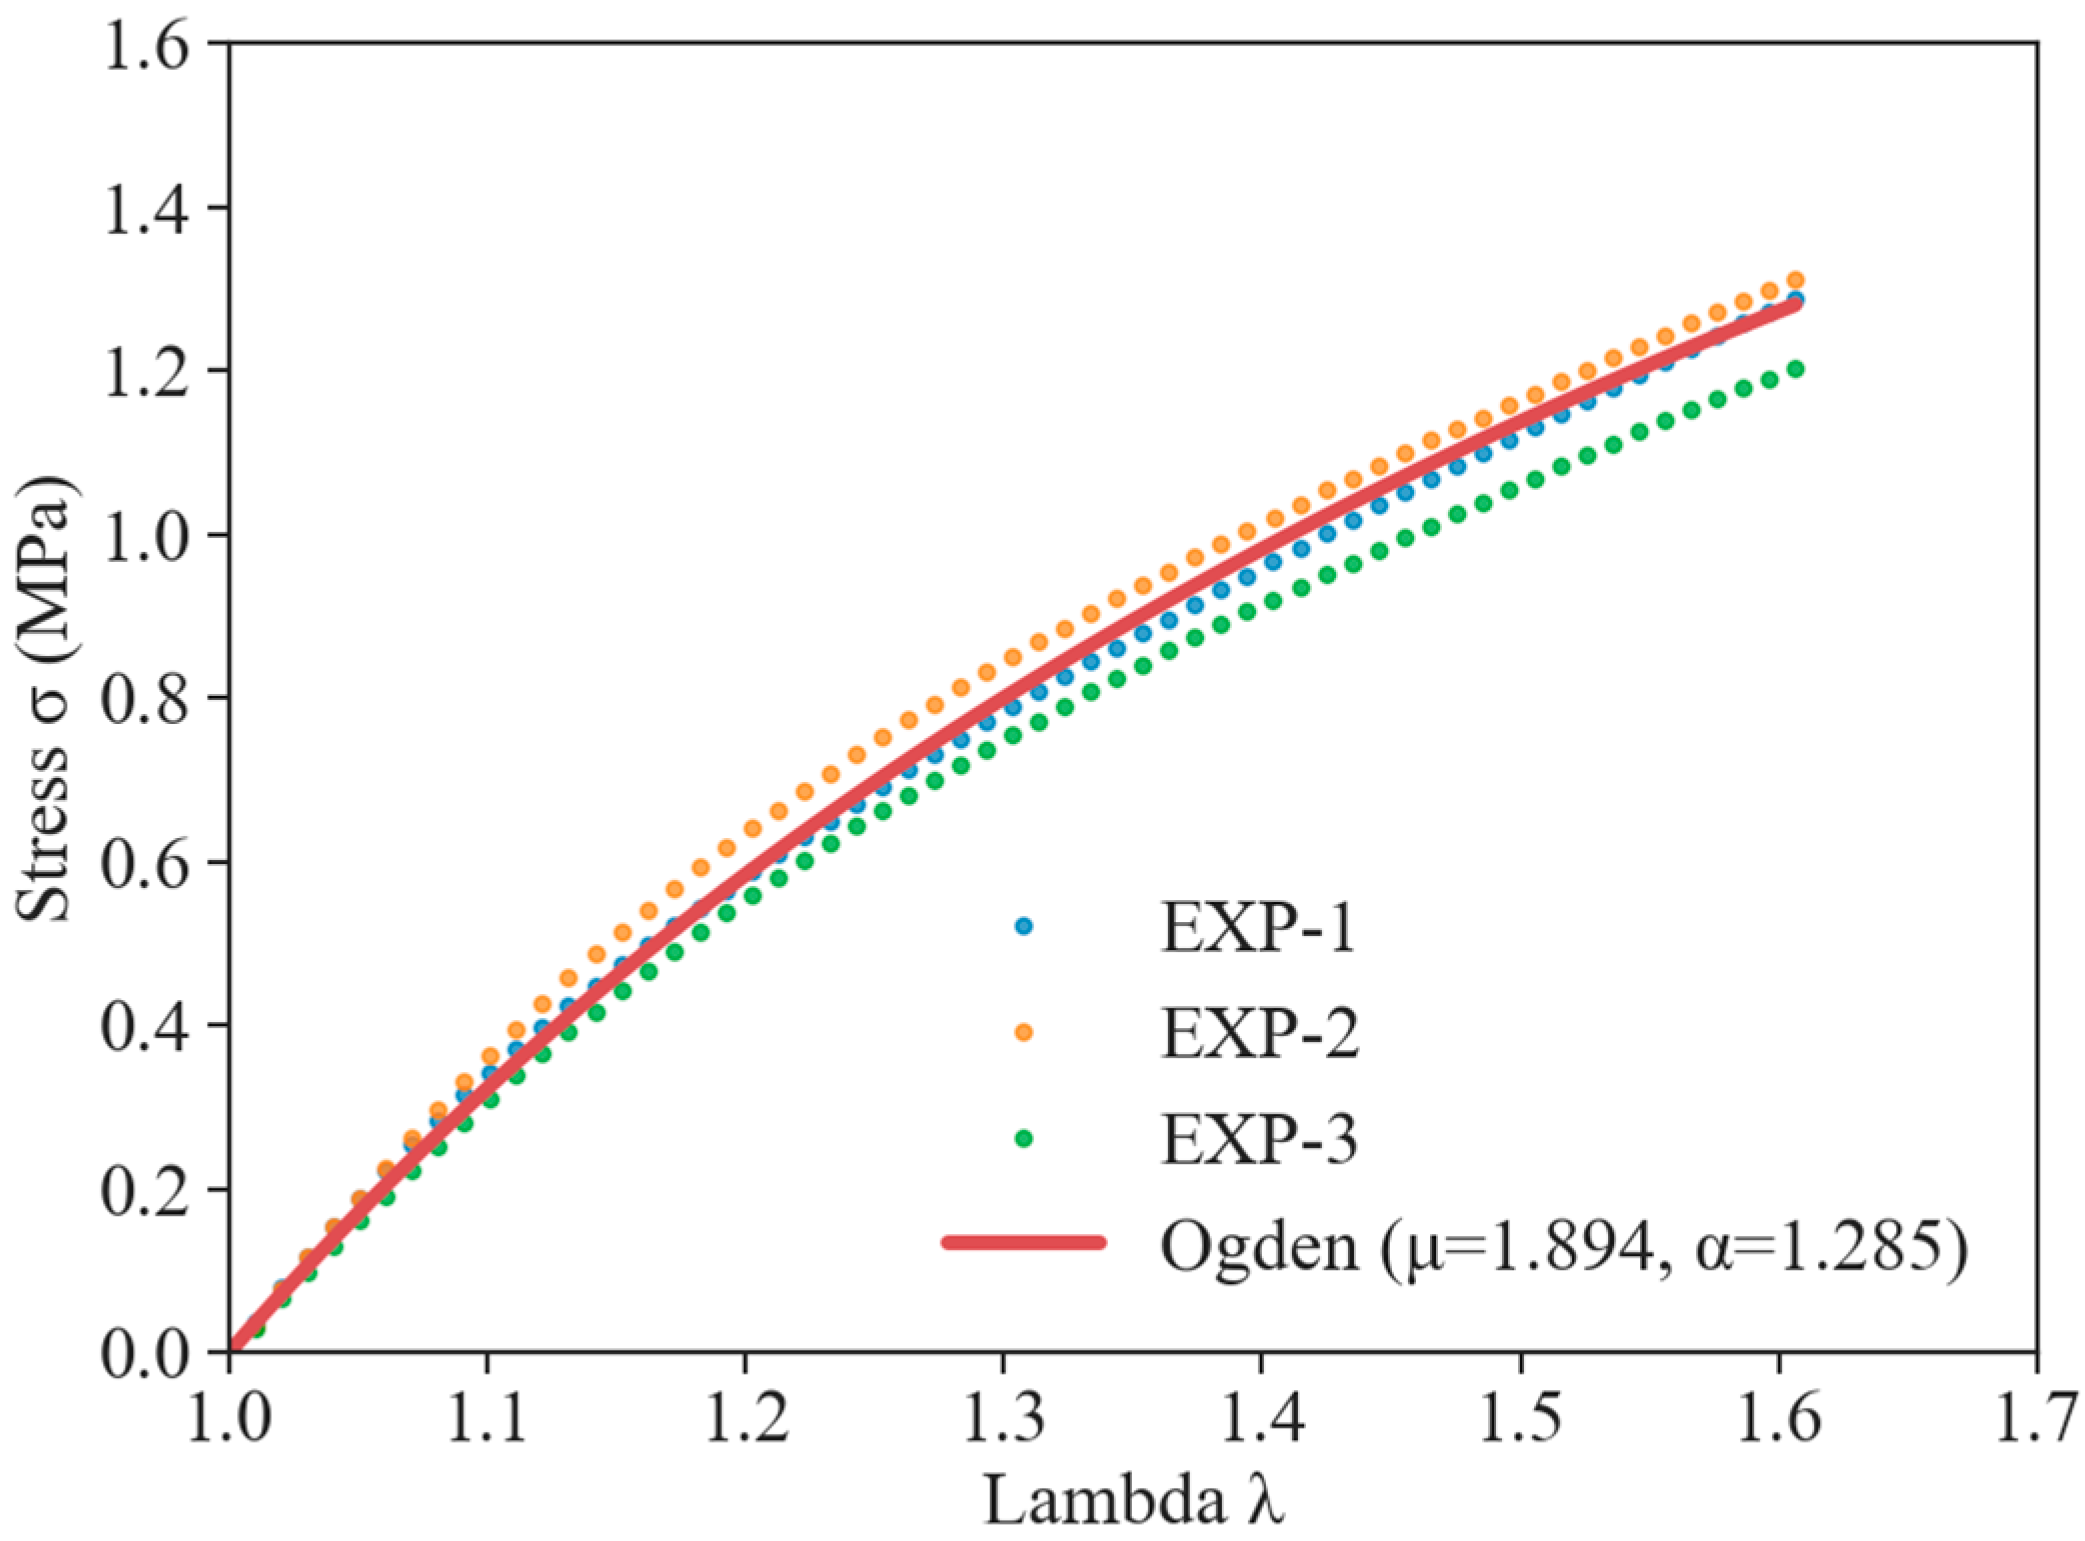
Figure 1. The parameters fitting of Ogden model for material undergoes uniaxial tensile loading.
Aerospace 12 00587 g001
Figure 2. Schematic of dimension parameters for cruciform configuration.
Aerospace 12 00587 g002
Figure 3. (a) The simulation strain results of different mesh sizes from 0.25–1 mm. (b) The diagram of the grid structure.
Aerospace 12 00587 g003
Figure 4. Schematic of the optimization process.
Aerospace 12 00587 g004
Figure 5. Schematic of experimental configuration parameters: (a) Specimen A; (b) Specimen B.
Aerospace 12 00587 g005
Figure 6. The biaxial tensile test with DIC imaging equipment.
Aerospace 12 00587 g006
Figure 7. Diagram of the evolution of max principal strain along the centerline (simulation shown as red dashed line, experiment shown as black dashed line) from the center point to the edge as a function of relative position: (a) Specimen A; (b) Specimen B.
Aerospace 12 00587 g007
Figure 8. Results of GRA for (a) the error coefficient of stress uniformity e σ , (b) the error coefficient of strain uniformity e ε , (c) the load transfer efficiency α .
Aerospace 12 00587 g008
Figure 9. Results of SGSA for (a) the error coefficient of stress uniformity e σ , (b) the error coefficient of strain uniformity e ε , (c) the load transfer efficiency α .
Aerospace 12 00587 g009
Figure 10. Simulation of biaxial tension under different slit numbers N: (ae) Stress distributions; (fj) Strain distribution.
Aerospace 12 00587 g010
Figure 11. Effect of N and Wd for (a) error coefficient of stress uniformity e σ , (b) error coefficient of strain uniformity e ε , and (c) load transfer efficiency α .
Aerospace 12 00587 g011
Figure 12. Simulation of biaxial tension under different slit widths Wd: (ad) Stress distributions; (eh) Strain distributions.
Aerospace 12 00587 g012
Figure 13. Effect of Wd when N = 3 during deformation for (a) error coefficient of stress uniformity e σ , (b) error coefficient of strain uniformity e ε , and (c) load transfer efficiency α .
Aerospace 12 00587 g013
Figure 14. Effect of Wd when N = 4 during deformation for (a) error coefficient of stress uniformity e σ , (b) error coefficient of strain uniformity e ε , and (c) load transfer efficiency α .
Aerospace 12 00587 g014
Figure 15. Effect of N and Wt for (a) error coefficient of stress uniformity e σ , (b) error coefficient of strain uniformity e ε , and (c) load transfer efficiency α .
Aerospace 12 00587 g015
Figure 16. Effect of Wt when N = 3 during deformation for (a) error coefficient of stress uniformity e σ , (b) error coefficient of strain uniformity e ε , and (c) load transfer efficiency α .
Aerospace 12 00587 g016
Figure 17. Effect of Wt when N = 4 during deformation for (a) error coefficient of stress uniformity e σ , (b) error coefficient of strain uniformity e ε , and (c) load transfer efficiency α .
Aerospace 12 00587 g017
Figure 18. Effect of R and Ws during deformation for (a) error coefficient of stress uniformity e σ , (b) error coefficient of strain uniformity e ε , and (c) load transfer efficiency α .
Aerospace 12 00587 g018
Figure 19. Simulation of biaxial tension with different fillet radius R and slit lengths Ws when N = 4: (ad) Stress distributions; (eh) Strain distributions.
Aerospace 12 00587 g019
Figure 20. Effect of different R when N = 3 during deformation for (a) error coefficient of stress uniformity e σ , (b) error coefficient of strain uniformity e ε , and (c) load transfer efficiency α .
Aerospace 12 00587 g020
Figure 21. Effect of different R when N = 4 during deformation for (a) error coefficient of stress uniformity e σ , (b) error coefficient of strain uniformity e ε , and (c) load transfer efficiency α .
Aerospace 12 00587 g021
Figure 22. Diagram showing changes in evaluation indicators of optimized configuration during deformation.
Aerospace 12 00587 g022
Figure 23. Comparison diagram of experiments and simulations of the center line: (a) 1:1 tensile condition; (b) 1:2 tensile condition.
Aerospace 12 00587 g023
Figure 24. Diagram of the evolution of the center line of the specimen under 1:1 tensile condition: (a) Max principal strain; (b) Max principal stress; (c) Stress triaxiality.
Aerospace 12 00587 g024
Figure 25. Diagram of the evolution of the center line of the specimen under 1:2 tensile condition: (a) Max principal strain; (b) Max principal stress; (c) Stress triaxiality.
Aerospace 12 00587 g025
Table 1. Formulation composition of Hydroxyl-Terminated Polybutadiene (HTPB) tri-component composite material.
ComponentAPAlHTPBOther
Content/%60.517202.5
Table 2. Description of symbols and ranges of dimension parameters.
ParametersLBhNRWtWdWsWu
Value range/mm100205∈[1,5]∈[1,20]∈[1,10]∈[1,5]∈[1,20]∈[−2,2]
Table 3. Size parameters of the optimized configuration.
ParametersLBhNRWtWdWsWu
Value range/mm100.020.05.043.02.52.015.00.0
Disclaimer/Publisher’s Note: The statements, opinions and data contained in all publications are solely those of the individual author(s) and contributor(s) and not of MDPI and/or the editor(s). MDPI and/or the editor(s) disclaim responsibility for any injury to people or property resulting from any ideas, methods, instructions or products referred to in the content.