Abstract
Hydrogen-powered aircraft constitute a transformative innovation in aviation, motivated by the imperative for sustainable and environmentally friendly transportation solutions. This paper aims to concentrate on the design of hydrogen powertrains employing a system approach to propose representative design models for distribution and propulsion systems. Initially, the requirements for powertrain design are formalized, and a use-case-driven analysis is conducted to determine the functional and physical architectures. Subsequently, for each component pertinent to preliminary design, an analytical model is proposed for multidisciplinary analysis and optimization for powertrain sizing. A double-wall pipe model, incorporating foam and vacuum multi-layer insulation, was developed. The internal and outer pipes sizing were performed in accordance with standards for hydrogen piping design. Valves sizing is also considered in the present study, following current standards and using data available in the literature. Furthermore, models for booster pumps to compensate pressure drop and high-pressure pumps to elevate pressure at the combustion chamber entrance are proposed. Heat exchanger and evaporator models are also included and connected to a burning hydrogen engine in the sizing process. An optimal liner pipe diameter was identified, which minimizes distribution systems weight. We also expect a reduction in engine length and weight while maintaining equivalent thrust.
Keywords:
concept of operations; evaporator; hydrogen aircraft; H2 burn; heat exchanger; LH2 distribution line; MBSE; MDAO; pump; SysML; valve 1. Introduction
Hydrogen-powered aircraft represent a disruptive innovation within aviation, motivated by the imperative for sustainable and environmentally friendly transportation alternatives. Hydrogen, as a clean and efficient energy carrier, offers significant potential to reduce greenhouse gas emissions. However, hydrogen comes with several challenges due to overpressure, cryogenic temperature, leak or spill, complex handling requirements, and potential physiological hazards [1,2].
In terms of aircraft design, it is necessary to re-evaluate well-established methods, which historically have been based mainly on semi-empirical relationships based on statistics [3,4,5]. Given the novelty of hydrogen technology and their current low maturity, there is limited precise technological data available to develop representation models for the preliminary design of hydrogen systems, which poses challenges to accurate modeling and predictions of aircraft performance.
Looking at the architecture of hydrogen aircraft, significant advances have been achieved in providing an overview of the primary components necessary for hydrogen-powered aircraft [6,7]. In [7], a generic concept was formulated, identifying critical components such as tanks, fuel and venting lines, heat exchangers (HEXs), valves, and the hydrogen-burning engine. It offers a comprehensive high-level review of hydrogen aircraft, proposing an architectural concept and Process Flow Diagrams (PFDs) that lay a more robust foundation for hydrogen aircraft design. It also highlights the fundamental principles required for the certification of hydrogen aircraft. However, despite the fact that this integrated approach elucidates key elements, it does not provide the relevant component design models needed for preliminary aircraft design.
Various models for multidisciplinary analysis and optimization (MDAO) are documented in the literature, including those for tanks [8,9,10], engines [11,12,13], and heat exchangers (HEXs) [12,14,15], while models of the overall hydrogen distribution system (including pipes, valves, and pumps) are scarcely addressed.
In examining component models, operational utilization (dormancy time and fuel for the mission) was considered in [8,9,10] to size the tank capacity with different insulation techniques (foam- and vacuum-insulated multi-layer insulation—MLI).
Regarding fuel system weight estimation, models derived from traditional aircraft can be found in aircraft design books, such as Raymer [3], Torenbeek [4], and Sadraey [5], which are based on semi-empirical relations. In fact, according to [4], the weight of the fuel system depends on the volume of the tank, the number of engines, and the number of fuel tanks. This model continues to be applied in the context of hydrogen aircraft sizing; for example, in [16], the weight of the hydrogen fuel system is estimated by scaling it by a constant factor to perform the preliminary design. It gives a first guess of the weight of the fuel system, but for hydrogen fuel, these models may give deviated results for preliminary aircraft design.
Considering the engine, since the thrust-specific energy fuel consumption (TSEC) for hydrogen and kerosene engines is approximately unchanged [17,18], this property is frequently used in numerous studies to derive specific fuel consumption (SFC) to scale the engine thrust and fuel consumption [10,19]. The TSEC is the engine Thrust Specific Fuel Consumption (TSFC) times the fuel lower heating value (LHV).
Using the TSEC for hydrogen burning can give a first guess for the engine model but may fail to capture impacts from other systems’ integration, such as the heat exchangers systems in the overall engine sizing.
Furthermore, since hydrogen is stored under cryogenic conditions, it will be necessary to transform it into a gas and increase the temperature and pressure. Many studies [11,12,20,21,22] have addressed the impact of heat exchangers on engine performance. The results demonstrate that their integration into the engine cycle generally leads to an improvement in engine performance. For example, in [12,20,21], a reduction in the TSEC is observed as a result of an optimization analysis of the engine cycle while considering the HEX connected to the engine. However, the overall impact of the integration of the HEX and the engine in terms of weight is not evaluated.
Moreover, compared to the kerosene engine, in [23], a reduction in engine weight is found when direct H2 combustion is considered, without an evaluation of heat exchanger weight when integrated into the engine.
For efficient fuel injection, ref. [11] proposed setting the pressure 5 bar above the core flow at the entry of the combustion chamber at a temperature between 150 K and 250 K to increase the fuel flow pressure above the core flow pressure, which is approximately 50 bar for modern engines. Refs. [12,20] suggest initially employing booster and inline pumps to compensate for pressure losses occurring within the pipes, followed by the use of a high-pressure pump to ensure sufficient pressure within the combustion chamber. These studies partially describe the distribution system, although they do not account for losses due to pipe bending and valves.
Therefore, the literature review does not highlight results in identifying the components that will significantly influence the preliminary sizing of the aircraft and evaluating the effects of their integration on the performance of the aircraft.
To address this, a system-level approach is essential, enabling the integration of various disciplines while including safety, operability, and environmental requirements as proposed by the authors in [24]. This holistic approach allows for the development of representative models and supports their integration, while effectively capturing hydrogen characteristics and their design implications for storage, propulsion, distribution, venting, and fire protection systems.
In this paper, we propose to focus on the design of the powertrain following a system approach to develop representative design models for the distribution and thermopropulsion systems. We formalize the requirements for the powertrain and perform use-case-driven analysis to determine the functional and physical architectures. Then, for each component that is relevant at the preliminary design stage, for the purpose of the MDAO, when needed, we developed new models and adapted existing ones from the literature.
This paper is organized as follows. Section 2 describes the methodology followed to determine the physical architecture of the powertrain. Section 3 details the design models for the components considered for preliminary aircraft design. Section 4 presents the results of the powertrain sizing. Section 5 discusses the approach developed in the current paper. Section 6 concludes this paper and outlines future work.
2. Methodology
The primary objective of this study is to perform preliminary aircraft design, which involves several disciplines, including aerodynamics, structure, geometry, performance, and weight [25]. The sizing of hydrogen-powered aircraft requires the incorporation of novel disciplines, notably thermal considerations due to H2 cryogenic storage, and volumetric evaluations, as liquid hydrogen (LH2) is housed in specially designed tanks, generally cylindrical, to mitigate weight penalties. Therefore, the traditional design process proves inadequate due to the unique challenges and constraints of using hydrogen as a fuel. Hence, it is crucial to define the affected systems and their architectures. This process involves evaluating various system configurations, considering how they will interact with each other, as well as identifying key elements that will substantially influence aircraft performance during early evaluation phases. The aircraft-level design and performance parameters to be considered in this preliminary hydrogen aircraft design will be similar to the one existing in the current process, e.g., weight, volume, dimensions, emissions, and engine TSFC. Specific parameters related to hydrogen integration are included in the disciplinary models.
Then, a holistic approach is developed that improves a comprehensive methodology previously proposed by the authors in [24]. The overall methodology proposed in this paper for powertrain sizing is presented in an eXtended Design Structure Matrix (XDSM) format in Figure 1.
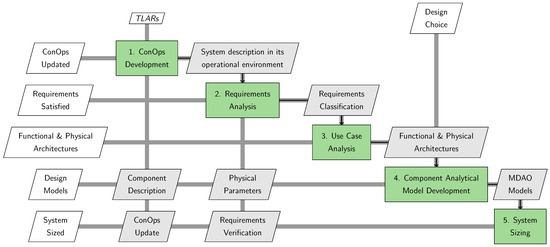
Figure 1.
Systems engineering approach for sizing of LH2 powertrain.
This methodology begins by defining top-level aircraft requirements (TLARs), followed by the development of a Concept of Operations (ConOps) to describe how the aircraft is operated within its environment (block 1 in Figure 1). Subsequently, the ConOps is analyzed to derive the requirements (block 2 in Figure 1). Then, from the output of the requirements analysis, we perform the use-case-driven analysis (block 3 in Figure 1). Later, this allows us to derive functional and physical architectures of the powertrain.
Then, an analytical model is proposed for each component pertinent to the preliminary design of the aircraft, focusing on weight and performance considerations (block 4 in Figure 1). Ultimately, we integrate all the models of components for the sized system, which is the powertrain in this study (block 5 in Figure 1). Given the novel nature of the system, the parameters associated with the components are not initially known. Once the components are identified and the model is developed, it becomes possible to determine new parameters that need to be considered for updating the system requirements through iteration loops existing in the XDSM diagram. Moreover, identifying the components facilitates a more comprehensive description, enabling ConOps updates.
The methodology for developing the full ConOps is described in [26]. In this work, it is limited to powertrain analysis, and hereafter, only its main elements will be discussed. In fact, the main justification for the changes comes from the adoption of LH2 as fuel, which introduces new properties such as cryogenic distribution and hydrogen combustion. Desired changes include storing LH2 in subcooled conditions, distributing it from tanks to engines with H2 combustion, avoiding pump cavitation and backflow, increasing pressure and temperature before the combustion chamber, and compensating for pressure drop throughout LH2 distribution. The operational scenarios considered for sizing encompass sea-level static (SLS), rolling take-off (RTO), top of climb (TOC), and cruise (CRZ) conditions. Safety considerations are central, with components and systems sized to account for hydrogen hazards, with the aim of preventing catastrophic events as defined in the European Union Aviation Safety Agency (EASA) CS-25 regulation for the certification of large airplanes [27]. The system is designed with the capability to stop the fuel flow and safely release trapped fuel in emergency situations. These ConOps elements are analyzed using the SysML modeling language and TTool software (version 1.0) to represent requirements and use case diagrams.
The requirements analysis for the powertrain system, as illustrated in Figure 2 and Figure 3, adheres to the methodology outlined in previous studies by the authors [24].

Figure 2.
Fuel system requirement diagram.

Figure 3.
Thermopropulsion requirement diagram.
The key points from distribution and thermopropulsion systems, characterized by a high level of abstraction, include requirements that have been refined to a lower level of detail, thereby facilitating the identification of components while considering, in the analysis, degraded conditions. These requirements are classified as discussed in [24] for a use case analysis.
Then, a use-case-driven analysis was performed to determine the functional architecture. Based on these functions, we determine the essential components required to perform the identified functions and describe the interrelationships between the actors and the system under study.
To perform the functions identified in the use case diagrams in Figure 4 and Figure 5, we derive components for the powertrain system as shown in Figure 6 and Figure 7.
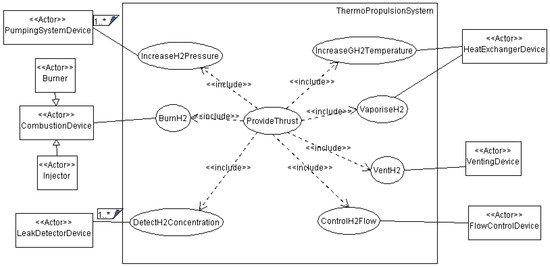
Figure 4.
Thermopropulsion use case diagram. Where 1..* indicates that there is at least one instance of an actor.
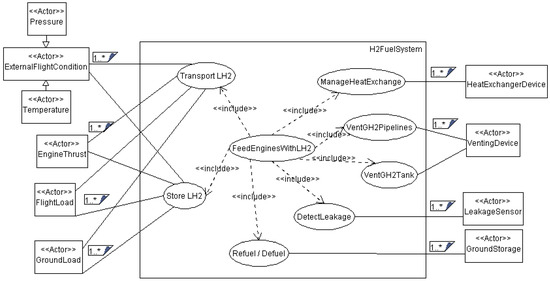
Figure 5.
Fuel system use case diagram. Where 1..* indicates that there is at least one instance of an actor.
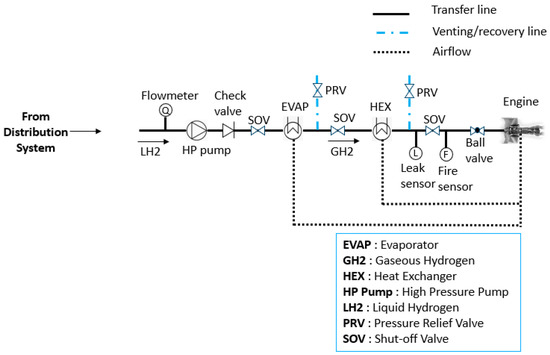
Figure 6.
Thermopropulsion architecture for LH2 aircraft with the arrow indicating the flow direction.
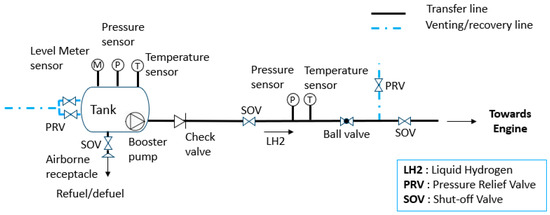
Figure 7.
LH2 distribution system architecture with the arrow indicating the flow direction.
Then, sizing models for the components identified in Figure 6 and Figure 7 are proposed following the methodology in Figure 1 for the MDAO.
In the sizing process, components’ data are initially sought for interpolation when available. If such data are not available, physical equations, empirical relationships from the literature, and standards are used to size the elements identified through system analysis to determine the parameters essential for the preliminary aircraft design.
3. Design Models
In this section, we analyze components of LH2 thermopropulsion and distribution systems. The fuel flow rates necessary for the sizing of heat exchangers, evaporators, pumps, pipes, and valves are evaluated by considering the hydrogen demand of the engine in the four following scenarios: sea-level static (SLS), top of climb (TOC), rolling take-off (RTO), and cruise (CRZ). The XDSM powertrain sizing diagram is presented in Figure 8. The analyses are conducted using the OpenMDAO framework [28].
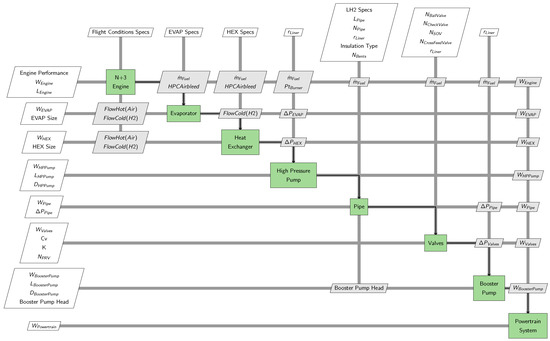
Figure 8.
Powertrain sizing with component coupling in an XDSM graph.
3.1. Thermopropulsion System
This section addresses the chosen engine architecture, as well as the thermopropulsion cycle analysis, the mechanical design of the heat exchangers, and the estimation of the engine’s weight and length.
3.1.1. Engine Architecture
For engine components, the model assumes a consistent design from the inlet to the combustion chamber, ensuring that no modification occurs in components, such as the intake and compressor. Similarly, the design remains unchanged from the turbine to the exhaust, preserving the configuration of these sections. Although not included in this analysis, the main changes may include a redesign of the combustion chamber [18,29,30] that potentially leads to a change in its size due to hydrogen combustion characteristics, including rapid combustion phenomena, elevated wall temperatures, more flame front positioning [31], and considerations of flame stability [32], which will eventually imply a reduction in the engine length. Thus, the estimation of weight and length for an H2 burn engine analogous to a kerosene engine is expected to be conservative.
A pyCycle framework for a thermopropulsion analysis and optimization is considered. It is used in several studies to model various engine architectures and reactants such as JetA and H2 [13,33,34]. It is heavily inspired by NASA’s Numerical Propulsion System Simulation (NPSS) software (version 3.2), a thermodynamic cycle modeling library designed primarily to simulate jet engine performance [35].
In this study, the N+3 engine model in the pyCycle framework is selected, as proposed in [36]. Its aim is to reduce fuel consumption and nitrogen oxides (NOx) emissions using advanced propulsion technologies, improved aerodynamics, sophisticated cooling techniques, and composite materials for thermodynamic analysis, with the objective of increasing the turbine entry temperature (T4). The engine architecture is assumed to be a two-spool, separate flow gas turbine engine. In an effort to improve propulsive efficiency, a gearbox is incorporated to improve fan efficiency [36]. Furthermore, in the N+3 model, a lean burn design is considered, which potentially facilitates significant reductions in NOx emissions. In this study, advanced cooling strategies are also explored, employing cooled air in conjunction with heat exchangers. For this purpose, a combination of evaporator and heat exchanger is used to initially convert LH2 into gaseous hydrogen (GH2) and to elevate the fluid temperature within a range of 150 to 250 K as recommended in [11]. Following this discussion, the components relevant to the thermopropulsion analysis are adapted from [34] as illustrated in Figure 9.
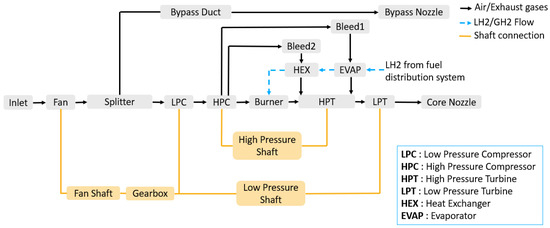
Figure 9.
Engine architecture adapted from [34].
To assess engine performance with the use of a heat exchanger and evaporator, we developed evaporator and heat exchanger elements within the pyCycle framework and connected them to the air bleeds at the high-pressure compressor (HPC) exit and high-pressure turbine (HPT), as shown in Figure 9.
In the following, the heat exchanger and evaporator design, as well as engine weight and length estimation, will be presented.
3.1.2. Heat Exchangers
Compared to alternative plate surface configurations, such as plain rectangular, trapezoidal, or wavy fin designs, offset strip geometry is selected. This preference arises from the formation of a laminar boundary layer on the short strip lengths, which significantly increases both the effective surface area and the heat transfer coefficient as developed in [37].
The thermal and geometric design of the heat exchanger considered in this study can be found in [14,15]. The geometrical and thermal design of the evaporator is similar to that of the heat exchanger except for the convection computation because of the phase change from liquid to gaseous. The entire process to calculate evaporator convection is developed in [15,37].
The weight estimation of the heat exchanger and the equations formulated in this section are obtained from [37]. Figure 10 shows the basic components of the plate-fin heat exchanger with an offset strip fin configuration.

Figure 10.
Basic components of plate-fin HEX geometry with an offset strip fin configuration where the arrows indicate the flows direction adapted from [38].
To compute the weight of the heat exchanger and evaporator, we consider the geometric parameters defined in [14] and determine the thickness of each component presented in Figure 10. The volume is then calculated, and the total weight is computed by multiplying this volume by the density of the material. Stainless steel 304 material is selected as recommended by [39].
At the cold and hot sides, the thickness of the fins, (m), is estimated using Equation (1):
where P (Pa) is the design pressure, is the number of fins per meter on the cold or hot side, and (Pa) is the allowable tensile stress for the fin material at the design temperature.
The thickness of the upper and lower cap is computed according to Equation (2):
with b (m) being the gap between the cap sheet and the first or last parting sheet, (Pa) being the design pressure, and (Pa) being the allowable tensile stress for the cap material at the design temperature.
The thickness of the parting sheets is determined to resist flexural and shear stresses. The thickness from flexural stress, (m), is given in Equation (3):
where and represent the number of fins per meter on the hot and cold sides, respectively.
Then, the minimum thickness, (m), to resist shear stresses is given in Equation (4):
where (Pa) is the maximum allowed shear stress. The maximum value between and is selected as the thickness of the parting sheet.
The minimum thickness of the side bar is given in Equation (5):
where (m) is the gap between sheets and (Pa) is the design pressure.
Finally, the header minimum thickness is calculated using Equation (6):
where P (kgf/m2) is the maximum allowable pressure, R (m) is the header radius, E is the joint efficiency, and S (kgf/m2) is the maximum allowable stress of the material.
Then, from the geometrical parameters in [14], we computed the weight of the fins, caps, parting sheets, side bars, and headers. According to [37], we added 2 kg for the weight of the lagging, nozzles, and brackets to compute the total weight of the heat exchanger and evaporator.
The formation of air frost inside the fins is a significant safety concern for both heat exchangers and evaporators [22]. In the case of heat exchangers, maintaining the temperature at approximately 200 K can effectively prevent ice formation. For evaporators, the implementation of a GH2 recirculation process, as suggested in [22], represents a potential solution. However, this aspect is not addressed in this current study and will be examined in future work.
3.1.3. Engine Weight and Length Estimation
As explained in Section 3.1.1, no modifications are considered to the H2 engine. Its weight and length are estimated using the correlations mentioned in [40]. They are derived from WATE++ simulations (LEW-19687-1), a NASA software for the estimation of the weight of the bare engine, facilitating rapid weight assessment without the extensive computational demands of a more complex model, and well-suited for preliminary design studies. A close agreement of the WATE++ model with various engines is presented in [40] that boosts confidence in its suitability for general estimation of the weight of turbine engines. The correlation formula Equations (7) and (9) are determined from [40] with the bypass ratio (BPR) adjusted between 4 and 50, fan inlet corrected air mass flow varied from 500 to 3000 (lbm/s), and the overall pressure ratio (OPR) ranged from 25 to 60:
where a, b, and c are given in Equation (8):
3.2. Fuel Distribution System
This section describes the architecture of the fuel system and the sizing of the pumps, pipes, and valves, which are essential to perform the functions defined in Figure 4 and Figure 5. The tanks are positioned in the aft fuselage section, and liquid distribution is considered to go from these tanks to a heat exchanger system located near the engine. To maintain adequate pressure throughout the system, booster pumps are installed within the tanks to compensate for pressure drops in the pipes. Safety is a primary concern, addressed through various valve types. Firstly, ball valves and throttle valves for flow regulation; shut-off valves (SOVs) to stop flow when needed; cross-feed valves to transfer the fuel between tanks; check valves for non-return flow; and pressure relief valves (PRVs) to safely vent hydrogen in the case of overpressure.
The layout is visually represented in Figure 11, which includes top and side views of the distribution lines. For clarity, only the distribution line from the aft tank to the engines is presented. Similar distribution lines and components exist from the forward tank to engines, maintaining symmetry. The sizing does not include an in-depth analysis of the architectural design to incorporate distribution lines redundancy. This visual aid serves to illustrate the location of all mentioned components and provides necessary information for computational analysis, such as the length and position of these elements, which are crucial for calculating distribution line parameters.
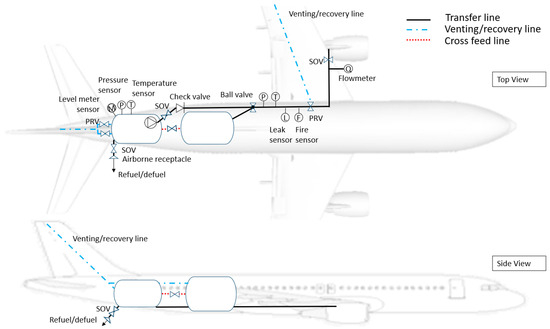
Figure 11.
Fuel system architecture.
In the following, the sizing of the distribution system components will be discussed with the exception of tanks, venting and recovery lines, refuel/defuel systems, and sensors. Tank design has previously been addressed in [8], while venting and recovery lines, refuel/defuel systems, and sensors will be considered in future research.
3.2.1. Pumps
This section addresses the sizing of the booster and high-pressure pumps as presented in Figure 6 and Figure 7. To ensure adequate fuel delivery to the engines, it is necessary to employ pumps that compensate for pressure drops and increase the pressure at the entrance of the combustion chamber while preventing cavitation.
Cavitation is critical in pump design since it can severely impact a pump’s performance, operational lifetime, and safety. Cavitation can occur because of pressure losses or heat leaks since they can bring the flowing liquid to a saturation condition in the presence of two-phase flow (gaseous and liquid flow). When the pressure drops below the liquid vapor pressure, it causes vapor bubbles. These bubbles collapse when they move into an area with higher pressure, leading to a decrease in mass flow rate and a reduction in efficiency. In addition, these vapor bubbles can cause vibration, material erosion, and damage.
Hence, while heat leakage has been accounted for in the pipe sizing discussed later, we propose booster pumps to compensate for the head equivalent to the pressure drop throughout the distribution system to prevent cavitation. These losses mainly result from pipes, connections, valves, and elevation changes as indicated in Equation (11) from [41]:
where denotes the elevation change from the tanks to the high-pressure pump, V is the velocity of LH2 flow, g is the acceleration of gravity, f is the friction coefficient, l is the length of the distribution pipes, d is the diameter of the pipes as calculated in Section 3.2.2, and K is the local losses of the pipes’ bends and valves as calculated in Section 3.2.2 and Section 3.2.3, respectively.. The ∑ notation represents the summation of contributions from individual components. Local losses from connections are not considered in this study, as the design assumes a limited number of connectors. Addressing these losses would require a level of detail that is not yet available at this preliminary stage. The elevation of the tanks is set to zero in this study, which is the most conservative condition for booster pump sizing.
Furthermore, the quantity and configuration of the pumps will be determined based on the discharge requirements for the flight phases considered and the necessary head that must be compensated within the distribution system. In instances where the required head is specified but the discharge is insufficient, similar pumps will be arranged in parallel while sharing identical suction and inlet conditions. In contrast, if the specified discharge meets the requirement, but the head is inadequate, similar pumps will be arranged in series [41]. Hence, the configuration of pumps in parallel and in series will be established to meet the H2 flow demand of the engines, corresponding to maximum discharge and maximum head, respectively. Based on the preceding analysis, we formulate the subsequent system of Equation (12) to determine the number of pumps configured in series and in parallel within the distribution system:
where is the system head expressed as a function of the volumetric flow rate (Q), is the number of pumps configured in series, is the flow rate of the system, is the number of pumps arranged in parallel, and is the available flow rate within the pump.
With respect to heat leakage, the heat flux entering the fluid is not zero and needs to be set to maintain hydrogen in its liquid state at the pump entrance to avoid cavitation. The thermal insulation of the transfer lines is sized in Section 3.2.2 to reduce heat leakage through the pipes.
Estimation of the pump weight is performed using the methodology described in [42]. It involves computing the rotational speed, the radii of the impeller, the weight of the pump casing, the impeller weight, and the turbine weight. The total weight is then adjusted by a factor of 10/9 to accommodate the contributions of fluid seals, studs, bolts, and other related components.
However, the estimation of pump weight is subject to certain limitations as it relies on empirical correlations that originate from rocket engine technology. In addition, extra pipings for pumps connections and associated losses are not considered, and the heat leakage from the pumps is set equal to zero.
3.2.2. Pipes
Double-walled pipes are considered to ensure that fuel is safely distributed with two barriers to minimize the risks of hydrogen leakage and excessive heat leakage. Pipes are assumed to be made of a liner, an insulation layer, and a sleeve or outer pipe that is a protective and structural external layer that acts as a second layer to the liner to prevent hydrogen leaks outside the pipe and provide mechanical protection. Initially, we conducted a structural sizing of the liner and sleeve, followed by an evaluation of the pressure losses, and subsequently carried out a heat transfer analysis to determine the appropriate insulation thickness. Liner and sleeve material are chosen considering hydrogen embrittlement and leakage requirements as proposed in the NASA hydrogen safety handbook [39]. It is assumed that the insulation will not support any structural load and will only serve as a thermal barrier to prevent heat leakage and the possible resulting hydrogen boil-off inside the pipes. In this study, two insulation techniques are considered: foam insulation and vacuum MLI. Taking into account the recommendations from CS25 appendix L [27], a safety factor of 1.5 is applied to the booster pump output pressure [39] and to the external pressure to the pipe to prevent the liner and sleeve from permanent deformation.
To meet temperature limits and hydrogen embrittlement requirements, the thickness of the liner for straight and bent sections of the pipe is determined following the American Society of Mechanical Engineers ASME 31.12 [43] standard for hydrogen piping and pipelines, as suggested in reference [39].
Aluminum alloy Al-6061-T6 is retained as the material for the liner since it is compatible with cryogenic service according to reference [39]. A smooth pipe is also considered to reduce the friction losses. The operational hydrogen pressure is considered equal to the pressure within the tanks (2 bar), as proposed in [44].
The inner diameter of the liner is calculated to ensure that the flow velocity remains between a lower and an upper limit to avoid excessive cooling stresses for the aluminum alloy Al-6061 according to [39], based on the maximum flow rate encountered during a flight mission. The lower and upper bounds interpolated from data in reference [39] are given in Equation (13) and Equation (14), respectively. The exponential fits exhibit an for the lower bound and an for the upper bound:
where (kg/s) is the maximum LH2 flow rate required from the engine, d (cm) is the liner inner diameter, and t (cm) is the liner thickness.
The thickness of the sleeve is sized to prevent buckling using sections II and VIII of the Boiler and Pressure Vessel Code (BPVC) standard [45,46] to derive the minimum thickness under external pressure conditions. The pressure at mean sea level of 1 atm, which is the highest that aircraft would encounter during a flight mission, is considered in this analysis.
The procedure for determining the minimum thickness of components under external or compressive loadings is detailed in ASME Section VIII [46], which is based on the use of a geometric chart in ASME Section II [45] considering the selected material and the working temperature. Calculations are performed iteratively to find the minimum thickness that meets compliance with ASME Section VIII [46]. Although this method is well-established, it can be impractical for MDAO processes, particularly when automated calculations are required. To address this limitation, we propose a slight modification of the traditional approach. Our method involves selecting a representative case that spans the range of typical design scenarios and interpolating data from the charts for that case. We selected and interpolated data from charts in [46] to determine the minimum thickness, with L being the total length of the pipe and the external diameter of the sleeve. This approach allows for a more streamlined integration into computational analysis tools, facilitating a more efficient multidisciplinary analysis while maintaining a reasonable level of accuracy compared to the original chart-based method.
The next step in pipe sizing is the evaluation of the pressure drop in the piping system, since it can influence the sizing of the pump discussed earlier. These losses can occur due to several factors, namely friction losses and local or minor losses.
The friction losses or pressure drop inside a generic pipe can be evaluated using Equation (15) according to [41]:
where l is the pipe length, d is the liner inner diameter, v is the fluid flow velocity inside the pipe, is the fluid density, and f is the friction factor. The latter can be computed using the explicit Haaland’s correlation Equation (16) according to [41]:
with being the Reynolds number, being the material roughness, and d being the liner inner diameter. Furthermore, local or minor losses are mainly due to bending or sudden expansions/contractions of the pipes. We assume a constant pipe diameter; therefore, contractions and expansion losses from pipe diameter variations will require more detailed design elements, which go beyond the scope of this preliminary analysis.
Then, we assume only 90-degree bends in the distribution lines. The loss coefficient K is given in Equation (17) according to [41]:
where R (m) represents the curvature or bending radius, d (m) represents the liner diameter, represents the Reynolds number, and represents a correlation factor equal to .
The minimum thickness is adjusted accounting for bending losses by computing the bending radius in accordance with the ASME 31.12 standard [43] and ensuring that the bending radius is no less than five times the liner outside diameter [39].
The final step is to determine the foam (polyurethane) and vacuum MLI thickness through a heat flux analysis of the fuel pipe. Figure 12 shows the schematic of the fuel pipe from the cold boundary in contact with the cryogenic fluid to the hot boundary, which is at an ambient temperature.
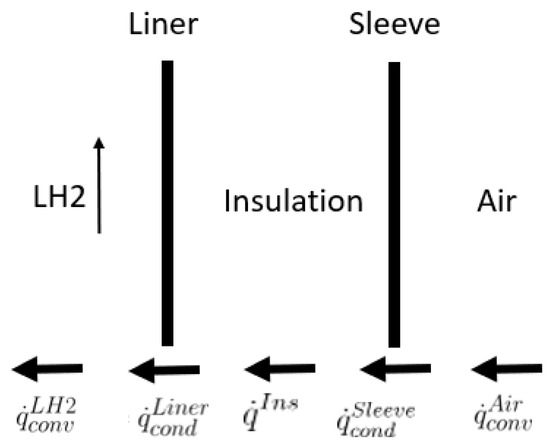
Figure 12.
Schematic representation of heat flux through a generic double-walled pipe.
Under steady-state conditions, LH2 convection, liner conduction, insulation heat flux, sleeve conduction, and air convection should be analyzed to compute equilibrium conditions. Therefore, the heat flux relation at equilibrium can be written as in Equation (18):
where (W/m2) and represent the heat flux from convection of LH2 flow and air, and are the conductivity heat flux of the liner and sleeve, and is the insulation heat flux that can be either foam () or vacuum MLI insulation ().
For foam insulation, only the conductive mode of heat transfer () is taken into account. The heat flux conductivity of the foam, the liner, and the sleeve is as presented in Equation (19) and is retrieved from [47]:
where k (W/m/K) is the thermal conductivity constant, (K) is the temperature difference between the hot and cold boundaries, and (m) and (m) are the inner and outer radii of the element under consideration, respectively. Then, the air convection heat flux is computed using Equation (20):
where (W/m2/K) represents the transfer coefficient of the outside film (air), which is considered constant.
Regarding vacuum MLI insulation, the mechanisms of radiation, conduction, and convection are considered. Several empirical formulations are available in the literature to compute heat flux (), such as McIntosh Layer-by-Layer and modified Lockheed equations [48,49]. In this study, we chose the modified Lockheed Equation (21), which provides more flexibility in material selection according to [49]:
where represents the number of shields; is the layer density (the number of layers/cm); is the material emissivity; P (torr) represents the gas pressure inside the MLI; and (K) are the hot and cold temperatures boundary, respectively; and , , and are semi-empirical constants.
Then, in analyzing the heat flux into the fuel, we considered forced convection for LH2 (in ). The tank temperature, which is equal to the temperature at the pipe inlet, is assumed to be in a subcooled condition (T < 20 K), and finally, Equation (18) is solved to determine the minimum insulation thickness required to have the temperature at the high-pressure pump inlet equal to a maximum of 20 K.
To solve the thermal equilibrium in Equation (18), we need to determine the heat flux within the fluid, .
The energy balance in a pipe section with a length (m) is given in Equation (22) according to [47]:
with (K) being the bulk temperature defined as the ratio of the enthalpy flow rate across a given cross-section to the flow rate of thermal capacity [47], p (m) being the section perimeter, (kg/s) being the LH2 mass flow rate, and (J/kg·K) being the LH2 specific heat capacity at constant pressure.
Equation (22) is valid whether is constant or not [47]. In our case, we assume a constant heat leakage, . The flow temperature from the tank to the pump schematic is depicted in Figure 13.
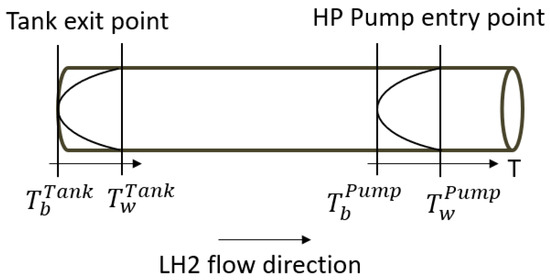
Figure 13.
Thermal behavior of LH2 flow within the pipes with a uniform wall heat flux () adapted from [47].
A constant heat flux was considered, resulting in temperature profiles at the tank exit point and at the high-pressure pump (HP pump) entry point that are similar. However, an increase in both bulk and wall temperatures is observed as the fluid transitions from the tank exit point to the HP pump entry point, attributable to the absorption of the heat flux by the fluid.
Introducing the convective coefficient h (W/m2/K), which is equal to , and integrating Equation (22) from the exit point of the tank to the entry point of the pump, the resulting system of Equations (23) is obtained, which is then solved for :
where (K) is the temperature at the high-pressure pump entrance; (K) is considered equal to the LH2 temperature inside the tank; and r (m) and L (m) are, respectively, the liner inner radius and length (the distance between the tank and the pump). The convective coefficient h is determined using Equation (24):
where represents the Nusselt number, k (W/m/K) represents the fluid conductivity, and d (m) represents the inner diameter of the liner.
Then, the Nusselt number () for fully developed flow in a smooth pipe can be computed using Equation (25) according to [47]:
where f is the friction factor calculated from Equation (15), is the Prandtl number, and is the Reynolds number of LH2 flow.
The total weight is obtained by summing the contributions from each individual component, namely, the liner, the insulation, the fluid within the pipes, and the sleeve.
There are some limitations in these models. Firstly, due to significant cooling of the liner, it undergoes contractions of up to several millimeters per meter during operation [39]. Consequently, consideration of this phenomenon is necessary to mitigate thermal stresses. This aspect has not been incorporated into the model in the present study. Secondly, the model used in this study is derived from applications in space technology, which are characterized by limited cycles of utilization. In contrast, its application in aviation can involve several thousand cycles, and insulation may support structural loads, thus necessitating a correction factor due to fatigue issues that will be evaluated in further studies.
3.2.3. Valves
Procedures for the valves sizing are now considered. The valves should be sized so that they do not choke when in operation to avoid cavitation issues, as discussed earlier for the pump sizing. For instance, cavitation can lead to a choked flow and affect the valve capacity and its function [50].
The procedures for the sizing of the check valve, ball valve, shut-off valve, and cross-feed valve are similar, and the main parameters considered in this study are the flow coefficient (), the loss coefficient (K), and the weight. The procedure for the PRV sizing is different and will be discussed subsequently. The flow coefficient is determined through Equation (26) according to [50]:
where (gal/min) represents the valve flow coefficient, represents a piping geometry function, Q (gal/min) represents the flow rate, represents the specific gravity which is the ratio between fluid density at flowing temperature and water density, and (psi) represents the allowable pressure drop across the valve.
The value of is determined from data available in the literature and depends mainly on the internal diameter of the valve, while is a constant depending on the geometry of the pipe, particularly in scenarios involving the application of reducers or increasers, and is a function of the fluid type; then, can be derived from Equation (26). Finally, the valve loss coefficient (K) is computed using Equation (27):
where denotes liquid density and V denotes the flow velocity.
We established correlations between the weight and the flow coefficient with the internal diameter of the valve using data from the literature. The sizing along with these correlations for the check valve, ball valve, shut-off valve, and cross-feed valve will be discussed in the following.
Regarding check valves, their weight is estimated using Equation (28) from data in reference [51] with a polynomial fit of an :
where (kg) and d (m) represent, respectively, the check valve weight and valve internal diameter.
The check valve flow coefficient (gal/min) as a function of its internal diameter d (m) is given in Equation (29) with a power law fit of an :
The ball valves design principles retained for this study to establish a correlation between the , the weight, and the diameter are described in [51]. They are engineered with equal percentage flow characteristics to provide precise control of the closure element in the first half of the stroke, where maintaining control is more challenging because of the closure element’s susceptibility to process forces. In addition, it improves the capacity in the second half of the stroke, enabling the valve to pass the required flow rate [50].
The ball valve flow coefficient (gal/min) as a function of the valve internal diameter d (m) is given in Equation (30) with a linear fit law of an :
The weight of the ball valve (kg) as a function of its internal diameter d (m) is given in Equation (31) with an :
According to [50], ball valves can act as an on/off valve. Therefore, as SOVs are used for flow stoppage purposes and the operational mechanism of a cross-feed valve is similar to the ball valve, the models to compute their weight and pressure drop are considered the same as the ball valves.
Finally, in terms of PRV sizing, they play a crucial role in controlling and maintaining pressure within piping systems. When the system is operating under normal conditions, there is no pressure drop across the valve because the flow does not pass through it. The PRV remains closed until the pressure of the system reaches its set point, at which point it opens to release excess pressure and prevent system damage. As indicated by [39], direct spring valves or deadweight valves are recommended due to their simplicity and automatic pressure control capabilities.
Although alternative valve types, such as pilot valves, can be used, it is crucial that their design ensures that the main unloading valve opens automatically at the established set pressure. For this study, spring valves are selected for sizing purposes following the recommendations in [39].
Two safety criteria are considered for the PRV sizing. The first criterion is related to the amount of LH2 trapped between two consecutive SOVs, transformed to gas to be evacuated. Equation (32), derived from the data in reference [39], quantifies the amount of liquid that transitions to gas as a function of the length and the inner diameter of the liner for the trapped liquid. The linear fit shows an :
where (m3/s) represents the amount of liquid that turns into gas per second, d (m) is the liner inner diameter, and L (m) is the pipe length. The valve area required to evacuate the vapor or gas in Equation (32) is computed according to the API520 standard [52]. It aims at defining the minimum discharge area for a PRV for critical and subcritical gas/vapor flows. The key differentiator between the critical and subcritical gas/vapor flow is the exit velocity: sonic for critical flow and sub-sonic for subcritical. Critical flow is characterized by choke conditions in the throat. If the pressure downstream of the PRV nozzle is less than or equal to the critical flow pressure, indicative of sonic conditions, the critical flow equation will be utilized; otherwise, the subcritical flow equation in [52] will be considered. In addition, the sizing process includes a maximum relieving pressure of 1.33 times the design pressure according to design recommendations in [39].
The second criterion is related to the need to evacuate the LH2 in circumstances where the pumps are operational yet the flow is obstructed downstream, as might occur with the closure of the SOV. In such instances, the PRV is sized to facilitate the evacuation of liquid flow, and the guidelines outlined in API520 [52] are considered to determine the minimum area required for the PRV.
Regarding the PRV individual weight, it is estimated using a correlation in Equation (33) between the weight of the PRV, (kg), and its diameter d (m) that is derived from data in [53] sized accordingly, as suggested by reference [39]. The polynomial fit shows an :
4. Results
Engine thrust requirements are the main driver for the sizing of the components of the distribution system. Therefore, we will first conduct an evaluative analysis of engine parameters in three distinct scenarios: JetA combustion as the reference case, GH2 combustion without considering phase transition, and GH2 combustion with the phase transition from LH2 to GH2 integrated into the engine, as described in Section 3.1.1. Then, we will present the main results of a design of experiments (DOE) for the H2 fuel distribution system. The DOE drives the identification of key parameters that will be considered to determine the total weight of the fuel distribution system. Then, from those parameters, both MLI and foam insulation options will be evaluated in the analysis.
4.1. Engine Performance
This section presents the findings with respect to engine performance. The flight points considered for the sizing are given in Table 1, with the engine airflow given at TOC and the thrust given for CRZ, RTO, and SLS.

Table 1.
Flight points considered for powertrain sizing.
Figure 14 and Figure 15 present the results of engine parameters computation using models described in Section 3.1.1 for the three scenarios described above.
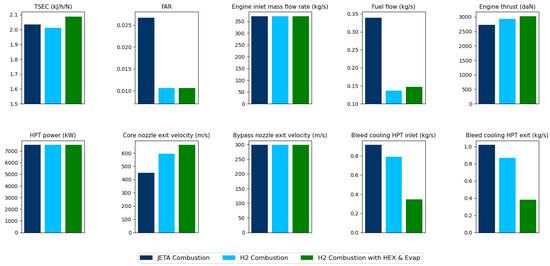
Figure 14.
JetA, H2, and H2 with heat exchanger and evaporator engines performance comparison at TOC.
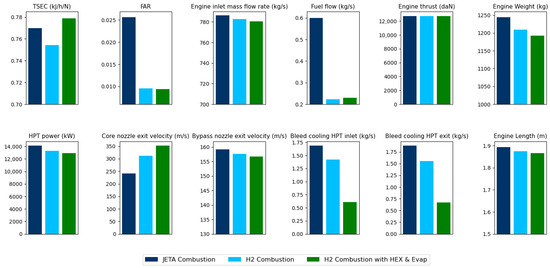
Figure 15.
JetA, H2, and H2 with heat exchanger and evaporator engines performance comparison at SLS (constant thrust).
Figure 14 compares key engine performance parameters assuming a constant inlet air mass flow rate and BPR. A slight increase in the TSEC is observed compared to both JetA combustion and the H2 engine without heat exchangers.
This is mainly attributed to the reduced need for air bleed, as cooler air from the heat exchanger and evaporator is used for turbine blade cooling. Maintaining the same fuel–air ratio (FAR) with less air bleed (bleed 1 and bleed 2 in Figure 9) results in more air passing through the combustion chamber, making more air available for combustion. This increased core airflow allows for higher energy at the turbine inlet at fixed turbine blade temperature. The higher energy, in turn, leads to a higher exit velocity at the nozzle, ultimately resulting in an increase in thrust.
Figure 15 presents a similar analysis with constant thrust. In this case, it can be concluded that a smaller engine may be needed, arising from the two following main reasons. Firstly, H2 has a higher LHV compared to kerosene, which means that less fuel is required for combustion, which in turn leads to a reduction in the FAR. This lower FAR results in less air being needed for combustion, which consequently reduces the amount of air that must be compressed throughout the fan, LPC, and HPC. With less air to compress, the turbines need less power to rotate the LPC and HPC, which reduces the overall power consumption of the fan and compressors.
As a result, this can lead to higher temperatures and pressures at the turbine exit, ultimately allowing for a higher exhaust velocity. Secondly, using the formula for the thrust calculation, since the core nozzle exit temperature is higher, the exit velocity () is higher. For the same thrust (F) and the same free stream speed (), less airflow () entering the engine is needed. Therefore, these factors combined contribute to the possibility of downsizing the engine length and weight for the same thrust. Similar trends are observed for the CRZ and RTO flight points.
In addition, Table 2 gives the weight and TSEC comparison between the three scenarios considered in this study.

Table 2.
Engine weight and TSEC comparison with respect to the case reference JetA combustion.
Although not considered in previous comparisons of bare engines, the integration of the heat exchanger and evaporator, together weighing approximately 75 kg, would result in an estimated 6% increase in the weight of the installed engine when phase change is incorporated into the system. The hypotheses considered for the computation of the thermopropulsion components along with the results are given in Table 3 and Table 4, respectively.

Table 3.
Assumptions for thermopropulsion analysis.

Table 4.
Thermopropulsion analysis ouputs for one engine.
Finally, the results derived from the engine analysis will establish the limits for the range of fuel flow observed at the four selected flight points. These will constitute part of the design variable inputs for the H2 fuel distribution sizing and the DOE analysis.
4.2. DOE Fuel Distribution System
The DOE was carried out with the full factor method level five on the five parameters presented in Table 5 to investigate how the design variable individually influences the pressure drop along the distribution system and the weight of the distribution system and how they interact and influence each other.

Table 5.
Fuel distribution input parameters.
Figure 16 presents the results of the DOE analysis from which several insights can be deduced. Initially, a decrease in the liner inner diameter results in a greater pressure drop and an increase in the total weight of the distribution system because of the additional systems that will be required to compensate for that pressure drop.
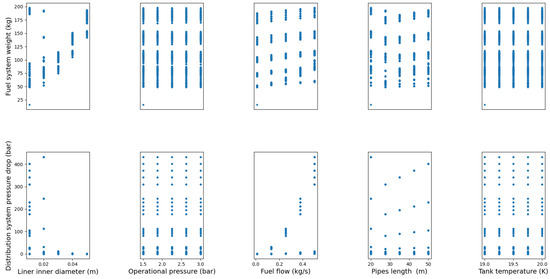
Figure 16.
Results of design of experiment for one line of H2 fuel distribution system.
Additionally, a slight insensitivity to pressure drop is observed as the liner inner diameter increases, suggesting a threshold beyond which further increases in diameter have minimal effect on the pressure drop. For instance, as the inner diameter of the liner increases, the fluid flow through the pipe becomes more efficient, resulting in reduced losses. Consequently, the increase in the distribution system weight is predominantly attributed to the increase in the liner inner diameter. Hence, based on the previous analysis, there exists a specific liner inner diameter that will minimize the total weight of the system.
Furthermore, fuel flow in a smaller liner inner diameter has a considerable impact on both weight and pressure drop. For a fixed liner inner diameter, as the fuel flow increases, the effort for the flow to pass through the pipes is higher, and the pressure drop is higher. We also observe a specific value of the fuel flow that minimizes the total weight of the system.
Then, on the one hand, there is an increase in pressure drop associated with a decrease in pipe length. This phenomenon is predominantly due to the combined effects of reduced radii and an elevated fuel flow rate, which leads to an increase in pressure drop and the overall weight of the distribution system. On the other hand, when the length increases, the increase in pressure drop is primarily attributed to friction losses, which are directly proportional to the length of the distribution lines, consequently leading to an increase in additional systems weight required to mitigate the pressure drop.
Finally, variations in operational pressure and tank temperature, which are equivalent to the temperature at the entrance of the distribution lines, exert minimal influence on both the pressure drop and the weight of the distribution system.
4.3. Fuel Distribution Weight
As discussed in Section 3.2, the results presented in this section refer to one distribution line feeding one engine. The liner inner diameter and fuel flow rate are the focus of this analysis, with all other parameters kept constant. In the first case, a variation in the diameter of the liner is considered with the maximum fuel flow rate of 0.3 kg/s presented in Table 4. The system maintains a fuel pressure of 2 bar, with pipes extending over a length of 30 m and including two 90-degree bends. The number of ball valves and SOVs is derived from Figure 6, Figure 7, and Figure 11. The quantity of check valves is set equal to the number of pumps (booster and HP). The determination of the number of PRVs takes into account discharges of both gas/vapor and liquid phases. The booster pumps are sized to compensate the pressure drop in a single distribution line, as discussed in Section 3.2.1, while delivering the maximum required mass flow rate, as specified in Table 4. Two pumps are considered for redundancy in the weight estimation.
For a smaller liner inner diameter, the pressure drop increases, and consequently, the number and weight of the pumps necessary to compensate for the pressure drop and avoid cavitation at the high-pressure pump inlet also increase. In addition, a value of the diameter of the pipe is observed that minimizes the total weight considering the vacuum MLI or foam insulation techniques, respectively, presented in Figure 17 and Figure 18.
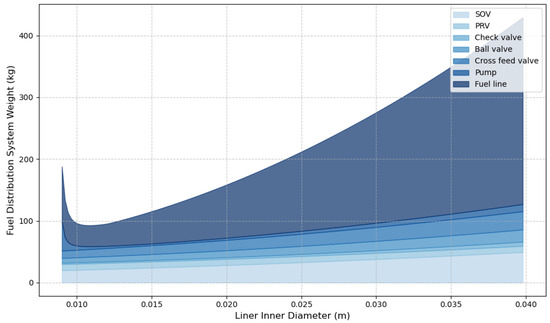
Figure 17.
Fuel distribution weight as a function of the liner inner diameter with MLI for one distribution line.
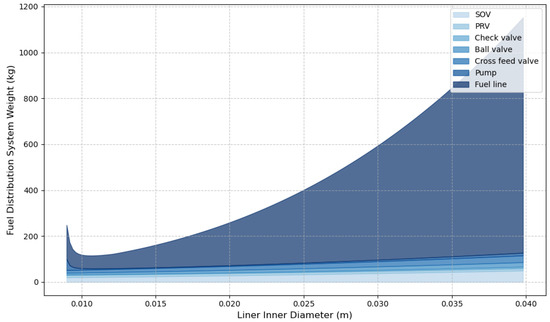
Figure 18.
Fuel distribution weight as a function of the liner inner diameter with foam insulation for one distribution line.
With foam or MLI vacuum insulation, an increase in the liner inner diameter results in an increase in the diameter of the sleeve and requires an increase in thickness to mitigate buckling, thus increasing the total weight of the distribution lines. Then, examining the weight of the distribution system reveals the influence of fuel flow while maintaining constancy in all other design variables, as illustrated in Figure 19 and Figure 20 for MLI and foam insulation, respectively, at optimal liner inner diameter.
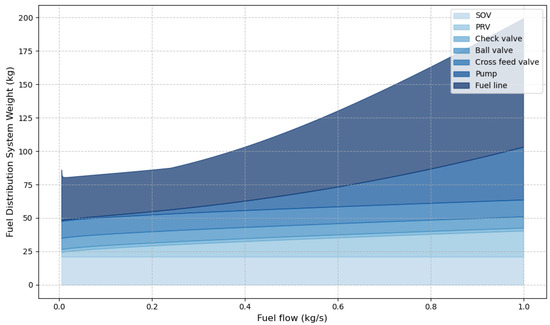
Figure 19.
Fuel distribution weight as a function of the fuel flow rate with MLI for one distribution line.
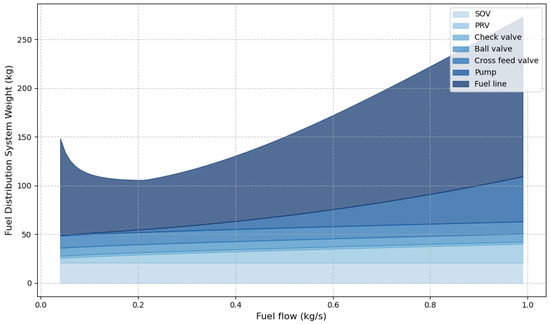
Figure 20.
Fuel distribution weight as a function of the fuel flow rate with foam insulation for one distribution line.
Considering foam insulation in Figure 20, maintaining the fluid in a subcooled state at lower fuel flow rates requires a significant insulation thickness, consequently increasing the overall weight of the pipe. In contrast, as the fuel flow rate increases, a reduced insulation thickness suffices, thus leading to a potential reduction in the total weight of the pipe. Additionally, increasing the fuel flow rate results in a higher flow velocity, which in turn increases the pressure drop and requires heavier pumps with elevated pressure output to counterbalance the pressure loss. The required thickness of the liner will then increase to sustain the pressure head, as shown in Figure 8. Hence, there exists an optimal fuel flow rate that minimizes the total weight of the distribution system. A similar but less pronounced phenomenon is observed with MLI in Figure 19, as its insulation thickness and weight are negligible compared to the weight of the liner and sleeve. The vacuum MLI insulation technique demonstrates better weight and thermal performances when compared to foam insulation, with less thickness required when the mass flow rate decreases.
The mass flow rate significantly impacts the sizing of the distribution system components. At a low value, it affects mainly the sizing of the insulation, and at a high value, it drives the sizing of the liner thickness, the pumps, and the valves. Furthermore, from Figure 19 and Figure 20, in the range of mass flow rates presented in Table 4, there is no significant difference in terms of the pipe’s weight. Therefore, the maximum value of 0.3 kg/s is selected for the sizing of the distribution system components.
This study then examines two sizing options: firstly, determining the optimal sizing through model consideration, and secondly, constrained sizing based on one specific pump with characteristics documented in the existing literature.
The assumptions considered for the sizing of the fuel distribution system along with the results at the optimal diameter are given in Table 6 and Table 7, respectively.

Table 6.
Assumptions for fuel distribution system sizing at optimal liner inner diameter.

Table 7.
Distribution system components weight at the optimal liner inner diameter for one distribution line.
Pressure losses along the distribution line at an optimal liner inner diameter are significantly elevated. This elevation in pressure loss is approximately 60 bar, leading to a corresponding increase in pressure at the booster pump output. As a result, it becomes necessary to increase the thickness of the liner inner pipe, which consequently increases the total weight of the distribution line. Furthermore, the existing literature does not provide sufficient data to validate the maturity level of this type of pump.
An alternative approach is to constrain the distribution system design and to select an existing pump from the literature. This approach establishes the maximum pressure drop by defining it according to the pump characteristics. The Subtran 45-2/50 was selected because it provides the required discharge for the flight points considered [54]. The assumptions for this sizing option are outlined in Table 8, and the results are given in Table 9. Establishing the head of the booster pump is equivalent to defining the maximum pressure drop of the distribution line, which consequently dictates the liner inner diameter. According to the assumptions presented in Table 9, a larger diameter is required; however, this option results in supplementary penalties related to weight, as shown in Table 9.

Table 8.
Assumptions for fuel distribution system sizing for constrained design.

Table 9.
Results of the fuel distribution system sizing for constrained design for one distribution line.
Finally, an alternative solution to mitigate the pressure drop and further decrease the total weight of the distribution system is to deploy multiple pumps in series along the distribution line, as referenced in Section 3.2.1. However, implementing this solution requires a comprehensive architectural layout indicating the positions of valves and bends, which is beyond the scope of this preliminary analysis.
5. Discussion
Regarding engine performance, we observed an increase in thrust when heat exchangers are connected considering the same engine size or a reduction in engine weight while maintaining the same thrust compared to a kerosene-fueled engine. For overall aircraft sizing, in the first case, the same engine allows for reduced power settings requirements, thus decreasing the fuel required for a given mission, impacting the direct operating cost (DOC) and maximum take-off weight (MTOW). For the second case, a reduction in the engine size is achievable that will affect the operating empty weight (OWE) and the MTOW. Therefore, these two options, along with the integration of the distribution system models developed in this study, and their impact in terms of safety and operability at the aircraft level, must be fully evaluated through overall aircraft design processes.
One of the main parameters that influences the sizing of the distribution system is the fuel flow rate, as discussed earlier in Section 4. The distribution system should ensure an adequate fuel supply across all flight points while keeping the hydrogen in cryogenic condition. Pumps, valves, pipes, the heat exchanger, and the evaporator are sized with respect to the maximum flow encountered. At a low fuel mass flow rate, the pipe weight can increase quickly due to the insulation thickness required to prevent boil-off and avoid cavitation at the pump’s inlet. For a broader analysis, it is necessary to account for the higher tank temperature at the mission end, which would bring LH2 near saturation conditions, and the reduced fuel flow rates at other flight mission points, such as landing or taxiing. A sensitivity analysis of the fuel mass flow rate effect on the distribution system sizing will be explored in a subsequent study.
Regarding pipes, although they are not included in the scope of this study, stiffeners between the liner and the sleeve are crucial to preserving the structural integrity of pipes, preventing the collapse of external pipes under vacuum or external pressure conditions while withstanding thermal cycling and mechanical vibration. Consequently, a more detailed analysis needs to be performed on this aspect to improve the weight model for pipes.
In addition, we considered SOVs with characteristics similar to those of a ball valve, since the latter can function as an on–off valve. However, given that the main purpose of shut-off valves is to facilitate on–off control, a quick opening and closing characteristic would be more appropriate, as mentioned in [50], and would require an improvement in the proposed SOV weight model. Furthermore, sizing PRVs for subcooled liquid and saturated vapor in a two-phase flow is a more realistic scenario encountered during aircraft operation, but it is not included in this analysis because certain data, such as the fraction of vapor mass (quality) at the PRV inlet, may not be available at this stage of the design process [52].
Finally, in terms of methodology, the main challenge was to establish the right abstraction level and find components relevant to MDAO. But once components are determined, we obtain a certain modularity from component models which can permit us to evaluate several architectures. In this study, components are sized from performance analysis, and their numbers were determined considering basic levels of independence for engine fuel supply while excluding considerations for redundancies within the feed line. An exhaustive safety assessment of this architecture is not considered at this preliminary design stage and may lead to an increase in the number of required components, consequently affecting the overall weight. The safety assessment of hydrogen system integration will include fire prevention and protection, leak management, regular and independent H2 supply, and the ventilation of some critical areas to be defined.
6. Conclusions
This paper presents a methodology for the sizing of LH2 fuel distribution and thermopropulsion systems adapted to preliminary aircraft design purposes. We perform a system analysis with a holistic approach to determine the functional and physical architecture of a hydrogen-powered aircraft powertrain. This involved initially defining key elements for a ConOps and subsequently employing the SysML analysis tool, incorporating safety and operability requirements. For each component identified in the physical architecture as relevant to the preliminary design of the aircraft, we developed analytical models to perform an MDAO. The elements examined in this study include the engine, heat exchanger, evaporator, booster and high-pressure pumps, pipes, and valves. With respect to the engine, it was observed that when heat exchangers are integrated, there is either an increase in thrust considering the same air inlet (the engine size) or a reduction in engine weight for an equivalent thrust compared to a kerosene-fueled aircraft. These two alternatives will be assessed in future work through complementing the Future Aircraft Sizing Tool—Overall Aircraft Design (FAST-OAD) in-house open source framework [25] with models dedicated to LH2 distribution and combustion developed in this study.
Then, we observed that the weight of a double-walled pipe with foam insulation can become significantly prohibitive as the liner inner diameter increases and at reduced fuel flow. At reduced liner radii, the number of pumps necessary to mitigate pressure loss and avoid cavitation increases, consequently increasing their overall weight.
Finally, future works include the evaluation of alternative architectures taking advantage of the modularity of the component models to perform automatic safety assessments through a Model-Based Safety Assessment (MBSA) methodology.
Author Contributions
Conceptualization, A.S.; methodology, A.S., J.J. and P.d.S.-S.; validation, J.J. and P.d.S.-S.; formal analysis, A.S., J.J. and P.d.S.-S.; investigation, A.S., J.J. and P.d.S.-S.; writing—original draft preparation, A.S.; writing—review and editing, A.S., J.J. and P.d.S.-S.; supervision, J.J. and P.d.S.-S.; project administration, J.J. and P.d.S.-S.; funding acquisition, J.J. All authors have read and agreed to the published version of the manuscript.
Funding
The presented work is supported by DAHER through the research chair ISAAR “Innovative Solutions for Aviation Architecture & Regulation”.
Data Availability Statement
Data may be available from the corresponding author upon reasonable request and with appropriate approvals.
Conflicts of Interest
The authors declare no conflicts of interest. The funders had no role in the design of the study; in the collection, analyses, or interpretation of data; in the writing of the manuscript; or in the decision to publish the results.
Correction Statement
This article has been republished with a minor correction to the correspondence contact information. This change does not affect the scientific content of the article.
Abbreviations
The following abbreviations are used in this manuscript:
| API | American Petroleum Institute |
| ASME | American Society of Mechanical Engineers |
| BPR | Bypass ratio |
| BPVC | Boiler and Pressure Vessel Code |
| ConOPS | Three-letter acronym |
| CRZ | Cruise |
| CS | Certification Specification |
| DOC | Direct operating cost |
| DOE | Design of experiment |
| EVAP | Evaporator |
| FAR | Fuel–air ratio |
| FAST-OAD | Future Aircraft Sizing Tool—Overall Aircraft Design |
| GH2 | Gaseous hydrogen |
| HEX | Heat exchanger |
| HPC | High-pressure compressor |
| HPT | High-pressure turbine |
| LH2 | Liquid hydrogen |
| LHV | Lower heating value |
| LPC | Low-pressure compressor |
| LPT | Low-pressure turbine |
| MBSA | Model-Based Safety Assessment |
| MDAO | Multidisciplinary analysis and optimization |
| MLI | Multi-layer insulation |
| MTOW | Maximum take-off weight |
| NASA | National Aeronautics and Space Administration |
| NPSS | Numerical Propulsion System Simulation |
| NOx | Nitrogen oxide |
| OP | Operational pressure |
| OPR | Overall pressure ratio |
| OWE | Operating empty weight |
| PFDs | Process Flow Diagrams |
| PRV | Pressure relief valve |
| RTO | Rolling take-off |
| SFC | Specific fuel consumption |
| SLS | Sea-level static |
| SOV | Shut-off valve |
| TLARs | Top-level aircraft requirements |
| TOC | Top of climb |
| TSFC | Thrust Specific Fuel Consumption |
| TSEC | Thrust-specific energy fuel consumption |
| UCD | Use Case Diagram |
| WATE ++ | Weight Analysis of Gas Turbine Engines |
| XDSM | eXtended Design Structure Matrix |
References
- Benson, C.; Holborn, P.G.; Rolt, A.; Ingram, J.; Alexander, E. Combined Hazard Analyses to Explore the Impact of Liquid Hydrogen Fuel on the Civil Aviation Industry. In Proceedings of the of ASME Turbo Expo 2020 Turbomachinery Technical Conference and Exposition, London, UK, 22–26 June 2020. [Google Scholar] [CrossRef]
- Jézégou, J.; Almeida-Marino, A.M.; O’Sullivan, G.; Carrasco, B.J.; André, R.; Gourinat, Y. Certification Gap Analysis for Normal-Category and Large Hydrogen-Powered Airplanes. Aerospace 2025, 12, 239. [Google Scholar] [CrossRef]
- Raymer, D.P. Aircraft Design: A Conceptual Approach, 6th ed.; AIAA Education Series; American Institute of Aeronautics and Astronautics, Inc.: Reston, VA, USA, 2018. [Google Scholar]
- Torenbeek, E. Synthesis of Subsonic Airplane Design; Delft University Press: Delft, The Netherlands; Martinus Nijhoff Publishers: Leiden, The Netherlands, 1982. [Google Scholar]
- Sadraey, M.H. Aircraft Design: A Systems Engineering Approach; Aerospace Series; Wiley: Chichester, UK, 2013. [Google Scholar]
- Brewer, G.D. Hydrogen Aircraft Technology; Routledge: London, UK, 1991. [Google Scholar] [CrossRef]
- O’Sullivan, G.; Horvat, A.B.; Jézégou, J.; Carrasco, B.J.; André, R. Hydrogen Aircraft, Technologies and Operations Towards Certification Readiness Level 1. Aerospace 2025, 12, 490. [Google Scholar] [CrossRef]
- Parello, R.; Defoort, S.; Benard, E.; Gourinat, Y. Design and Integration of a Liquid Hydrogen Tank on an Aircraft. In Proceedings of the AIAA SCITECH 2024 Forum, Orlando, FL, USA, 8–12 January 2024. [Google Scholar] [CrossRef]
- Mantzaroudis, V.K.; Theotokoglou, E.E. Computational Analysis of Liquid Hydrogen Storage Tanks for Aircraft Applications. Materials 2023, 16, 2245. [Google Scholar] [CrossRef] [PubMed]
- Verstraete, D. The Potential of Liquid Hydrogen for Long Range Aircraft Propulsion. Ph.D. Thesis, Cranfield University, Bedford, UK, 2009. [Google Scholar]
- Görtz, A.; Silberhorn, D. Thermodynamic Potential of Turbofan Engines with Direct Combustion of Hydrogen. In Proceedings of the ICAS—International Council of the Aeronautical Sciences, Stockholm, Sweden, 4–9 September 2022. [Google Scholar]
- Patrao, A.C.; Jonsson, I.; Xisto, C.; Lundbladh, A.; Grönstedt, T. Compact Heat Exchangers for Hydrogen-fueled Aero Engine Intercooling and Recuperation. Appl. Therm. Eng. 2024, 243, 122538. [Google Scholar] [CrossRef]
- Atma, P.; Lamkin, A.; Martins, J. Comparing Hydrogen and Jet-A for an N+3 Turbofan with Water Recirculation using Gradient-Based Optimization. In Proceedings of the AIAA Aviation Forum, San Diego, CA, USA, 12–16 June 2023. [Google Scholar] [CrossRef]
- Brelje, B.J.; Martins, J.R. Development of a Conceptual Design Model for Aircraft Electric Propulsion with Efficient Gradients. In Proceedings of the 2018 AIAA/IEEE Electric Aircraft Technologies Symposium, Cincinnati, OH, USA, 12–14 July 2018; AIAA Propulsion and Energy Forum. American Institute of Aeronautics and Astronautics: Reston, VA, USA, 2018. [Google Scholar] [CrossRef]
- Habrard, V.; Hazuk, I.; Pommier-Budinger, V.; Jézégou, J.; Benard, E. Liquid Cooling Thermal Management System Modelling for Preliminary Design of Hybrid Fuel Cell Aircraft. In Proceedings of the AIAA AVIATION 2023 Forum, San Diego, CA, USA, 12–16 June 2023. [Google Scholar]
- Onorato, G.; Proesmans, P.; Hoogreef, M.F.M. Assessment of Hydrogen Transport aircraft: Effects of Fuel Tank Integration. CEAS Aeronaut. J. 2022, 13, 813–845. [Google Scholar] [CrossRef] [PubMed]
- Adler, E.; Martins, J. Hydrogen-Powered Aircraft: Fundamental Concepts, Key Technologies, and Environmental Impacts. Prog. Aerosp. Sci. 2023, 13, 813–845. [Google Scholar] [CrossRef]
- Maniaci, D. Relative Performance of a Liquid Hydrogen-Fueled Commercial Transport. In Proceedings of the 46th AIAA Aerospace Sciences Meeting and Exhibit; Aerospace Sciences Meetings, Reno, Nevada, 7–10 January 2008; American Institute of Aeronautics and Astronautics: Reston, VA, USA, 2008. [Google Scholar] [CrossRef]
- Mukhopadhaya, J. Performance Analysis of Evolutionary Hydrogen-Powered Aircraft; Technical Report; International Council on Clean Transportation: Washington, DC, USA, 2022. [Google Scholar] [CrossRef]
- Abedi, H.; Xisto, C.; Jonsson, I.; Grönstedt, T.; Rolt, A. Preliminary Analysis of Compression System Integrated Heat Management Concepts Using LH2-Based Parametric Gas Turbine Model. Aerospace 2022, 9, 216. [Google Scholar] [CrossRef]
- Jakubowski, R.; Bednarz, A.; Rogalski, L. Study of the Effects of Heat Exchanger Location on Turbofan Engine Performance. Adv. Sci. Technol. Res. J. 2024, 18, 355–368. [Google Scholar] [CrossRef] [PubMed]
- Gomez-Vega, N.; Prakash Prashanth, R.L.S.; Allroggen, F. Hydrogen Aircraft Design with Heat-Exchanger-Enhanced Turbofan Engines. In Proceedings of the AIAA SCITECH 2025 Forum, Orlando, FL, USA, 6–10 January 2025; American Institute of Aeronautics and Astronautics: Reston, VA, USA, 2025. [Google Scholar] [CrossRef]
- Jagtap, S.S.; Childs, P.R.N.; Stettler, M.E.J. Conceptual Design-Optimisation of a Future Hydrogen-powered Ultrahigh Bypass Ratio Geared Turbofan Engine. Int. J. Hydrog. Energy 2024, 95, 317–328. [Google Scholar] [CrossRef]
- Sarr, A.; Jézégou, J.; de Saqui-Sannes, P. Model-Based Approach for Hydrogen Preliminary Aircraft Design Considering Safety and Operability. In Proceedings of the ICAS 2024, 34th Congress of the International Council of the Aeronautical Sciences, Florence, Italy, 9–13 September 2024. [Google Scholar]
- David, C.; Delbecq, S.; Defoort, S.; Schmollgruber, P.; Benard, E.; Pommier-Budinger, V. From FAST to FAST-OAD: An Open Source Framework for Rapid Overall Aircraft Design. IOP Conf. Ser. Mater. Sci. Eng. 2021, 1024, 012062. [Google Scholar] [CrossRef]
- IEEE Guide for Information Technology—System Definition—Concept of Operations (ConOps) Document; IEEE: New York, NY, USA, 1998; ISBN 9780738114071. [CrossRef]
- European Union Aviation Safety Agency (EASA). Easy Access Rules for Large Aeroplanes (CS25) 2023. Available online: https://www.easa.europa.eu/en/downloads/136694/en (accessed on 19 October 2023).
- Gray, J.S.; Hwang, J.T.; Martins, J.R.R.A.; Moore, K.T.; Naylor, B.A. OpenMDAO: An Open-Source Framework for Multidisciplinary Design, Analysis, and Optimization. Struct. Multidiscip. Optim. 2019, 59, 1075–1104. [Google Scholar] [CrossRef]
- Haglind, F.; Singh, R. Design of Aero Gas Turbines Using Hydrogen. J. Eng. Gas Turbines Power 2004, 128, 754–764. [Google Scholar] [CrossRef]
- Brand, J.; Sampath, S.; Shum, F.; Bayt, R.; Cohen, J. Potential Use of Hydrogen In Air Propulsion. In Proceedings of the AIAA International Air and Space Symposium and Exposition: The Next 100 Years, Dayton, Ohio, 14–17 July 2003; International Air and Space Symposium (Evolution of Flight). American Institute of Aeronautics and Astronautics: Reston, VA, USA, 2003. [Google Scholar] [CrossRef]
- Sampath, P.; Shum, F. Combustion Performance of Hydrogen in a Small Gas Turbine Combustor. Int. J. Hydrogen Energy 1985, 10, 829–837. [Google Scholar] [CrossRef]
- Abdelhafez, A.; Abdelhalim, A.; Abdulrahman, G.A.; Haque, M.A.; Habib, M.A.; Nemitallah, M.A. Stability, near Flashback Combustion Dynamics, and NOx Emissions of H2/N2/air Flames in a Micromixer-based Model Gas Turbine Combustor. Int. J. Hydrogen Energy 2024, 61, 102–112. [Google Scholar] [CrossRef]
- Hendricks, E.S.; Gray, J.S. pyCycle: A Tool for Efficient Optimization of Gas Turbine Engine Cycles. Aerospace 2019, 6, 87. [Google Scholar] [CrossRef]
- Gray, J.; Chin, J.; Hearn, T.; Hendricks, E.; Lavelle, T. Thermodynamics of Gas Turbine Cycles with Analytic Derivatives in OpenMDAO. In Proceedings of the 57th AIAA/ASCE/AHS/ASC Structures, Structural Dynamics, and Materials Conference, San Diego, CA, USA, 4–8 January 2016; American Institute of Aeronautics and Astronautics: Reston, VA, USA, 2016. [Google Scholar] [CrossRef]
- Quibén Figueroa, R.; Cavallaro, R.; Cini, A.; Soler Arnedo, M. MOTIVATION (Mdao fOr susTaInable aViATION)-Framework Development for the Design and Optimization of H2 Powered Aircraft. In Proceedings of the AIAA AVIATION 2023 Forum, San Diego, CA, USA, 12–16 June 2023; p. 4151. [Google Scholar] [CrossRef]
- Jones, S.M.; Haller, W.J.; Tong, M.T.H. An N+3 Technology Level Reference Propulsion System; Technical Report E-19373; NASA Glenn Research Center: Cleveland, OH, USA, 2017. [Google Scholar]
- Ranganayakulu, C.; Seetharamu, K.N. Compact Heat Exchangers—Analysis, Design and Optimisation Using FEM and CFD Approach; ASME Press: New York, NY, USA; John Wiley & Sons Ltd.: Hoboken, NJ, USA, 2018. [Google Scholar] [CrossRef]
- Ali, H.M.; Hassan, A.; Wahab, A. Nanofluids for Heat Exchangers; Springer: Singapore, 2022. [Google Scholar] [CrossRef]
- Guide To Safety Of Hydrogen And Hydrogen Systems, ANSI/AIAA G-095A-2017; American National Standard Guide; American Institute of Aeronautics and Astronautics: Reston, VA, USA, 2017. [CrossRef]
- Greitzer, E.M.; Bonnefoy, P.A.; Hall, D.K.; Hansman, R.J.; Hileman, J.I.; Liebeck, R.H.; Lovegren, J.; Mody, P.; Pertuze, J.A.; Sato, S.; et al. N+3 Aircraft Concept Designs and Trade Studies, Final Report; NASA: Washington, DC, USA, 2010; Volume 2. [Google Scholar]
- Frank, M.W. Fluid Mechanics; McGraw-Hill: New York, NY, USA, 2011. [Google Scholar]
- Saunders, D.J.; So, B. A Method of Calculating the Weight and Dimensions of a Turbo Pump for Rocket Propellants; Technical Report; Rocket Propulsion Department: Westcott, UK, 1949. [Google Scholar]
- Hydrogen Piping and Pipelines ASME Code for Pressure Piping, B31; Technical Report; The American Society of Mechanical Engineers: New York, NY, USA, 2023.
- Parello, R.; Gourinat, Y.; Benard, E.; Defoort, S. Structural Sizing of a Hydrogen Tank for a Commercial Aircraft. J. Phys. Conf. Ser. 2024, 2716, 012040. [Google Scholar] [CrossRef]
- ASME Boiler & Pressure Vessel Code, Section II, Materials; Technical Report; The American Society of Mechanical Engineers: New York, NY, USA, 2019.
- ASME Boiler & Pressure Vessel Code, Section VIII, Rules for Construction of Pressure Vessels, Division 1; Technical Report; The American Society of Mechanical Engineers: New York, NY, USA, 2023.
- John, H.L.I.; John, H.L.V. A Heat Transfer Textbook; Phlogiston Press: Cambridge, MA, USA, 2020. [Google Scholar]
- Hastings, L.J. Liquid Hydrogen Zero-Boiloff Testing and Analysis for Long-Term Orbital Storage. AIP Conf. Proc. 2004, 710, 1163–1170, ISSN: 0094243X. [Google Scholar] [CrossRef]
- Singh, D.; Singh, M.; Chaubey, A.; Ganguly, A.; Singh, V. Thermal performance improvement of multilayer insulation technique. Heat Mass Transf. 2023, 59, 1365–1378. [Google Scholar] [CrossRef]
- Philip, L.S. Valve Handbook; McGraw-Hill: New York, NY, USA, 2004. [Google Scholar]
- Herose. Valves for Cryogenic Applications. 2023. Available online: https://produkte.herose.com/data/katalog-interactive/herose-cryogenic-2023-en/epaper/HEROSE-Katalog-CRYO-2023-E.pdf (accessed on 23 December 2024).
- API—520 Sizing, Selection, and Installation of Pressure-Relieving Devices in Refineries; Technical Report; Americal Petroleum Institute: Washington, DC, USA, 2000.
- Soupapes de Sûreté en Acier Inoxydable, en Forme d‘Equerre avec Raccords à Brides, Série 455 ANSI—Goetze. 2024. Available online: https://www.goetze-group.com/Series/455/goetze-455-ansi-datasheet-fr.pdf (accessed on 15 January 2025).
- Cryostar. Hydrogen Expanders and Pumps. Available online: https://www.sintef.no/globalassets/project/hyper/presentations-day-2/day2_1005_hautdidier_cryostar.pdf (accessed on 5 May 2025).
Disclaimer/Publisher’s Note: The statements, opinions and data contained in all publications are solely those of the individual author(s) and contributor(s) and not of MDPI and/or the editor(s). MDPI and/or the editor(s) disclaim responsibility for any injury to people or property resulting from any ideas, methods, instructions or products referred to in the content. |
© 2025 by the authors. Licensee MDPI, Basel, Switzerland. This article is an open access article distributed under the terms and conditions of the Creative Commons Attribution (CC BY) license (https://creativecommons.org/licenses/by/4.0/).