Article

Shell-Stripping Mechanism of Red Sandstone Under Hypervelocity Impact with Aluminum Spheres

1
Key Laboratory of Microgravity (National Microgravity Laboratory), Institute of Mechanics, Chinese Academy of Sciences, Beijing 100190, China
2
School of Engineering Science, University of Chinese Academy of Sciences, Beijing 100049, China
3
State Key Laboratory of Nonlinear Mechanics, Institute of Mechanics, Chinese Academy of Sciences, Beijing 100190, China
*
Authors to whom correspondence should be addressed.
Aerospace 2025, 12(6), 534; https://doi.org/10.3390/aerospace12060534
Submission received: 29 April 2025 / Revised: 8 June 2025 / Accepted: 11 June 2025 / Published: 12 June 2025
(This article belongs to the Special Issue Asteroid Impact Avoidance)

Abstract

To investigate the size effect on fragmentation phenomena during hypervelocity impact, scaled experiments were conducted using a 30 mm smooth-bore ballistic range (DBR30) driven by a detonation-driven two-stage launching system. Unique stripping of sandstone target was observed, revealing that free-surface unloading waves govern peak pressure attenuation and fragmentation patterns. By establishing a shock wave attenuation model, the typical failure characteristics of different regions were distinguished, including jetting, crushing, and cracking. Parameter λ was defined to distinguish two forms of destruction, Class I (stripping-dominated) and Class II (cratering-dominated). Given the significant difference between the compressive and tensile strength of sandstone, the influence of the size effect on its failure characteristics was notable. This research also provides a valuable reference for understanding the evolution and formation mechanisms of binary asteroids.

1. Introduction

Near-Earth asteroids (NEAs) are defined as asteroids with heliocentric orbits intersecting Earth’s orbital vicinity. Those possessing a minimum orbital intersection distance (MOID) <0.05 AU with a diameter exceeding 140 m are designated as Potentially Hazardous Objects (PHOs), posing collision risks [1,2]. According to the Minor Planet Center (MPC), as of January 2018, there were more than 17,000 Near-Earth asteroids, of which nearly 1700 should be considered potentially hazardous [3]. The typical impact speed of asteroids is 15–20 km/s. Currently, there are 188 confirmed meteorite impact craters on Earth. The dimensions of these craters primarily depend on various factors, including the energy, size, composition, density, speed of the impactor, and so on [4]. Craters of various sizes exist all over the world, for example the Gosses Bluff crater [5], Chicxulub crater [6], Amguid crater [7], Barringer crater [8], Carancas crater [9], and Chelyabinsk crater [10], proving the existence of asteroid impact events directly and indirectly. Researchers worldwide have proposed a variety of strategies for asteroid defense to prevent the Earth from being hit. Among them, kinetic impact deflection of asteroids is the simplest and most effective approach [11]. In 2022, the DART (double asteroid redirection test) impactor struck Dimorphos, the secondary star of the double asteroid Didymos, at a speed of more than 6.2 km/s, successfully changing the asteroid’s orbit around Didymos and proving the feasibility of kinetic energy impact [12]. While momentum transfer quantification and asteroid property characterization require refinement, ground-based hypervelocity impact experiments have become a reliable method to help understand the mechanism of these phenomena.
Hypervelocity impact experiments, involving projectiles of varying sizes and targets, result in distinct debris and plume characteristics, thereby revealing novel fragmentation characteristic. George et al. [13] conducted sphere impact experiments with different pores and measured the velocity of the dust plume at about 1.6 km/s and the velocity of the large jet fragments at about 19.4 m/s. Meteorite ejecta has two stages of development: a high velocity, fine-grained ejecta cone, and high-velocity ejection of large ejecta fragments. These large ejecta fragments are the main cause of cratering recoil. For hard and thick target rocks such as anorthosite, cratering is the main feature after impact, and hyperbolic, parabolic, and power law equations can be used to evaluate crater excavation shape [14]. Fragmentation characteristics under hypervelocity impact affect crater formation efficiency [15]. Fragmentation accounts for more than 50% of the final crater volume, with quartzite targets exhibiting ~70% pellet fragmentation efficiency [16]. In contrast, sandstone projectile fragmentation under identical impact conditions exhibits an efficiency of ~50%, demonstrating dominant control over crater formation dynamics. Experimental observations [17] document large irregular rocks undergoing central pit formation and fragmentation along peripheral main cracks. Impactor size and material properties yield distinct, fragmentation-dependent phenomena. Conventional fragmentation modes primarily involve cratering and blocking, which are potentially determined by shock wave propagation at different stages.
Hypervelocity impact (HVI) on an asteroid, creating a crater, occurs in three stages: contact and compression, excavation, and modification. Each stage is dominated by a different set of physical mechanism [18]. Both strain rate and size have important effects on the formation of these craters [19]. The duration of dynamic fracture is very short. The energy accumulation and transfer speed at the crack tip are faster than the propagation speed of a new crack at the crack tip. Under a certain confining pressure, rock exhibits enhanced dynamic compressive strength and peak strain with increasing strain rate, demonstrating logarithmic scaling of compressive strength [20]. HVI-induced compression at the projectile–target interface launches shock waves along the compressed/uncompressed material boundary. Proximal to the impact site, the high pressure impact will induce vaporization, melting, and solid phase transformation. A strong impact material accompanied by a high-speed “jet” is ejected from the interface between the projectile and the target. Chen [21], Liu [22], and Johnson et al. [23] also explained this phenomenon through theory or simulation. The surface of the target, due to the interaction of the shock wave and unloading wave, will also produce tensile stress, resulting in spalling of the target [24]. Pressure pulse-induced rock deformation in small-scale crater experiments revealed enhanced dynamic strength under high strain rates, exhibiting significant size effects [25]. Shock loading and unloading strongly affect the crushing characteristics of the impact. Quantifying the shock transfer process is very important to clarify the crushing mechanism.
In order to study the size effect in hypervelocity impact, scaled specimen experiments were conducted in this paper. A special phenomenon of stripping effect on sandstone was observed during hypervelocity impact. Shock wave attenuation during the impact process is closely related to the crushing effect of the target. Especially, the influence of the unloading wave needs to be considered. Therefore, the relation between shock wave propagation and the broken region is established, explaining the shell-stripping model. The parameter λ emerges as the quantitative threshold defining sandstone’s size effect-driven failure mode transitions. A critical λ = 1 distinguishes Class I (stripping-dominated) and Class II (cratering-dominated) failure modes.

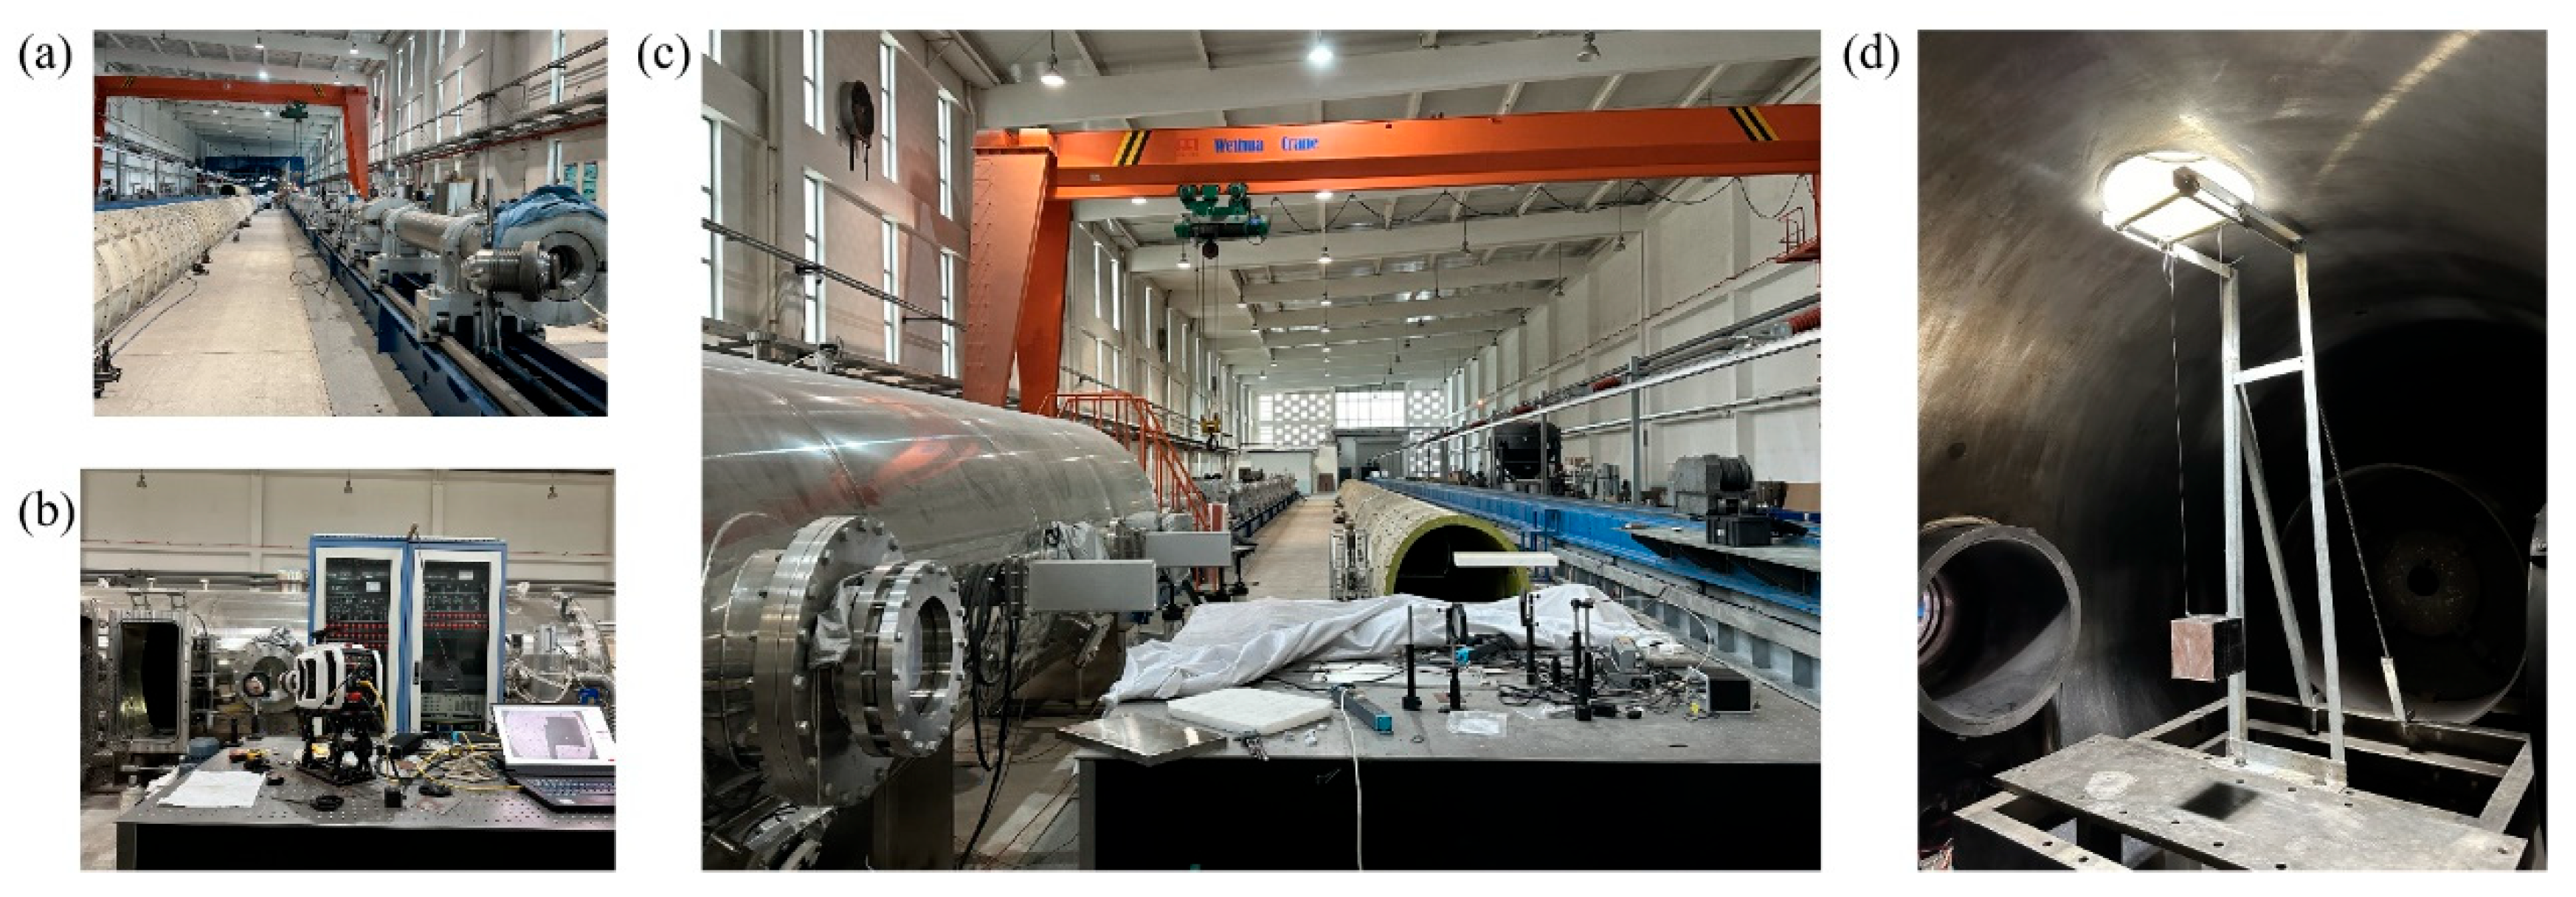
2. Experimental Methods

In this work the projectiles were 8 mm diameter Al-spheres (6061-T6 Al) (Yasite company, Jinhua, China), and a red sandstone cube with a size of 100 mm served as the impact target. Red sandstone impact tests were carried out using a 30 mm smooth-bore ballistic (DBR30) driven by gaseous detonation from the Institute of Mechanics, Chinese Academy of Sciences [26,27], as shown in Figure 1. The main body of the bombing driver of the secondary light cannon balloon (DBR30) mainly includes the hypervelocity transmitter main body (explosion tube and compression pipe), test section, and recycling section, as shown in Figure 2a. A sabot of low-density high-pressure polyethylene was utilized in the launch system. Nitrogen was pressurized in the test section to achieve projectile–sabot separation. The ballistic target uses a stimulating imaging system, and the impact process of the shooting target was recorded by a high-speed camera (Kirana 5 (Pitstone, UK)), as shown in Figure 2b. The camera sampling frame rate was 75,000 Hz, and the speed of the incident projectile was measured by laser velocimetry system. The optical path was visualized using a schlieren imaging system, as shown in Figure 2c. The sandstone specimen was wrapped by insulating tape to prevent the rock from collapsing. The sandstone was suspended in the target chamber with two steel wire ropes, configured as a ballistic pendulum, as shown in Figure 2d. A polyvinylidene fluoride (PVDF) sensor was employed to capture the impact response of the center point behind the sandstone. In order to preserve the high-frequency characteristics of the signal, the sampling frequency of the oscilloscope was set to 10 MHz. The sampling time was not less than 2 ms, and the trigger voltage was 210 mV.

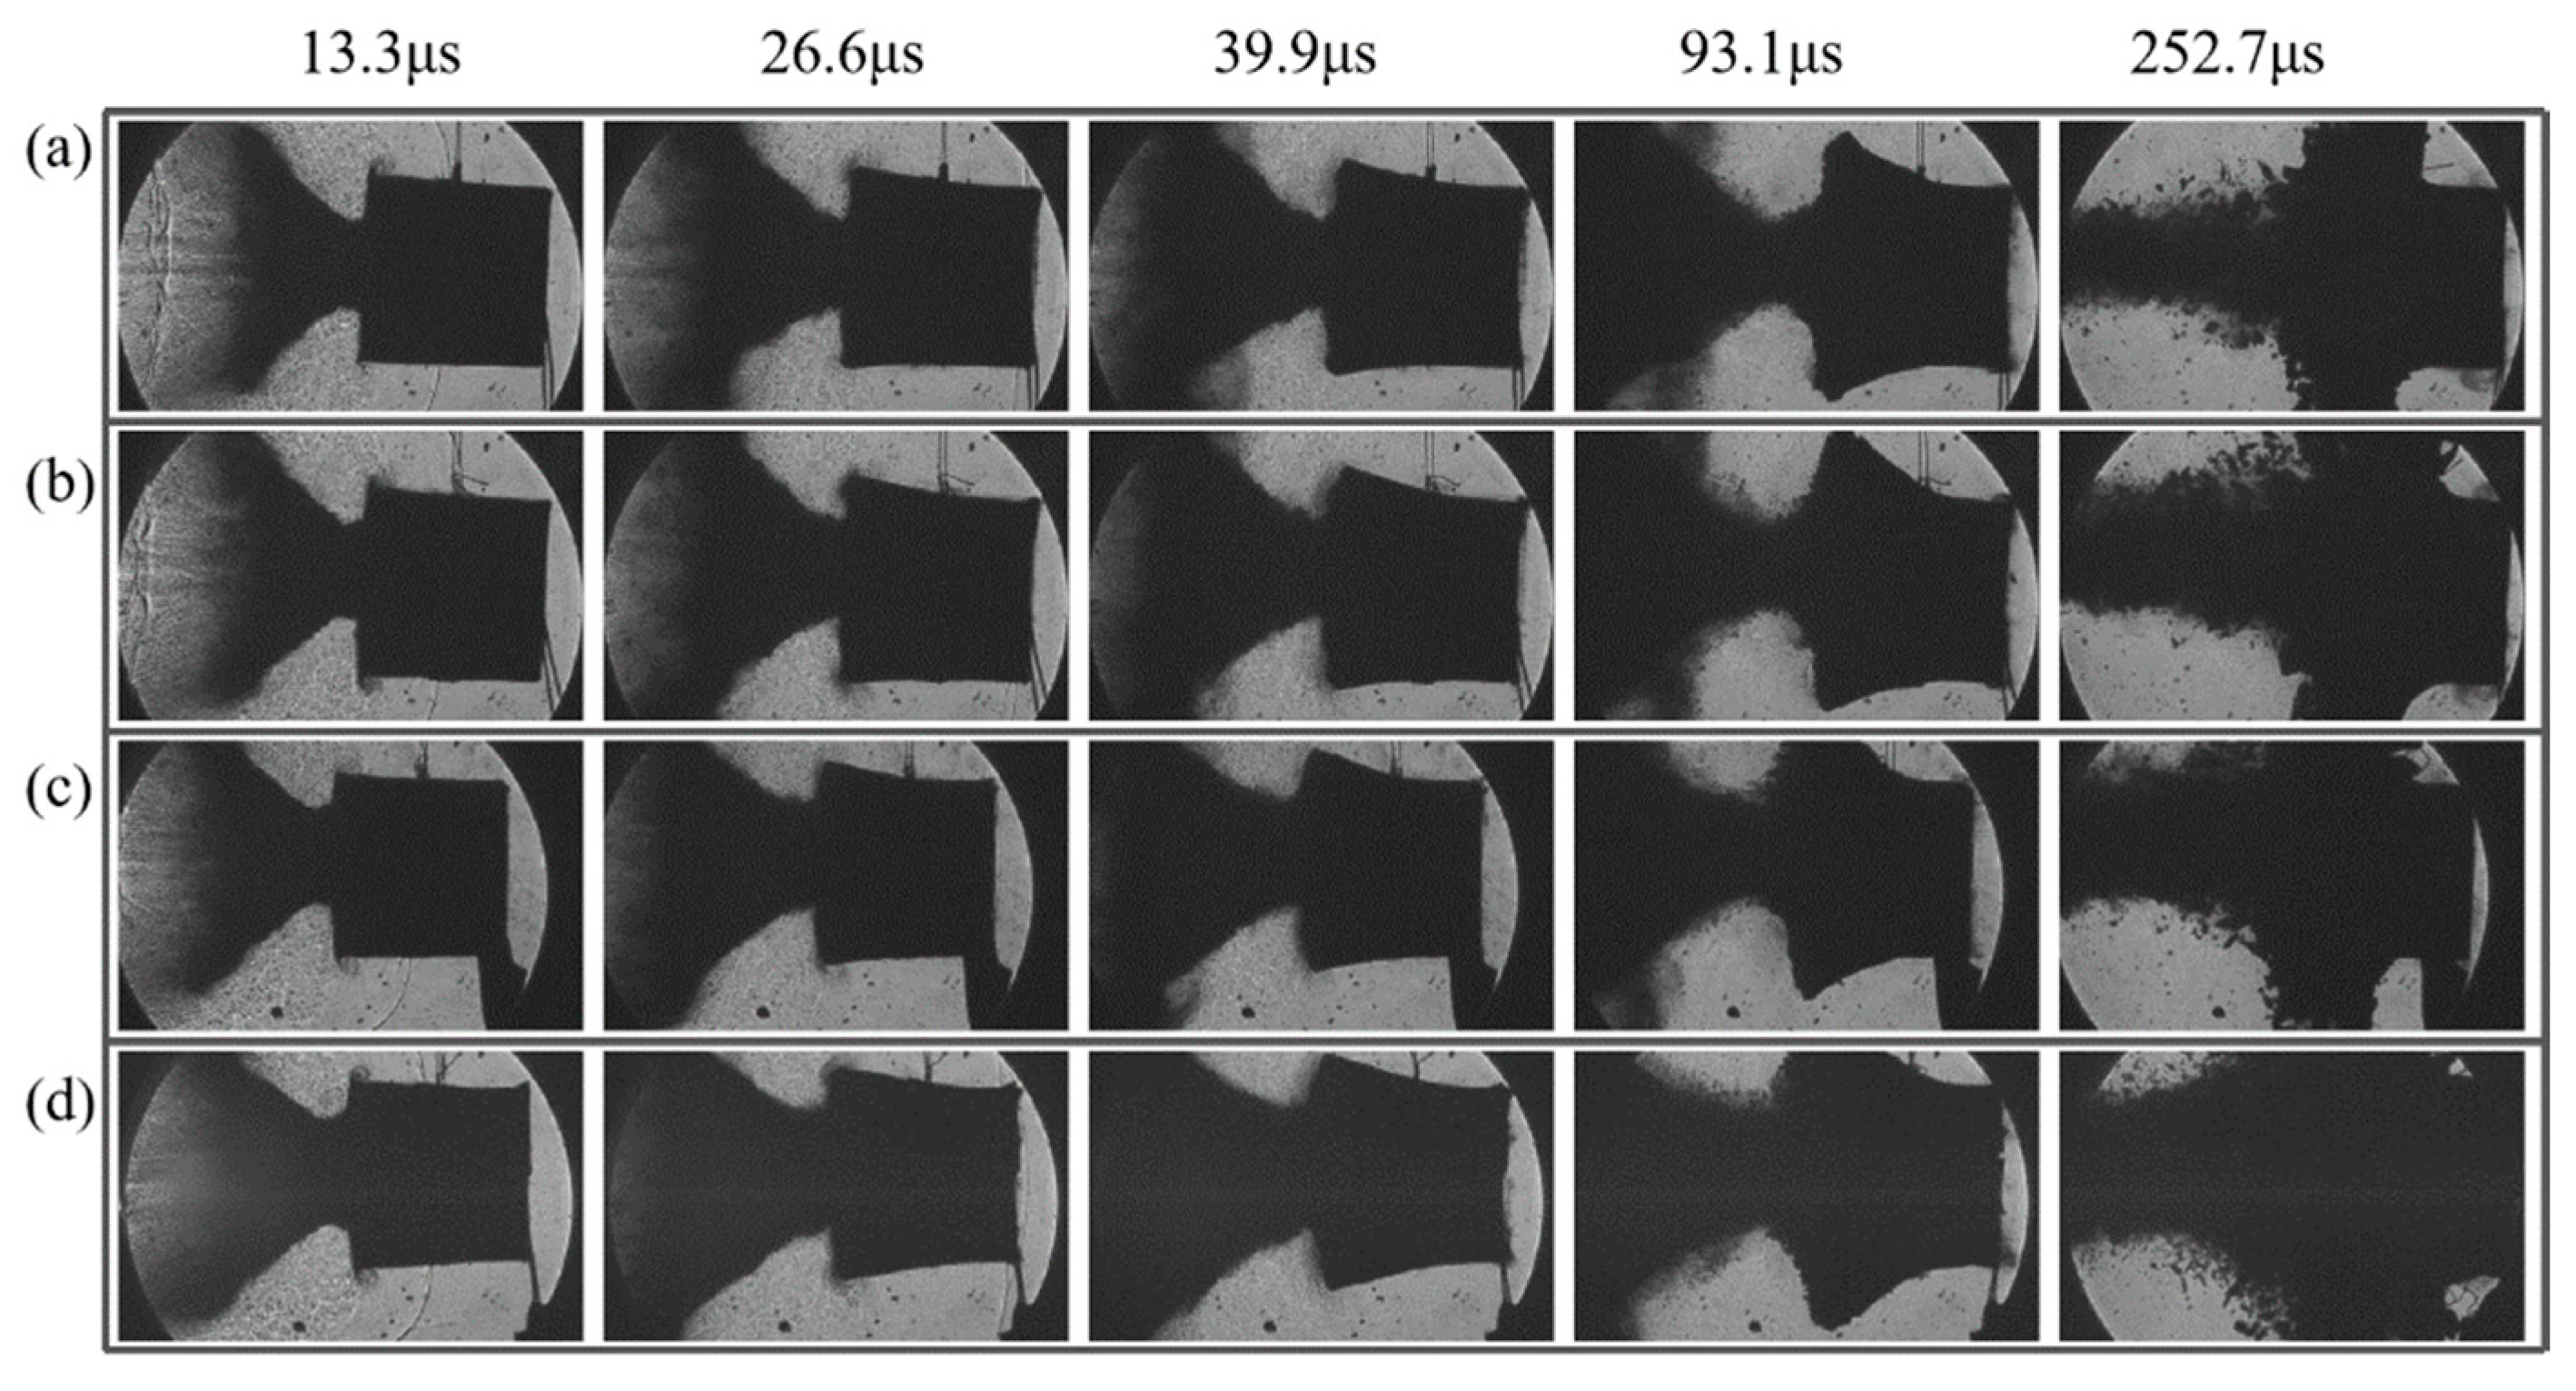
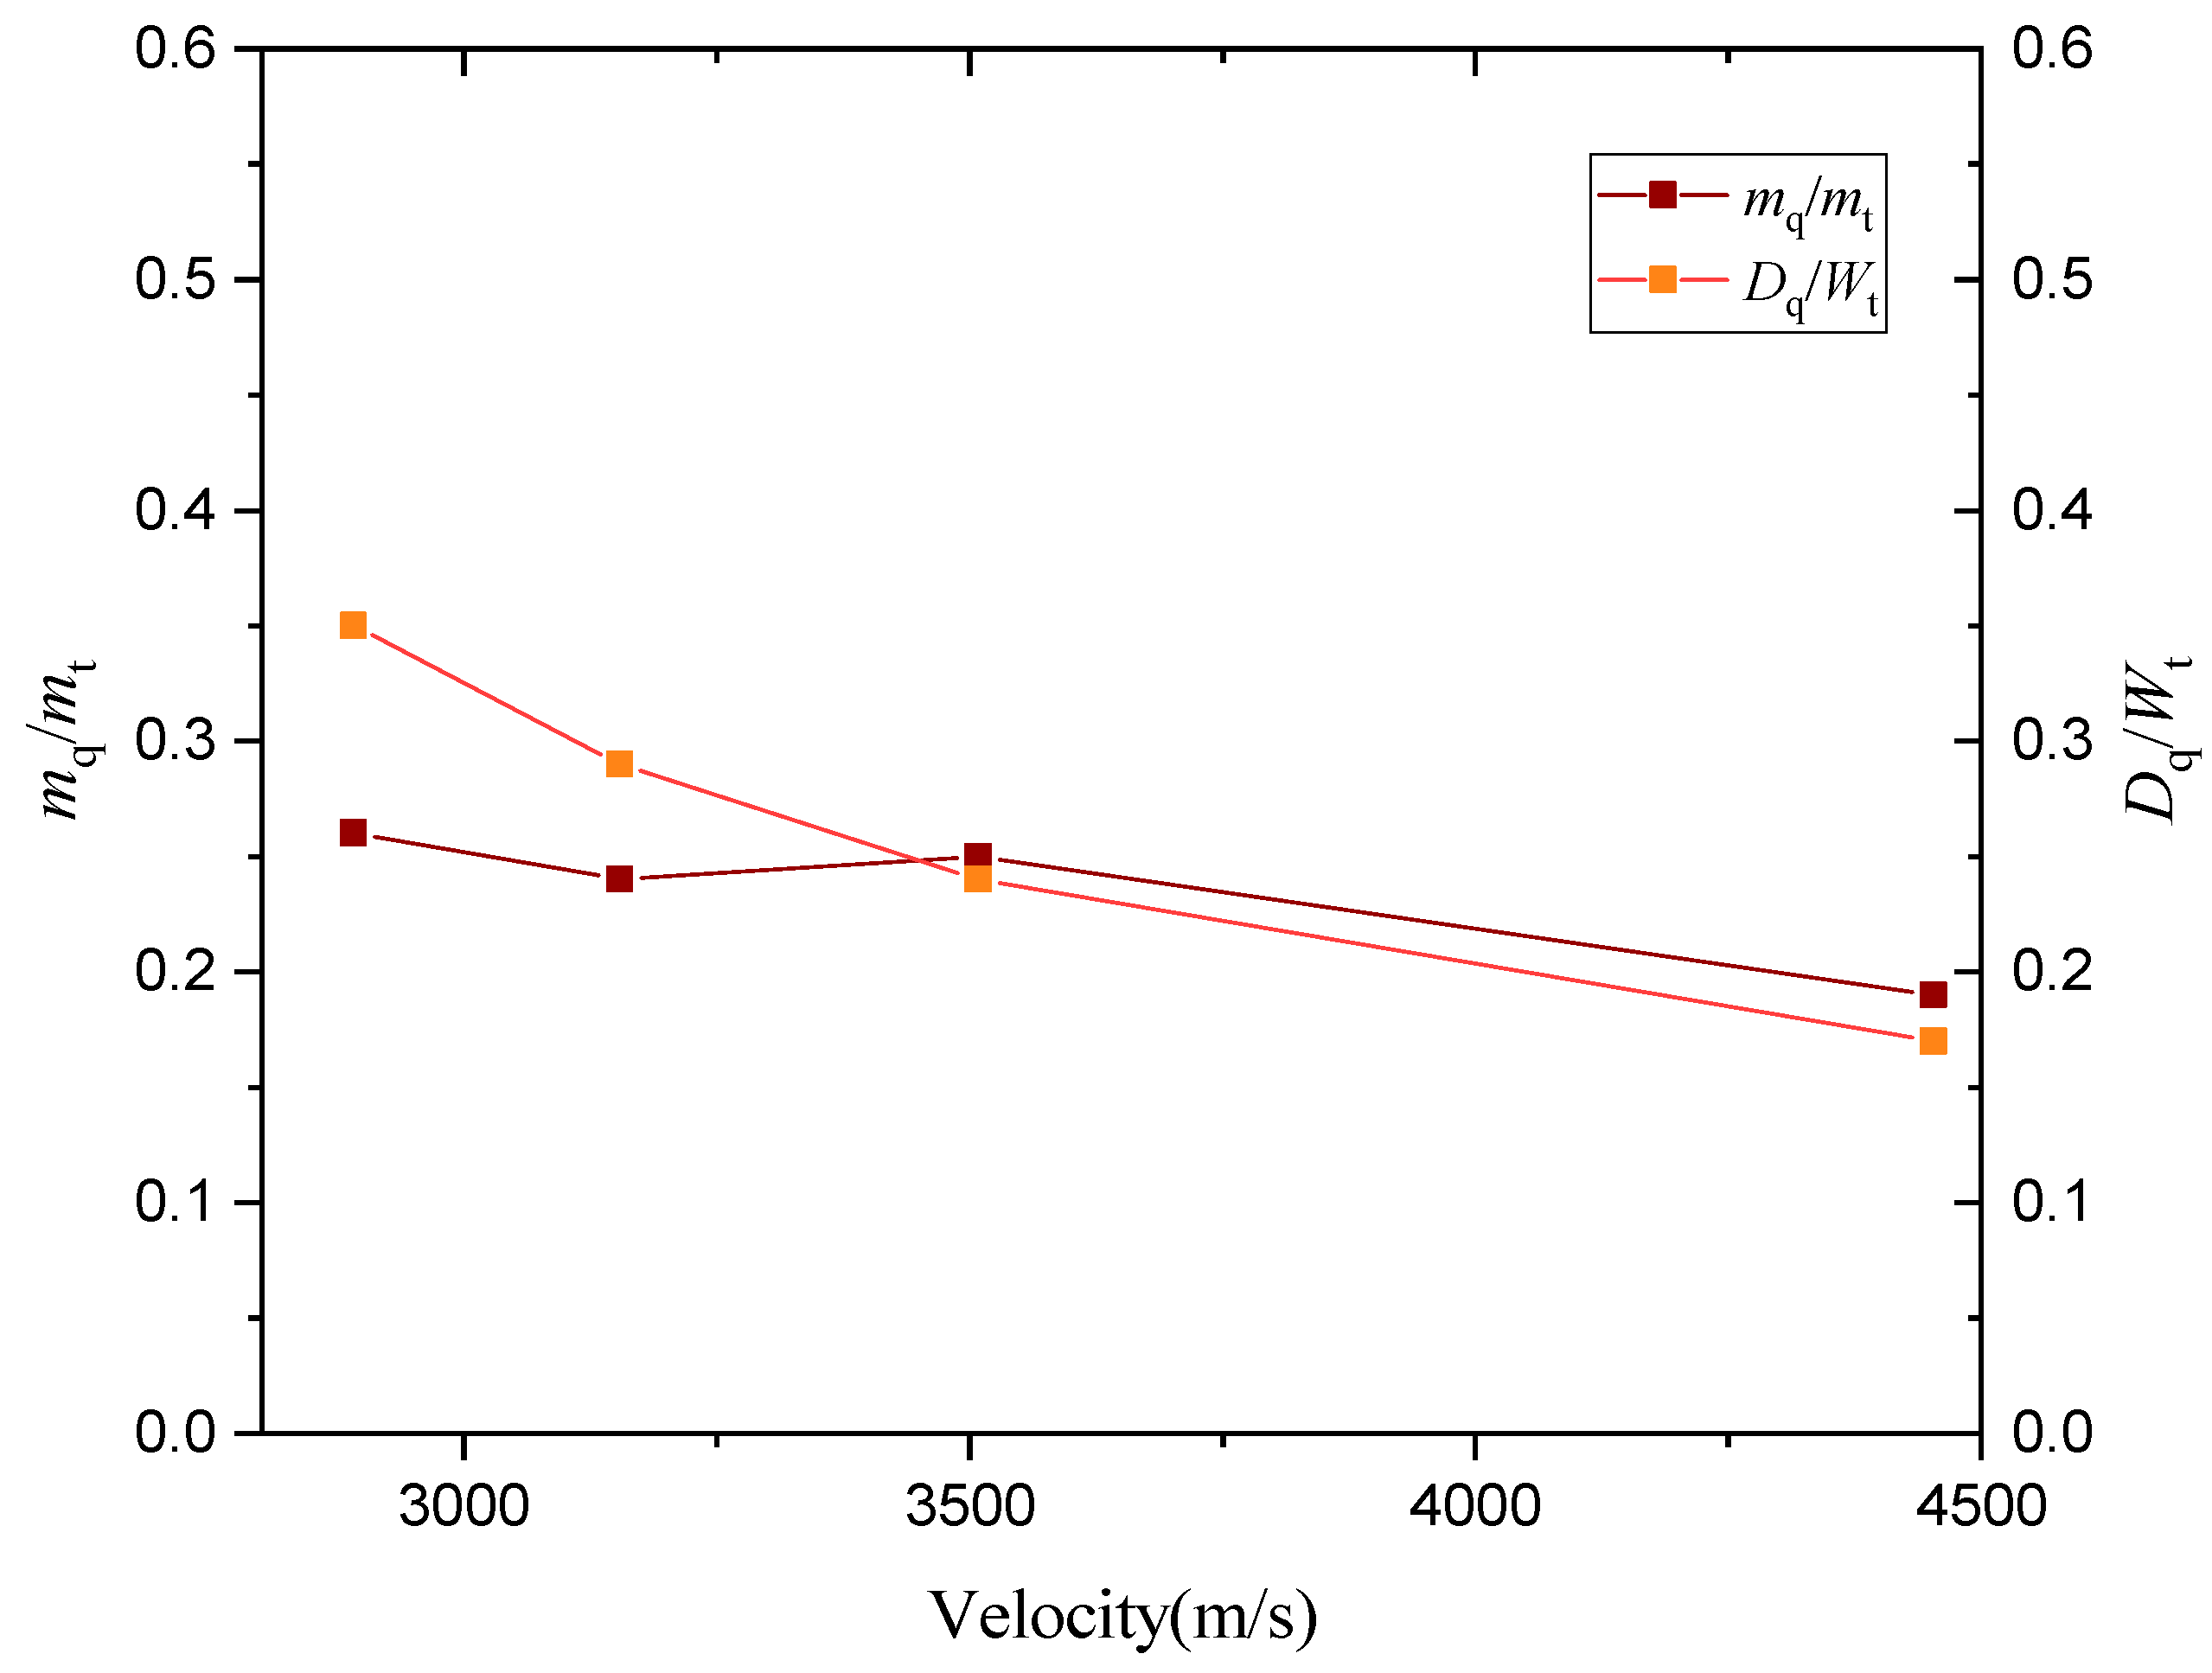
3. Experimental Results

Ballistic impact tests of an aluminum ball on red sandstone specimens at different velocities were conducted, and the results were summarized in Table 1. It can be inferred that, with an increase in impact velocity, the mass of the remaining targets decreases. When the velocity exceeded 4453 m/s, the target was ejected, and the catastrophic fragmentation rendered the residual mass measurement unfeasible. The final impact morphology was illustrated in Figure 3. Centrally-located spherical craters surrounded by petaloid fractures were observed. Notably, spheres of the sandstone target, with a mass of mq, were left after impact across all tested velocities, as circled in Figure 3. Moreover, the fracture morphology on the rear face of the target was velocity-dependent. At an impact velocity of 2891 m/s, there was no detectable fracture on the back of the target. When the velocity reaches 3154 m/s, a single crack could be observed. And at an impact velocity of 3509 m/s, a cross crack was introduced, with the target being divided into four fragments.
The entire impact process was recorded using high-speed photography with a frame size of 512 × 320 px and a sampling rate of 75,000 Hz. High-speed photography is triggered by the output signal of the laser velocimetry system. Figure 4 shows the projectile perforation process of the projectile hitting that target, as captured by a high-speed camera. After the impact, the central region of the target fragmented, developing an outward-propagating conical jet structure. At the end of the collision, large debris was ejected from the target center.

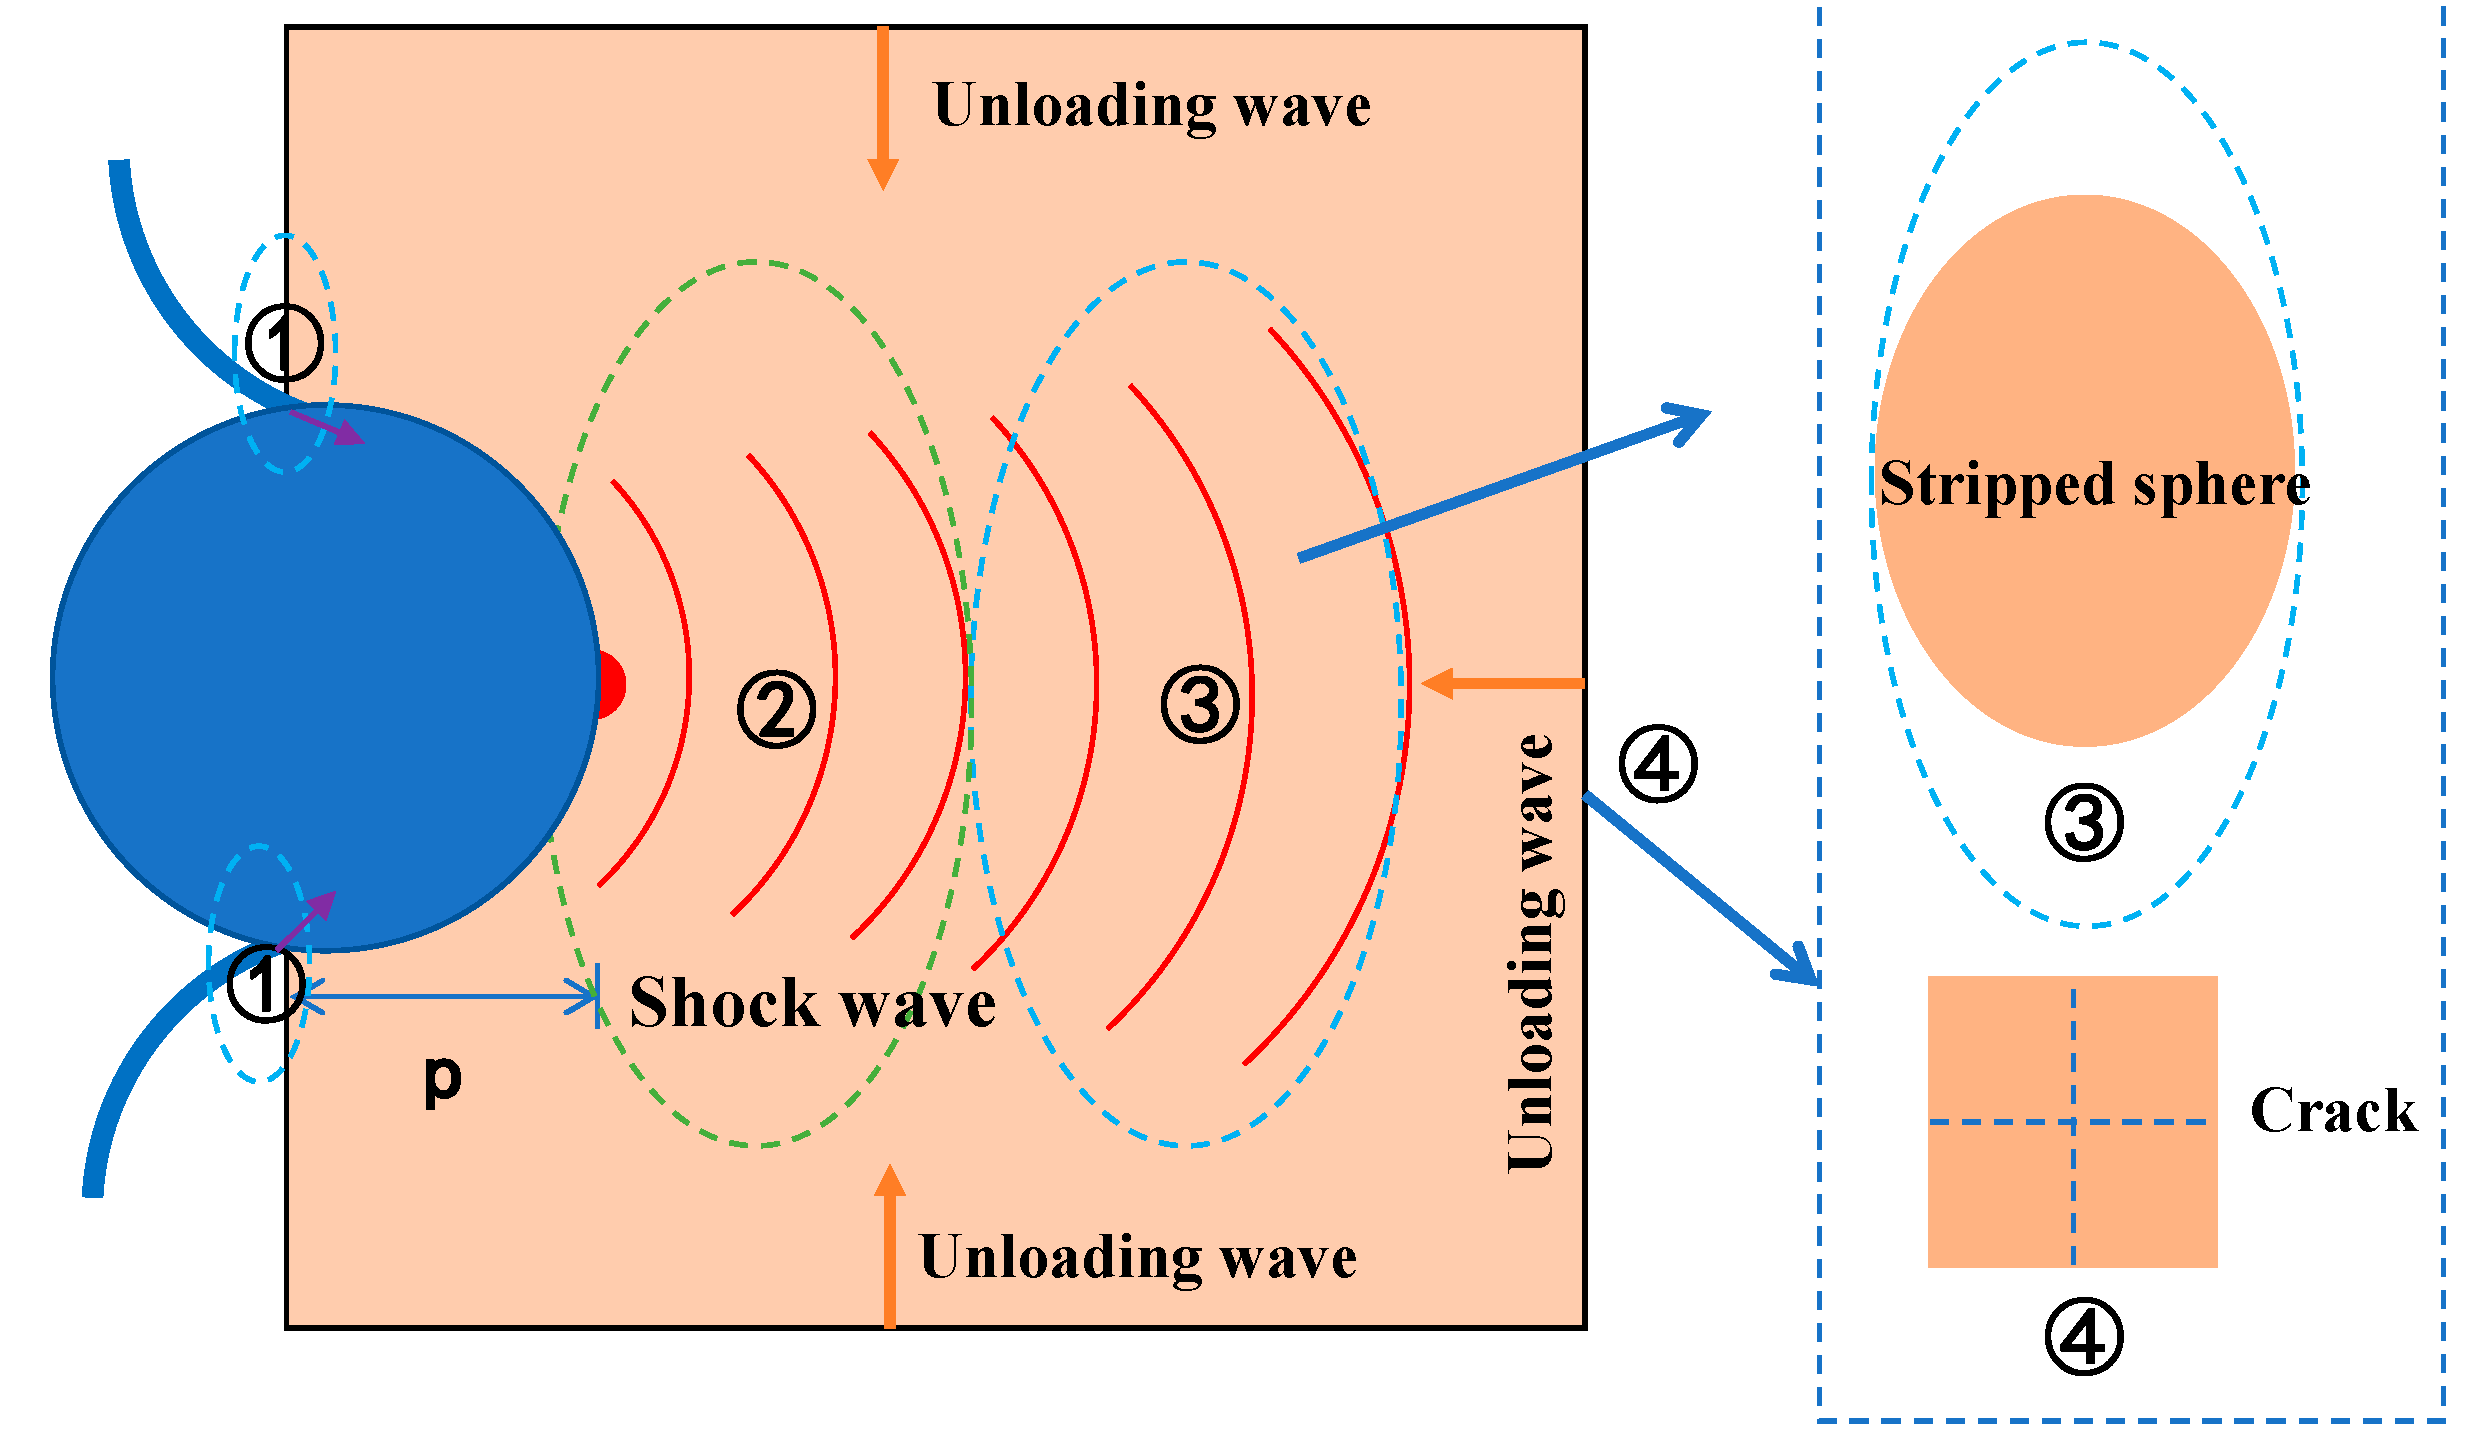
4. Simulation Verification

4.1. Simulation Method

We used low-density spherical aluminum projectiles to represent spacecraft equivalently. The projectile perforation process was simulated with the Smoothed Particle Hydrodynamics (SPH) method implemented in LS-DYNA. The Johnson–Cook (JC) constitutive model [28] coupled with the Mie–Gruneisen equation of state (EOS) [29] was utilized to characterize the thermo-mechanical response of the 6061-Al alloy projectile, and the mechanical behavior of the red sandstone specimen was described by the Holmquist–Johnson–Cook (HJC) model [30]. Critical parameters are listed in Table 2, Table 3 and Table 4. A free boundary condition was employed in the SPH modeling.

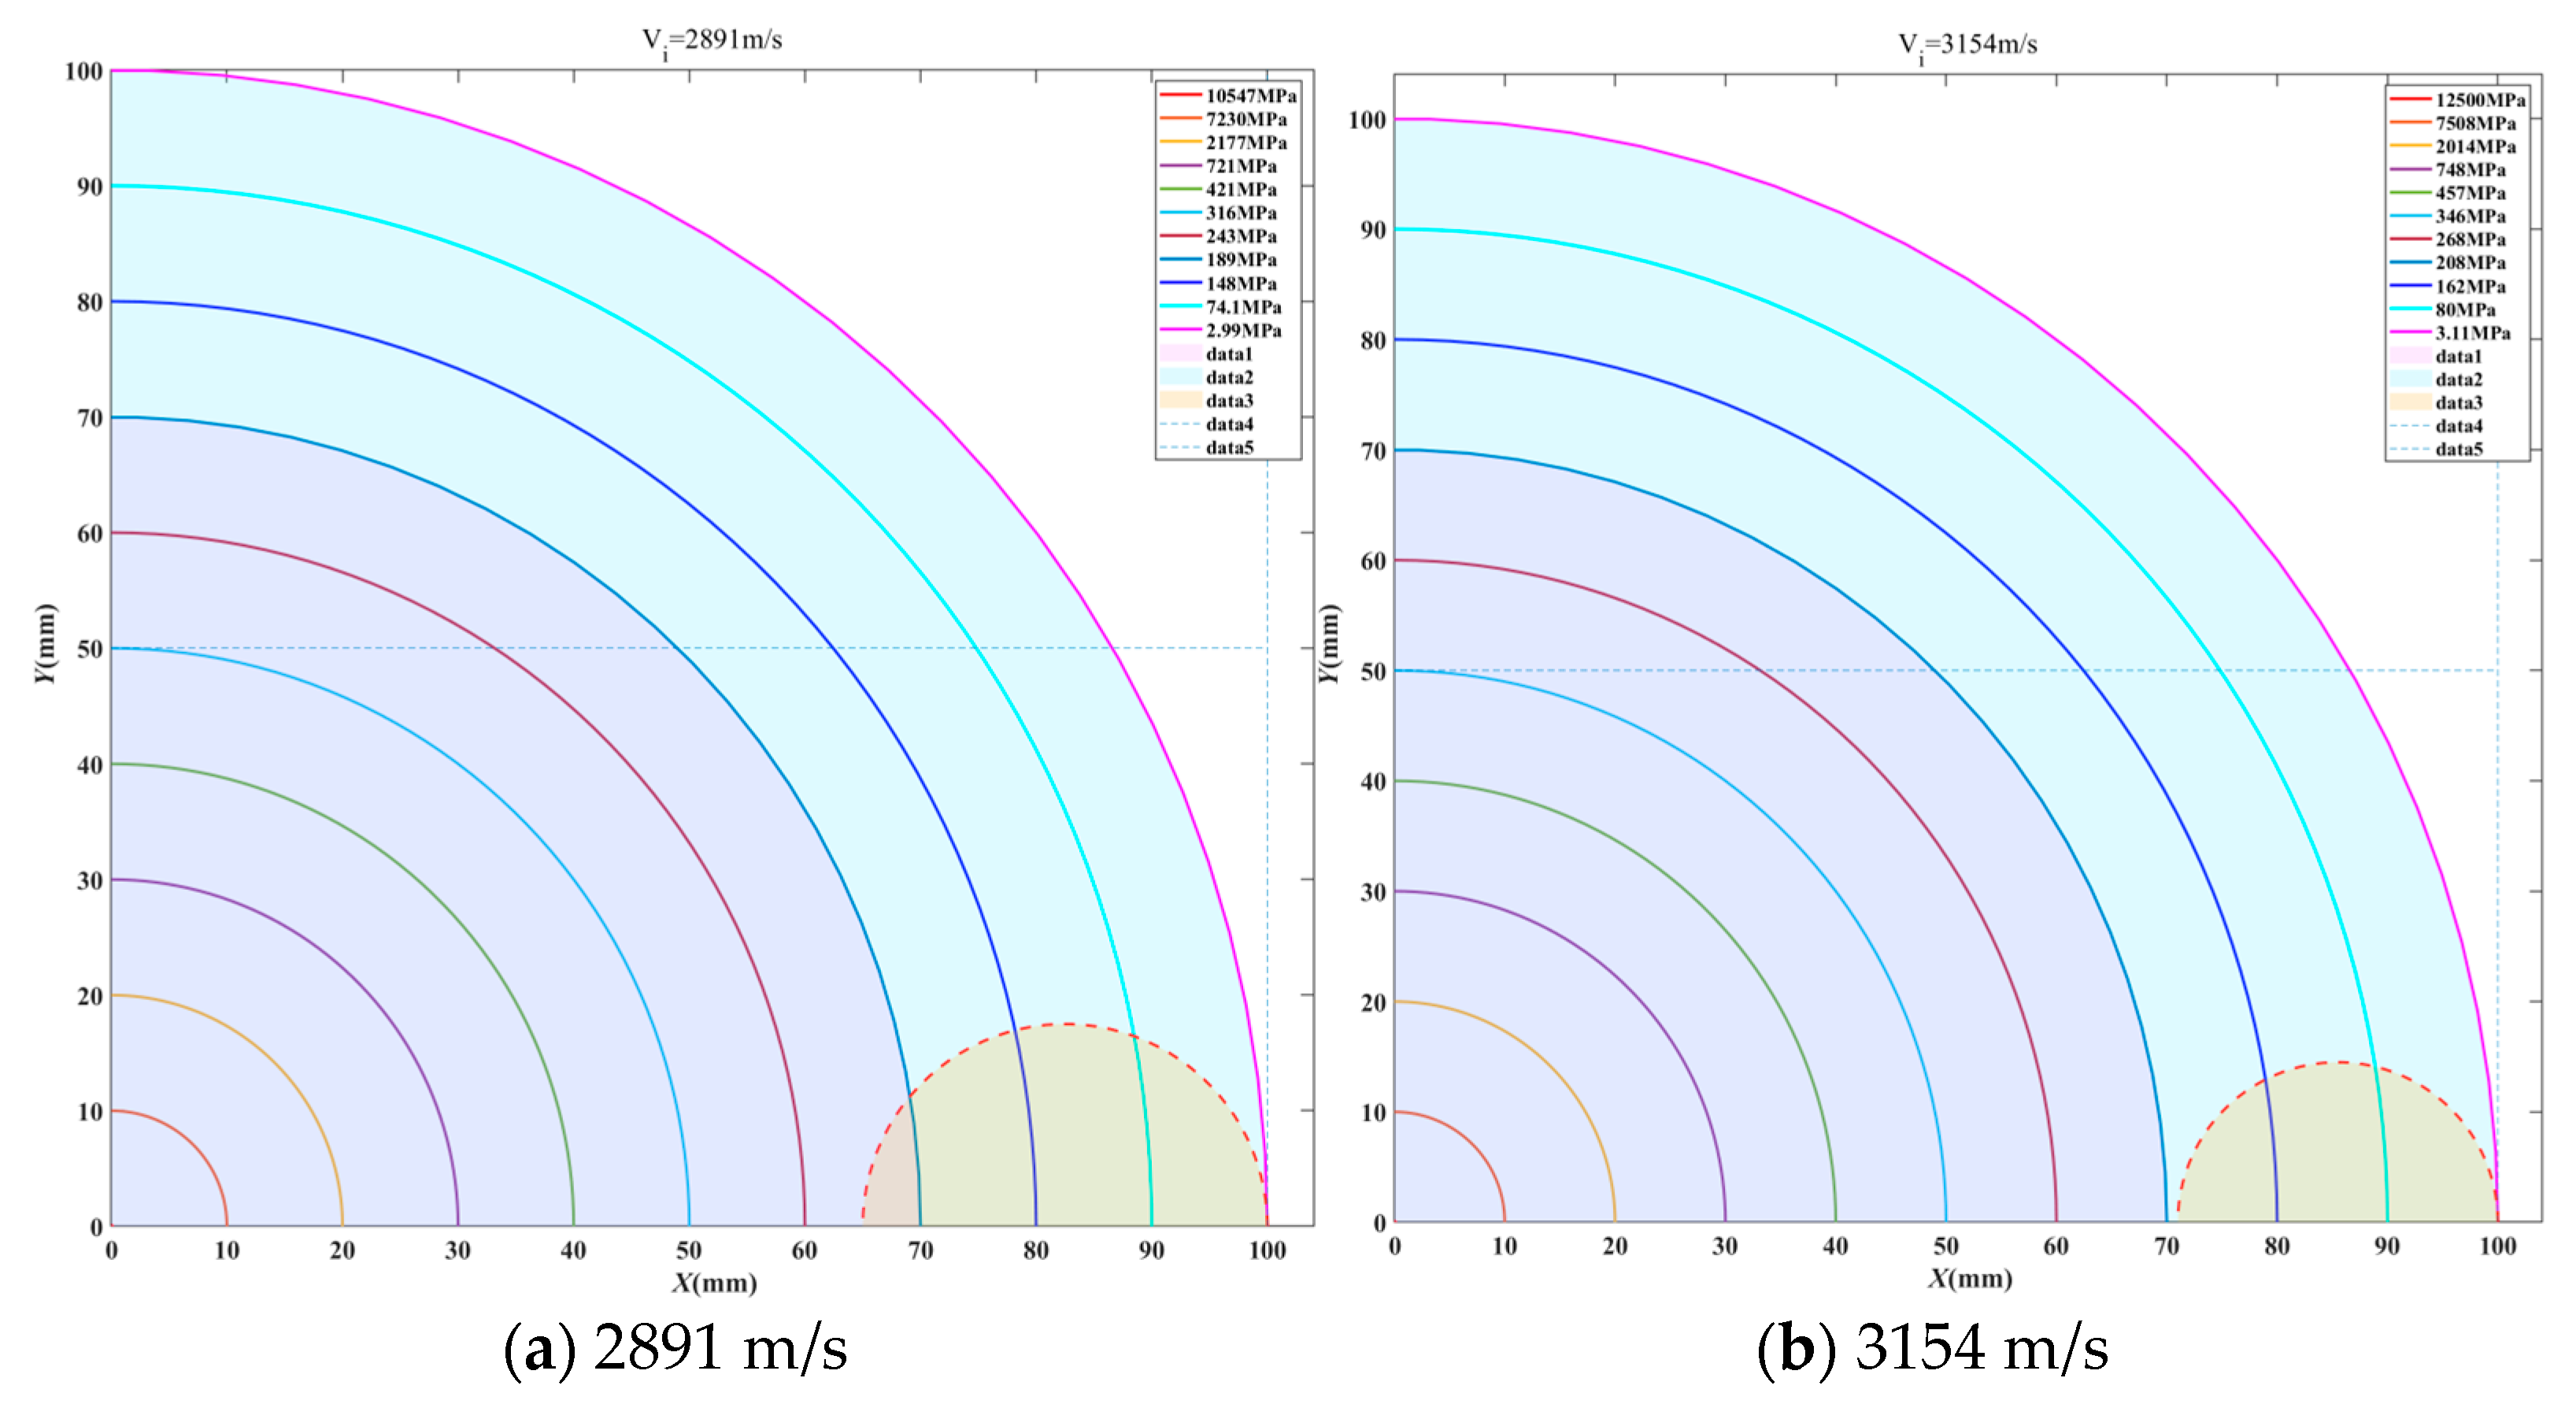
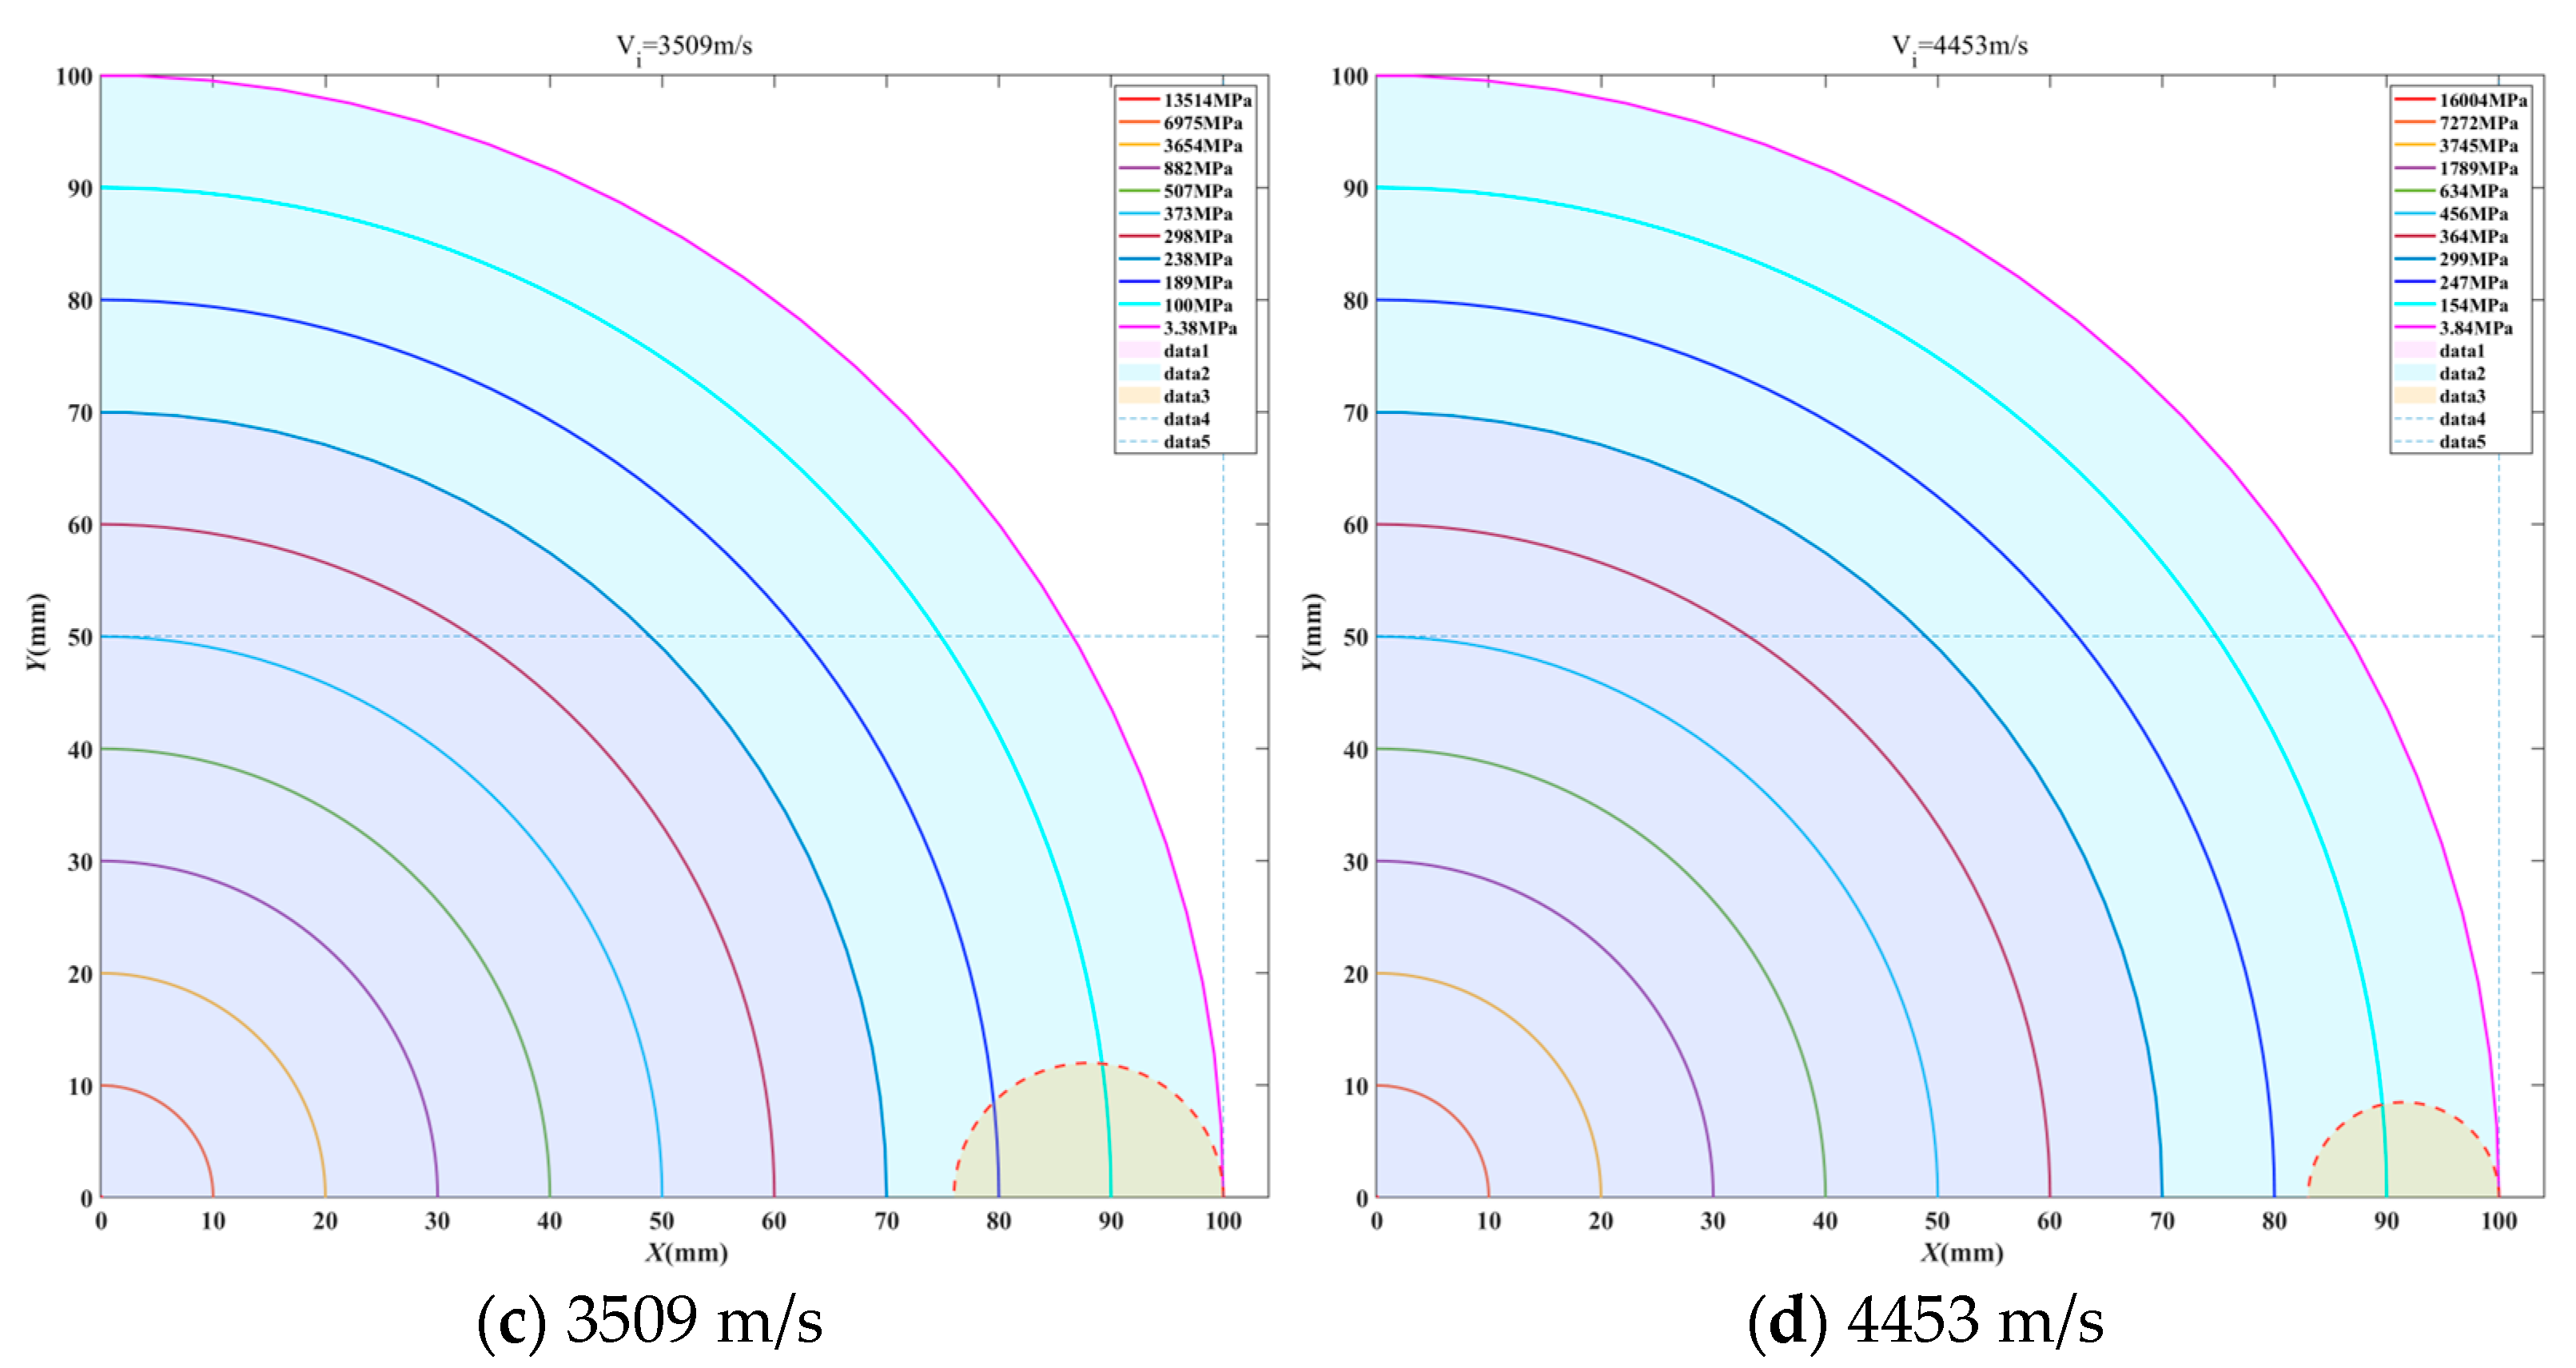
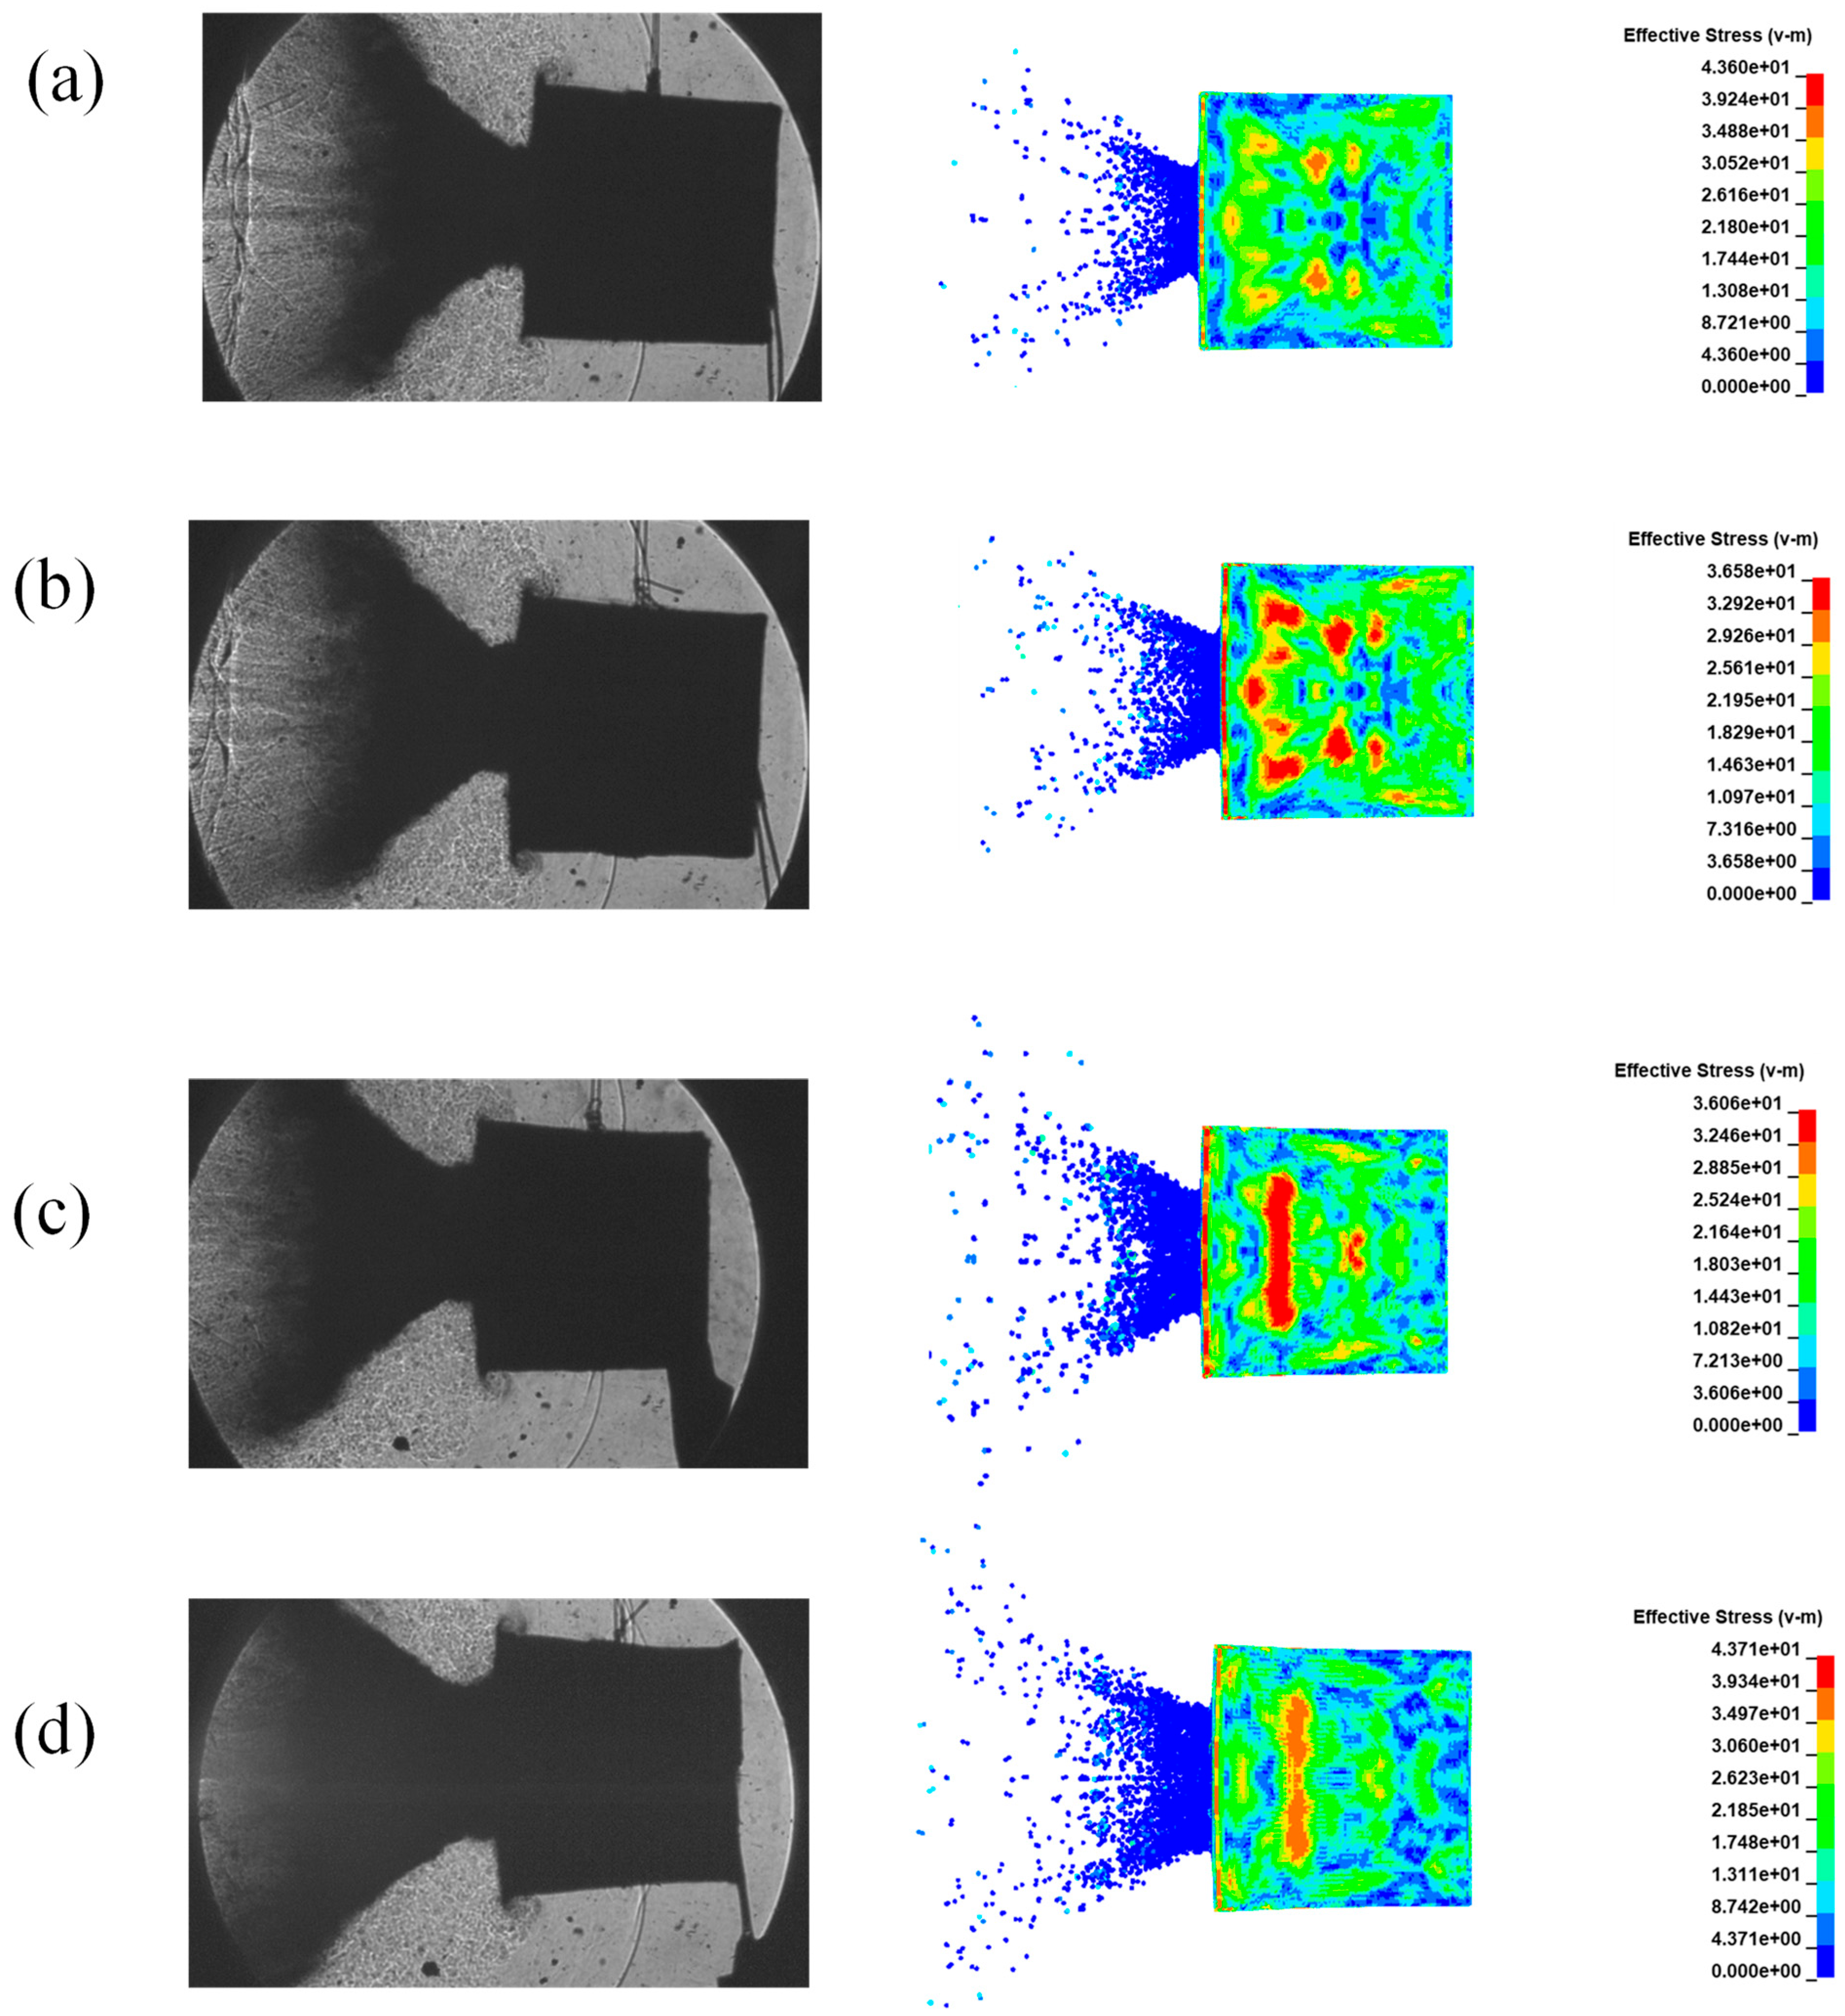
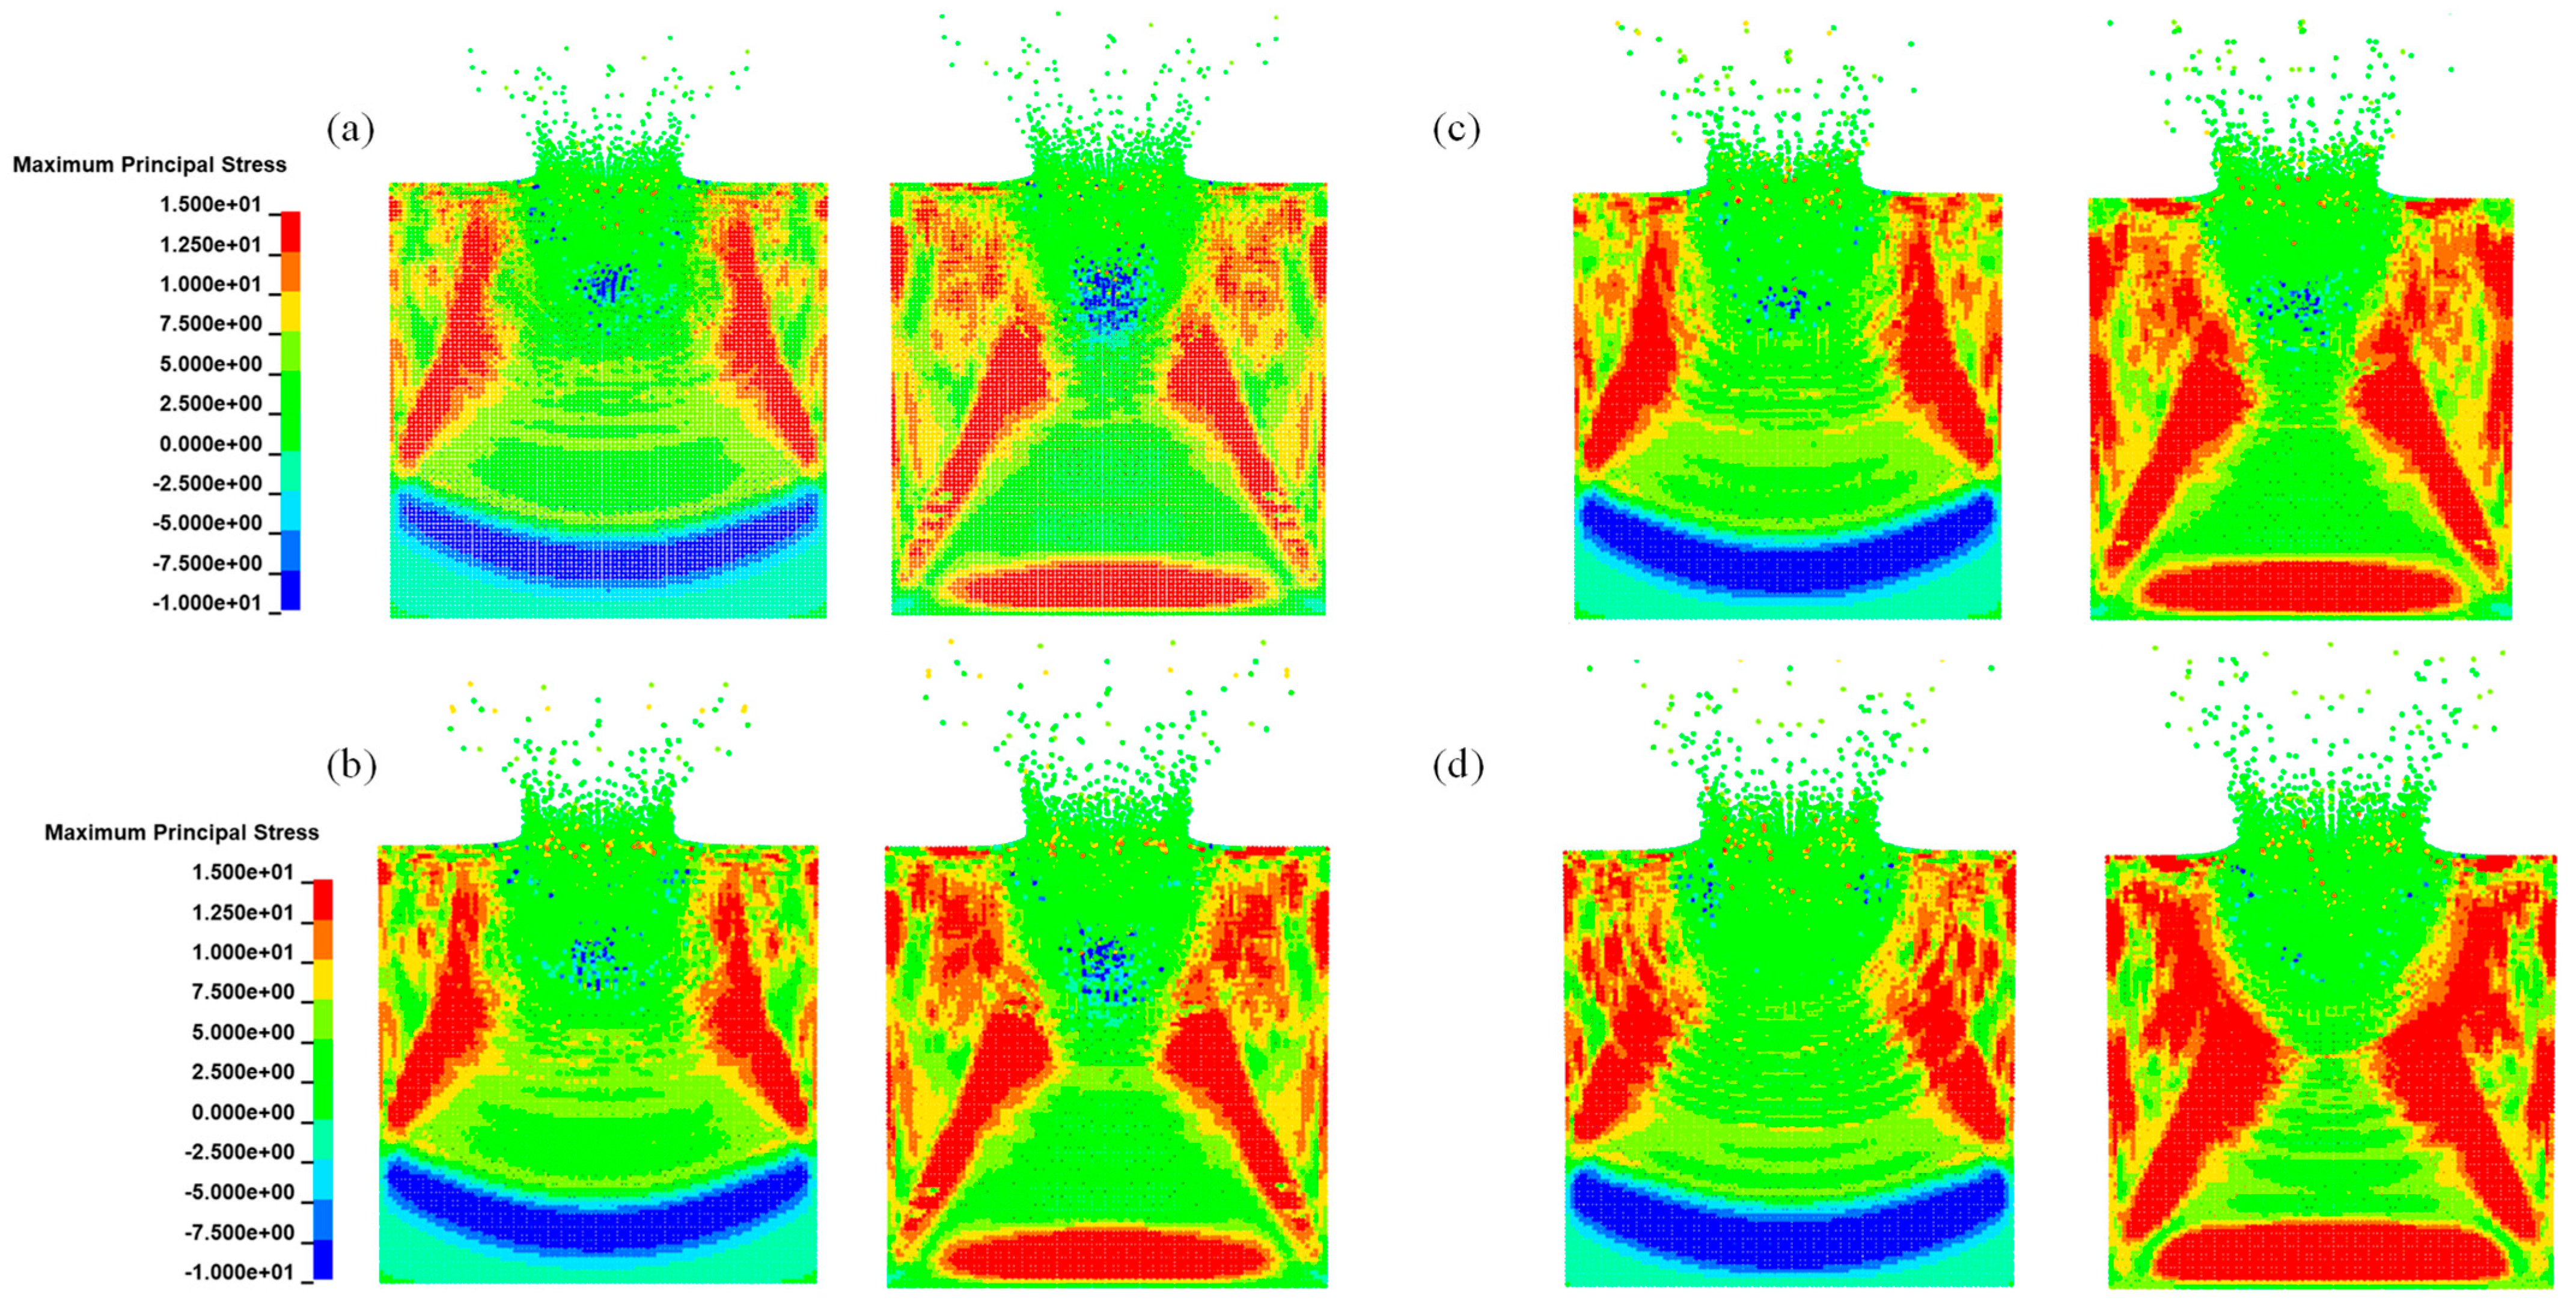
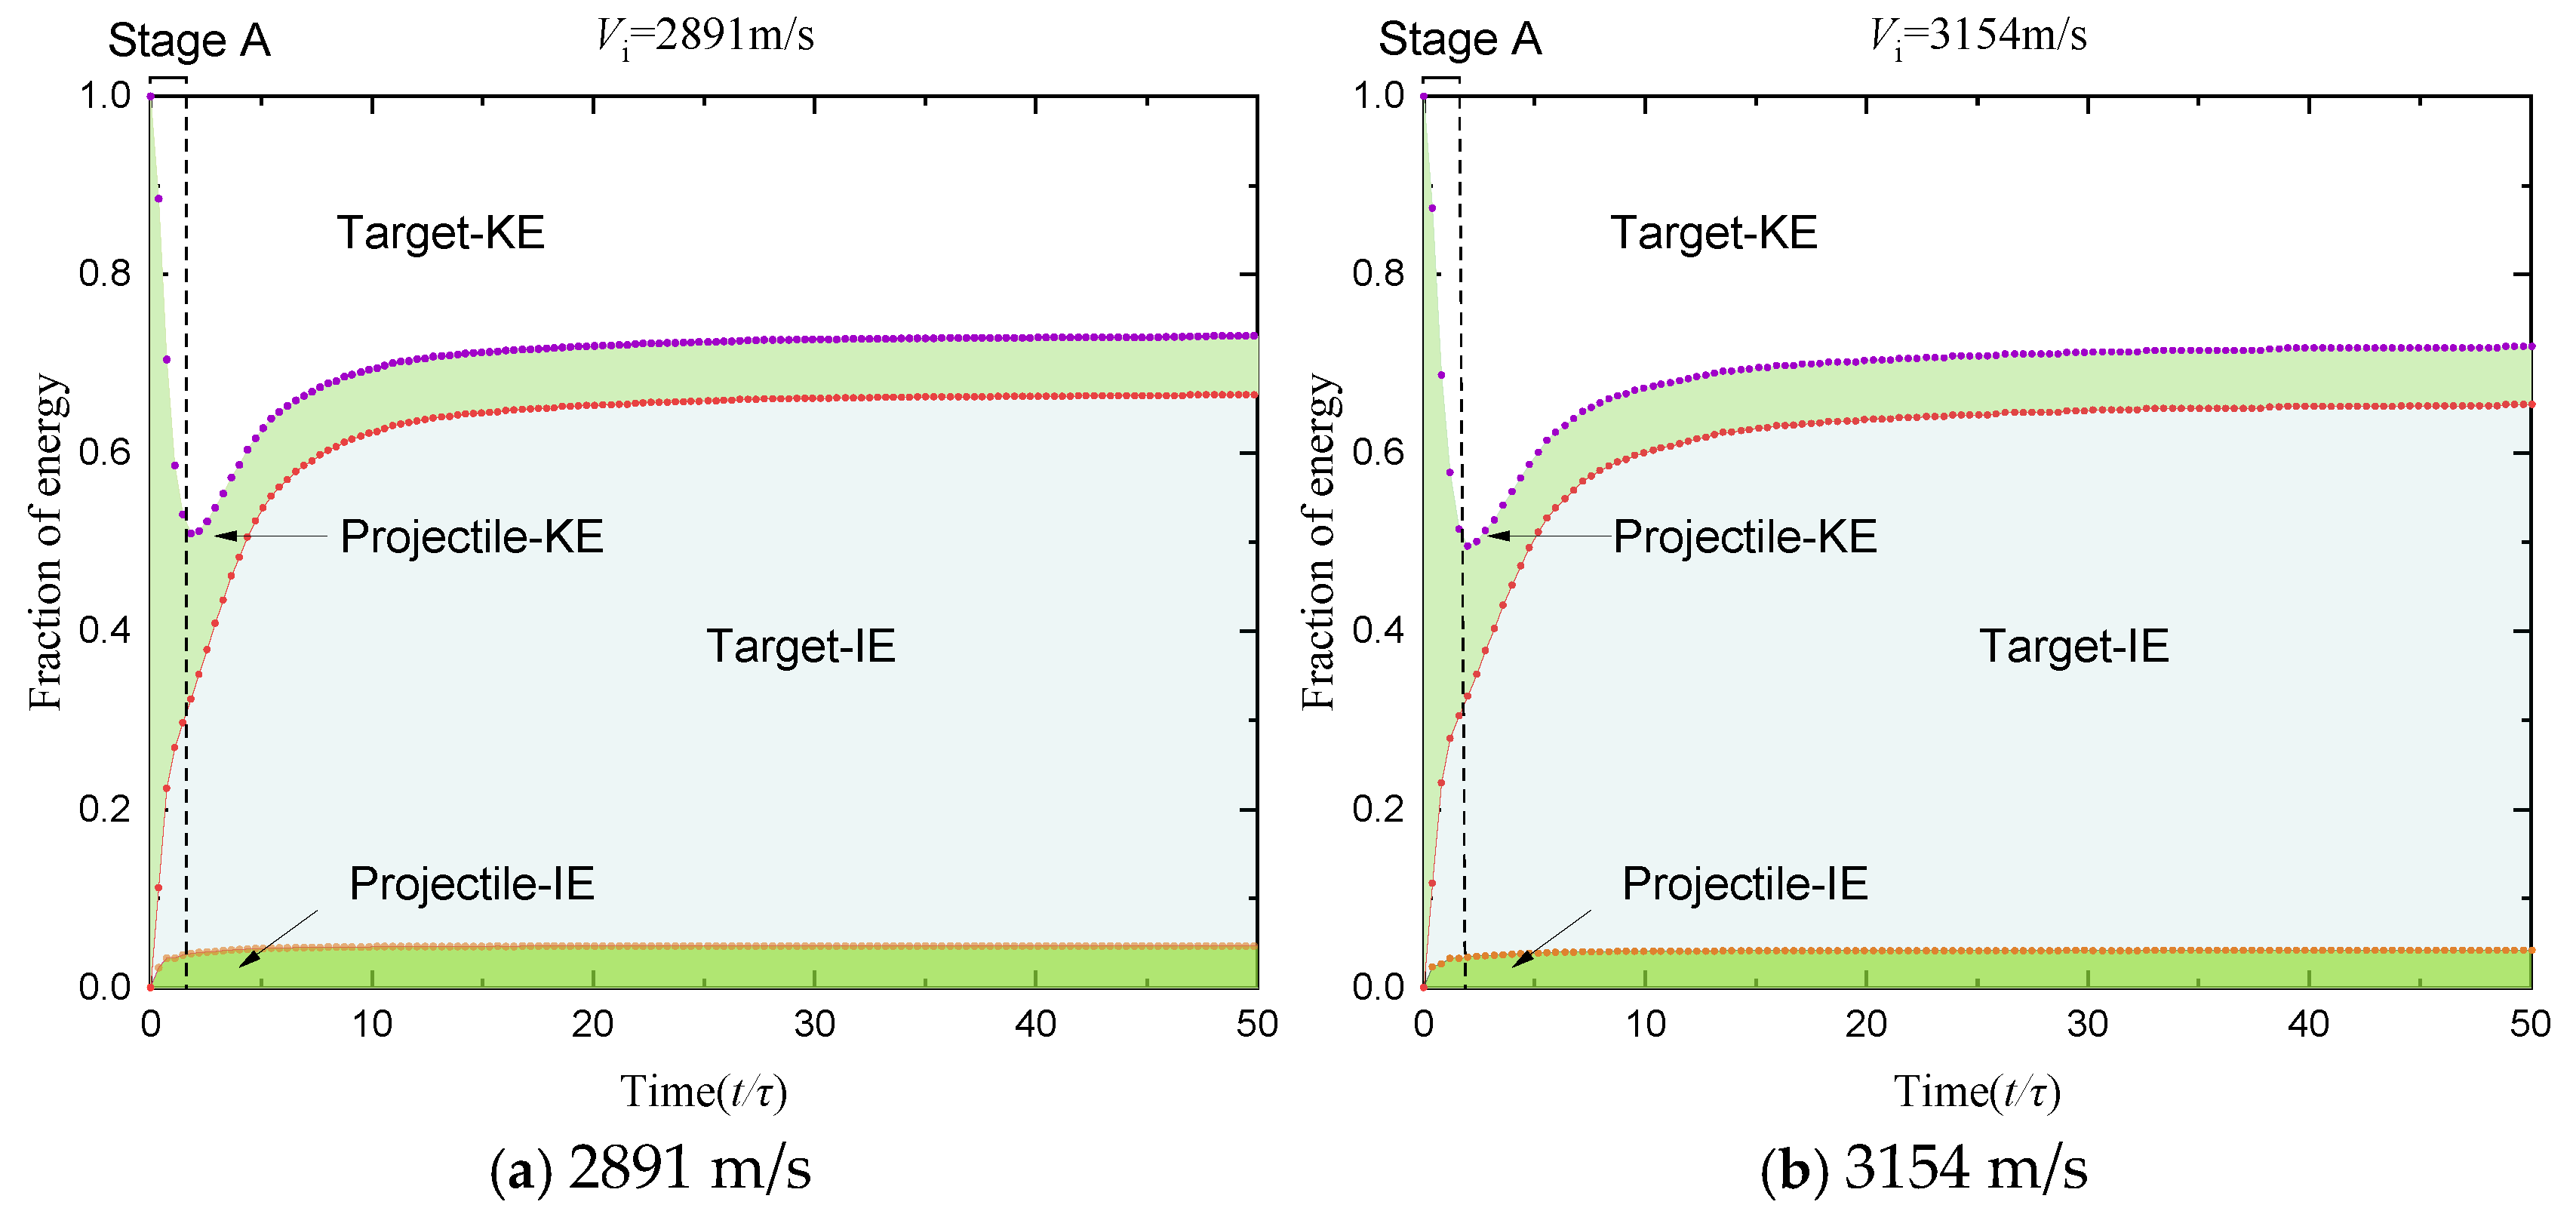
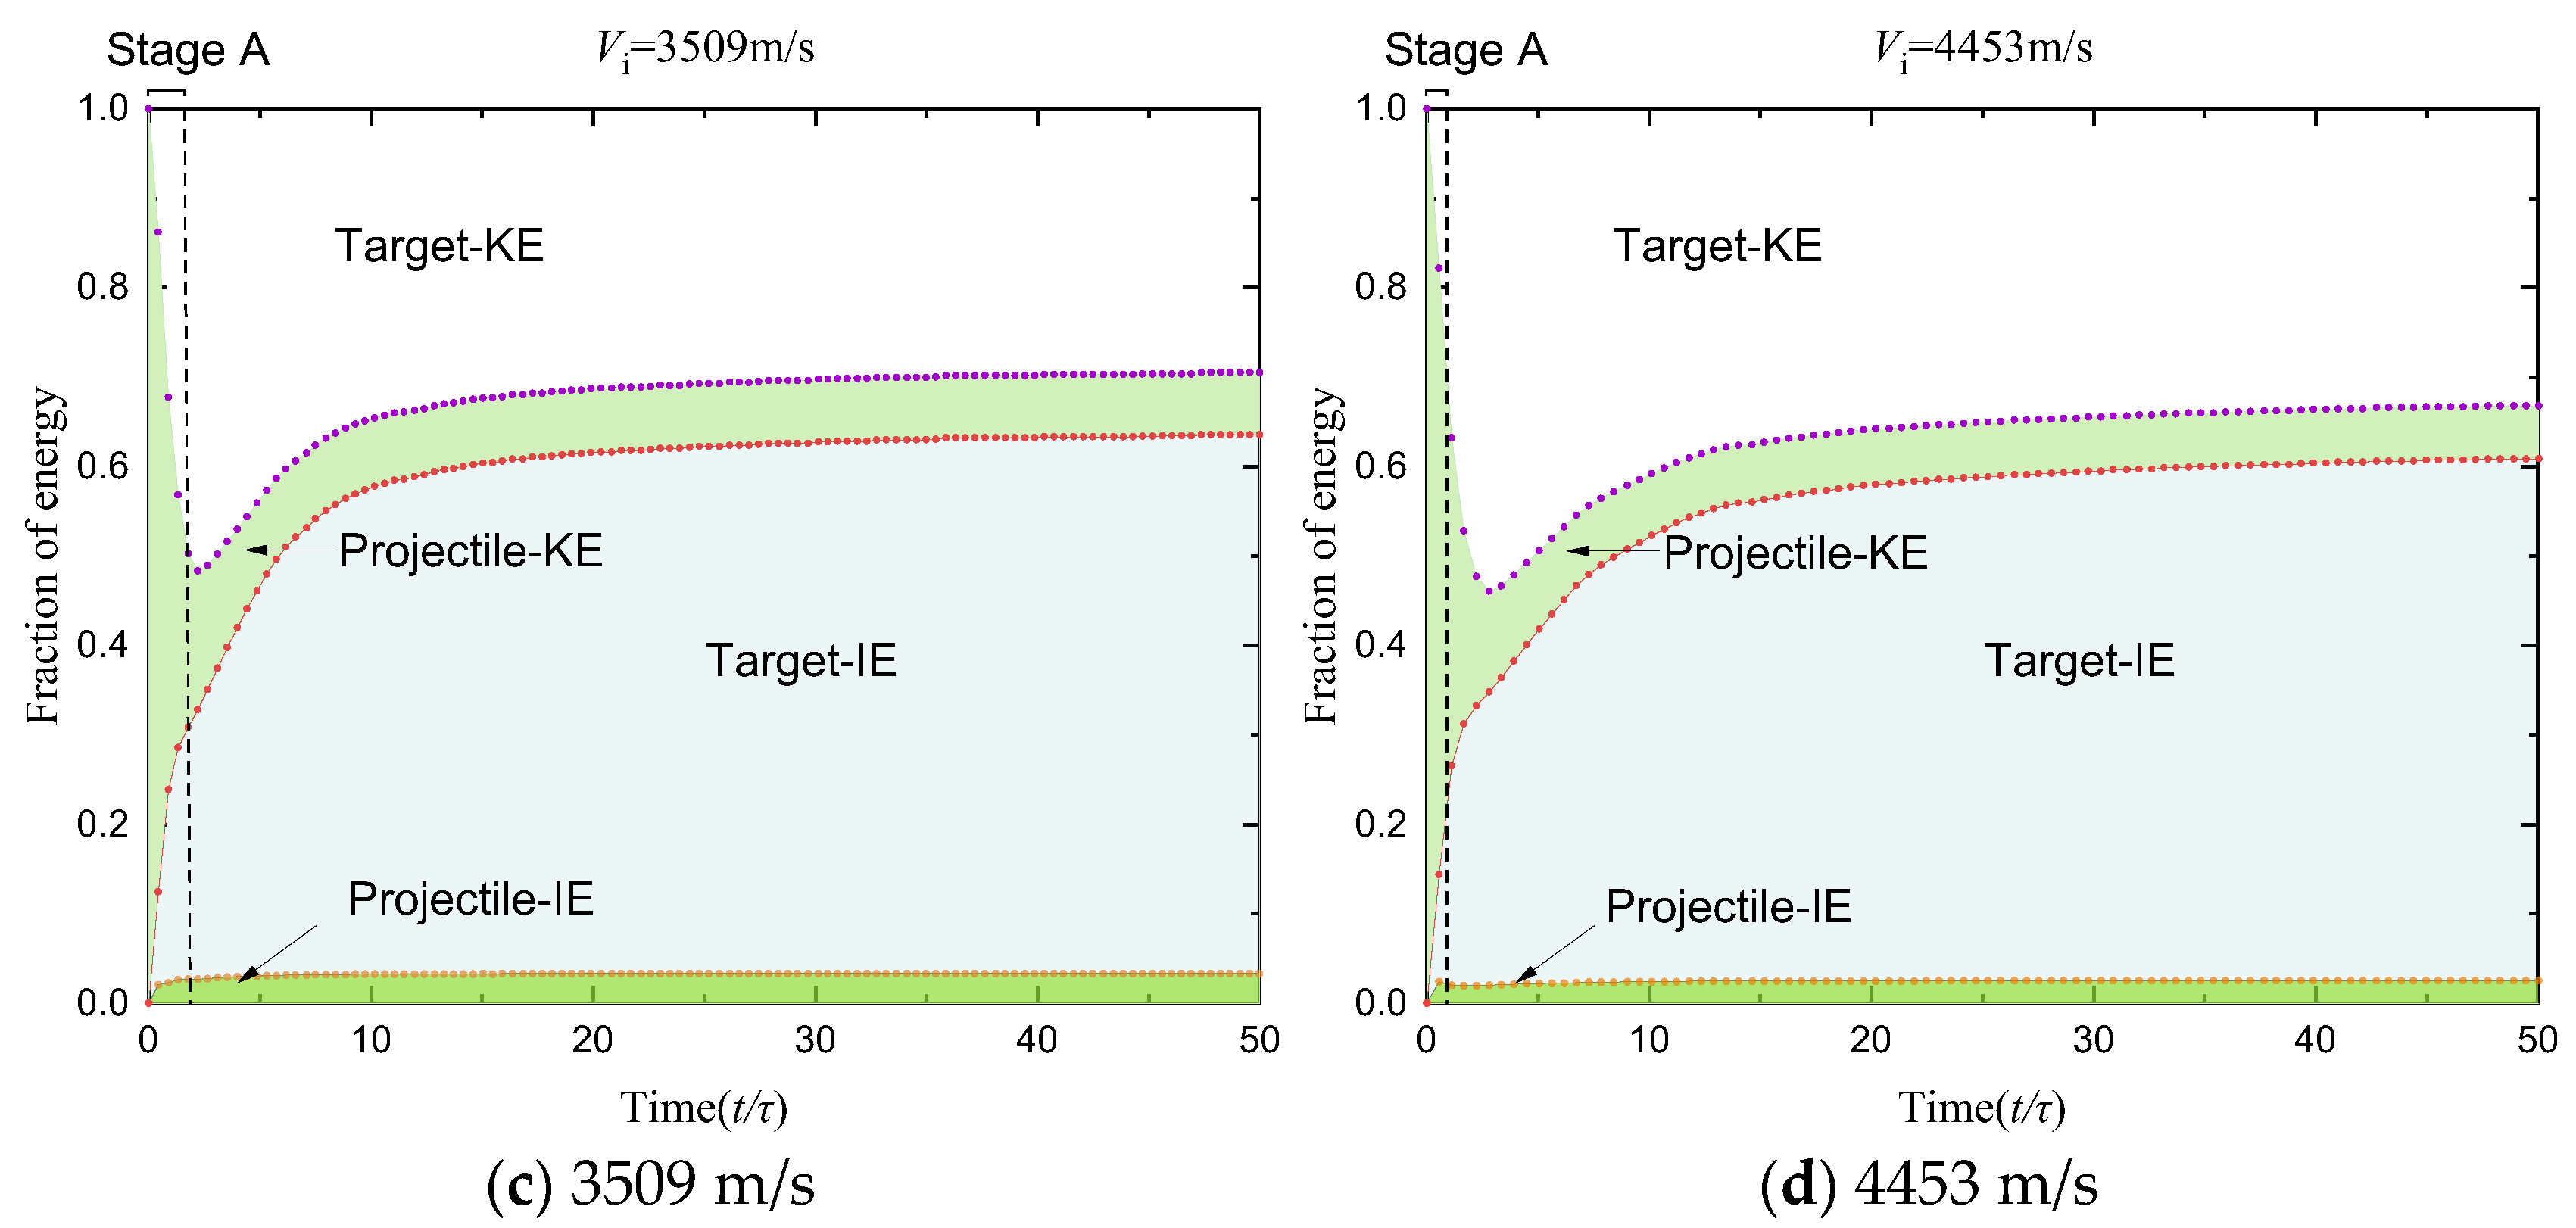
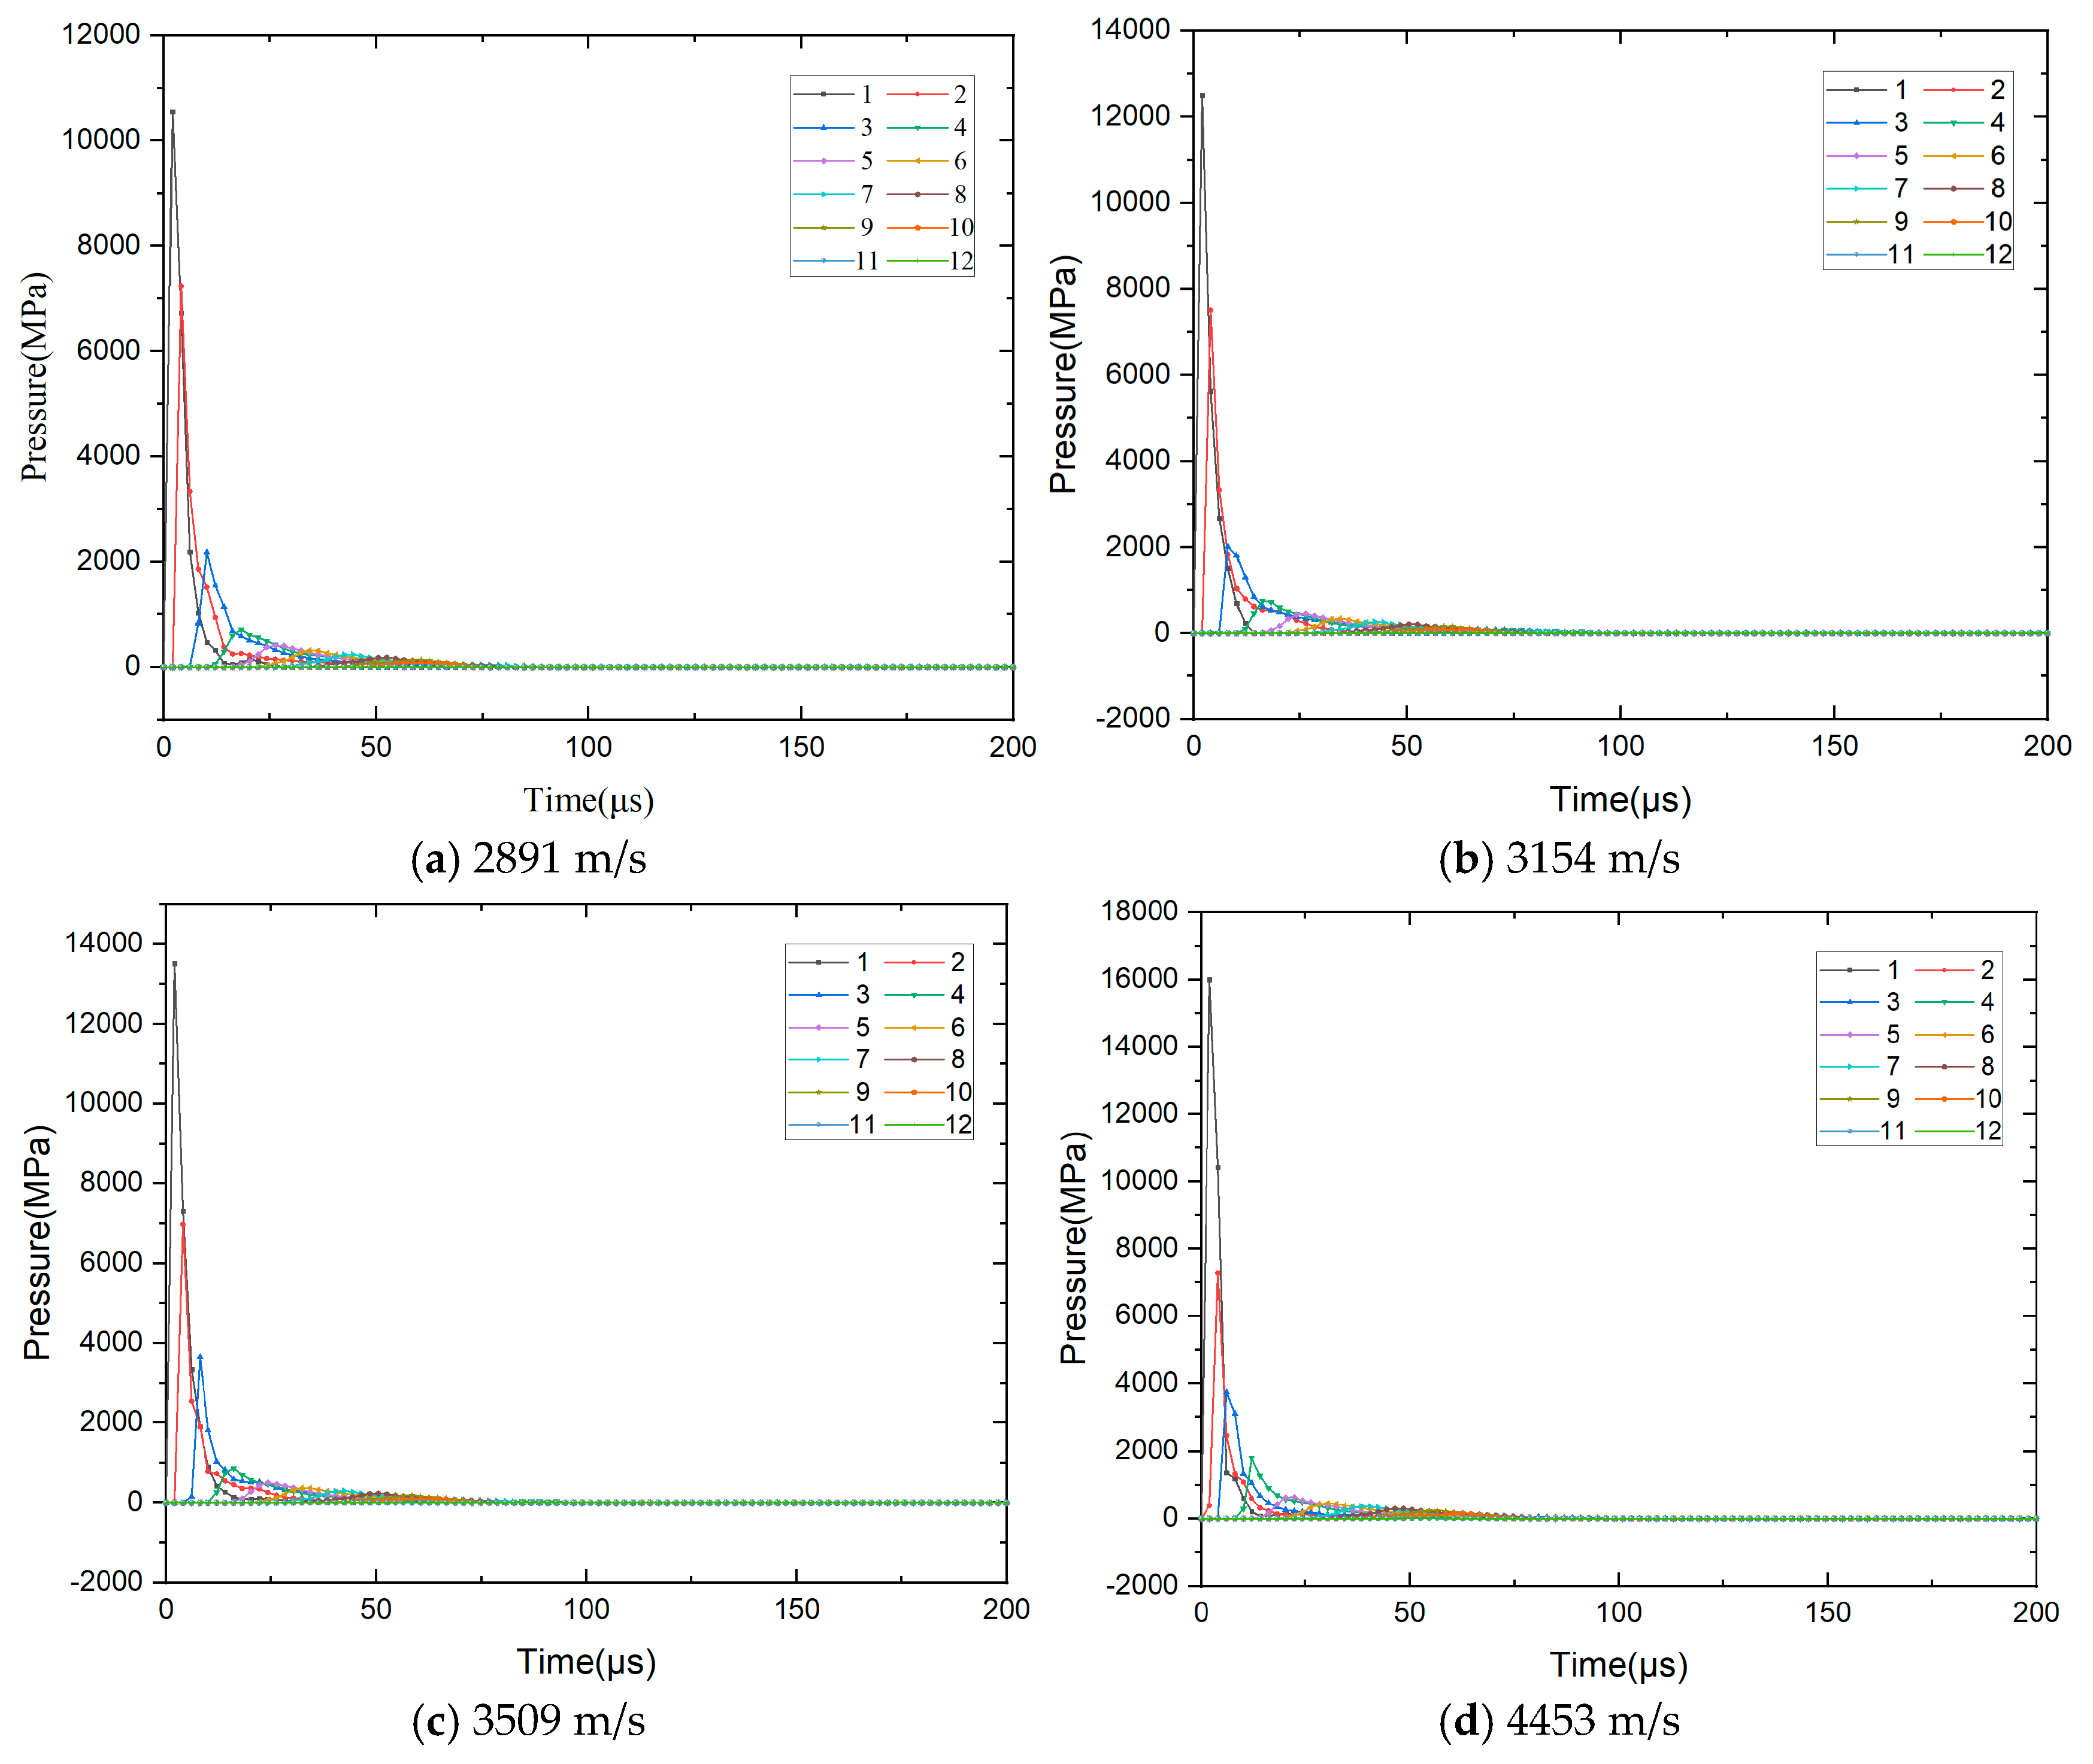
4.2. Simulation Results Analysis

The simulation results are compared with the experimental results under the same circumstances to verify their accuracy, as shown in Figure 5. The simulation and experimental results have equal scaling. At 130 μs, the simulated debris cloud morphology matches experimental observations, exhibiting identical funnel-shaped geometry. The hypervelocity impact formed a crater and debris ejected from the target. The peripheral deformation of the target exhibits velocity-dependent flaring under varying impact velocities. The debris cloud morphology obtained from simulations and experiments is generally consistent.
The SPH-simulated maximum principal stress fields in the central section of the target under varied impact velocities are shown in Figure 6. The red region indicates propagation of the unloading wave, and the central green region corresponds to the stripping area, which is consistent with experimental observations. The energy variation during the hypervelocity impact process was also obtained through numerical simulation, as shown in Figure 7. The ratio of kinetic energy to internal energy can be calculated according to the particle velocity during the contact and compression stage (Stage A). It is found that 50% of the kinetic energy of the projectile was transferred to the target, with a portion converted into internal energy to perform work during expansion, thereby inducing a phase transition. The kinetic energy of the target peaks at the end of the contact and compression stage. The initial decline is attributed to reduced particle velocities during shock wave expansion, but this decline continues as excavation flow velocity decreases. In the subsequent stage (after about 10τ, τ = d/Vi; d is the diameter of the projectile; Vi is the speed of the projectile), the ratio of internal energy to total energy of the projectile stabilizes, with most initial energy transferred to the target.

5. The Shell-Stripping Model

During the impact experiment, regardless of the velocity, large stripping spheres were detached, and their formation process was recorded with an ultra-high-speed camera, as shown in Figure 8b. According to Adriano’s [32] research, asteroid shapes observed in rubble-pile asteroids result from stochastic low-velocity collisions during the impact process. Mass, fragment shapes, and angular momenta collectively govern the stochastic emergence of distinct configurations within each system. Contact binary asteroids may form through gravitational regrouping, and their largest fragments need not occupy the central region of the rubble-pile structure. This phenomenon warrants further investigation to establish a plausible explanation.

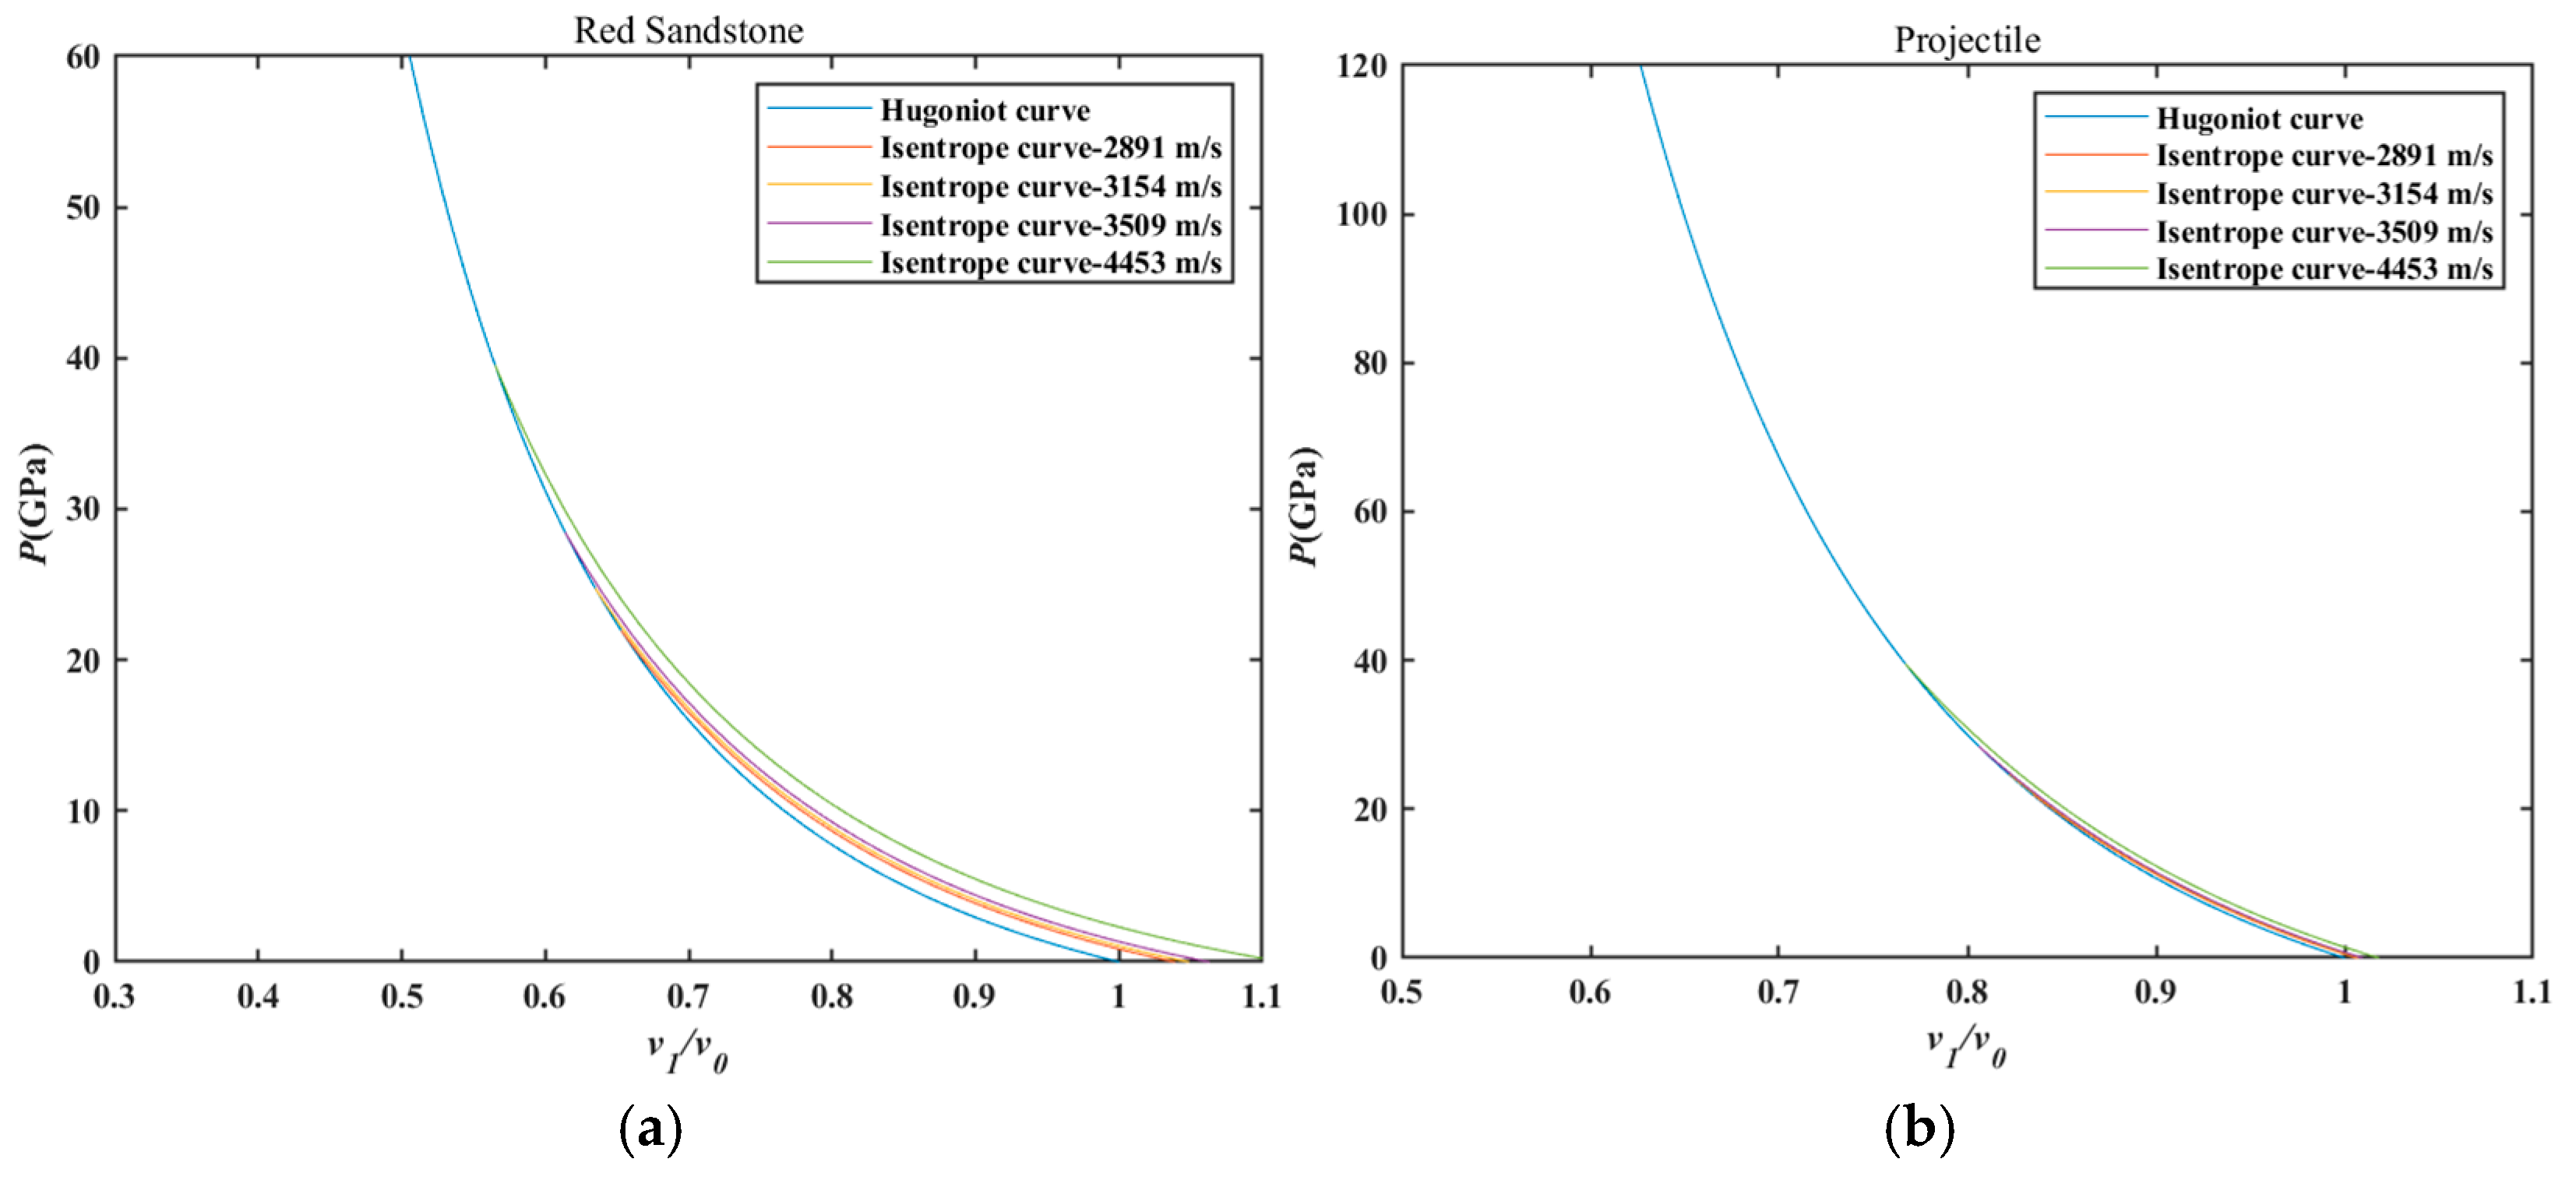
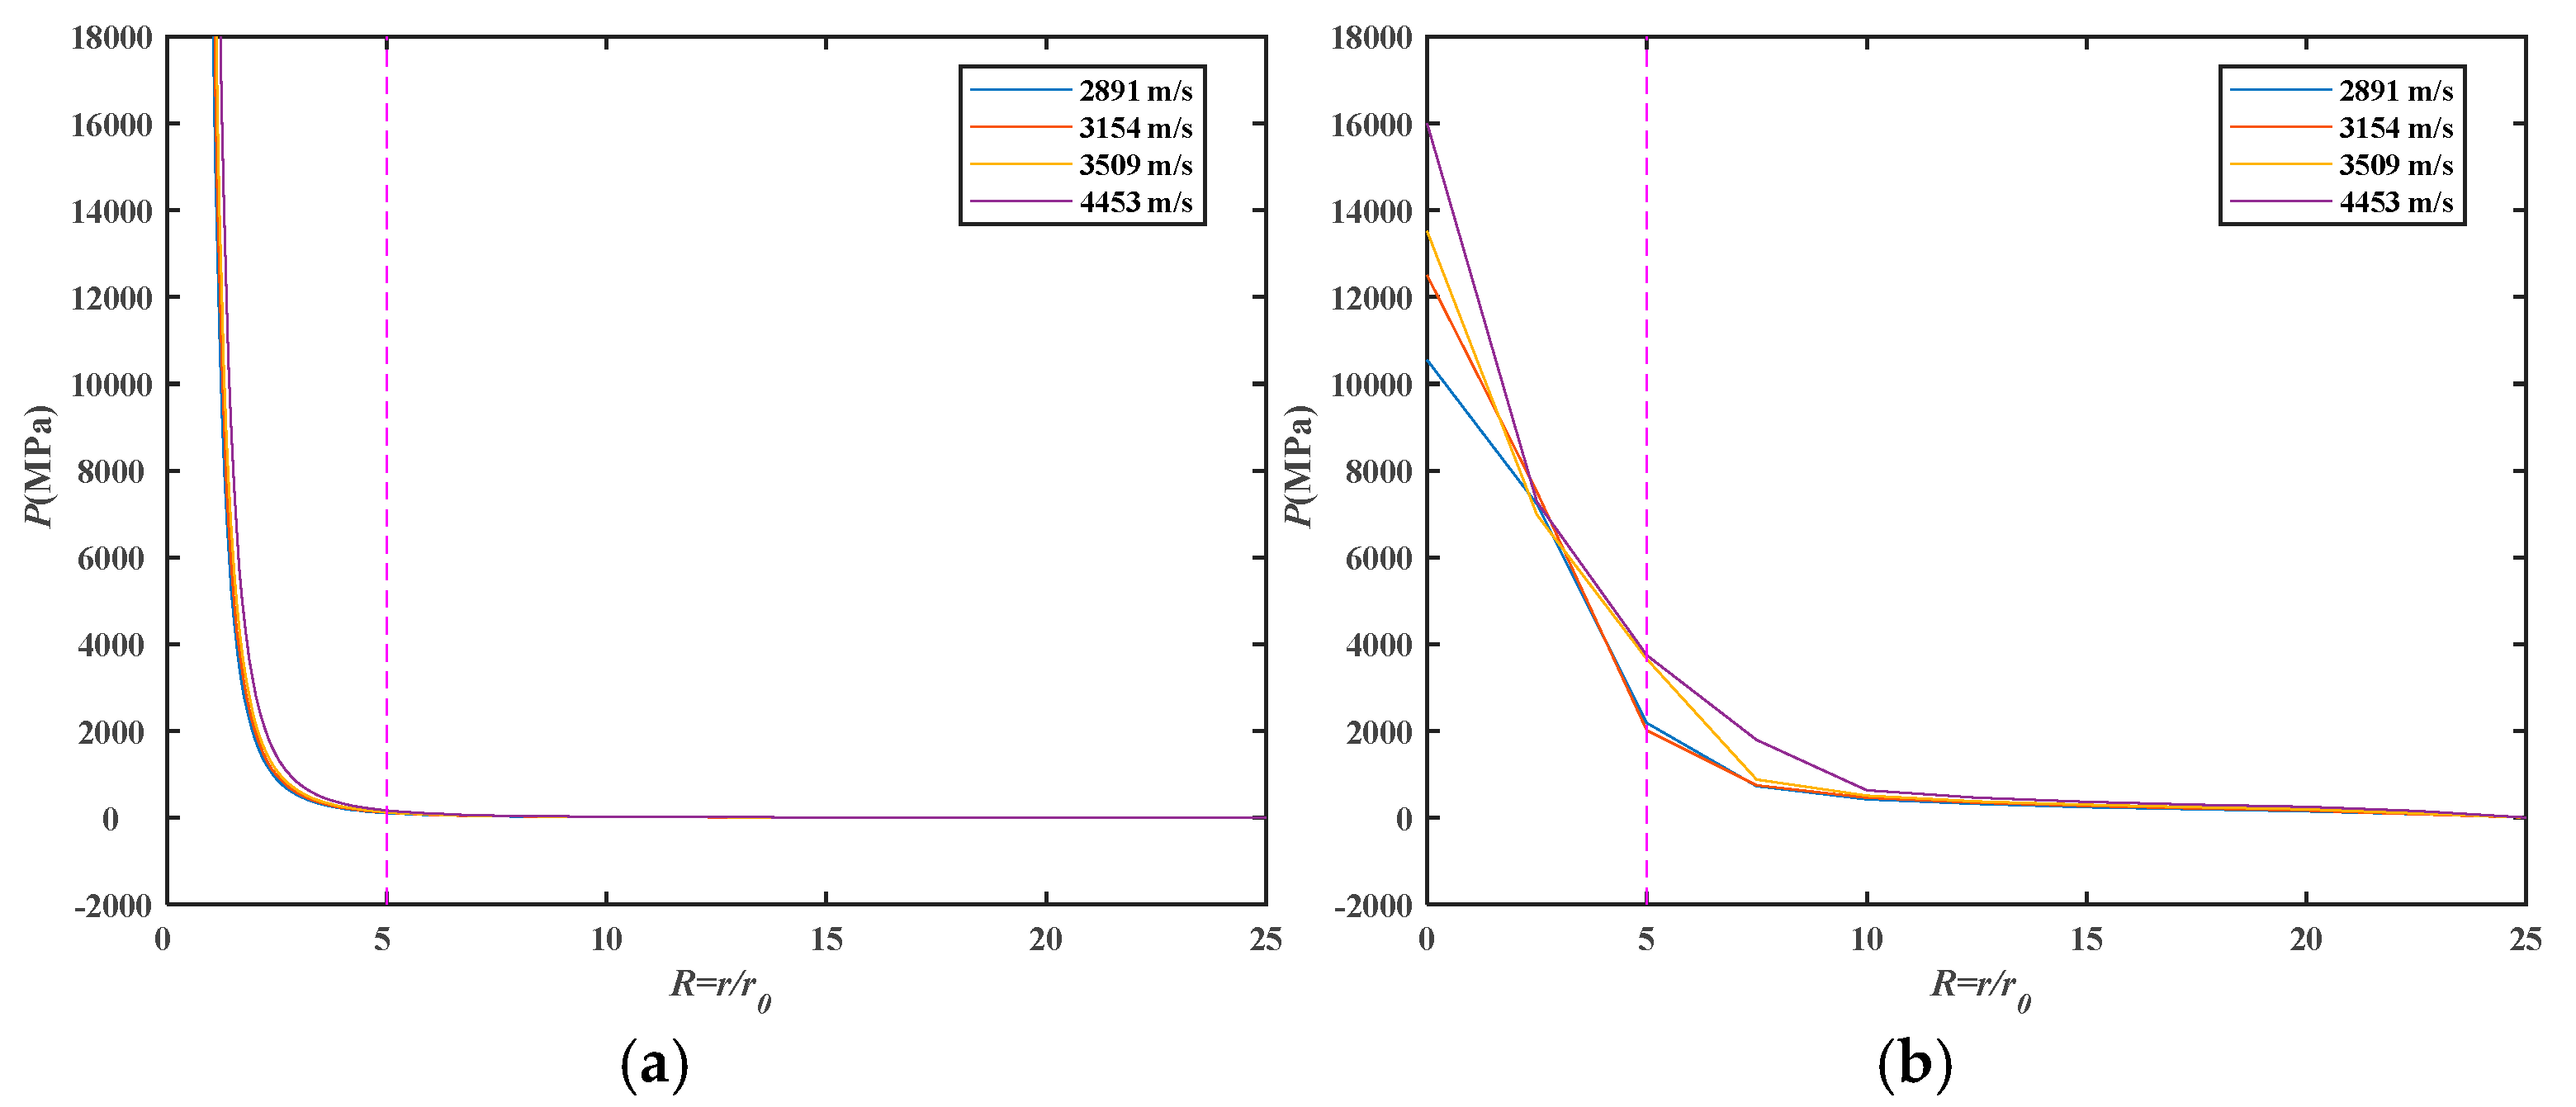
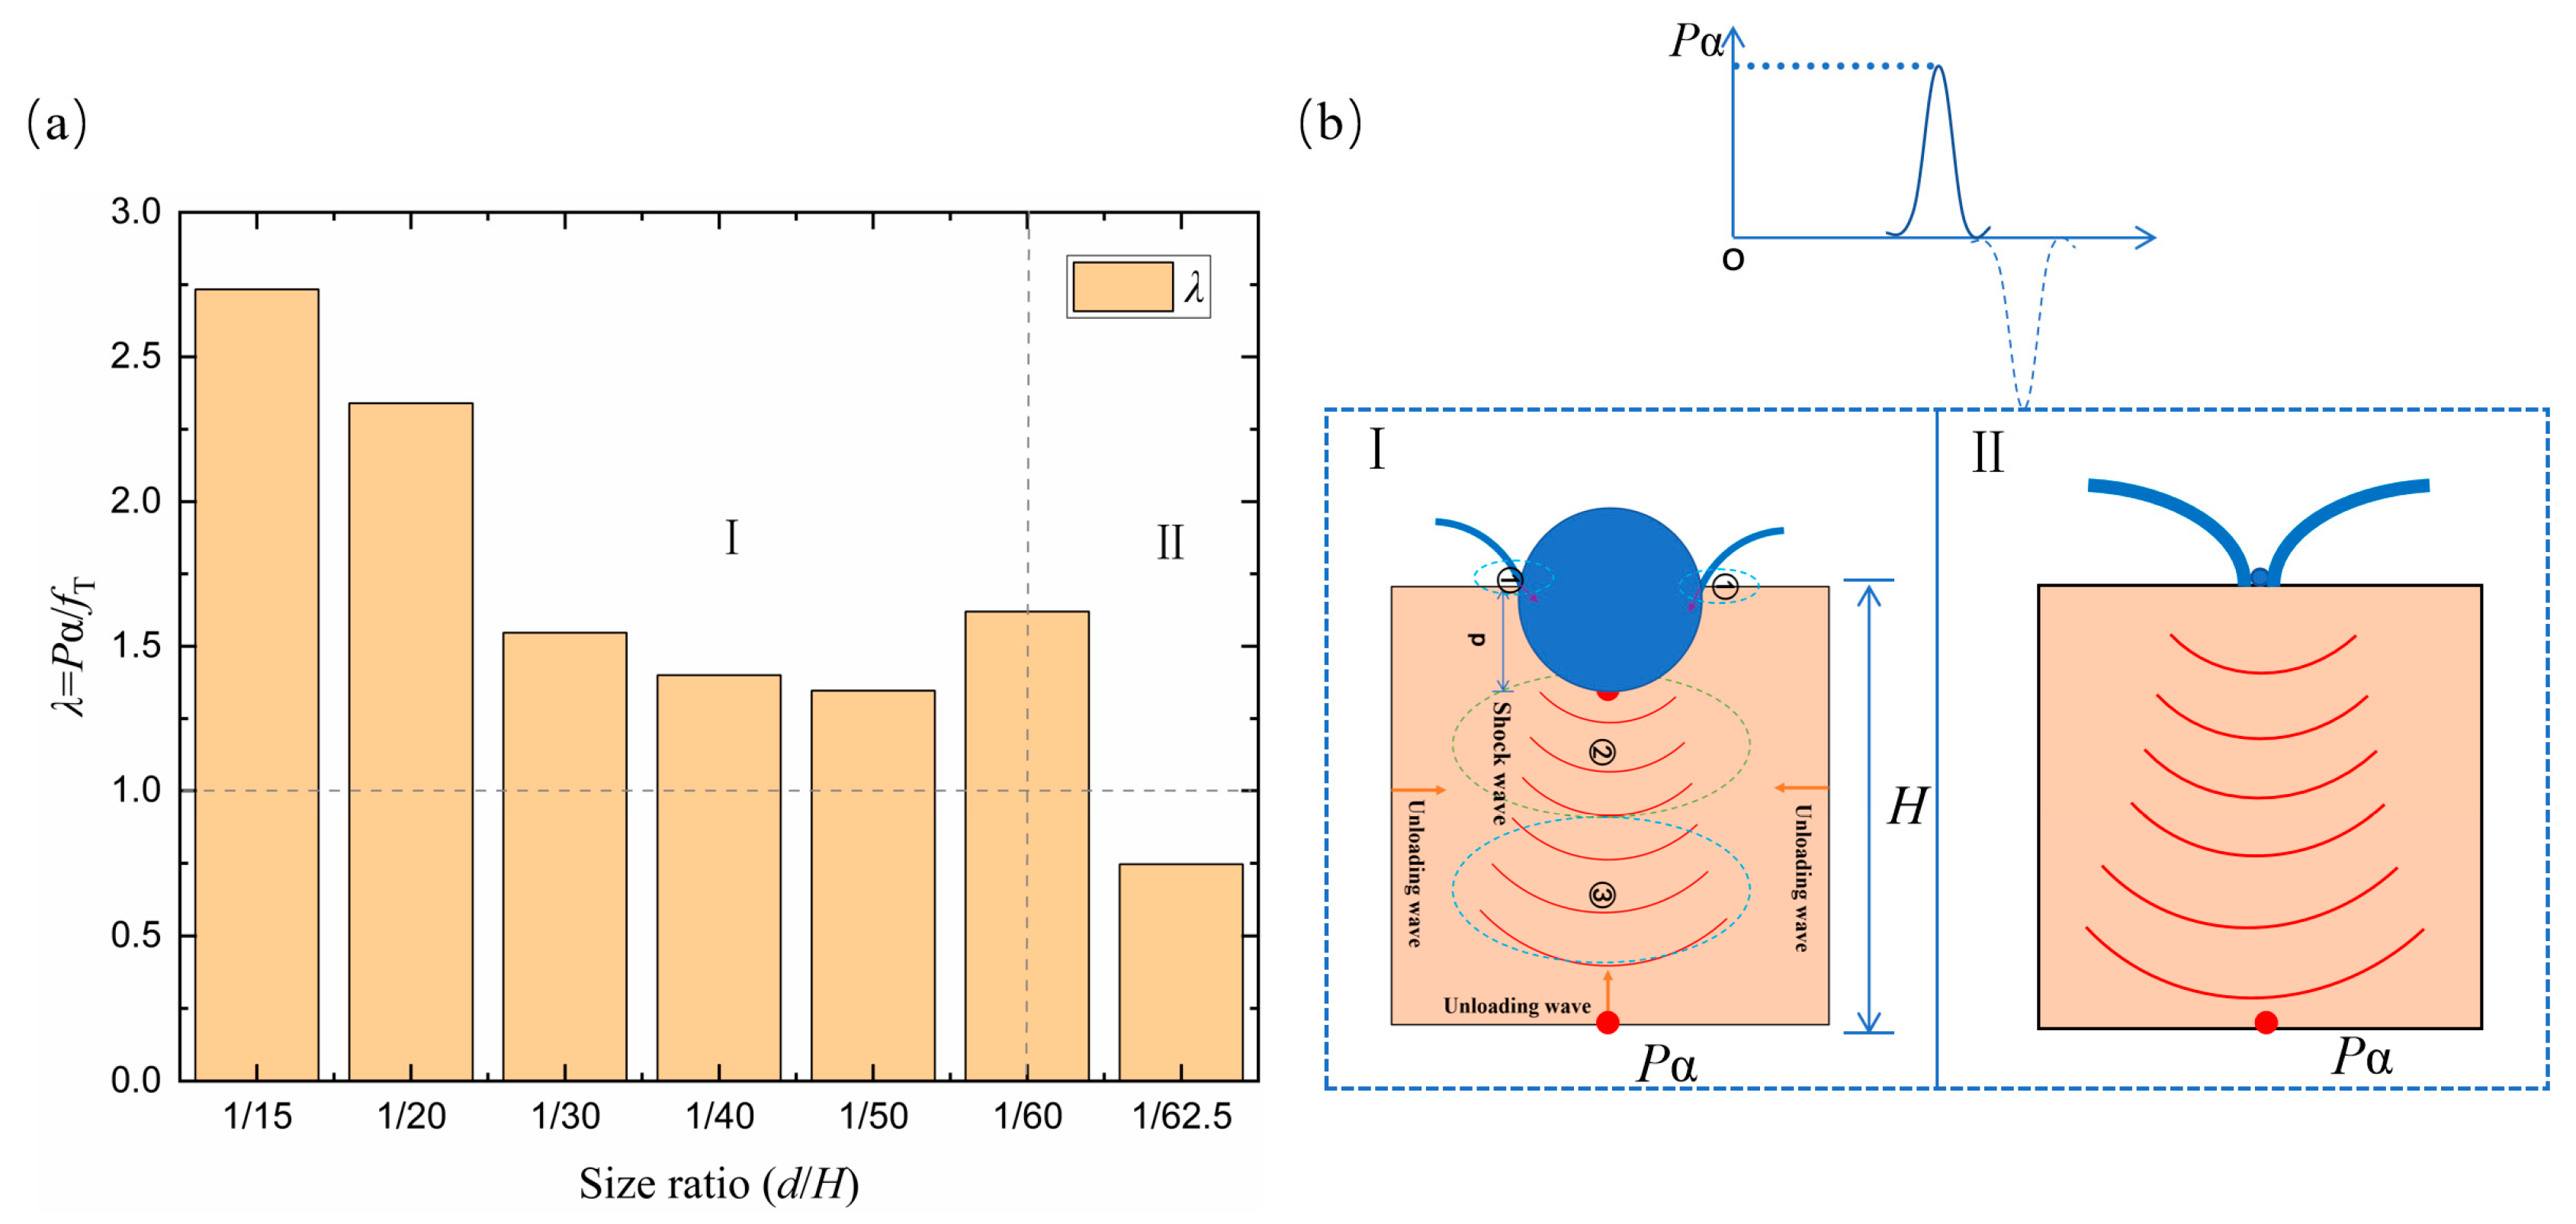
5.1. Shock Wave Attenuation Model

The shock wave accumulated in the initial contact and compression stages of the hypervelocity impact, while the subsequent attenuation stage affects the fragmentation characteristics of materials. An effective shock wave attenuation model was developed by Gault et al. [33]. However, the assumption of spherical (or hemispherical) symmetry inadequately represents near-surface conditions and neglects the effects of the unloading wave from free surfaces, particularly when considering the impact size. This limitation underscores the need for a more accurate attenuation model through simulation. In order to model shock wave theoretical propagation in space, it is assumed that the shock wave exhibits spherically symmetric attenuation originating from a source at depth (p), and r0 represents the radial distance between the uniformly shocked volume and the peak pressure zone. r0 defines a sphere centered at depth p.
While
p ~ 2 ( 2 r 0 m U s , p ) u t
Us,p is the shock wave velocity of the projectile; ut is the target particle velocity; r0m is the radius of the projectile; and the initial radius of energy deposition in the target is denoted as r0t.
The shock wave attenuation model has several basic assumptions. Shock wave accumulation is completed at a specific depth. The energy transferred to the target during the shock stage is uniformly distributed in a compressed sphere behind the shock wave at any time. Without considering the real representation of near-surface conditions, the unloading wave influence from the free surface is not considered.
Then, the total energy in the system ET is the sum of the kinetic and internal energies:
E τ = 4 3 π r 3 P 1 P n K 0 + 1 1 / n
The differential energy dET for a small radius change dr is
d E T d r = 4 π r 2 1 P n K 0 + 1 1 / n P + r 3 d P d r + 4 3 π r 3 P K 0 P n K 0 + 1 1 ( 1 / n ) d P d r
The internal energy regained during isentropic expansion is given under a release adiabat, with specific waste heat ΔEw defined as
E w = 1 2 P ( V 0 V ) V 0 ν P d V
Then,
V 0 ν P d V = K 0 n 1 ( 1 n ) [ V 0 1 P n K 0 + 1 1 ( 1 / n ) + V 0 ( 1 n ) P n K 0 + 1 1 / n ( 1 n ) V 0 ]
Therefore
E w = 1 2 P V 0 2 K 0 V 0 n 1 P n K 0 + 1 1 / n + K 0 V 0 n ( 1 n ) 1 P n K 0 + 1 1 ( 1 / n )
d E w d r = 4 π ρ 0 r 2 1 2 P V 0 2 K 0 n V 0 1 P n K 0 + 1 1 / n + K 0 V 0 n ( 1 n ) 1 P n K 0 + 1 1 ( 1 / n )
Equating (3) and (7):
d X d R = 3 2 X + 3 2 X ( X n + 1 ) 1 / n + 1 n 1 n ( X n + 1 ) 1 / n + 1 n ( 1 n ) [ ( n X + 1 ) 1 ( 1 / n ) 1 ] R 3 [ 1 ( n X + 1 ) 1 / n + X ( n X + 1 ) 1 ( 1 / n ) ] 1
Specify the initial value X = P/K0 (representing X0) at any initial value of R= r/r0 (R0). K0 is adiabatic bulk modulus, and n is adiabatic bulk modulus derivative. P0 is the initial pressure, calculated by Hugoniot curve, and V0 = 1/ρ0. Here all properties refer to target properties, so the subscript t, as in ρt, is dropped.
Then the equation can be numerically integrated to obtain the dimensionless attenuation law during the impact process, as shown in Figure 9a. However, due to the size effect of the target, the shock wave produces an unloading wave that catches up with the shock surface during the unloading process. It is necessary to determine the unloading pressure, considering the sparse wave produced under the simulation conditions. The unloading pressure was simulated by taking one SPH particle every ten particles in the impact direction and connecting its pressure into a curve. It can be seen that, at R = 5 to the left, the shock wave attenuation pressure calculated theoretically is greater than that of SPH simulation and then tends to be stable when R > 5.
The temporal shock wave attenuation in the impact direction obtained by simulation is shown in Figure 10. According to the peak pressure decay profile, the diameter of the stripping spheres can be roughly estimated as illustrated in Appendix AFigure A2. The dimensionless mass/size of stripping balls obtained by experiments/simulations is shown in Figure 11. It is indicated that impact velocity correlates inversely with residual spall diameter. Such an unloading of shock waves is an important cause of stripping failure.

5.2. Shock Wave Stripping Model

During HVI penetration, the contact zone experienced extreme temperature and pressure upon the initial collision. An intense shockwave was generated at the projectile–target interface, propagating through both materials. Regions ② and ③ in Figure 12 represent shock waves. HVI-induced shock pressures, ranging from 21.95 GPa to 39.62 GPa, were derived from Hugoniot curve analysis during the initial impact stages and far exceed the yield strengths of the projectile and the target. The unloading wave reflected at the lateral boundary of the projectile–target contact interface induced jet ejection. The unloading wave is represented by purple arrows in Figure 12. Shock attenuation modeling initiated when the projectile reached depth p (defined in the approximate model), with initial conditions established at this position, whereas the SPH simulations were carried out along the impact path directly. The area above point p is the cavity-crushing area. Spatial pressure decay in the shock wave is quantified by simulation based on the shock wave attenuation model. Appendix AFigure A2 shows the concentric contours characterizing the spatial distribution of shock waves calculated from shock attenuation positions at different velocities of the target.
Due to the limited size of the target, the shock attenuation transmitted to the lateral surface and the lower surface will produce an unloading wave. The dynamic compressive strength of sandstone is generally 60–200 MPa, and the tensile strength is generally about 1.5 MPa [34,35,36]. Region ② is a high-compression area, and the target is broken and debris splashes from here. The results indicate that the shock pressure in region ③ remains subcritical to sandstone’s compressive strength, while the lower surface edge transfer of shock pressure to an unloading wave can generally reach the tensile strength of sandstone. The interaction of the compression wave and the unloading wave leads to a sphere-stripping effect in region ③. At the same time, tensile cross cracks will also occur in target region ④, as shown in Figure 3.
To investigate the scaling effects of projectile/target dimensions on failure characteristics, the HVI of different projectile body and target sizes were simulated at 3000 m/s. λ is defined as the ratio of the peak shock pressure at the target’s backside center (red dot in Figure 13b) to the tensile strength of the target. λ = Pα/fT, where Pα is the peak shock pressure at the center of the back of the target, and fT is the tensile strength of the target. The peak pressure at this position corresponds to the pressure rise from the shock wave’s initial arrival at the interface, with subsequent unloading initiating at this peak. It is the obvious difference between the compressive strength and the tensile strength of sandstone that induces size-dependent fracture mechanisms in HVI failure. Variation of ratio λ with the size ratio is obtained, as shown in Figure 13. λ decreases as the size ratio reduces, falling below 1 beyond a critical threshold. This indicates that shock unloading at such ratios will not lead to tensile failure generation, consistent with the semi-infinite target impact response. λ greater than 1 will produce damage in region ③, in the pattern shown in Figure 12. The damage to the target can be classified into Class I or Class II damage, according to variation in λ. Class I failure features the stripping effect, with retention of large, spherical fragments. Class II failure features traditional cratering and crushing, which generally occurs in the case of large target size and is consistent with the impact effect of a semi-infinite target.

6. Conclusions

In this paper, experiments and simulations of HVI of aluminum spheres on sandstone were conducted, and a stripping phenomenon under specific dimensional impacts was found. The spatial shock pressure attenuation model clarified distinct regional failure mechanisms in the target, incorporating unloading wave effects on peak pressure. The significant disparity between sandstone’s compressive and tensile strengths drives the combined effect of shock compression and unloading wave tension, inducing a regional shell-stripping phenomenon. We establish a quantitative framework for HVI-induced size effects governing damage assessment. Parameter λ was defined to distinguish two forms of destruction, Class I (stripping-dominated) and Class II (cratering-dominated). The size effect on the failure phenomenon of rock subjected to shock waves is worthy of attention. This research also provides a valuable reference for understanding the evolution and formation mechanisms of binary asteroids.

Author Contributions

Y.L. (Yizhe Liu): conceptualization, methodology, investigation, writing—original draft, writing—review and editing. Q.J.: conceptualization, methodology, investigation, validation. Z.L.: conceptualization, methodology, formal analysis, writing––review and editing. M.J.: methodology, investigation. Y.L. (Yadong Li): investigation. Z.C.: conceptualization, validation, methodology, resources, writing—review and editing. K.Z.: conceptualization, resources, writing—review and editing. B.W.: conceptualization, validation, supervision, funding acquisition, resources, writing—review and editing. All authors have read and agreed to the published version of the manuscript.

Funding

This work was supported by the National Natural Science Foundation of China (Grant No. 12272392, No. 11790292), the Strategic Priority Research Program of the Chinese Academy of Sciences (Grant No. XDB0620301), the Youth Innovation Promotion Association of the Chinese Academy of Sciences (No. 2022020), and the Yip Kee Sun Foundation (Grant No. U2441207).

Data Availability Statement

Data will be made available on request.

Conflicts of Interest

The authors declare that they have no known competing financial interests or personal relationships that could have appeared to influence the work reported in this paper.

Abbreviations

The following abbreviations are used in this manuscript:
DARTDouble asteroid redirection test
HVIHypervelocity impact
HJCHolmquist–Johnson–Cook
JCJohnson–Cook
MPCMinor Planet Center
NEAsNear-Earth asteroids
PHOsPotentially hazardous objects
PVDFPolyvinylidene fluoride
SPHSmoothed particle hydrodynamics

Appendix A. Initial Pressure Values for Theoretical Attenuation

To establish the initial shock pressure of theoretical attenuation, it is necessary to establish a theoretical model of shock wave loading and unloading of the projectile target firstly. The material parameters required for the theoretical calculation of projectile materials and sandstone are shown in Table A1. The impact-loading process of the projectile and target satisfies the impact compression line of the material (generally represented as a Hugoniot curve), assuming that the wave front is stationary [18].
p ( v ) = p H ( v ) = ρ 0 c 0 2 ( 1 v / v 0 ) 1 s ( 1 v / v 0 ) 2
When a projectile with velocity W impacts the target, a shock wave in the opposite direction is generated in the projectile and target simultaneously. Before impact, the particle velocity of the projectile is W, the pressure of the projectile and the target plate is 0, and the density is the normal value. After the impact, a shock wave in the same direction as the velocity of the projectile is generated in the target plate, in which the velocity is D2, the velocity of the particle behind the wave is u2, and the pressure is P2. The target deformation zone is between the collision plane and the shock wave front. At the same time, a shock wave is generated in the opposite direction of velocity W, for which the velocity is D1 and the particle velocity is u1 in the deformation zone of the projectile, with pressure being P1. In the region not reached by the shock wave, the velocity is still W. Relative to a stationary observer, the actual velocity of the particle behind the wave is Wu1, while that of the shock wave is −D1 + W. The impact surface is the contact discontinuity surface, so the pressures in the projectile and in the target plate after collision are equal. According to continuous particle normal velocity:
p 1 = p 2 = p H W u 1 = u 2 = u H
Using the shock wave relation:
p 2 = ρ 02 D 2 u H D 2 = c 02 + s 2 u H
For the projectile:
D 1 = c 01 + s 1 u 1 = c 01 + s 1 ( W u H )   p 1 = ρ 01 D 1 u 1 = ρ 01 c 01 + s 1 ( W u H ) ( W u H )
The combined equation for u H :
u H = B + B 2 4 A C 2 A
While
A = ρ 02 s 2 ρ 01 s 1 B = ρ 02 c 02 + ρ 01 c 01 + 2 ρ 01 s 1 W C = ρ 01 W ( c 01 + s 1 W )
The impact pressure pH during the collision process of the projectile target is obtained by introducing the pressure relation. The calculation results under different working conditions are shown in Table A2.
When the shock wave propagates to the free surface, it reflects an unloading wave after interacting with the free surface. The compressed solid expands, with pressure in the solid dropping to zero, and the free surface gains additional velocity in the original direction of motion. The unloading process is an isentropic expansion process. Based on the shock compression line, the differential equation of the isentropic line is obtained by using the thermodynamic relation [18,37,38].
d p S d v + p s γ G v [ 1 ( v γ G ) 2 d d v ( γ G v ) ] = p H γ G v [ 1 2 ( v γ G ) 2 d d v ( γ G v ) ] + d p H d v [ 1 1 2 γ G v ( v 0 v ) ]
Simplifying the equation:
d p S d v + γ 0 v 0 p S = 1 2 γ 0 v 0 p H + 1 1 2 γ 0 v 0 ( v 0 v ) d p H d v
The lines of the projectile body and target are shown in Figure A1. When the shock wave reaches the free surface, it reflects the unloading wave R, and the pressure of material near the free surface decreases from pH to 0. At the same time, the particle velocity is superimposed on the basis of u H to a velocity increment u R caused by unloading waves. Using the Riemannian invariant along the isentropic line:
u R = v ( p = p H ) v ( p = 0 ) p v s 1 / 2 d v
Figure A1. (a) Hugoniot curve and isentropic curve of red sandstone; (b) Hugoniot curve and isentropic curve of the projectile.
Aerospace 12 00534 g0a1
Table A1. Material parameters required for theoretical calculation [39,40,41,42].
Materialsρ0 (g/cm3)s1γ0K0 (GPa)n
Al60612.775.3861.97--
sandstone2.51.14118.54.72
ρ0 is the material density; s1 and γ0 are the Hugoniot parameters of the material; K0 is the thermal insulation volume modulus of the material; n is the adiabatic–bulk modulus derivative.
Table A2. Particle velocity calculation of material impact loading and isentropic unloading.
vp (m/s)pH (GPa)UPp (km/s)UPt (km/s)URP (km/s)URt (km/s)
289121.951.151.751.131.64
315424.651.261.891.251.76
350928.471.412.101.361.94
445339.621.832.631.712.39
vp is the impact velocity; pH is the impact pressure; UPp is the projectile particle velocity; UPt is the target particle velocity; URP is the projectile isentropic unloading velocity; URt is the target isentropic unloading velocity.
Figure A2. Spatial distribution of shock wave attenuation during sandstone impact in the simulation. (The blue dashed line represents the size boundary of sandstone, and the junction with the concentric circle area represents the shock wave unloading here. The brown circles represent rough estimates of stripping ball sizes based on sandstone strength.).
Aerospace 12 00534 g0a2aAerospace 12 00534 g0a2b

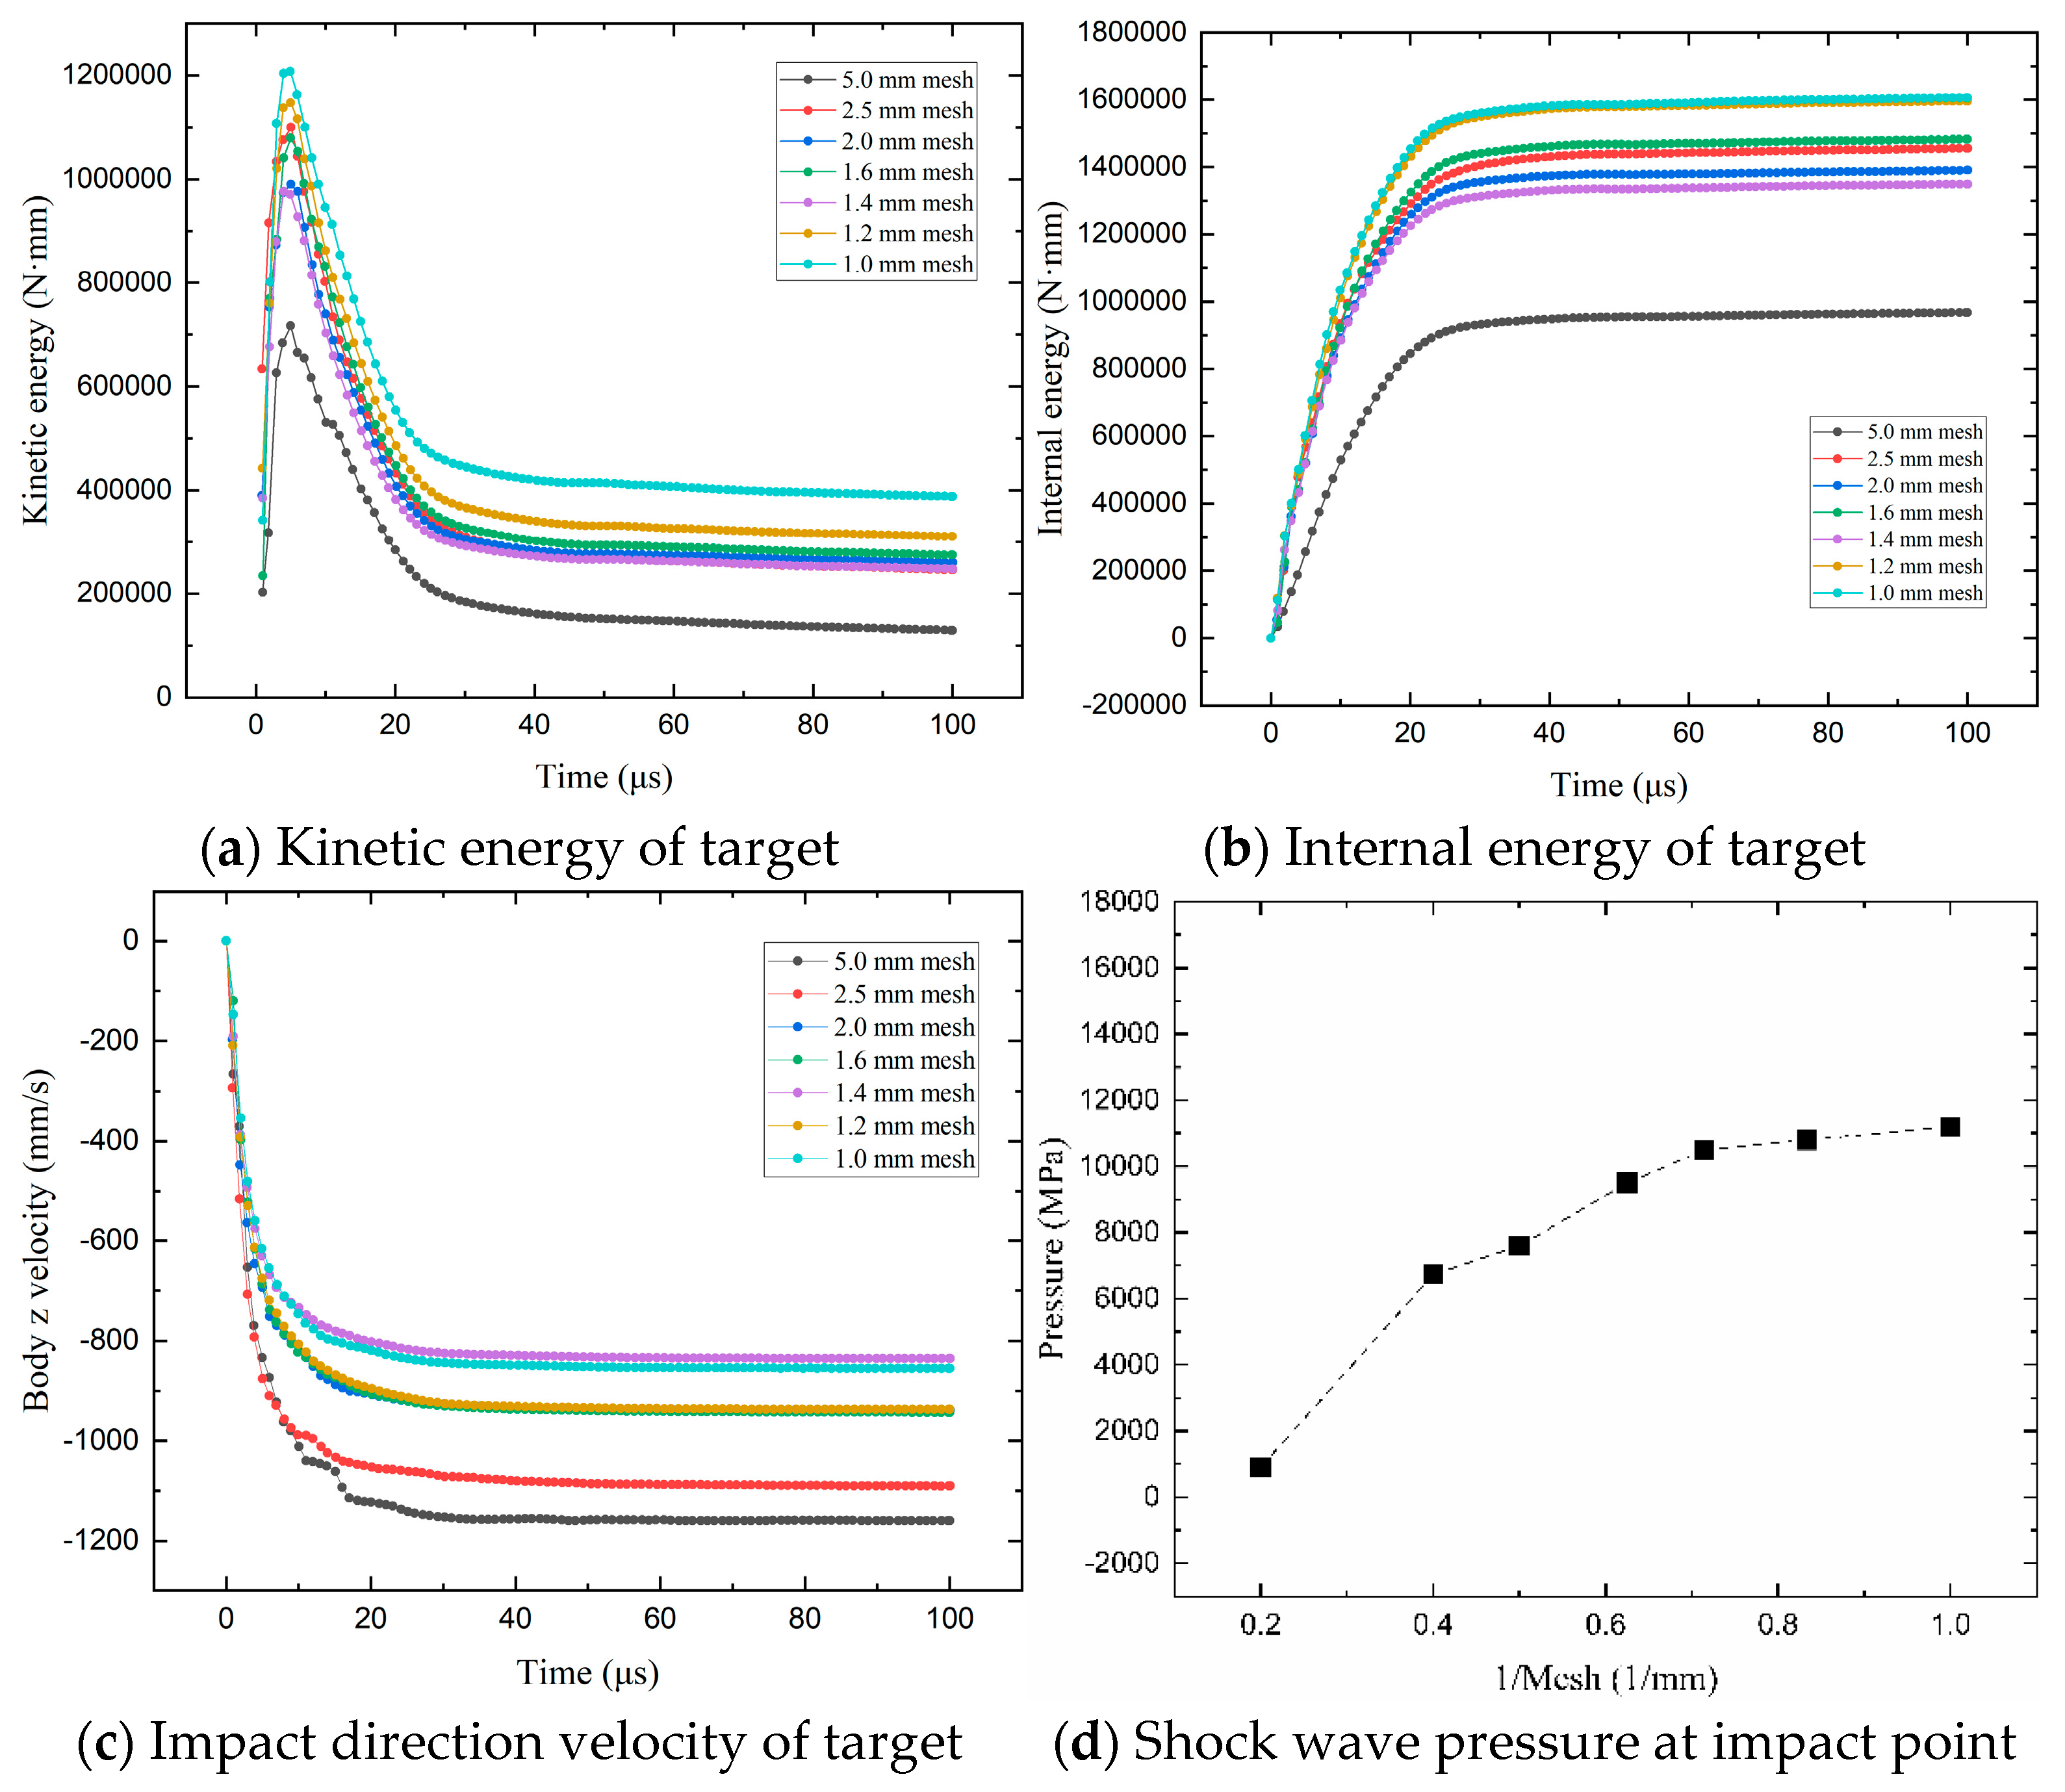
Appendix B. Grid Independence Verification

First, 5 mm, 2.5 mm, 2 mm, 1.6 mm, 1.4 mm, 1.2 mm, and 1 mm meshes were selected, and the corresponding numbers of SPH particles were 20, 40, 50, 60, 70, 80, and 100, respectively. By comparing the target kinetic energy, internal energy, target impact direction velocity, and particle pressure at the impact point under the condition of 2891 m/s, it is found that it tends to be stable and has good grid independence, as shown in Figure A3.
Figure A3. Grid independence verification.
Aerospace 12 00534 g0a3

References

  1. Pengbin, M.A.; Hexi, B. Research Status of the Near-Earth Asteroids’ Hazard and Mitigation. J. Deep. Space Explor. 2016, 3, 10–17. [Google Scholar]
  2. Buys, M.; Squirini, R.M.; Wilson, C.M.; Gabriel, J.L.; Salehuddin, H.; Zimmerman, G.K.; Barbee, B.W. THEO & MUFN: Defending Earth against the 2023 PDC hypothetical asteroid impact. Acta Astronaut. 2024, 215, 217–233. [Google Scholar]
  3. NASA. Discovery Statistics [EB/OL]. Available online: https://cneos.jpl.nasa.gov/stats/ (accessed on 14 March 2018).
  4. Hergarten, S.; Kenkmann, T. The number of impact craters on Earth: Any room for further discoveries? Earth Planet. Sci. Lett. 2015, 425, 187–192. [Google Scholar] [CrossRef]
  5. Prinz, T. Multispectral remote sensing of the Gosses Bluff impact crater, central Australia (N.T.) by using Landsat-TM and ERS-1 data. ISPRS J. Photogramm. Remote Sens. 1996, 51, 137–149. [Google Scholar] [CrossRef]
  6. Hand, E. Updated: Drilling of Dinosaur-Killing Impact Crater Explains Buried Circular Hills. Available online: https://www.science.org/content/article/updated-drilling-dinosaur-killing-impact-crater-explains-buried-circular-hills (accessed on 27 November 2023).
  7. Kaplan, M. 11 Fascinating Impact Craters on Earth. Available online: https://www.touropia.com/impact-craters-on-earth/ (accessed on 27 November 2023).
  8. Puliti, L. Meteor Crater: Discover the Immense Crater of Arizona. Available online: https://www.travelinusa.us/meteor-crater-arizona/ (accessed on 27 November 2023).
  9. Carancas, H4-5. Available online: https://meteoritegallery.com/carancas-h4-5/ (accessed on 27 November 2023).
  10. Meteor Strikes Chelyabinsk, Russia. Available online: https://forum.nasaspaceflight.com/index.php?topic=31118.460 (accessed on 27 November 2023).
  11. Barbee, B.W.; Syal, M.B.; Dearborn, D.; Gisler, G.; Greenaugh, K.; Howley, K.M.; Leung, R.; Lyzhoft, J.; Miller, P.L.; Nuth, J.A.; et al. Options and uncertainties in planetary defense: Mission planning and vehicle design for flexible response. Acta Astronaut. 2018, 143, 37–61. [Google Scholar] [CrossRef]
  12. Cheng, A.F.; Agrusa, H.F.; Barbee, B.W.; Meyer, A.J.; Farnham, T.L.; Raducan, S.D.; Richardson, D.C.; Dotto, E.; Zinzi, A.; Della Corte, V.; et al. Momentum transfer from the DART mission kinetic impact on asteroid Dimorphos. Nature 2023, 616, 457–460. [Google Scholar] [CrossRef]
  13. Flynn, G.J.; Durda, D.D.; Molesky, M.J.; May, B.A.; Congram, S.N.; Loftus, C.L.; Reagan, J.R.; Strait, M.M.; Macke, R.J. Momentum transfer in hypervelocity cratering of meteorites and meteorite analogs: Implications for orbital evolution and kinetic impact deflection of asteroids. Int. J. Impact Eng. 2020, 136, 103437. [Google Scholar] [CrossRef]
  14. Gores, P.A.S.; Spray, J.G. Hypervelocity impact of anorthosite: Excavation, spallation and crater reconstruction. Int. J. Impact Eng. 2022, 160, 104078. [Google Scholar] [CrossRef]
  15. Hoerth, T.; Schäfer, F.; Thoma, K.; Kenkmann, T.; Poelchau, M.H.; Lexow, B.; Deutsch, A. Hypervelocity impacts on dry and wet sandstone: Observations of ejecta dynamics and crater growth. Meteorit. Planet. Sci. 2013, 48, 23–32. [Google Scholar] [CrossRef]
  16. Poelchau, M.H.; Kenkmann, T.; Hoerth, T.; Schäfer, F.; Rudolf, M.; Thoma, K. Impact cratering experiments into quartzite, sandstone and tuff: The effects of projectile size and target properties on spallation. Icarus 2014, 242, 211–224. [Google Scholar] [CrossRef]
  17. Chocron, S.; Walker, J.D.; Grosch, D.J.; Beissel, S.R.; Durda, D.D.; Housen, K.R. Momentum enhancement simulations for hypervelocity impacts on sandstone. Int. J. Impact Eng. 2021, 151, 103832. [Google Scholar] [CrossRef]
  18. Melosh, H.J. Impact Cratering: A Geologic Process; Oxford University Press: New York, NY, USA, 1989; pp. 1–240. [Google Scholar]
  19. Lockner, D.A. Rock Failure. In Rock Physics and Phase Relations: A Handbook of Physical Constants; Ahrens, T.J., Ed.; American Geophysical Union, AGU Reference Shelf: Washington, DC, USA, 1995; Volume 3, pp. 127–147. [Google Scholar]
  20. Lu, Z.; Wang, Z. Triaxial tests on dynamic properties of granite under intermediate and high strain rates. Chin. J. Geotech. Eng. 2016, 38, 1087–1094. [Google Scholar]
  21. Lv, H.; He, Q.; Chen, X.; Han, P. Numerical simulation of impact crater formation and distribution of high-pressure polymorphs. Acta Astronaut. 2023, 203, 169–186. [Google Scholar] [CrossRef]
  22. Liu, W.; Zhang, Q.; Long, R.; Gong, Z.; Wu, Q.; Siyuan, R.; Lu, Y.; Xu, J.; Zhong, X.; Jiankang, R. Ejecta velocity and motion model of spherical aluminum alloy projectile hypervelocity impact on basalt. Acta Astronaut. 2024, 224, 574–592. [Google Scholar] [CrossRef]
  23. Johnson, B.C.; Bowling, T.J.; Melosh, H.J. Jetting during vertical impacts of spherical projectiles. Icarus 2014, 238, 13–22. [Google Scholar] [CrossRef]
  24. Melosh, H.J. Impact ejection, spallation, and the origin of meteorites. Icarus 1984, 59, 234–260. [Google Scholar] [CrossRef]
  25. Nakamura, A.; Michel, P.; Setoh, M. Weibull parameters of Yakuno basalt targets used in documented high-velocity impact experiments. J. Geophys. Res. 2007, 112, E02001. [Google Scholar] [CrossRef]
  26. Liu, Z.; Jiang, Q.; Liu, Y.; Zhang, K.; Wei, Y.; Chen, T.; Guo, Y.; Lu, L.; Wei, B. Response characteristics and impact resistance of composite laminates with shear stiffening gel under hypervelocity impact. Acta Astronaut. 2024, 219, 858–870. [Google Scholar] [CrossRef]
  27. Tang, W.; Zhang, K.; Chen, T.; Wang, Q.; Wei, B. Microstructural evolution and energetic characteristics of TiZrHfTa0.7W0.3 high-entropy alloy under high strain rates and its application in high-velocity penetration. J. Mater. Sci. Technol. 2023, 132, 144–153. [Google Scholar] [CrossRef]
  28. Wang, Y.; Zeng, X.; Chen, H.; Yang, X.; Wang, F.; Zeng, L. Modified Johnson-Cook constitutive model of metallic materials under a wide range of temperatures and strain rates. Results Phys. 2021, 27, 104498. [Google Scholar] [CrossRef]
  29. He, Q.; Chen, X.; Chen, J. Finite element-smoothed particle hydrodynamics adaptive method in simulating debris cloud. Acta Astronaut. 2020, 175, 99–117. [Google Scholar] [CrossRef]
  30. Sun, Y.; Wang, L.; Wang, J.; Tan, C.; Ye, Y.; Lin, K. A modified Holmquist–Johnson–Cook (HJC) constitutive model and its application to numerical simulations of explosions and impacts in rock materials. Simul. Modell. Pract. Theory 2025, 138, 103038. [Google Scholar] [CrossRef]
  31. Lu, S.; Wu, X. Finite element simulation of sandstone SHPB experiment under impact load. J. Hefei Univ. Technol. (Nat. Sci.) 2022, 45, 1517–1521. (In Chinese) [Google Scholar]
  32. Bagatin, A.C.; Alemañ, R.A.; Benavidez, P.G.; Pérez-Molina, M.; Richardson, D.C. Gravitational re-accumulation as the origin of most contact binaries and other small body shapes. Icarus 2020, 339, 113603. [Google Scholar] [CrossRef]
  33. Gault, D.E. The partition of energy for hypervelocity impact craters formed in rock. In Proceedings of the Sixth Hypervelocity Impact Symposium, Cleveland, OH, USA, 30 April–2 May 1963. [Google Scholar]
  34. Liu, K.; Zhao, J.; Wu, G.; Maksimenko, A.; Haque, A.; Zhang, Q.B. Dynamic strength and failure modes of sandstone under biaxial compression. Int. J. Rock. Mech. Min. Sci. 2020, 128, 104260. [Google Scholar] [CrossRef]
  35. Kubota, S.; Ogata, Y.; Wada, Y.; Simangunsong, G.; Shimada, H.; Matsui, K. Estimation of dynamic tensile strength of sandstone. Int. J. Rock. Mech. Min. Sci. 2008, 45, 397. [Google Scholar] [CrossRef]
  36. Padmanabha, V.; Schäfer, F.; Rae, A.S.P.; Kenkmann, T. Dynamic Split Tensile Strength of Basalt, Granite, Marble and Sandstone: Strain Rate Dependency and Fragmentation. Rock. Mech. Rock. Eng. 2023, 56, 109. [Google Scholar] [CrossRef]
  37. Tang, W.; Zhang, R.; Hu, J.; Jing, F. Approximation calculation methods of shock temperature. Adv. Mech. 1998, 28, 479–487. [Google Scholar]
  38. Kieffer, S.W.; Simonds, C.H. The role of volatiles and lithology in the impact cratering process. Rev. Geophys. 1980, 18, 143–181. [Google Scholar] [CrossRef]
  39. Zhang, J.J.; Bentley, L.R. Change of bulk and shear moduli of dry sandstone with effective pressure and temperature. CREWES Res. Rep. 1999, 11, 1–16. [Google Scholar]
  40. Qin, X.; Han, D.H.; Zhao, L. Measurement of grain bulk modulus on sandstone samples from the norwegian continental shelf. J. Geophys. Res. Solid Earth 2022, 127, e2022JB024550. [Google Scholar] [CrossRef]
  41. Kui, Z.; Xun, L.; Gang, Y. Study on planar impact experiment and state equation under high pressure of red sandstone. BLASTING 2024, 41, 69–74. [Google Scholar]
  42. McQueen, R.; Marsh, S.; Fritz, J. Hugoniot equation of state of twelve rocks. J. Geophys. Res. 1967, 72, 4999–5036. [Google Scholar] [CrossRef]
Figure 1. Schematic of the experimental system.
Aerospace 12 00534 g001
Figure 2. (a) Diagram of the ballistic target (DBR30); (b) high-speed camera system; (c) schlieren imaging system; (d) diagram of the ballistic pendulum structure.
Aerospace 12 00534 g002
Figure 3. Impact morphology at different velocities: (a) 2891 m/s; (b) 3154 m/s; (c) 3509 m/s; (d) 4453 m/s.
Aerospace 12 00534 g003
Figure 4. Image of projectile perforation process at impact velocities of (a) 2891 m/s; (b) 3154 m/s; (c) 3509 m/s; and (d) 4453 m/s.
Aerospace 12 00534 g004
Figure 5. Debris cloud morphology from experiments and simulations at 130 μs of impact velocity of (a) 2891 m/s, (b) 3154 m/s, (c) 3509 m/s, and (d) 4453 m/s.
Aerospace 12 00534 g005
Figure 6. SPH particle maximum principal stress fields in the central section of the target under varied impact velocities: (a) 2891 m/s, (b) 3154 m/s, (c) 3509 m/s, (d) 4453 m/s.
Aerospace 12 00534 g006
Figure 7. Energy conversion during the impact of different velocities (Projectile-IE represents the internal energy of the projectile, Projectile-KE represents the kinetic energy of the projectile, Target-IE represents the internal energy of the target, and Target-KE represents the kinetic energy of the target).
Aerospace 12 00534 g007aAerospace 12 00534 g007b
Figure 8. (a) Large stripping spheres detached from the target. (b) The formation of large pellets captured by ultra-high-speed cameras (the red arrow represents the spherical parts). (c) Adriano et al. documented large-scale fragmentation through multi-angle imaging, capturing the largest fragment positions at 14 ms, 20 ms, and 24 ms post-impact, temporally referenced against the target’s original morphology [32].
Aerospace 12 00534 g008
Figure 9. Attenuation law of dimensionless shock waves in the impact process: (a) theoretical result; (b) simulation result.
Aerospace 12 00534 g009
Figure 10. Shock pressure time curves of 12 points in different impact directions.
Aerospace 12 00534 g010
Figure 11. The mass of the dimensionless balls obtained by experiment and the dimensionless size obtained by simulation (mq represents the mass of stripping ball; mt represents the mass of target; Dq represents the simulated diameter of the ball; and Wt represents the size of target.).
Aerospace 12 00534 g011
Figure 12. Shock wave stripping model of HVI in sandstone.
Aerospace 12 00534 g012
Figure 13. (a) λ changes due to different size ratios of the projectile and the target. (Generally, consider that the size of the projectile is smaller than the target. d is the diameter of the projectile, and H is the size depth of the target. The simulated working condition is 3000 m/s.) (b) Class I and Class II damage due to size effects.
Aerospace 12 00534 g013
Table 1. Experimental parameters and results.
vp (m/s)ρp (g/cm3)ρt (g/cm3)mp (g)mr (g)mq (g)
28912.7002.51819.01942647
31542.7002.50419.01738611
35092.7002.49819.01629619
44532.7002.49819.0-485
Note: vp is the speed of the projectile; ρp is the density of the projectile; ρt is the density of the target; mp is the mass of the projectile (including the cartridge); mr is the total remaining mass of the target (including stripping ball); mq is the mass of the stripping ball.
Table 2. Parameters of the JC 6061-T6 model [29].
ρ0 (kg·m−3)µG (GPa)σs (MPa)Nq (MPa)
27730.3327.6290203
NeQSpall typeD0D2–5
0.350.011310
Table 3. Parameters of the Mie–Gruneisen EOS [29].
C (m·s−1)S1γ
53861.3391.997
Table 4. Parameters of the red sandstone with HJC model [30,31].
ρ0 (kg·m−3)fc (MPa)ABC0
2500200.792.20.007
SmaxG (Gpa)T (MPa)D01D02
74.10.40.031
Pcrush (MPa)µcrushPlock (GPa)µlockK1 (GPa)
3700.061.00.1515
K2 (GPa)K3 (GPa)EFminNFS
5000.010.800.004
Disclaimer/Publisher’s Note: The statements, opinions and data contained in all publications are solely those of the individual author(s) and contributor(s) and not of MDPI and/or the editor(s). MDPI and/or the editor(s) disclaim responsibility for any injury to people or property resulting from any ideas, methods, instructions or products referred to in the content.

