Article

Film Cooling Performance and Superposition Method of an Actual Turbine Vane at High Freestream Turbulence

1
School of Energy & Power Engineering, Xi’an Jiaotong University, Xi’an 710049, China
2
Hangzhou Turbine Power Group Co., Ltd., Hangzhou 310015, China
*
Authors to whom correspondence should be addressed.
Aerospace 2025, 12(6), 533; https://doi.org/10.3390/aerospace12060533
Submission received: 26 March 2025 / Revised: 3 June 2025 / Accepted: 9 June 2025 / Published: 12 June 2025
(This article belongs to the Section Aeronautics)

Abstract

This study aims to enhance the understanding of film cooling performance in an actual turbine vane by investigating influencing factors and developing more precise numerical prediction methods. Pressure sensitive paint (PSP) testing and Reynolds-Averaged Navier–Stokes (RANS) simulations were conducted. The findings indicate that the current design blowing ratio of S1 holes (0.89) is too high, resulting in poor film cooling effectiveness. However, the blowing ratios of P3 (0.78) and P4 (0.69) holes are relatively low, suggesting that increasing the coolant flow could improve the film cooling effectiveness. It is not recommended to design an excessively low blowing ratio on the suction surface, as this can lead to poor wall adherence downstream of the film holes. A slight increase in turbulence intensity enhances the film covering effect, particularly on the suction surface. Additionally, a novel superposition method for multirow fan-shaped film cooling holes on an actual turbine vane is proposed, exhibiting better agreement with experimental data. Compared with experimental results, the numerical predictions tend to underestimate the film cooling effectiveness with the examined k-ε-based viscosity turbulence models and Reynolds stress turbulence models, while the SST demonstrates relatively higher accuracy owing to its hybrid k-ω/k-ε formulation that better resolves near-wall physics and separation flows characteristic of turbine cooling configurations. This study contributes to the advancement of turbine vane thermal analysis and design in engineering applications.

1. Introduction

Higher turbine inlet temperatures are employed to improve the thermal efficiency and amplify the specific work in modern advanced gas turbines. However, the turbine operation temperatures far exceed the metal material limits, necessitating the use of advanced cooling technology [1]. Film cooling is one of the most important and widely used methods in turbine vanes and blades, which forms a thin layer of coolant air on the vane surface to hinder the direct heat exchange between the hot gas and the vane, thus effectively reducing the vane temperature.
The research on film cooling focuses on the film cooling heat transfer characteristics under different influencing factors, as well as developing an accurate prediction method of film cooling effectiveness. Baldauf et al. studied the influence of blowing ratio on film cooling effectiveness and performed the measurements under 12 blowing ratio conditions [2]. The results showed that the cooling effectiveness increased with higher cooling air flow when the blowing ratio was lower than 0.6. However, as the blowing ratio continued to rise above 0.85, the peak value of cooling effectiveness showed a gradual decrease. Thole et al. [3] focused on exploring the impact of momentum ratio on the film cooling effectiveness. They found that when the momentum ratio was lower than 0.4, the film remained well attached to the wall. As the momentum ratio ranged between 0.4 and 0.8, the film jet experienced detachment from the wall and then reattached. When it exceeded 0.8, the film completely detached from the wall, resulting in very poor film cooling performance. Pedersen, Johnson, and Ammari studied the effect of density ratio on film cooling effectiveness [4,5,6,7]. The effect of the density ratio is greatly affected by parameters such as blowing ratio and momentum ratio, and the film cooling effectiveness is relatively higher when the density ratio is higher. Eriksen, Kadotani, and Thole and Lebedev studied the effect of mainstream turbulence on film cooling effectiveness [8,9,10,11]. At small momentum ratios, turbulence plays a major role in carrying away a portion of the cooling airflow. The increase in turbulence intensity strengthens the mixing between the film and the mainstream, reducing the film cooling effectiveness. However, at large momentum ratios, the increase in film transverse diffusion and the return of some cooling air to the wall became more significant. On the contrary, high turbulence enhances the film cooling effectiveness.
The research methods for film cooling mainly include numerical simulation and experimental measurement. In terms of numerical simulation, Heidamann et al. used the k-ω turbulence model to simulate the film cooling effectiveness of the blade in a steady state [12]. However, their results exhibited a certain deviation from the test data. Subsequent research by Charbonnier et al. [13] revealed that such k-ω based simulations can exhibit maximum local effectiveness errors of 40%~95% compared to experimental data. Similarly, Dyson et al. employed the SST turbulence model to simulate the film cooling effectiveness of the blade showerhead, but the calculated results showed higher values than the experimental data [14]. Wu et al. calculated the film cooling effectiveness of a blade under conditions of high turbulence and real exit Mach number [15]. The calculated results based on the V^2-f model were in good agreement with the experimental results on the pressure side at a blowing ratio of 1.5 but were higher on the suction side. Presently, due to the complex nature of film cooling flow and heat transfer, there is a lack of an accurate numerical prediction method that is available.
Experimental measurement is an important means for film cooling research. Common experimental measurement technologies include thermocouple measurement [16,17], infrared measurement [18,19,20,21], and transient liquid crystal technique [22,23,24]. However, each of these methods has certain drawbacks. For example, thermocouples can only provide temperature data of a few points and may disturb the near-wall flow field. Infrared measurement is susceptible to errors caused by wall thermal conductivity, and the measurement range is limited in blades with large curvatures. Shadid et al. carried out theoretical derivations and experimental research [25]. Their results showed that film cooling was primarily a convection-dominated process, with theoretical minimal influence from differences in heat and mass transfer diffusion coefficients. Zhang et al. introduced PSP technology into the film cooling effectiveness measurement based on the heat and mass transfer principles [26]. This technology offers high measurement accuracy, high spatial resolution, good repeatability, and a simple experimental setup. Currently, PSP technology has become a mainstream technology for measuring film cooling effectiveness [27,28,29,30,31,32,33,34].
To improve the efficiency of blade thermal analysis and design, it is necessary to find a superposition method for multirow film holes in the design of high-performance blades. Sellers et al. previously studied the cooling effectiveness relationship between single-row holes and multirow holes and proposed a superposition method for multirow film holes under the assumption of ignoring the mutual interference between hole rows, which is more suitable for two-dimensional slot film cooling [35]. Sasaki et al. conducted experiments to validate Sellers’ superposition method, which showed that the calculated values were low in most cases, but the deviation was acceptable [36]. Takeishi experimentally examined the cooling effectiveness and superposition effectiveness for multirow film holes [37]. It was found that Sellers’ superposition method was more applicable to the suction surface of the vane and only held true for the far downstream region of the film holes on the suction surface under rotating conditions. On the pressure surface, there was a significant difference between the calculated and experimental results. Zhu et al. studied the superposition method for the cooling effectiveness of the expanded film holes and found that when applying Sellers’ superposition method to calculate the cooling effectiveness of double row holes, large deviations occur at high blowing ratios [38]. Based on their test data, they proposed a new cooling effectiveness superposition correlation for the double row expanded film holes.
At present, advanced turbine vanes adopt multirow film holes or even full film holes to enhance their film cooling performance, and it is necessary to investigate the performance and stacking behavior of multirow film holes. Based on PSP technology, this paper aims to experimentally study the film cooling performance of an actual turbine vane under high turbulence conditions. Additionally, the influence of different blowing ratios and turbulence intensities on the film cooling effectiveness is investigated. Sellers’ superposition method is examined by experimental data, and a novel method for the superposition of multirow fan-shaped film holes is proposed to improve the efficiency of turbine vane thermal analysis and design. By comparing numerical simulations with the experimental results, the accuracy of six turbulence models is verified, and a more accurate prediction method for film cooling effectiveness in engineering applications is established.

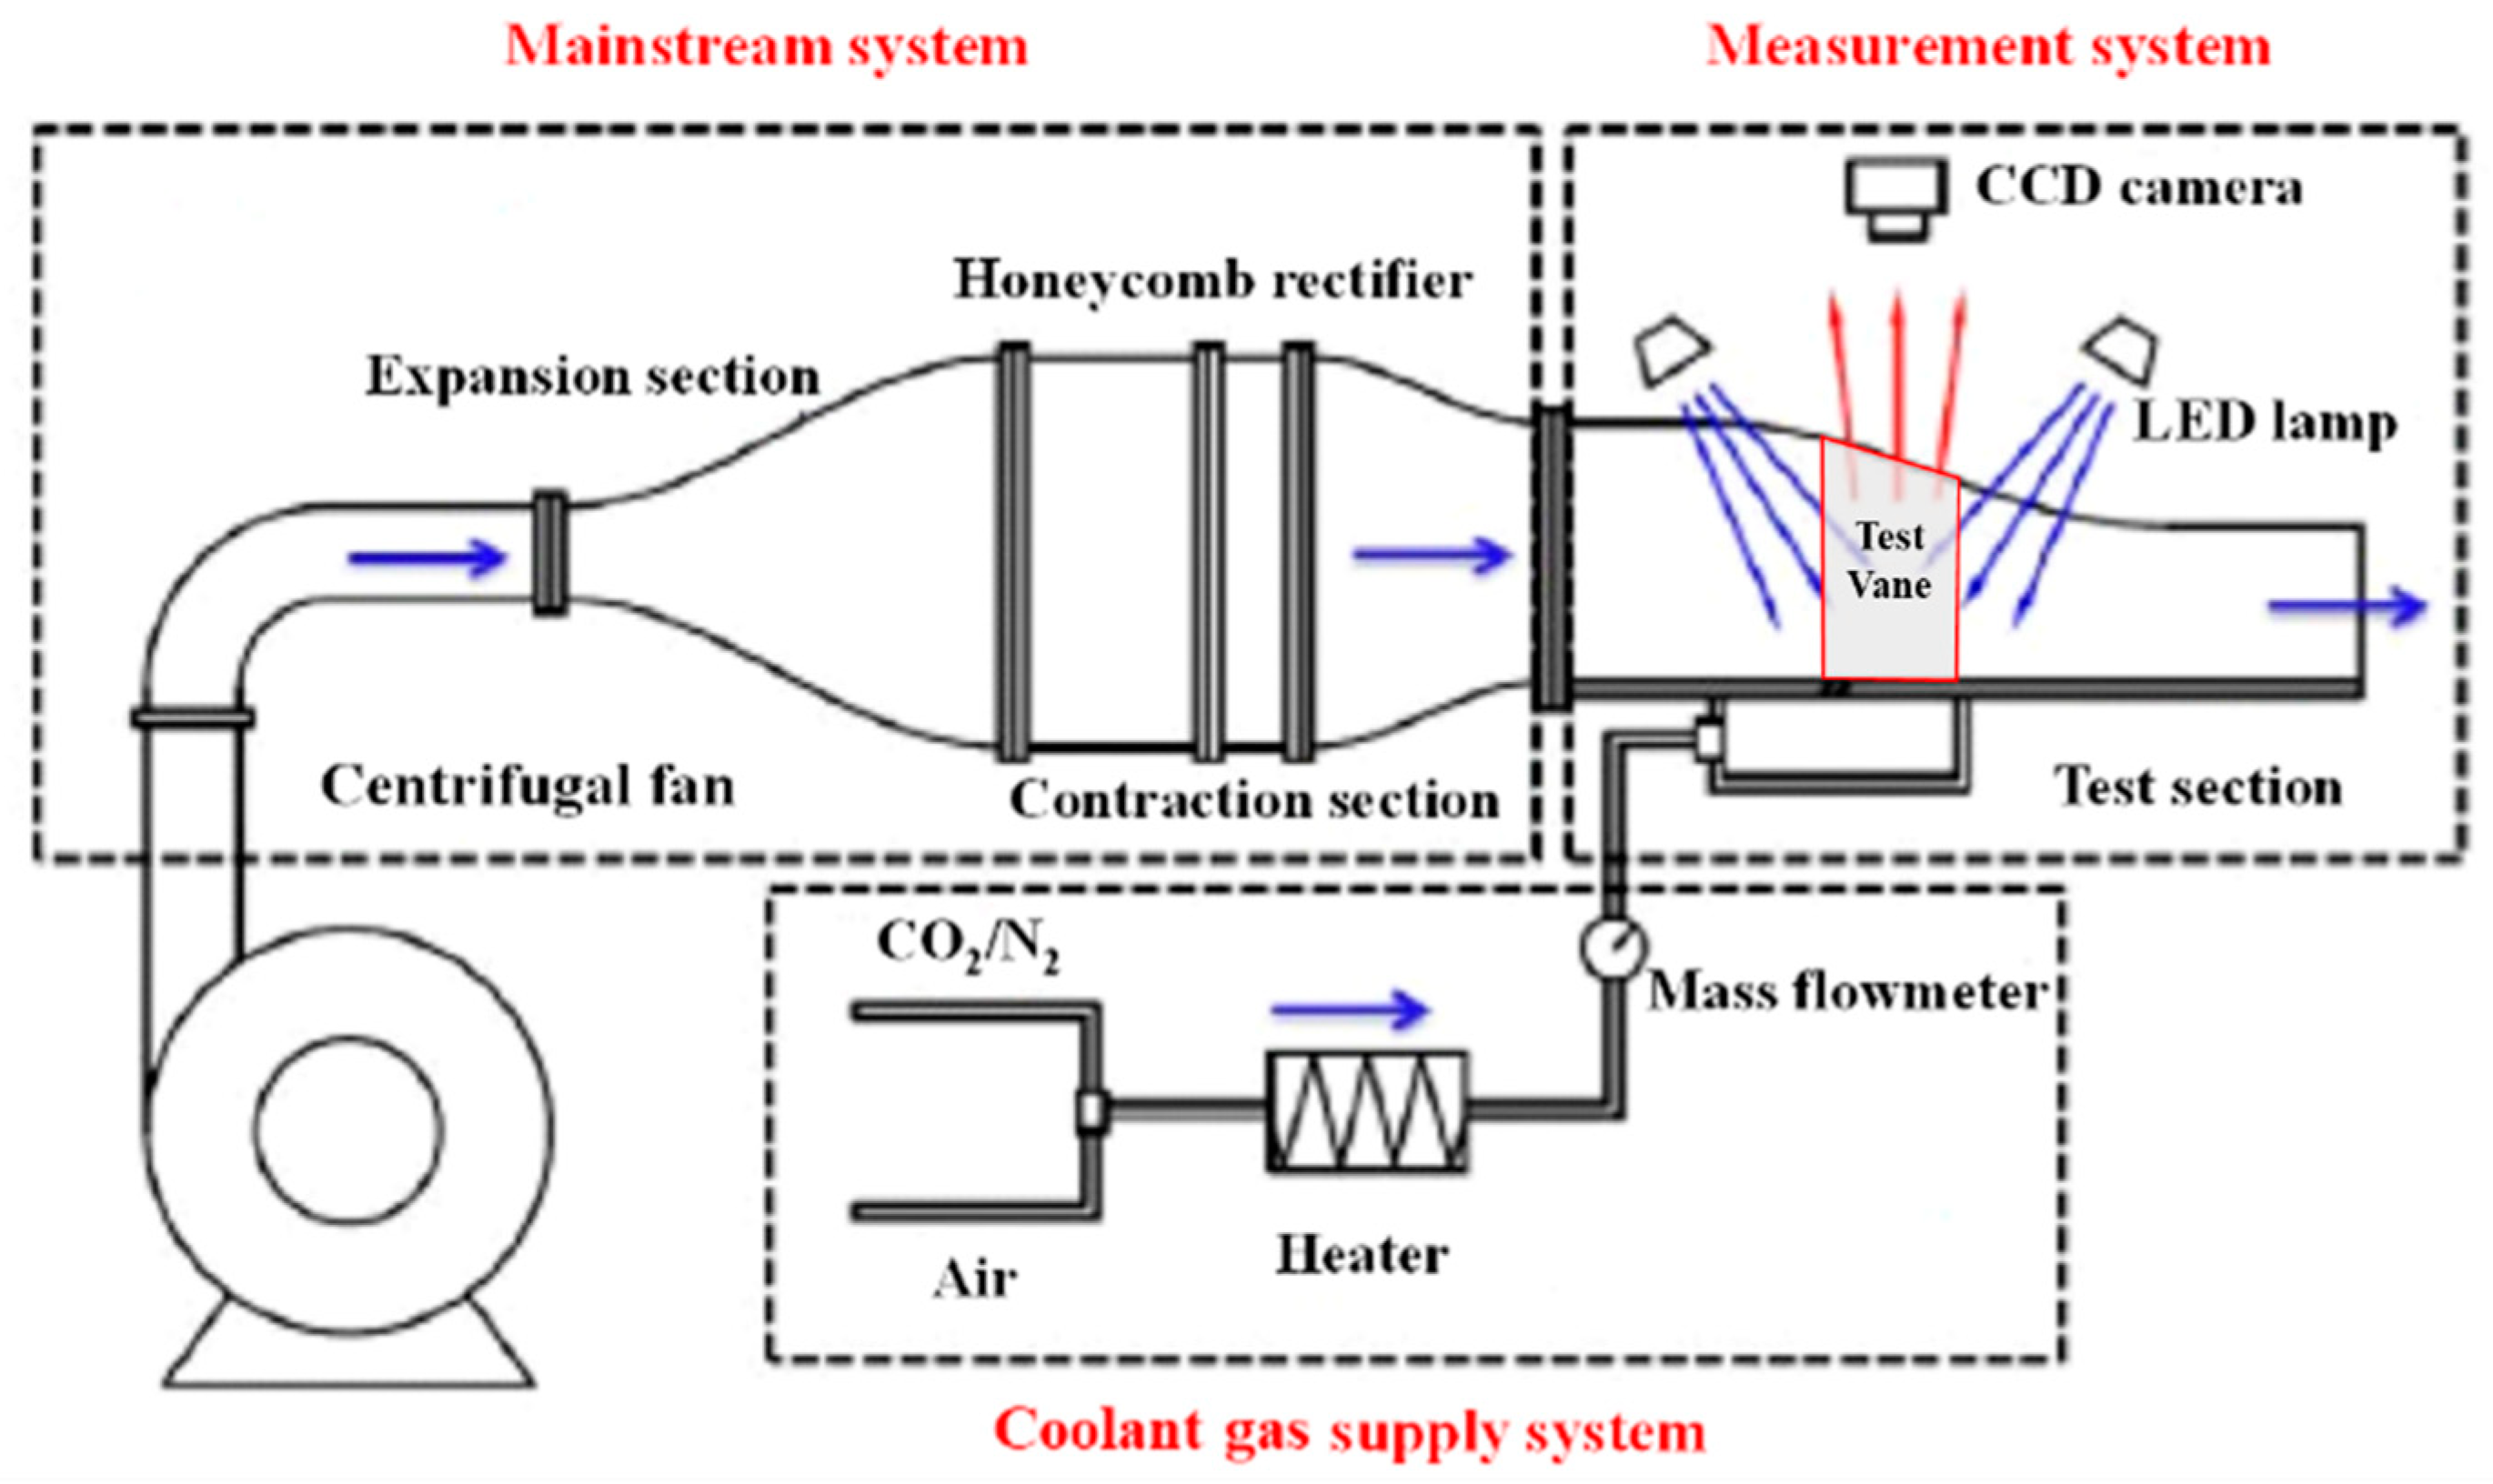
2. Experimental Setup and Method

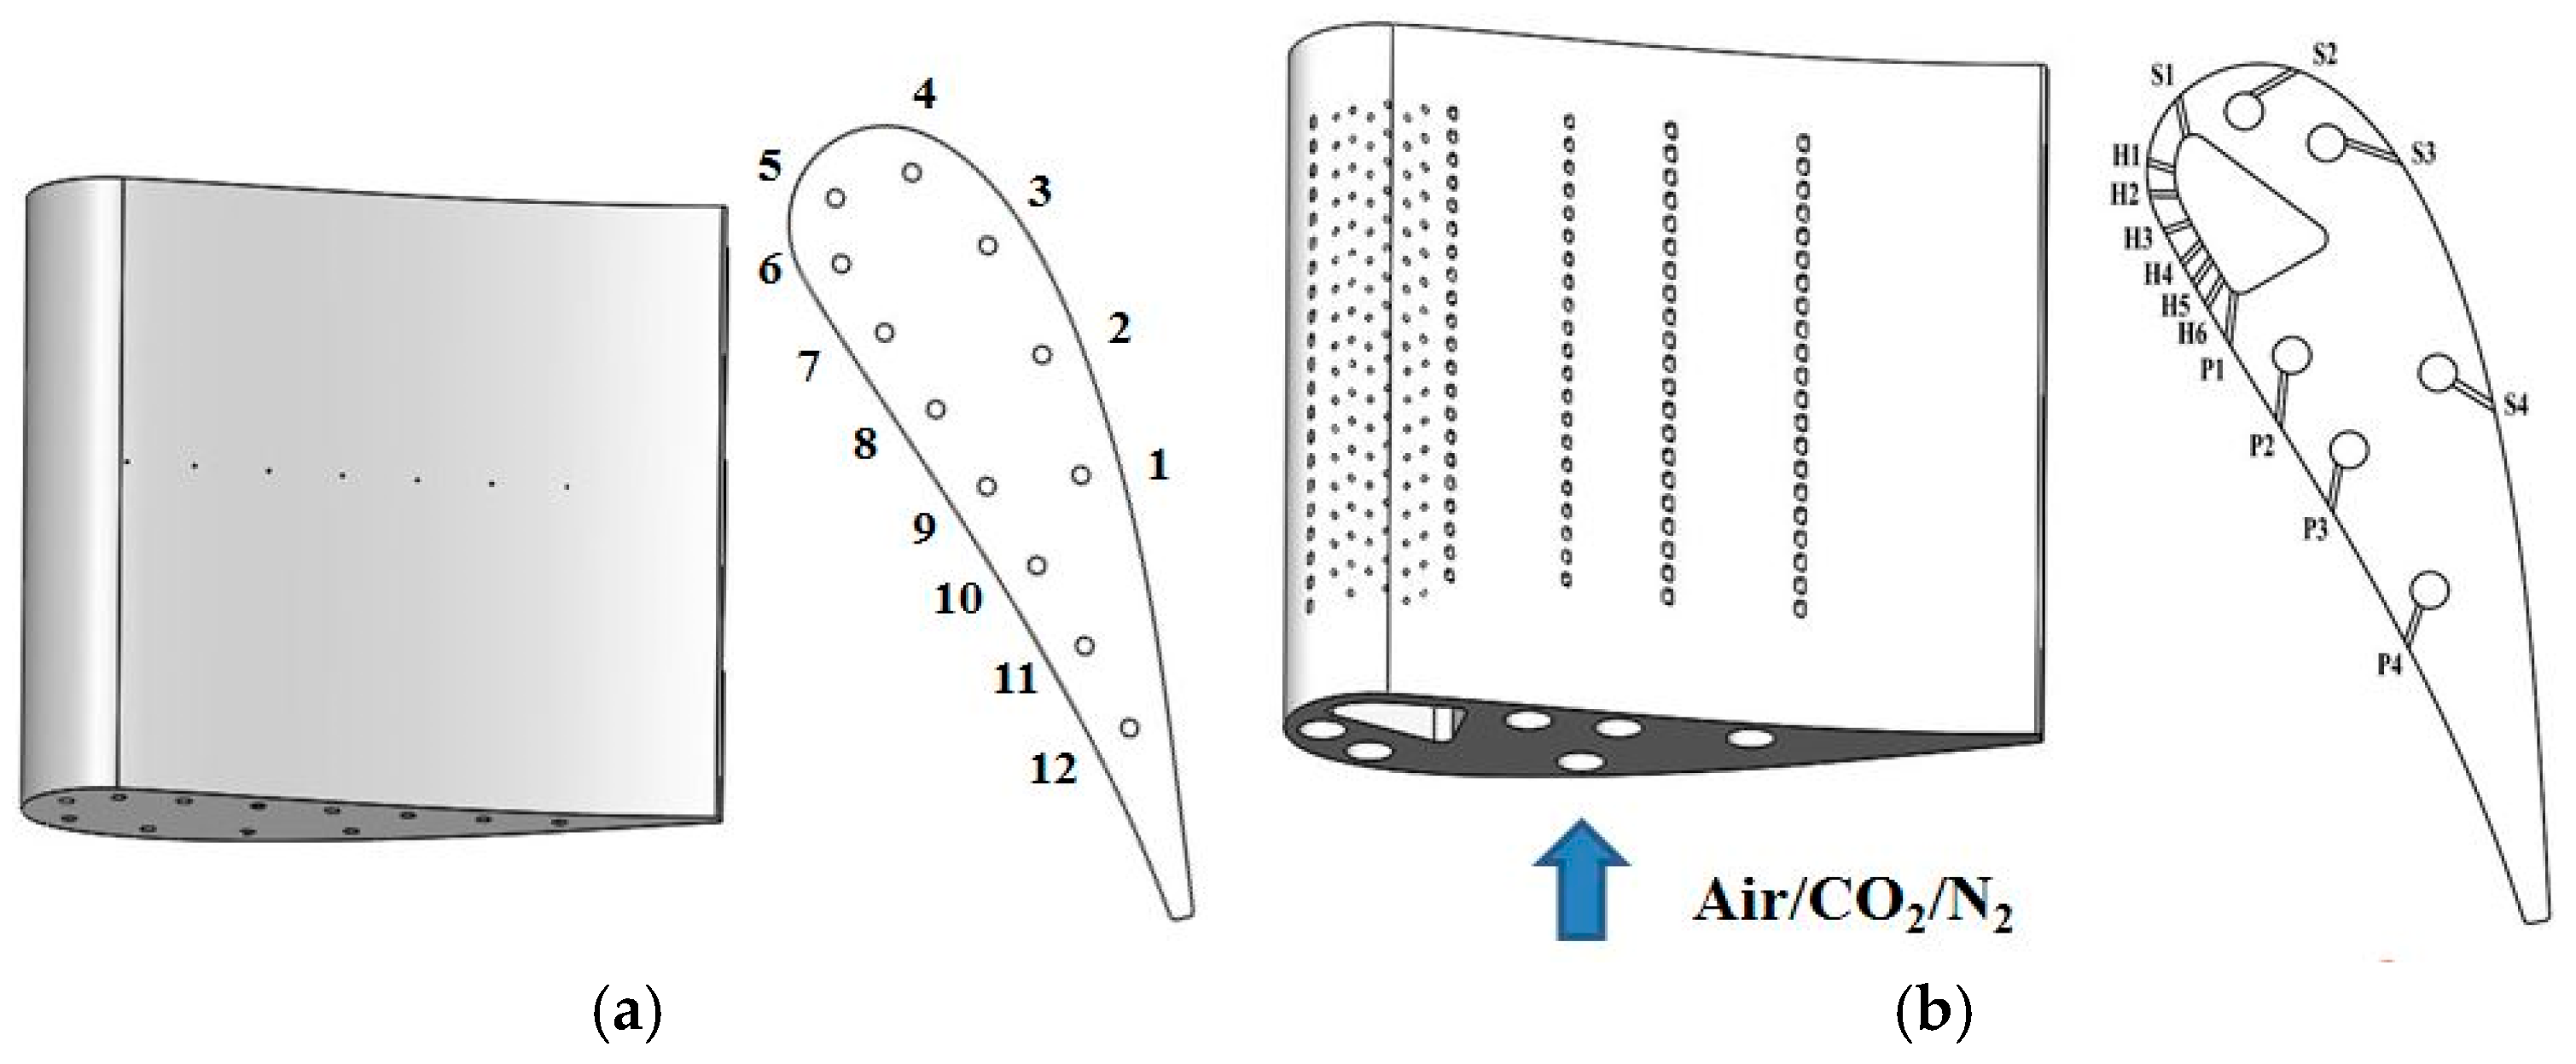
2.1. Geometry and Test Conditions

Figure 1 shows the film cooling test platform, which is mainly composed of the mainstream system, the cold air supply system, and the measurement system. The air is supplied by an 11 kW centrifugal fan. The air flows through the expansion section, the honeycomb rectifier section, and the contraction section before entering the test section. The expansion section converts the flow passage from round to square shape, reducing the velocity of the main flow. The rectifier section and the test section are connected by a contraction section, and the contraction section size is determined according to the test section parameters. The contraction process is designed by using the Vitoshinsky curve to ensure a uniform flow development without separation. The honeycomb rectifier breaks the large vortex structure, resulting in a uniform incoming flow. The outlet divergent section is located after the test section of the cascade. The gas passing through the cascade is finally discharged to the atmosphere through the outlet divergent section. The coolant gas, consisting of air, carbon dioxide (CO2), and nitrogen (N2), is supplied by an air compressor and high-pressure tank, respectively. The coolant gas is controlled and measured using a flowmeter.
A turbulence grid is commonly used to increase fluid turbulence intensity. Roach carried out experimental studies on numerous factors that may influence the turbulence intensity, such as grid rod width, Reynolds number, and consistency, and gave fitting formulas for some of these factors [39]. Yuan et al. demonstrated that the turbulence intensity was associated with the ratio of the grating thickness to the air duct length, with higher ratios resulting in higher turbulence intensity [40].
In this experiment, a cross-shaped grating structure is utilized, consisting of longitudinal and transverse cuboid columns, as shown in Figure 2. Three turbulence intensities of 8%, 10%, and 12% are designed by adjusting the grid thickness.
Figure 3 shows the cascade test section of the film test rig. The cascade test section is made of transparent plexiglass with a transmittance of no less than 83% to ensure the effective light passage. The test section consists of five vanes forming four flow channels. The central vane is the test measurement vane, while the remaining four vanes on both sides are the foil vanes.
Figure 4a shows the static pressure test vane featuring 12 circular holes with a diameter of 0.5 mm on the middle section and 12 circular pressure chambers with a diameter of 2.5 mm for measuring the static pressure on the vane surface. Figure 4b shows the film test vane, which is used to measure the film cooling effectiveness on the vane surface. The film test vane has 14 rows of film holes, with the index number of each row indicated in the figure. At the leading edge, there are 6 rows of holes (H1~H6), and each row has 18 film holes with a diameter of 0.8mm and a pitch ratio of 3.8. On the pressure side, there are 4 rows of fan-shaped holes (P1~P4), and on the suction side, there are 4 rows of fan-shaped holes (S1~S4), with each row consisting of 21 film holes of diameter 0.8 mm and a pitch ratio of 4.8. The stagnation zone is between the H1 and H2 film holes at the leading edge. All film holes are processed by laser drilling. Coolant gas (Air/CO2/N2) enters 7 air supply chambers from the bottom of the vane.
Table 1 presents the test conditions, which are achieved by continuously monitoring and controlling the total temperature, total pressure, static pressure, turbulence intensity, and the cooling air flow. The inlet total pressure is measured by a three-hole probe located at 2C_ax upstream of the leading edge of the test vane. The total temperature of the main flow is measured by a K-type armored thermocouple. The turbulence intensity is measured by a hot wire anemometer, and the cooling air flow is measured using an air flowmeter. In the experiment, the blowing ratio of each hole is ensured to meet the test conditions by controlling the air flow of each air supply chamber. The cooling air is mixed with Air, N2, and CO2 to achieve the desired density ratio with the mainstream gas.

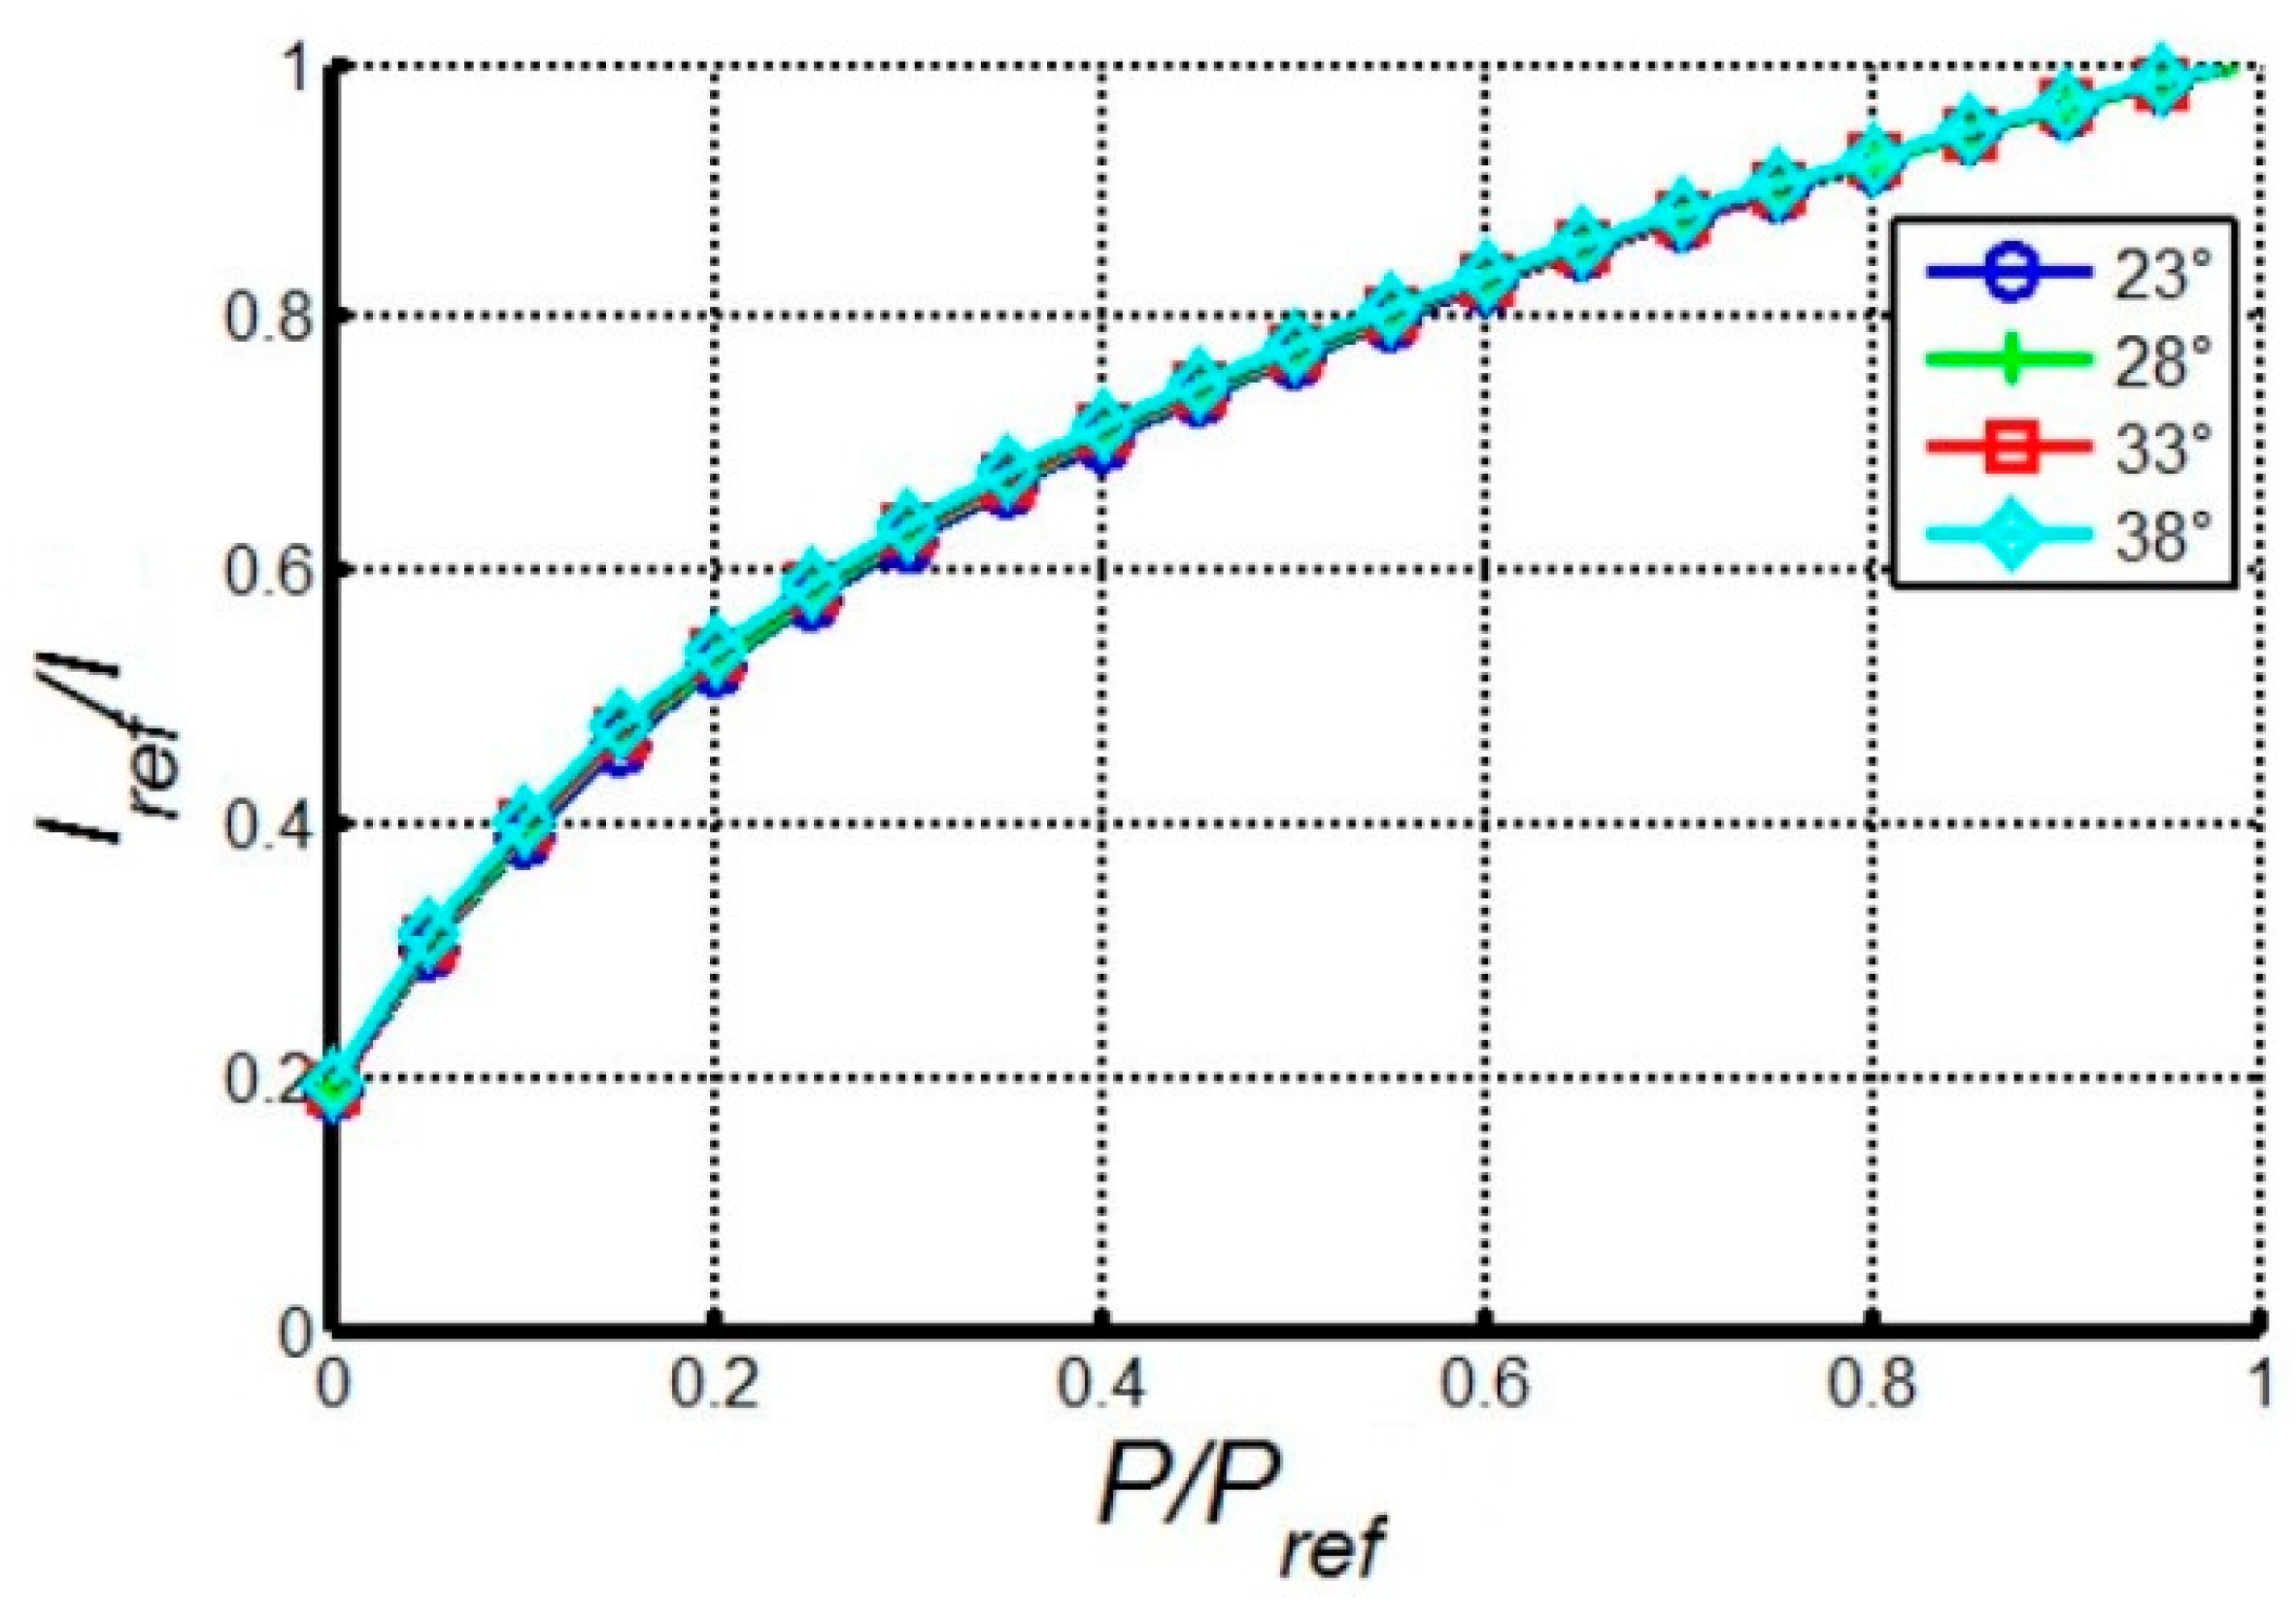
2.2. Measurement Techniques

The film cooling effectiveness distribution is obtained by the PSP technique. During the experiment, as gas flows over the surface coated with PSP, variations in the pressure occur on the vane surface, leading to a change in the partial pressure of oxygen. Consequently, luminescent molecules in the PSP exhibit different intensities of emitted light. By measuring the luminous intensity, the local pressure can be calculated using the established light intensity–pressure relationship. Figure 5 shows the PSP shooting system. The PSP is excited by a 480 nm light source emitted by an LED lamp, and the excited light is captured by a highly sensitive CCD camera, the resolution of which is 1600 × 1000. A 600 nm filter is installed in front of the camera to distinguish the incident light from the excited light.
Before the experiment, the PSP requires calibration to establish the relationship between the light intensity and oxygen partial pressure. Figure 6 shows the PSP calibration curves at different temperatures. The calibration curves are coincident, indicating that the temperature has little effect on the PSP excitation characteristics. As long as the experimental temperature is within the calibration range, there is a reliable corresponding relationship between the excitation light intensity of PSP and the surface oxygen partial pressure.
Four images are captured in the experiment: black image, reference image, air injection image, and another gas injection image. The black image intensity ( I b l k ) is obtained under no-light and no-flow conditions to eliminate the environmental light source effects. The reference image intensity ( I r e f ) is obtained under light and no-flow conditions, serving as a reference for the excitation light intensity in the ambient atmosphere. The air injection image intensity ( I a i r ) is obtained under light and flow conditions, and the cooling gas is air. Another gas injection image intensity ( I f g ) is obtained under light and flow conditions, but the cooling gas is a mixture of nitrogen and carbon dioxide.
The relationship between PSP emitting light intensity and the oxygen partial pressure is calculated as follows:
I r e f I b l k I I b l k = f P o 2 ( P o 2 ) r e f
Based on the heat and mass transfer method, the film cooling effectiveness is calculated:
η = T g T a w T g T c = 1 C o 2 , f g C o 2 , a i r = 1 1 P o 2 , a i r P o 2 , f g 1 M f g M a i r + 1
where, C o 2 , a i r and P o 2 , a i r are the oxygen concentration and partial pressure of the near-wall flow with air injection; C o 2 , f g and P o 2 , f g correspond to the case with another coolant gas; M f g is the molar mass of the injection gas, M a i r is the molar mass of air.

2.3. Experimental Uncertainty

The mainstream turbulence intensity is measured by a hot-wire anemometer, with a measurement error of ± 2% under the experimental conditions. The cooling flow at different blowing ratios is controlled by a flowmeter with an accuracy of ± 0.6%. The measurement error of the film cooling effectiveness includes two aspects: the error caused by the heat and mass transfer analogy and the random error caused by PSP. Shadid et al. showed that the error caused by the heat and mass transfer analogy is very small [25]. Li studied the random error of PSP, taking into account factors such as the influence of temperature on excitation light intensity, deterioration of PSP with time, and the uncertainty of pressure calibration [41]. The final random error distribution is shown in Table 2. Under the experimental conditions in this study, the absolute value of most film cooling effectiveness is above 0.1, the random error is less than 10%, and the average error is within 5%.

3. Numerical Method

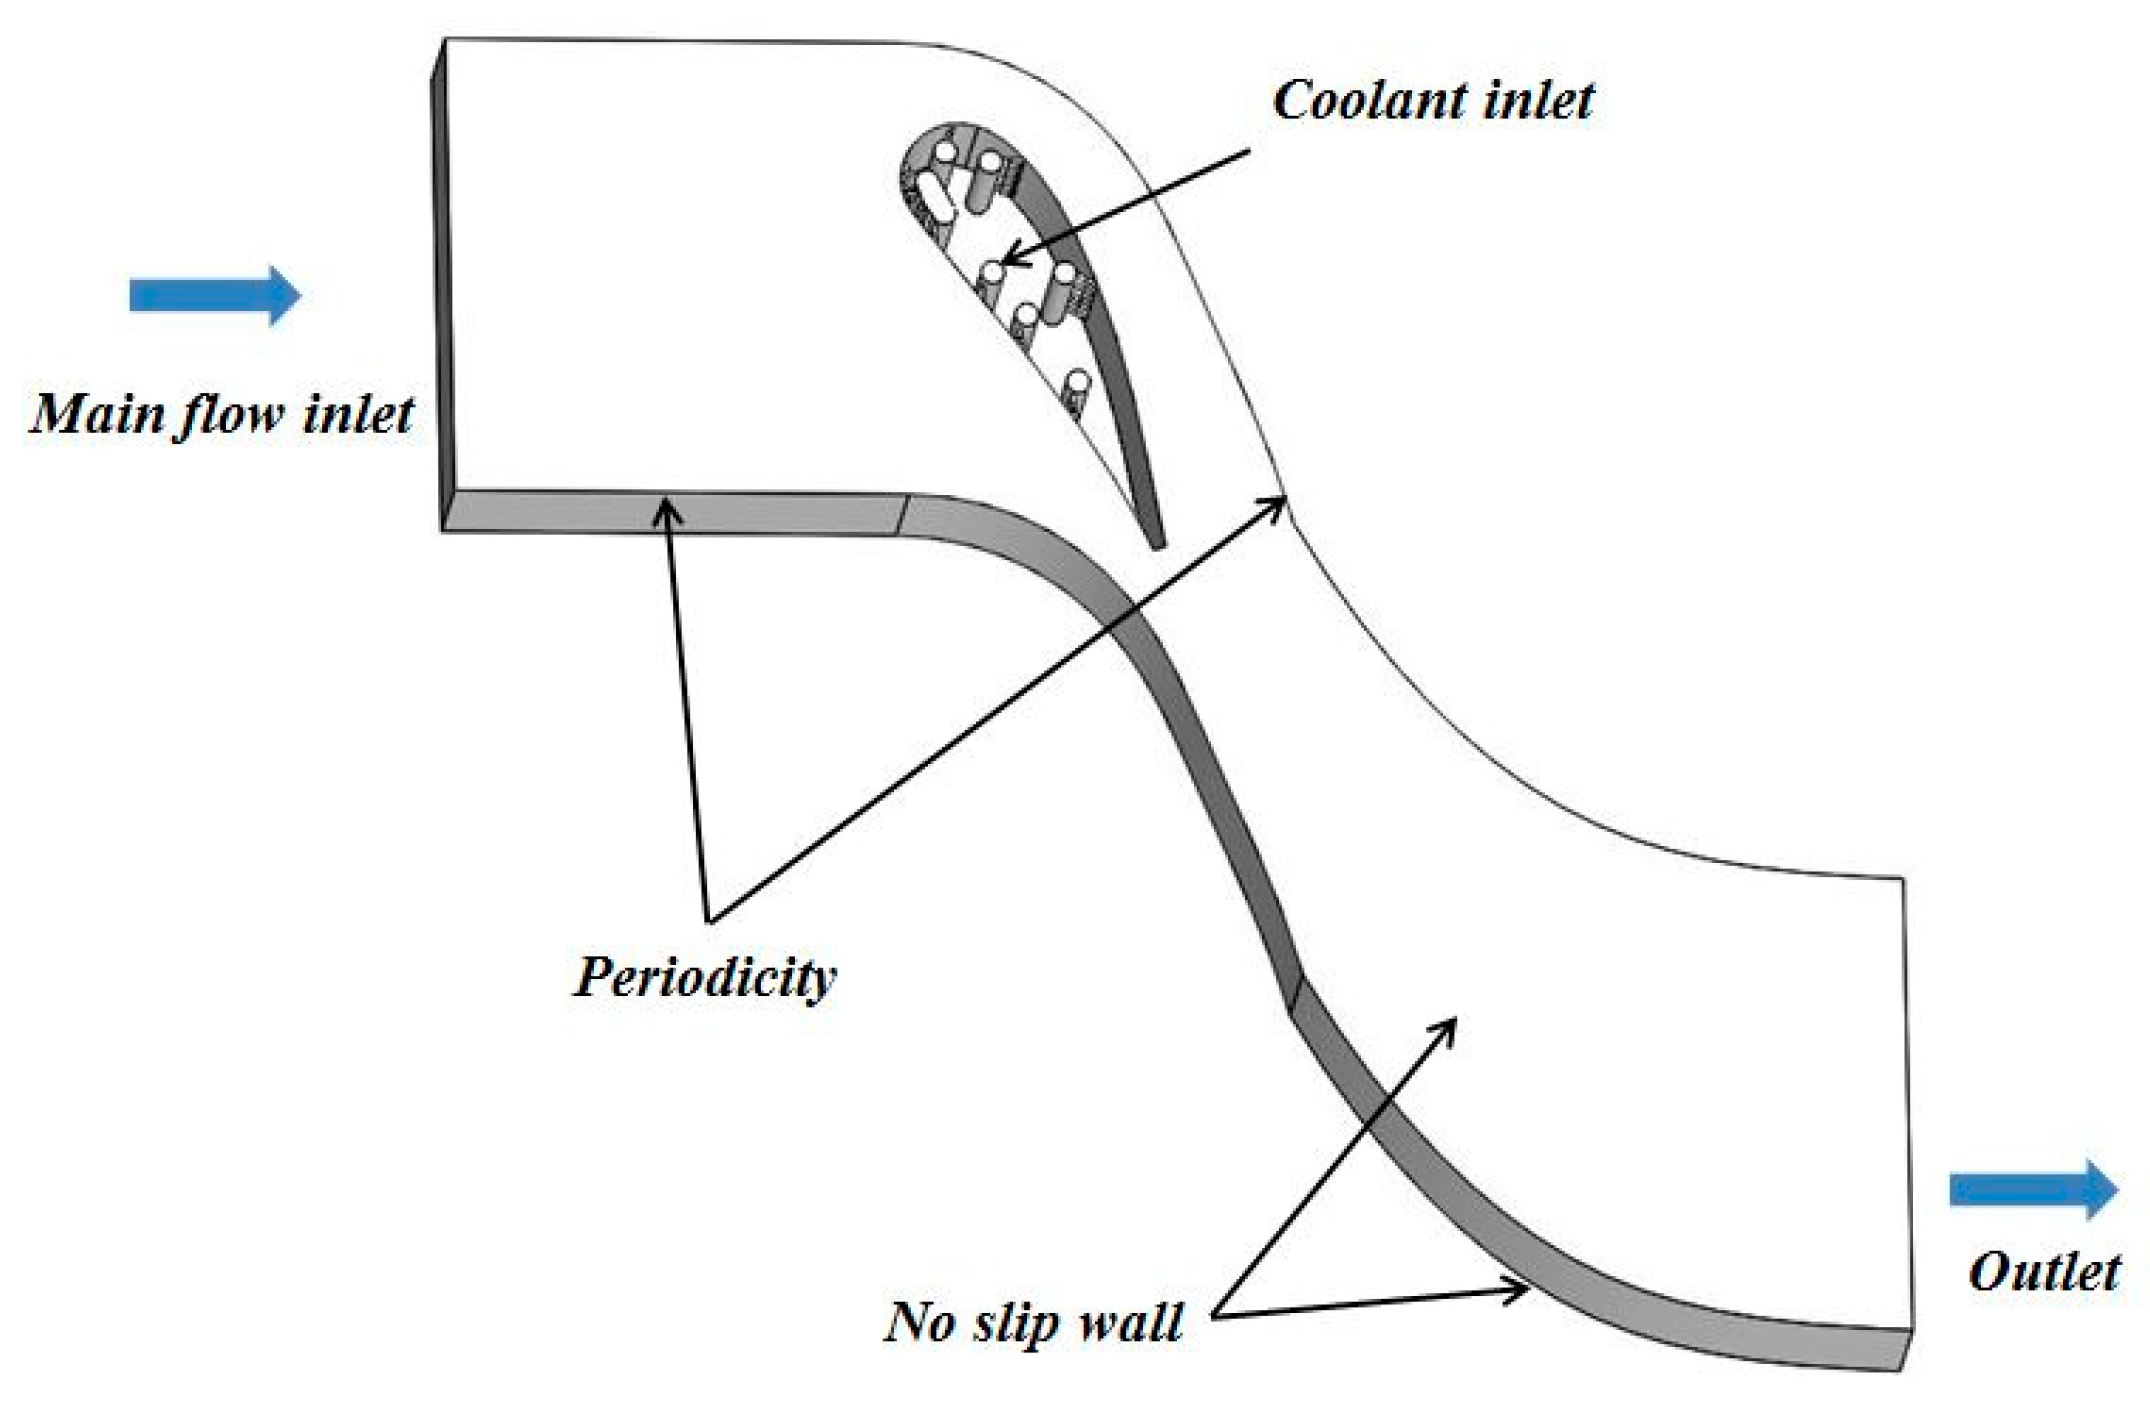
3.1. Domain and Boundary Conditions

Figure 7 shows the three-dimensional simulation domain, with a vane selected for the calculation. Periodic boundary conditions are set on both sides of the flow channel. The upper and lower surfaces are treated as non-slip walls. Seven cooling air supply chambers are used to supply air to the film holes. The main flow inlet boundary is set at about 1.5 C a x upstream of the vane leading edge, and the outlet boundary is positioned at approximately 2 C a x downstream of the vane trailing edge. The actual boundary conditions of the experiment are adopted for numerical calculation. The mainstream gas is considered the primary flow, while the cooling gas is air. The density ratio of the air/gas is 1.5. Mass flow inlet boundary conditions are applied for each cooling air supply chamber, which are determined by the corresponding blowing ratios. Table 3 presents the detailed boundary conditions for the CFD calculation, which are equivalent to the boundary conditions of the PSP experiment at normal atmospheric temperature.

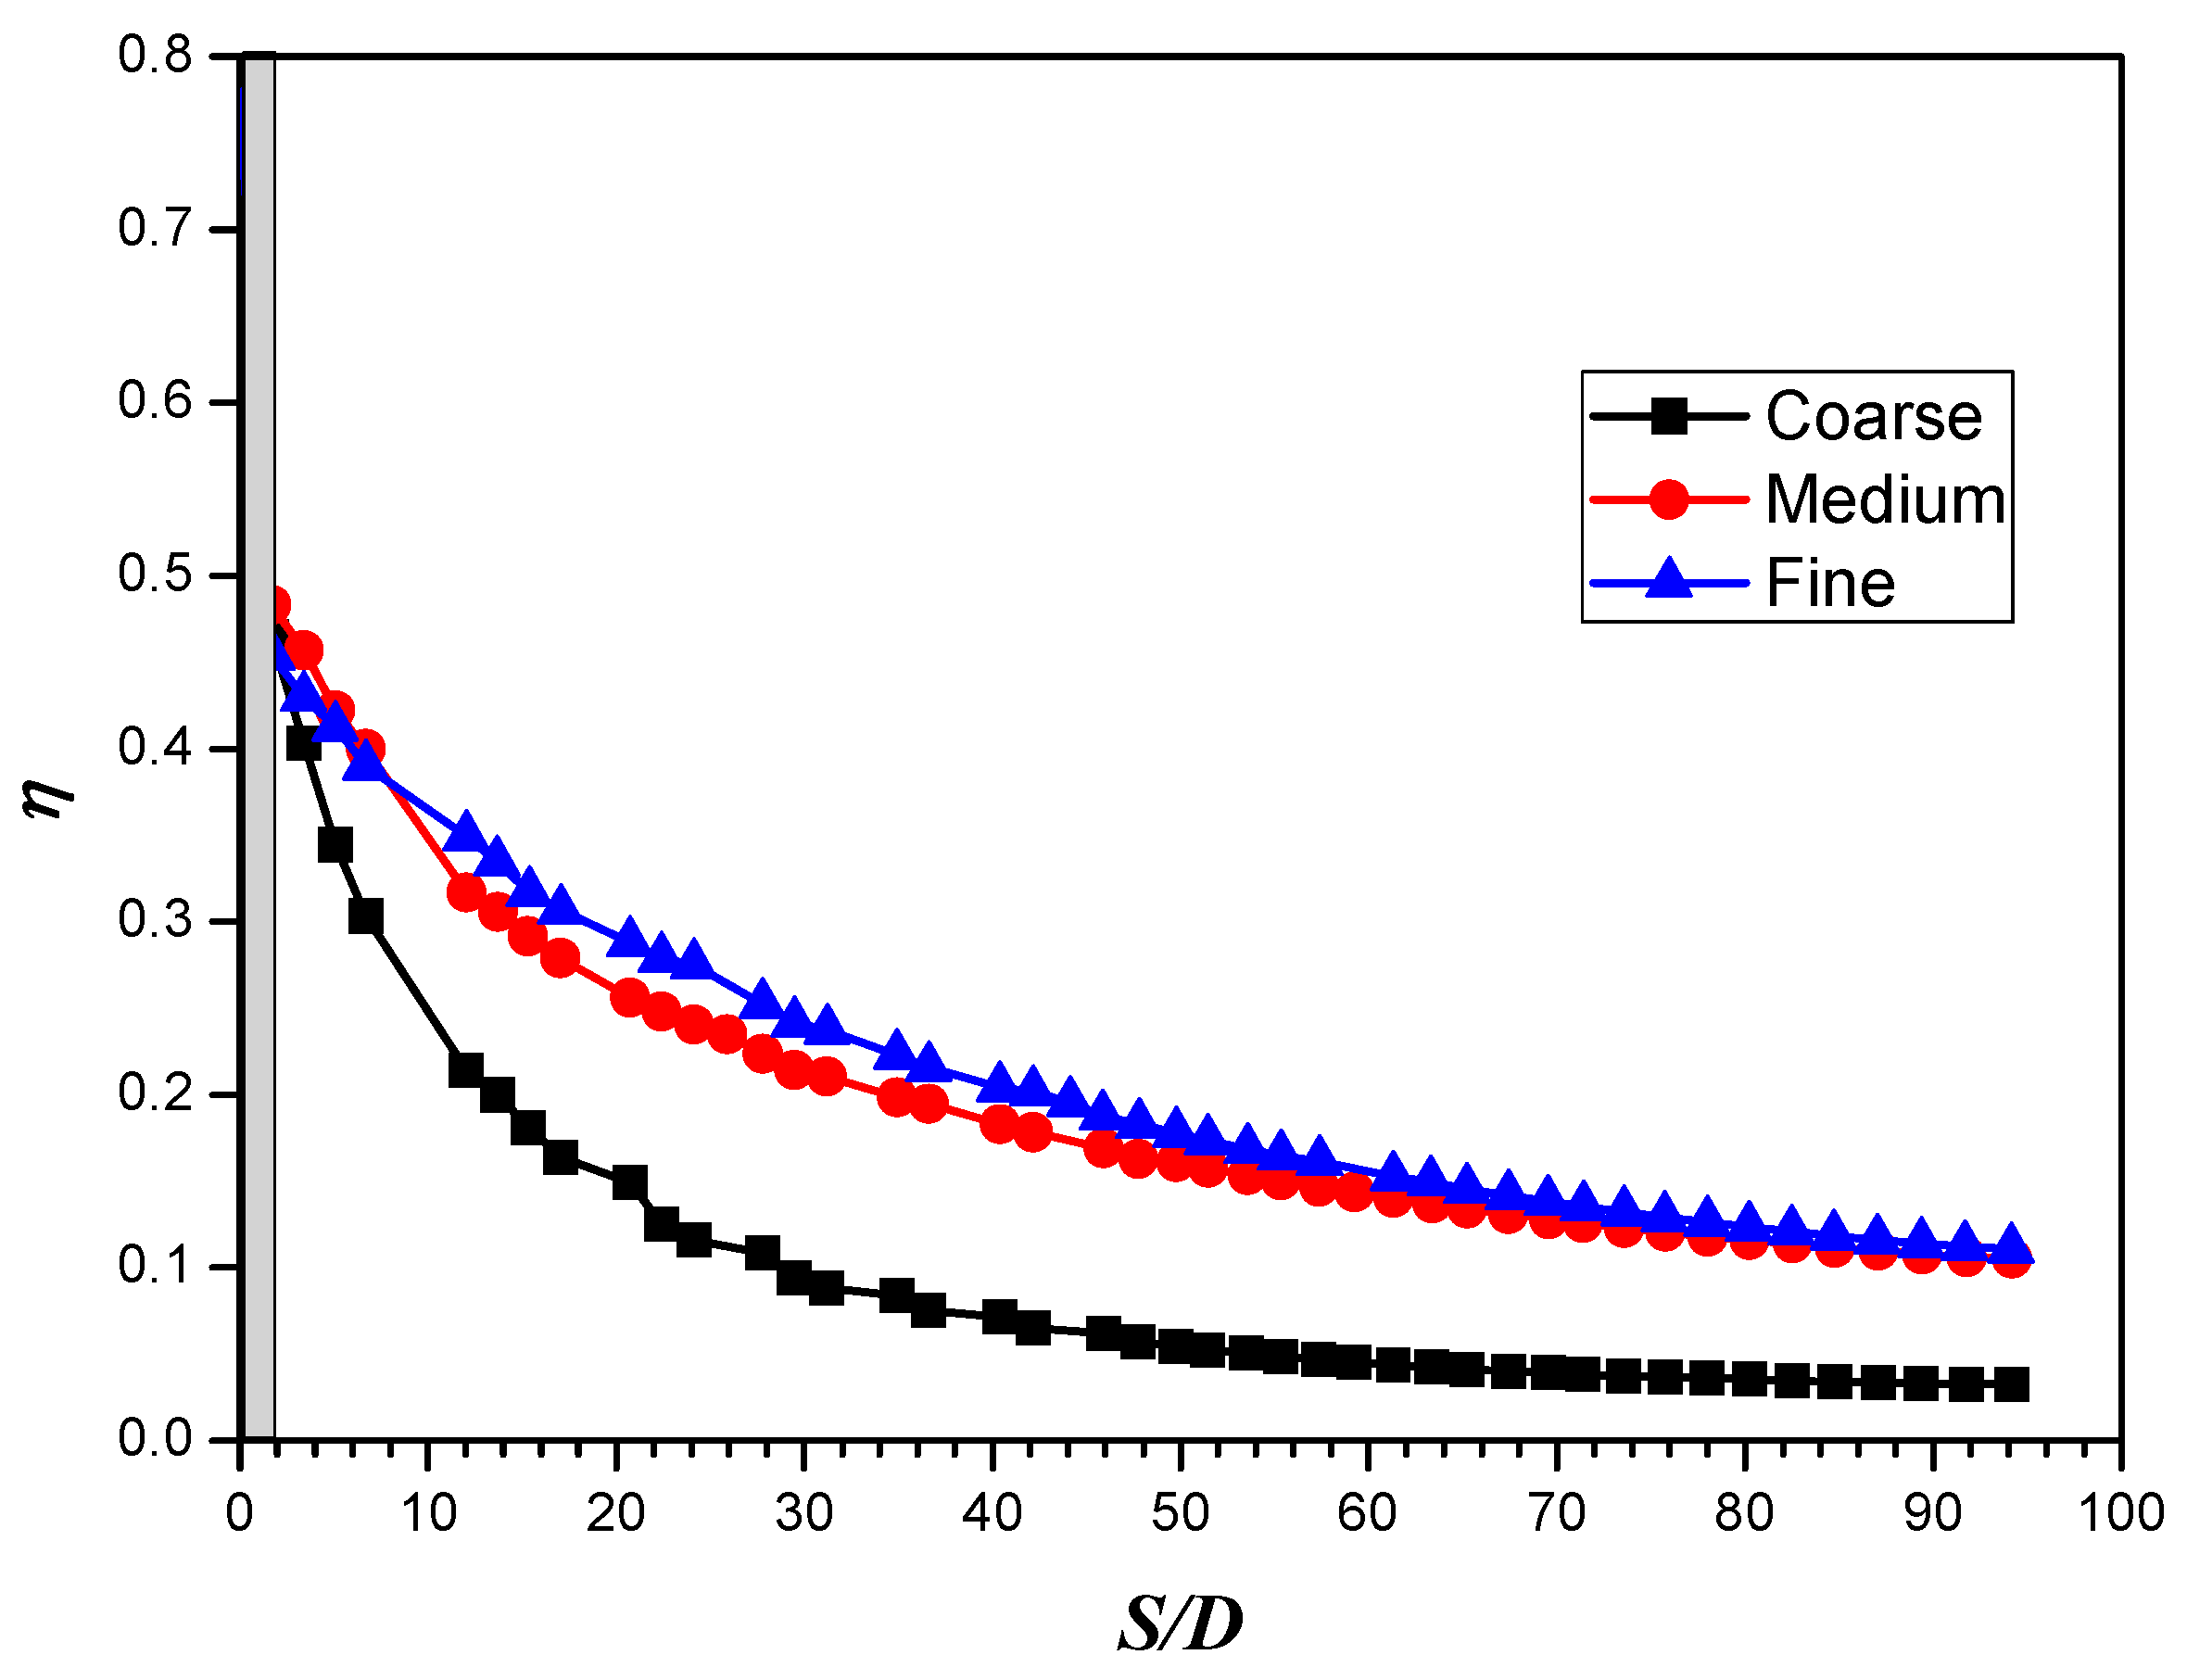
3.2. Computational Mesh

Figure 8 shows the generated grids, generated using ICEM CFD 2020 R2. The near-wall regions were divided into 20 prism boundary layer grids with a growth rate of 1.1. The values of the near-wall grid height were adjusted to ensure that they were within the range recommended by the turbulence models used. The other regions were divided into tetrahedral grids. Table 4 shows three sets of grid scales for calculating the film cooling effectiveness of P2 film holes. A grid sensitivity analysis is carried out with the SST turbulence model and a blowing ratio of 0.79. The calculation results, as shown in Figure 9, indicate that the cooling effectiveness of P2 film holes is significantly lower using the coarse grid scale, while the medium and fine grid scales yield similar results. Near the film holes (S/D < 10), as the grid resolution increases from medium to fine, the film cooling effectiveness exhibits a slight decrease. The possible reason is that as the grid resolution increases, viscous dissipation decreases, but more smaller vortices in the flow field can be resolved. This enhanced resolution of smaller-scale flow structures accelerates the mixing of hot mainstream gas with the coolant jet, potentially leading to a reduction in film cooling effectiveness near the holes. Despite the slight difference in results between medium and fine grids, particularly in the vicinity of the film holes, we have concluded that the medium grid offers sufficient accuracy for our research while maintaining reasonable computational efficiency. Considering the computing resource limitation, the medium grid scale is finally adopted.

3.3. Numerical Settings

The commercial CFD solver ANSYS CFX 2020 R2 is employed to calculate the film cooling effectiveness. The three-dimensional Reynolds-Averaged Navier–Stokes (RANS) equations are solved for compressible flow, assuming the ideal gas law for the equation of state [42]. The simulation is carried out with the actual operating conditions. Various turbulence models are applied to investigate their ability to predict film cooling effectiveness. The one-equation eddy viscosity model EVTE is the simplest and requires fewer computational resources [43]. The two-equation turbulence models are widely used in the turbomachinery industry because of their reliable accuracy. In this study, two models, namely k- ε [44] and SST [45], are used. The Reynolds stress model includes the algebraic Reynolds stress model and the differential Reynolds stress model [46]. The transfer equation is used to solve all components of the Reynolds tensor and dissipation rate. In this study, BSL-EARSM [47], k- ε -EARSM [48] (explicit algebraic Reynolds stress models) and SSG [49] (differential Reynolds stress model) are used. All equations are discretized with second-order accuracy.

4. Results and Discussion

4.1. Vane Loading

Figure 10 compares the measured static pressure and the numerical calculation under the design conditions. It can be found that the static pressure test results are in good agreement with the periodic numerical calculation results. In addition, the influence of different turbulence intensities on the pressure distribution is studied, as shown in Figure 11. The results reveal that the pressure distribution on the vane surface has little change under different turbulence intensities.

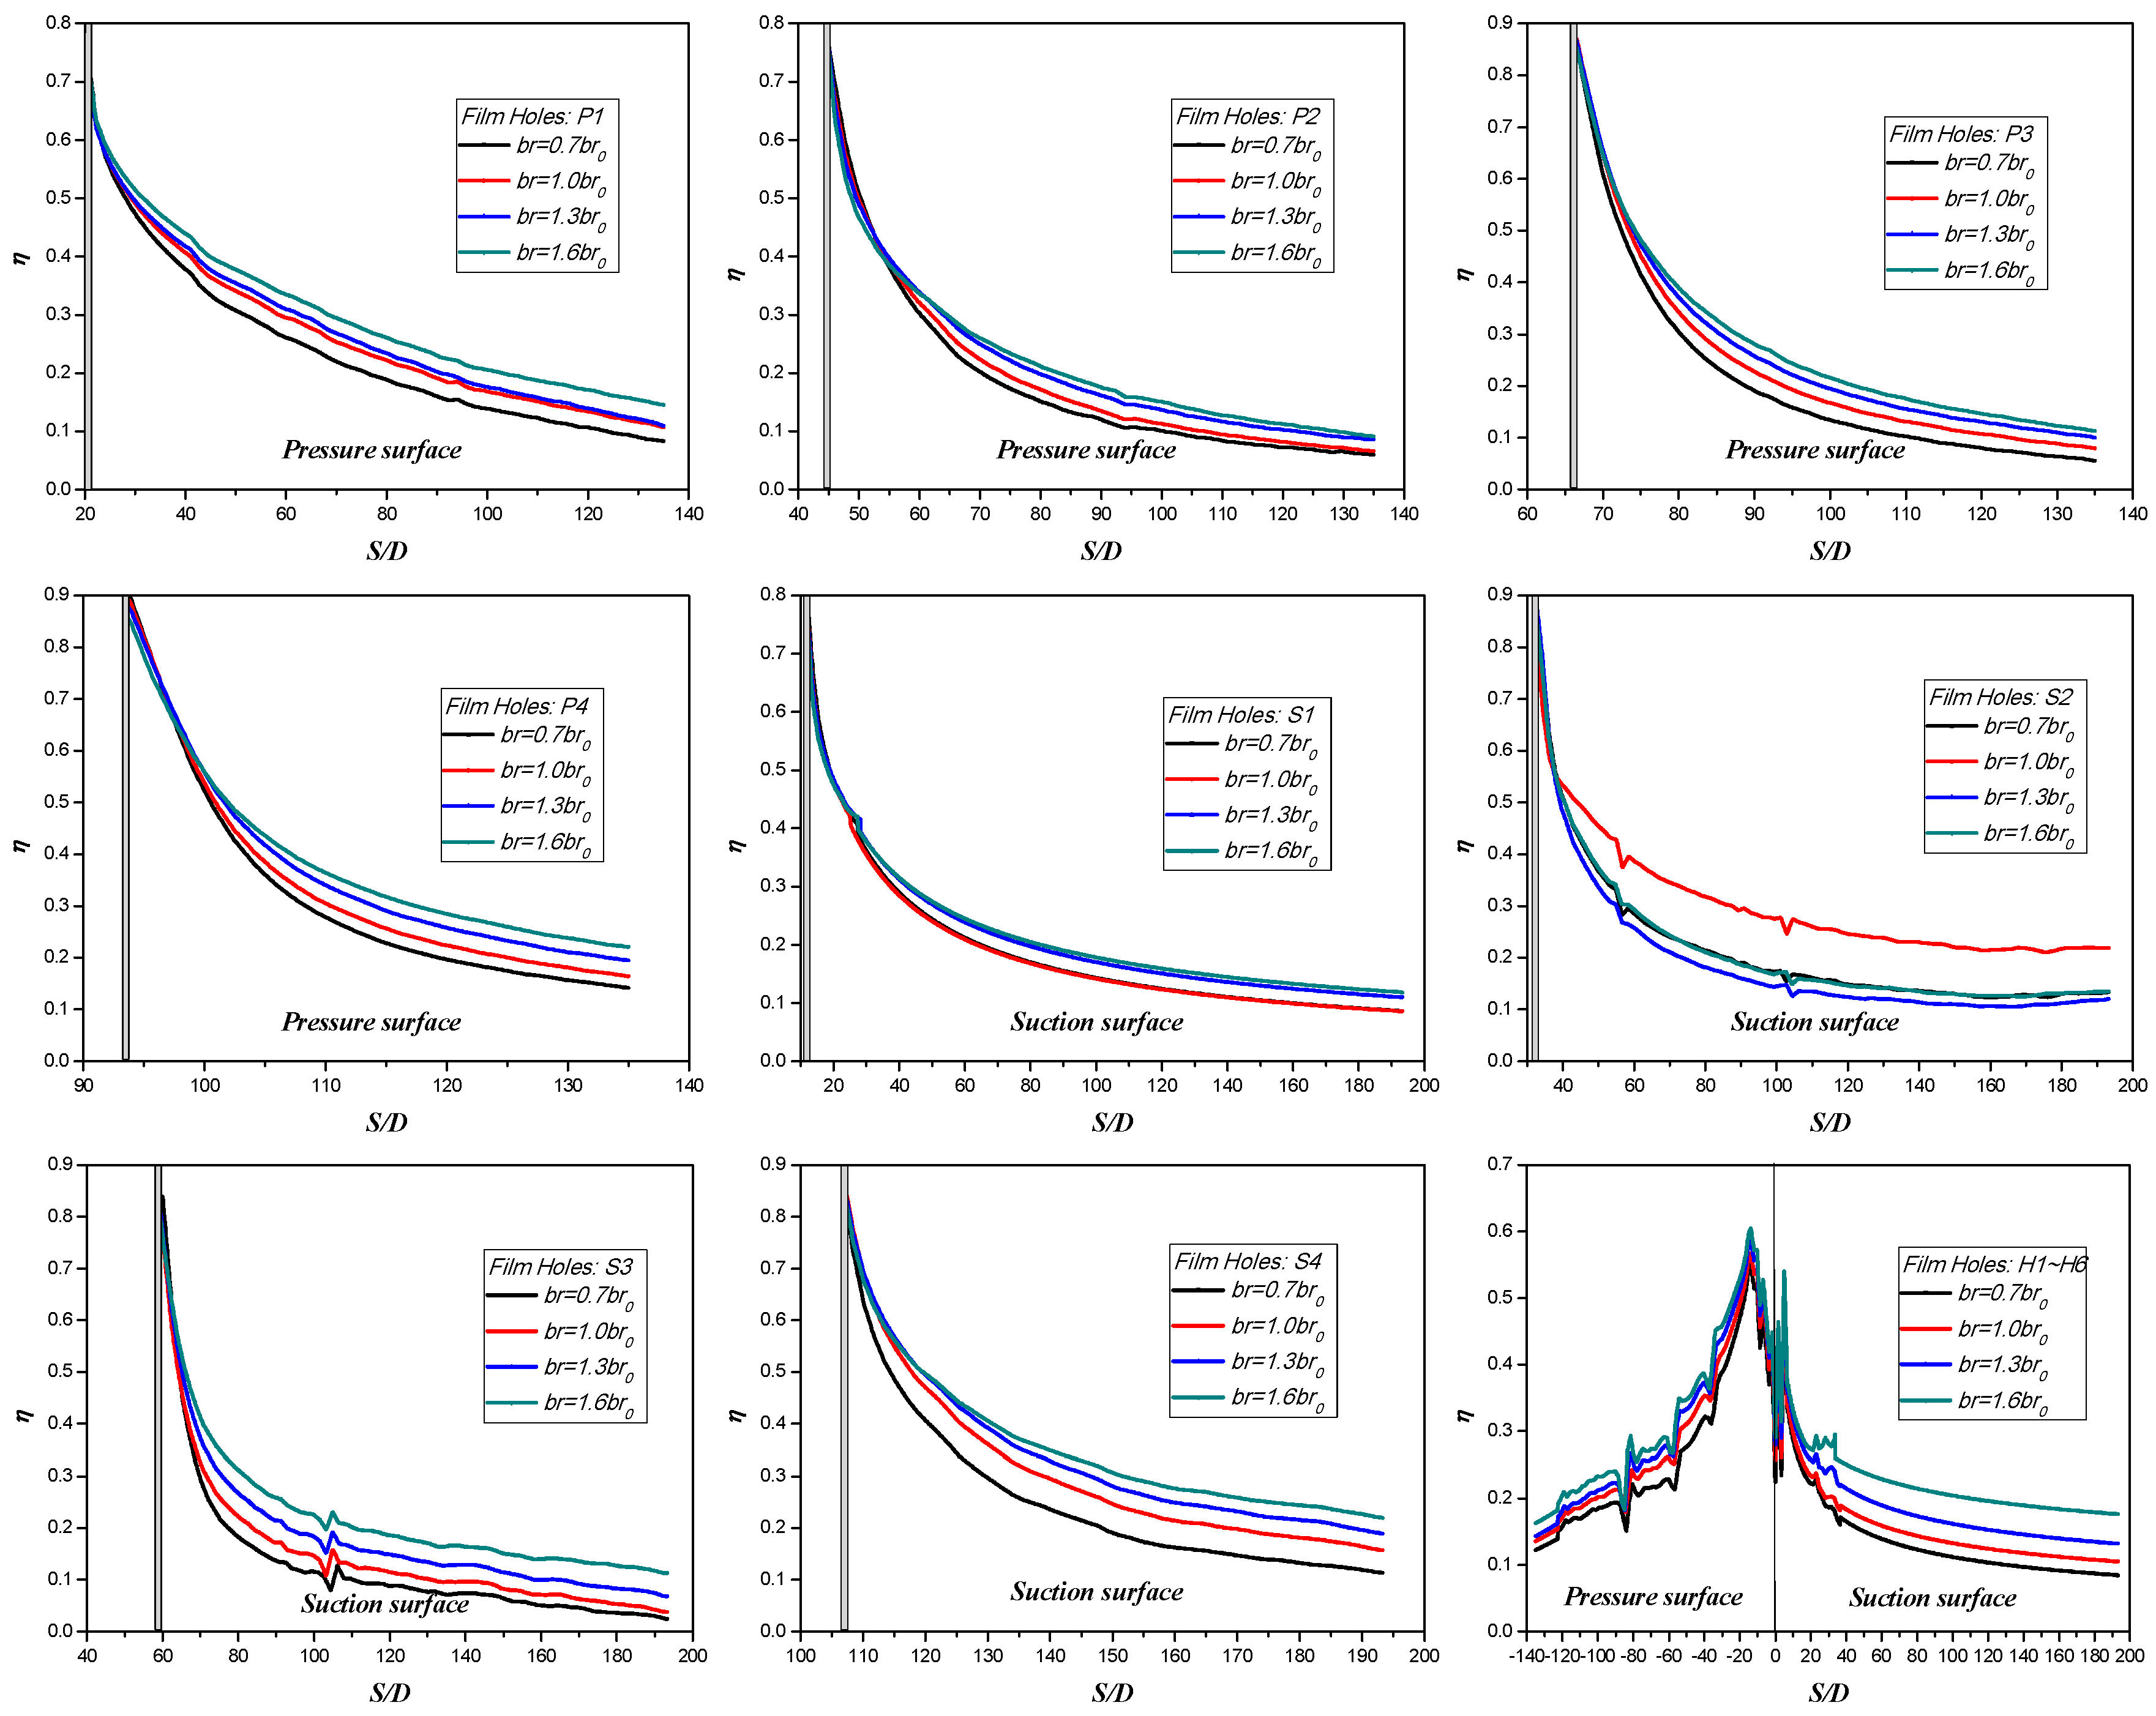
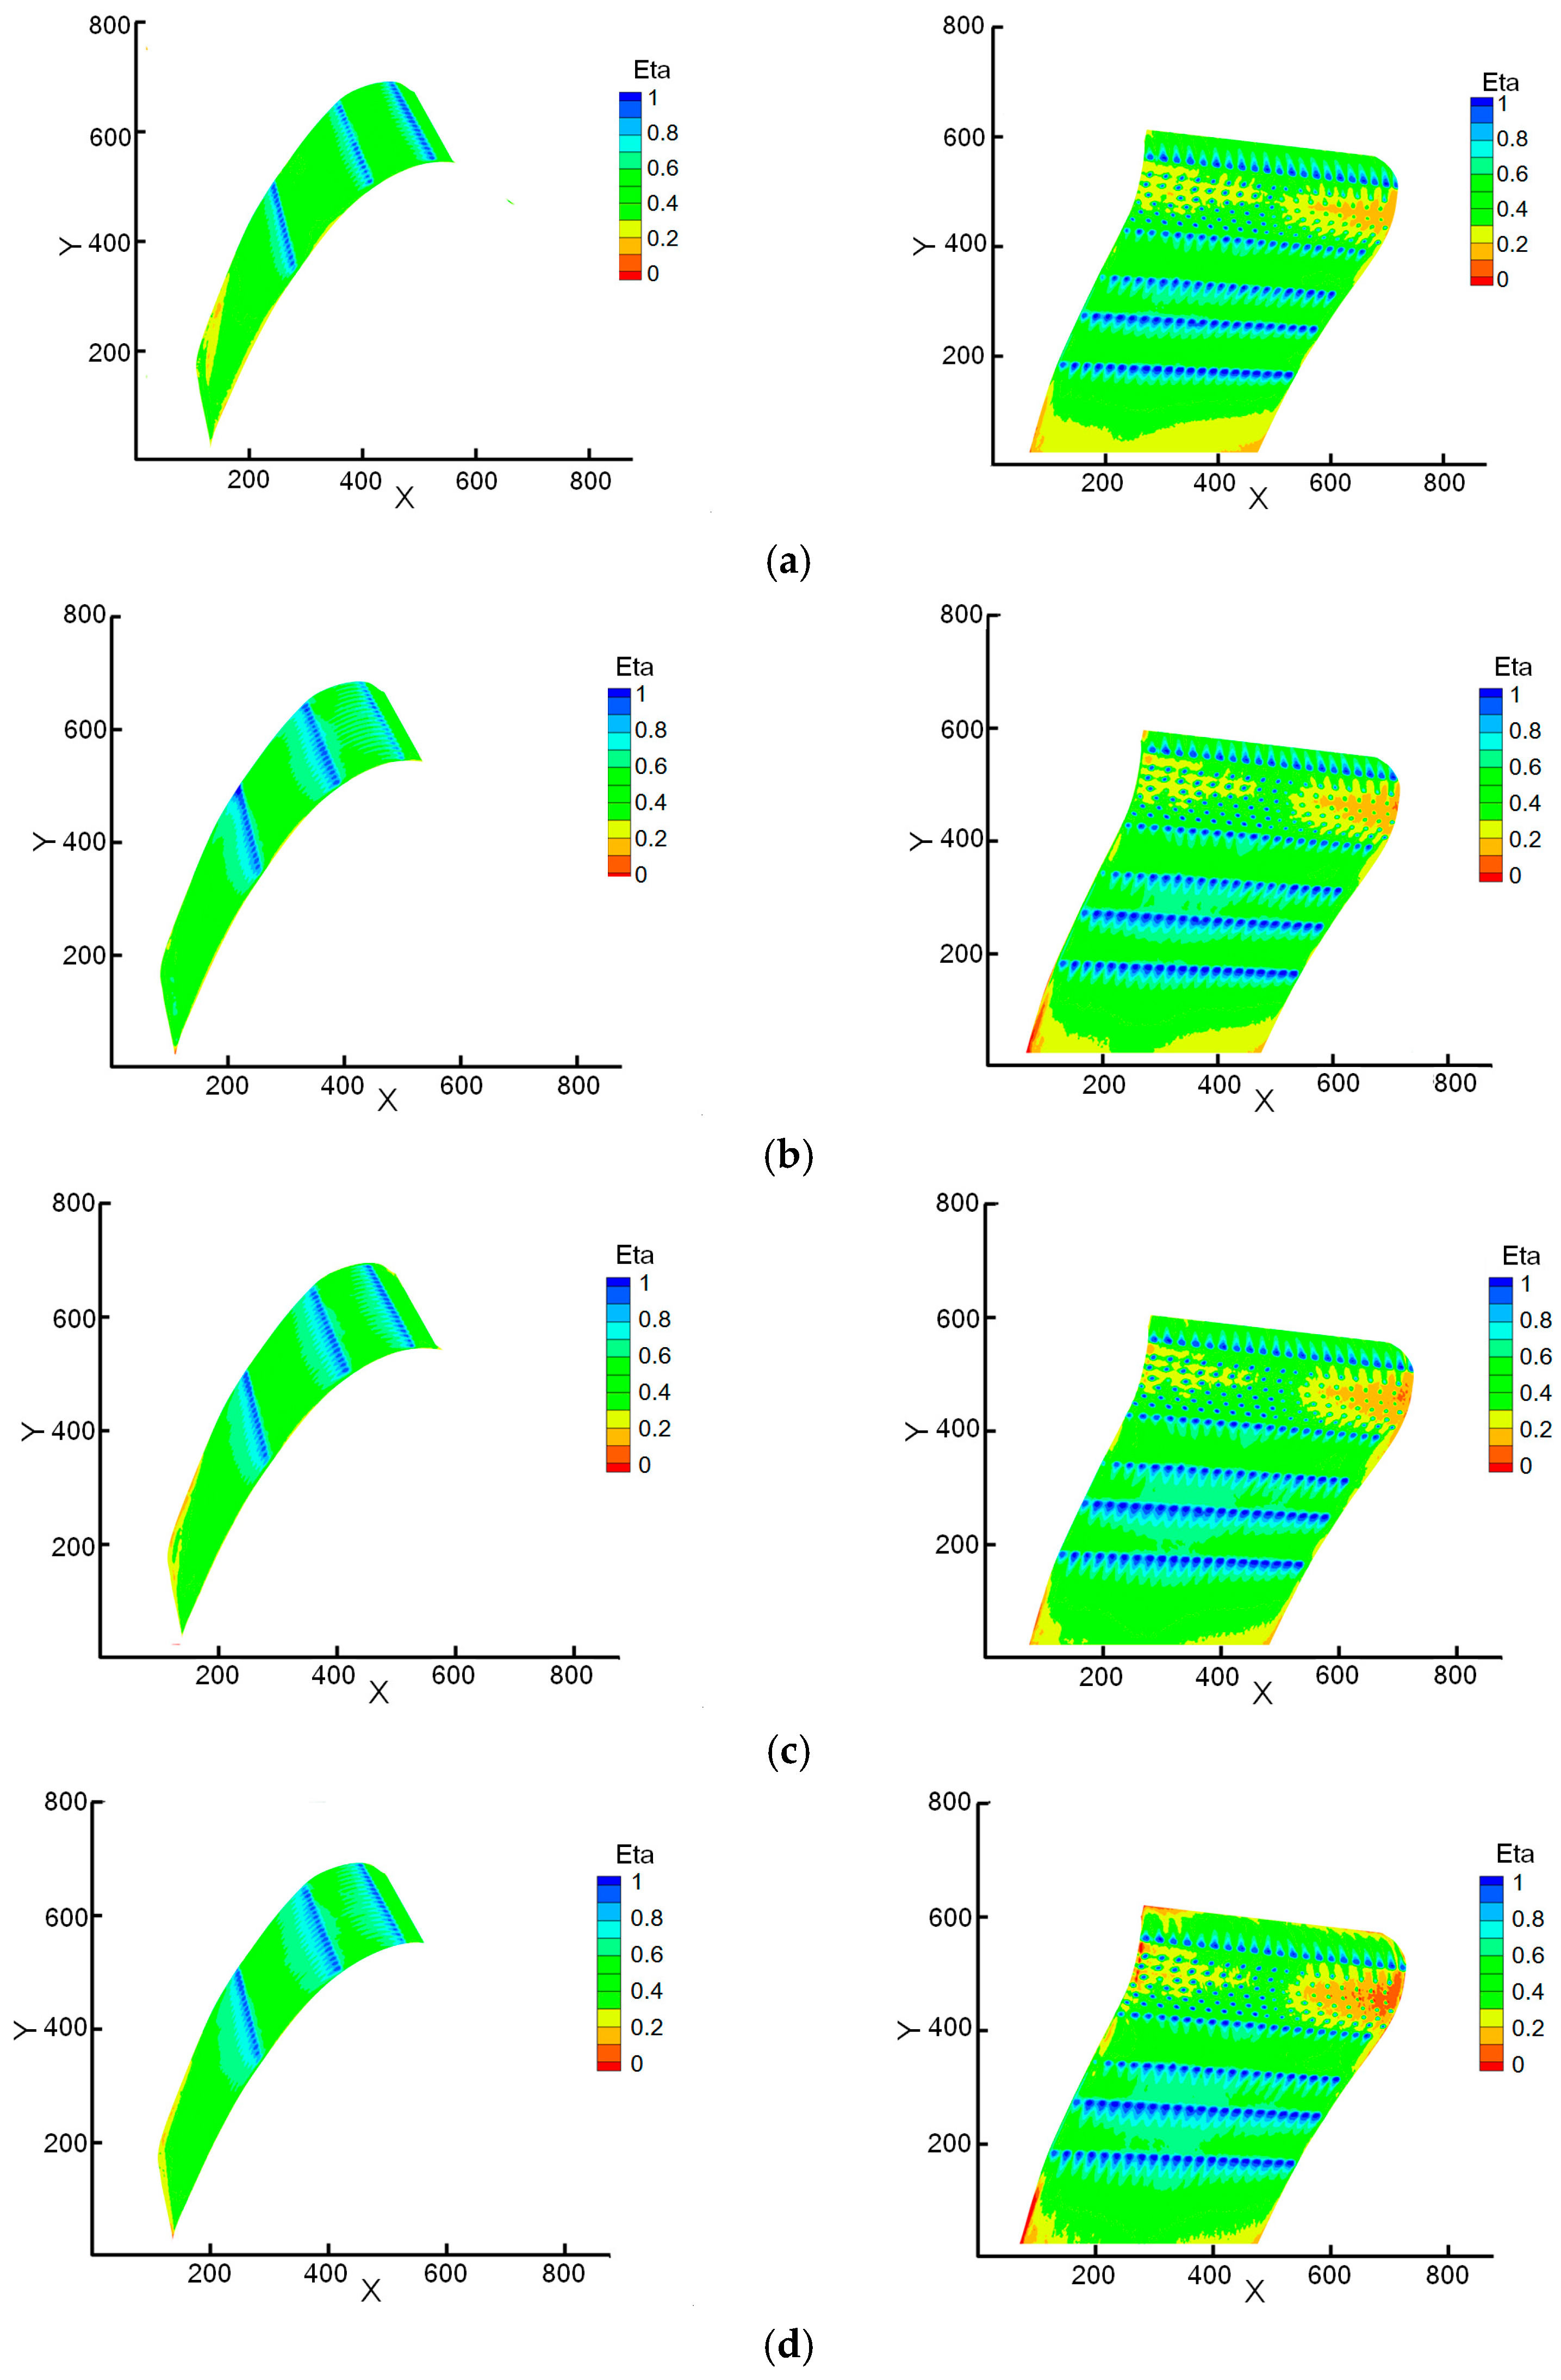
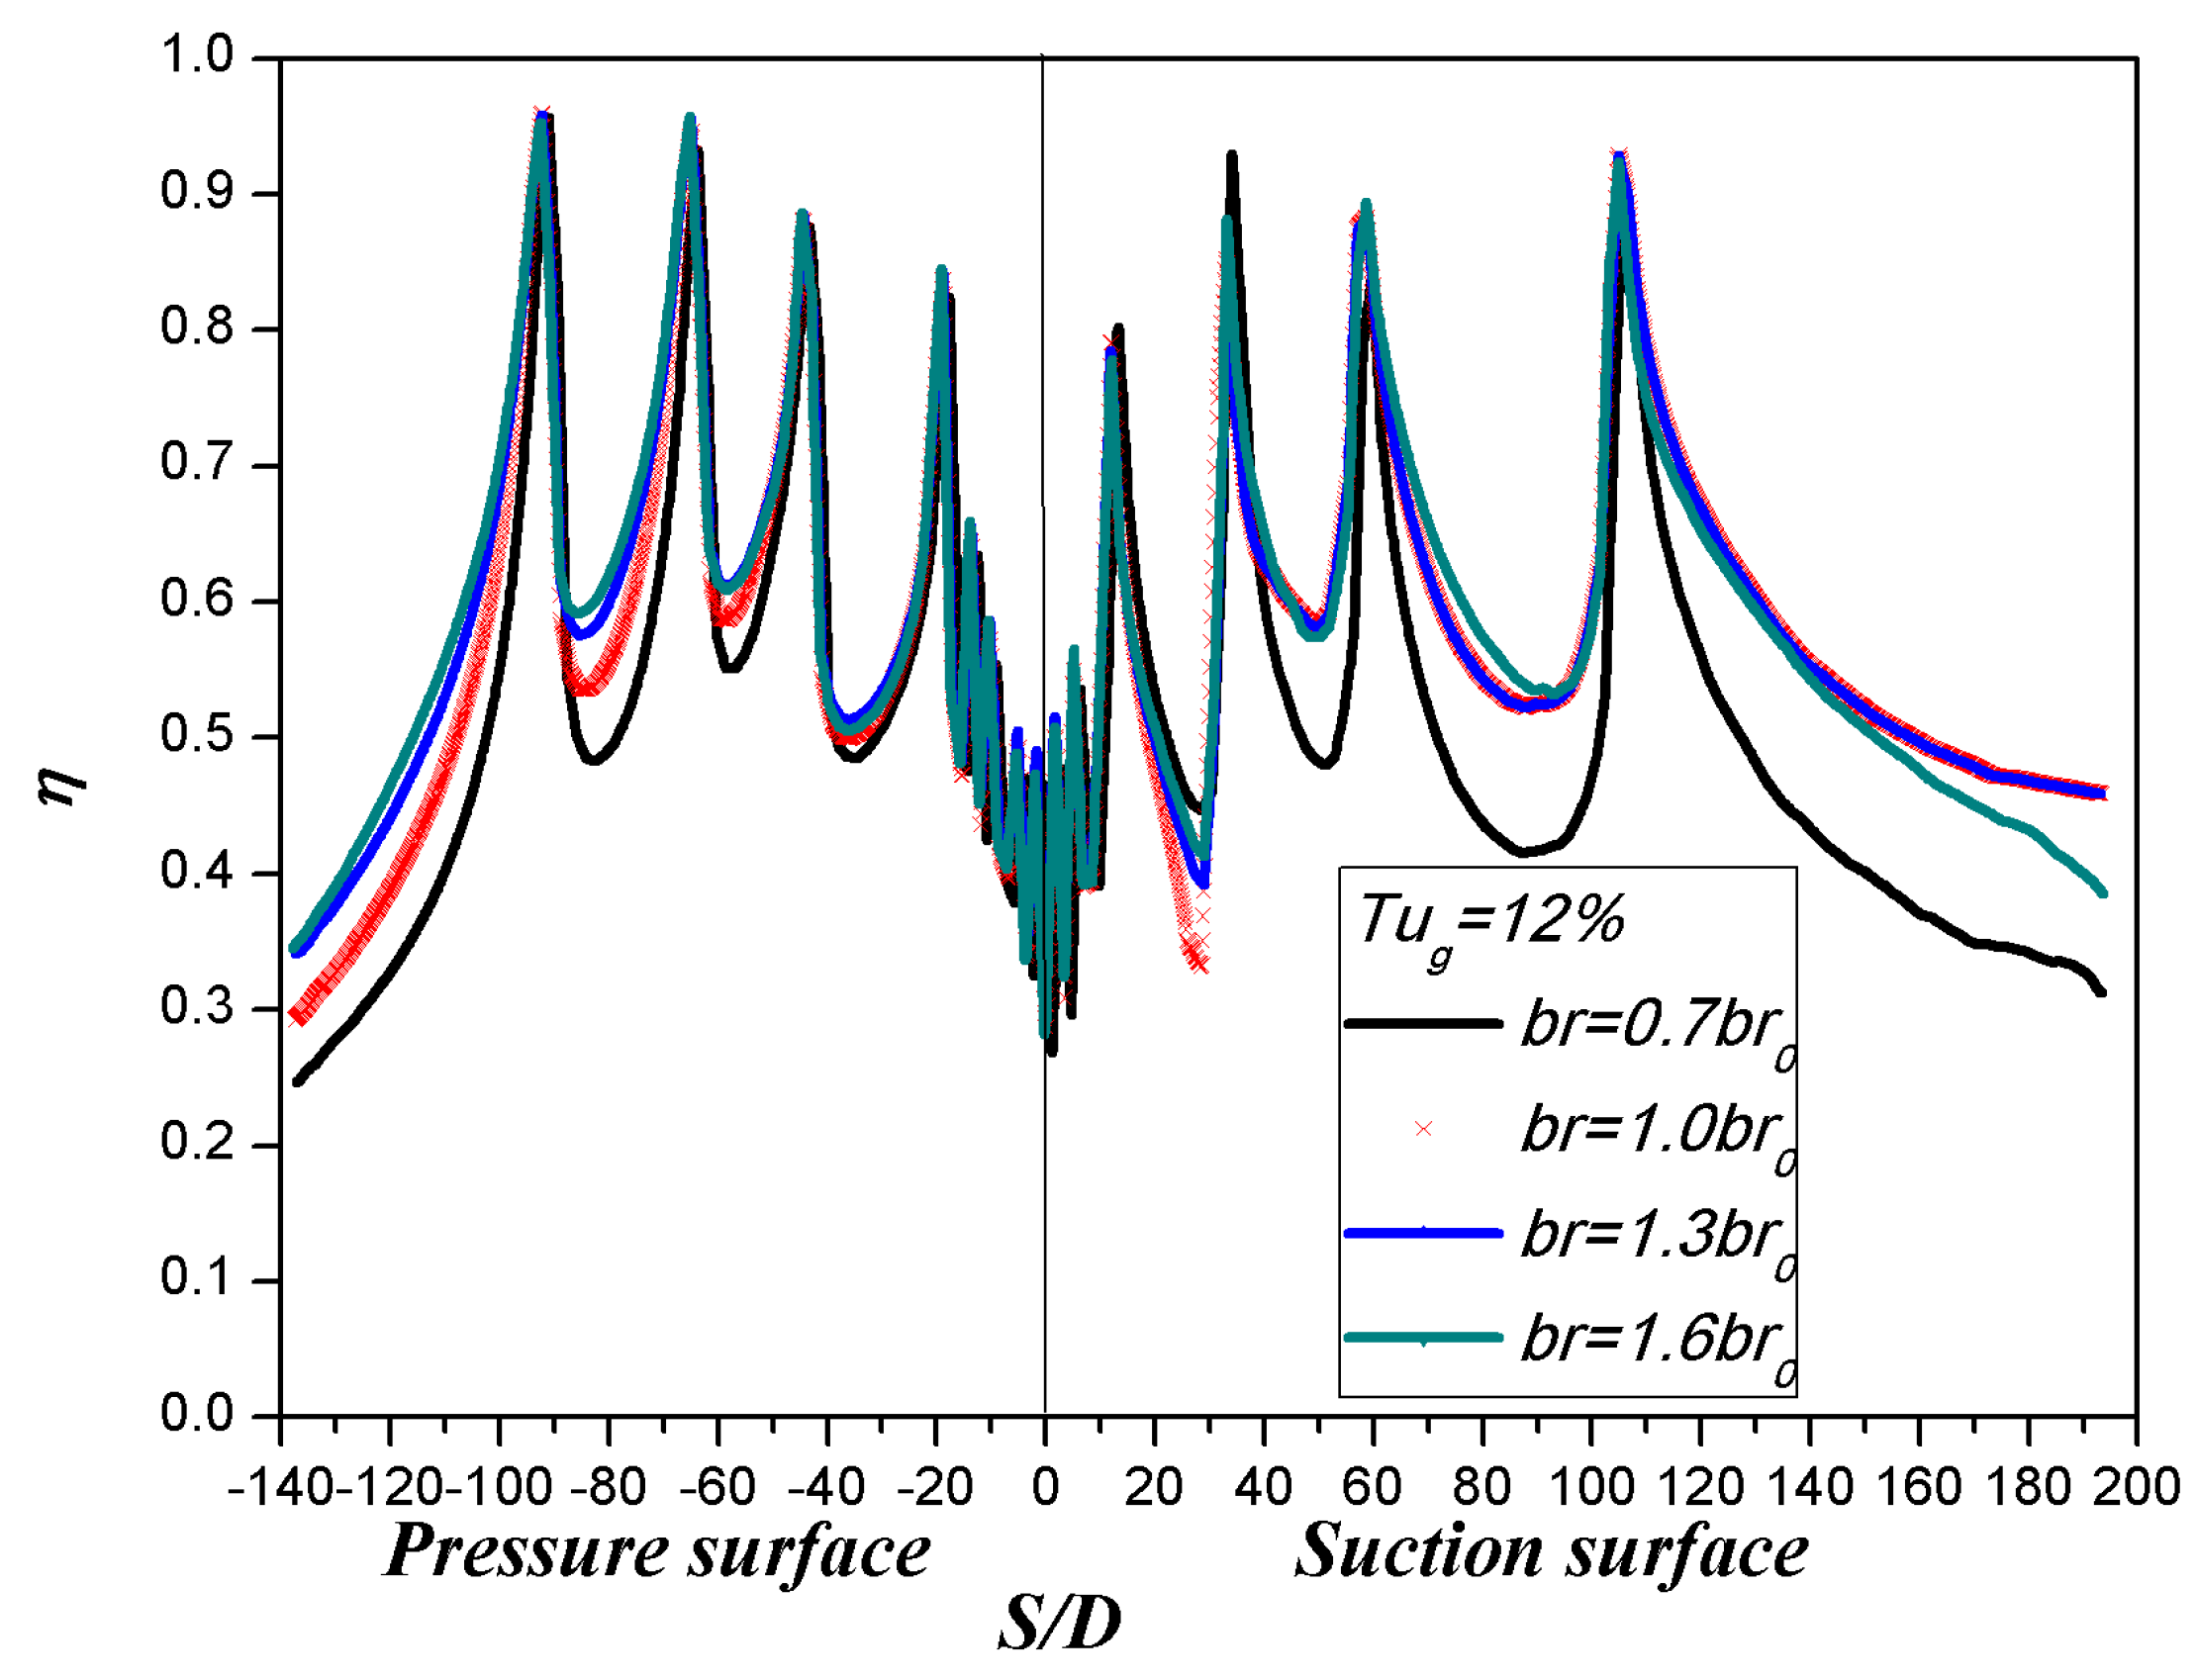
4.2. Effect of Blowing Ratio

According to the research on the film cooling characteristics of single-row holes on a flat plate, three different states are observed as the blowing ratio changes from low to high: complete attachment, partial separation, reattachment, and blowing away. When the blowing ratio is relatively small, the air film is basically attached to the wall. Increasing the blowing ratio within this range significantly increases the film cooling effectiveness, because the increased cooling flow remains basically attached to the surface. However, when the blowing ratio is further increased and the film separation occurs, the cooling effectiveness does not increase significantly, or may even decrease, because the film jet fails to completely attach to the surface. Therefore, there is generally an optimal blowing ratio for single-row film holes. Below the optimal blowing ratio, the film cooling effectiveness increases significantly with the blowing ratio. While above the optimal blowing ratio, the cooling effectiveness tends to plateau or slightly decrease, unless the film is completely blown away.
Figure 12 illustrates the effect of different blowing ratios on the spanwise average film effectiveness distribution of single-row film holes. Most of the film near the film holes resides in the region of complete attachment or partial separation and reattachment. Increasing the blowing ratio does not lead to a significant increase in the cooling effectiveness, as the film jet fails to fully attach to the surface, or may even detach partially, resulting in decreased effectiveness. For example, when the blowing ratio of P2 and P4 holes increases to 1.6 b r 0 , the film cooling effectiveness begins to decline. However, in the region far downstream of the film holes, the film remains largely attached to the wall. Within this range, increasing the blowing ratio substantially enhances the surface film cooling effectiveness, because the increased cooling air is basically attached to the surface. In addition, due to the curvature and pressure gradient at different positions on the pressure surface and suction surface, the effect of the blowing ratio differs. Special attention should be given to the S2 film holes, as their film cooling effectiveness is significantly affected by the large curvature at this position. The optimal blowing ratio is basically achieved at the design blowing ratio ( 1.0 b r 0 ), and both increasing and decreasing the blowing ratio lead to a significant decrease in the film cooling effectiveness.
According to the current experimental results, the blowing ratio under the current design condition is deemed reasonable. Permitting an increase in cooling flow can effectively increase the blowing ratio, thereby improving the film cooling effectiveness far downstream of the vane, except for the S2 film holes.
Figure 13 shows the contours of adiabatic film cooling effectiveness from experimental measurements under different blowing ratios at T u g = 12%. Figure 14 shows the spanwise averaged film cooling effectiveness of multirow film holes under different blowing ratios at T u g = 12%. The superposition of film cooling effectiveness provides a more realistic reflection of the influences of factors on the film cooling performance, such as multirow superposition, curvature, pressure gradient, and so on. Under the current design condition, the film holes of P1, P2, S2, S3, and S4 are basically in the optimal state, within the range of complete wall attachment and partial separation and reattachment. At this state, an increase in the blowing ratio does not result in a significant improvement in cooling effectiveness. The film cooling effectiveness after S1 holes is the worst, indicating a need to reduce the blowing ratio for S1. The film after P3 and P4 holes is in the state of complete wall attachment, and the cooling effectiveness increases with an increase in blowing ratio, which indicates that the film cooling effectiveness in this region has the potential to be further improved by increasing the cooling flow. It is important to note that a low blowing ratio has a great influence on the cooling effectiveness of the film holes on the suction surface, which leads to poor attachment to the wall far downstream of the film hole. Therefore, during the actual design process, it is not recommended to design a blowing ratio that is too low on the suction surface.

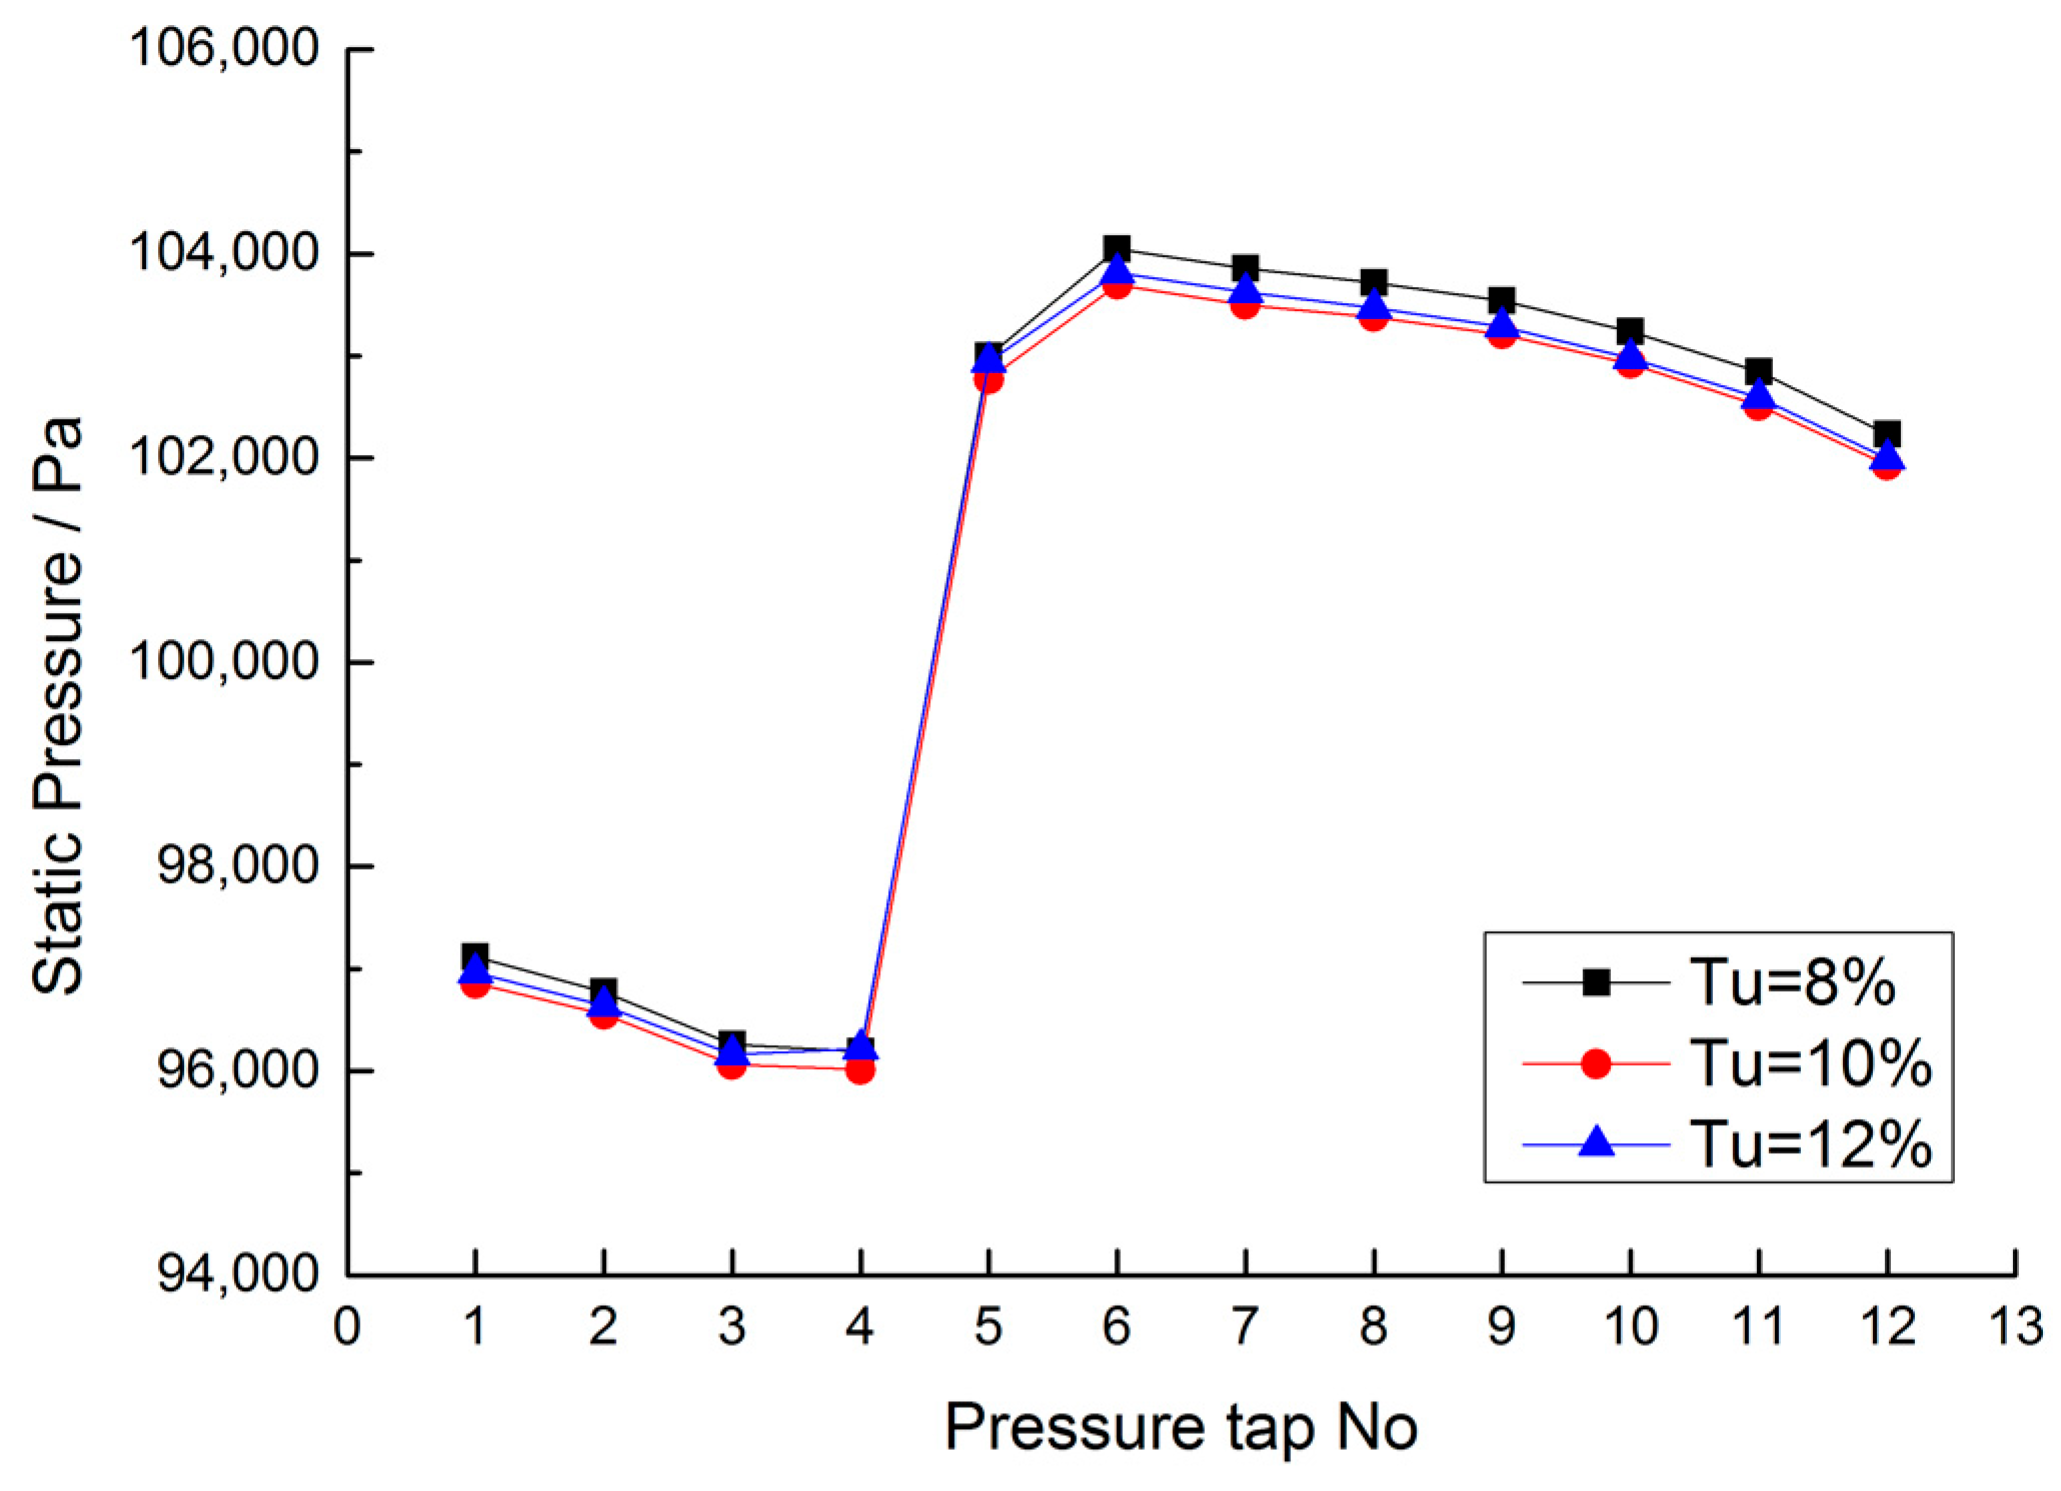
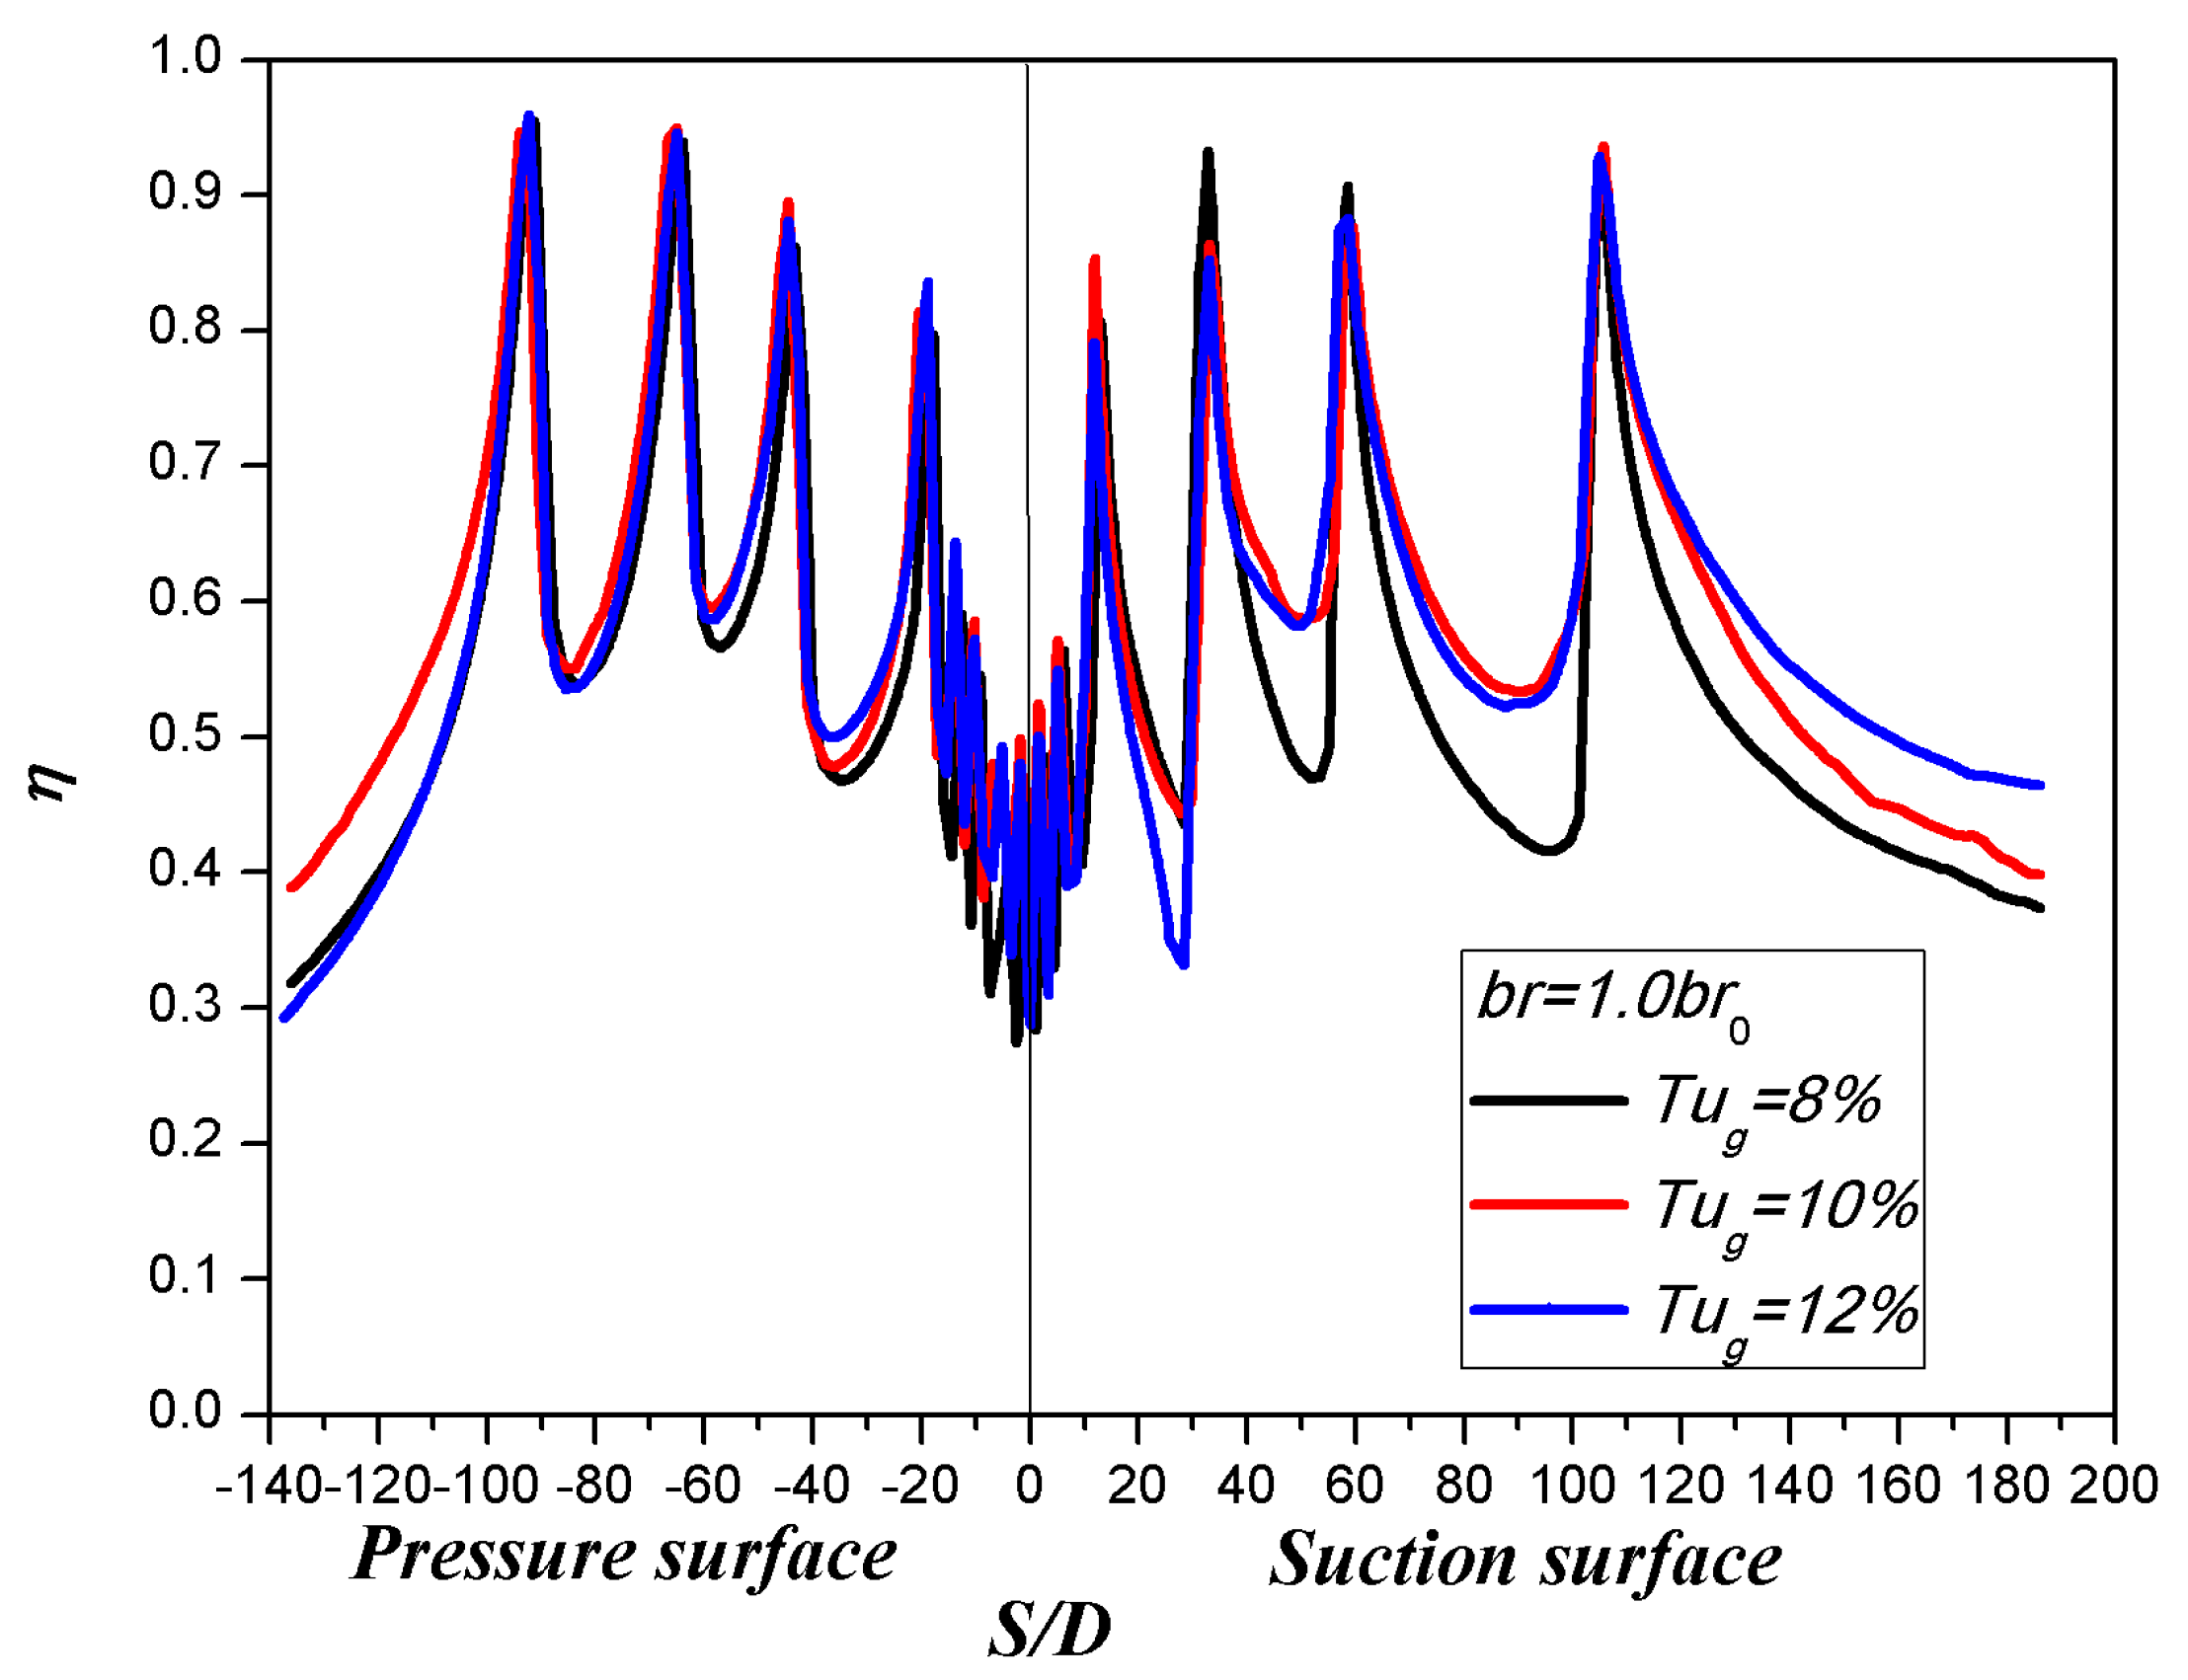
4.3. Effect of Turbulence Intensity

Figure 15 shows contours of adiabatic film cooling effectiveness from experimental measurements under different turbulence intensities at b r = 1.0 b r 0 . Figure 16 illustrates the spanwise averaged film cooling effectiveness of multirow film holes under different turbulence intensities at b r = 1.0 b r 0 . The results indicate that with the increase in turbulence, the film cooling effectiveness on the pressure side changes little. However, on the suction side, the overall film cooling effectiveness increases significantly when the turbulence intensity increases from 8% to 10%. Beyond this point, further increases in turbulence intensity do not result in significant changes in film cooling effectiveness. Under the current design condition, the blowing ratio of many film holes causes the film to be basically in a state of partial separation and reattachment. The disturbance caused by the increase in turbulence redirects a portion of the cooling air that has been blown away back toward the wall, thereby enhancing the film coverage and film cooling effectiveness. However, as the turbulence increases further, the cooling effectiveness undergoes a slight change or even decrease. It is worth noting that the curvature has a greater impact on the suction surface compared to the pressure surface.

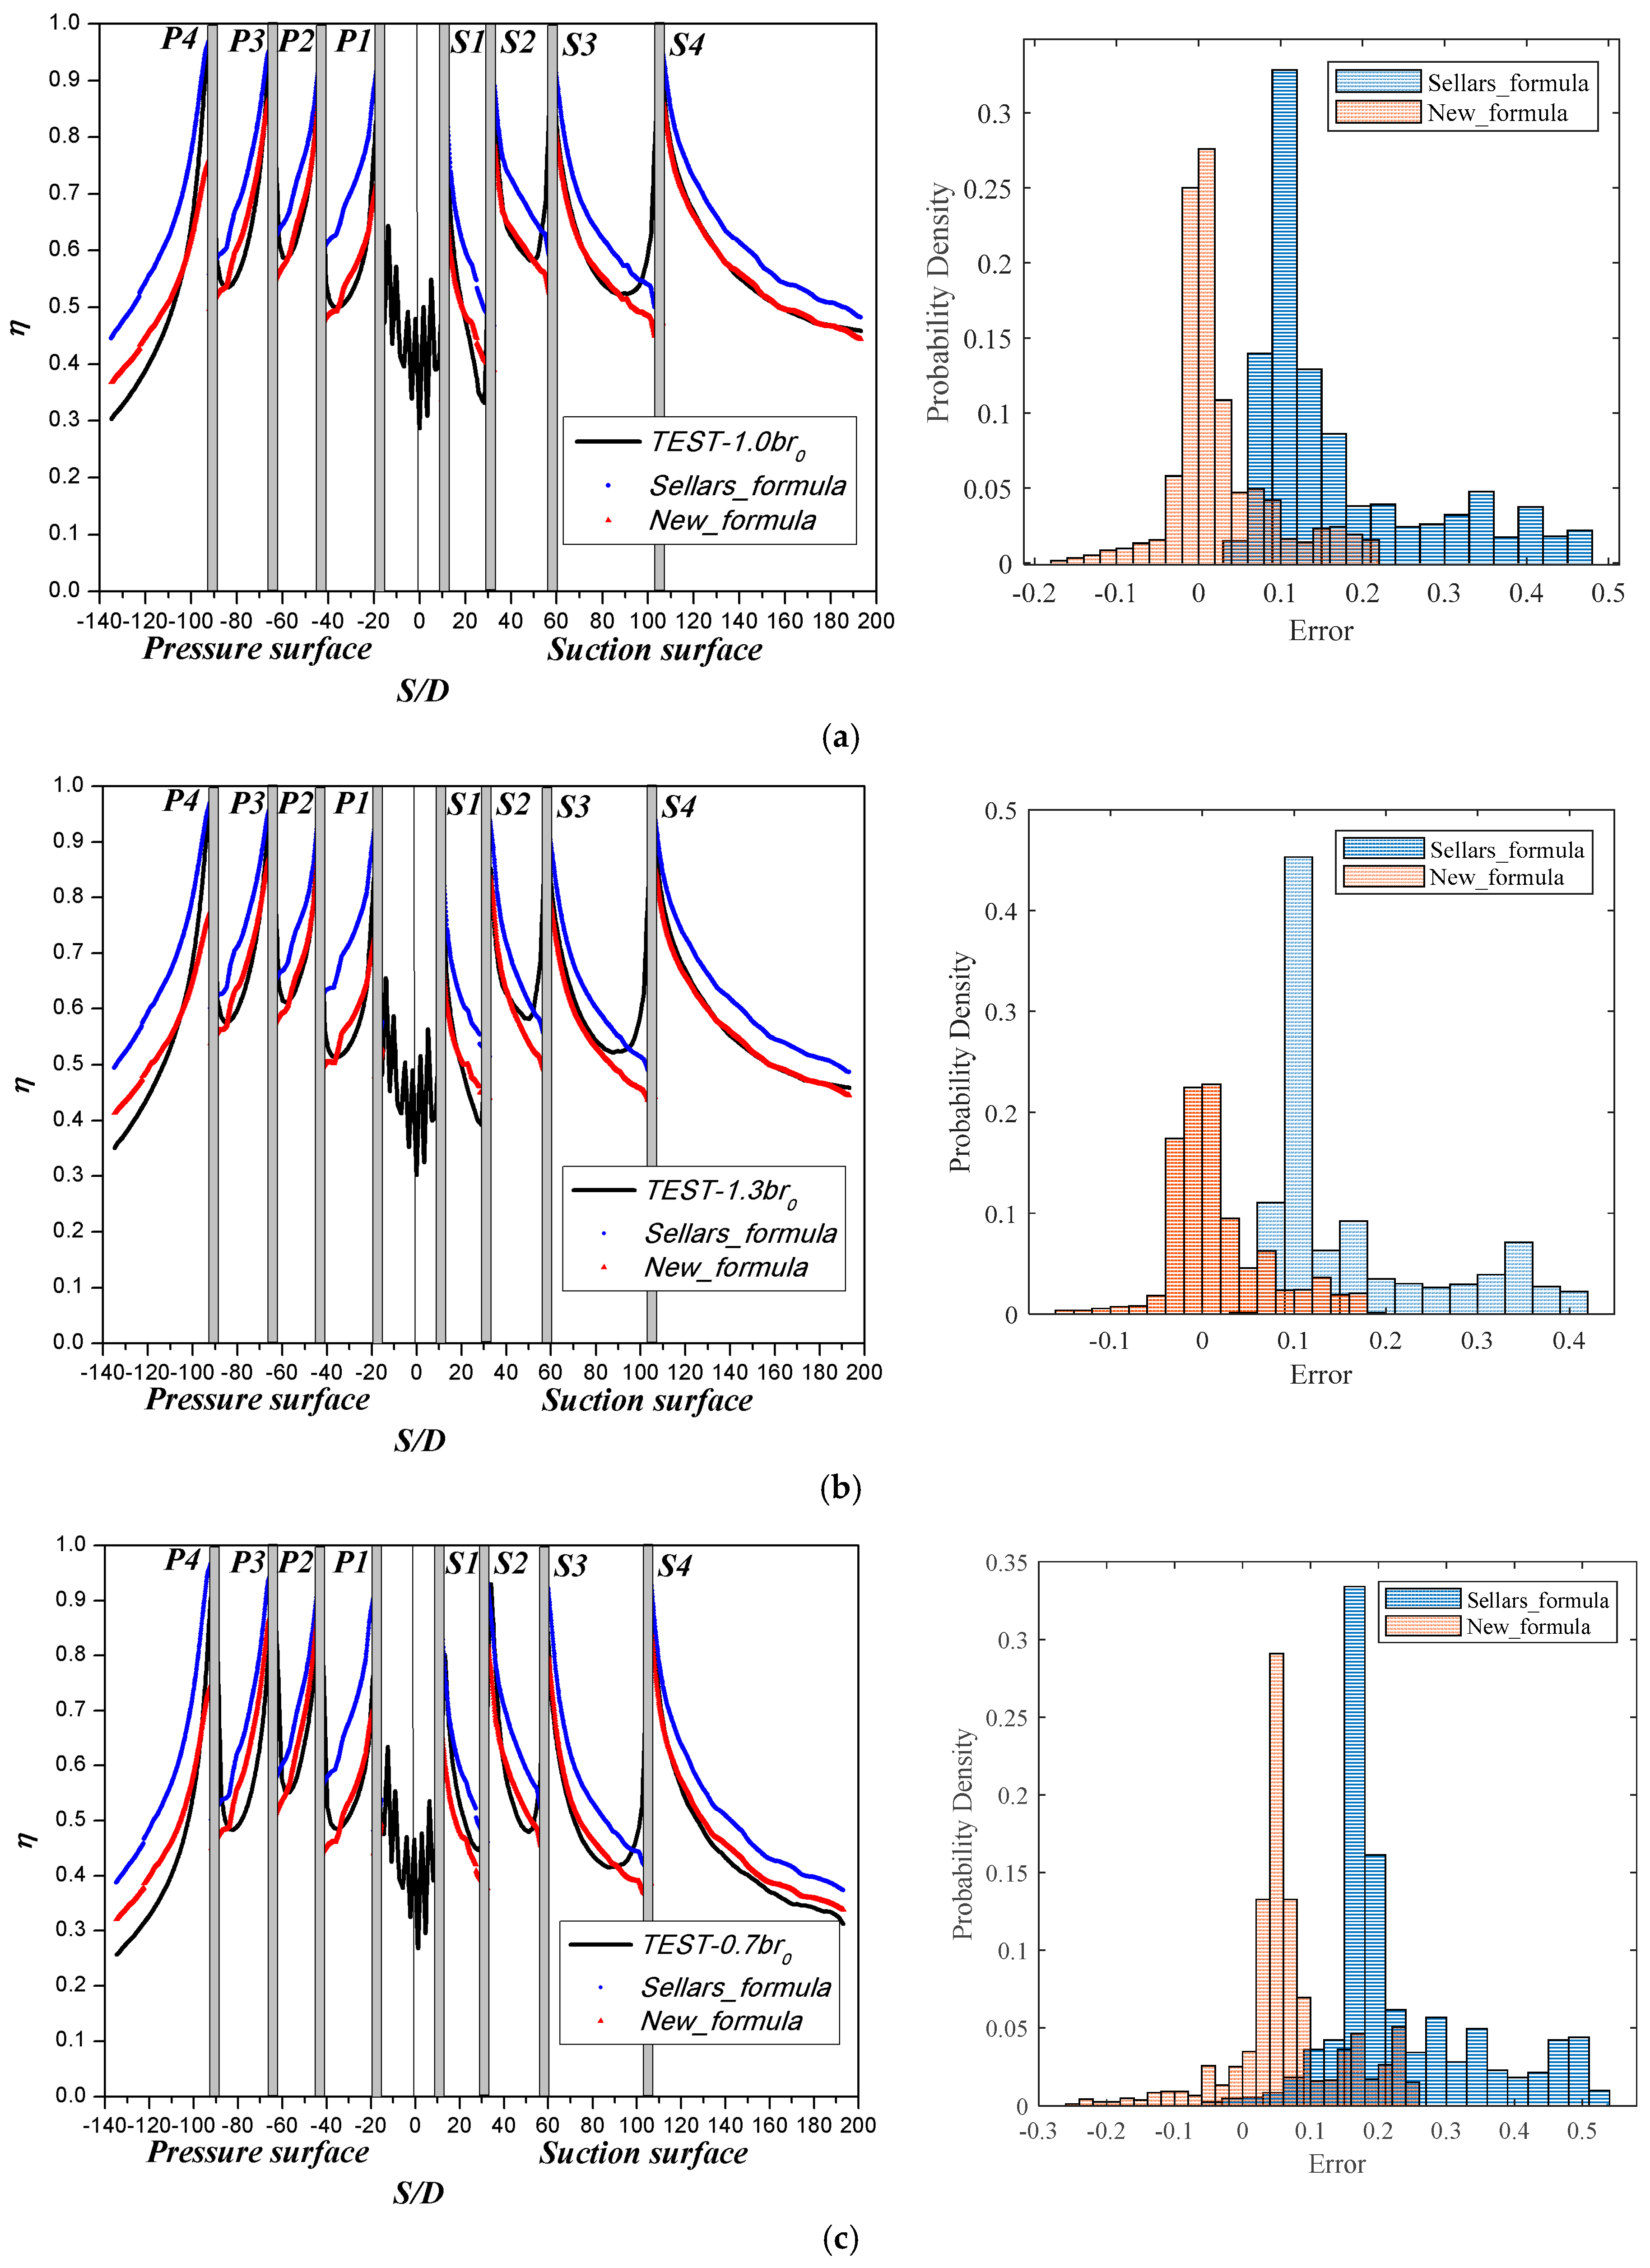
4.4. Superposition Method

Generally, multirow film holes exhibit higher film cooling effectiveness compared to single-row holes, and their effectiveness is closely related to that of the individual single-row holes. However, determining the specific relationship can be challenging. As early as the 1960s, Sellers proposed a superposition method for calculating film cooling effectiveness based on the characteristics of two-dimensional slot film cooling, which is referred to as Sellers’ formula:
η = η 1 + η 2 1 η 1 + + η n 1 η 1 1 η 2 1 η n 1                
where, η n is the film cooling effectiveness of the nth row of film holes.
The derivation of the above formula is based on the two-dimensional film slot injection, neglecting the mutual interference of upstream and downstream film injections, which greatly limits its applicability. In this study, the experimental data are used to validate Sellers’ formula. Figure 17 shows a comparison between the film cooling effectiveness calculation by the superposition formula and the test results at different blowing ratios. The calculation results of the Sellers formula are consistently higher than the experimental data, with the discrepancy increasing as the distance from the film hole increases. To address this discrepancy, a correction factor is introduced for the cooling effectiveness of each row of film holes, resulting in a new specific calculation formula represented by the following formula.
η = a 1 η 1 + a 2 η 2 1 η 1 + + a n η n 1 η 1 1 η 2 1 η n 1
where, a n is the correction factor for the film cooling effectiveness of the nth row of film holes.
The showerhead film holes (H1~H6) are considered as a whole, so there are five rows of film holes on both the pressure surface and suction surface. Five coefficients are introduced, and Formula (5) is used to describe the superposition calculation of film cooling effectiveness for the studied vane. Under the design conditions, one typical experimental data point after each row of film holes is selected to form five equations for solution. The resulting coefficients are presented in Table 5. It can be seen from Figure 17a that the results obtained through the new formula are in better agreement with the experimental data. As shown in the error probability density distribution of Figure 17a, at the blowing ratio of 1.0, Sellers’ formula exhibits errors ranging from 0.05 to 0.3, while the new formula demonstrates significantly improved accuracy with prediction errors confined within −0.1 to 0.1. It should be noted that the film cooling effectiveness before the film hole exhibits very large values due to the light intensity scattering. Therefore, the deviation in this region needs to be disregarded in the analysis. Figure 17b,c indicates that the new formula is also applicable to other blowing ratios, and maintains good accuracy under these conditions, where the new formula maintains consistent prediction accuracy with errors remaining within the −0.1 to 0.1 range.
η = a 1 η 1 + a 2 η 2 1 η 1 + a 3 η 3 1 η 1 1 η 2 + a 4 η 4 1 η 1 1 η 2 1 η 3 + a 5 η 5 1 η 1 1 η 2 1 η 3 1 η 4

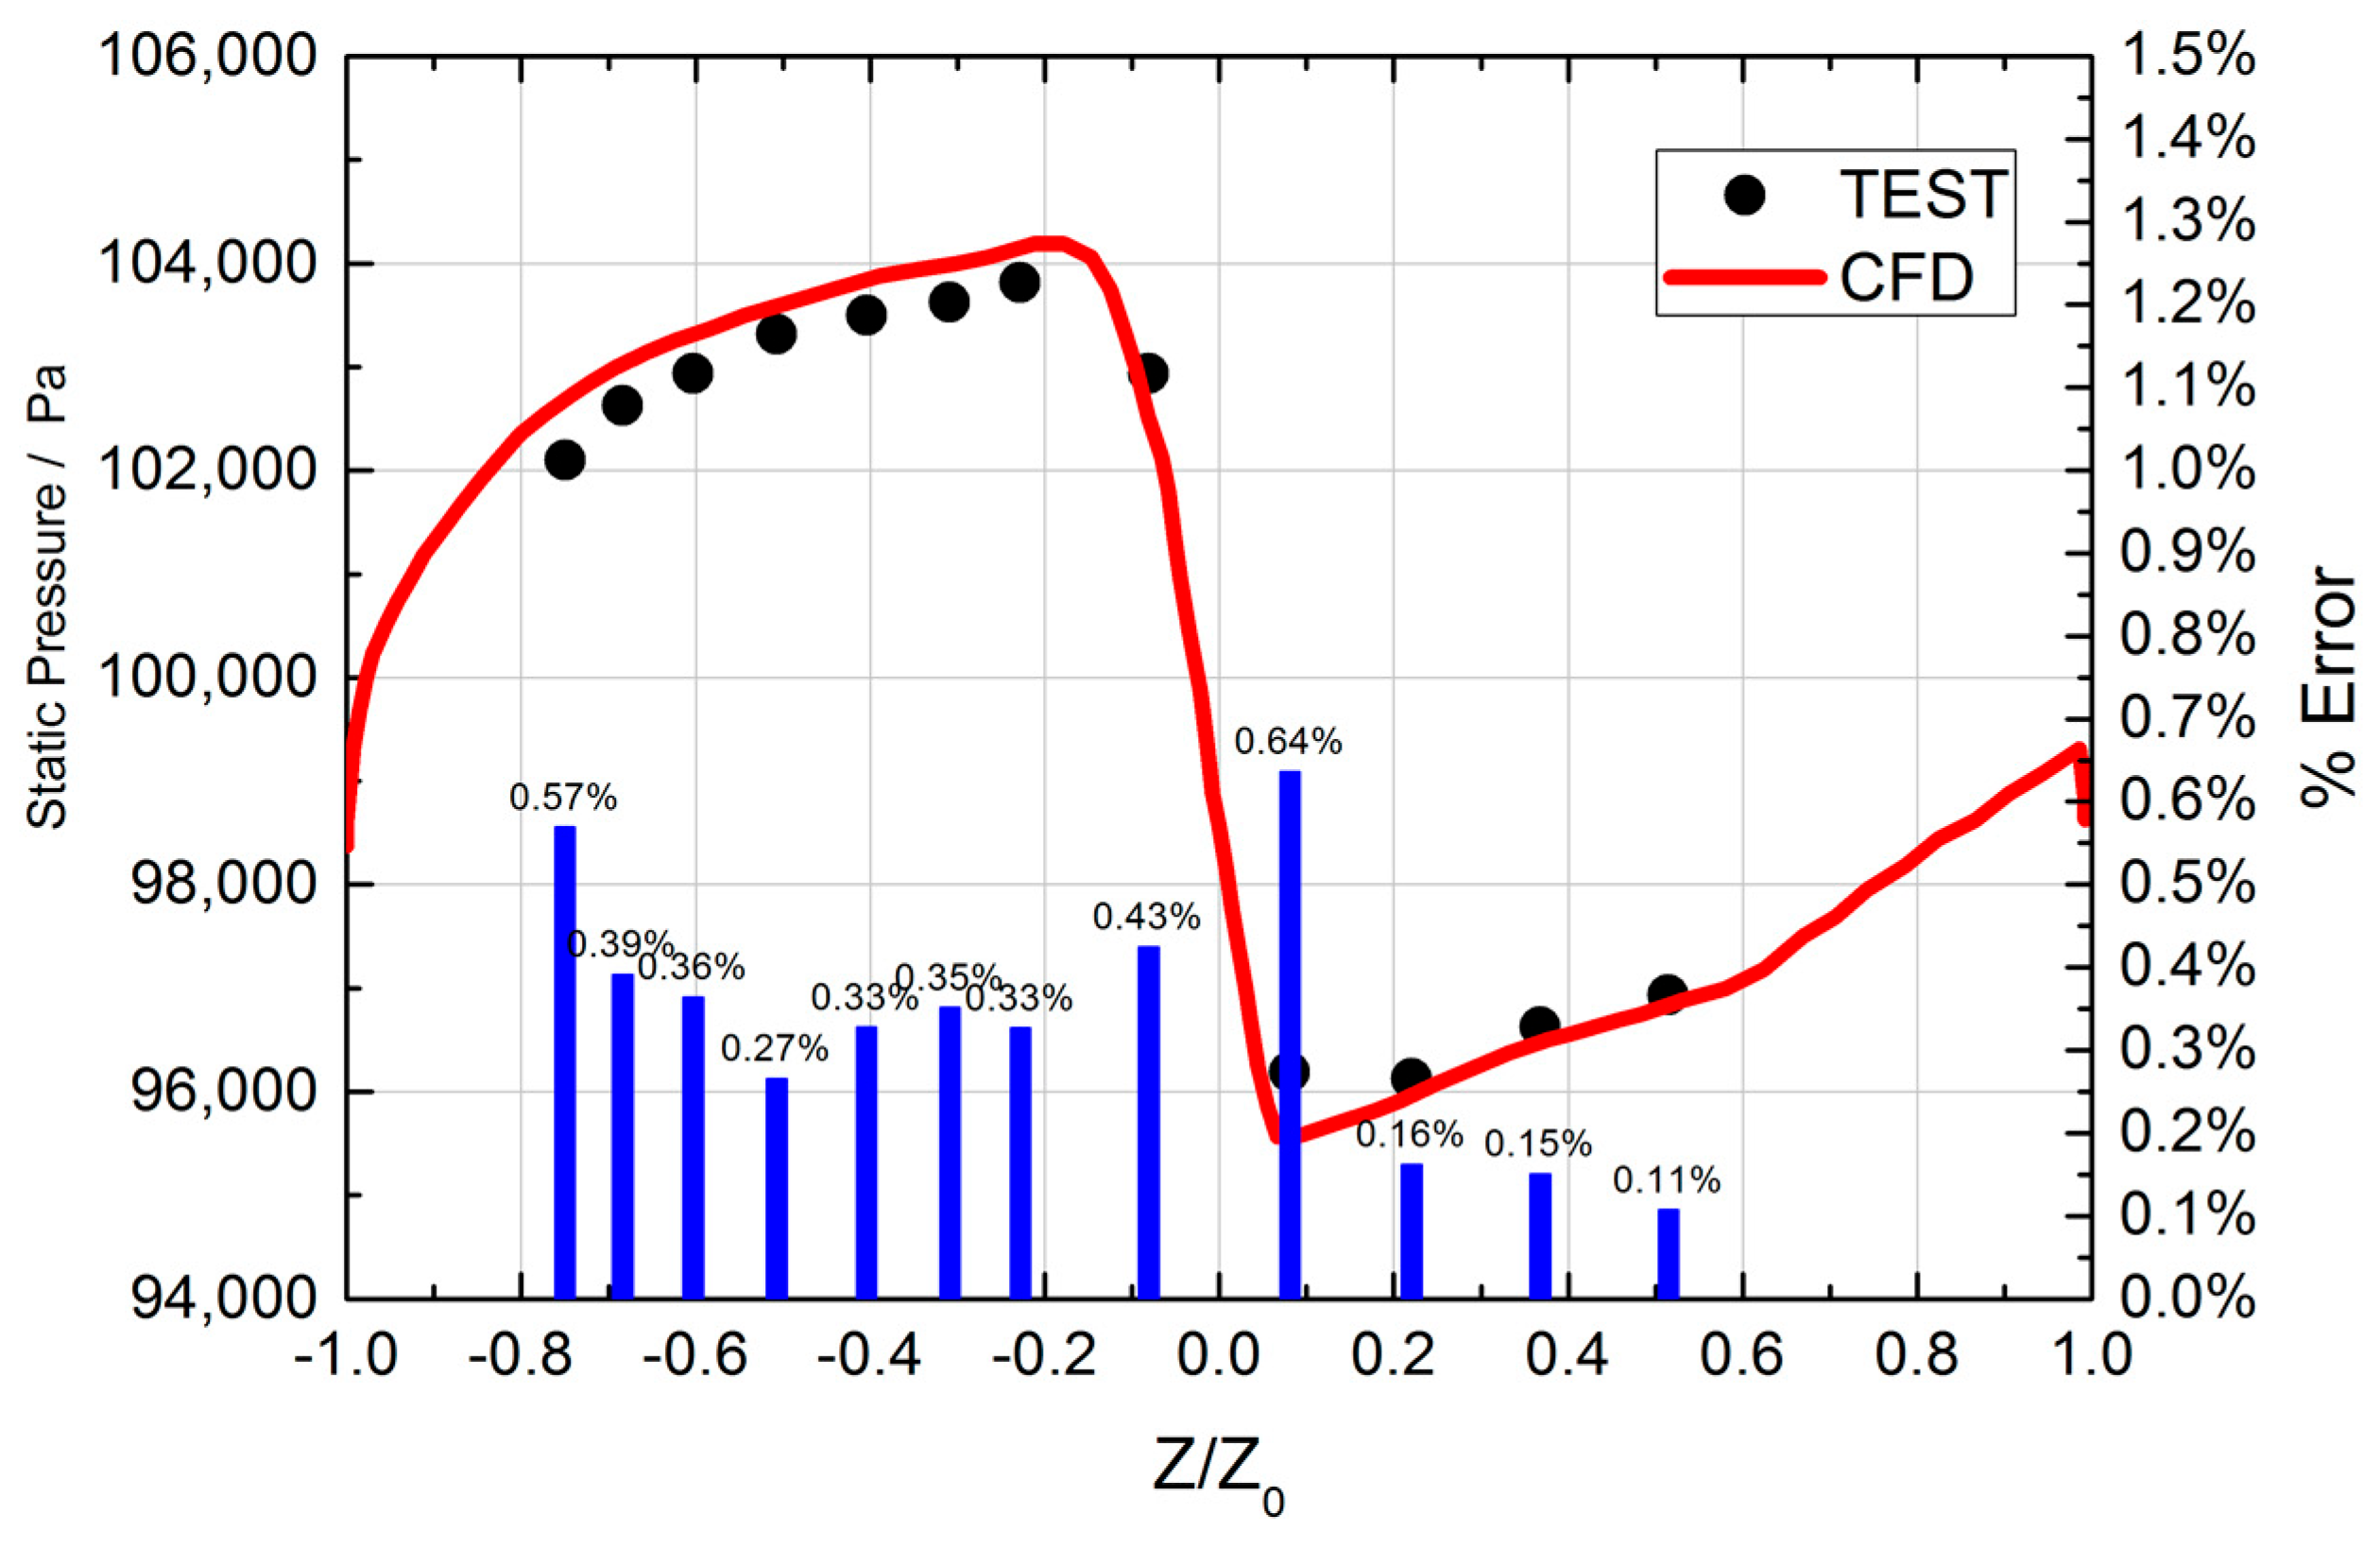
4.5. Comparison Between CFD and PSP Test

Figure 18 shows the results of numerical simulations for the film cooling effectiveness on the vane surface with different turbulence models. Notably, the film cooling effectiveness is enhanced directly downstream of the film holes, subsequently diminishing over distance. The average film cooling effectiveness is higher on the pressure side due to the denser film hole arrangement. Among the models tested, the SST model predicts the highest cooling effectiveness, especially downstream of the last row of film holes on the suction side and pressure side.
Figure 19 presents a comparison between the spanwise averaged film cooling effectiveness derived from simulations with different turbulence models and experimental results. Generally, the trend of the numerical results with different turbulence models is consistent, peaking at the film hole and then gradually decreasing along the flow direction. It should be noted that in the PSP experiment, there is a particularly strong emission light at the film hole outlet, indicating a peaking cooling effectiveness that may not reflect actual performance. In addition, the strong light scattering elevates the measured film cooling effectiveness upstream, leading to skewed results.
EVTE, k- ε , k- ε -EARSM turbulence models underestimate the cooling effectiveness, particularly on the suction side, likely due to the known limitations of the k- ε -models when it comes to flows with a strong streamline curvature. Dissipation ε remains constant across these models, and therefore, the results are similar as well.
The Reynolds stress model does not use the assumption of eddy viscosity and is theoretically more suitable for complex flows. However, the numerical results indicate that k- ε -EARSM, BSL-EARSM, and SSG Reynolds pressure turbulence models also yield lower predictive accuracy, showcasing no distinct advantages.
The SST turbulence model, which takes into account the turbulent shear stress, avoids overestimating the eddy viscosity and, therefore, can theoretically achieve accurate prediction for the onset and extent of the flow separation under conditions of negative pressure gradient. In comparison with other models, the SST turbulence model’s predictions are in better agreement with the experimental data, particularly on the pressure side and the front half of the suction side, though it underpredicts near the trailing edge on the suction surface.
To quantify the numerical difference between the CFD predictions and the experimental results, the root mean square error (RMSE) and mean absolute percentage error (MAPE) were calculated for each turbulence model. The RMSE and MAPE are defined as follows:
R M S E = 1 N y ^ i y i 2
M A P E = 1 N y ^ i y i y i × 100 %
where y i is the experimental value, y ^ i is the predicted value, and N is the number of data points. Table 6 presents the RMSE and MAPE values for each turbulence model. The results indicate that the SST model has the lowest RMSE and MAPE values, followed by the k-ε-EARSM, SSG, and BSL-EARSM models. The k-ε and EVTE models have the highest RMSE and MAPE values, suggesting relatively poorer prediction accuracy.

5. Conclusions

In this study, the film cooling performance of an actual turbine vane has been studied experimentally and numerically, and several recommendations for improvement were proposed. A more accurate superposition method for evaluating multirow film cooling effectiveness has been established, aiming to improve the efficiency of turbine vane thermal analysis and engineering design. The key conclusions drawn from this study are outlined as follows:
(1)
The film cooling effectiveness on an actual turbine vane surface was measured through the PSP technique. Compared with the single-row holes on the flat plate, the film cooling characteristics of the actual turbine vane are different due to the effects of curvature, pressure gradient, and film superposition. Notably, the current design blowing ratio of S1 holes is found to be too high, resulting in poor film cooling effectiveness. Conversely, P3 and P4 holes have relatively low blowing ratios, so the film cooling effectiveness can be enhanced by increasing the cooling flow. The remaining holes demonstrate optimal blowing ratios, with the film operating within the range of full wall attachment or partial separation and reattachment, and the cooling effectiveness shows minimal variations, with changes in the blowing ratio. It is not recommended to employ a low blowing ratio on the suction surface, as this may degrade the wall adherence downstream of the film holes. A slight increase in turbulence intensity can improve the film coverage effect, with a more pronounced impact on the suction surface.
(2)
The film cooling effectiveness calculated using Sellers’ formula is larger than the experimental data, and this discrepancy increases with the distance from the holes. To improve prediction accuracy, A new superposition method for multirow fan-shaped film cooling holes has been proposed, which is in better agreement with the experimental data.
(3)
The experimental data were compared with the numerical simulation results based on different turbulence models. The accuracy of six RANS turbulence models has been verified. Notably, the numerical predictions of both the k- ε -based turbulence model and Reynolds stress turbulence model are lower compared to the experimental results, whereas the SST turbulence model demonstrates relatively higher accuracy.

Author Contributions

Conceptualization, P.C., Y.S., and Z.F.; methodology, P.C., B.D., and J.L.; writing—original draft preparation, P.C., W.S., and B.X.; writing—review and editing, Y.S. and Z.F.; visualization, W.S., B.X., and X.X.; supervision, Y.S. and Z.F. All authors have read and agreed to the published version of the manuscript.

Funding

This research was funded by the Science and Technology Project of Zhejiang Province & Development and Application of High Temperature Turbine Blade for Gas Turbine (Grant no. 2023C01137) and the State Key Laboratory of High-performance Precision Manufacturing (Grant no. HPMKF202410).

Data Availability Statement

The data presented in this study are available on request from the corresponding author.

Acknowledgments

The experimental work was carried out on the PSP experimental platform of Tsinghua University. The authors are grateful for the technical support from the Tsinghua University team and acknowledge Hangzhou Turbine Power Group Co., Ltd. for the permission to publish this paper.

Conflicts of Interest

Authors Peng Chu, Yongfeng Sui, Bin Dai, Jibing Lan, Wenyang Shao, Binbin Xue and Xiliang Xu were employed by the company Hangzhou Turbine Power Group Co., Ltd. The remaining authors declare that the research was conducted in the absence of any commercial or financial relationships that could be construed as a potential conflict of interest.

Abbreviations

The following abbreviations are used in this manuscript:
Tuturbulence intensity
ρrdensity ratio
brblowing ratio
Iintensity
Cconcentration
Ppartial pressure
Mmolar mass
ηfilm cooling effectiveness
acorrection factor of film cooling effectiveness
Subscripts
gmainstream
ccoolant
blkno-light and no-flow condition
reflight and no-flow condition
airAir as the cooling gas
fgcooling gas consisting of N2 and CO2
nthe index number of the film hole row
0current design condition

References

  1. Han, J.C.; Dutta, S.; Ekkad, S.V. Gas Turbine Heat Transfer and Cooling Technology, 2nd ed.; CRC Press: Boca Raton, FL, USA, 2012; pp. 1–5. [Google Scholar] [CrossRef]
  2. Baldauf, S.; Scheurlen, M.; Schulz, A.; Witting, S. Correlation of Film-Cooling Effectiveness from Thermographic Measurements at Engine like Conditions. J. Turbomach. 2002, 124, 686–698. [Google Scholar] [CrossRef]
  3. Thole, K.A.; Sinha, A.K.; Bogard, D.G.; Crawford, M.E. Mean Temperature Measurements of Jets with a Crossflow for Gas Turbine Film Cooling Application. In Proceedings of the 3rd International Symposium on Transport Phenomena and Dynamics of Rotating Machinery, Honolulu, HI, USA, 1–4 April 1990; pp. 1–4. [Google Scholar]
  4. Pedersen, D.R.; Eckert, E.R.G.; Goldstein, R.J. Film Cooling with Large Density Differences Between the Mainstream and the Secondary Fluid Measured by the Heat-mass Transfer Analogy. J. Heat Transf. 1997, 99, 620–627. [Google Scholar] [CrossRef]
  5. Johnson, B.; Tian, W.; Zhang, K.; Hu, H. An Experimental Study of Density Ratio Effects on the Film Cooling Injection from Discrete Holes by Using PIV and PSP Techniques. Int. J. Heat Mass Transf. 2014, 76, 337–349. [Google Scholar] [CrossRef]
  6. Ammari, H.D.; Hay, N.; Lampard, D. Simulation of Cooling Film Density Ratios in a Mass Transfer Technique. In Proceedings of the ASME 1989 International Gas Turbine and Aeroengine Congress and Exposition, Toronto, ON, Canada, 4–8 June 1989. ASME Paper No. 89-GT-200. [Google Scholar] [CrossRef]
  7. Ammari, H.D.; Hay, N.; Lampard, D. The Effect of Density Ratio on the Heat Transfer Coefficient from a Film Cooled Flat Plate. J. Turbomach. 1990, 112, 444–450. [Google Scholar] [CrossRef]
  8. Eriksen, V.L.; Goldstein, R.J. Heat Transfer and Film Cooling Following Injection through Inclined Circular Tubes. J. Heat Transf. 1974, 96, 239–245. [Google Scholar] [CrossRef]
  9. Kadotani, K.; Golastein, R. On the Nature of Jets Entering a Turbulent Flow Part B- Film Cooling Performance. ASME J. Eng. Power 1979, 101, 466–470. [Google Scholar] [CrossRef]
  10. Thole, K.A.; Bogard, D.G. Enhanced Heat Transfer and Shear Stress Due to High Free Stream Turbulence. J. Turbomach. 1995, 117, 418–424. [Google Scholar] [CrossRef]
  11. Lebedev, V.P.; Lemanov, V.V.; Misyura, S.Y.; Terekhov, V.I. Effects of Flow Turbulence on Film Cooling Efficiency. Int. J. Heat Mass Transf. 1995, 38, 2117–2125. [Google Scholar] [CrossRef]
  12. Heidmann, J.D.; Rigby, D.L.; Ameri, A.A. A Three-dimensional Coupled Internal/External Simulation of a Film-cooled Turbine Vane. ASME J. 1999, 122, 348–359. [Google Scholar] [CrossRef]
  13. Charbonnier, D.; Ott, P.; Jonsson, M.; Köbke, T.; Cottier, F. Comparison of numerical investigations with measured heat transfer performance of a film cooled turbine vane. In Proceedings of the ASME Turbo Expo 2008: Power for Land, Sea, and Air, Berlin, Germany, 9–13 June 2008; Volume 4, pp. 571–582. [Google Scholar]
  14. Dyson, T.E.; Bogard, D.G.; Bradshaw, S.D. Evaluation of CFD Simulations of Film Cooling Performance in the Showerhead Region of a Turbine Vane including Conjugate Effects. In Proceedings of the ASME 2012 International Mechanical Engineering Congress and Exposition, Houston, TX, USA, 9–15 November 2012. [Google Scholar] [CrossRef]
  15. Wu, H.; Nasir, S.; Ng, W.F.; Moon, H.K. Showerhead Film Cooling Performance of a Transonic Turbine Vane at High Freestream Turbulence (Tu = 16%): 3-DCFD, Comparison with Experiment. In Proceedings of the ASME 2008 International Mechanical Engineering Congress and Exposition, Boston, MA, USA, 31 October–6 November 2008. [Google Scholar] [CrossRef]
  16. Mick, W.J.; Mayle, R.E. Stagnation Film Cooling and Heat Transfer, Including its Effect within the Hole Pattern. J. Turbomach. 1988, 110, 66–72. [Google Scholar] [CrossRef]
  17. Mehendale, A.B.; Han, J.C.; Ou, S.; Lee, C.P. Unsteady Wake over a Linear Turbine Blade Cascade with Air and CO2 Film Injection: Part II—Effect on Film Effectiveness and Heat Transfer Distributions. J. Turbomach. 1994, 116, 730–737. [Google Scholar] [CrossRef]
  18. Blair, M.F.; Lander, R.D. New Techniques for Measuring Film Cooling Effectiveness. J. Heat Transf. 1975, 97, 539–543. [Google Scholar] [CrossRef]
  19. Gritsch, M.; Schulz, A.; Wittig, S. Adiabatic Wall Effectiveness Measurements of Film-Cooling Holes with Expanded Exits. J. Turbomach. 1998, 120, 549–556. [Google Scholar] [CrossRef]
  20. Kohli, A.; Bogard, D.G. Fluctuating Thermal Field in the Near-Hole Region for Film Cooling Flows. J. Turbomach. 1998, 120, 86–91. [Google Scholar] [CrossRef]
  21. Eberly, M.K.; Thole, K. Time-Resolved Film-Cooling Flows at High and Low Density Ratios. J. Turbomach. 2014, 136, 61003. [Google Scholar] [CrossRef]
  22. Vedula, R.J.; Metzger, D.E. A Method for the Simultaneous Determination of Local Effectiveness and Heat Transfer Distributions in Three-Temperature Convection Situations. In Proceedings of the ASME, International Gas Turbine and Aeroengine Congress and Exposition, Orlando, FL, USA, 3–6 June 1991. ASME Paper No. 91-GT-345. [Google Scholar]
  23. Ekkad, S.V.; Zapata, D.; Han, J.C. Film Effectiveness over a Flat Surface with Air and CO2 Injection through Compound Angle Holes Using a Transient Liquid Crystal Image Method. J. Turbomach. 1997, 119, 587–593. [Google Scholar] [CrossRef]
  24. Roy, A.; Jain, S.; Ekkad, S.V.; Ng, W.; Lohaus, A.S.; Crawford, M.E.; Abraham, S. Heat Transfer Performance of a Transonic Turbine Blade Passage in Presence of Leakage Flow through Upstream Slot and Mateface Gap with Endwall Contouring. J. Turbomach. 2014, 139, 121006. [Google Scholar] [CrossRef]
  25. Shadid, J.N.; Eckert, E.R.G. The Mass Transfer Analogy to Heat Transfer in Fluids with Temperature-Dependent Properties. J. Turbomach. 1991, 113, 27–33. [Google Scholar] [CrossRef]
  26. Zhang, L.J.; Baltz, M.; Pudupatty, R.; Fox, M. Turbine Nozzle Film Cooling Study Using the Pressure Sensitive Paint (PSP) Technique. J. Turbomach. 2001, 123, 730–738. [Google Scholar] [CrossRef]
  27. Zhang, L.J.; Moon, H.K. Turbine Blade Film Cooling Study: The Effects of Film Hole Location on the Pressure Side. In Proceedings of the ASME Turbo Expo 2007: Power for Land, Sea, and Air, Montreal, QC, Canada, 14–17 May 2007. ASME Paper No. GT2007-27546. [Google Scholar] [CrossRef]
  28. Cutbirth, J.M.; Bogard, D.G. Thermal Field and Flow Visualization within the Stagnation Region of a Film-Cooled Turbine Vane. J. Turbomach. 2002, 124, 200–206. [Google Scholar] [CrossRef]
  29. Qin, Y.M.; Ren, J.; Jiang, H.D. Effects of Streamwise Pressure Gradient and Convex Curvature on Film Cooling Effectiveness. In Proceedings of the ASME Turbo Expo 2014: Turbine Technical Conference and Exposition, Düsseldorf, Germany, 16–20 June 2014. ASME Paper No. GT2014-25808. [Google Scholar] [CrossRef]
  30. Liu, K.; Yang, S.F.; Han, J.C. Influence of Coolant Density on Turbine Blade Film-Cooling with Compound-angle Shaped Holes. J. Heat Mass Transf. 2012, 136, 044501, ASME Paper No. GT2014-2689. [Google Scholar] [CrossRef]
  31. Andrei, L.; Facchini, B.; Caciolli, G. Performance Improvement of a Heavy Duty GT: Adiabatic Effectiveness Measurements on First Stage Vanes. In Proceedings of the ASME Turbo Expo 2014: Turbine Technical Conference and Exposition, Düsseldorf, Germany, 16–20 June 2014. [Google Scholar] [CrossRef]
  32. Charbonnier, D.; Ott, P.; Jonsson, M.; Cottier, F.; Ko, T. Experimental and Numerical Study of the Thermal Performance of a Film Cooled Turbine Platform. In Proceedings of the ASME Turbo Expo 2009: Power for Land, Sea, and Air, Orlando, FL, USA, 8–12 June 2009. [Google Scholar] [CrossRef]
  33. Zhang, Y.; Yuan, X. Endwall Film Cooling using the Staggered Combustor-Turbine Gap Leakage Flow. In Proceedings of the ASME Turbo Expo 2014: Turbine Technical Conference and Exposition, Düsseldorf, Germany, 16–20 June 2014. ASME Paper No. GT2014-26771. [Google Scholar] [CrossRef]
  34. Zhang, M.J.; Wang, N. Influence of Turbine Blade Leading Edge Profile on Film Cooling with Shaped Holes. J. Therm. Sci. Eng. Appl. 2017, 10, 051006. [Google Scholar] [CrossRef]
  35. Sellers, J.P. Gaseous Film cooling with Multiple Injection stations. AIAA J. 1963, 1, 2154–2156. [Google Scholar] [CrossRef]
  36. Sasaki, M.; Takahara, K.; Kumagai, T.; Hamano, M. Film Cooling Effectiveness for Injection from Multirow holes. J. Eng. Gas Turbines Power 1979, 101, 101–108. [Google Scholar] [CrossRef]
  37. Takeishi, K.; Aoki, S.; Sato, T.; Tsukagoshi, K. Film cooling on a gas turbine rotor blade. J. Turbomach. 1992, 114, 828–834. [Google Scholar] [CrossRef]
  38. Zhu, H.R.; Guo, T.; Xu, D.C. Film Cooling and Superposition Method for Double Row Dust-Span Shaped Holes. J. Aerosp. Power 2006, 21, 814–819. [Google Scholar]
  39. Roach, P.E. The Generation of Nearly Isotropic Turbulence by Means of Grids. Int. J. Heat Fluid Flow 1987, 8, 82–92. [Google Scholar] [CrossRef]
  40. Yuan, X.; Huang, W.N. Experiment of Grid-Generated Turbulent in a Smooth Channel. J. Aerosp. Power 2019, 34, 27–33. [Google Scholar]
  41. Li, J. Experimental Theoretical Research on Gas Turbine Film, Cooling. Ph.D. Thesis, Tsinghua University, Beijing, China, 2011. [Google Scholar]
  42. Versteeg, H.K.; Malalasekera, W. An Introduction to Computational Fluid Dynamics: The Finite Volume Method, 2nd ed.; Pearson Schweiz: Cham, Switzerland, 2007; p. 20. [Google Scholar]
  43. Carroll, R.J.; Ruppert, D.; Stefanski, L.A.; Crainiceanu, C.M. Measurement Error in Nonlinear Models: A Modern Perspective; Chapman and Hall/CRC: Boca Raton, FL, USA, 2006. [Google Scholar]
  44. Launder, B.E.; Sharma, B.I. Application of the Energy Dissipation Model of Turbulence to the Calculation of Flow Near a Spinning Disc. Lett. Heat Mass Transf. 1974, 1, 131–138. [Google Scholar] [CrossRef]
  45. Menter, F.R. Two-equation eddy-viscosity turbulence models for engineering applications. AIAA J. 1994, 32, 1598–1605. [Google Scholar] [CrossRef]
  46. Martin, B.; Carolin, W.; Clemens, D.; Krewinkel, R.; Shiau, C.-C.; Grundmann, S.; Han, J.-C. Assessment of the Flow Field and Heat Transfer in an NGV Using Magnetic Resonance Velocimetry, Thermochromic Liquid Crystals and CFD. In Proceedings of the ASME Turbo Expo 2022: Turbomachinery Technical Conference and Exposition, Rotterdam, The Netherlands, 13–17 June 2022. ASME Paper No. GT2022-79526. [Google Scholar] [CrossRef]
  47. Wallin, S.; Johansson, A.V. An explicit algebraic Reynolds stress model for incompressible and compressible turbulent flows. J. Fluid Mech. 2000, 403, 89–132. [Google Scholar] [CrossRef]
  48. Gatski, T.B.; Speziale, C.G. On explicit algebraic stress models for complex turbulent flows. J. Fluid Mech. 1993, 254, 59–78. [Google Scholar] [CrossRef]
  49. Speziale, C.G.; Sarkar, S.; Gatski, T.B. Modelling the pressure–strain correlation of turbulence: An invariant dynamical systems approach. J. Fluid Mech. 1991, 227, 245–272. [Google Scholar] [CrossRef]
Figure 1. Film cooling test platform.
Aerospace 12 00533 g001
Figure 2. Cross Grating Structure.
Aerospace 12 00533 g002
Figure 3. Cascade Test Section of Film Test Rig.
Aerospace 12 00533 g003
Figure 4. Schematic diagram of the test vane. (a) Static pressure test vane; (b) Film test vane.
Aerospace 12 00533 g004
Figure 5. Pressure sensitive paint shooting system.
Aerospace 12 00533 g005
Figure 6. PSP calibration curves at different temperatures.
Aerospace 12 00533 g006
Figure 7. 3D computational domain.
Aerospace 12 00533 g007
Figure 8. Overall and boundary layer grid for the computational domain.
Aerospace 12 00533 g008
Figure 9. Grid sensitivity analysis, predictions of spanwise averaged film cooling effectiveness of P2 film holes.
Aerospace 12 00533 g009
Figure 10. Comparison between pressure test and numerical calculation.
Aerospace 12 00533 g010
Figure 11. Static pressure distribution on the surface of vane under different turbulence intensities.
Aerospace 12 00533 g011
Figure 12. Effect of blowing ratio on spanwise averaged film cooling effectiveness of single-row film holes.
Aerospace 12 00533 g012
Figure 13. Contours of adiabatic film cooling effectiveness distribution from experimental measurements under different blowing ratios at T u g = 12%. (a) b r = 0.7 b r 0 ; (b) b r = 1.0 b r 0 ; (c) b r = 1.3 b r 0 ; (d) b r = 1.6 b r 0 .
Aerospace 12 00533 g013
Figure 14. Effect of blowing ratio on spanwise averaged film cooling effectiveness of multirow film holes at T u g = 12%.
Aerospace 12 00533 g014
Figure 15. Contours of adiabatic film cooling effectiveness distribution from experimental measurements under different turbulence intensities at b r = 1.0 b r 0 . (a) T u g = 8%; (b) T u g = 10%; (c) T u g = 12%.
Aerospace 12 00533 g015
Figure 16. Effect of turbulence intensity on spanwise averaged film cooling effectiveness of multirow film holes at b r = 1.0 b r 0 .
Aerospace 12 00533 g016
Figure 17. Comparison of film cooling effectiveness calculation by superposition formula and test result at different blowing ratios at T u g = 12%. (a) b r = 1.0 b r 0 ; (b) b r = 1.3 b r 0 ; (c) b r = 0.7 b r 0 .
Aerospace 12 00533 g017
Figure 18. Contours of adiabatic effectiveness distribution from numerical simulations with different turbulence models. (a) EVTE; (b) k-ε; (c) SST; (d) BSL-EARSM; (e) k-ε-EARSM; (f) SSG.
Aerospace 12 00533 g018
Figure 19. Comparison between calculated spanwise averaged film cooling effectiveness under different turbulence models and experimental results.
Aerospace 12 00533 g019
Table 1. Test conditions.
LocationCondition
Mainstream inletTotal pressure104,640.5 Pa
Static pressure104,215.6 Pa
Velocity27 m/s
Total temperature304 K
Turbulence intensity ( T u g )8%, 10%, 12% 1
Coolant inletDensity ratio ( ρ r )1.5
Blowing ratios ( b r ) 0.7 b r 0 ,   1.0 b r 0 ,   1.3 b r 0 ,   1.6 b r 0
Current design blowing ratios ( b r 0 )H1:0.89, H2:0.77, H3:0.68, H4:0.68, H5:0.88, H6:0.72
P1:1.7, P2:0.79, P3:0.78, P4:0.69
S1:0.89, S2:0.78, S3:0.77, S4:0.75
1 Turbulence intensity under current design condition.
Table 2. Distribution of random errors in the measurement of adiabatic film cooling effectiveness by PSP.
η 0.80.50.30.10.050.001
η / η 2.45%3.46%4.76%8.72%12.49%89.42%
Table 3. Boundary conditions for the CFD calculation.
LocationCondition
Mainstream inletTotal pressure1,555,620 Pa
Total temperature1573.15 K
Turbulence intensity ( T u g )12%
Mainstream outletStatic pressure1,105,000 Pa
Coolant inletTotal temperature
Turbulence intensity ( T u c )
683.55 K
5%
Blowing ratios ( b r ) 0.7 b r 0 ,   1.0 b r 0 ,   1.3 b r 0 ,   1.6 b r 0
Current design blowing ratios ( b r 0 )See above
Table 4. Grid for sensitivity analysis.
Grid CoarseMediumFine
Total Elements (million)7.178.8210.23
Total Nodes (million)2.263.244.07
Table 5. New formula coefficient values.
Coefficient Values a 1 a 2 a 3 a 4 a 5
Pressure surface0.91440.62741.18940.96780.6391
Suction surface1.11580.61940.94050.85780.9279
Table 6. RMSE and MAPE values for each turbulence model.
Turbulence Model RMSE MAPE ( % )
EVTE0.12116.70
k- ε 0.11615.75
SST0.0607.64
SSG0.10213.58
k- ε -EARSM0.10112.99
BSL-EARSM0.10313.74
Disclaimer/Publisher’s Note: The statements, opinions and data contained in all publications are solely those of the individual author(s) and contributor(s) and not of MDPI and/or the editor(s). MDPI and/or the editor(s) disclaim responsibility for any injury to people or property resulting from any ideas, methods, instructions or products referred to in the content.

