Article

Static Aero-Propulsion Experiment of an Electric Ducted Fan

by
Hoang-Quan Chu
1,
Quang-Ngoc Dinh
2,
Thai-Son Vu
2,
Van-Yen Pham
3,
Van-Trung Bui
3,
Nhat-Minh Hoang
4,
Trung-Kien Nguyen
1,
Dong Nguyen
2,
Gia-Diem Pham
2 and
Cong-Truong Dinh
2,*
1
Institute of Vehicle and Energy Engineering, Le Quy Don Technical University, 236 Hoang Quoc Viet St., Bac Tu Liem Dist., Hanoi 11917, Vietnam
2
School of Mechanical Engineering, Hanoi University of Science and Technology, 1 Dai Co Viet St., Hai Ba Trung Dist., Hanoi 11615, Vietnam
3
Air Defense—Air Force Technical Institute, 166 Hoang Van Thai St., Thanh Xuan Dist., Hanoi 11413, Vietnam
4
Viettel Aerospace Institute, Viettel Building—Hoa Lac Hi-Tech Park, Thach That, Hanoi 13112, Vietnam
*
Author to whom correspondence should be addressed.
Aerospace 2025, 12(6), 509; https://doi.org/10.3390/aerospace12060509
Submission received: 20 April 2025 / Revised: 26 May 2025 / Accepted: 31 May 2025 / Published: 4 June 2025

Abstract

:
Electric ducted fans are gaining prominence in aviation due to their compact size, low noise, and zero emissions compared to conventional gas turbines. This study presents an experimental test system for a 390 mm electric Ducted Propulsion Fan developed by the Aerospace Propulsion Systems group at Hanoi University of Science and Technology. The carbon fiber composite thruster, driven by a centrally located BLDC motor, was mounted on a test stand equipped with force and rotational speed (rpm) sensors. Power was supplied through two battery configurations, eight-pack and nine-pack, with voltage and current monitored and controlled via an ESC module. Experiments conducted from 2000 to 7000 rpm explored the relationship between electrical inputs and aero-propulsive outputs. The results revealed that input power, current, and sound pressure level (SPL) amplified meaningfully with rpm, while the voltage slightly declined. The maximum rpm reached 6500 rpm for the eight-pack and 7000 rpm for the nine-pack configurations. When greater than 6000 rpm, the SPL reaches close to 120 dB. The eight-pack configuration provided higher thrust per volt, whereas the nine-pack offered better thrust per ampere and improved starting power. Although dimensionless indices, including power coefficient (CP), thrust coefficient (CT), and figure of merit (FM), reduced with rpm, the FM remained between 0.7 and 0.75 at medium speeds, demonstrating effective energy conversion.

1. Introduction

Ducted fan applications in UAVs and S/VTOL aircraft are no longer novel. Competitive advantages such as a higher static thrust-to-power ratio and lower noise levels compared to open rotors of the same diameter have brought ducted fans to the forefront. Furthermore, the use of electric power to replace the thermal cycle in conventional engines further aligns electric propulsion fans with a green future. Numerous empirical studies have been published over the past 20 years.
Kondor et al. [1,2,3] investigated circulation control using pneumatic jets at both the inlet and nozzle of a shrouded fan model featuring 16 fixed-pitch blades and a fan diameter of approximately 136 mm. Their goal was to enhance the propulsive efficiency and reduce the performance degradation under off-design conditions during VTOL operations. By leveraging the Coandă surface principle, these studies examined morphing nacelle configurations through detailed assessments of static thrust, fan exhaust flow visualization, pressure ratios at various altitudes, and rotational speeds spanning from 10,000 to over 30,000 rpm.
Concurrently, Martin and colleagues [4,5] evaluated ducted rotors for VTOL UAVs, including a 254 mm diameter model with two blades, under diverse flight conditions such as hover, forward flight, and high angles of attack. Their work focused on how duct geometry and propeller tip gaps influence aerodynamic performance, with rotor speeds ranging from 2000 to 9500 rpm. Combining wind tunnel testing, flow visualization, acoustic measurements, and CFD analysis, their findings showed strong agreement between simulations and experiments, providing valuable guidance for optimizing rotor and duct designs and tip gap configurations.
Graf et al. [6] conducted experimental aerodynamic investigations on fixed-pitch electric ducted fans (EDFs) ranging from 76 mm to 305 mm in diameter under static thrust conditions. By altering duct lip shapes during forward flight, they sought to improve lift-to-drag ratios, reduce pitching moments, and enhance control authority via duct-mounted control surfaces. Meanwhile, Ohanian et al. [7] developed a compact, twelve-coefficient non-dimensional model to efficiently predict forces, moments, and required rotor power for 305 mm diameter ducted fan vehicles across a variety of wind tunnel conditions up to a 25.9 m/s free-stream velocity.
Akturk et al. [8,9,10] conducted comprehensive simulation and experimental investigations on ducted fan rotors, focusing on the effects of tip clearance, forces, torque, and Particle Image Velocimetry (PIV) measurements across various rotational speeds. Specifically, studies [8,9] examined a five-blade ducted fan with a diameter of 127 mm powered by a high-efficiency 1.5 kW electric motor, while another study [10] involved an axial flow fan rotor featuring eight blades with a rotor pitch angle of 55 degrees and a diameter of 559 mm, driven by a 14.9 kW A200-6 brushless electric motor. Dimensionless parameters such as thrust coefficient, power coefficient, and figure of merit were utilized to quantitatively evaluate the aerodynamic characteristics of these electric propulsion units.
Integrating simulation and experimental data, Cho et al. [11] proposed design methodologies to optimize duct geometries for small UAV ducted fans with a three-blade rotor of 248 mm diameter and a five-blade stator of 250 mm diameter operating at 7000 rpm, aiming to enhance thrust efficiency and reduce noise emissions. Concurrently, Brezina and Thomas [12] evaluated multiple small-scale two-blade propeller systems with a rotor diameter of 119.4 mm at 6000 rpm by measuring forces, torque, and total pressure under both static and dynamic conditions to refine predictive models and deepen our understanding of open rotor designs and electric motor characteristics.
Yilmaz et al. [13] investigated a two-blade ducted propeller with a rotor diameter of 406.4 mm operating at 7000 rpm at zero angle of attack under varying flight conditions to emphasize the substantial impact of the duct geometry and advance ratio on thrust and overall performance. McCrink and Gregory [14] employed blade element momentum theory alongside dimensionless factors such as advance ratio, thrust, torque, and power coefficients to conduct low-Reynolds-number wind tunnel tests on three pitch angle variants of open two-blade propellers with a rotor diameter of 254 mm, highlighting the significance of scale effects and model fidelity. Their initial dataset covers operation at full power with fixed voltage across a range of advanced ratios.
In contrast, Deng [15] examined the ground effect on an EDF model equipped with a four-blade metal propeller and an inner duct diameter of 660 mm during the takeoff and landing phases, with the propeller pitch angle manually adjustable in the experiments, demonstrating that proximity to the ground reduces thrust and increases power demand.
Research by Xiang and Xu’s groups [16,17] further explored ground effects in aerial systems, underscoring their pronounced influence on control and aerodynamic behavior. Utilizing a powertrain with five-blade carbon fiber rotors measuring 330 mm in diameter and 152 mm in screw pitch, operated at speeds ranging from 3000 to 6000 rpm corresponding to tip Reynolds numbers between 26,550 and 53,100, the former group focused on modeling and controlling a novel coaxial EDF aerial robot using nonlinear disturbance observers. The latter compared open and shrouded rotors, revealing that EDFs exhibit greater sensitivity to ground proximity due to flow phenomena such as tip leakage and back pressure.
Ebus et al. [18] performed experimental analysis of a small contra-rotating EDF comprising a 17-blade front rotor and a 13-blade rear rotor with a casing diameter of 132 mm, investigating thrust ranges up to 100 N. Their study assessed parameters, including the mass flow rate, thrust, static pressure, rotation speed, and electrical power consumption, corroborated by comparisons with ANSYS CFX version 12.1 simulations.
Jiahao and Zhou [19,20] conducted thrust experiments based on rotational speed for an EDF with a 150 mm diameter rotor (10 blades) and stator (6 blades), while applying CFD techniques to optimize blade designs for a larger 400 mm model featuring 12-blade rotors and 8-blade stators. The first study aimed to enhance rotor and stator configurations to improve thrust and efficiency, whereas the second introduced a multi-objective design strategy for distributed VTOL ducted fans targeting the optimization of thrust, efficiency, and power consumption.
Meanwhile, Urban et al. [21] investigated the structural configuration effects on two small EDFs with diameters of 50 mm and 64 mm, both featuring 12 blades, by measuring thrust, torque, voltage, current, and angular velocity to identify suitable UAV configurations. Their experimental setup used maximum voltage and current supplies of 35 V and 40 A, respectively.
Luo et al. [22] simulated the effects of static wind speed and wind angle on the aerodynamic characteristics of a three-blade EDF propeller with a radius of 103 mm, validated through thrust and torque diagrams at specified rotational speeds. The design operating speed was 4000 rpm, with a total thrust of 5.4 N and a figure of merit of 0.92. Grava et al. [23] studied crossflow influences on aerodynamic properties such as thrust, drag, and power coefficients of a small-drone two-blade propeller model APC-96, with a blade radius of 75 mm and NACA4412 airfoil profile in forward flight, varying the angle of attack and Reynolds number.
Parallel to this, Hirono et al. [24] conducted combined aerodynamic and aeroacoustic investigations on three 120 mm EDF models with differing design flow coefficients, tested in both wind tunnel and anechoic chambers. They measured thrust, power coefficients, jet velocity ratios, sound pressure level (SPL) spectra, acoustic directivity, and psychoacoustic parameters. The EDFs were designed, manufactured, and tested using brushless DC electric motors, delivering a static thrust of 5 kg and a thrust of 1.5 kg at 30 m/s flight speed.
Snikdha and Chen [25] explored a 3 m diameter disc-shaped VTOL UAV featuring a centrally mounted eight-blade ducted fan and a curved upper surface to enhance fuel efficiency. Their ANSYS CFX 19.0 analyses demonstrated that 95% of the lift during hover was generated aerodynamically, reducing overall energy consumption. Lengyel-Kampmann et al. [26] presented the design, optimization, and experimental validation of a counter-rotating shrouded fan stage with 10 and 12 blades, respectively, and a 1 m outer diameter. Utilizing lightweight carbon fiber-reinforced plastic blades developed by the German Aerospace Center (DLR), their design achieved isentropic efficiencies up to 91.8% and exhibited strong agreement with CFD simulations, validating the design approach and numerical methods.
Most existing studies on electric ducted fans (EDFs) focus on models with diameters at or below approximately 350 mm [1,2,3,4,5,6,7,8,9,11,15,16,17,18,19,20,21,22,23,24], primarily investigating aerodynamic and performance characteristics through experimental and numerical methods. These smaller-scale EDF studies often emphasize dimensionless parameters, such as thrust coefficient, power coefficient, figure of merit, and advance ratio, to assess performance. In contrast, research on fans or propellers exceeding 350 mm in diameter remains limited and tends to involve fixed pitch angles [10,13,15,19], large-diameter shrouded fans [26], or relies mainly on simulation-based analyses without accompanying experimental validation [25].
Furthermore, detailed experimental data correlating thrust with electrical inputs like voltage and current are sparse across the literature, with reported maximum voltage and current thresholds generally low—for example, Urban et al. [21] report maxima of 35 V and 40 A, while Luo et al. [22] recount 55 V and 80 A. Notably, studies such as McCrink and Gregory [14] present results predominantly in non-dimensional form, limiting direct practical comparisons. This distinction highlights the research gap addressed by the current study, which focuses on large-scale EDFs with comprehensive experimental evaluation of the electrical and aero-propulsive performance, emphasizing the significance of such data for advancing large-scale fan applications.
Building upon this foundation, the present paper addresses these gaps by conducting an experimental investigation into the static thrust characteristics of an electric Ducted Propulsion Fan (eDPF) system developed by the Aerospace Propulsion Systems (APSs) research team at Hanoi University of Science and Technology, Vietnam. The eDPF, the experimental fan model in this study, features a blade diameter of 386 mm and incorporates design modifications in pitch angle that differ significantly from those reported in previous studies [10,13,15,19] on electric fans of similar sizes.
In fact, this study involves static propulsion tests measuring thrust across a broad rotational speed range from 2000 rpm to 7000 rpm while systematically varying the input voltage and current. Leveraging the capabilities at APSs, two battery configurations, including eight-pack and nine-pack, are employed to maintain maximum DC voltages of 115 ± 3 V and 130 ± 3 V, respectively, allowing controlled adjustments to current intensity to align with the specifications of the 32 kW BLDC motor. Furthermore, this work includes an analysis of the relationship between electrical inputs and aero-propulsive performance, complemented by acoustic measurements of SPLs.

2. Experimental Method

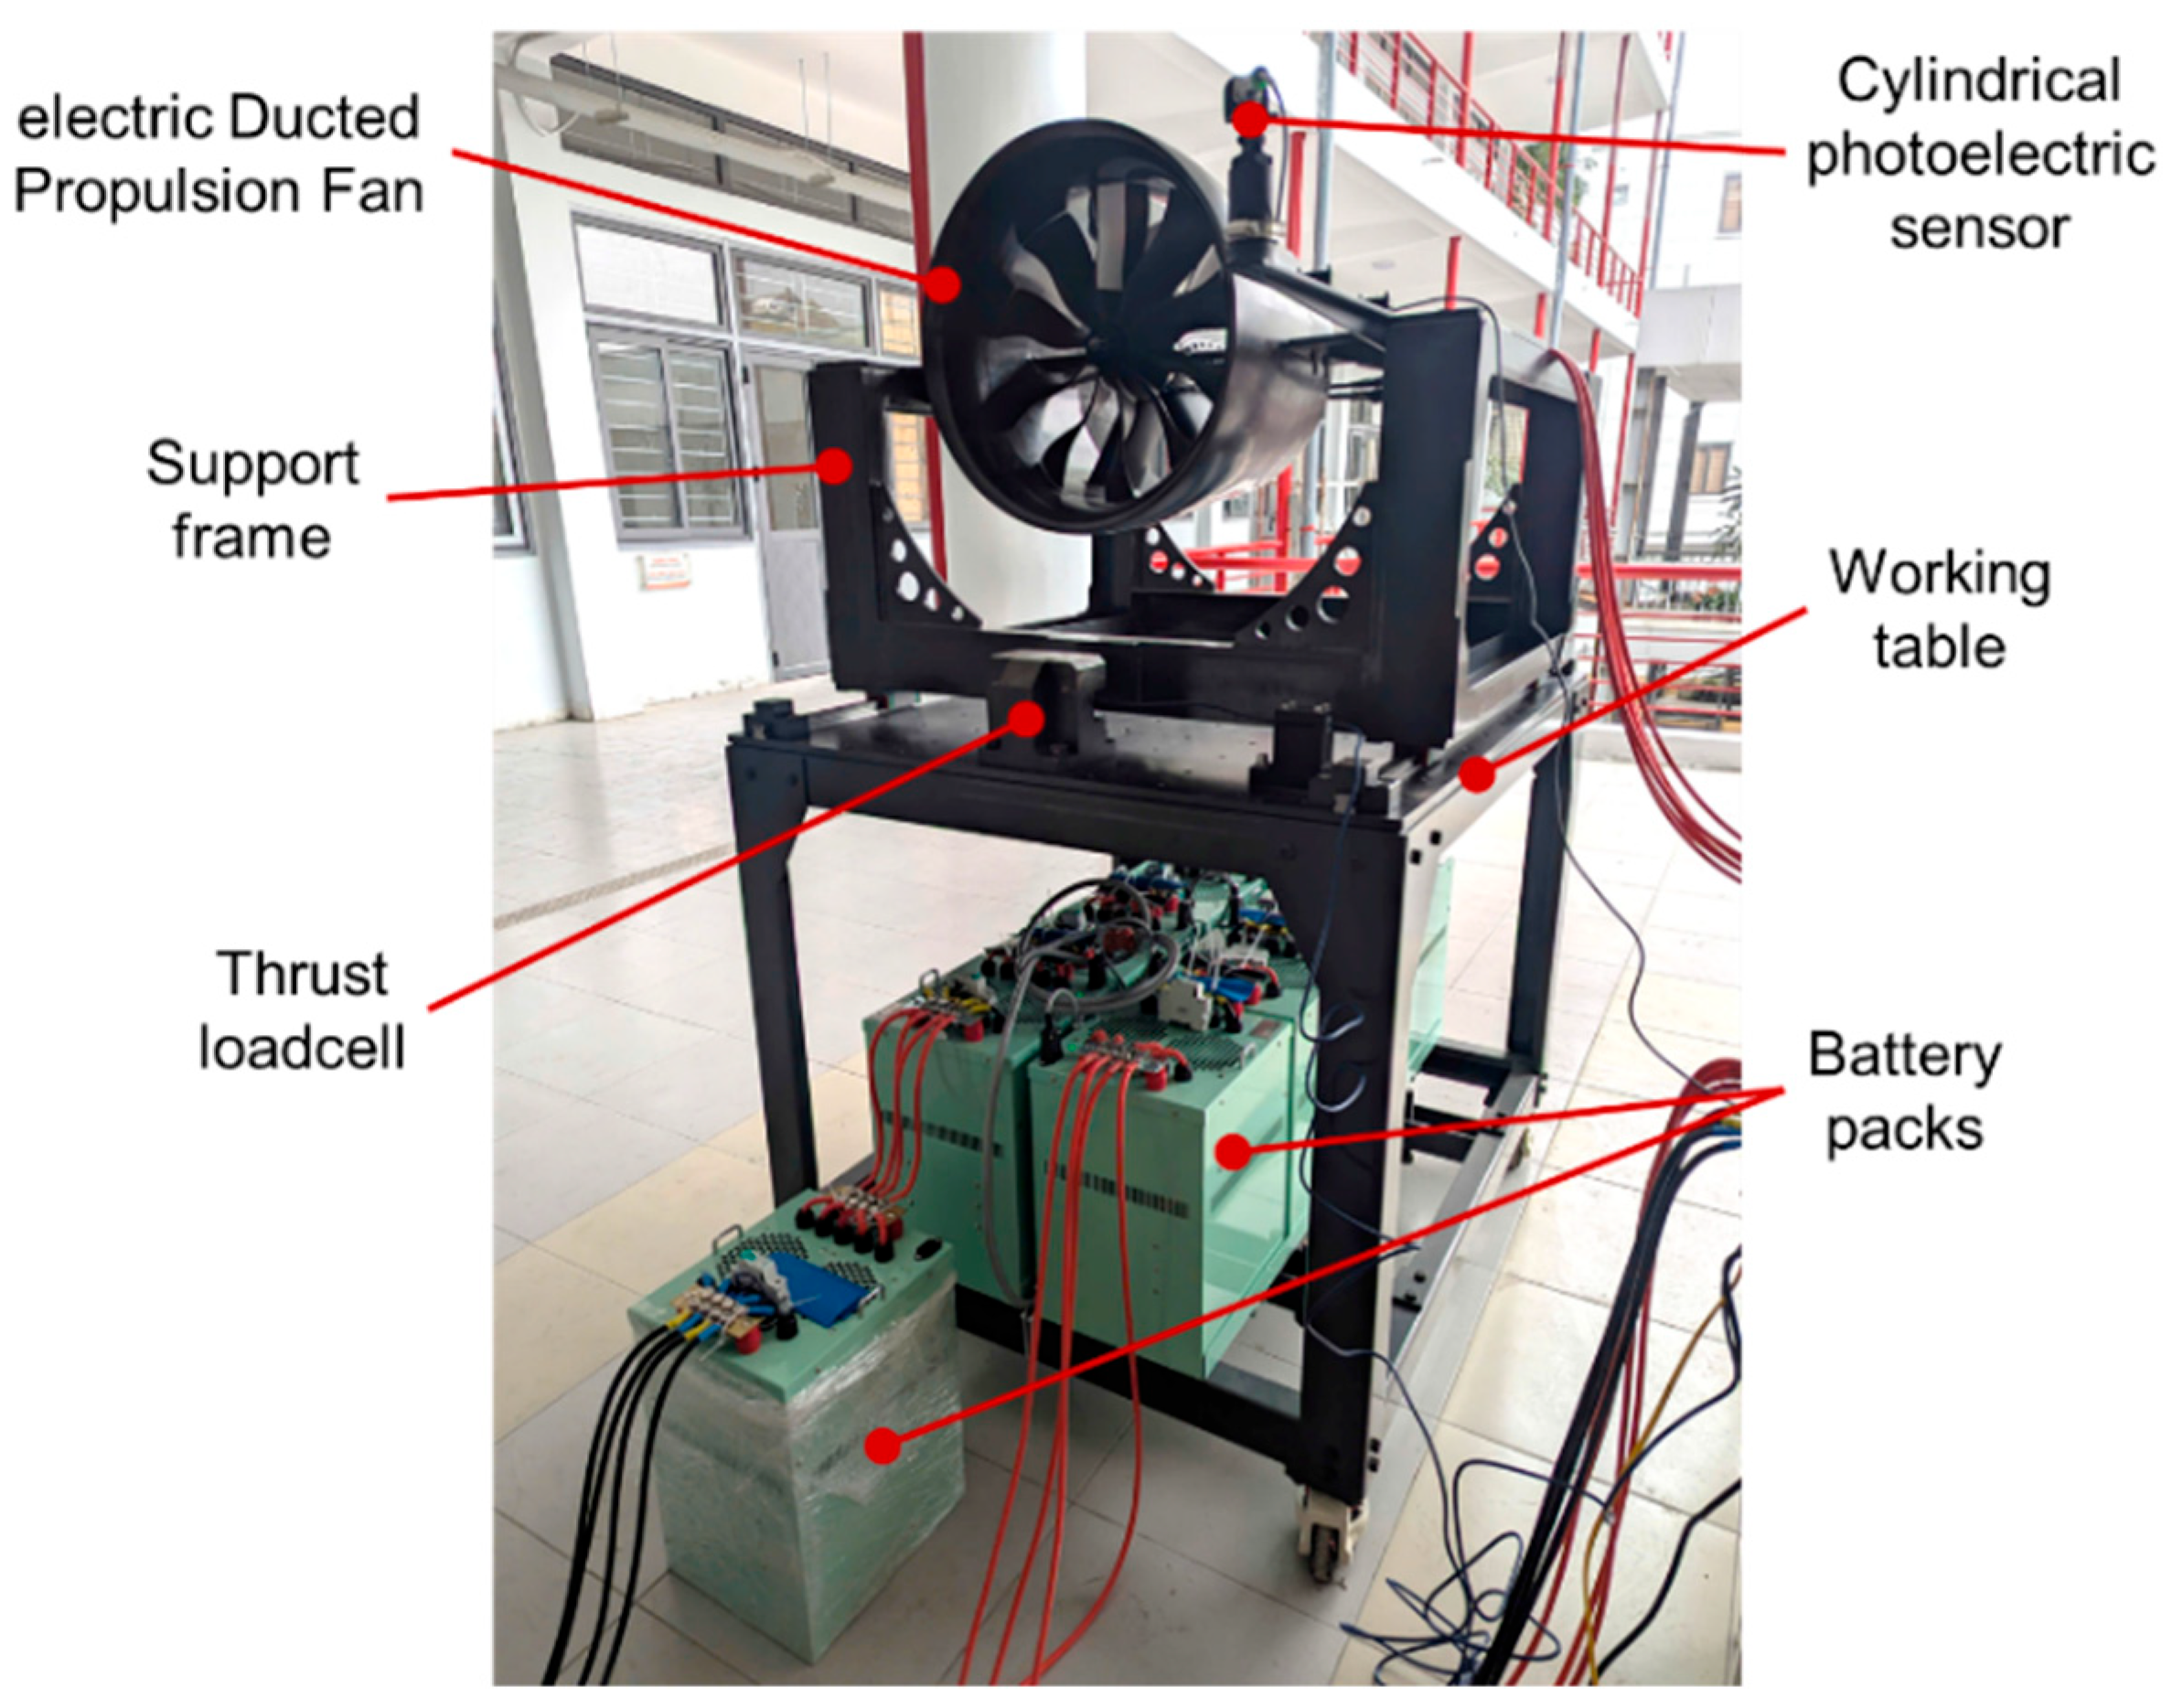
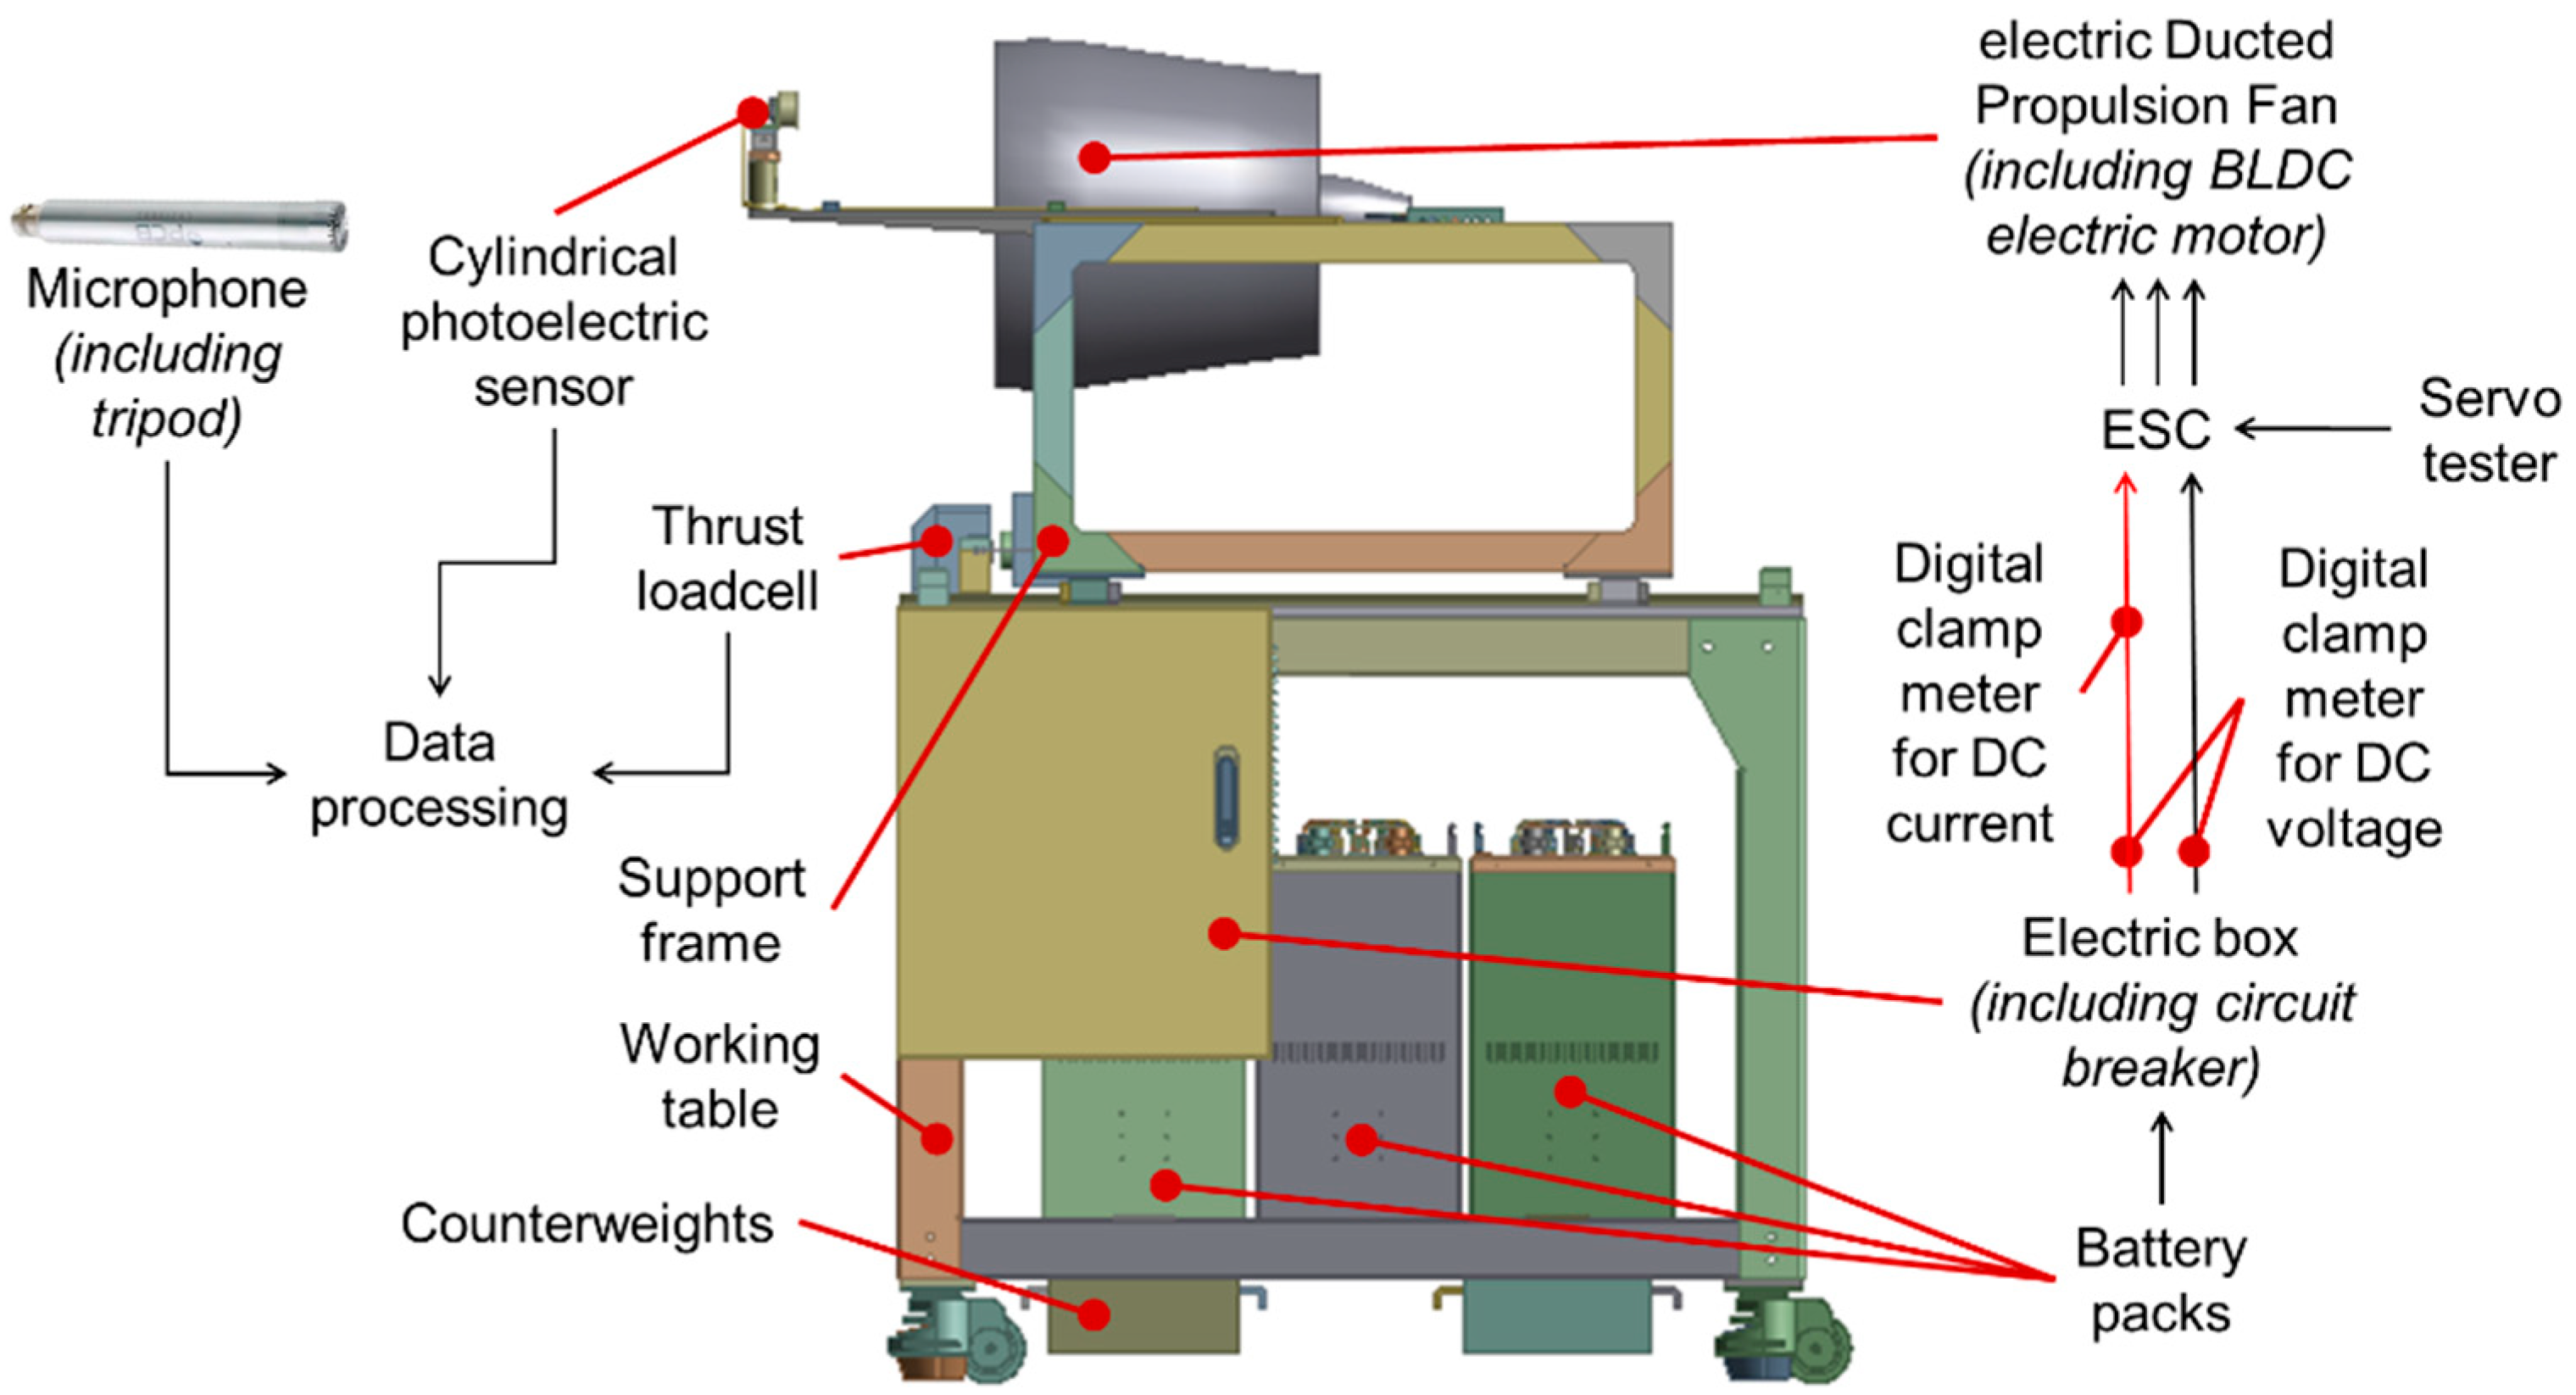
2.1. Facility Description

2.1.1. Electric Ducted Propulsion Fan Model

The eDPF model consists of 10 rotating blades and 6 stationary blades, with a duct shroud diameter of 390 mm and an average blade tip clearance of 2 mm (Table 1). This electric propulsor is primarily constructed from carbon fiber composite materials, with overall dimensions of 554 mm in length and 498 mm in nacelle diameter. The fan blades rotate counterclockwise, driven by a 32 kW Brushless Direct Current (BLDC) electric motor located at the core, allowing the eDPF to operate at rotational speeds of up to 10,000 rpm, depending on the battery, electrical, and control system configurations.
Figure 1 illustrates the main components of the eDPF, including the fan blades, strut blades, duct (shroud, lip, nacelle), tailcone, and mounting bars for attachment to the thrust test stand.

2.1.2. Thrust Testing Stand System

The thrust test stand system was developed by members and partners of the APSs research group. Figure 2 shows the key elements of the test stand setup, excluding the acoustic measurement equipment and control system. It includes the eDPF sample, support frame, working table, thrust load cell, cylindrical photoelectric sensor, and battery packs.

2.1.3. Measuring Equipment

All measurement equipment used in the static thrust testing of the eDPF was calibrated by the Vietnam Metrology Institute, as listed in Table 2. The compression-type thrust load cell is secured to the workbench using a fixed holder. The cylindrical photoelectric sensor is firmly mounted to the support frame at a distance suitable for directing the red LED beam onto the surface of a fan blade coated with a reflective layer. The microphone is mounted on a tripod at a suitable height and distance from the eDPF. Voltage and current from the battery system are measured independently and simultaneously using two digital clamp meters.

2.1.4. Battery System

The battery system powering the eDPF test setup is modular, consisting of nine rechargeable battery packs that can be connected either in series or in parallel. Each pack uses LiFePO4 battery cells, with voltage and current ratings specified in Table 3 and efficiency guaranteed by the supplier. Configurations with 8 or 9 battery packs connected in series were tested to determine the voltage and current values for the subsequent test steps.

2.2. Experimental Setup

Figure 3 presents a schematic diagram and the layout of the testing system. First, the circuit is closed using a circuit breaker located in the electrical cabinet. Then, DC power from the battery system—positioned beneath the working table—is supplied to the BLDC motor via an Electronic Speed Controller (ESC).
A 1/4-inch free-field microphone, equipped with a windscreen, is mounted on a tripod at a height of 1.5 m and a distance of 1.0 m from the fan nose. This microphone is aligned with the rotational axis of the eDPF to capture acoustic pressure fluctuations. The analog sound pressure signal is amplified and filtered using an amplifier before being digitized by the CompactDAQ system at a 20 kHz sampling rate. The digitized data are then processed to calculate SPL.
During operation, the support frame moves forward along the working table, transferring the thrust force to the load cell. A servo tester provides the PWM control signal to the ESC, which, in turn, regulates the rotational speed of the BLDC motor.
Two digital clamp meters are connected along the power line before the ESC to measure DC voltage and current. Signals from the thrust load cell, rotational speed sensor (photoelectric sensor), and microphone are transmitted to the CompactDAQ system for data acquisition and analysis.

3. Data Processing

3.1. Testing Procedure

All components involved in the eDPF static thrust testing are shown in Figure 3. A smoothing filter is applied in real time to eliminate most of the noise during data acquisition. In the next phase, data on thrust, rotational speed, and sound pressure are collected in real time on a computer using LabVIEW 2019 SP1 software. Voltage and current values are manually recorded from the digital clamp meter displays.
All measurements were carried out under identical operating conditions. Each test was repeated five times, and the average values were used as reference data. Only results with relative errors within acceptable limits were considered valid.
The testing campaign was divided into three groups:
+ Group 1: Full-range thrust tests using the nine-pack battery configuration. From these tests, the recommended voltage and current thresholds corresponding to different rotation speeds were determined.
+ Group 2: Comparative testing with eight-pack and nine-pack battery configurations. The electrical and thrust performance of the eDPF was evaluated based on both rotation speed and the number of battery packs.
+ Group 3: Acoustic measurements using the nine-pack battery configuration, assessed as a function of rotation speed.

3.2. Sound Pressure Level

The microphone samples audio signals at 20 kHz and employs a low-pass filter amplifier for signal acquisition. Based on the voltage signal V ( t ) (in V) measured by the microphone, the corresponding pressure signal p ( t ) (in Pa) is calculated using the following equation:
p ( t ) = V ( t ) S
where S is the microphone sensitivity, expressed in V/Pa.
Next, the Root Mean Square (RMS) of the pressure p r m s (in Pa) is calculated:
p r m s = 1 N i = 1 N p ( t i ) 2
where N is the number of samples.
At this time, the S P L (in dB) is calculated according to the following formula:
S P L = 20 log 10 p r m s p 0
where p 0 = 20 10 6   ( P a ) is the reference sound pressure in the air.

3.3. Background Noise

The ambient background noise was measured for several minutes and repeated multiple times before the eDPF operation to ensure consistency and reliability. During the measurements, the recorded background noise level stayed below 55 dB SPL, which served as the reference baseline.
When the fan was running, the measured SPL exceeded the background noise by more than 15 dB across all relevant frequency ranges. As per the ISO 3744:2010 standards [27], background corrections are not required when the signal-to-noise ratio is greater than 10–15 dB. Therefore, no corrections were made to the SPL, and the background noise was considered insignificant.

3.4. Uncertainty Analysis

The measurement uncertainties for all equipment were verified by the Vietnam Metrology Institute and are detailed in Table 2.
To evaluate measurement accuracy, the relative error for each measurement was required to be less than 5%. The relative error is defined as the ratio of the average difference between the measured and reference values to the applied value for each test. All data presented in the Experimental Results section exhibit relative errors below 5%, confirming that the uncertainties of both the instruments and measurements remain within acceptable bounds.
Regarding SPL uncertainty, the possible effect of uncorrected background noise was evaluated. Given the stable difference between the operational and baseline SPL values, its impact on the overall measurement error is minimal and falls within an acceptable range of uncertainty.

4. Experimental Results and Discussion

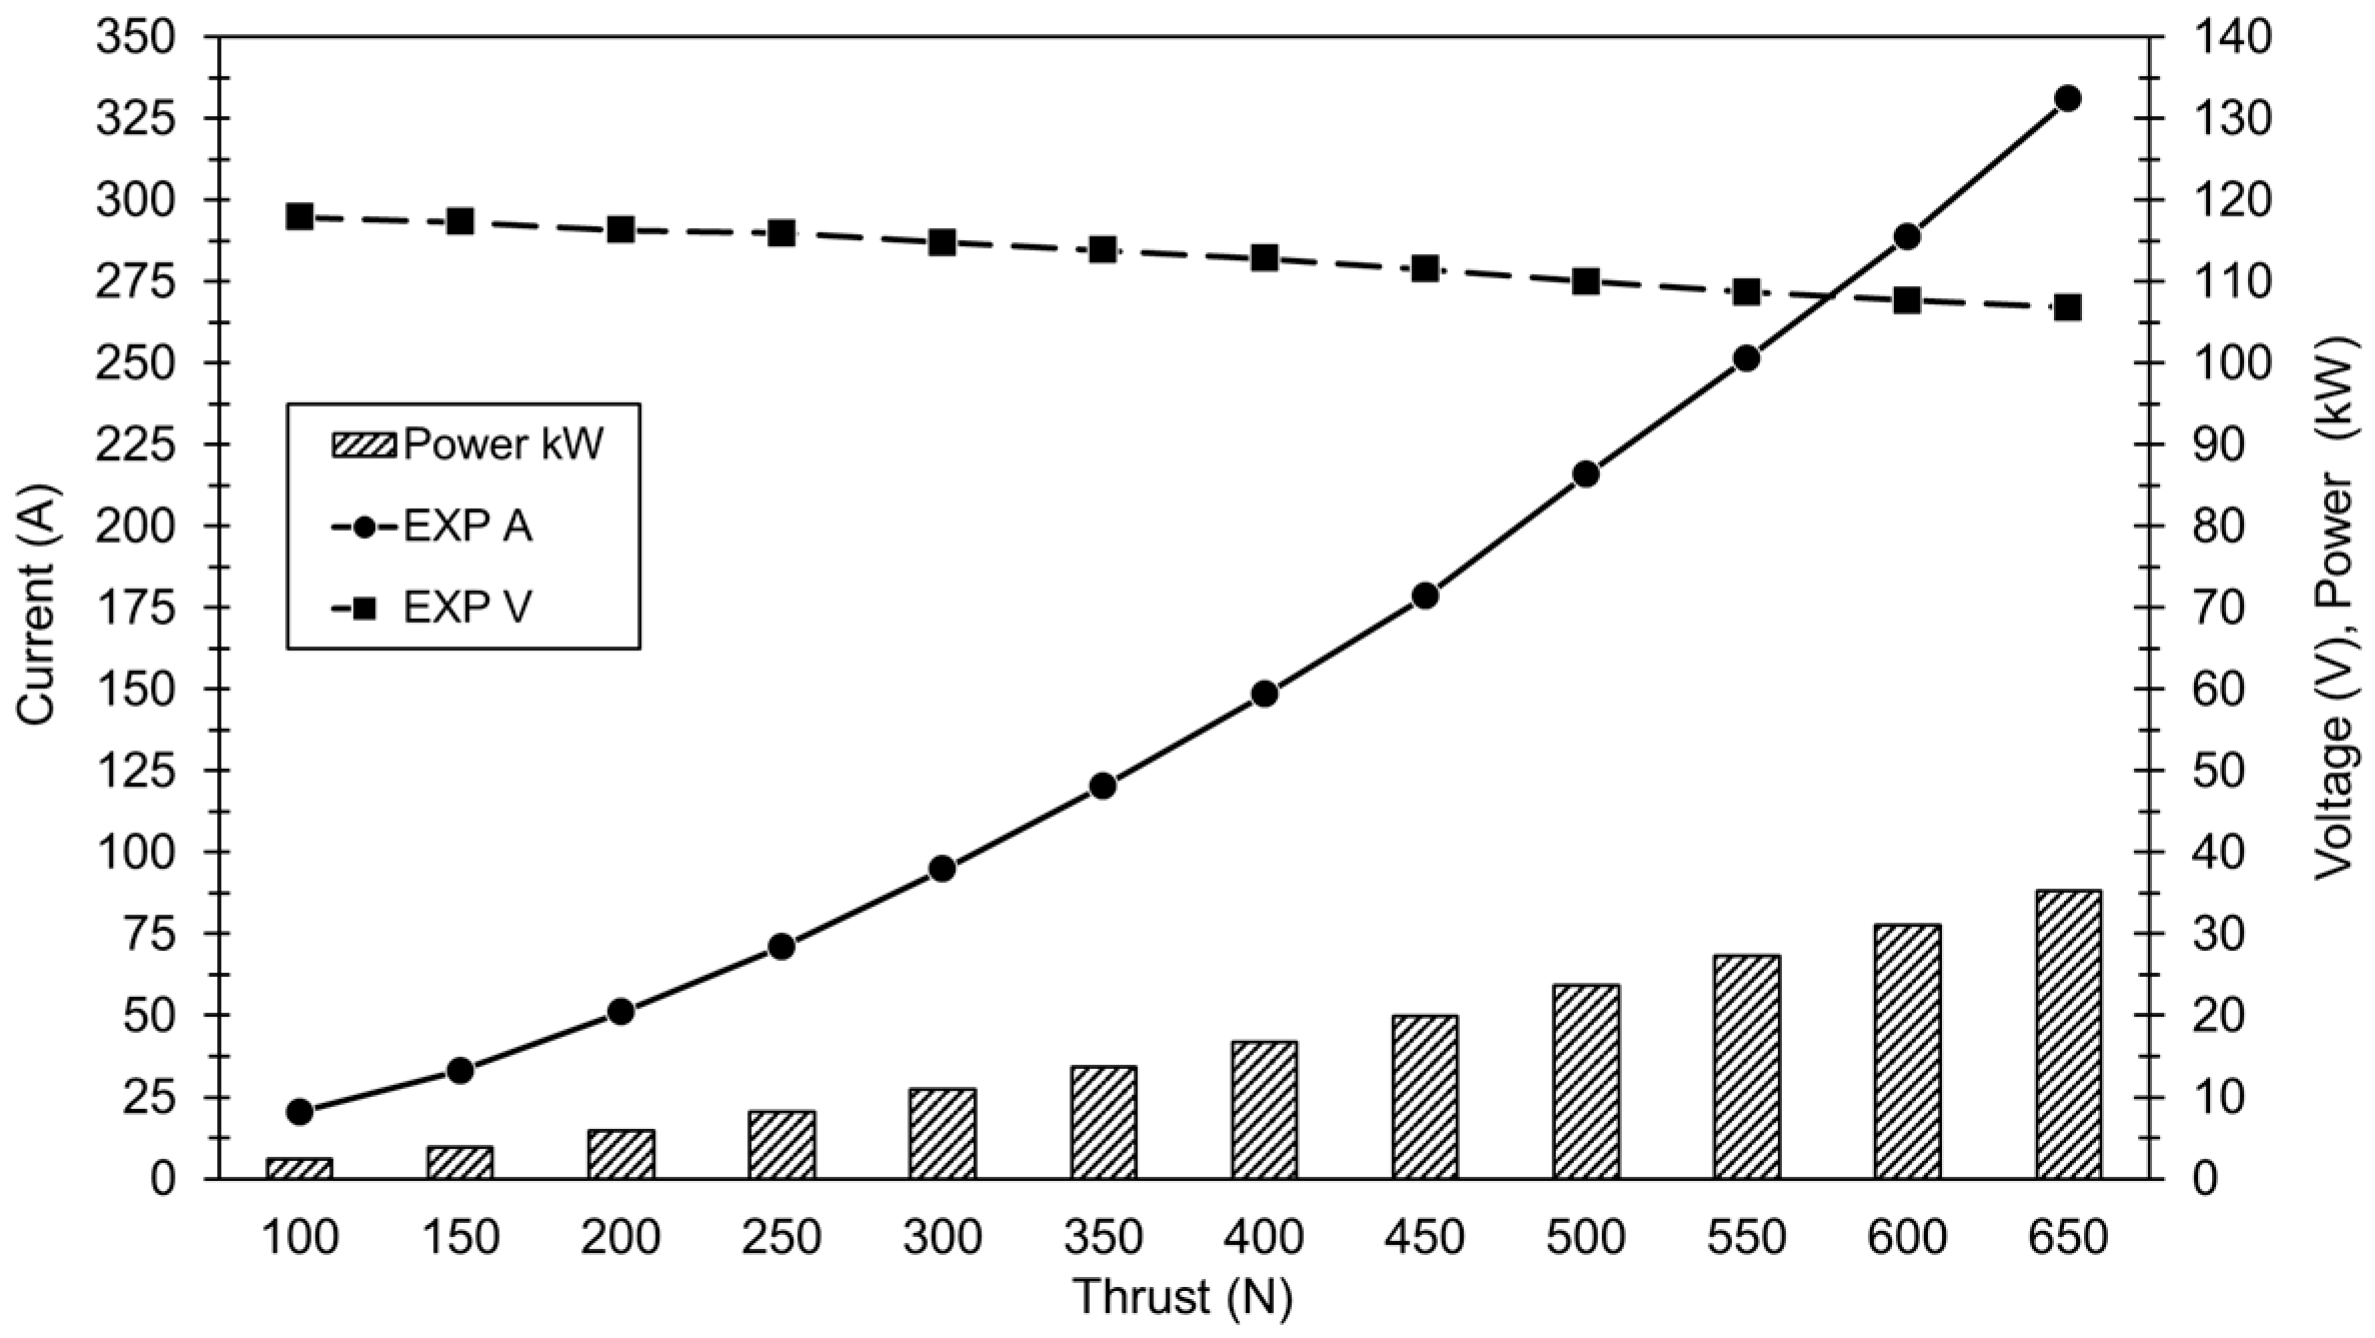
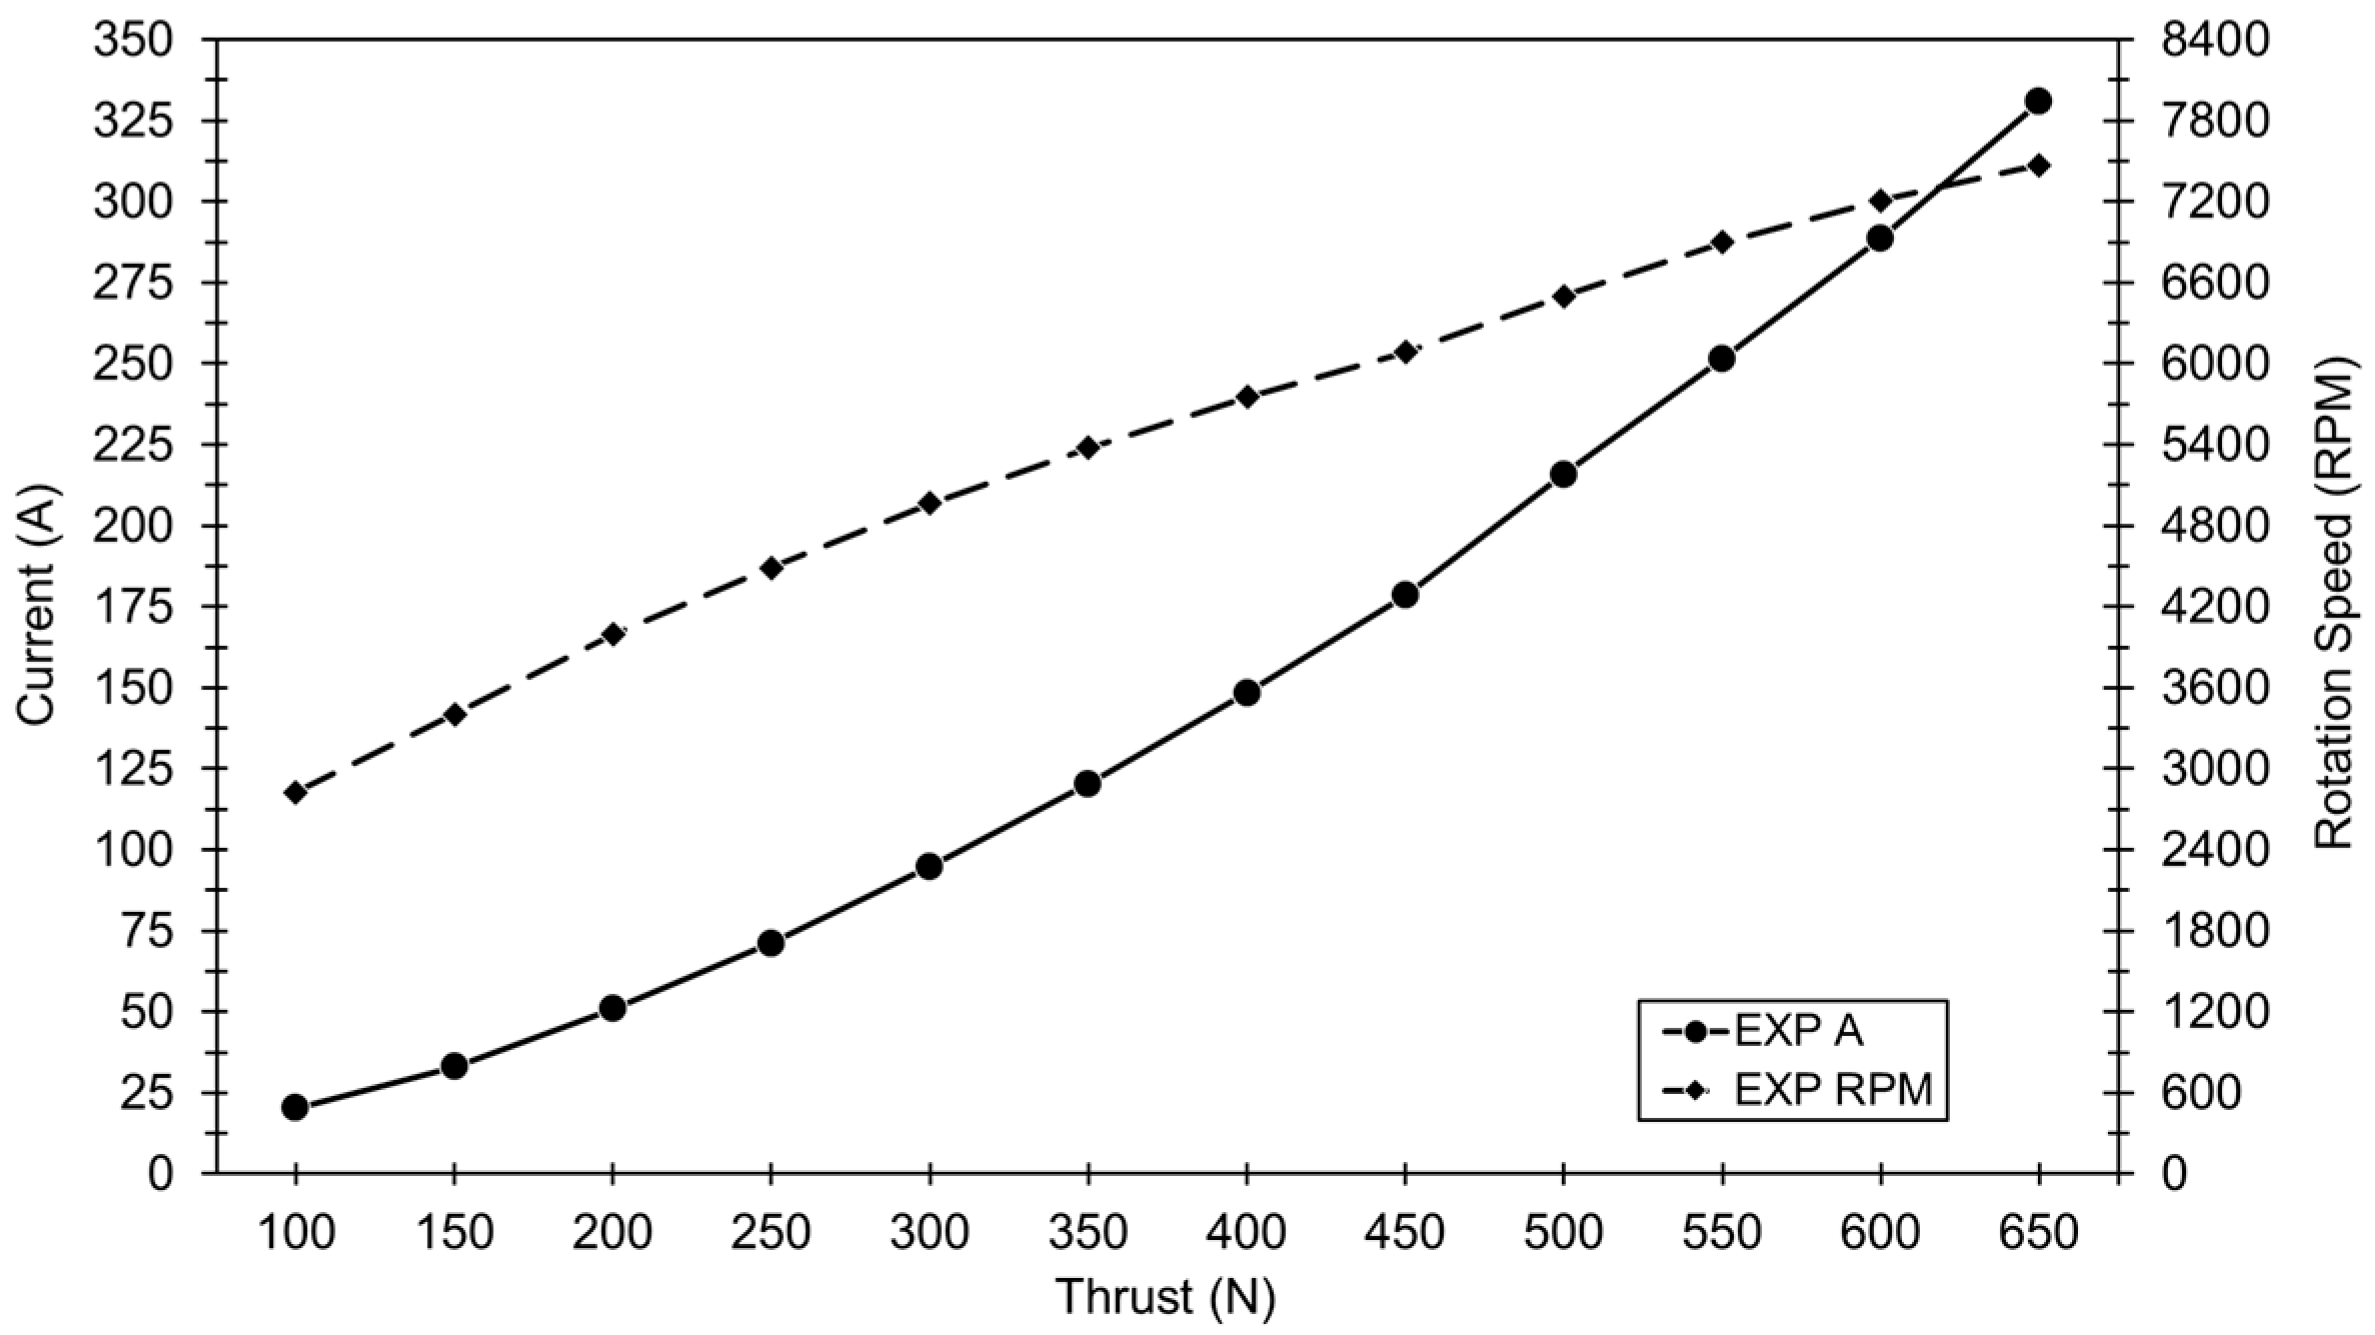
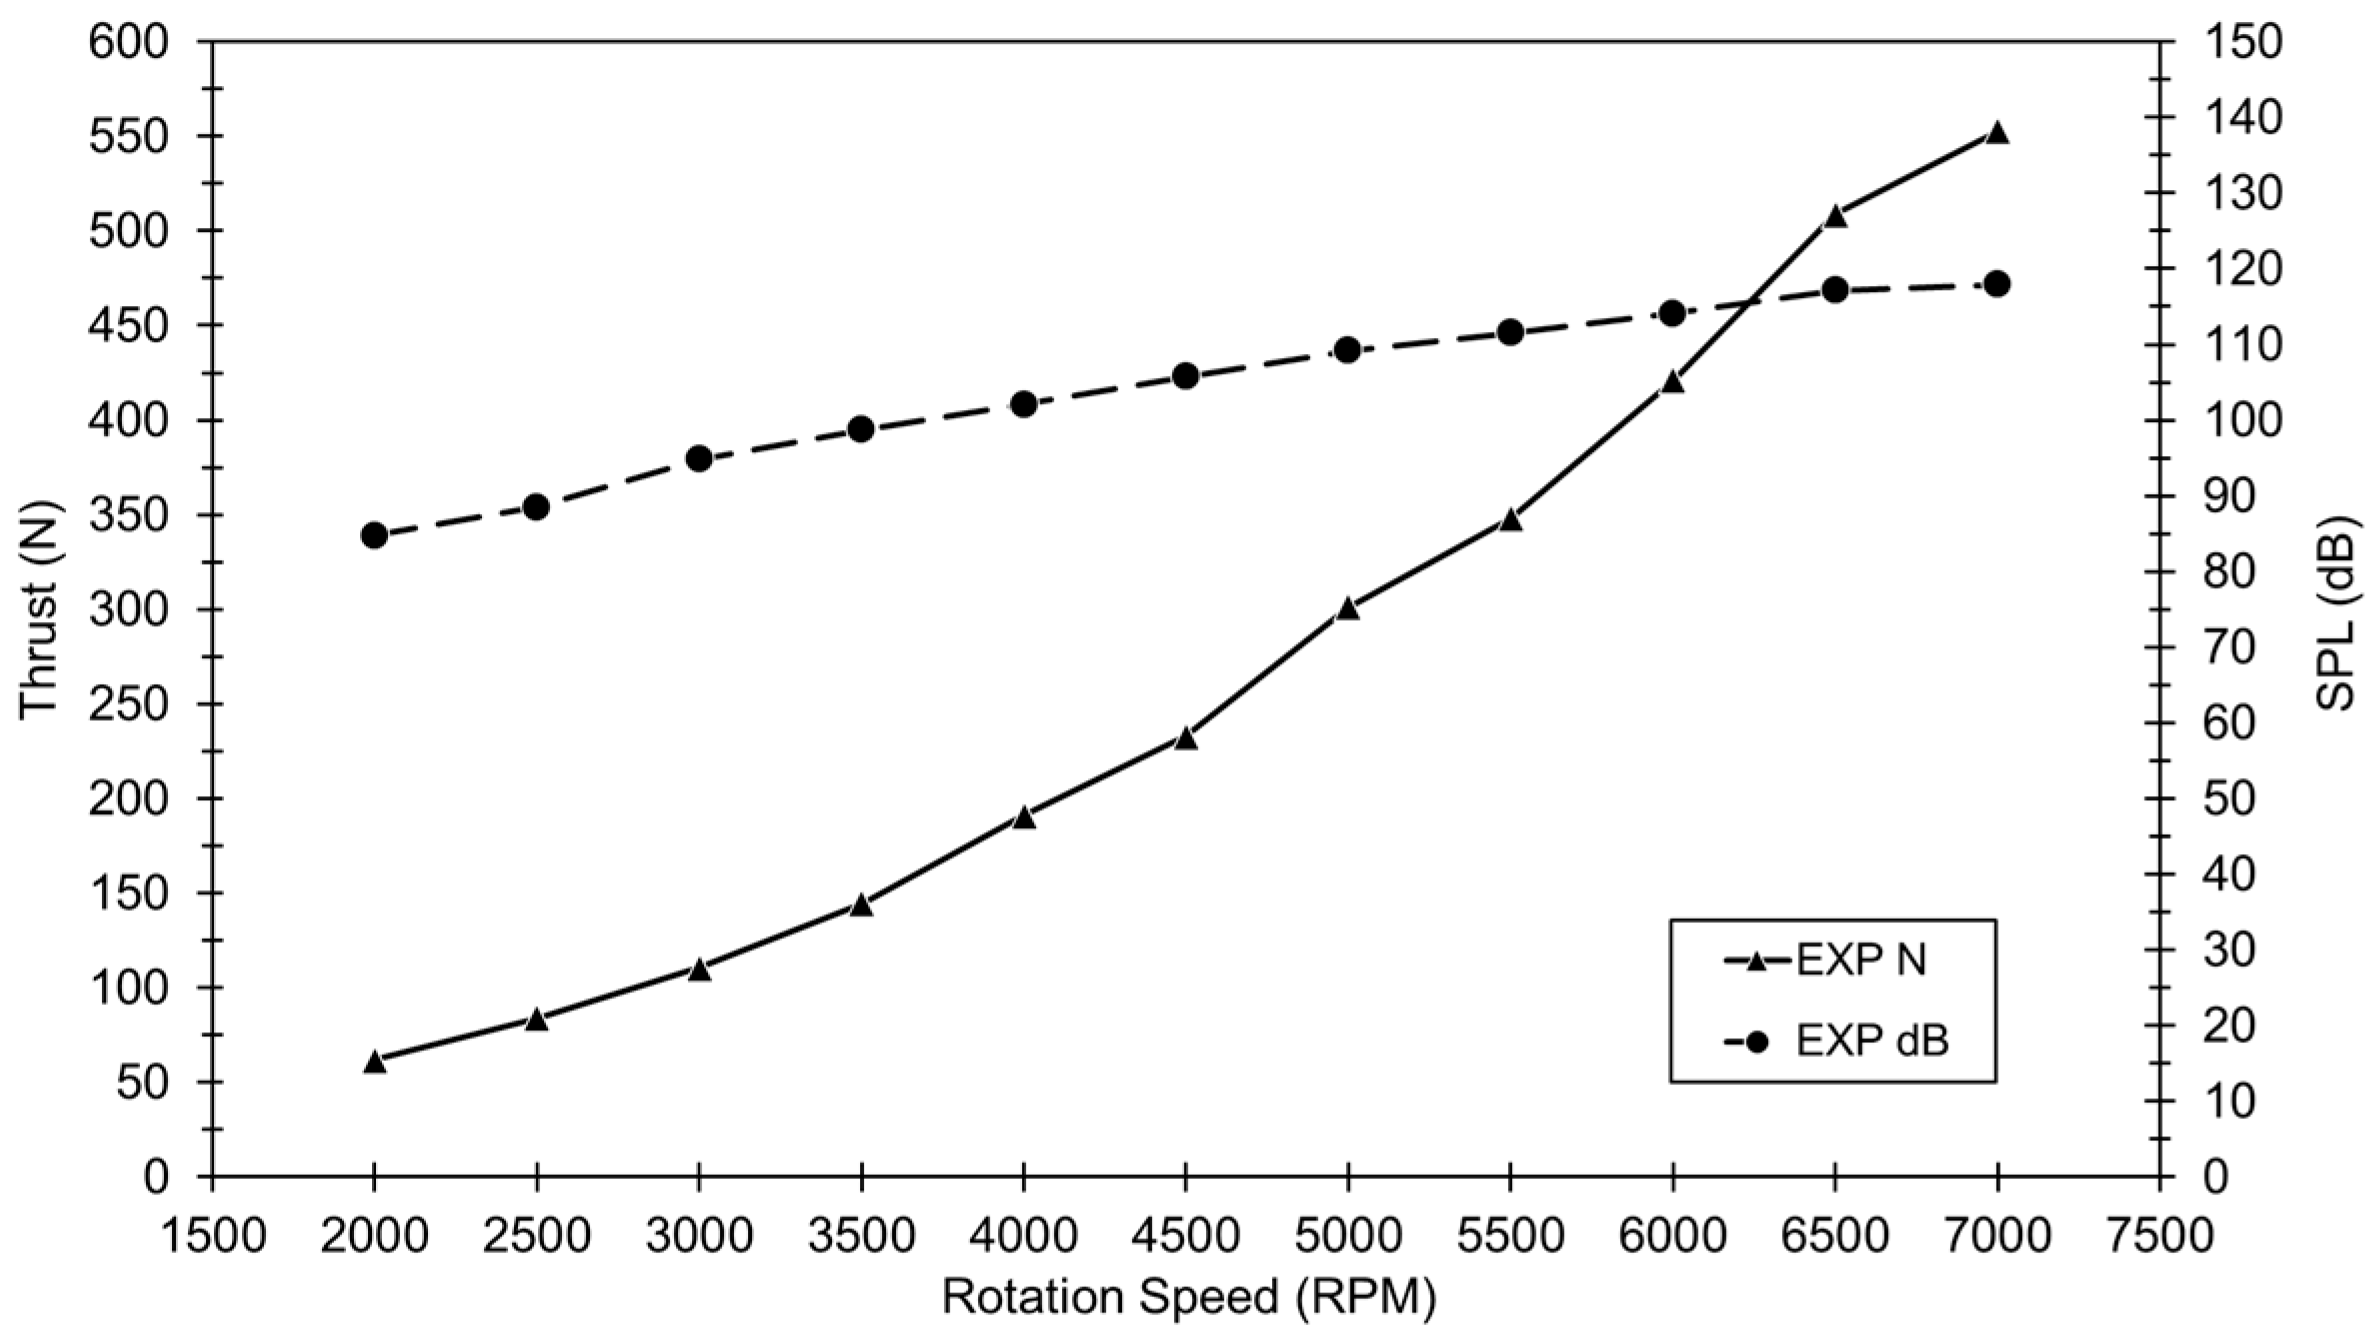
4.1. Experiment by Thrust Range

Initially, the battery system is fully utilized with nine packs. The eDPF rotational speed is then gradually increased to explore the relationships that vary across the thrust range.
Figure 4 shows that with nine battery packs, the voltage decreases from 117.9 V to 106.8 V, while the thrust increases from 100 N to 650 N in increments of 50 N. To increase thrust, the potentiometer is adjusted to raise the current through the ESC’s PWM pulse chopper wire. In practice, the current rises from 20.4 A to 330.9 A, indicating that the current increases proportionally with thrust and inversely with voltage. Furthermore, the graph in Figure 4 shows that as both current and thrust increase, the input power also rises, from 2.40 kW to 35.34 kW.
Figure 5 presents additional relationships between current, thrust, and rotational speed. As thrust increases from 100 N to 650 N, the rotational speed increases from approximately 2828 rpm to 7469 rpm.
Although the ESC can handle high current and power levels, the manufacturer recommends not exceeding voltage and current thresholds of 120 V and 300 A, respectively. At a thrust value of 600 N, the voltage is 107.7 V, the current is 288.8 A, the power is 31.10 kW, and the rotational speed is approximately 7208 rpm.
This means that to operate within the safe working limits of the ESC and BLDC, the eDPF should not be adjusted to achieve 600 N of thrust. For subsequent tests, the current should be kept below 280 A and the rotational speed below 7200 rpm, which remain within the ESC and BLDC’s recommended operational range.

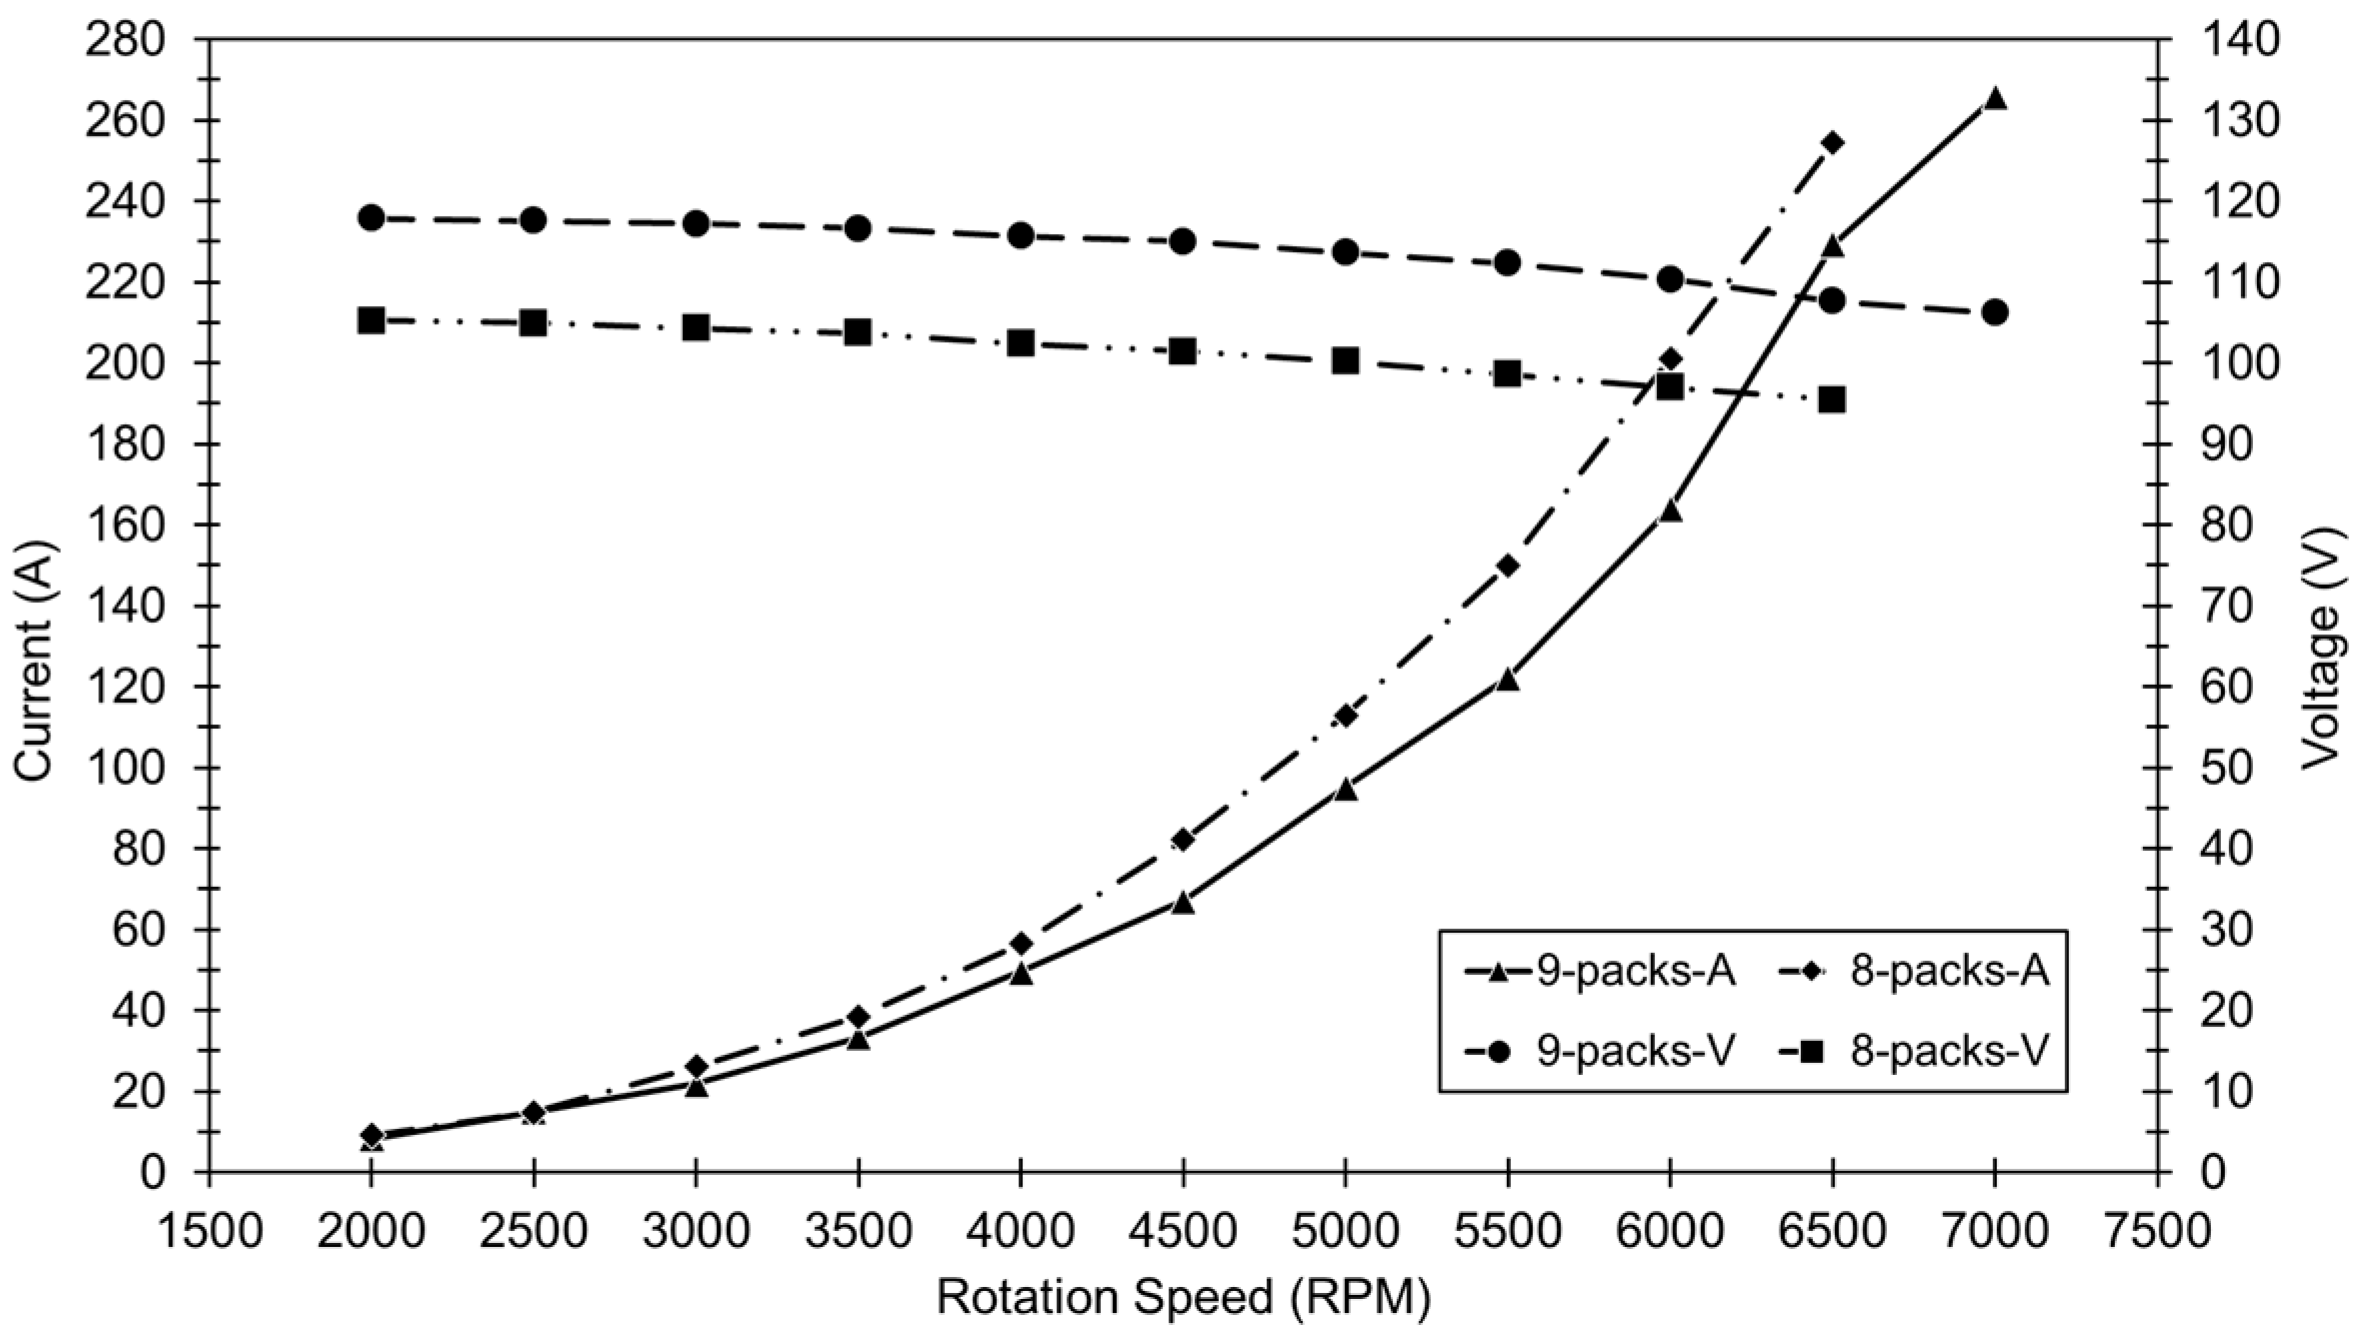
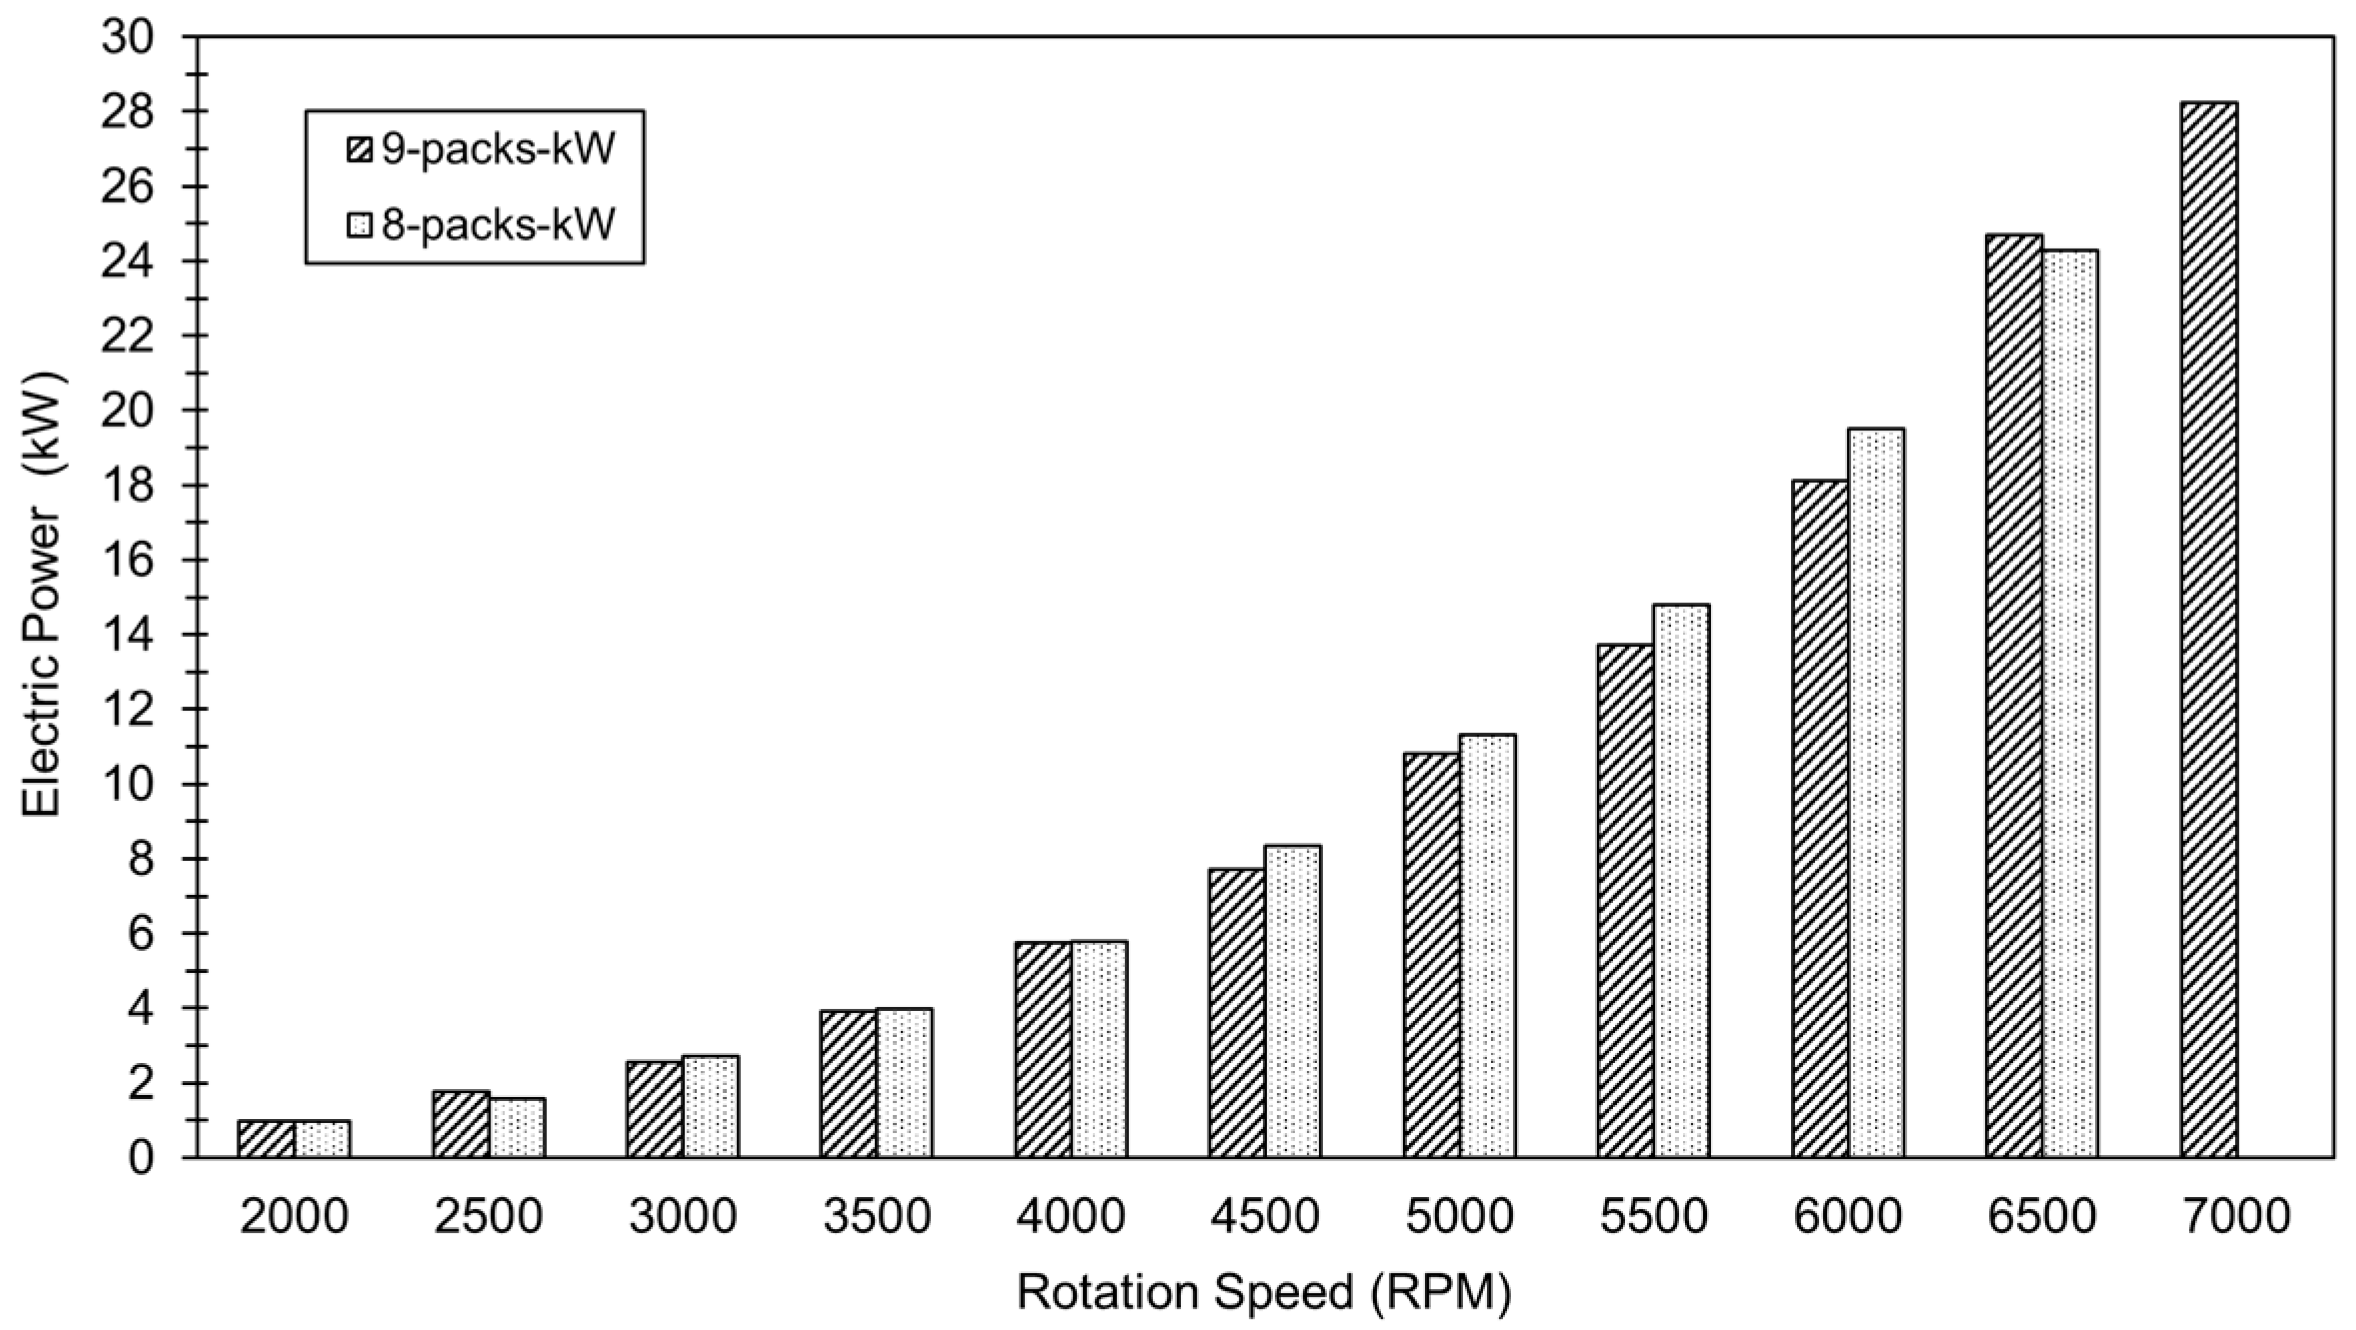
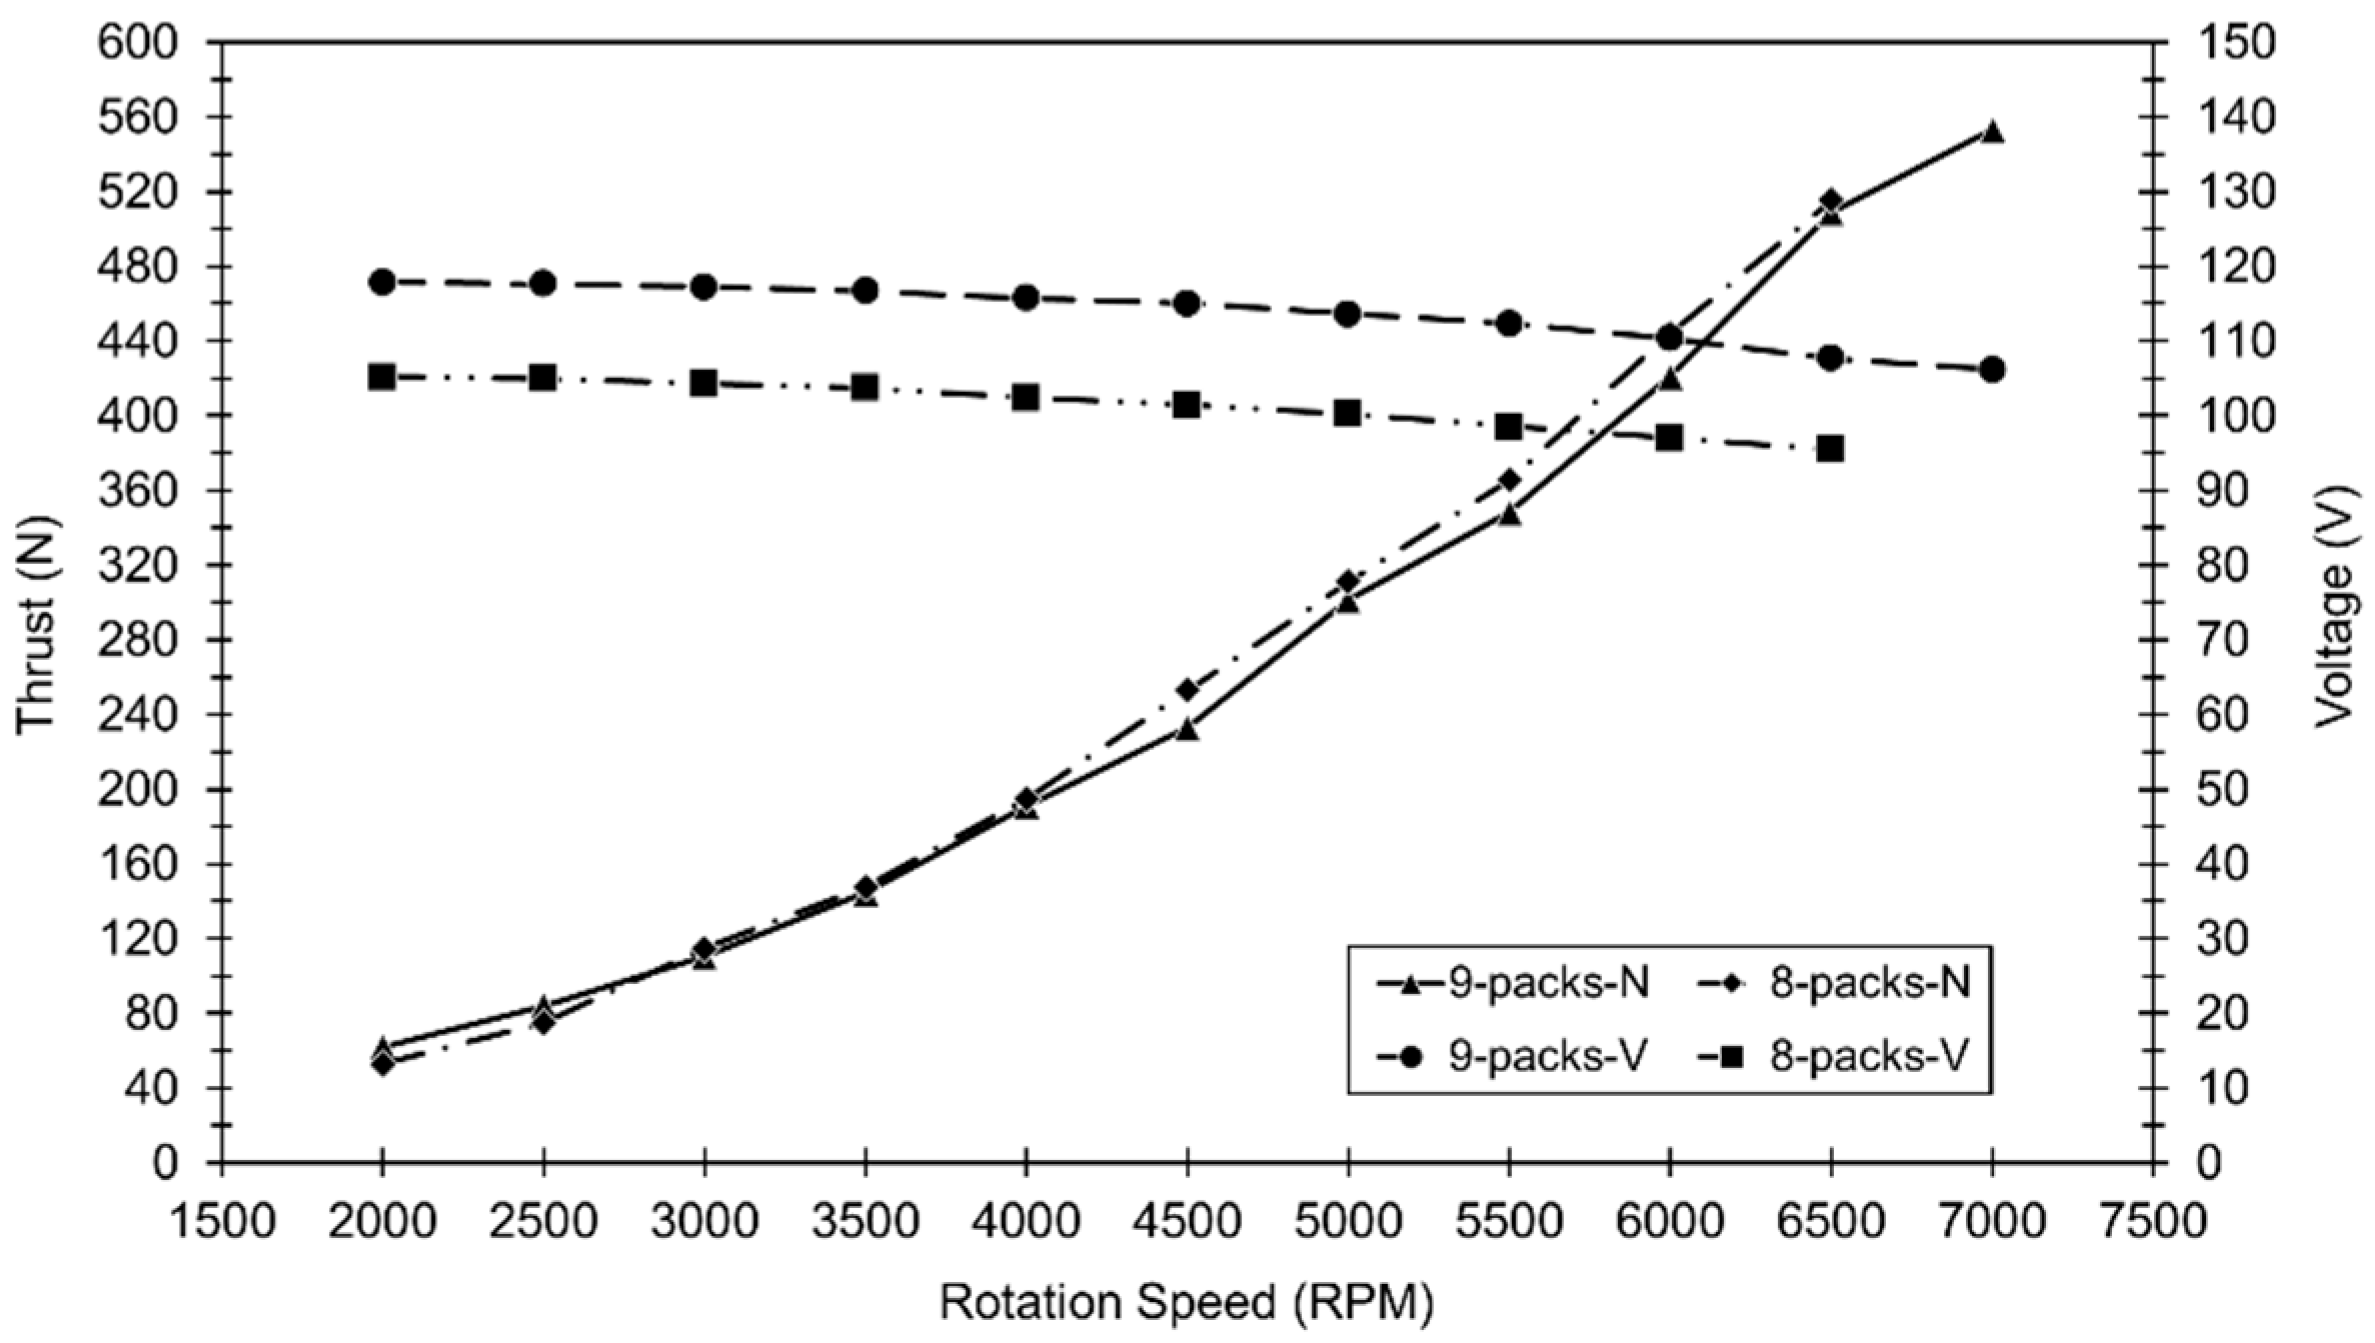
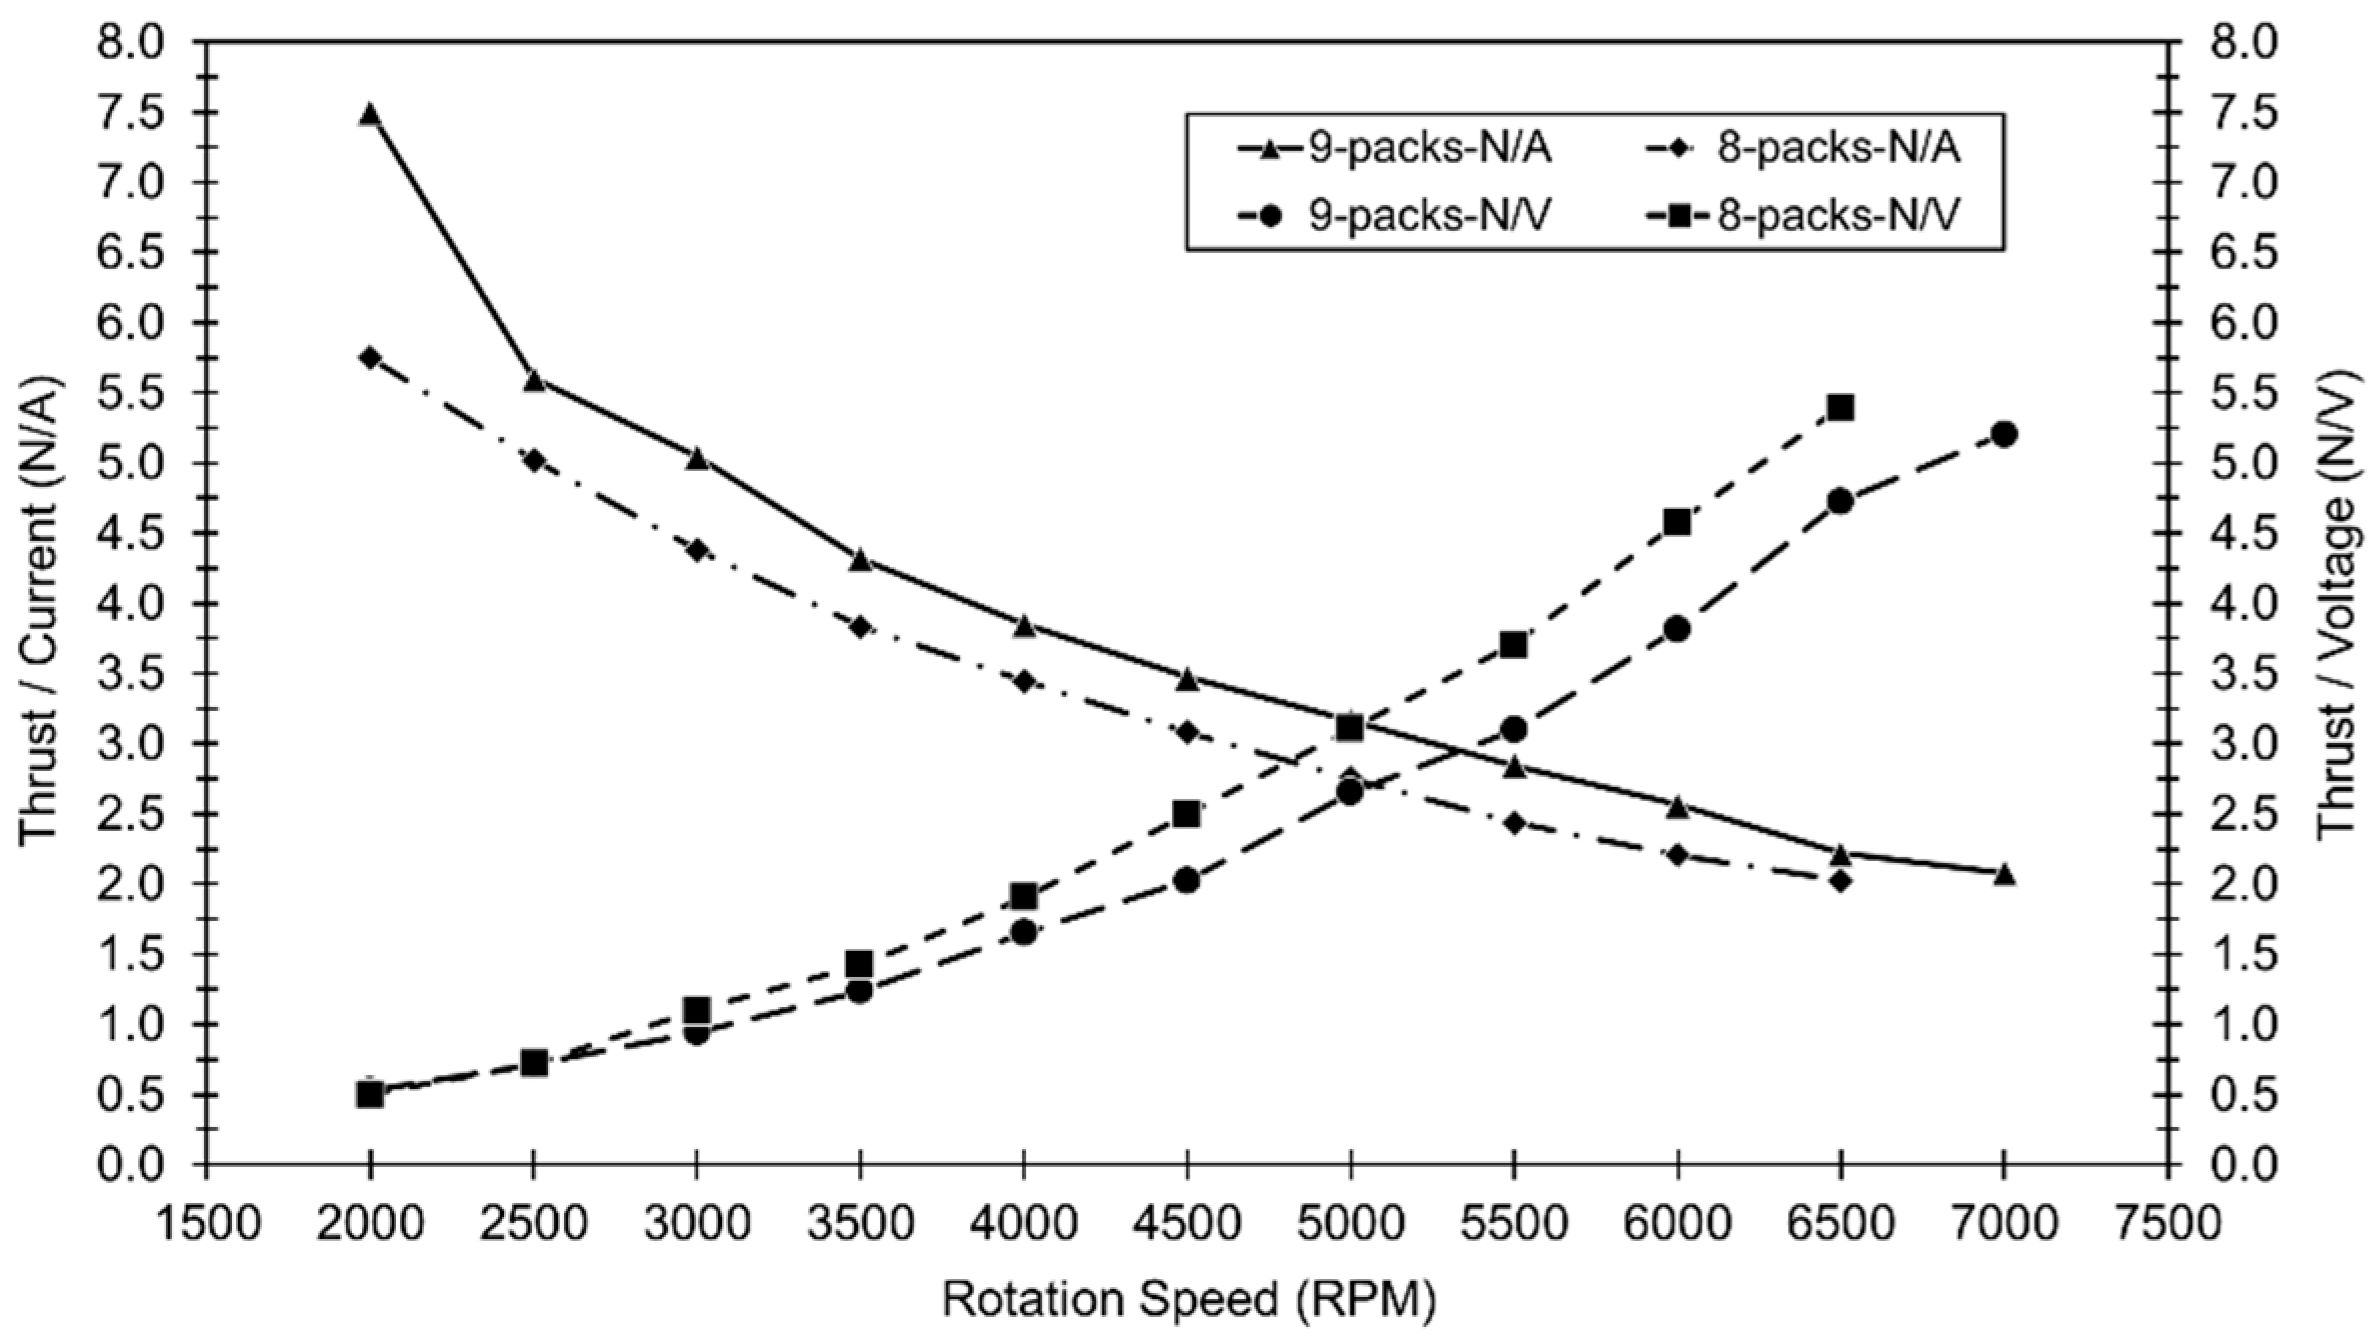
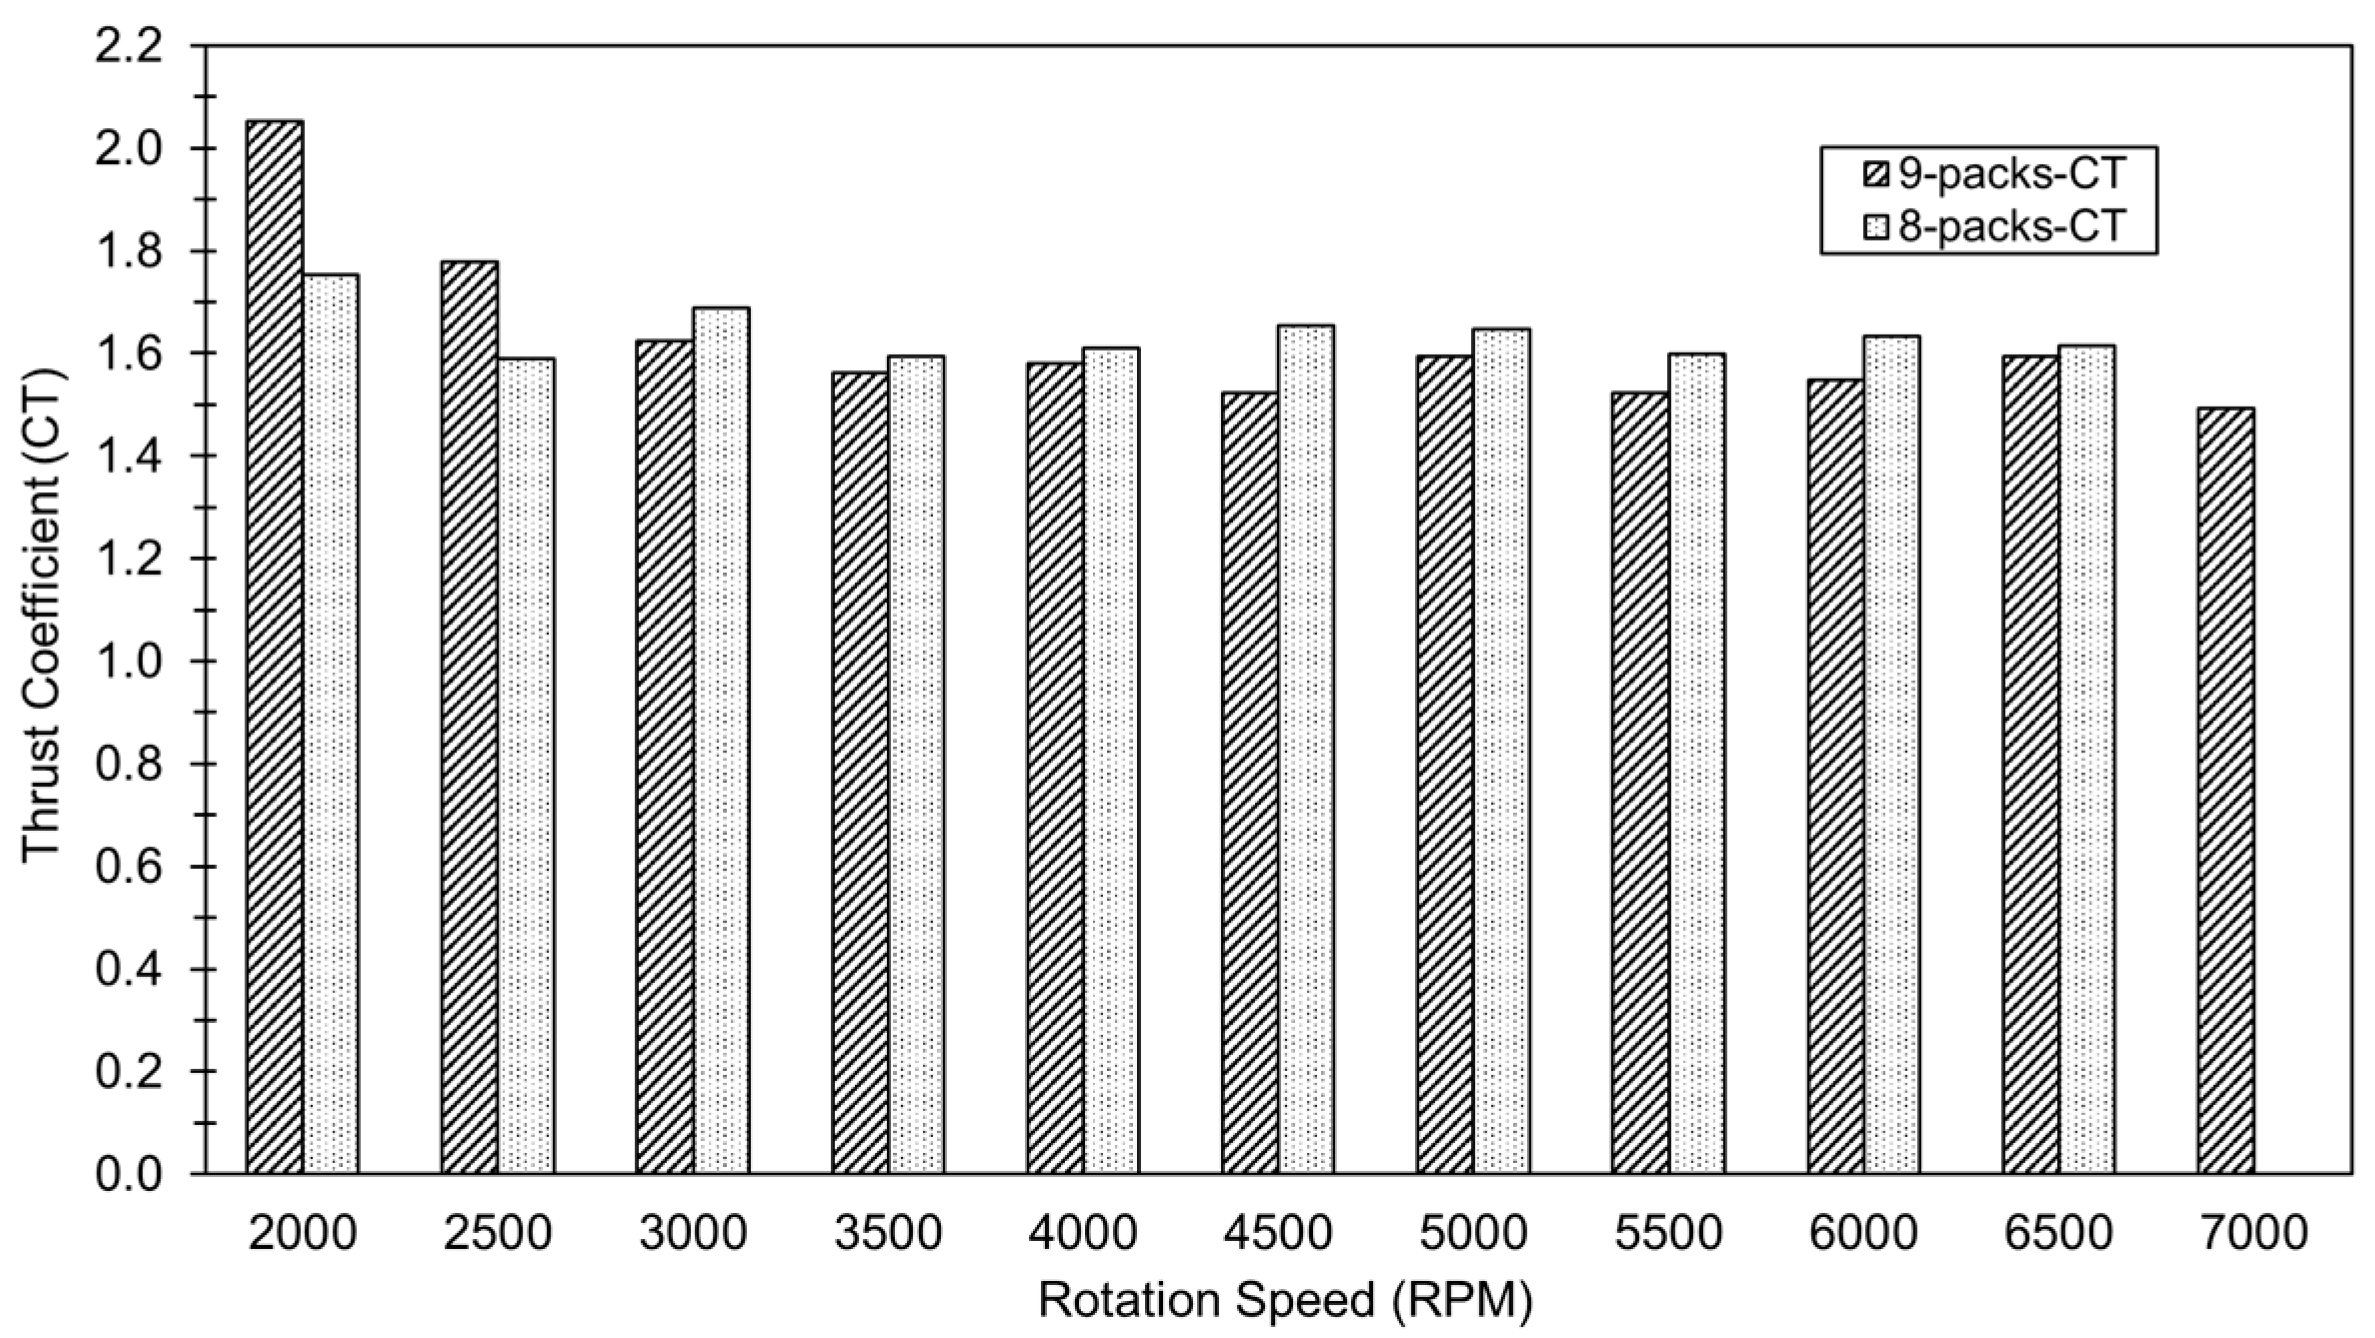
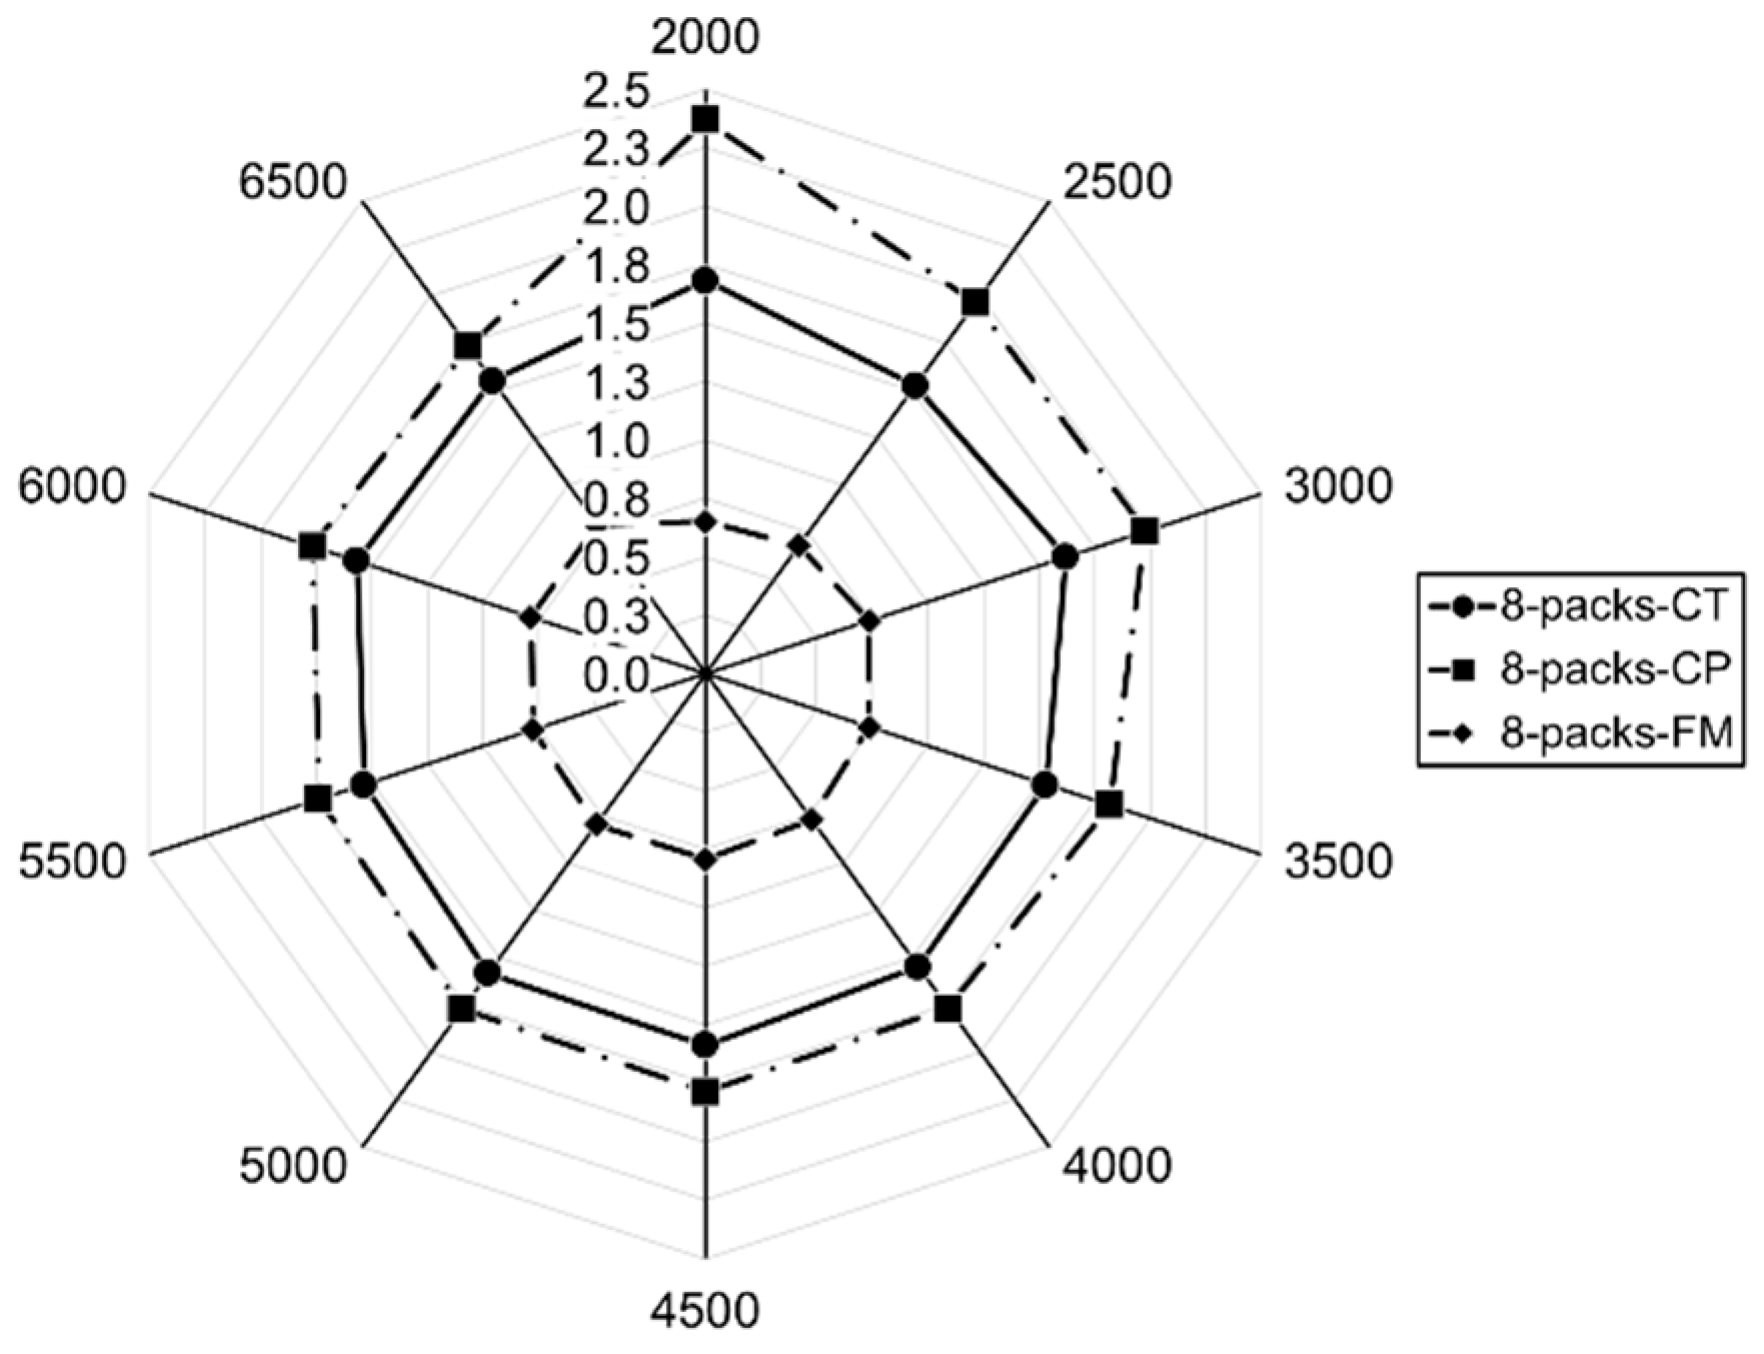
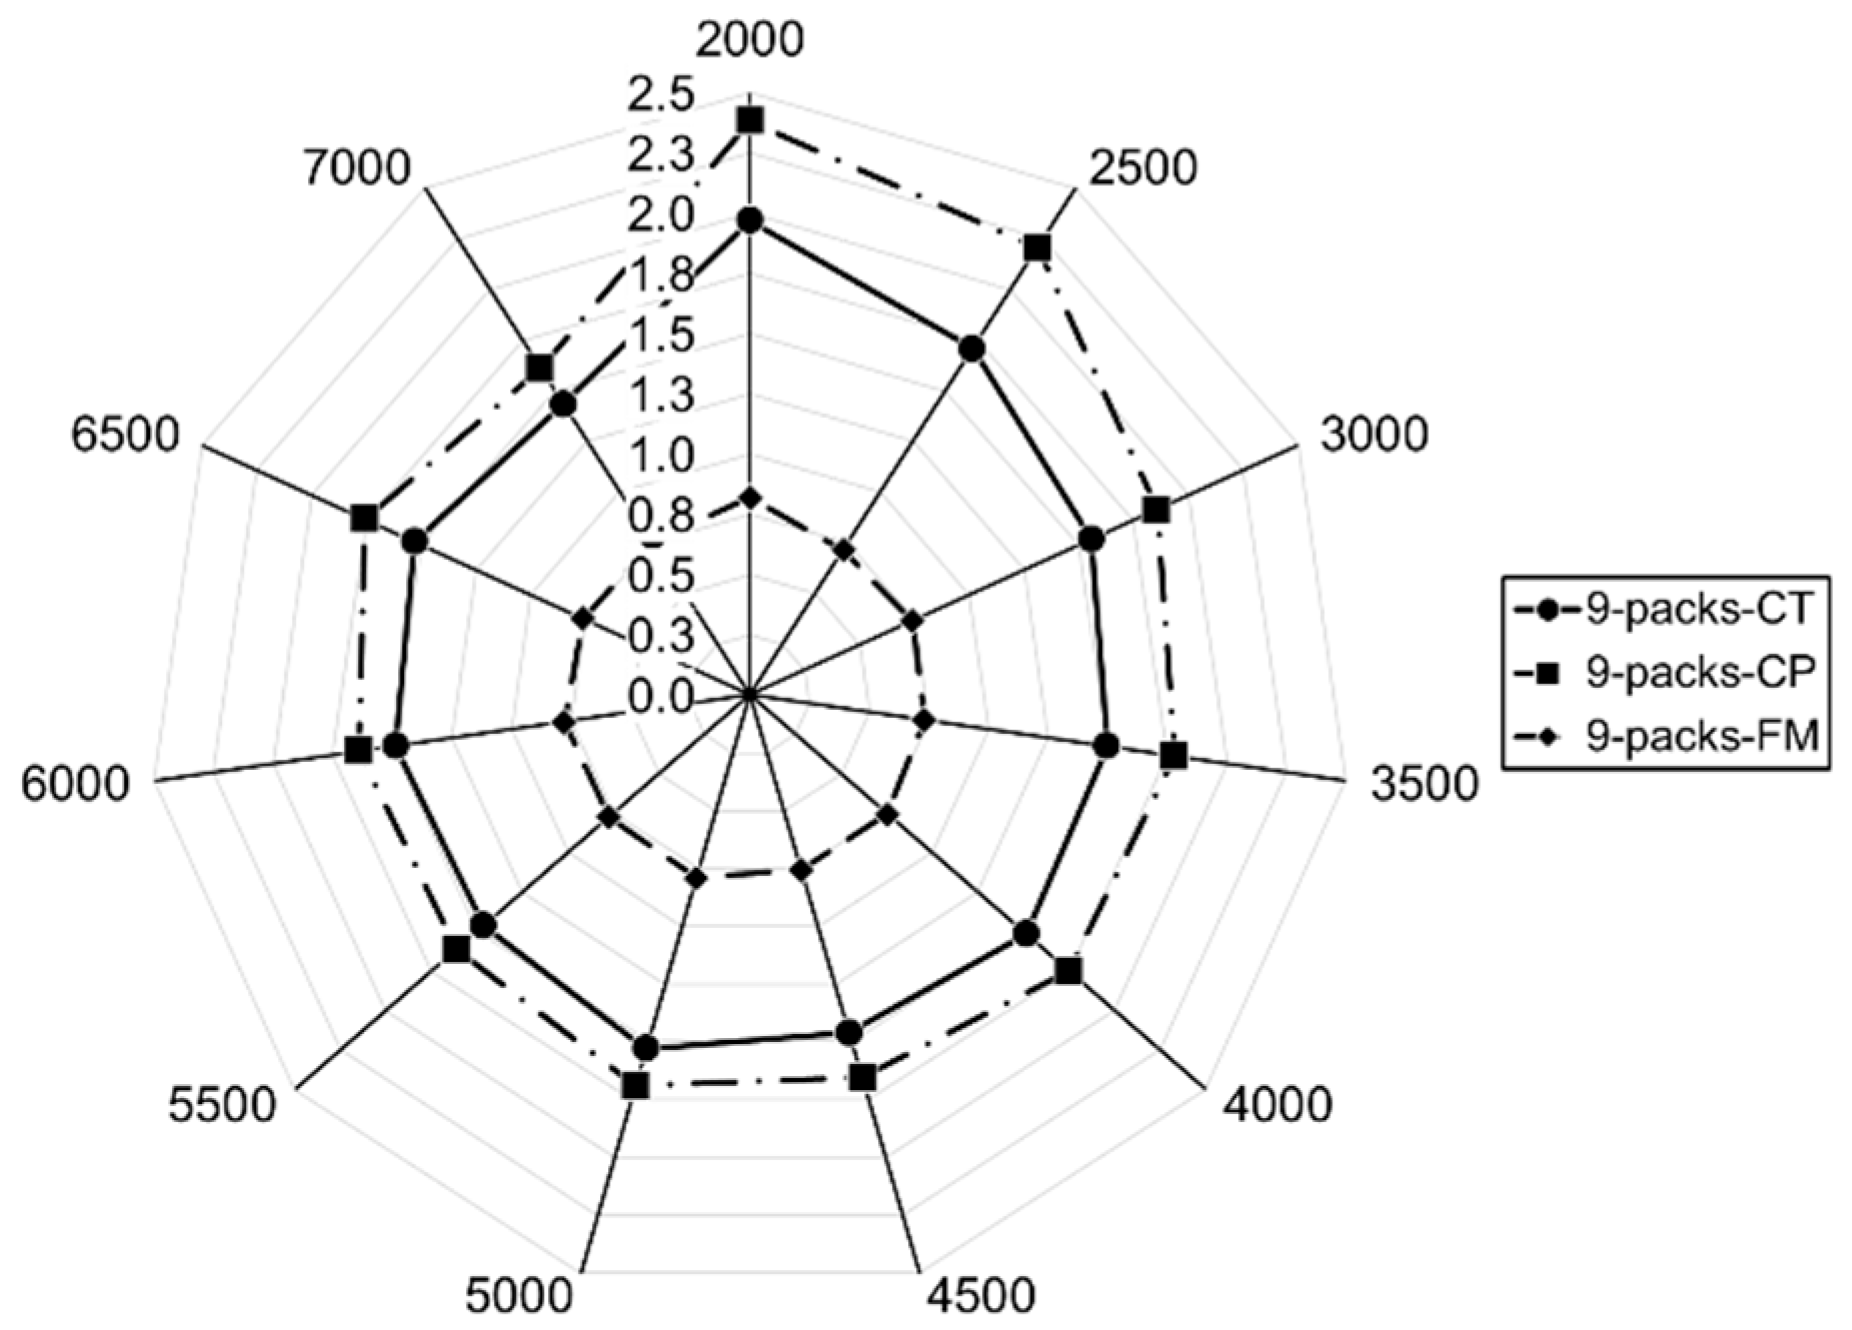
4.2. Experiment by Battery Pack Number

In this test step, the number of battery packs is varied with the aim of adjusting the input voltage. During this phase, eDPF operation is monitored across a rotational speed range from 2000 rpm to 7000 rpm, with increments or decrements of 500 rpm.
Figure 6 shows that when using eight battery packs, the voltage decreases from 105.2 V at 2000 rpm to 95.5 V at 6500 rpm. Meanwhile, with nine battery packs, the voltage decreases from 117.9 V at 2000 rpm to 106.2 V at 7000 rpm. Notably, the maximum voltage in the eight-pack configuration is still lower than the minimum voltage in the nine-pack configuration. This allows for seamless and continuous monitoring of voltage variations.
Figure 6, Figure 7 and Figure 8 reveal a recurring pattern in the eight-battery-pack case: as the rotational speed increases, voltage and power demand also increase, resulting in increased thrust, while voltage tends to drop.
Figure 6 also shows that the maximum rotational speed achievable with eight battery packs is 6500 rpm, whereas with nine battery packs, it can reach 7000 rpm—both within the system’s safe operating threshold. Additionally, at the same rotational speed, since the voltage supplied by the eight-pack configuration is lower than that of the nine-pack, a higher current is required when using eight packs.
As speed increases, the difference in current between the two configurations becomes more pronounced due to higher energy demand. Specifically, at 6500 rpm, eight battery packs must supply approximately 254.4 A, while nine battery packs supply only about 229.3 A—a difference of around 25.1 A.
Since electrical power is proportional to the square of the current and inversely proportional to voltage, a faster rise in current intensity results in more heat generation in the wires and electrical equipment, leading to increased thermal losses over time. Therefore, based on Figure 6, prolonged use of the eight-pack battery configuration will result in higher heat losses compared to the nine-pack configuration, especially at medium to high rotational speeds (from 4500 rpm and above).
Figure 7 shows a slight difference in input power at each rotational speed, particularly from 4500 rpm and higher. Meanwhile, Figure 8 indicates a small variation in thrust between the two configurations in the 4500–6500 rpm range. Specifically, the thrust produced by eight battery packs is slightly higher than that produced by nine packs. At 6000 rpm, the eight-pack setup enables the eDPF to generate about 444 N of thrust, while the nine-pack setup delivers around 421 N—a difference of about 23 N.

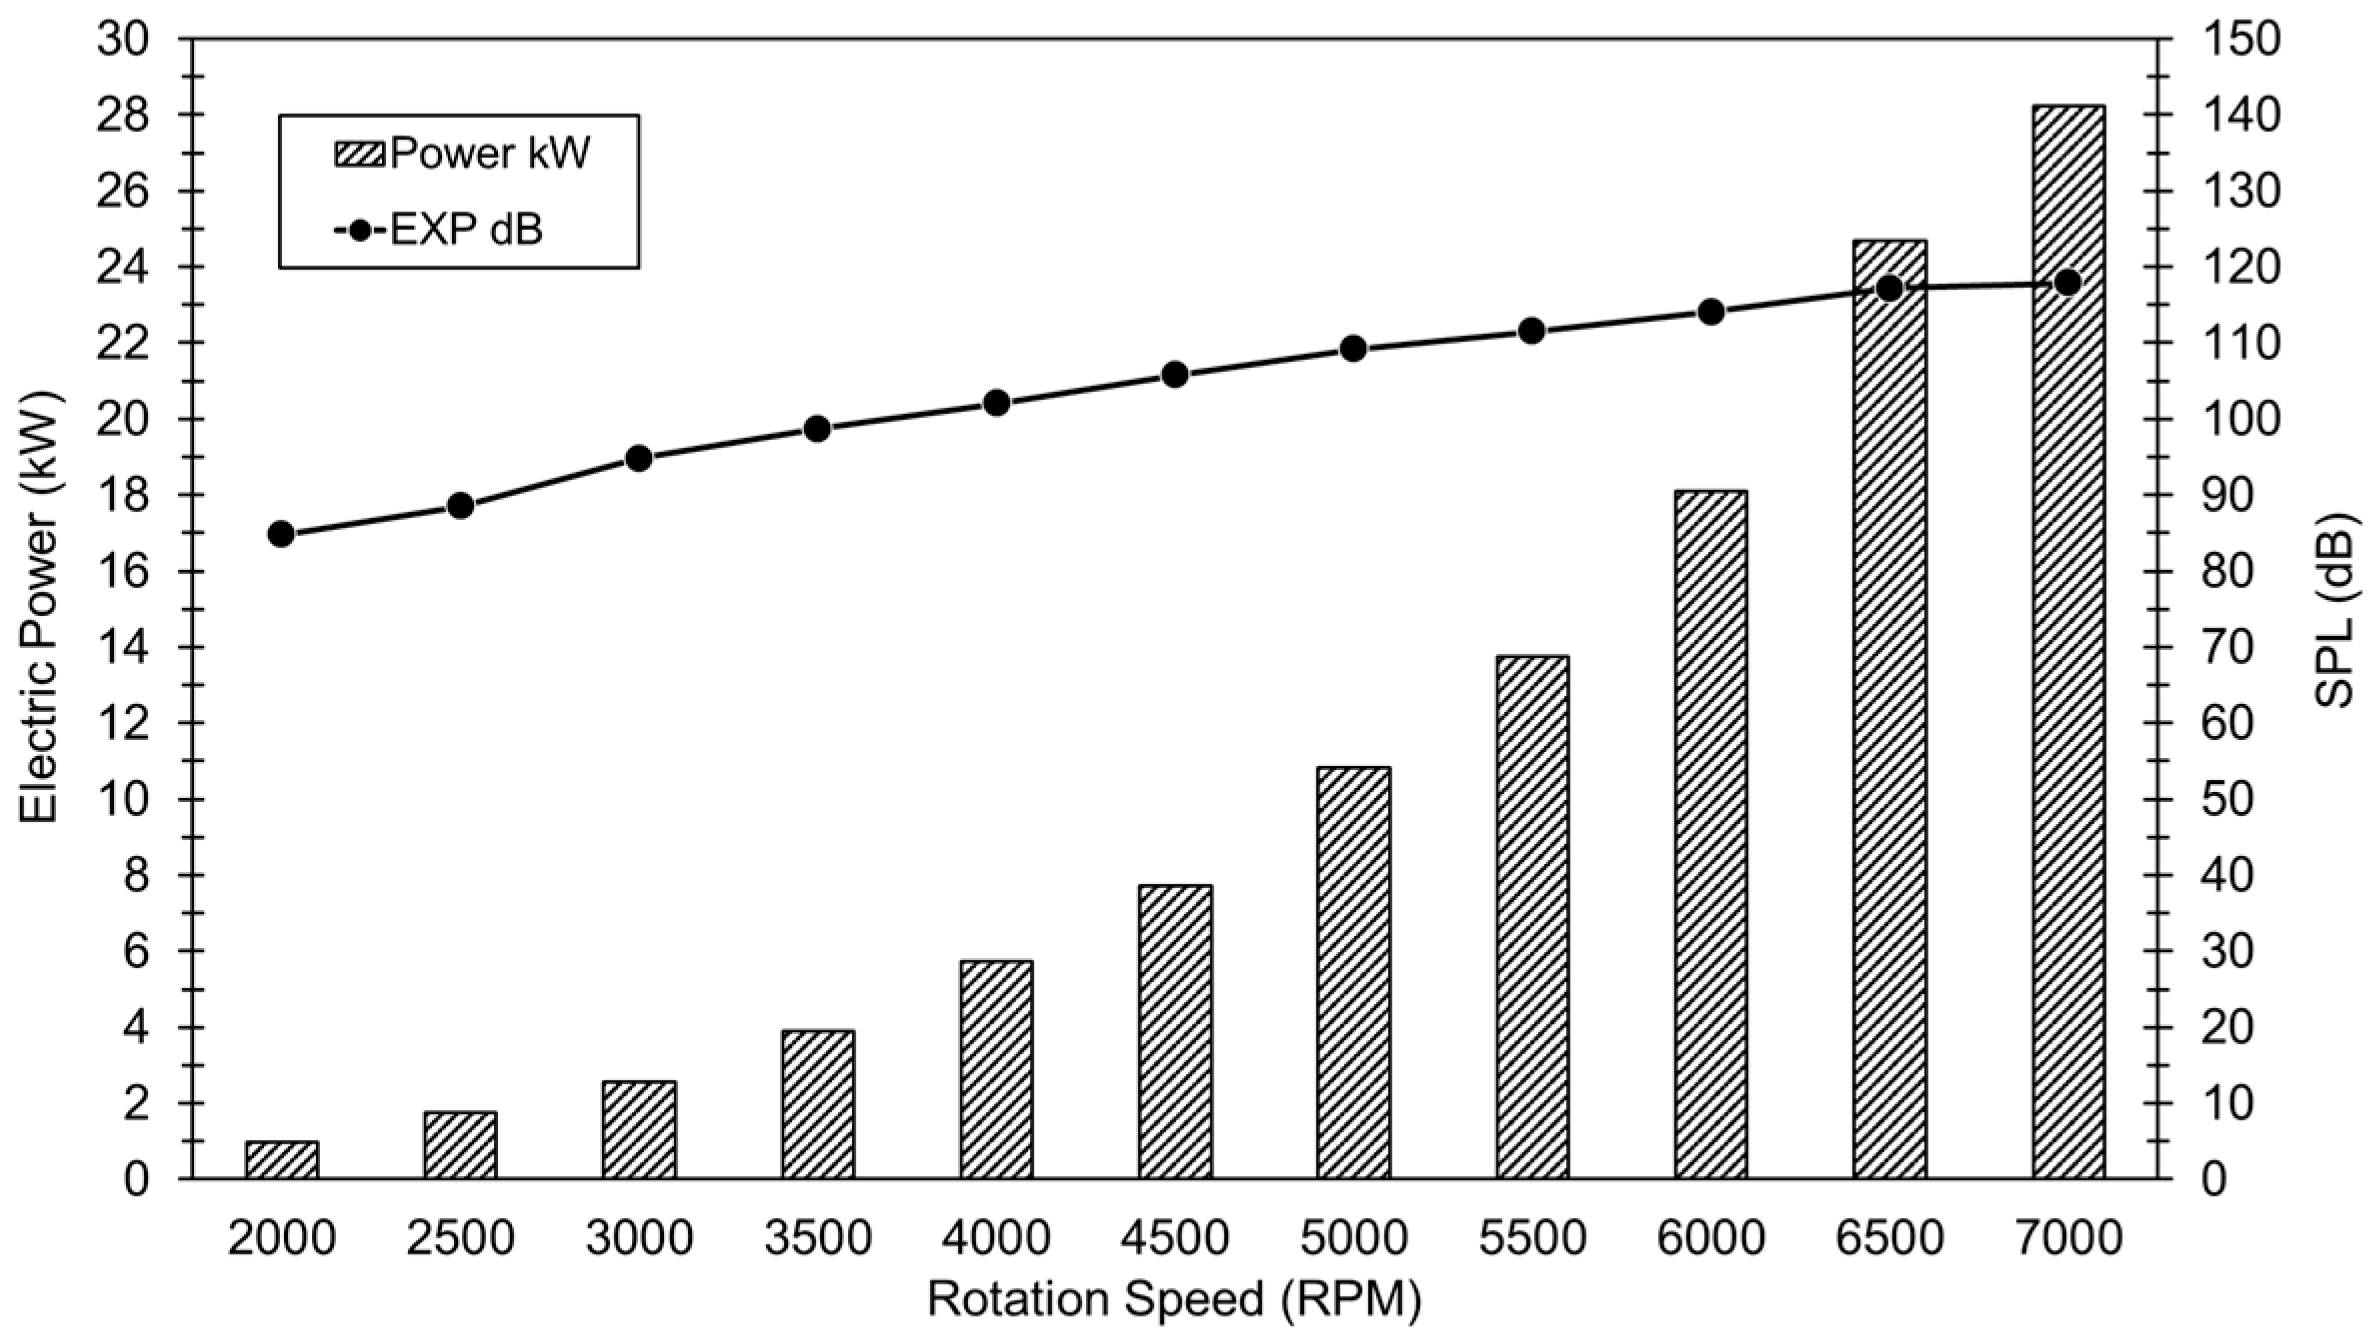
4.3. Aeroacoustic Testing

To reduce the impact of vibration when placed too close to the eDPF operating at high speeds, a distance of 1.0 m is selected along the axis of rotation and from the fan tip to the location where the tripod is placed to mount the microphone.
Figure 9 and Figure 10 show that as the rotational speed increases from 2000 rpm to 7500 rpm, the SPL also rises from 84.8 dB to 117.9 dB. This indicates that even at low rotational speeds, the noise generated near the eDPF reaches uncomfortable levels. At high rotational speeds, the noise approaches 120 dB—comparable to the sound level at a concert—which can be harmful to human hearing with prolonged exposure. Therefore, hearing protection headphones are required for participants during this eDPF test.

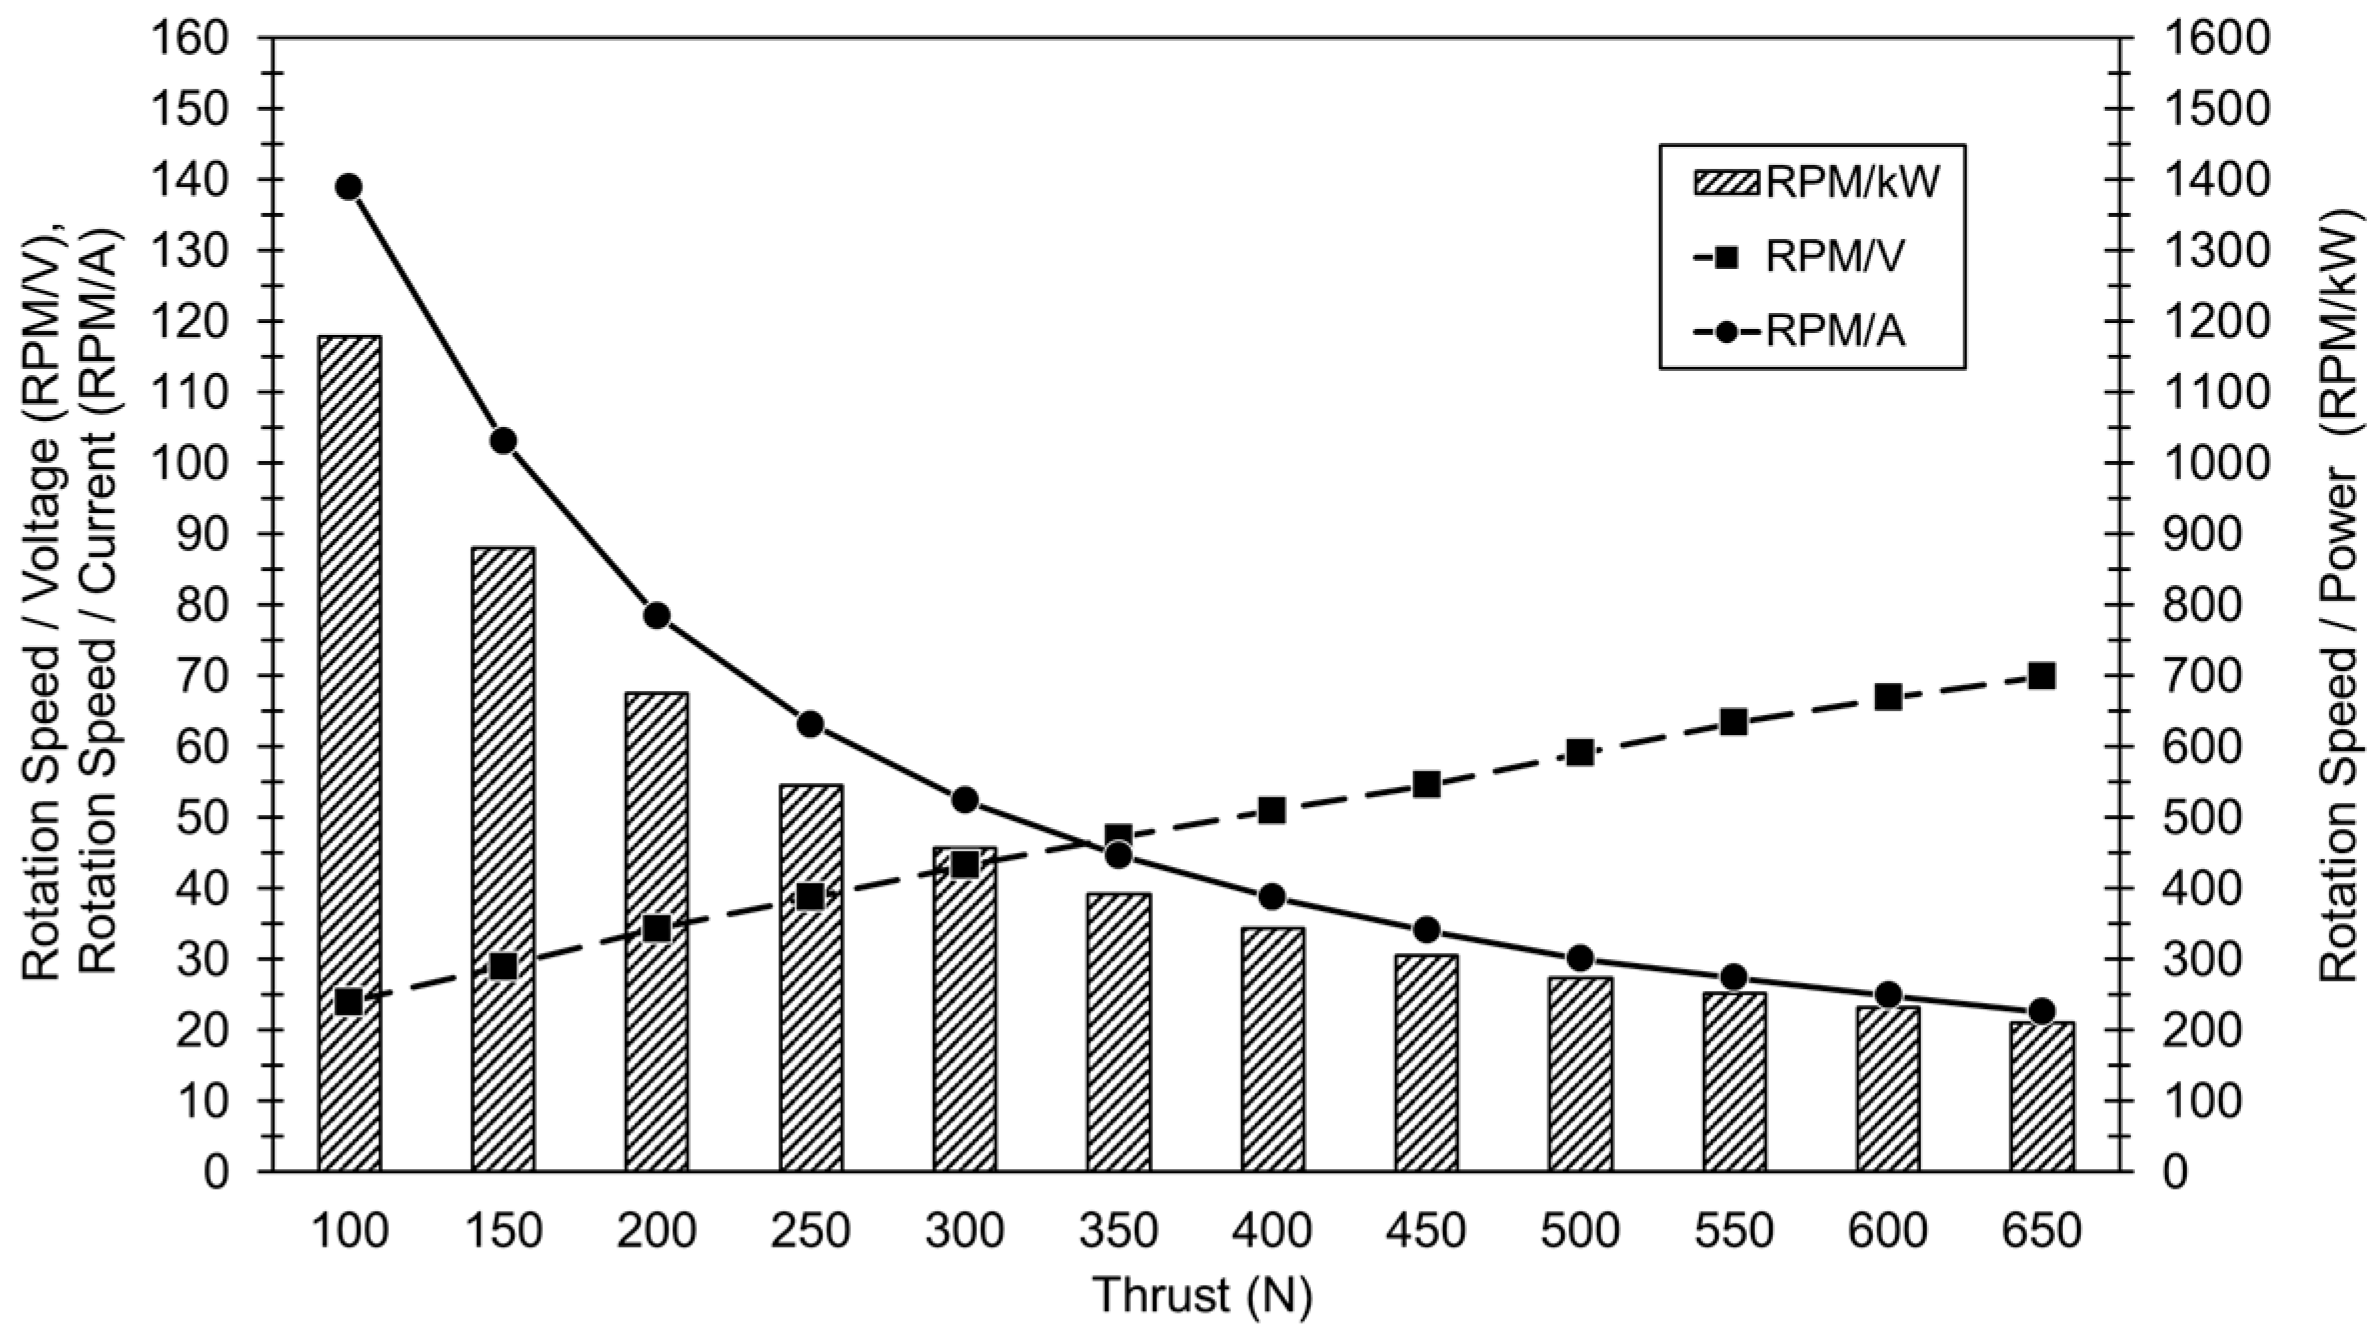
4.4. Relationship Between Electrical and Aero-Propulsion Characteristics

To clarify the relationship between independent quantities related to electrical and aerodynamic properties, the ratios between them are examined.
Figure 11 shows that as thrust increases from 100 N to 650 N, the ratio of rotational speed to voltage increases slightly from 24.0 rpm/V to 69.9 rpm/V, while the ratio of rotational speed to current decreases sharply from 129.0 rpm/A to 22.6 rpm/A. Accordingly, the ratio of rotational speed to electric power also drops significantly from 1178.7 rpm/kW to 211.4 rpm/kW. This confirms that the increase in thrust or rotational speed depends more on current and electric power than on input voltage.
Figure 12 and Figure 13 show the ratios of thrust to current, voltage, and power for both eight- and nine-battery pack configurations. As the rotational speed increases, these ratios follow the same patterns as analyzed in Figure 11. However, the thrust-to-current ratio in the case of nine battery packs is higher than that of eight battery packs, while the thrust-to-voltage ratio is lower. For the thrust-to-power ratio, there is almost no difference between the two battery configurations at rotational speeds from 2500 rpm to 6500 rpm. Remarkably, at 2000 rpm, the nine-battery pack configuration yields a much higher thrust-to-current and thrust-to-power ratio than the eight-battery pack configuration. This may suggest that the nine-battery-pack setup provides better initial power.

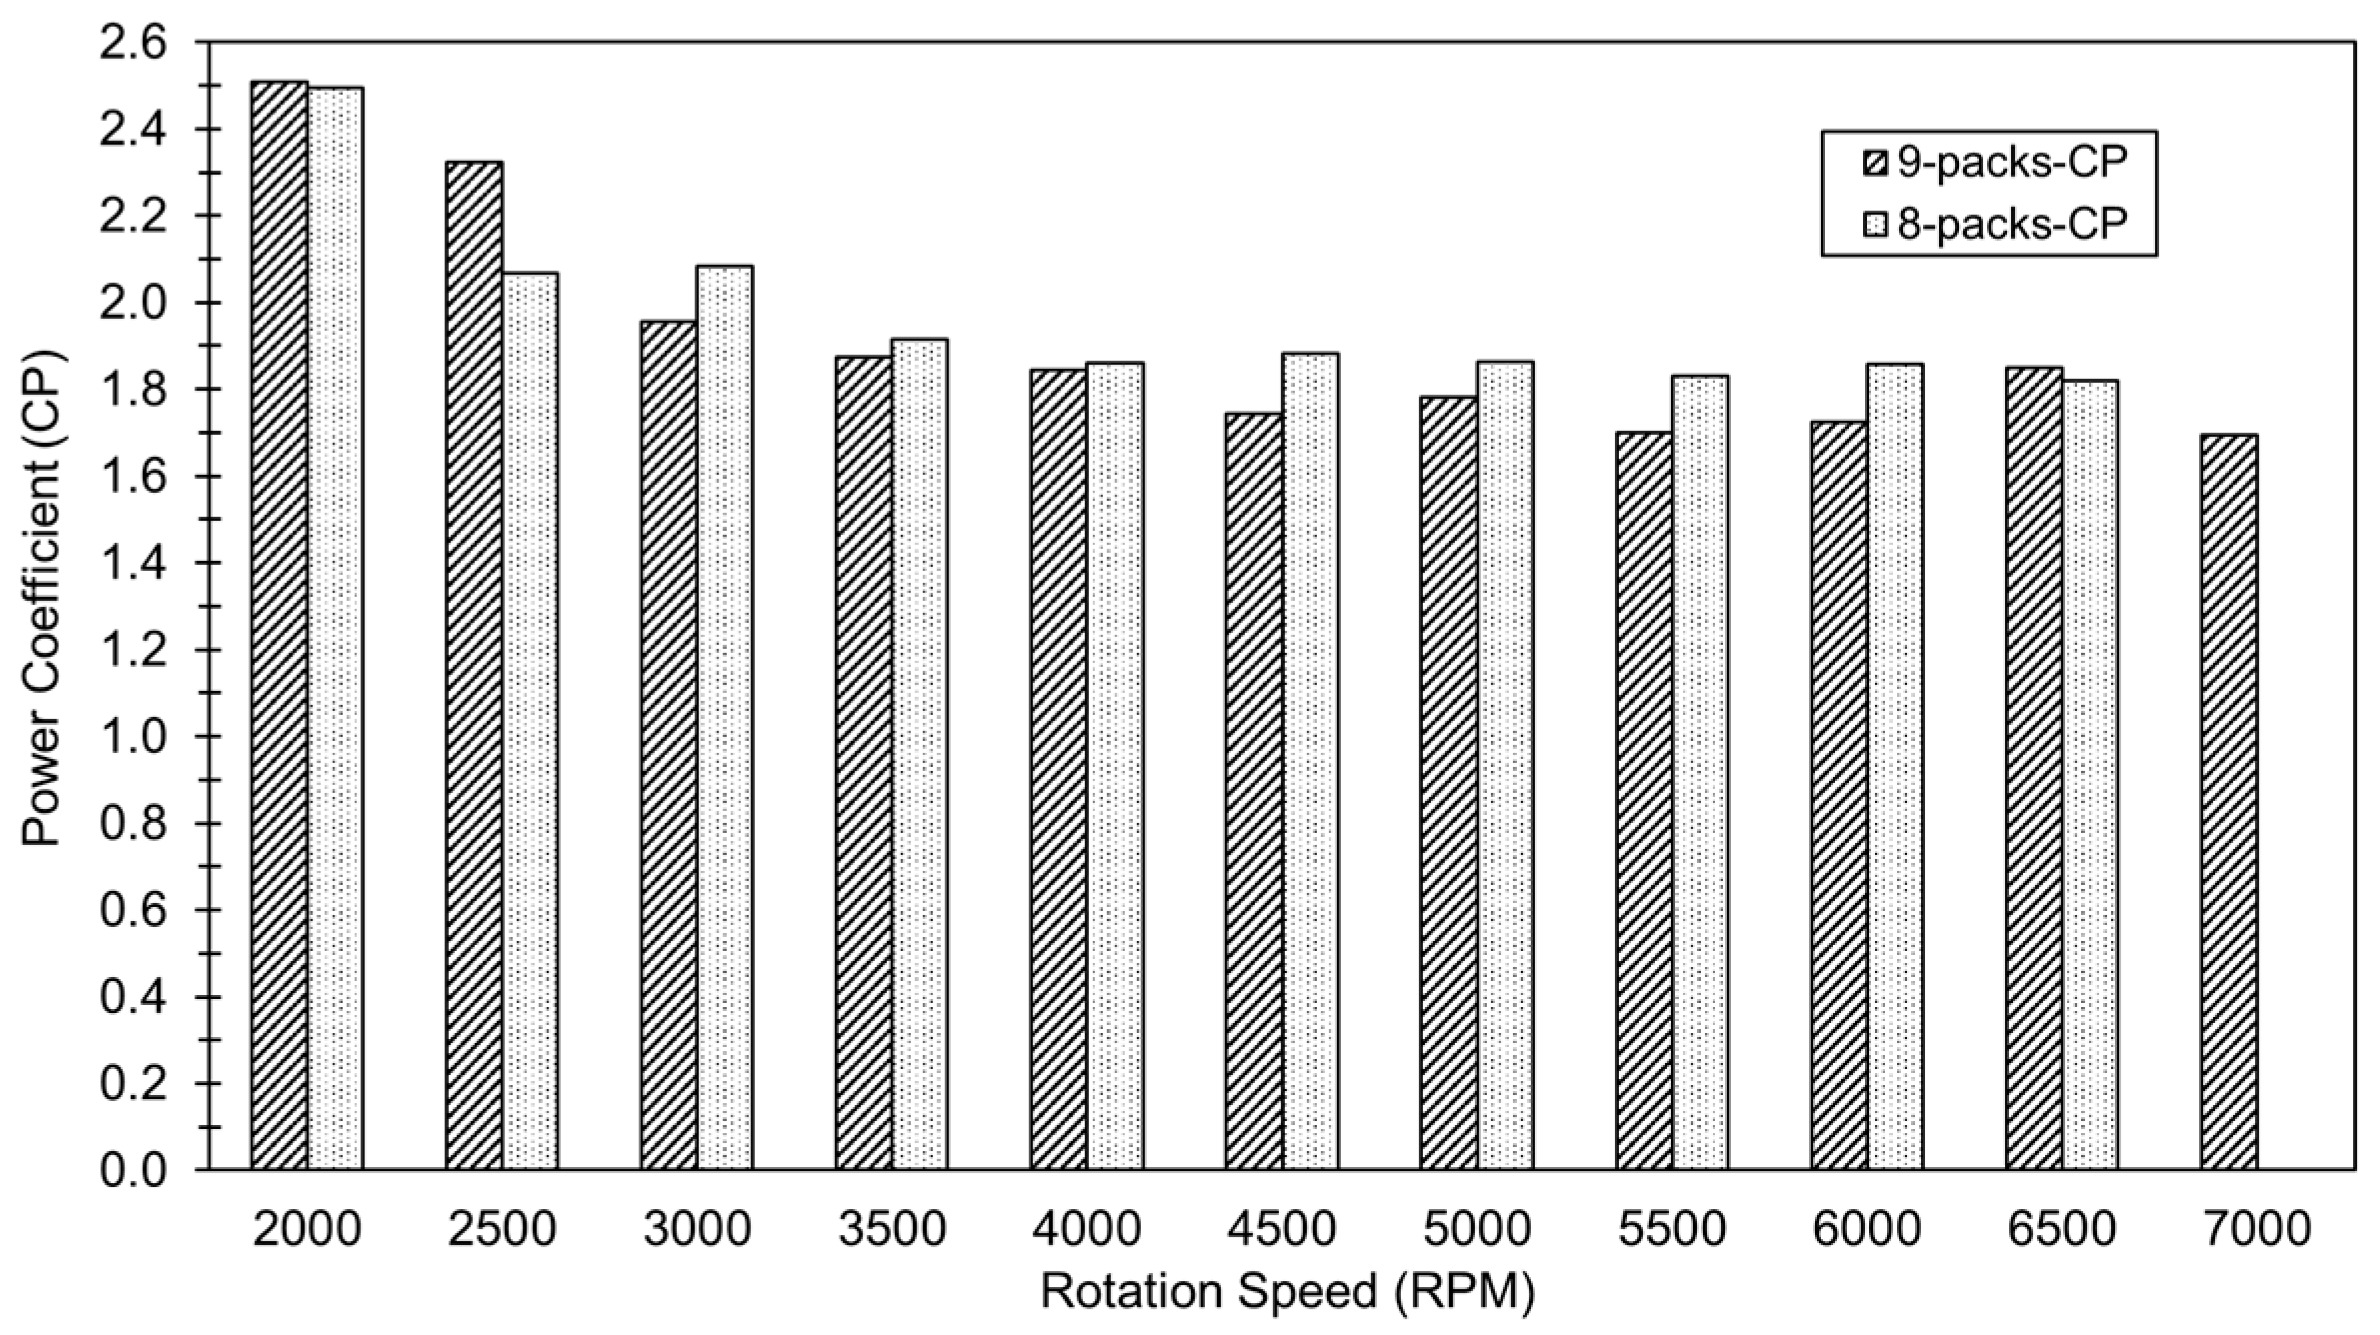
4.5. Non-Dimensional eDPF Data

For further evaluation, a proposal for dimensionless analysis of the investigated quantities—similar to many previous studies—was adopted [1,2,3,4,6,7,10,12,14,15,17,22,23,24]. Accordingly, in this study, three dimensionless quantities are proposed: the power coefficient (CP), thrust coefficient (CT), and figure of merit (FM).
These quantities are calculated as follows:
C P = P o w e r ρ Ω 3 D 5
C T = T h r u s t ρ Ω 2 D 4
F M = C T 3 / 2 2 C P
where ρ is the air density under the test conditions (approximately 25 °C), i.e., ρ = 1.225 kg/m3; Ω is the fan rotation speed (rpm); and D is the fan blade diameter (m), i.e., D = 0.386 m (excluding the blade tip clearance).
Thus, non-dimensional quantities essentially help eliminate the effects of scale and environmental conditions, allowing the studied propeller configuration to be assessed in a more generalized manner.
Figure 14, Figure 15 and Figure 16 show that as the rotational speed increases from 2000 rpm to 7000 rpm, CP, CT, and FM generally decrease. At moderate rotational speeds, between 3000 rpm and 6000 rpm, the eight-pack configuration appears slightly more efficient due to higher CP and CT values. However, at low rotational speeds of 2000 rpm and 2500 rpm, the nine-pack configuration performs more efficiently.
FM represents the efficiency of thrust generation relative to the supplied energy. A FM value closer to 1 implies lower energy loss and higher overall efficiency of the eDPF. Figure 16 indicates that FM ranges from about 0.66 (eight-pack battery case at 2000 rpm) to about 0.83 (nine-pack battery case at 2000 rpm). At medium rotational speeds, the FM value fluctuates around 0.7–0.75. These results suggest that the eight-pack battery configuration operates inefficiently at low rotational speeds, while the eDPF exhibits good energy conversion efficiency at medium speeds, with approximately 70–75% of the supplied energy being converted into thrust.
When examining the eight- and nine-battery-pack configurations, as shown in Figure 17 and Figure 18, respectively, it appears that at medium rpms, the power level remains relatively stable. Meanwhile, at low rpms of 2000 rpm and 2500 rpm, the FM values indicate better efficiency.

5. Conclusions

In summary, this experimental study investigated the eDPF system through tasks such as assessing thrust range, battery configurations, and the electrical and aerodynamic relationship, along with preliminary aeroacoustic measurements. The investigation uncovered four key findings that hold considerable significance for engineering applications:
First, concerning electrical behavior, input power, current, and SPL exhibit marked increases with rising thrust and rotational speed, while input voltage showed a slight reduction. Importantly, current levels must be meticulously regulated to stay within the safe operational boundaries of the ESC and BLDC components.
Second, propulsion efficiency is highly influenced by battery configuration: the eight-pack setup attains a peak speed of 6500 rpm and offers superior thrust per volt, whereas the nine-pack configuration reaches speeds up to 7000 rpm, providing enhanced thrust per ampere as well as improved starting torque.
Third, noise hazards escalate at elevated speeds, with SPL values approaching critical thresholds near 120 dB when operating above 6000 rpm, emphasizing the necessity for effective acoustic control measures.
Finally, dimensionless performance metrics such as CP, CT, and FM generally decline as speed increases; nevertheless, the FM index remains comparatively high, ranging from 0.7 to 0.75 at moderate speeds, indicating robust energy conversion efficiency.
Future research will focus on improving system performance by considering wind effects on thrust, expanding aerodynamic experiments, enhancing acoustic testing, investigating structural vibrations, and comparing experimental results with numerical simulations.

Author Contributions

H.-Q.C. conceived the research idea, conducted the experiments, and drafted the manuscript. Q.-N.D. and T.-S.V. assisted with the experimental work and analyzed the experimental data. V.-Y.P. and V.-T.B. were responsible for constructing the mechanical components of the thrust testing stand. N.-M.H. processed the acoustic data. T.-K.N. reviewed and edited the manuscript. D.N. proposed and deployed the battery system options. G.-D.P. provided consultation and oversaw the control systems. C.-T.D. secured financial support and assumed overall responsibility for the project. All authors have read and agreed to the published version of the manuscript.

Funding

This work was supported by the Ministry of Education and Training, Vietnam, under Project No. B2023-BKA-11.

Data Availability Statement

The measurement data cannot be made public as the funding project has not been approved.

Acknowledgments

The authors would like to express their sincere thanks to the Ministry of Education and Training, Vietnam, for providing the budget for this project.

Conflicts of Interest

The authors declare no conflicts of interest.

Nomenclature

Dfan blade diameter(m)
Nnumber of samples
ppressure signal(Pa)
Smicrophone sensitivity(V/Pa)
Vvoltage signal(V)
Greek
ρdensity of air(kg/m3)
fan rotation speed(rpm)
Subcripts
0reference value
P Power
T Thrust
Acronyms
APSsAerospace Propulsion Systems
BLDCBrushless Direct Current
CPPower Coefficient
CTThrust Coefficient
DAQData Acquisition
EDFElectric Ducted Fan
eDPFelectric Ducted Propulsion Fan
ESCElectronic Speed Controller
EXPExperimental
FMFigure of Merit
PIVParticle Image Velocimetry
PWMPulse Width Modulation
RMSRoot Mean Square
rpmRevolutions Per Minute
S/VTOLShort/Vertical Takeoff and Landing
SPLSound Pressure Level
UAVUnmanned Aerial Vehicle

References

  1. Kondor, S.A.; Lee, W.; Englar, R.J.; Moore, M.D. Experimental investigation of circulation control on a shrouded fan. In Proceedings of the 21st AIAA Applied Aerodynamics Conference, Orlando, FL, USA, 23–26 June 2003. [Google Scholar] [CrossRef]
  2. Kondor, S.A.; Moore, M. Experimental investigation of a morphing nacelle ducted fan. In Proceedings of the NASA/ONR Circulation Control Workshop, Hampton, VA, USA, 16–17 March 2004; pp. 435–468. Available online: https://ntrs.nasa.gov/citations/20050192632 (accessed on 7 September 2013).
  3. Kondor, S.A. Further experimental investigation of circulation control morphing shrouded fan. In Proceedings of the 43rd AIAA Aerospace Sciences Meeting and Exhibit—Meeting Papers, Reno, NV, USA, 10–13 January 2005; pp. 7765–7772. [Google Scholar] [CrossRef]
  4. Martin, P.; Tung, C. Performance and flow field measurements on a 10-inch ducted rotor VTOL UAV. In Proceedings of the 60th Annual Forum of the American Helicopter Society, Baltimore, MD, USA, 7–10 June 2004; Available online: https://ntrs.nasa.gov/citations/20050009943 (accessed on 7 September 2013).
  5. Martin, P.B.; Boxwell, D.A. Design, analysis, and experiments on a 10-inch ducted rotor VTOL UAV. In Proceedings of the AHS International Specialists’ Meeting—Unmanned Rotorcraft, Chandler, AZ, USA, 18–20 January 2005; pp. 399–420. Available online: https://www.researchgate.net/publication/259039691 (accessed on 1 January 2005).
  6. Graf, W.; Fleming, J.; Ng, W. Improving ducted fan UAV aerodynamics in forward flight. In Proceedings of the 46th AIAA Aerospace Sciences Meeting and Exhibit, Reno, NV, USA, 7–10 January 2008. [Google Scholar] [CrossRef]
  7. Ohanian, O.J.; Gelhausen, P.A.; Inman, D.J. A compact method for modeling the aerodynamics of ducted fan vehicles. In Proceedings of the 48th AIAA Aerospace Sciences Meeting, Orlando, FL, USA, 4–7 January 2010. [Google Scholar] [CrossRef]
  8. Akturk, A.; Shavalikul, A.; Camci, C. PIV measurements and computational study of a 5-inch ducted fan for V/STOL UAV applications. In Proceedings of the 47th AIAA Aerospace Sciences Meeting, Orlando, FL, USA, 5–8 January 2009. [Google Scholar] [CrossRef]
  9. Akturk, A.; Camci, C. Experimental and computational assessment of a ducted-fan rotor flow model. J. Aircr. 2012, 49, 885–897. [Google Scholar] [CrossRef]
  10. Akturk, A.; Camci, C. Tip clearance investigation of a ducted fan used in VTOL unmanned aerial vehicles—Part I: Baseline experiments and computational validation. J. Turbomach. 2013, 136, 021004. [Google Scholar] [CrossRef]
  11. Cho, B.L.; Lee, S.; Cho, J. Numerical and experimental analyses of the ducted fan for the small VTOL UAV propulsion. Trans. Jpn. Soc. Aeronaut. Space Sci. 2013, 56, 328–336. [Google Scholar] [CrossRef]
  12. Brezina, A.J.; Thomas, S.K. Measurement of static and dynamic performance characteristics of electric propulsion systems. In Proceedings of the 51st AIAA Aerospace Sciences Meeting, Grapevine, TX, USA, 7–10 January 2013. [Google Scholar] [CrossRef]
  13. Yilmaz, S.; Erdem, D.; Kavsaoglu, M.S. Performance of a ducted propeller designed for UAV applications at zero angle of attack flight: An experimental study. Aerosp. Sci. Technol. 2015, 45, 376–386. [Google Scholar] [CrossRef]
  14. McCrink, M.H.; Gregory, J.W. Blade element momentum modeling of low-Reynolds electric propulsion systems. J. Aircr. 2017, 54, 163–176. [Google Scholar] [CrossRef]
  15. Deng, Y. Experimental investigation on ground effect of ducted fan system for VTOL UAV. Lect. Notes Electr. Eng. 2019, 459, 1602–1609. [Google Scholar] [CrossRef]
  16. Ai, T.; Xu, B.; Xiang, C.; Fan, W.; Zhang, Y. Aerodynamic analysis and control for a novel coaxial ducted fan aerial robot in ground effect. Int. J. Adv. Robot. Syst. 2020, 17, 1729881420953026. [Google Scholar] [CrossRef]
  17. Han, H.; Xiang, C.; Xu, B.; Yu, Y. Experimental and computational investigation on comparison of micro-scale open rotor and shrouded rotor hovering in ground effect. Proc. Inst. Mech. Eng. Part G J. Aerosp. Eng. 2021, 235, 553–565. [Google Scholar] [CrossRef]
  18. Ebus, T.; Dietz, M.; Hupfer, A. Experimental and numerical studies on small contra-rotating electrical ducted fan engines. CEAS Aeronaut. J. 2021, 12, 559–571. [Google Scholar] [CrossRef]
  19. Guo, J.; Zhou, Z. An efficient blade design method of a ducted fan coupled with the CFD modification. Aerospace 2022, 9, 241. [Google Scholar] [CrossRef]
  20. Guo, J.; Zhou, Z. Multi-objective design of a distributed ducted fan system. Aerospace 2022, 9, 165. [Google Scholar] [CrossRef]
  21. Urban, D.; Kusmirek, S.; Socha, V.; Hanakova, L.; Hylmar, K.; Kraus, J. Effect of electric ducted fans structural arrangement on their performance characteristics. Appl. Sci. 2023, 13, 2787. [Google Scholar] [CrossRef]
  22. Luo, Y.; Ai, T.; He, Y.; Xu, B.; Qian, Y.; Zhang, Y. Numerical analysis of wind effects on aerodynamic characteristics of a ducted fan. Chin. J. Aeronaut. 2024, 37, 263–280. [Google Scholar] [CrossRef]
  23. Grava, A.; Jacopo, S.; Gaetano, I.; Luis, B.; Gioacchino, C. Experimental investigation of a small drone propeller aerodynamics in forward flight. J. Aircr. 2024, 63, 1855–1866. [Google Scholar] [CrossRef]
  24. Hirono, F.C.; Torija, A.J.; Grimshaw, S.D.; Cousins, D.; Farman, J.; Taylor, J.V. Aerodynamic and aeroacoustic design of electric ducted fans. Aerosp. Sci. Technol. 2024, 153, 109411. [Google Scholar] [CrossRef]
  25. Ahmed Snikdha, S.S.; Chen, S.-H. A Computational Investigation of the Hover Mechanism of an Innovated Disc-Shaped VTOL UAV. Drones 2023, 7, 105. [Google Scholar] [CrossRef]
  26. Lengyel-Kampmann, T.; Karboujian, J.; Charroin, G.; Winkelmann, P. Experimental Investigation of an Efficient and Lightweight Designed Counter- Rotating Shrouded Fan Stage. Int. J. Turbomach. Propuls. Power 2024, 9, 26. [Google Scholar] [CrossRef]
  27. ISO 3744:2010; Acoustics—Determination of Sound Power Levels and Sound Energy Levels of Noise Sources Using Sound Pressure—Engineering Methods for an Essentially Free Field over a Reflecting Plane. International Organization for Standardization: Geneva, Switzerland, 2010; Edition 3. Available online: https://www.iso.org/standard/52055.html (accessed on 1 October 2010).
Figure 1. Photograph of the electric Ducted Propulsion Fan.
Aerospace 12 00509 g001
Figure 2. Photograph of the thrust testing stand system.
Aerospace 12 00509 g002
Figure 3. Schematic diagram for static aero-propulsion testing.
Aerospace 12 00509 g003
Figure 4. Electric testing according to thrust range.
Aerospace 12 00509 g004
Figure 5. Aero-propulsion testing according to thrust range.
Aerospace 12 00509 g005
Figure 6. Electric testing according to the number of battery packs.
Aerospace 12 00509 g006
Figure 7. Electric power according to the number of battery packs.
Aerospace 12 00509 g007
Figure 8. Aero-propulsion according to the number of battery packs.
Aerospace 12 00509 g008
Figure 9. Electric-acoustic testing according to rotation speed.
Aerospace 12 00509 g009
Figure 10. Aeroacoustic testing according to rotation speed.
Aerospace 12 00509 g010
Figure 11. Electric–propulsion ratio according to thrust range.
Aerospace 12 00509 g011
Figure 12. Electric–propulsion ratios according to the battery packs.
Aerospace 12 00509 g012
Figure 13. Electric power vs. propulsion according to the battery packs.
Aerospace 12 00509 g013
Figure 14. Power coefficient according to the battery packs.
Aerospace 12 00509 g014
Figure 15. Thrust coefficient according to the battery packs.
Aerospace 12 00509 g015
Figure 16. Figure of merit according to the battery packs.
Aerospace 12 00509 g016
Figure 17. Radar diagram of CT-CP-FM in the case of 8 battery packs.
Aerospace 12 00509 g017
Figure 18. Radar diagram of CT-CP-FM in the case of 9 battery packs.
Aerospace 12 00509 g018
Table 1. Geometric specification of the eDPF model.
Fan Shroud DiameterFan Tip CleranceNumber of Fan BladesNumber of Strut BladeseDPF Axial LengtheDPF Nacelle DiameterCenter Body Diameter
390 mm2 mm106554 mm498 mm110 mm
Table 2. Measuring equipment uncertainties.
Measuring EquipmentSpecificationMinMaxUncertaintyUnit
Thrust Load Cell (Compression type)Thrust027000.88%N
Cylindrical photoelectric sensor (Red LED light)Angular velocity072000.1%rpm
Microphone (PCB 377C01 + 426E01 + DAQ 20 kHz)Sound Pressure02000.25%dB
Digital clamp meter (DC Voltage)Voltage06000.01%V
Digital clamp meter (DC Current)Current06000.27%A
Table 3. Basic technical characteristics of battery system.
Option
(Serial Connection)
Max
DC Voltage
Operating
DC Voltage
Max
DC Current
Operating
DC Current
Efficiency
One battery pack14.4 V12.8 V400 A100 A98%
8 battery packs115 ± 3 V105 ± 3 V400 ± 40 A100 ± 10 A98%
9 battery packs130 ± 3 V115 ± 3 V400 ± 40 A100 ± 10 A98%
Disclaimer/Publisher’s Note: The statements, opinions and data contained in all publications are solely those of the individual author(s) and contributor(s) and not of MDPI and/or the editor(s). MDPI and/or the editor(s) disclaim responsibility for any injury to people or property resulting from any ideas, methods, instructions or products referred to in the content.

