1. Introduction
Applying artificial intelligence for improving the support for air traffic controller officers (ATCOs) is widely discussed. The growing air traffic volumes and resulting capacity and staff shortages [
1,
2,
3] have intensified the need for higher levels of automation in air traffic control (ATC), particularly within the frameworks of SESAR (Single European Sky ATM Research). Autonomous systems based on AI technologies are being pursued to assist human ATCOs in every aspect of their job and create human-autonomy teaming (HAT) [
4,
5,
6].
Human–AI collaboration in air traffic control (ATC) is transforming the way airspace is managed. The aim is for AI systems to relieve and support ATCOs, whereby ATCOs’ expertise remains essential for handling unpredictable situations, making complex judgments, and ensuring accountability. A framework for adaptive human–AI teaming in ATC highlights the importance of designing AI systems that effectively support ATCOs by understanding their cognitive functions [
7]. Kirwan [
8] reviews the evolution of Human Factors to identify the critical areas where Human Factors can aid future human–AI teaming performance and safety in aviation. Furthermore, the human–AI hybrid paradigm emphasizes collaborative air traffic management, integrating AI’s computational capabilities with human intuition and adaptability [
9]. These studies suggest that AI can significantly improve ATC operations, but successful integration requires careful design, ensuring that AI complements human decision-making rather than replacing it.
Early research in the human–computer interaction domain sought to distribute specific functions to human or machine control based on the Fitts list defining tasks that humans or machines are better at [
10]. However, the Fitts list is not suitable for modern AI-based systems as it does not consider teamwork and surrounding factors [
11]. More recent studies have explored AI as a collaborative team partner dynamically adapting to the needs of the human (e.g., [
7,
8,
12]). Therefore, humans and machines no longer have a distinct set of tasks, but both work on the same tasks together. For an overview of design principles crucial for such human–AI hybrids, see [
13]. Similarly, EASA distinguishes between cooperation (Level 2A) and collaboration (Level 2B) as two types of human–AI teaming [
13]. In cooperation, the AI helps the human by performing a set of predefined tasks, whereas in collaboration, the AI and human jointly work towards the same goal with the ability to flexibly allocate tasks, which is the case for human–AI hybrids. A key difference between cooperation and collaboration is the capability of collaborative AI systems for communication and shared situation awareness, which are both not crucial for cooperation.
The digital ATCO (DA) developed at the German Aerospace Center (DLR) is envisioned to collaborate with human ATCOs on traffic controlling tasks including autonomously making decisions and implementing them without additional human confirmation [
4,
5]. In the project LOKI (Kollaboration von Luftfahrt Operateuren und KI Systemen—Collaboration of Aviation Operator and AI systems) at the DLR, an interdisciplinary team of DLR institutes and external partners in aviation develop guidelines for human-centered collaboration between users and AI systems in aviation and beyond. The main use case of LOKI is the development of an AI-based digital partner which collaborates with human ATCOs. According to the EASA AI roadmap, the proposed digital ATCO concept in LOKI is categorized as human–AI collaboration (Level 2B) [
13]. The collaborative relationship allows for predefined shared goals between a human ATCO (HA) and a digital ATCO. Due to the safety-critical nature of ATC and often non-deterministic behavior of AI methods, EASA has stipulated requirements for human supervision over automation and AI-based systems [
13]. An important consideration for teams of human and digital ATCOs is to share the work appropriately between them.
As various studies found that humans perform suboptimally when assigned to passively supervise autonomous systems [
14,
15,
16,
17], the introduction of higher automation in ATC poses safety risks. Several critical issues can arise including degraded situation awareness, complacency, skill degradation, and boredom. An approach is needed to share the tasks between human and digital ATCOs adequately. In the LOKI use case, complete flights are assigned to each controller (digital as well as human) instead of single tasks. This leads to the necessity that the digital ATCO should have suitable situation assessment of the current traffic which is compatible to the situation awareness (SA) of the human ATCO. Therefore, autonomous systems collaborating with HAs in a human–autonomy team must be designed to maintain or improve the SA of the human team partner rather degrading it [
18].
For human ATCOs, the SA very often depends on the correct assessment of complex traffic situations and the ability to foresee future events, such as conflicts. As air space is characterized by various complexity factors, such as fluctuations in flight volume, diversified flight paths, variations in aircraft performance, and dynamic weather conditions, the air space complexity is a core factor for ATCOs’ workload as well as the probability of safety occurrence [
19]. As in the AISA project [
20], the complexity of ATC traffic can be used to calculate shared SA. A successful shared assessment of the traffic situation (e.g., complexity) has the potential to outperform human SA by integrating and analyzing the available data, as the Australian Transport Safety Bureau reported that approximately 85% of accidents in air traffic are related to a lack of SA [
18].
Equally important is a need for the DAs to develop their own SA, which includes understanding HAs’ intent and the overall traffic complexity. Therefore, the DA must have its own situation awareness, which considers both the complexity of the traffic situation and the behavior of the human team partner. Thereby, DA’s SA supports human–AI teaming between the digital and the human ATCO. To achieve this, the architecture of human SA as well as measures of traffic complexity were applied to develop a digital partner with an ability to have comparable situation assessment as human ATCOs.
For introducing a digital team partner for human ATCOs, this paper will discuss various forms of human–autonomy teaming between human and digital ATCOs. Likewise, factors related to human SA which are applicable for creating the SA of a digital ATCO and new factors needed to measure digital SA are identified. Afterwards, methods are described to make the mental image of a human ATCO accessible to a digital ATCO, and several newly developed factors for digitally measuring the SA and the degree of traffic complexity of a DA are presented. The most important research questions related to this are as follows:
Which elements of SA does the DA need to know for digital SA?
Is complexity an appropriate measure for the SA of a DA?
How can complexity be measured in a data-driven approach?
Which factors lead a DA to judge a situation as “complex”?
This paper is organized in such a way that the theoretical background of SA and airspace complexity for human ATCOs is described in
Section 2, together with a wrap-up of the challenges of higher automation in air traffic control. Based on the described well-known principles, similar characteristics are derived in
Section 3 for the SA of DAs teaming up with human ATCOs. The factors related to digital SA are described, and a model for digital SA is developed similar to Endsley’s model for situation awareness in dynamic decision-making [
21]. Additionally, complexity assessment as the most important factor for the SA of a digital ATCO is described, and conclusions for handling complexity are drawn. In
Section 4, factors related to air traffic complexity are described, and several methods for measuring the complexity related to air traffic characteristics are developed. In
Section 5.1, a model for the situation awareness of digital ATCOs is described, which is then applied to a case study for the problem of solving conflicts between aircraft in
Section 5.2 and demonstrated with an example in
Section 5.3. Finally, the conclusion and future work is presented in
Section 6.
2. Theoretical Background
This section explains briefly the main assumptions about situation awareness and complexity for human ATCOs. It will be followed by a brief discussion about shared SA and human–autonomy teaming. Key contributors to the workload of an ATCO, the influence of airspace, and air traffic complexity are discussed in the last subsection.
2.1. Situation Awareness for Human ATCOs
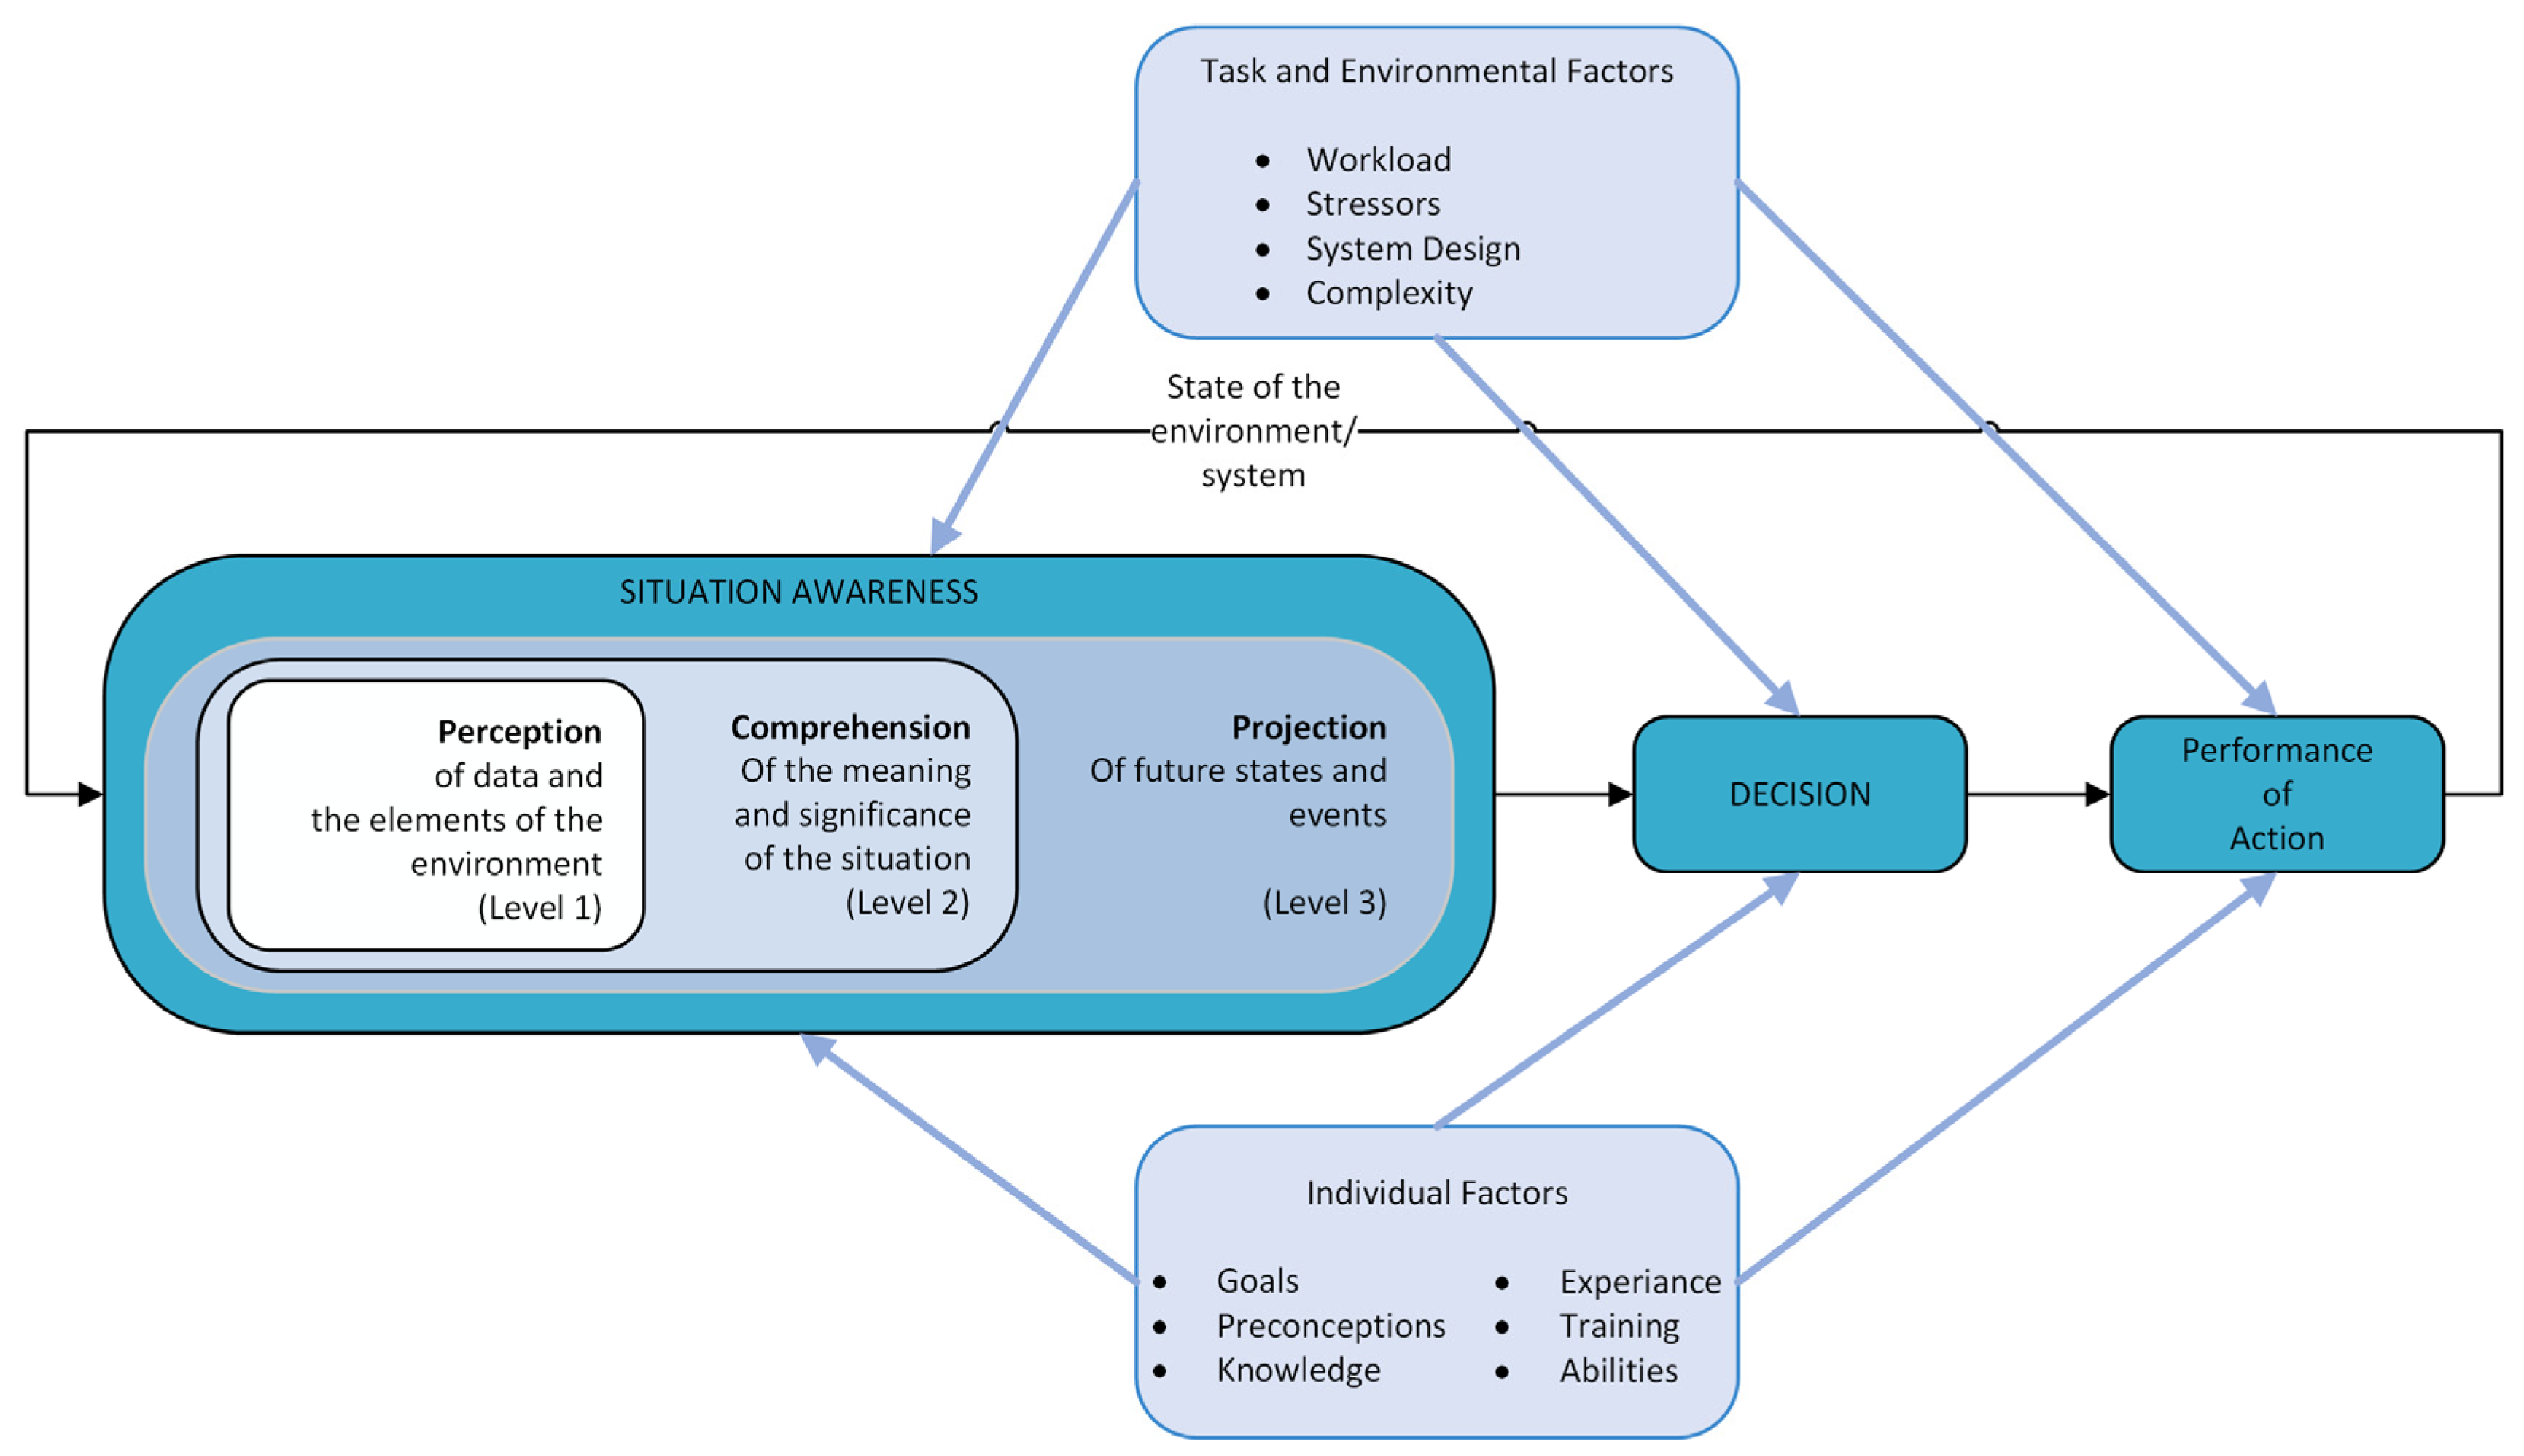
An essential condition for safe and efficient air traffic control is the ATCO’s ability to accurately perceive, interpret, and anticipate changes in the controlled airspace. The resulting mental model of the situation is called the situation awareness of the ATCO and it forms the basis for their future decisions [
15]. Endsley defines SA as follows [
22]:
Situation awareness is the perception of the elements in the environment within a volume of time and space, the comprehension of their meaning, and the projection of their status in the near future.
Endsley’s model for SA in dynamic decision-making, shown in
Figure 1, is the backbone of the research on situation assessment and awareness [
21]. As parts in the process of establishing SA, three levels are proposed in this model:
Perception: collect and integrate all available data to make it easily available for the next step.
Comprehension: comprehend the meaning and significance of the data collected in step one and form a mental model of the current situation (depends on individual factors like knowledge and experience).
Projection: project the current situation into the future with respect to one’s goals.
More detailed descriptions of the three levels in the context of air traffic control can be found in [
20,
23,
24]. Human ATCOs tend to create a mental model of the current traffic situation which is based on the described three levels (
Figure 1, projection phase “Level 3”) and is an abstraction of the real system, strongly influenced by knowledge and experience. Such mental models can be seen as “mechanisms whereby humans are able to generate descriptions of system purpose and form, explanations of system functioning and observed system states, and predictions of future states” [
25] or as the operator’s conceptual, dynamic representation of a physical system that is used to comprehend the current state and predict future states of the system [
26].
Equally important components of Endsley’s model are tasks and environmental factors, which consist of workload, stressors, system design, and complexity. The complexity of a situation is an importing factor that is characterized by the number of system components like airspace structure, traffic distribution, the degree of interaction between these components, and the dynamics or rate of change for these components. Other factors are workload, stressors, and system design, which all interact with each other.
The model also considers individual factors like experience, knowledge, training, abilities, and goals of a user. These factors also influence the conclusions drawn in the perception phase, which is the basis for the decision-making process. Abilities and experience are factors which cannot be trained because the former is different for every user and the latter simply needs time to develop. Knowledge and training are parameters which can be influenced and may give even unexperienced users the chance to compensate for a lack of experience.
For decision-making, humans have different strategies to conclude the best decision. An overview with respect to understanding human decision processes can be found in [
27]. The authors state that the psychology literature has identified many human decision strategies on a spectrum from heuristic to analytic strategies. Heuristic strategies ignore parts of the information to focus on quick, frugal, and/or accurate decisions instead of more complex methods. An analytic strategy seeks to weigh all the available information to identify an optimal solution. Analytic strategies tend to be slower and more complex, and they are highly dependent on working memory capacity. Decisions can be represented as decision trees where every node stands for a possibility to decide which option would suit the selected goals best. A final decision would then be a sequence of subdecisions where for each node, a subgoal has to be defined. For instance, in the case of creating a conflict-free trajectory, the first subdecision would be to select the aircraft which should change its trajectory and the second could be the type of the new trajectory (e.g., short or fuel-optimized). Standard operating procedures (SOP) are defined for many different situations for ATCOs to rely on. They form the basis of the decision tree and are based on long years of experience [
28].
Kallus et al. present a model for the cognitive components and processes specifically tailored to the ATC environment, explaining how SA develops and how the traffic picture is formed [
29]. For their cognitive model, it is assumed that ATC is an information processing activity governed by rules, plans, and the acquired knowledge of the ATCO.
2.2. Airspace and Air Traffic Complexity for Human ATCOs
In this section, the role of the ATCO and the definition of the term complexity for HAs are examined. The complexity of the observed airspace is important when discussing SA because it will strongly influence the workload of ATCOs. The influence of complexity on humans is often measured as the effort the ATCO has to make to solve a problem or ease a critical situation. Prandini et. al. stated that air traffic complexity is ultimately related to workload [
30]. They see the air traffic complexity as a measure of the difficulty that a particular traffic situation will present to an ATCO. For HAs, an airspace or air traffic situation is complex when it is challenging to keep track of the traffic situation, which potentially leads to loss of separation.
In recent decades, extensive research has focused on the complexities of air traffic management. This research primarily falls into two categories: air traffic complexity and airspace complexity. However, many papers do not clearly differentiate between these two concepts. Sridhar et al. [
31] give the following description of complexity and distinguish between flow and structural characteristics, but they summarize both aspects and “airspace complexity” as influencing factors for controller workload:
Airspace complexity depends on both structural and flow characteristics of the airspace. The structural characteristics are fixed for a Sector/Center and they depend on the spatial and physical attributes of the Sector such as terrain, number of airways, airway crossings and navigation aids. The flow characteristics vary as a function of time and depend on features like number of aircraft, mix of aircraft, weather, separation between aircraft, closing rates, aircraft speeds and flow restrictions. A combination of these structural and flow parameters influences the controller workload.
Perez Moreno et al. [
32] state that it is necessary to study the complexity of the sectors from the behavior of their air traffic flows (based on the behavior of individual aircraft) and also on the structural aspects of the sector itself. They define the complexity in a traffic-related way but see the traffic flows as important influencing factors too:
…main indicator that defines complexity is the number of aircraft in the sector, together with the occupancy of the traffic flows and the vertical distribution of aircraft.
Unfortunately, this definition does not cover the possibility that all flights are well separated and follow each other on predefined routes. Even the usage of Free Route Airspace (FRA) will not necessarily increase the complexity. A key consideration for defining the complexity of an air traffic situation is the segregation of traffic flows, i.e., the number and distribution of flights and their crossing points.
2.3. Challenges of Higher Automation in ATC
The introduction of a DA as an HA’s team partner can aid HAs in providing safe and efficient ATC, but at the same time, it poses risks if not integrated properly. Human SA may be improved by the DA through proactively sharing or highlighting relevant information as a new situation emerges and adapting to the needs of the HA, e.g., taking over more tasks when the traffic load increases and transferring more control to the HA when traffic load is low [
9]. For this, the DA needs to have the same understanding of the situation as the HA, i.e., shared SA.
A key guideline for Human–Machine Systems in ATC is that operators of complex technological systems should stay in the loop and focus on more complex tasks that the machine may be unable to manage appropriately instead of serving merely as a supervisor of the system [
29]. This is based on findings showing that with increasing automation, the risk of diminished SA of ATCOs increases, especially when limited to monitoring tasks, which are not a strength of human information processing [
14,
15,
16,
17]. The more the human ATCOs’ tasks are reduced to mere supervising, the more their attention tends to wander, which may lead to a complete loss of SA.
A DA does not have an attention limit or problems with dividing attention between different targets and goals, as long as the technical equipment is not stretched to the limit. The risk of SA loss depends on the way controller tasks are shared between humans and DAs. If specific tasks like handling conflict detection and resolution are assigned completely to a digital ATCO, there is a risk that the human ATCO is Out of the Loop (OOTL) for these problems. If the DA needs support or suffers from a (partial) system failure, the human ATCO may need longer than acceptable to regain the needed SA to solve this problem. Therefore, it is important to maintain the SA of HAs as a key design element when defining and implementing the concept of a DA as a team partner.
For advanced DAs capable of managing all controller tasks instead of specific tasks, complete flights can be assigned to both ATCOs, if possible covering the whole controlled airspace. In this scenario, HAs have to evaluate the traffic situation for their own flights, thereby making loss of SA and long-term loss of skill less probable. However, an assignment of full flights can unintentionally lead to the same situation, where some tasks are never or seldomly handled by the human. Therefore, this has to be taken into consideration when assigning flights to a DA or HA. In addition, for the distribution of flights between the digital and human ATCOs, the HA should not be relieved from too much work even when the digital ATCO would be able to handle more traffic than already assigned. This way, it should be possible to keep the human ATCO engaged without overloading them. Ideally, a digital ATCO will handle traffic only in situations that would induce a loss of the HA’s SA due to high workload and/or stress.
Many studies focus on how SA is affected by increased automation and how the reliance of ATCOs on the automated system decreases their SA [
16,
20]. Endsley noted that these combined challenges create a fundamental automation conundrum [
16]: the more automation is added to a system, and the more reliable and robust that automation is, the less likely it is that human operators overseeing the automation will be aware of critical information and able to take over manual control when needed.
There will be situations where a DA needs immediate support or a decision from its human partner and so forces the HA to abandon their own tasks. Preventing the degradation of HAs’ SA is crucial, as it requires longer recovery time. In case a critical decision has to be carried out by an HA, they may need considerably more time to investigate the problem. This phenomenon is called “Out-of-the-Loop Performance” (OOTLP). Sridhar et al. interpret this problem as caused by a lack of human operators’ involvement in automation-controlled processes due to shifts of operator tasks from active control to monitoring the automation [
33]. Moreno et al. carried out several studies on this behavior and identified situations were ATCOs only detected conflicts when working without automated support [
31]. In an automated surrounding, ATCOs looked at the conflicting aircraft but did not analyze the situation further. A more intense insight into the problem of OOTLP can be found in Chapter 5.3 of [
32].
Furthermore, it is assumed that automation will have a negative impact on the workload in situations where the ATCO has to revisit a flight several times and to regain SA because of system requests instead of handling the flight completely alone. This would be the case for system structures where only certain tasks are carried out automatically and the ATCO makes all critical decisions.
3. Characteristics of Digital Situation Awareness
Developing a digital situation awareness for a digital ATCO is a challenging task and many aspects of SA for human ATCOs discussed in the previous section cannot be transfer one-to-one to DAs. Therefore, we first have to look at the characteristics that are relevant for building situation awareness for DAs. Most importantly, we have to consider collaborative working space, where HAs work together with DAs and build a digital SA that takes influence from human SA. Once we identify the characteristics essential for digital SA, we can then discuss tools and methods necessary to create such a digital SA for DA.
3.1. Factors for Digital Situation Awareness
There are two types of factors considered for HAs’ situation awareness by Endsley’s model presented in
Figure 1. The first type comprises environmental factors, which consist of workload, stressors, system design, and complexity. Workload and stressors are attributes that are usually associated with humans and have no impact on the functionality of digital ATCOs. However, these factors are important for the DA to understand the state of its human partner and adapt its response accordingly. The methods that are relevant to assess these include monitoring devices, i.e., heart rate monitor, EEG device, etc. In the scope of current models, we mention them but do not consider them as an integral part of the digital SA for DAs. For a good overview of ideas and methods to measure SA, see [
18].
With respect to complexity, the DA needs criteria for the attribute “complex” from human ATCOs. Therefore, this can be seen as a perfect application area for artificial intelligence with respect to machine learning. It must be clarified which situations a DA would consider “complex” and whether the focus should be laid on avoiding traffic situations which are complex to the human ATCO. Additional environment factors like airspace structure, traffic situation, and types of special events are important factors that will be required for building a digital SA.
Next to that, individual factors like goals, knowledge, and abilities are attributes of the DAs’ construction. Methods and techniques used for developing DAs will influence their behavior. A machine learning model trained on historical observations will be more confident with similar examples. For unseen cases, it may react differently, i.e., use guidance from defined operational goals.
3.2. Differences in Situation Awareness Between Human and Digital ATCOs
In a team of an HA and DA, the awareness part will be handled not only by the HA but also by the DA insofar as it is needed for all tasks assigned to it. The DA will collect and integrate knowledge, make conclusions, and decide which action should be taken, similar to HAs. Nevertheless, there are several differences between the SA of HAs and DAs and the way they achieve SA. In this section, the differences between HAs and DAs in processes and aspects related to SA are discussed.
For information sampling and processing, the advantage of the DA is that it more easily connects perceived information to additional facts like aircraft parameters for an aircraft type. Furthermore, no limiting interface for information presentation and filtering is needed to prevent information overload. Thus, a DA will be able to take all available information into account.
The decision-making of ATCOs depends on their mental model of the situation [
34,
35]. However, it is difficult to create a comparable digital description of a situation (digital mental model) from human mental models. If the mental models of the HA and DA are different, it cannot be guaranteed that they will always decide in a comparable way. So, the focus should be to develop a digital mental model comparable to the human model. Humans are able to act automatically under known circumstances (gut instinct). In contrast, a DA has to follow predefined plans (e.g., standard operating procedures), which may hinder the DA’s ability to adapt to unknown situations. To prevent this, a DA can be supported by data-driven AI methods like machine learning or decision trees (e.g., random forest (random decision tree [
36])). Nevertheless, the creation of default procedures applicable as long as no exception occurs can be a suitable way to manage air traffic for a DA. Nevertheless, there should be a possibility to readjust the understanding of SA in the sense of “go back and think again” when the information changes or the sequence of sampling information reveals aspects which do not fit into the mental model of the DA.
The ability of a DA to handle traffic will be strongly influenced by the design of the system and the decision-making process. Where an HA may overstep a task with low influence when the traffic situation affords this, the DA will carry out the prescribed analyzing sequence without fail. Therefore, a DA should be able to adapt the decision-making process depending on the complexity of the traffic situation.
3.3. Complexity Assesment by the Digital ATCO
For HAs, the complexity is often measured in relation to controller workload. Endsley stated that certain constraints on a person’s ability to accurately perceive multiple items in parallel are a major limit on SA [
21]. This is clearly not a problem for a DA because they have neither a comparable mental workload nor a typical attention loss problem. Since measuring the complexity of traffic and airspace will be essential for digital SA, the definition of complexity has to be adapted for DAs. For both ATCO types, the time needed for this will depend on the number of controlled flights and their trajectories in relation to each other (e.g., many crossings, all well separated on the same route, etc.). As long as a DA does not work alone, an HA’s understanding of complexity has to be considered, especially when they have to deal with flight trajectories generated by the DA.
To characterize a traffic situation in such a way that a DA can decide what action has to be taken, a set of parameters should be defined which describe the main influencing factors. Several of the following factors are already in use for HAs [
31] but will work for DAs as well:
Number of flights: General traffic load [
37].
Distribution of flights and relation of used to unused airspace. Identification of areas which should be avoided. Traffic density. Sector occupation [
38].
Fraction of flights using a route network (real one or mental route network of the controller).
Number of active flights undergoing a trajectory change [
33].
Planned flights with flight level changes within sector.
Flights close to the sector boundary.
Number of used entry and exit points and distance between them [
31,
38].
Staggered adjacent sectors (delegated airspace).
This type of multi-objective problem is often solved by applying a decision tree, respectively, a random forest algorithm to a set of known characteristics and an assessment value given by experts (e.g., HA) [
36]. Thus, the influence of different aspects of a solution can be identified by evaluating sets of characteristics instead of all at the same time. As the training effort for decision trees is very high, several sets of input parameters with varying focus types for different air traffic situations can be created instead. The appropriate set is then selected by applying deterministic rules. A comprehensive overview about possible parameters together with an approach to evaluate air traffic complexity metrics based on neural networks can be found in [
39]. Li et al. [
38] used a deep unsupervised learning approach for the evaluation of airspace complexity, and they stated that airspace complexity is affected by a combination of subjective, objective, dynamic, and static factors, such as air routes as well as sector entering and exiting points.
4. Methods for DA to Measure Traffic Characteristics in Relation to Complexity
The focus of this section is the evaluation of complexity for DAs, which was identified as the most important influencing factor of SA. In the first part of this section, for several of the factors listed in
Section 3.3, possibilities to measure them are identified and discussed. The second subsection introduces several tools which implement some of these measures. A case study addressing conflict detection and resolution is presented in the last subsection. As a simulation environment, a setup with an improved controller display providing traffic data and access for the DA was implemented. A support tool was added for the creation of trajectories (see [
40] for more details) which is able to develop optimized trajectories with respect to a selected network. Furthermore, all tools proposed in
Section 4.1,
Section 4.2,
Section 4.3,
Section 4.4,
Section 4.5 and
Section 4.6 are tested within the DIAL and LOKI projects of the DLR.
There are several possibilities to measure and evaluate traffic characteristics which may be used to establish SA of a digital ATCO based on complexity. Several of these measures are widely used in the evaluation of controller workload and airspace/air traffic complexity for HAs. For some, like the number of active flights undergoing a trajectory change, the measurement is self-explanatory and is not described in detail.
They were implemented in a set of services called FACT (Factorization and Analysis of Consolidated Traffic). The FACT services consist of a set of tools which can be requested for several types of information related to situation evaluation. They should support a DA in assessing the current traffic situation to create and assign trajectories depending on the assessment results and support the DA in drawing conclusions about how to handle upcoming situations (conflict, trajectory creation, monitoring). Furthermore, they can be used to decide whether a new aircraft should be handled by an HA or DA. For these, a description is given and a functionality to calculate them is introduced. The contained services so far are as follows:
CoRA: Conflict Risk Assessment.
FNGen: Flow Network Generation.
FNComp: Flow Network Complexity.
FNUtil: Flow Network Utilization.
DyHm: Dynamic Heatmap.
All services work on the same set of predicted traffic data, FNGen mostly beforehand and the others in real time. In case of changes, the trajectories are updated.
4.1. Conflict Risk Assessment
A conflict risk between two flights exists when these flights have a separation above the prescribed minimum separation but below a user-dependent value which is based on personal experience with inaccuracies and unpredictability. Such a minimum separation value set by the controller enables the controller to identify flights which may come too close to each other and may have an increased risk to trigger a conflict. For the best information gain from identifying risky situations, the airspace may be overlaid with a grid where a conflict risk value is computed for each cell by calculating the conflict times based on the user-defined values for all flight trajectory combinations. Then, the resulting grid shows the areas which should be monitored by an ATCO more intensively than others or where the ATCO should consider sending some flights over different routes to proactively reduce the probability of conflicts.
The target of CoRA is the creation of this grid overlay for the airspace indicating the conflict risks for a specified airspace area, time interval, and a selected test separation distance. Other services (e.g., a DA) may send requests to CoRA containing the separation for which the calculation should be carried out, the relevant time interval, and the flight levels which should be considered. The results are calculated for each cell of this grid and will include the average of the minimum distances (below or equal to test separation) over every combination of flights moving through it. The results for all non-empty cells of the calculated grid, including the “number of counted flights” and “average separation”, are sent back to the requesting tool. If requested, the results of the flights with risks are included in the result as well. Additionally, for all flights with a minimal separation above the prescribed minimum and below the maximum lateral separation values, the average minimal distance is calculated as an evaluation of their risk to fall below the minimum separation.
4.2. Flow Network Generation
Today, it is more and more common to assign direct connections between enter and exit points for flights moving through a sector. This leads to time periods where the standard route network is not in use anymore. A DA should act in a comparable way. For this, it is necessary to identify the real main flow/mental controller networks depending on time and traffic. A possible approach for this is described by Gerdes and Temme [
40].
The objective of the identification of main flows behind a traffic sample is to enable the DA to create and assign trajectories for flights which follow the mental model of the HAs. This can be especially helpful when time intervals for the traffic sets are selected in such a way that they reflect certain traffic periods (low/high) or flight levels which indicate traffic types (origin–destination pairs, wake vortex category). The calculation of FNGen is triggered by a request from outside which specifies the observed airspace by defining flight levels and a time interval.
For the flow network generation, the intersections between all flights are calculated and clustered to “Common Crossing Points”, and the used links between them are calculated [
41,
42]. Former trajectories (consisting of waypoints where changes take place) are substituted by a trajectory consisting of intersections. Afterwards, the resulting network is used for creating optimized trajectories with an A* algorithm and is then used to identify connections between cluster centers. These connections form the underlying so-called main flow network. It is optimized with respect to node numbers and positions and sent back to the requesting tool (e.g., the DA). An example of the resulting network is shown in
Figure 2, with the main flow network as orange lines and the cluster centers C as colored circles. The thickness of network lines depends on the number of flights using them.
In addition, the value
“density(C)” is calculated for every cluster on the boundary of the observed airspace and included in the result set (see
Section 4.7). Cluster density can be measured with the following equation [
43]:
where
d(
x,
y) = distance from
x to
y.
density(C) can be seen as the number of cluster elements per length unit.
As limitations of FNGen, the following points should be considered:
The number of clusters, especially, will differ depending on the selection of ε and minPts and with that, clearly, the whole structure of the network. Extensive parameter tests were carried out for the predecessor TraSIIC (Traffic Structure Identification using Intersection Clustering) of FNGen described in [
41,
42]. Nevertheless, these parameters have to be calculated for every select set of data again to ensure the resulting mental network really is appropriate to the problem. This the main reason why FNGen should be used to create typical mental networks beforehand.
4.3. Flow Network Complexity (Structural Complexity)
The complexity of a route network can be calculated for an existing route network or an adapted network based on the real traffic (
Section 4.2). For analyzing traffic flows for an air traffic complexity value, Gerdes and Temme designed a complexity assessment which can be used to calculate the structural complexity of a route network [
41,
42]. It should characterize the structure of an airspace region in combination with a traffic situation. Based on the complexity values for each network node, a complexity value for the flights mapped to this network can also be calculated.
Figure 2 shows two examples of calculated complexity values for different traffic samples. The main flow network links are depicted as orange lines (thickness depending on usage number). Size and color of the network nodes depend on the level of complexity, from green/small for low complexity to red/big for high complexity. With reference to Formula (2), the complexity values range from 0 and 10. Based on this and using a step size of one, ten colors (complexity 0: no color) shown at the bottom of this figure are used to distinguish between the complexity values. The pixel size of the circles is calculated by multiplying the complexity value by 3.
With this definition, the structural complexity values can indicate areas of the airspace which should be the focus of the ATCO more often, because the traffic structure is more complicated than in other regions. Furthermore, the complexity can be used as a parameter for conflict resolution (trajectory generation) to avoid complex airspace regions or to decide which trajectory from a set of comparable solutions should be adapted. As mentioned in
Section 3.2, there are different types of complexity values for air traffic or airspace structure, but most of them are not directly applicable to DAs because of the lack of workload.
FNComp starts working when a request with the parameters of time interval, boundary of observed airspace, and network data or name is received (for more details, see [
41,
42]). It maps the actual traffic to the selected route network and measures the structural complexity of this network with respect to all network nodes. The measurement is based on flight directions for pairs of mapped flights using the same network node. For all pairs of mapped flights with an overflight time difference less than 300 s, the angles between all combinations of in- and outgoing links are calculated and multiplied by a weight factor. This factor depends on the type of link combination (ingoing/outgoing) and the angle and is listed in Formula (2). For the creation of Formula (2), we used aspects of ATM complexity measurement [
30,
45]. The angle at which two routes meet defines potential horizontal interactions. As in [
45], we used 15° as the lower bound; others, e.g., Gianazza [
46] use 20°. Route segments with an angle of −15° to 15° are handled as similar, of more than 15° to 165° as different, and 165° to 180° as opposite. Traffic situations where mapped flights nearly fly in the same direction or follow each other are in general evaluated as less complex than those where flight links of different flights have angles between 15 and 165 degrees. For opposite traffic, it is assumed that the flights are separated vertically. The weight factor is defined as follows:
To calculate the network complexity, the average of the complexity values for all nodes of the network is calculated. For flights, the same calculation as for the node complexity is carried out to calculate the complexity of every trajectory node. In this case, all other flights moving through these nodes within 300 s around the overflight time of the observed flight are identified. For the trajectory complexity, the node complexity values are averaged and non-zero values are summarized to calculate the average complexity value for the whole trajectory.
Conflicts between mapped flights are not considered. Up to now, the focus lays on the structure of the network, especially the angles between all pairs of links entering or leaving a node. With the definition given in Formula (2), a trajectory with a low complexity value is less complex than one with a higher value.
4.4. Flow Network Utilization
Flow network utilization is an indicator metric for the usage of a selected route network by a given set of flights. For this, the “distances” between their trajectories and the closest links of the route network can be calculated and merged into a closeness value for each trajectory. Additionally, a closeness value for the complete network can be calculated in addition to the value for each trajectory. FNUtil may be used by a DA for identifying the (mental) network in use and therefore the traffic handling strategy of the HA with their trajectory generation preferences. The objective of FNUtil is therefore to determine the usage factor for a set of flights on a given network by calculating the closeness value (distance to network) for each flight trajectory. For this, the “closest” link of a network is identified for each trajectory segment, and the average of the minimal distances for all segments of a trajectory is calculated. The “closeness” metric is calculated based on the SSPD idea (Symmetrized Segment-Path Distance, [
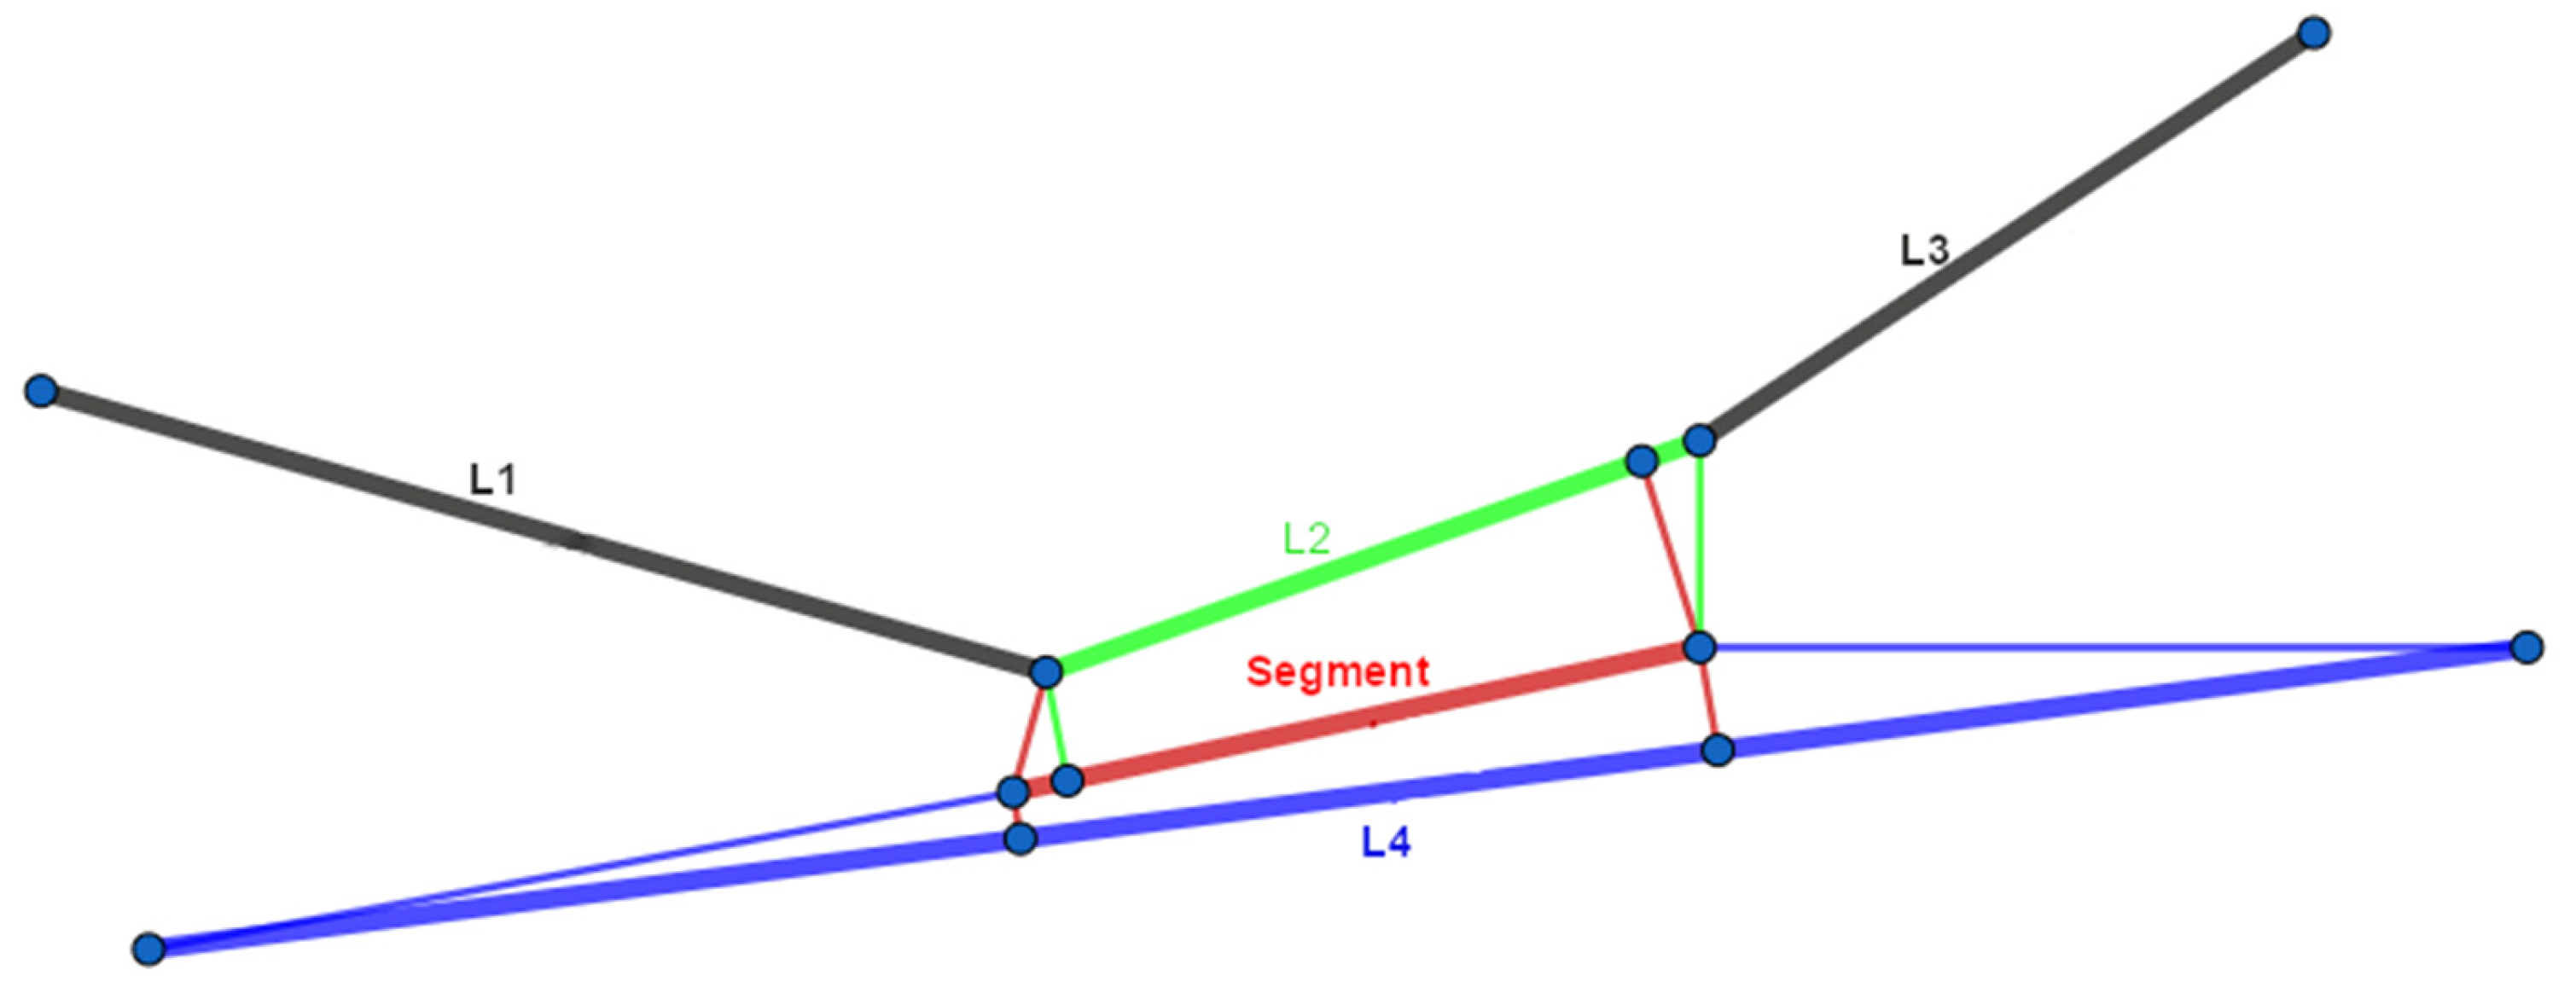
47]) but was enhanced to a “Symmetrized Segment-Network Distance” (SSND). The result of a request for FNUtil is an average “closeness” value for the selected traffic sample and a special one for every included flight. The lower the value for the SSND for trajectories, the closer it is to the network. In detail, for each segment of a trajectory, the link of the network is searched where the distance for the two end points is as low as possible (
Figure 3). For this, the average distance of start and end points of each trajectory segment to all network links is calculated and stored. Afterwards, the same is performed for each network segment to every trajectory link. The link with the lowest sum of both distance values is selected as the closest link of the network to the segment.
Figure 3 shows an example for the calculation with the observed flight segment in red and two possible links of the route network in green (L2) and blue (L4). When taking only the lowest distance (thin red lines to link L4) from the segment to the link into account, the trajectory segment (red) would be assigned to network link L4. Incorporating the distances of the end points of the network links as well (thin green and blue lines) reveals that link L2 fits the segment better than L4.
Especially when a main flow network created by FNGen is used, many straight connections between two waypoints of a trajectory are divided into several segments in the network. This may lead to situations where no appropriate network link can be found for longer trajectory segments, because the segment spans over several links. To prevent this, succeeding network links with the same heading were added as new temporary segments to the network’s link list.
By comparing a trajectory to the actually used network, a high distance to the network in combination with a worse ratio of the length of the trajectories to the direct connection indicates a complex situation with problems caused by evasive movements.
4.5. Active Flow Network Identification
Since there are more networks known than only the standard route network (e.g., the mental network of the human ATCO), it is of eminent interest to a DA to know which network is in use. For the identification of the actual network, the flow network utilization (
Section 4.4) for considered networks should be calculated and compared with FNUtil. The network with the lowest value for the average trajectory-to-network distance should be selected. This will help a DA to create new trajectories based on ATCO preferences. This function is part of the functionality of a DA to keep track of the strategies used by human ATCOs. As the used network may depend on the traffic and therefore on the time of day, it may be vital for a digital ATCO to have several networks for different sections of the day and/or traffic loads available and to always select the appropriate one.
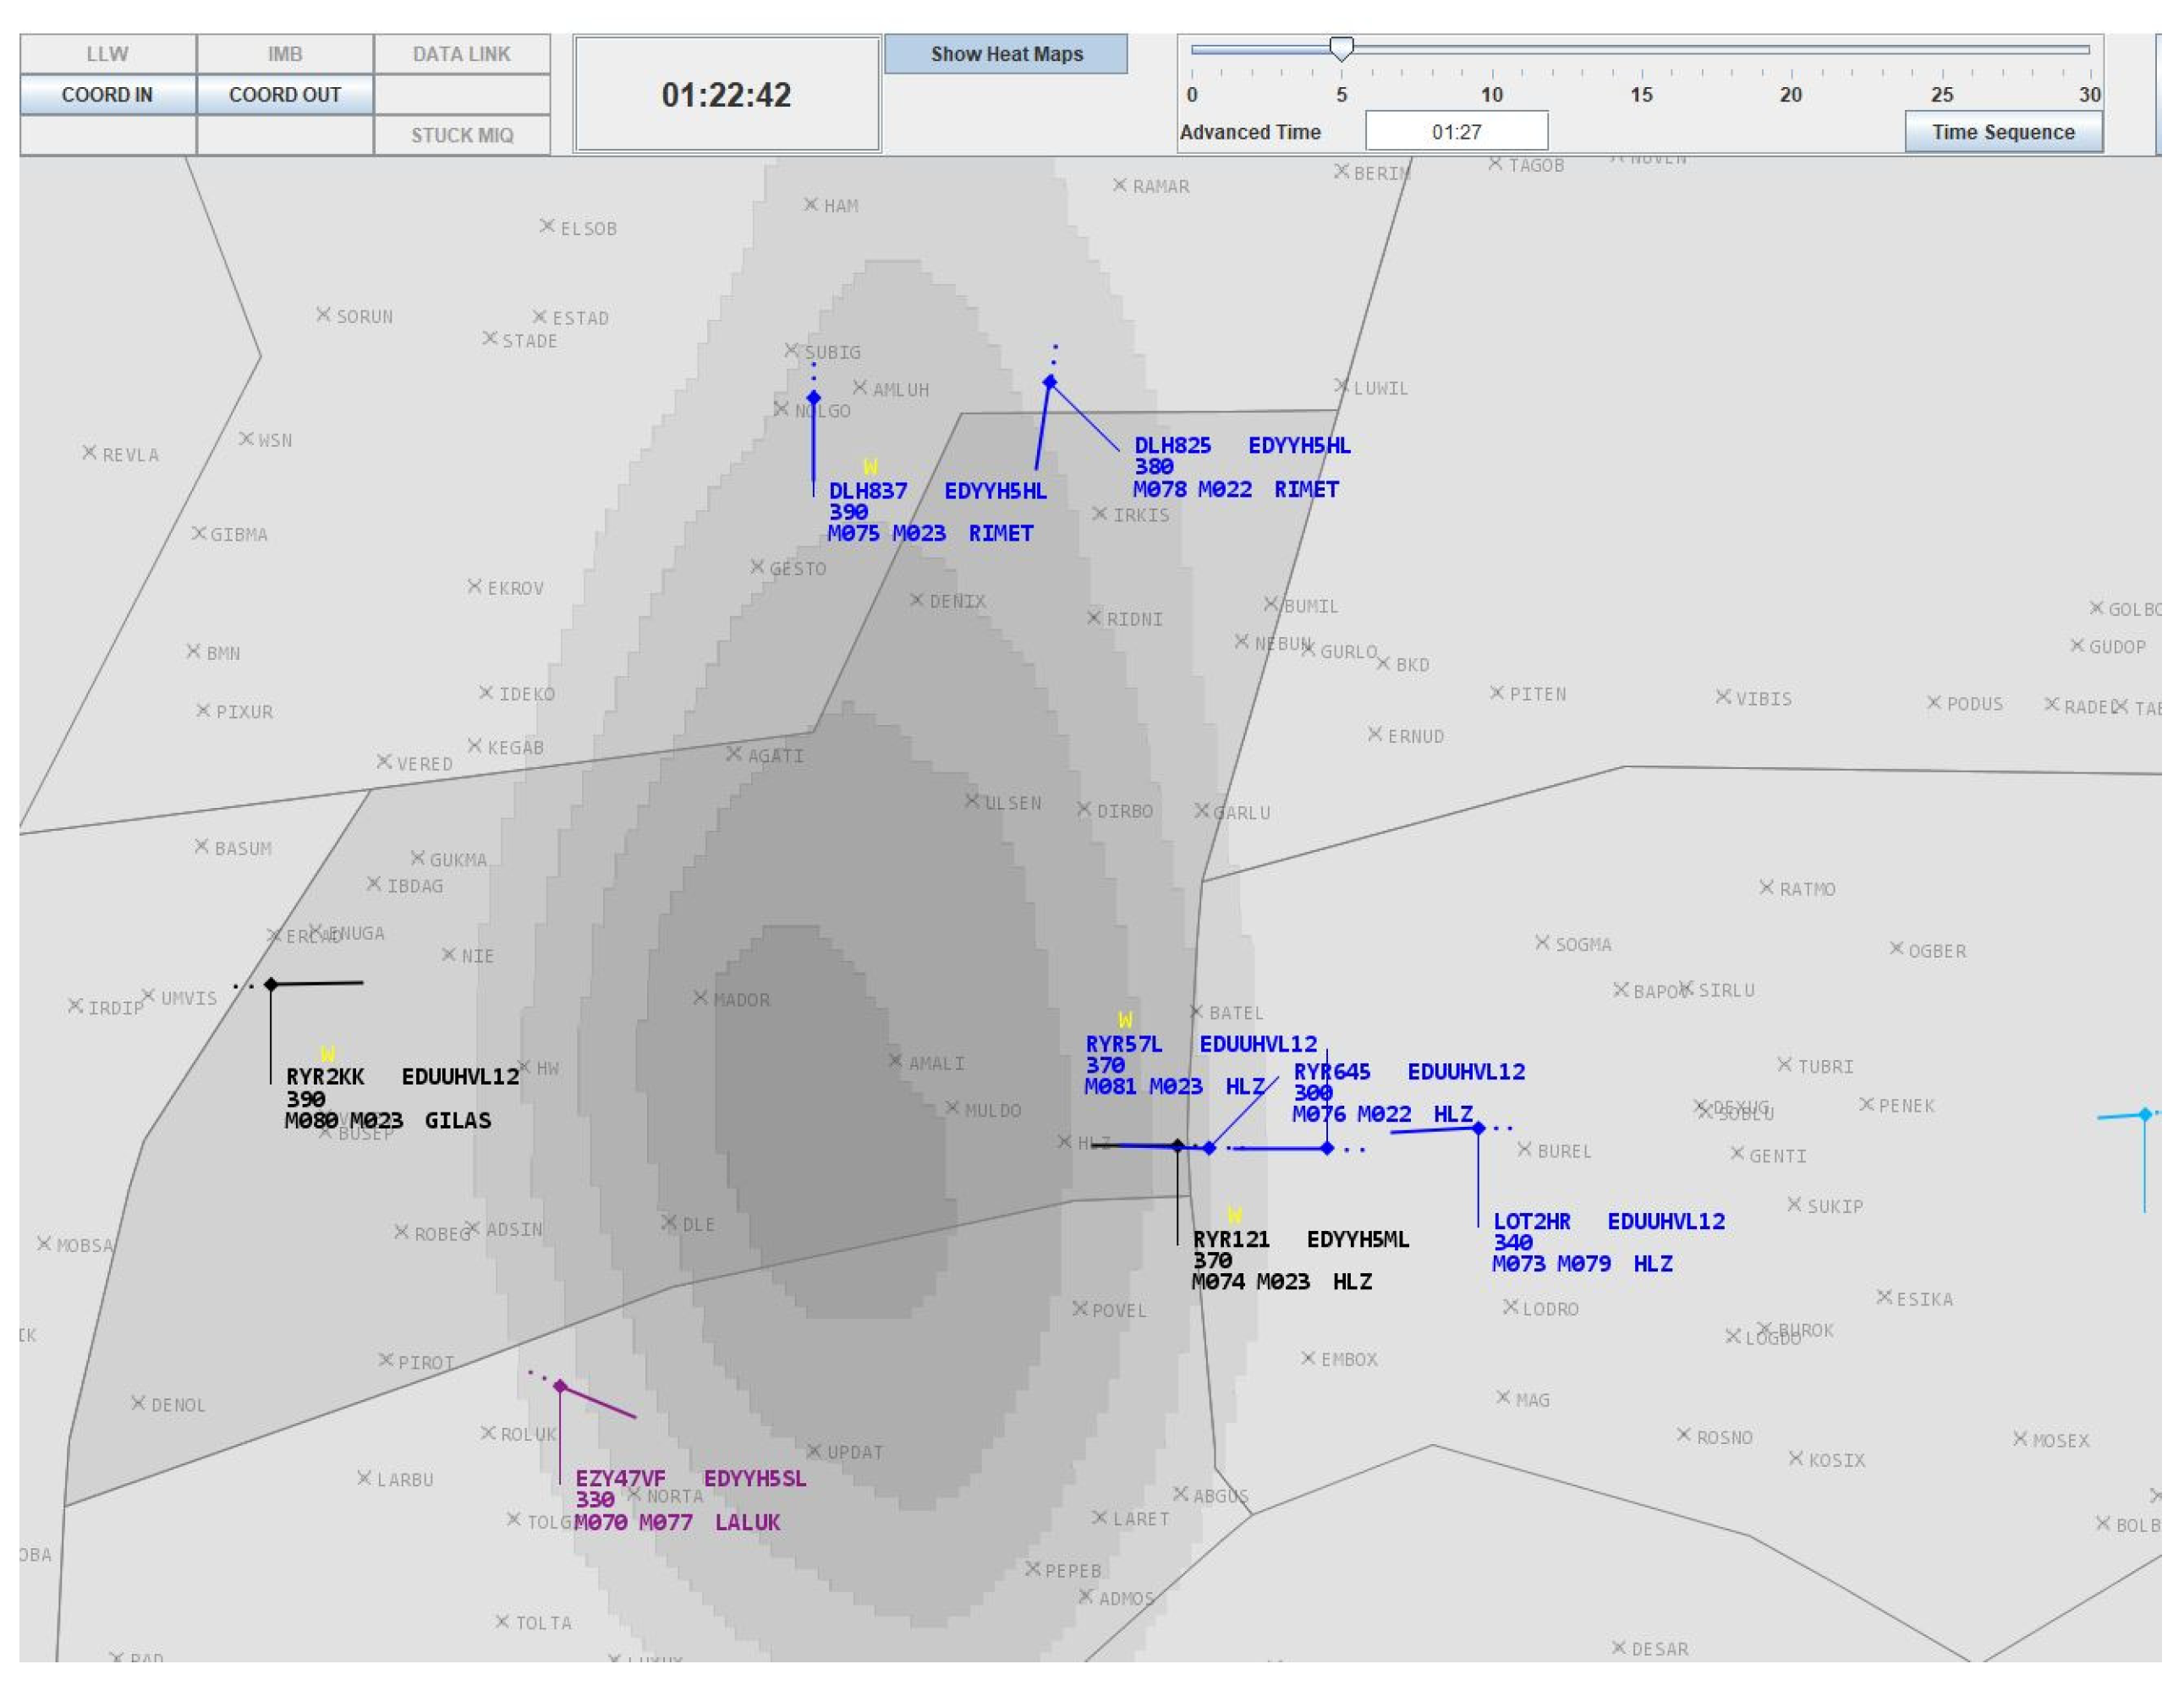
4.6. Traffic Density and Distribution (Dynamic Heatmap)
The traffic density heatmap service DyHm shows regions with dense traffic where it is more likely to encounter conflicts (
Figure 4). They are updated every minute. If possible, routing additional traffic through dense airspace should be avoided. DyHm divides the traffic density in
zones
depending on the identified number of flights moving through it. The traffic density distribution can be used by the DA to identify less used airspace areas where evasive movements should be carried out if necessary. Furthermore, it can be used to forecast areas where problems may occur in the near future or how the traffic is distributed (
Section 4.8).
For the evaluation of the dynamic density
for a trajectory
with
n segments, the actual dynamic heatmap can be used to calculate the distances
flown in zone
. These are multiplied with a density factor
and summarized. This sum is divided by the trajectory length
to normalize it and to prevent higher values for long trajectories.
When creating new trajectories, very dense areas may be restricted, forbidden, or down-weighted. This has to be performed with care to avoid unnecessary diversions with vertical separation at the same time. Furthermore, the dynamic heatmap may be used for the assignment of flights between the HA and DA, e.g., to send only those flights to the DA which have a low value for traffic density.
4.7. Distribution of Used and Calculated Entry and Exit Points
The number and distribution of used entry and exit points for a sector is another hint for the complexity of the main traffic flows. These entry and exit points and their distribution are obtained as a byproduct of the main traffic flow calculation described in
Section 4.2, where the crossing points of trajectories and the region boundary are calculated and clustered to compact entry and exit centers. Center points with a high standard deviation/variance or low-density values of the associated clusters (
Section 4.2) indicate a high degree of defibration and therefore widely unstructured entry and exit streams [
40].
The number of different entry and exit points and the average distance between entry and exit points together with the density of the corresponding clusters will show the necessary diversion of attention between traffic entering and leaving the sector and the traffic within. The distance between exit and entry points on the boundary can give a hint about the number of areas which have to be monitored at the same time and the necessity to indicate problems in these regions to the HA. Furthermore, to avoid overloading an entry or exit point with too many assigned flights, the DA has to consider rerouting using a nearby point instead. This will often require coordination between sectors.
4.8. Distribution and Variation of Flights to Levels
The distribution of flight levels between aircraft (traffic per flight level) as well as the number and range/spread/bias of used flight levels and of descending, climbing, and cruising flights are often used in the literature as measurements for air traffic complexity when calculating HA workload. Furthermore, they are measures for the difficulty to maintain SA, and the flight level assignment is often used to solve conflicts. It can be used for the evaluation of complexity in the same way for DAs. When level changes are caused by conflicts, this can point to lateral separation problems in the original flight level. Nevertheless, the resulting conclusions depend on the general airspace structure. With several hub airports within a typical climb-and-descent range between ground and cruising level of the observed airspace, a higher number of level changes can be expected. This makes the traffic more complex and more difficult to supervise than with cruising flights only.
4.9. Proximity to Sector Boundary
For flights within the proximity of half of the prescribed minimum lateral radar separation (typically 2.5 NM) to the sector boundary (of sectors that are not planned in the original flight plan), additional coordination effort has to be performed. Therefore, this aspect may be included in the calculation of air traffic complexity for HAs. For a high level of SA, this has to be under observation of an ATCO all the time because negotiations with the adjacent sector are mandatory and increase the effort for these flights. For a DA, the number of flights within the proximity of the sector boundary can be interpreted as an indicator for necessary possible negotiations or restrictions in handling possibilities.
5. Modelling Digital Situation Awareness for Digital ATCO
Building digital situation awareness for a digital ATCO is crucial for enhancing their understanding of the environment and comprehending the actions of their human counterparts in a collaborative setting. Endsley’s model, discussed in
Section 2, provides a foundation for understanding how SA can be developed for humans.
Section 3 highlights the characteristics necessary for creating digital SA. Finally,
Section 4 offers methods and tools for assessing various aspects of SA. In this section, we integrate these pieces to establish a digital SA framework for DAs and define how different tools can assist at various levels in building this awareness.
5.1. Architecture of a Digital Situation Awareness
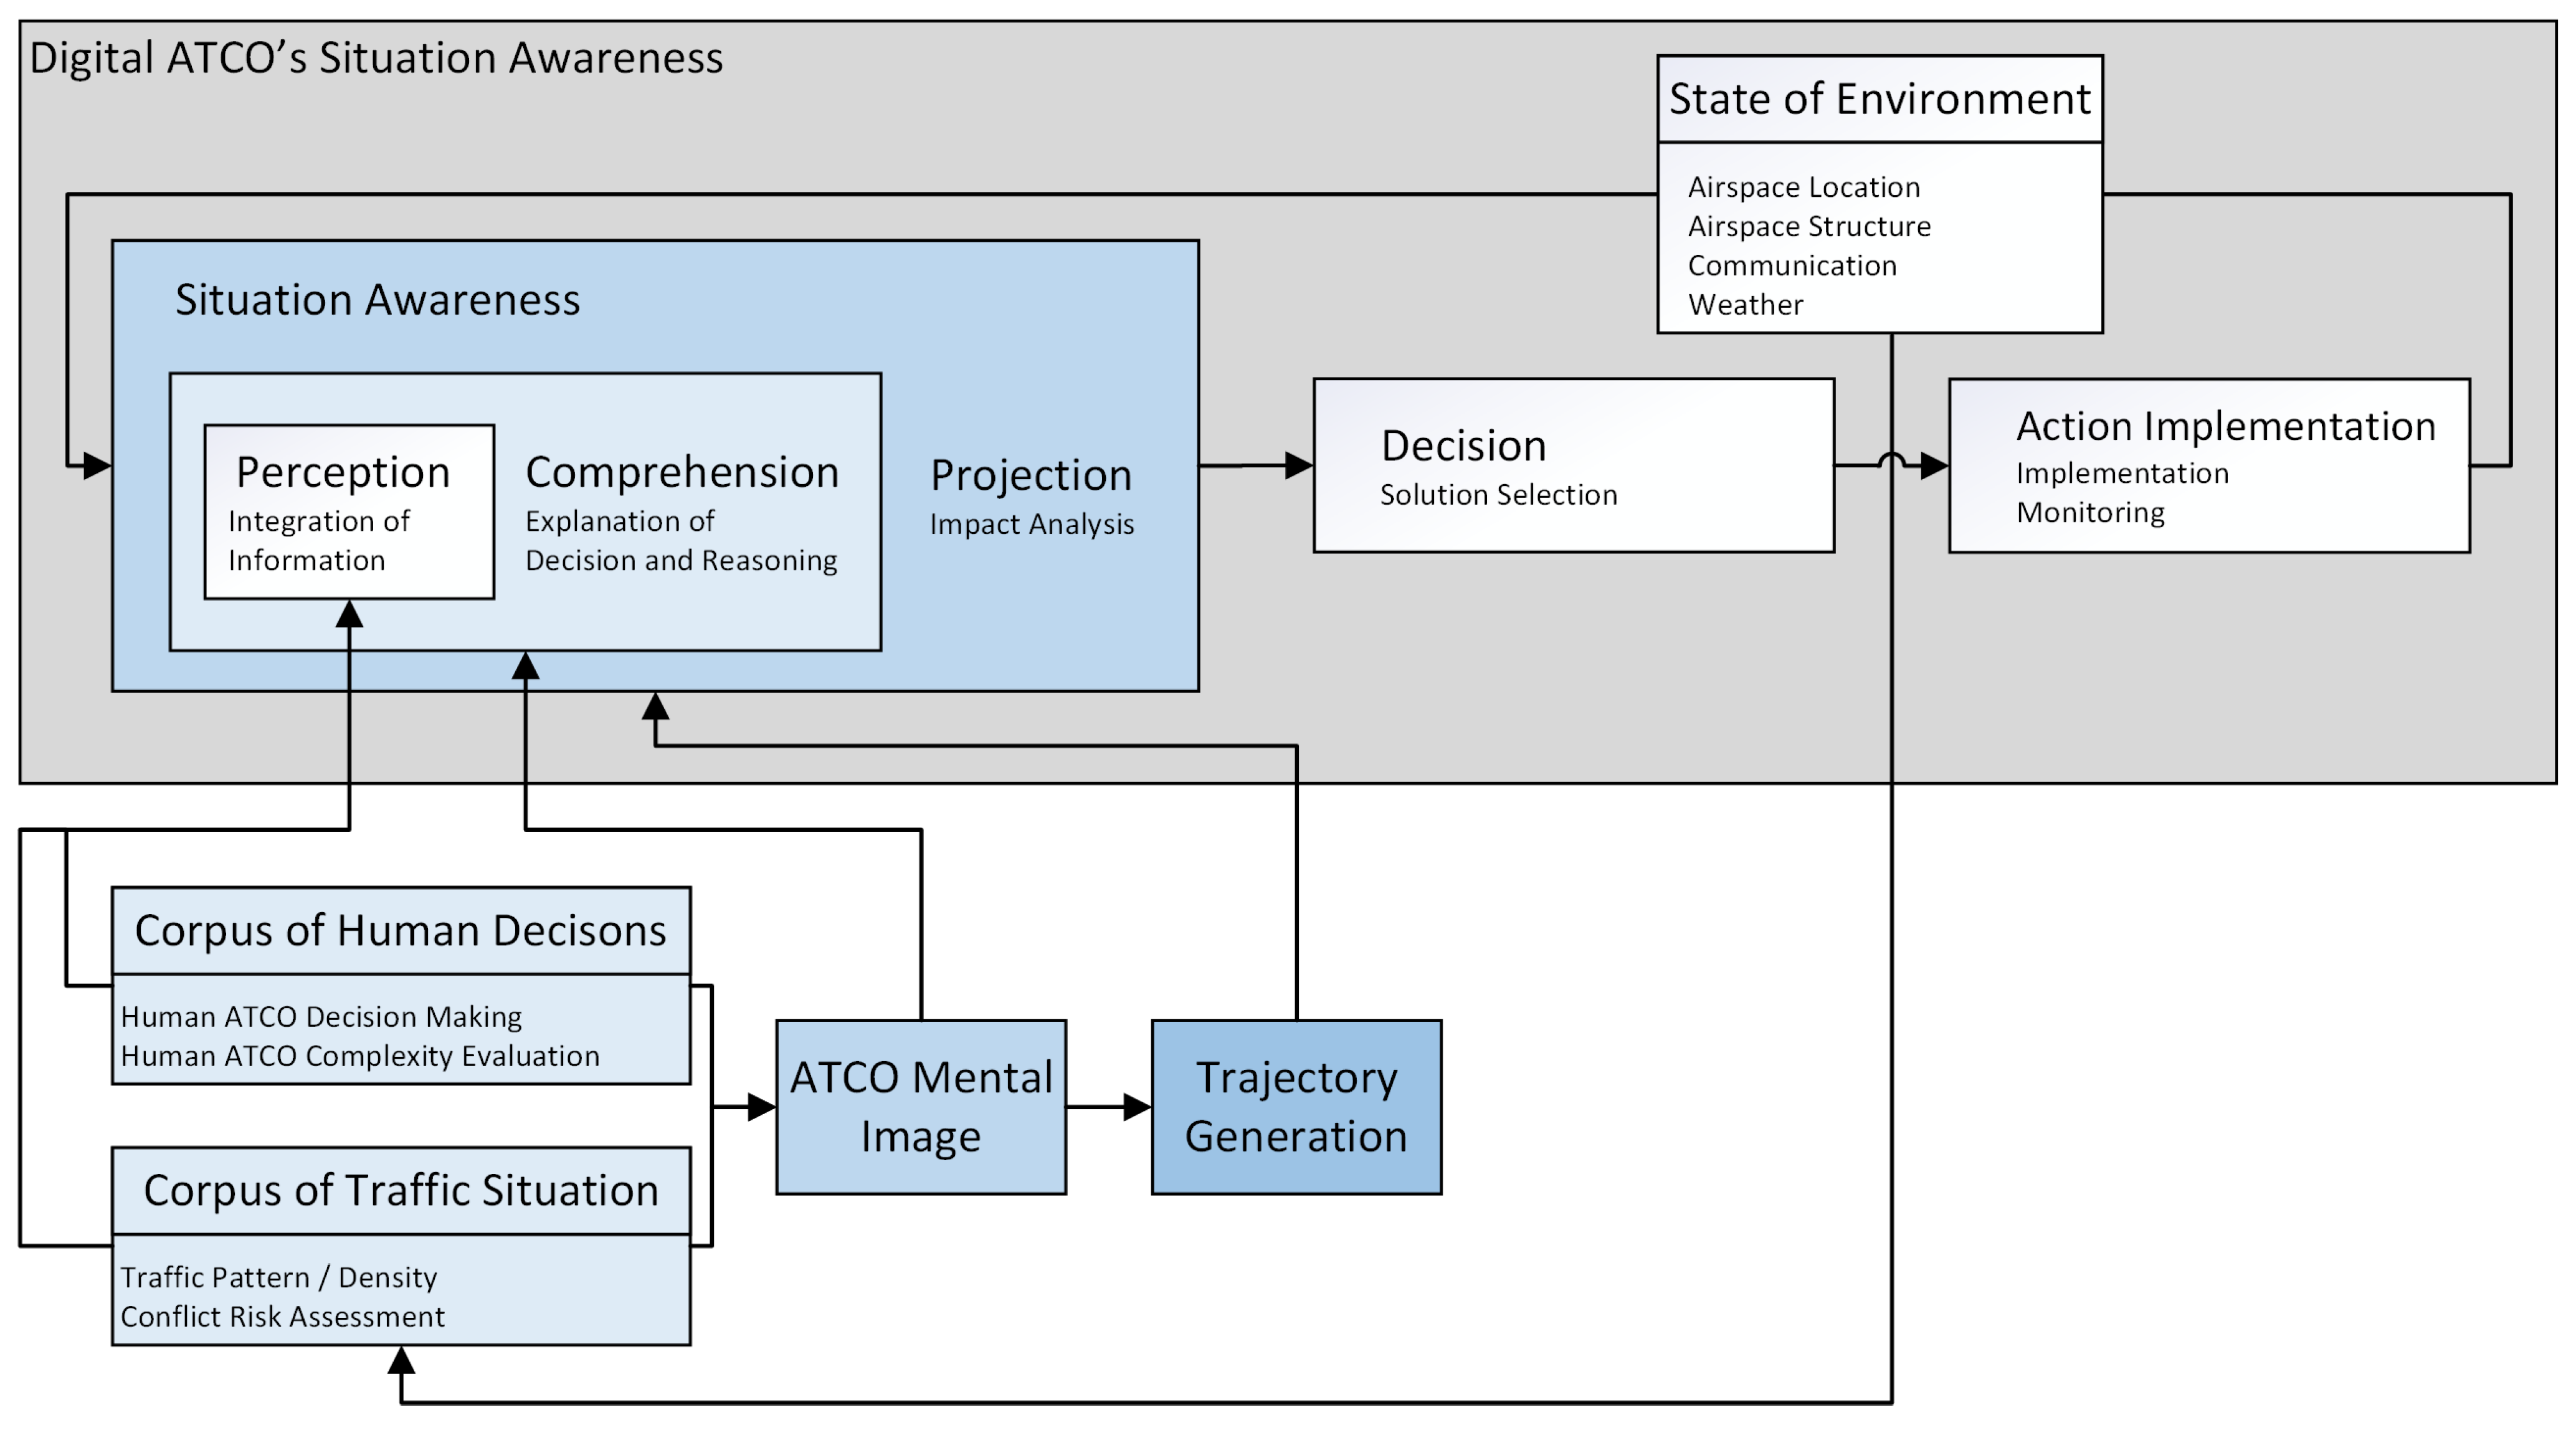
We propose a comprehensive SA framework specifically designed for a digital ATCO, as illustrated in
Figure 5. This model builds upon Endsley’s established framework, incorporating additional components that are essential for the effective operation of a digital entity in the complex environment of air traffic management. By integrating these extensions, the framework aims to enhance the DA’s ability to perceive, comprehend, and project future states, thereby improving overall operational efficiency and safety. The entire process starts with the observation of state of the environment, which can be described as current aircraft locations, traffic situation, airspace structure, planned event, pilot–ATCO and ATCO–ATCO communication, weather conditions, etc. The state of the environment provides first-hand information to a digital ATCO, which it must understand in building SA. The situation awareness consists of a DA’s ability to perceive, comprehend, and project future scenarios.
Perception: The perception building begins with the integration of information, including historical observations of human decision-making and traffic situations. By utilizing the FNGen tool, DAs can analyze a corpus of traffic situations to identify patterns that reflect the preferences of human ATCOs for routing traffic. This approach offers valuable insights into the mental models used by humans and how they organize traffic within a sector. The combination of these data sources helps DAs to develop a clearer understanding of the current state of the environment.
Comprehension: The comprehension process enables DAs to develop reasoning about a given situation. To enhance this reasoning, FNComp provides a complexity assessment of the current state of the air traffic sector, while FNUtil helps identify how close the flights are to the mental route network of the HA. Additionally, DyHm enriches the information by pinpointing hotspots and open spaces within the sector. This information is crucial for building a comprehensive understanding of the current situation. When comprehension is combined with perception, the DA can provide explanations for various scenarios.
Projection: Once perception and comprehension are established, the DA can apply this understanding to analyze future decisions by assessing potential actions and their associated risks. This is achieved by generating possible solutions using a trajectory generation tool and evaluating the risks linked to these solutions. For risk assessment, CoRA evaluates conflict risk, while FNComp assesses complexity. This information is then used to analyze the impact of the available options.
5.2. Case Study
Whilst
Section 5.1, and especially
Figure 5, shows the general model for a DA to gain situation awareness, in this section a workflow implementing the above-mentioned processes, “perception”, “comprehension”, and “projection” is presented. The workflow shown in
Figure 6 is then applied to an example to showcase this process. Because this is only an example which should give the reader an impression of the way the tools explained in
Section 4 will support the workflow presented in
Figure 5 and what type of results can be expected, no further statistical analysis is carried out on the presented results. Nevertheless, this will be performed later. The combination of tools presented in
Section 4 allows the DA to collect the data necessary for the corpus of human decisions and traffic situations shown in
Figure 5.
The perception step is always to collect traffic data and the general information necessary for assessing the state of the environment. Based on this finding, main flow networks for different time periods or flight level selections are created with FNGen and stored in a database. It is assumed that the human decisions are represented in the way the general traffic flow is conducted. These networks are evaluated with respect to their complexity with FNComp and later for their conflict risk with CoRA. The results are stored within the DA and referred to as a mental model. For the comprehension level, the existing mental models are evaluated with respect to their utilization by the actual traffic set using FNUtil. The connected conflict risk calculated with CoRA and the future traffic distribution visualized with DyHM are also applied to increase the understanding of the situation. Afterwards, the most appropriate network for the actual traffic is selected and applied, e.g., for the process of trajectory creation shown in
Figure 6. The projection in the future is then based on the created knowledge and in cases of the conflict resolution tasks depicted in
Figure 6 supported by a trajectory generation service. In case a flight trajectory has to be created, the DA calculates “avoidance areas” based on CoRA and DyHM results, which are used by a trajectory generation service. Afterward, the DA requests for the conflicting flight a set of trajectories with different foci from a trajectory generation tool like TraGAT, which is able to take avoidance areas and route networks into account [
41].
For the decision-making process of the DA, for each created trajectory, the corresponding complexity value is calculated with FNComp and the closeness to the current route network with FNGen. All created trajectories are sent to the Controller Working Position (CWP) in case the HA wishes to participate in the selection process. Otherwise, the DA selects the “best” trajectory based on these characterization parameters and applies it to the observed flight. For the identification of “the best” trajectory, deterministic rules based on the results of the FACT tools, the SOP [
28], or targets like preferring shorter or less complex trajectories or to stick as close as possible to a given trajectory (not necessarily the actual) are used.
In case a trajectory generation has to be started because of a conflict (
Figure 5, yellow part), an important step will always be to select the aircraft which should be adapted. Possible factors which may influence the selection are, amongst others, the number of conflicting flights for each involved flight, the distance to first separation violation, or the remaining flight time in the sector (the higher it is, the more possibilities for evasive movements).
5.3. Digital Controller Resolving Conflicts Utilizing Digital Situation Awareness
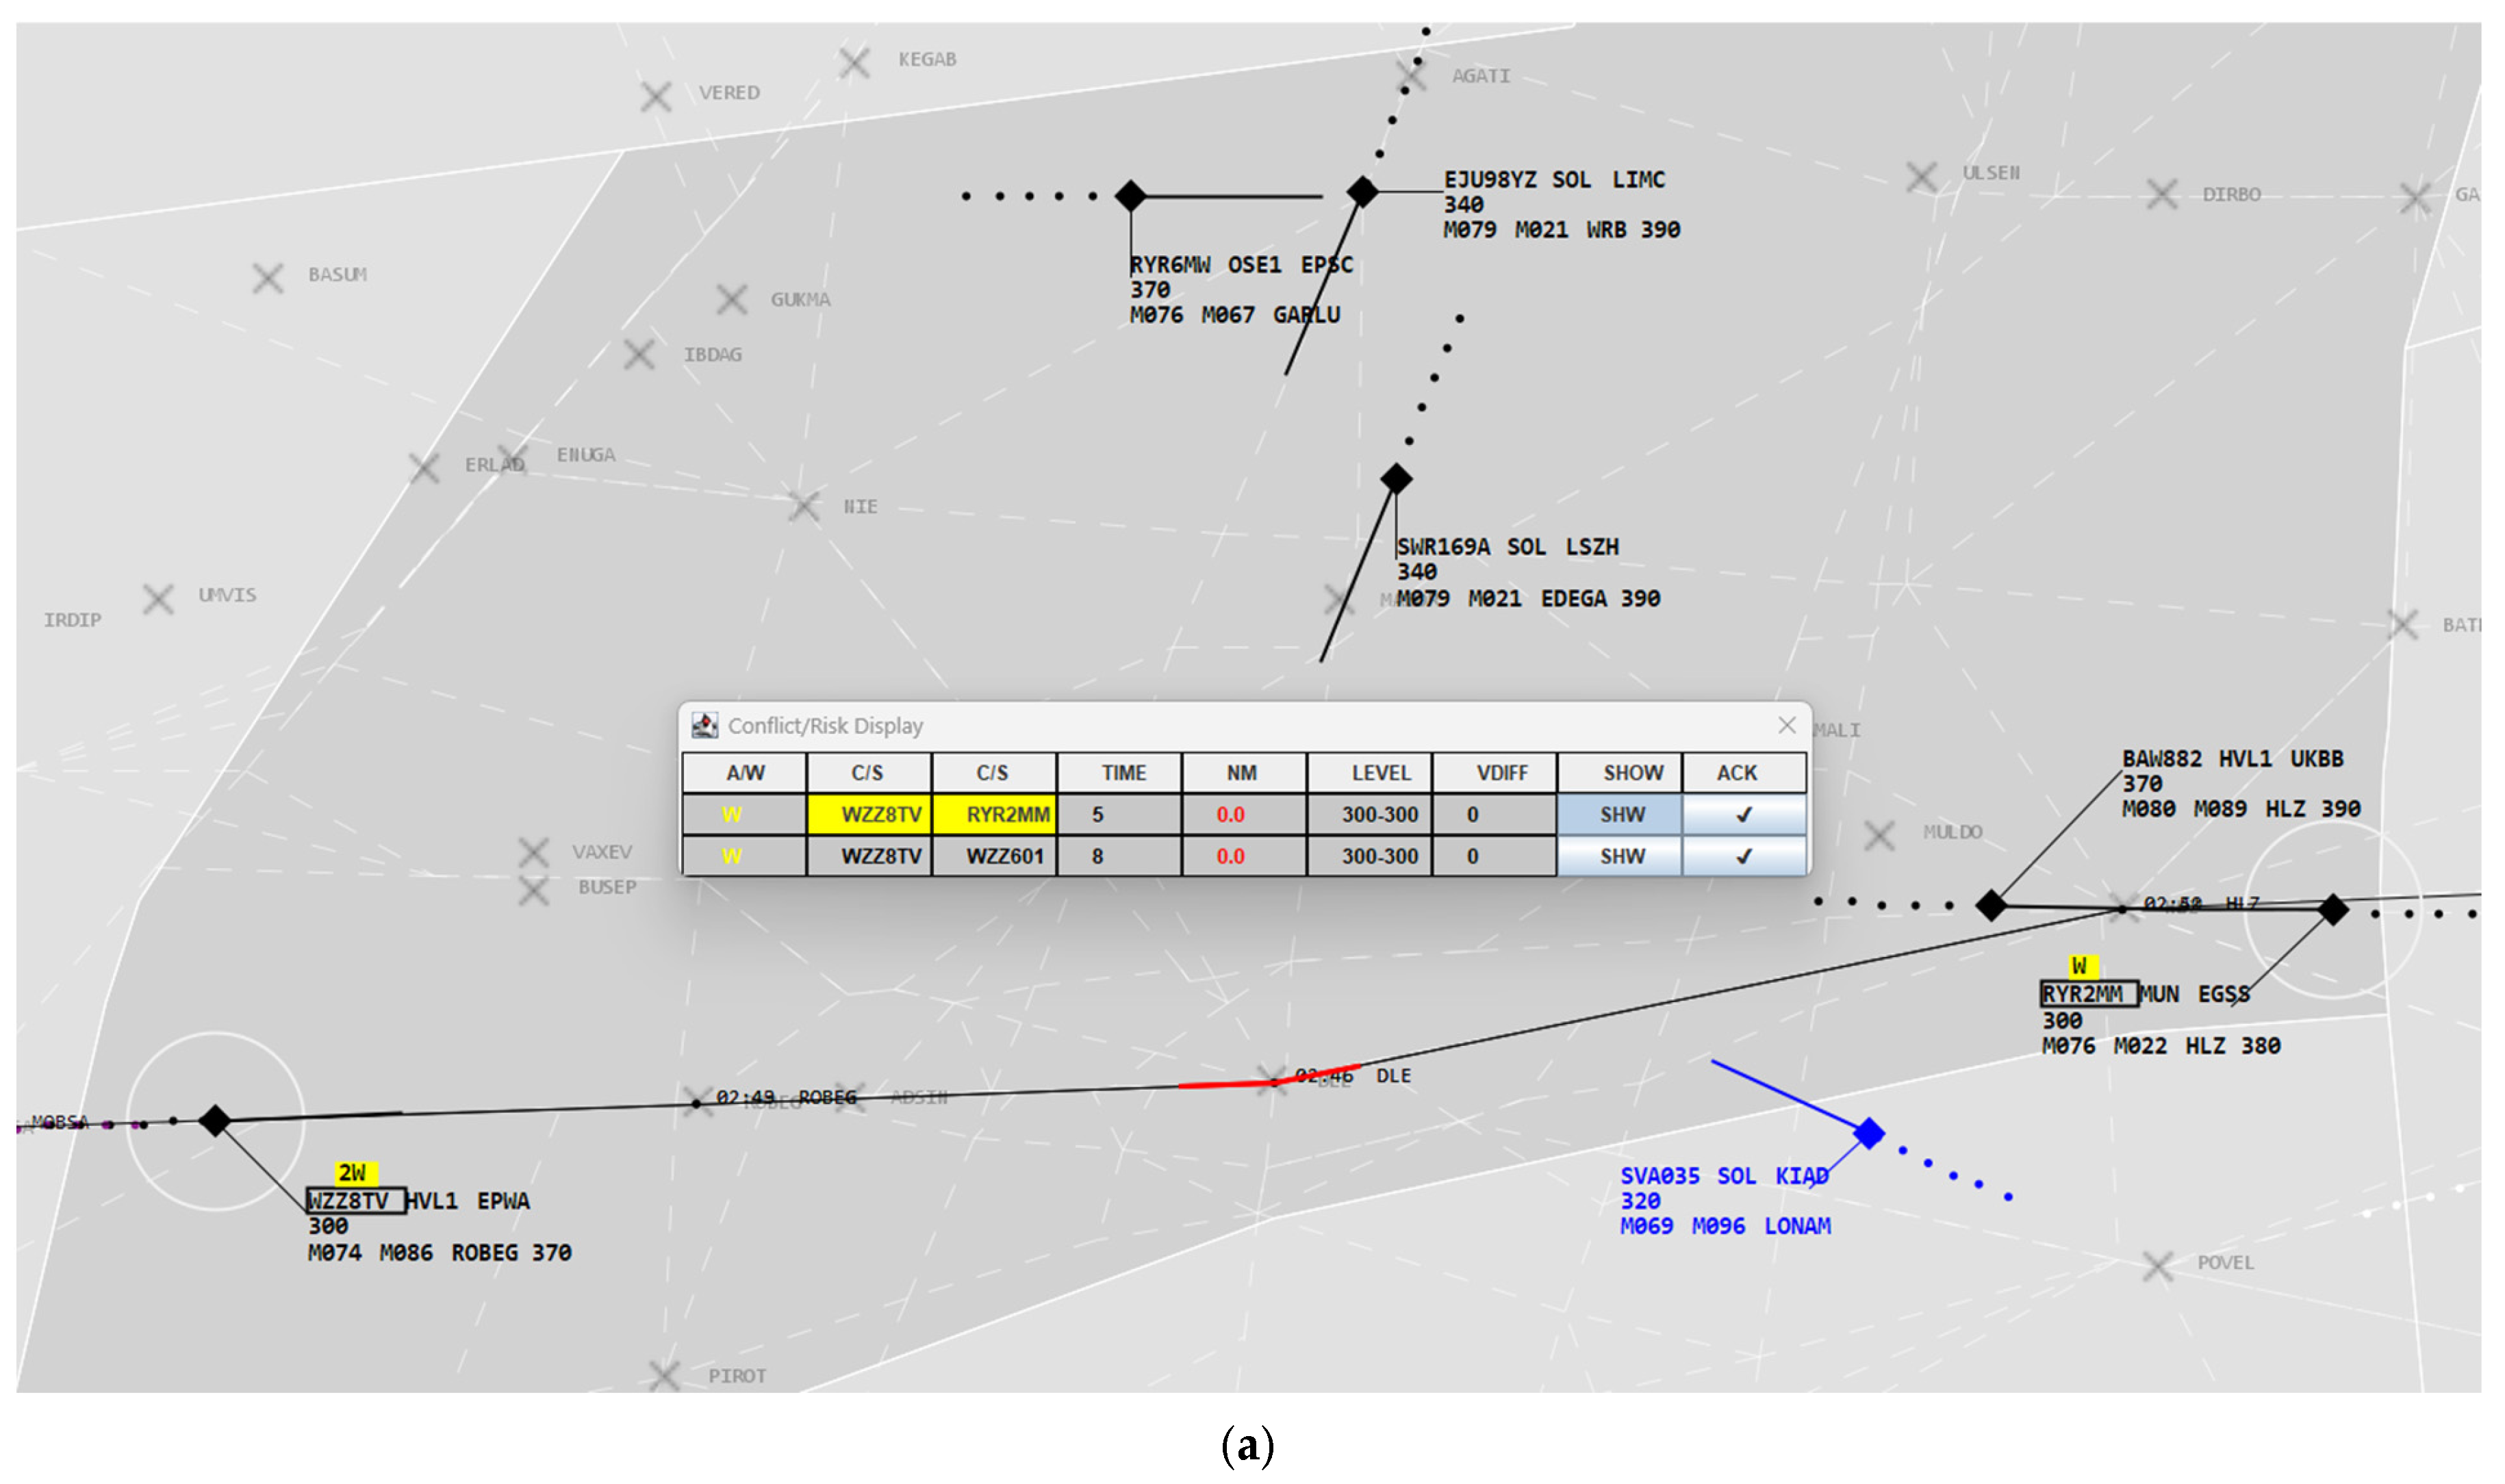
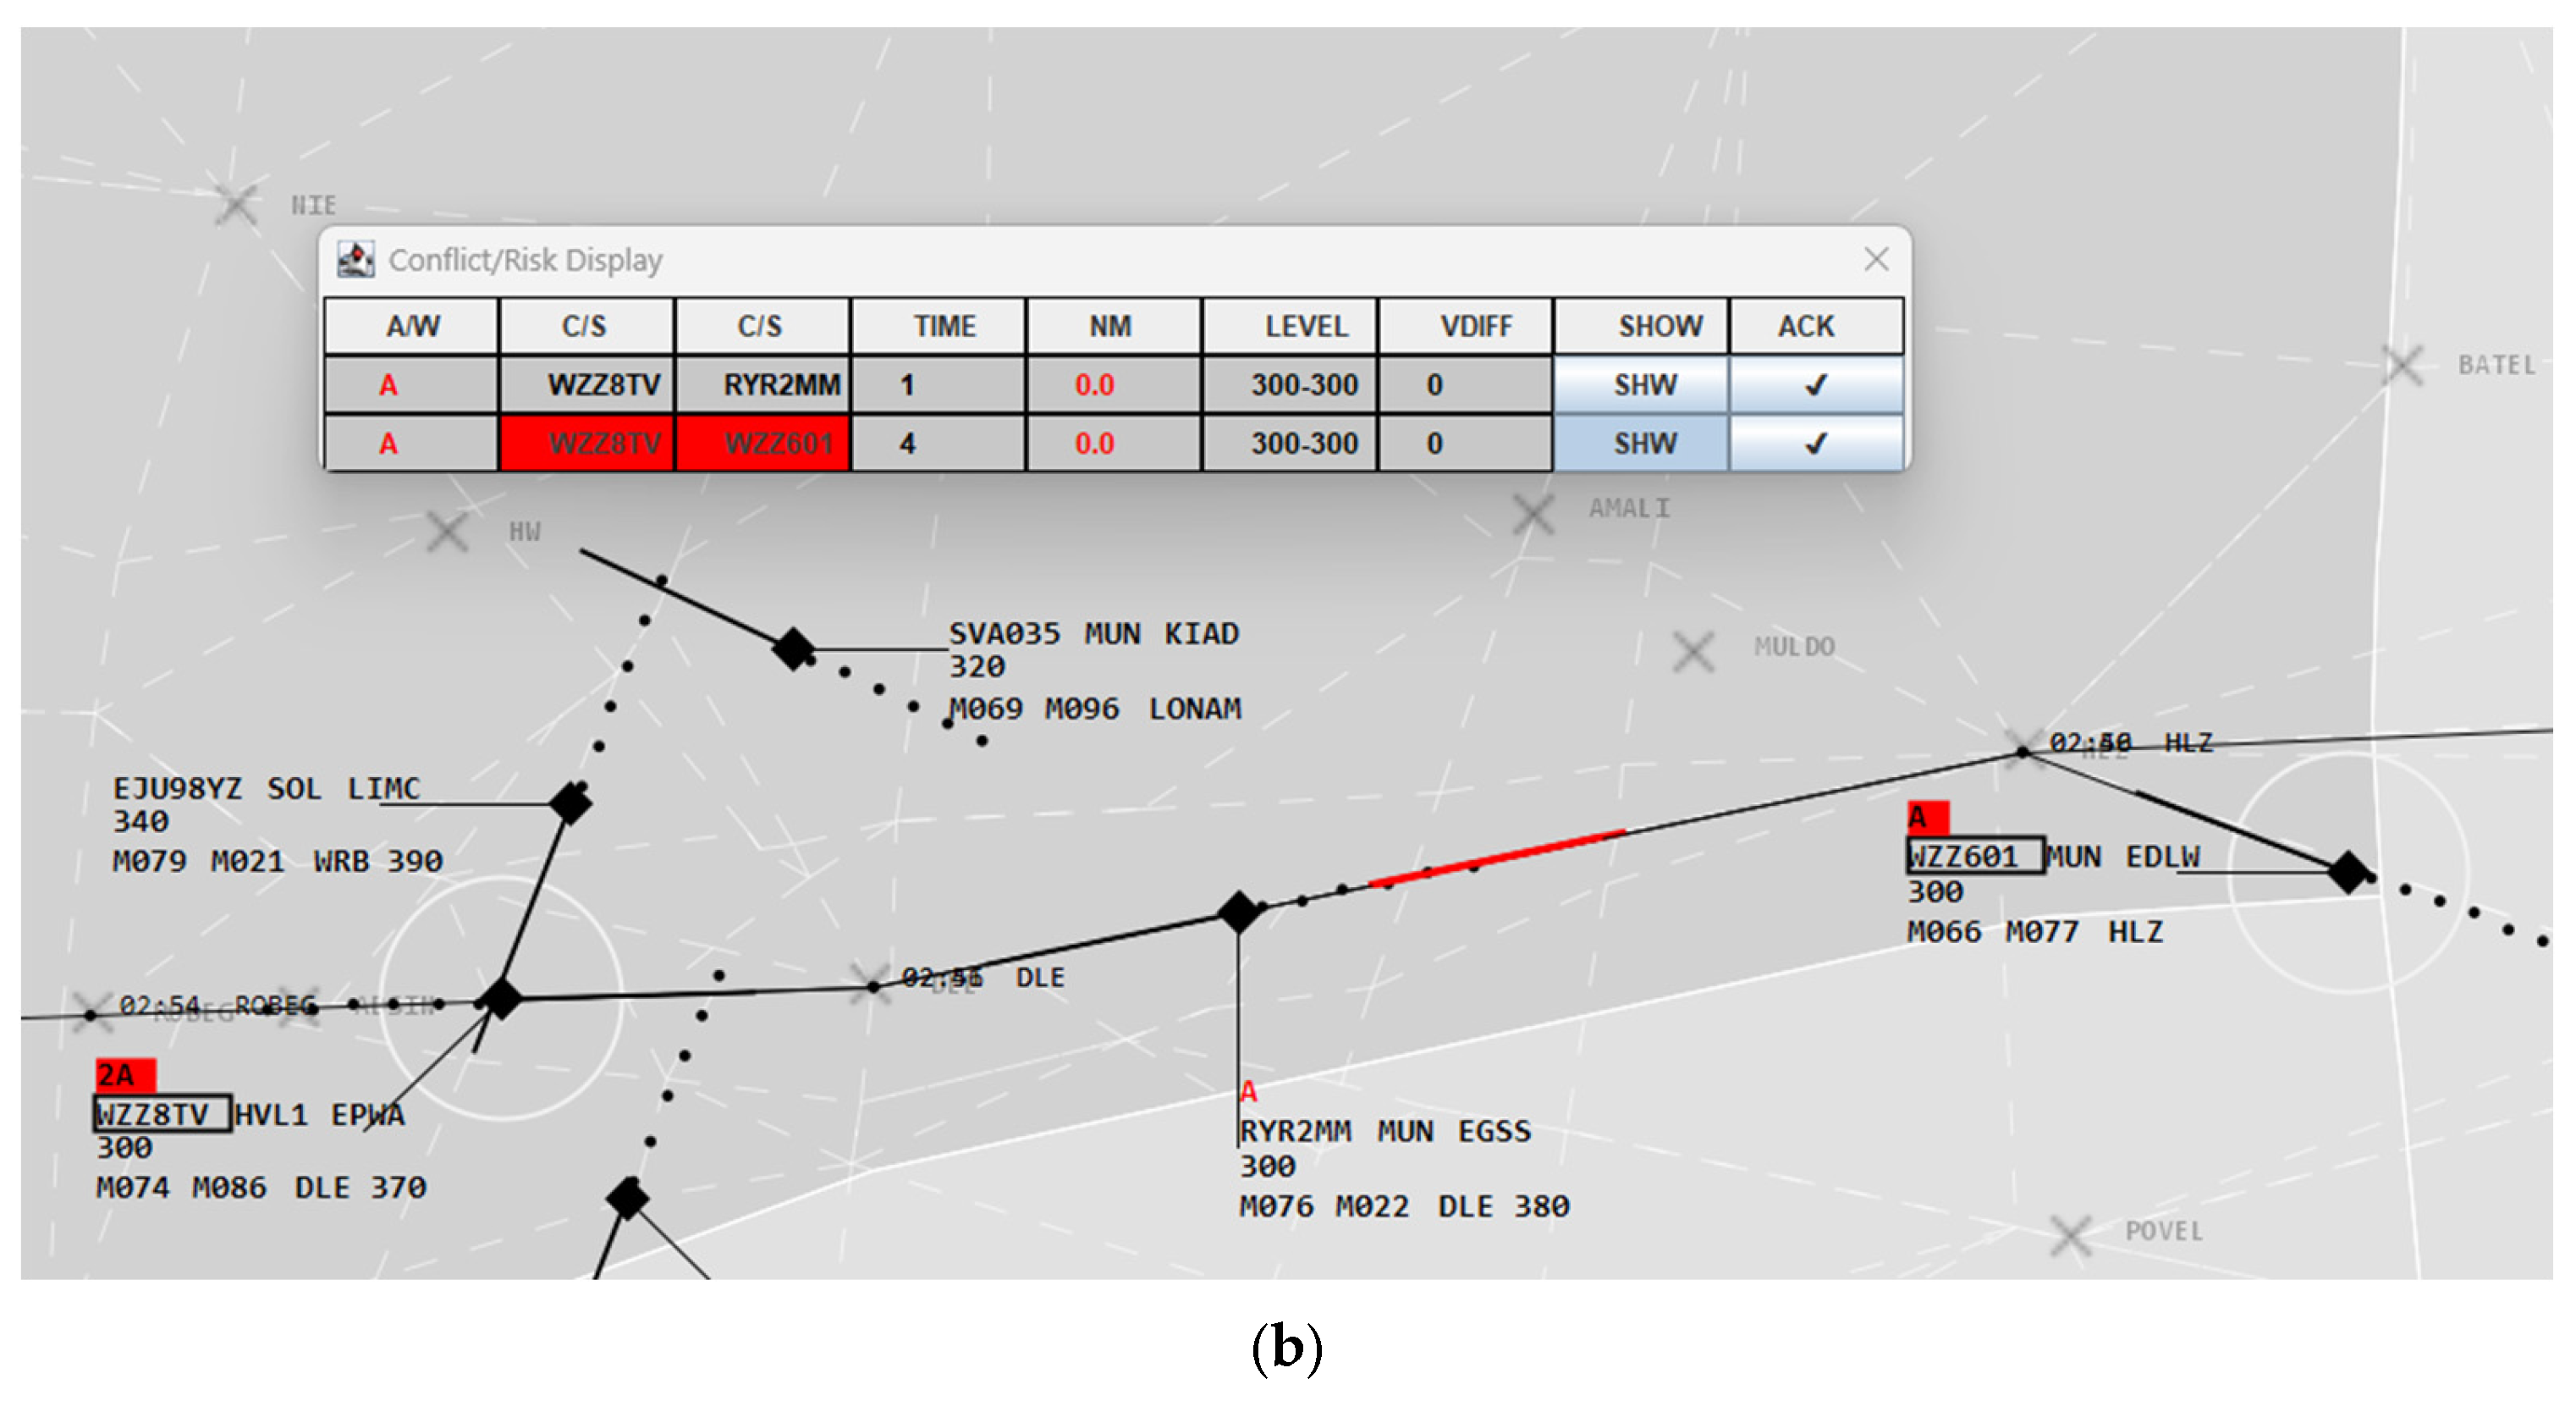
As a basis for the following example, real traffic data from 1 May 2017 for the time from 00:00 to 06:00 UTC with 432 flights with randomized callsigns was used from the airspace sector EDYYH5CL (Celle) and its surroundings. This dataset was used throughout the projects DIAL (Der Individuelle und Automatisierte Luftverkehr—Individual and Automated Air Traffic) and LOKI for the included real-time simulations with ATCOs. Therefore, we used the same data set for the case study presented here to ensure the compatibility of the results with the other parts of these projects. The disadvantage of real-world data is that they normally do not include any conflicts because they are already solved by the assigned controller. For demonstration purposes, artificial conflicts were added to the scenario by sending the flight WZZ601 from flight level 350 to 300. As the relevant time period for selecting the appropriate flow network, the time from 02:00 to 06:00 UTC was selected. The applied horizontal minimal separation was 7 NM and the vertical 1750 feet (2000—buffer). As examples, two conflict situations with minimal separation 0 NM were identified for RYR2MM at 2:40 (
Figure 7a) and WZZ601 at 2:45 UTC (
Figure 7b), both with flight WZZ8TV. The flights are shown at the moment when entering the sector with trajectories as black and the conflicting areas as red lines. In addition,
Figure 7b shows the relevant traffic situation in more detail. In the relevant part, both flights used the same route in the east–west direction. Only the time frame was different because the conflicting aircraft WZZ8TV had moved on and the conflict was much closer for WZZ601. Therefore, the area for evasive movements was more restricted for WZZ601 than for RYR2MM.
For the perception step, the available knowledge of airspace structure and traffic was aggregated (traffic restricted to sector boundary) and two example networks created with FNGen for the flight level intervals “250–350” (
Figure 2a) and “250–450” (
Figure 2b).
As part of the comprehension step, the minimal distance in NM for each flight of the selected traffic set to both networks (
Section 4.4, SSND metric) was calculated with FNUtil as well as the complexity values described in
Section 4.3.
Table 1 shows clearly that the trajectories between 2:00 and 6:00 are much closer to the second network than to the first. Since even the complexity is slightly lower for this network, it was selected as the actual ATCO-preferred (mental) network for all following calculations.
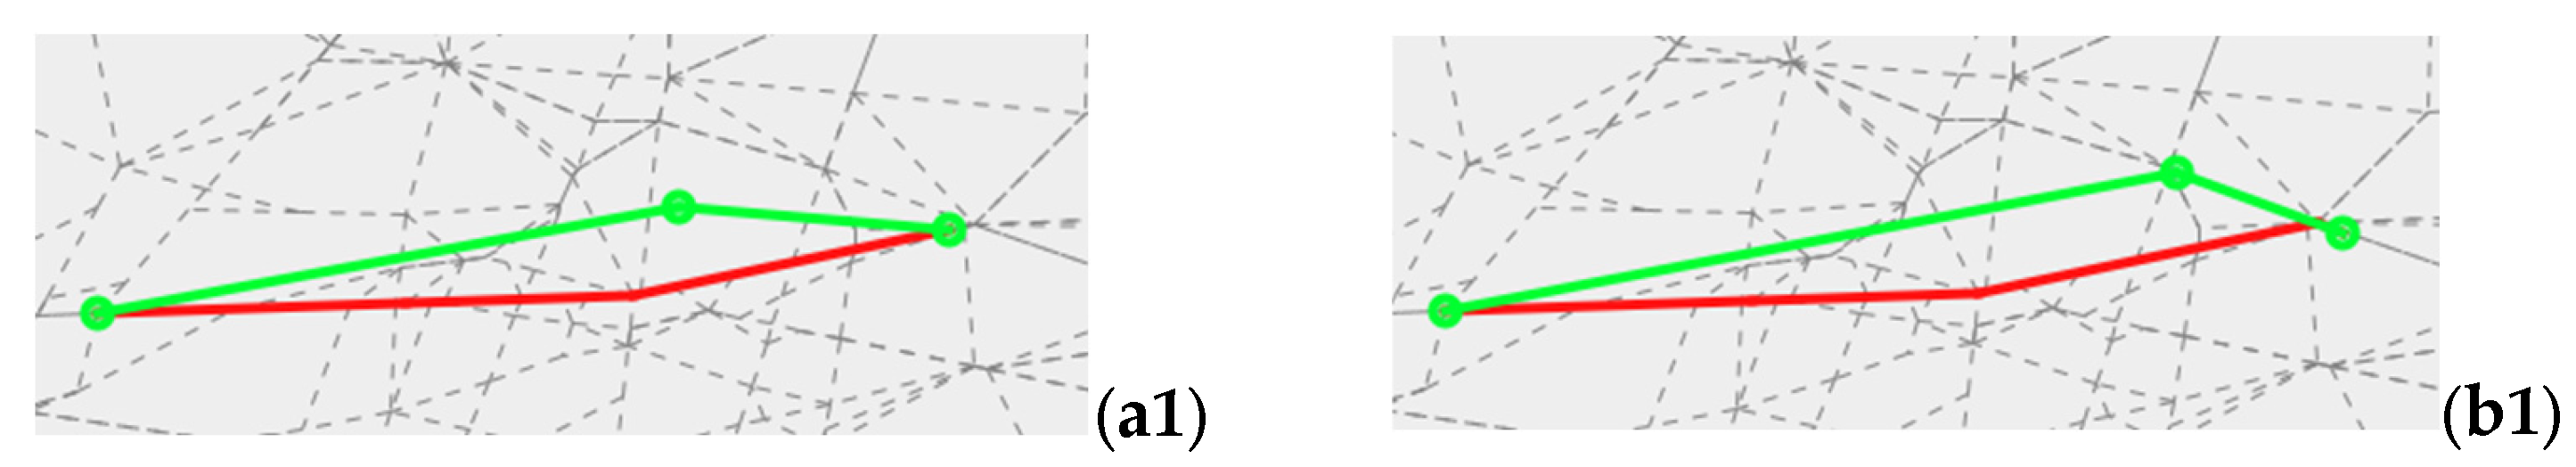
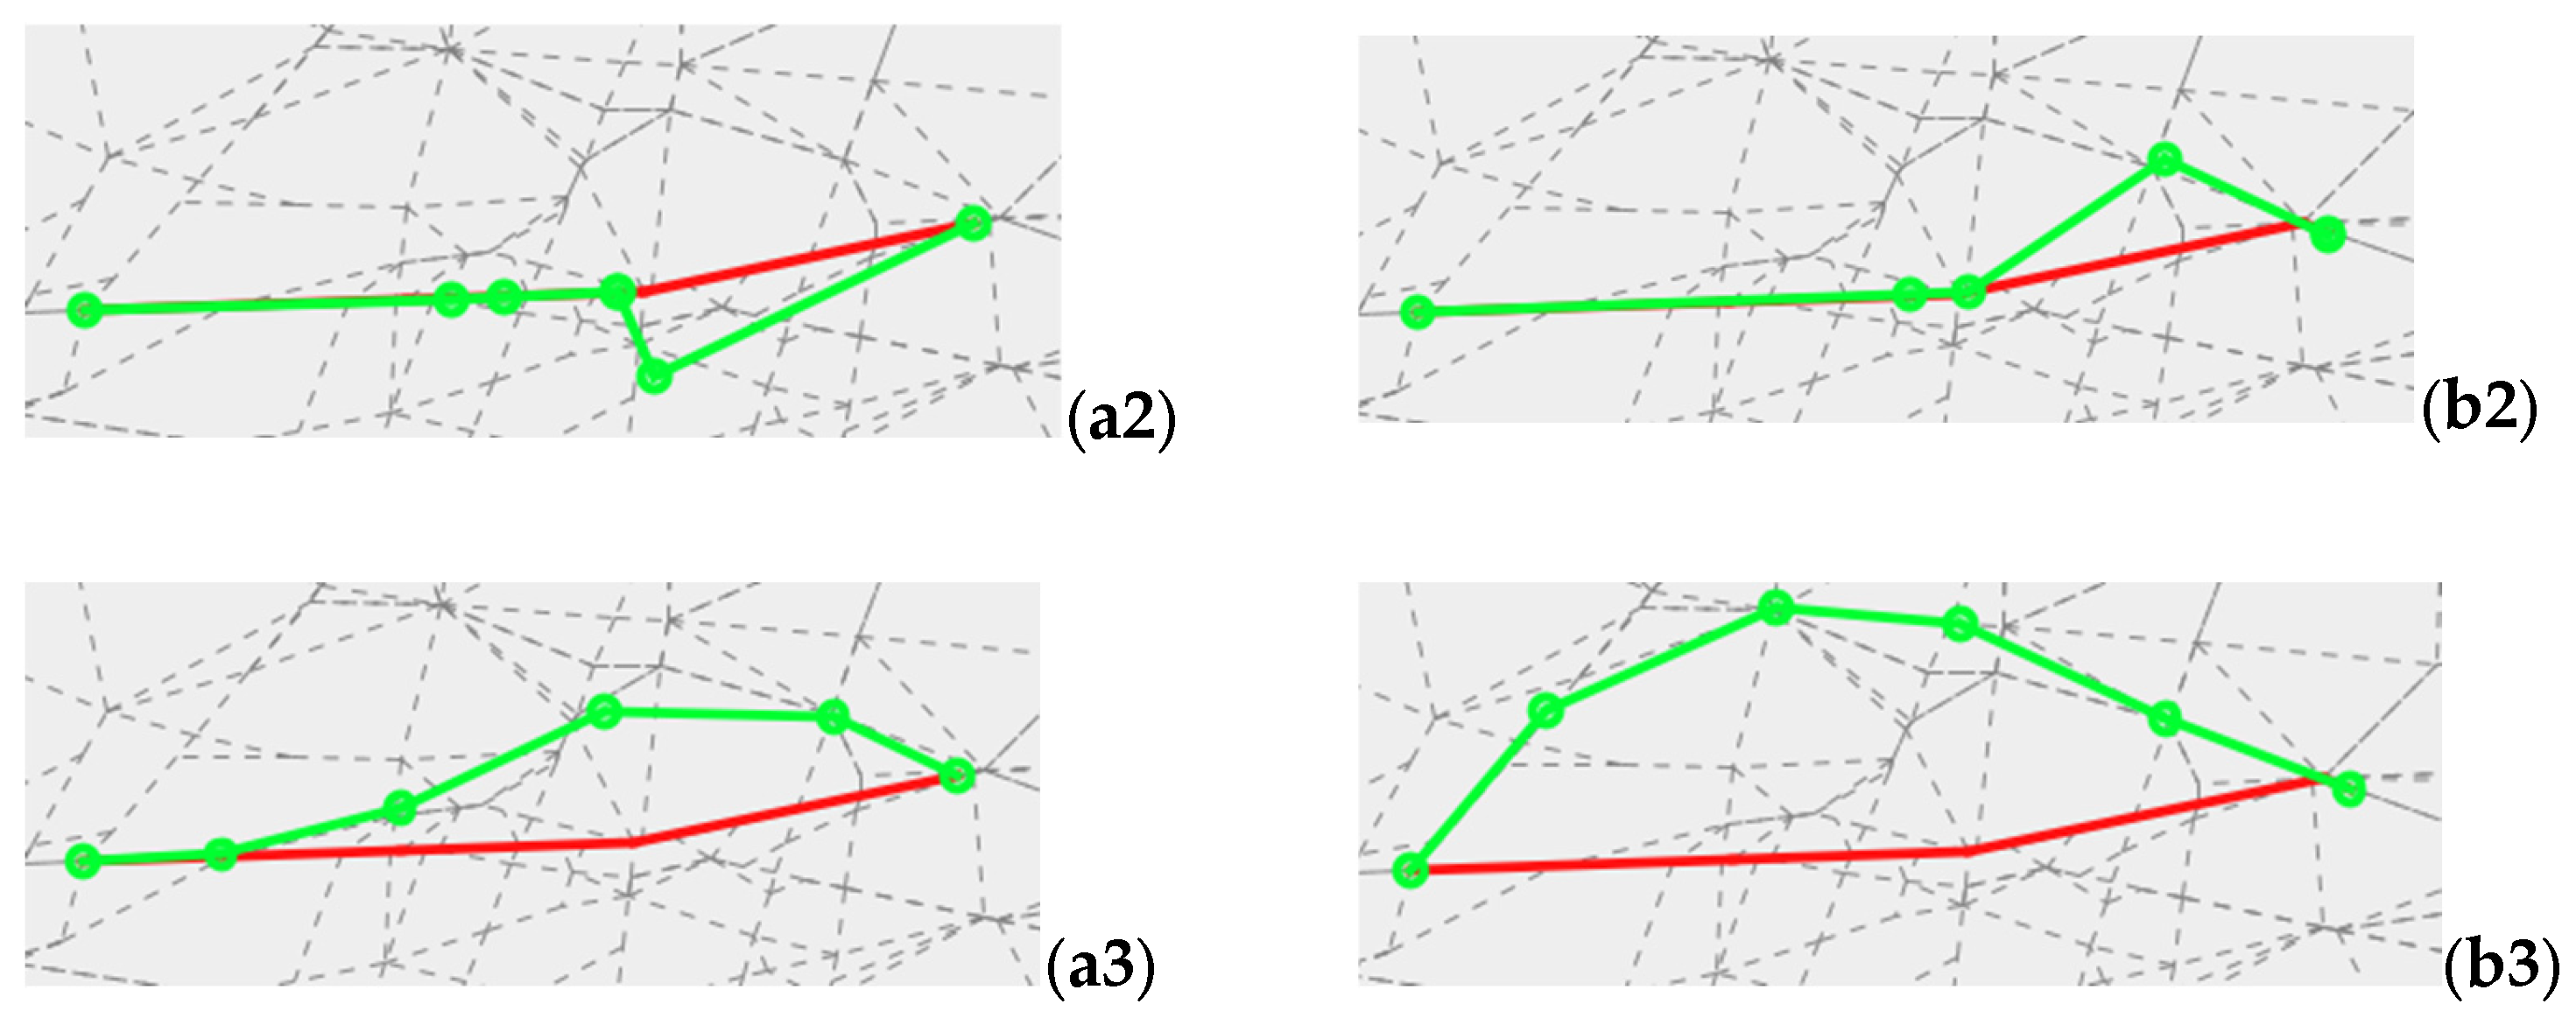
For the projection, three possible solutions were generated for each conflict with respect to trajectory “length”, “similarity” to the original trajectory, and taking the selected “network” into account. The results of the trajectory generation service are depicted in
Figure 8. For these trajectories, the similarity to the selected network was calculated with FNUtil and the complexity with FNComp (
Table 2). It is obvious that the short solutions do not represent the mental network at all, while sticking to the original trajectories automatically uses it more. When the focus is on the network, the trajectories look quite different and feature a longer detour using network links. The high values from FNComp for all trajectories except the “similar” version show that the traffic situation is dense, and leaving the original trajectory will increase the interference with other flights (
Section 4.3, Formula (2)). A closer look at the “similar” solutions reveals that they partially use the network as well, although this was not part of their trajectory optimization process.
As could be expected, the complexity is lowest for each trajectory when using as much as possible of the original trajectory and therefore the planned position in the traffic flow. In comparison, the short trajectories have the highest values for complexity and distance to the network because they neither take the flow of traffic nor the network into account. So, FNComp was able to analyze the traffic situation correctly and use this information to improve the SA. The network solutions stick close to the mental network but leave the original traffic flow in the east–west direction, therefore causing more interaction with traffic from different angles.
Table 3 shows the results given in minimum separation (NM) to the conflicting flight calculated with CoRA. The lower the values, the higher the conflict risk. Since the solution for WZZ601 depends on the selected trajectory for RYR2MM, they were all calculated based on the “network” solution for RYR2MM. It is obvious that using the network always leads to a higher distance between both flights, while the similar solution is always the closest to the lateral separation minimum of 7 NM because it follows the original trajectory as far as possible. As can be seen in
Figure 7b, there was a lot of crossing traffic for flight RYR2MM which had to be considered. So, the possibilities were limited to staying close to the original trajectory or accepting a considerable detour. With the focus on mimicking the behavior of an HA and considering the SA generated by the tools, the decision of the DA was to select the “network” solution for RYR2MM and the “similar” solution for WZZ601.
6. Conclusions and Future Work
This work tackles the challenge of developing shared situation awareness between a human and a digital ATCO. By doing so, it seeks to equip the digital ATCO with the ability to understand both the traffic situation and the actions of a human ATCO in managing air traffic—an aspect that has been lacking so far. We propose a framework to build digital situation awareness for a digital ATCO, drawing inspiration from Endsley’s model of situation awareness in dynamic decision-making [
21]. The digital SA aims to provide a comparable understanding of the traffic situation. To develop the digital SA, we identified the factors that influence human SA and are applicable to a DA’s situation awareness. Complexity was identified as the most important factor affecting the workload of human ATCOS and, therefore, the main factor influencing digital SA. Several tools were implemented to evaluate the complexity of a situation and to create a data-driven version of SA. As the most important knowledge for a shared SA, the mental model for handling the traffic flow via a mental flow network was discussed, and a method was presented to calculate these mental networks from historical data. Furthermore, a tool based on knowledge about flight directions, positions, and the relation of flights to each other was developed, which can be used to calculate complexity values for networks or single flights. These tools were linked to the digital situation awareness framework, and a workflow was created to build up SA. Finally, a step-by-step walkthrough for developing digital situation awareness using various tools proposed in this paper was presented as a case study for the digital air traffic controller task of “identifying and solving conflicts”.
As a future direction, there are research questions that need to be addressed. From a technical perspective, we must explore which methods and techniques can enhance the digital ATCOs’ perception about the situation by creating a principled way of selecting the most appropriate flight network from a set of given situations. Additionally, it is crucial to determine how this information can be effectively shared with human ATCOs without overwhelming them. Furthermore, there are questions regarding the empirical validation of this approach, which necessitates conducting a validation study involving human ATCOs. Systematic evaluation will help answer key questions, such as how digital situation awareness influences human–autonomy teaming. To investigate this aspect, a Human-in-the-Loop (HITL) validation study is planned for the end of the year involving 10 ATCOs. The upcoming study aims to thoroughly examine the performance and impact of human–digital teams using a series of real traffic scenarios.


