Abstract
The fuselage serves as the primary component of commercial aircraft. The strength reliability of fuselage panels is therefore crucial for commercial aircraft. In the present study, a finite element (FE)-based modeling approach has been developed to predict the post-buckling behavior of curved fuselage panels under combined axial compression and in-plane shear loads at different shear-to-compression ratios. The intra-laminar damage was replicated using a progressive damage model driven by the Hashin’s failure criteria, while the skin−stiffener debonding was modeled using the cohesive zone model. Failure tests were performed using a bespoke Fuselage Panel Test System (FPTS), enabling comparison between experiments and simulations. The predicted buckling loads and ultimate failure loads are in good agreement with those obtained from experiments, which verify the predictive capability of the FE model. The failure load of the panels was found to be at least 30% higher than the initial buckling loads for all loading cases, indicating significant post-buckling load-carrying capacity. Under these four loading conditions studied, the load transfer mechanisms of curved panels were examined. All specimens experienced local skin buckling and subsequent global buckling, resulting in skin−stiffener debonding followed by fracture of the stiffeners, which was the dominant failure mechanism for the panel studied.
1. Introduction
Composite stiffened panels are a fundamental structural component in modern aircraft, serving as the primary load-bearing element of the fuselage. During flight, these panels are subjected to a complex combination of tensile, compressive, shear, bending, and internal pressure loads. Upper fuselage panels primarily endure compression-shear combined loads, and lower fuselage panels typically withstand tension-shear combinations. The compression-shear combined loading condition represents the most critical scenario for structural stability, as it can induce buckling even when both individual load components remain below their respective critical thresholds [1]. Consequently, panel testing plays a critical role in the hierarchical validation process of aircraft structures. To accurately assess the strength performance of these panels, it is essential to account for the intricate interplay of these loads during testing. Extensive research has been conducted on the buckling and post-buckling behavior of stiffened panels under individual loads, such as pure shear or pure compression [2,3,4,5]. However, simulating combined loads in experimental settings has proven challenging due to limitations in testing technology. Traditionally, complex load boundaries have only been achievable through full-scale component structures, such as cylinder sections and box sections [6,7].
The high manufacturing costs associated with full-scale components present significant challenges to aircraft development. Consequently, there has been a growing focus on testing techniques and apparatus for curved panels under complex loading conditions. The NASA Langley Research Center’s Structures and Materials Laboratory has made significant contributions to this field through the development of the Combined Loads Test System (COLTS) [8,9,10,11,12,13,14,15]. Similarly, the Federal Aviation Administration (FAA) and NASA developed the Full-Scale Aircraft Structural Test Evaluation and Research (FASTER) facility [16]. In 2006, Boeing introduced the E-fixture test device [17], which aims to replicate the loads experienced by fuselage panels during flight. The German company IMA has developed a series of panel test devices, with the latest generation capable of simulating the complex loads experienced by fuselage panels during flight [18]. Zang et al. designed a composite load test device for fuselage panels [19,20,21,22,23].
Furthermore, due to the complex post-buckling failure mechanism of composite stiffened panel structures, which is influenced by numerous factors and lacks accurate and effective analysis methods, only conservative design criteria can be used in engineering design to cover the analysis errors and the limitations of understanding. Therefore, conducting in-depth research on the post-buckling failure mechanism of composite stiffened panels in aviation, and developing practical failure prediction and evaluation methods for engineering applications, will help in the effective application of composite stiffened panel post-buckling design in aviation structures. This is of great significance for further weight reduction and enhancement of load-bearing efficiency of composite structures [24]. Consequently, extensive research efforts have been devoted to understanding the buckling and progressive failure of stiffened fuselage panels through both experimental and numerical approaches. Current studies primarily focus on the post-buckling behavior of stiffened panels under uni-axial loading [25,26]. Systematic evaluations of buckling loads and failure modes have been conducted for various stiffener configurations [27,28,29]. Zhang’s comparative study analyzed I- and T-shaped stringers using FEM and engineering methods [5], establishing bearing capacity correlations. Duarte [30] conducted an in-depth numerical study on the influence of stinger cross-section on the mechanical behavior of curved stiffened panels under compression. Numerical analysis was carried out to research the post-buckling behavior on cylindrical panels with different radius/thickness ratios and boundary conditions. Comparative evaluations of flat versus curved composite plates under shear and bending have also been conducted [31,32]. Mahdy’s numerical work addressed combined compression and torsional loading effects on composite cylindrical shells [33]. Abramovich’s experimental-numerical program investigated J-stringer panels under compressive loads [34]. Kumar [35] studied the influence of stringer’s geometry and shape on the buckling and post-buckling behavior of curved stiffened composite panels.
However, research on large-scale curved fuselage panels under combined loads remains limited due to the high cost and complexity related to manufacturing and the technical challenges associated with curved panel testing. Li [36] adopted theoretical and finite element analysis to predict the buckling load and capacity of fuselage panels. The influence of BVID damage was also considered. Li [37] studied the complex stress field test technology of large fuselage panels with opening holes, and developed a set of multi-load application test facilities. Chai Yanan et al. (patents (1–4)) created the Fuselage Panel Complex Load Test Device (FPTS), which is based on a self-balancing shear frame concept. Deng [38] conducted verification work on the FPTS apparatus under multi-axis loading, and the results showed that the strain data are uniform in uni-axial loading experiments and satisfy the superposition principle for small deformation in multi-axial loading experiments. This validation confirms the system’s capability to apply decoupled multi-axial loading without significant cross-component interference.
This study focuses on the failure analysis of fuselage panels under pure shear, pure compression, and two combinations of shear and compression with different load ratios. A finite element (FE)-based approach was developed to predict the post-buckling behavior and failure modes of curved fuselage panels under uni-axial and multi-axial loads. Panel testing was conducted using FPTS. Simulation results were in good agreement with experimental data, which validates the effectiveness of the FE model. The post-buckling behavior and failure modes of the fuselage panels were investigated under four distinct loading conditions. During the post-buckling phase, a progressive load transfer to the stiffeners was observed. The experimental and numerical results demonstrate that the global buckling-induced waviness contributes to the skin−stiffener debonding, which results in the final failure of the panel.
2. Experiment
2.1. Specimen Configuration
The fuselage panel consists of a composite fuselage skin with hat-shaped stiffeners, comprising a total of four panels. All the specimens were produced using autoclave-curved Carbon/Epoxy prepregs. The dimensions of the specimen are illustrated in Figure 1. The total length is 3100 mm, the overall width (curvilinear length) is 2150 mm, and the radius is 3000 mm. The specimen features five frames and eight stringers, with a spacing of 210 mm between stringers and 620 mm between frames. The single-layer thickness of the composite material is 0.186 mm, and the material properties are detailed in Table 1 [39]. These properties include the elastic modulus E11 and E22, the in-plane Poisson’s ratio v12, the longitudinal tensile and compressive strengths XT and XC, the transverse tensile and compressive strengths YT and YC, the in-plane shear modulus G12, the in-plane shear strength S12, the Interlaminar Tensile Strength SN, and the critical energy release rates GIC and GIIC. The stacking sequences for the specimen are provided in Table 2, with the 0° layers aligned along the stringer direction. The fuselage frames are constructed using a combination of L-shaped and Z-shaped profiles. The stringers and skin are fabricated using a co-bonding technique, while the frames are mechanically fastened to the skin via bolted connections.
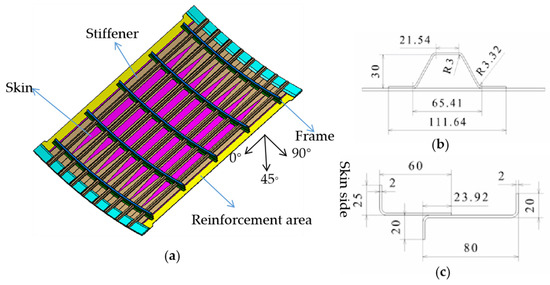
Figure 1.
(a) Fuselage panel specimen. (b) Cross-section of the hat stiffener. (c) Cross-section of the frames.

Table 1.
Mechanical properties of composite.

Table 2.
Lay-ups sequences of fuselage panels.
2.2. Test Facility and Procedures
Figure 2 illustrates the Fuselage Panel Test System (FPTS, developed by Aircraft Strength Research Institute of China, Xi’an, China). The testing setup is composed of three main parts: the compression loading component, the shear loading component, and the V-shaped support component, as shown in Figure 3. In this apparatus, axial tensile and compressive loads are applied through two actuators, both connected to a support beam and a loading beam, as illustrated in Figure 3a. When activated, the actuators drive the loading beam along precision linear guide rails, enabling controlled and accurate load application. The curved ends of the test specimen are fastened to the fixtures using mechanical fasteners, simulating fixed boundary conditions, while the straight edges are connected to V-shaped components that provide simple support constraints.
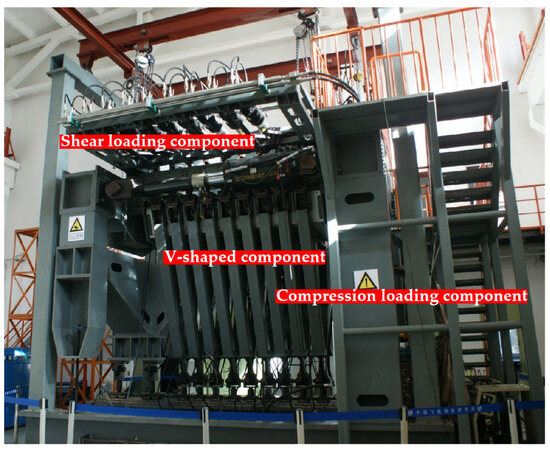
Figure 2.
Fuselage panel test system.
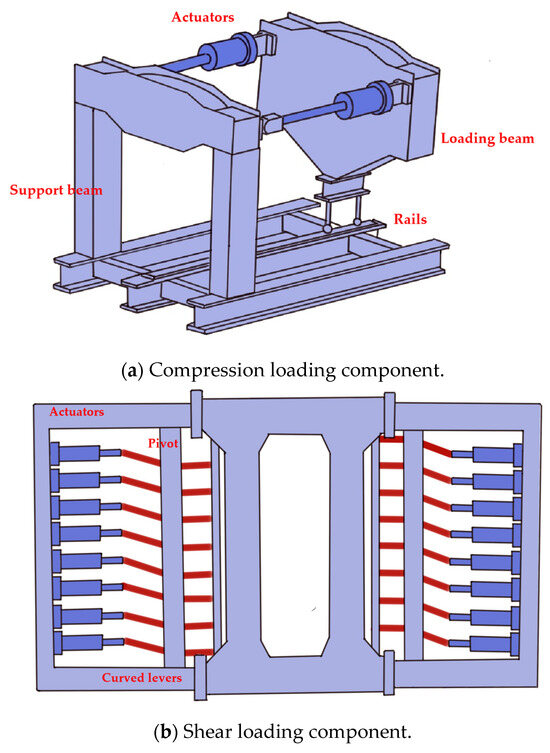
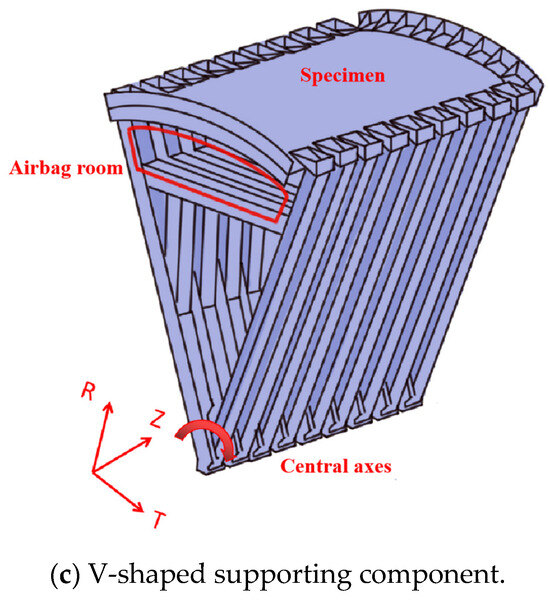
Figure 3.
Components of the fuselage panel test system.
The application of shear loads is divided into active and passive loading mechanisms. A multi-point distributed shear load is applied along the straight edges of the specimen, while the curved edges are loaded via the actuators with curved levers rotating around their pivots to change the direction of the force [40], as shown in Figure 3b. The support end of the specimen is fixed to provide passive shear resistance. It is worth mentioning that as illustrated in Figure 3c, the V-shaped components are designed to rotate around the Z-direction and slide along the Z-direction, ensuring uniform distribution of shear loads across all four edges of the specimen. There is an airbag room in the V-shaped support component, which provides air pressure for the test specimen. For further details on the design and operational principles of this apparatus, refer to patents (1–4).
During the test, strain measurements were conducted using strain gauges. Figure 4 and Figure 5 show the locations of the strain gauges. The strain gauges on the skin were installed in a back-to-back configuration. The strain gauge numbering convention on the skin is as follows:
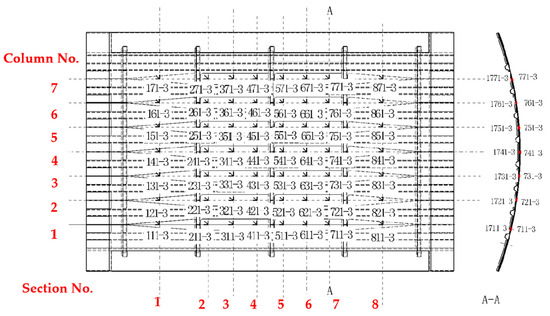
Figure 4.
Locations of the strain gauges on the skin.
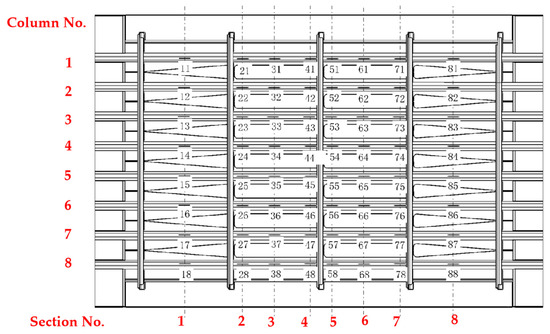
Figure 5.
Locations of the strain gauges on the stiffeners.
- The first number is the cross-section number.
- The second number is the column number.
- The third number is the orientation of the strain gauge. Gauge 1 (0°) aligns with the axial direction of the stiffeners, Gauge 2 (45°) corresponds to the 45° direction, and Gauge 3 (90°) aligns with the circumferential direction of the specimen.
- The strain gauges on the inner surface of the skin were systematically numbered by prefixing a ‘1’ to the corresponding gauge numbers on the outer surface.
The experiments described in this study include four load cases: pure compression, pure shear, and two different combined load cases. The reference loads are presented in Table 3. For each load case, the experimental procedure was conducted as follows:

Table 3.
One hundred percent of the loads under four loading cases.
- Preliminary test: The load was incrementally increased in steps equal to 5% of the reference load (as shown in Table 3) until it reached 30% of the reference load.
- Buckling load test: The load was increased in steps of 5% of the reference load until it reached 70%. Beyond this point, the load was increased in steps of 2% until buckling occurred, as determined by strain data.
- Destructive test: The load was increased in steps of 5% of the reference load until it reached 70%. Subsequently, the load was increased in steps of 2% until the fuselage panel experienced failure.
At each step, the load was maintained for 3 s before strain measurements were recorded. Strain values were acquired using the ST-24 Data Acquisition System, which has a measurement accuracy of ±1% of the reading.
3. Numerical Modeling
3.1. Finite Element (FE) Model of Composite Fuselage Panel
The comprehensive finite element model of the test specimen, depicted in Figure 6, is constructed using a cylindrical coordinate system in ABAQUS/Standard (6.14 version). The skin, stiffeners, and frame are modeled with four-node shell elements (CS4R), while the radius fillets within the hat stiffener are represented using 3D eight-node solid elements (C3D8R). Cohesive elements are incorporated to accurately simulate the interfacial behavior between the skin and stringers. Furthermore, the constraints are applied to enforce proper connectivity between the skin and reinforcement plates, as well as between the frame and stiffeners, ensuring a realistic representation of the structural interactions.
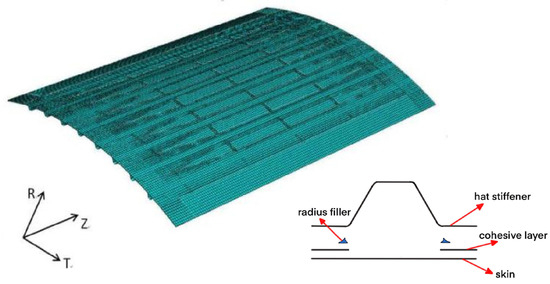
Figure 6.
FEM model of fuselage panel.
Under pure compression loading conditions, the rotational and translational degrees of freedom (DOF) for both the bottom end and the loading end are illustrated in Figure 7 and detailed in Table 4 Since the V-shaped components are designed to rotate around the Z-direction and slide along the Z-direction. The reinforcement areas on both sides are constrained in the translational degree of freedom along the R-direction and the rotational degree of freedom along the T-direction.
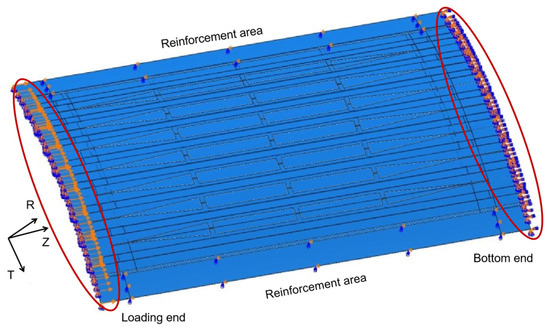
Figure 7.
Compressive load and boundary conditions.

Table 4.
The rotational and translational DOF under pure compression load case.
Under pure shear loading conditions, the rotational and translational degrees of freedom (DOF) for all four edges are illustrated in Figure 8 and detailed in Table 5. The shear load is applied to the entire specimen through shear flow, exerted on three edges, while the bottom end remains fixed.
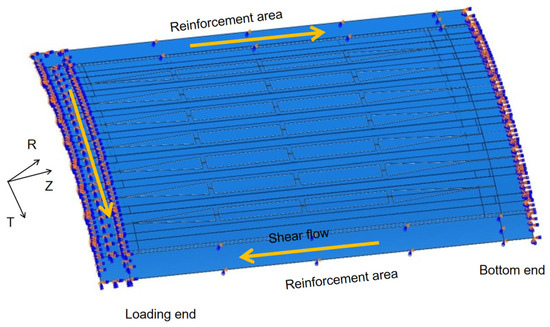
Figure 8.
Shear flow and boundary conditions.

Table 5.
The rotational and translational DOF under pure shear load case.
Under combined loading conditions, the rotational and translational degrees of freedom (DOF) for all four edges are illustrated in Figure 9 and detailed in Table 6. The shear load is applied to the specimen in the same manner as in the pure shear load case. Simultaneously, a reference point is coupled with the loading end of the specimen to facilitate the application of compressive loads.
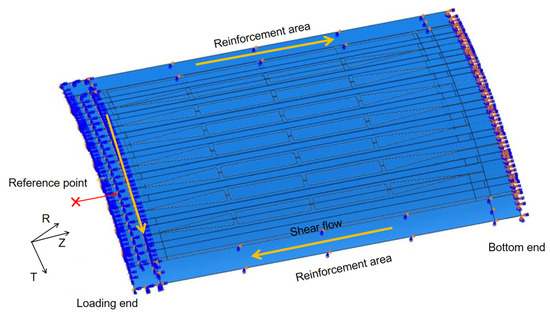
Figure 9.
Combined load and boundary conditions.

Table 6.
The rotational and translational DOF under combined load case.
3.2. Intralaminar Damage Modeling
In this study, Hashin’s failure criterion, incorporating stiffness matrix degradation, was employed to accurately simulate the failure behavior of both the stiffener and the skin. This criterion comprehensively accounts for tensile and compressive damage modes in both the fiber and matrix phases, providing a robust framework for predicting progressive failure in composite structures [28].
Fiber tensile mode ():
Fiber compressive mode ():
Matrix tensile mode ():
Matrix compressive mode ():
Here, represents the components of the stress tensor, while X, Y, and S denote the material strengths, as specified in Table 1.
This study employs a constant degradation model based on Continuum Damage Mechanics (CDMs) to simulate the progressive degradation of composite materials. Upon failure at a material point, the stress−strain relationship is defined as follows:
Here, Cd denotes the matrix of stiffness after material degradation.
The damage variables d1 and d2 are employed to characterize the degradation of the fiber and matrix, respectively. A value of 0 indicates undamaged material, while a value of 0.98 represents fully damaged material.
3.3. Interlaminar Damage Modeling
To simulate the interfacial behavior between the skin and stiffeners, cohesive elements based on the quadratic stress criterion, were implemented to predict the initiation of skin−stiffener debonding under complex loading conditions. The cohesive properties include normal strength N, tangential strength T, and shear strength S. The quadratic stress criterion is mathematically expressed as Equation (7) and provides a framework for evaluating interfacial failure onset.
where, N, S, and T are listed in Table 7 [39], denoting the strengths in the corresponding direction.

Table 7.
Mechanical properties of the adhesive of Carbon/Epoxy.
The mixed mode power-law criterion in Equation (8) was employed to determine the damage evolution of debonding.
, , and represent the work carried out by traction forces along with their corresponding relative displacements. , , and denote the critical fracture energies required to induce failure in the normal and two tangential directions, respectively. Upon damage initiation, the cohesive elements follow the constitutive relationship defined by Equation (10), as follows:
D is the damage variable describing the damage evolution of the interface, following the equation below:
4. Results and Discussion
4.1. Compression
During the compression load test, the initial buckling load was measured at 1486.8 kN, while the failure load was recorded as 2166.5 kN. The ultimate load capacity exceeded the initial buckling load by 45.72%. The finite element analysis (FEA) predicted a buckling load of 1410.23 kN and a failure load of 2017.53 kN, resulting in relative errors of −5.17% and −6.88%, respectively. The post-buckling behavior of the test specimen under compressive loading is illustrated in Figure 10. As the external load increased, the primary buckling in the central area of the skin propagated along the loading axis. The initial buckling point was identified at gauge No. 241. Figure 11 provides a comparative analysis of the load-strain curves obtained from the finite element method and the experimental data for this location. The strain values exhibited a linear increase with the applied load until buckling occurred. As shown in Figure 11, the skin buckling caused a sudden and significant divergence in the back-to-back values, indicating the onset of instability.
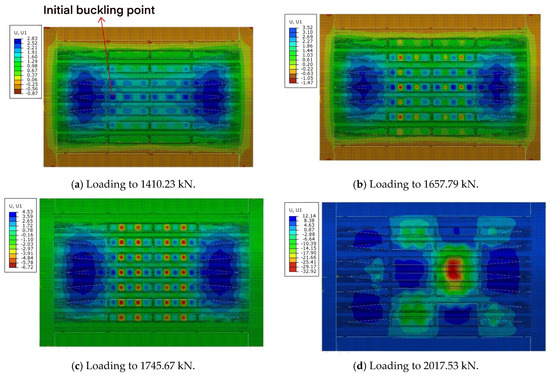
Figure 10.
The displacement of R−direction in post-buckling progression of test specimen under compressive load. (a) Initial buckling at 1410.23 kN. (b) Loading to 1657.79 kN. (c) Loading to 1745.67 kN. (d) Loading to 2017.53 kN.
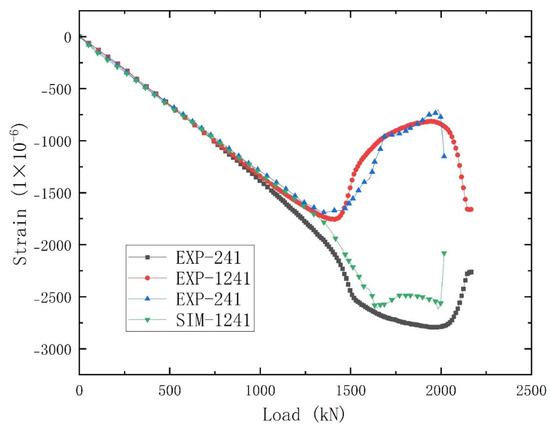
Figure 11.
Load−strain curve of simulation and experiment for initial buckling point (No. 241) under compressive load.
Figure 12a displays strain readings from four additional skin regions. When the load reached 1839 kN, a second buckling point appeared in the strain curves of the panel skin. Figure 12b shows the axial strain readings on the top of the stiffeners adjacent to selected points on the skin. These readings provide critical insights into the load transfer mechanisms between the skin and stiffeners. Since the compressive loading capacity of the skin decreases after the skin buckles, the stiffeners begin to bear the majority of the compressive load, which can be observed by the increase in the tangent of the axial compressive strain curves after buckling. When the loads reached about 1879 kN, the stiffeners began to buckle, which is 2.17% higher than the second buckling load of the skin. The buckling of the skin and stiffeners indicates the onset of global structural instability.
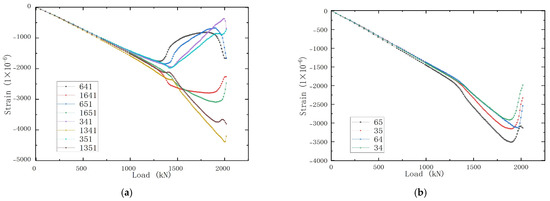
Figure 12.
Typical load−strain curves of experiment for skin and stiffeners in central area. (a) Load-strain curves obtained from the skin. (b) Load-strain curves obtained from the stiffeners.
Figure 13 presents the progressive debonding between the stiffeners and skin as simulated by FEM. When loading to 1915.48 kN, interfacial debonding initiates, which is dominated by shear stress at the skin−stiffener interface, as shown in Figure 13a. With the increasing applied load, the debonding area exhibited progressive expansion. The final debonding area is shown in Figure 13b.

Figure 13.
Interfacial debonding of skin and stiffeners in FEM under pure compression. (a) Initial debonding at 1915.48 kN. (b) Final debonding area at ultimate load.
After the fuselage experienced secondary buckling and interfacial debonding, skin wrinkling and structural failure quickly ensued. The failure mode of the test specimen under compressive loads exhibited wrinkling on the outer skin surface, delamination of the skin from the stiffeners at the failure section, and compressive failure of the stiffeners, as shown in Figure 14.
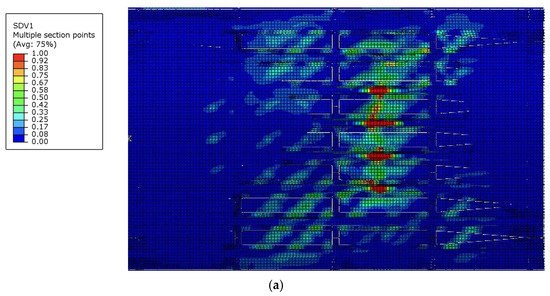
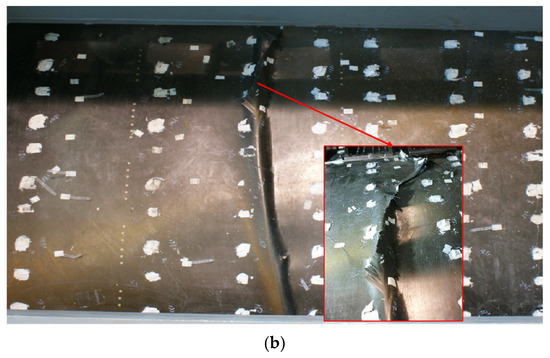
Figure 14.
Comparison of failure modes in the experiment and finite element analysis under compression load case. (a) Fiber compressive failure (corresponding to state variable SDV1) in finite element analysis. (b) Failure mode in the experiment.
4.2. Shear
Under pure shear loading conditions, the experimental initial buckling load was measured at 684.6 kN, with the ultimate failure load reaching 1019.2 kN. The ultimate load capacity exceeded the initial buckling load by 48.88%. The finite element analysis (FEA) predicted an initial buckling load of 712.95 kN and a failure load of 1094.17 kN, resulting in relative discrepancies of 4.13% and 7.36%, respectively. The post-buckling behavior of the specimen under compressive loading is depicted in Figure 15. The initial buckling point for the panel under this loading condition was identified at strain gauge No. 461. Figure 16 presents a comparative analysis of the load-shear strain curves derived from FEM simulations and experimental data for this location, along with the corresponding back-to-back strain readings. The strain values demonstrated a linear increase with the applied load until buckling initiation. As illustrated in Figure 16, skin buckling induced a sudden and pronounced divergence in the back-to-back strain values, marking the onset of structural instability.
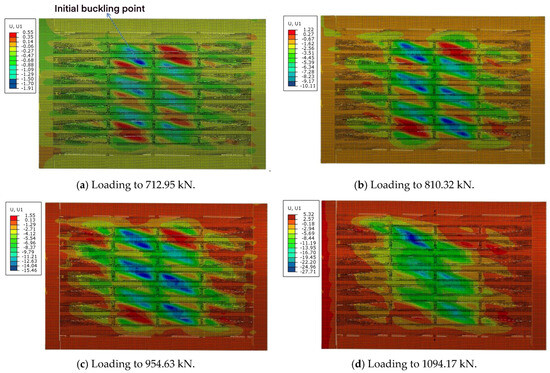
Figure 15.
The displacement of R−direction in post-buckling progression of test specimen under pure shear in FEM. (a) Initial buckling at 712.95 kN. (b) Loading to 810.32 kN. (c) Loading to 954.63 kN. (d) Loading to 1034.17 kN.
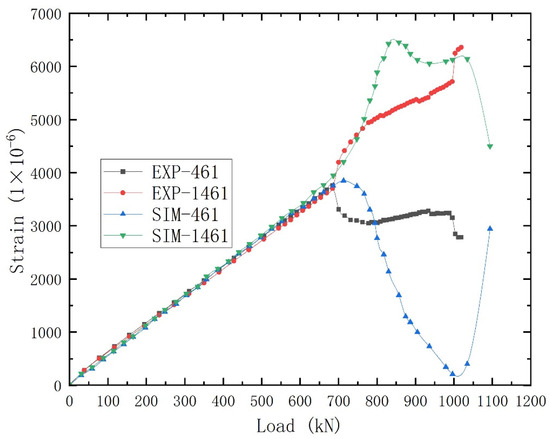
Figure 16.
Load−strain curve of simulation and experiment for initial buckling point (No. 461) under pure shear load case.
Figure 17a displays shear strain readings from four additional skin regions. When the load reached 772.6 kN, second inflection points appeared in the strain curves of the panel skin, indicating the occurrence of secondary buckling at these locations. Figure 17b displays the axial strain readings measured at the top of the stiffeners, specifically at locations adjacent to selected points on the skin. Due to the very low slope of the load-strain curves for the stringer, it can be inferred that the stringers were initially subjected to minimal load transfer. This suggests that the majority of the shear load was still being carried by the skin prior to its buckling. The gradual increase in the slope of the stringers’ load-strain curves after skin buckling indicates a progressive transfer of load from the skin to the stringers, with some stringers transitioning into compression while others experienced tension. As the shear load increases, localized shear buckling progressively propagated and merged along diagonal directions, leading to the emergence of secondary buckling in central regions, as indicated by the strain distribution simulated by FEM. This phenomenon resulted in a redistribution of stresses, with some areas experiencing a significant secondary buckling.
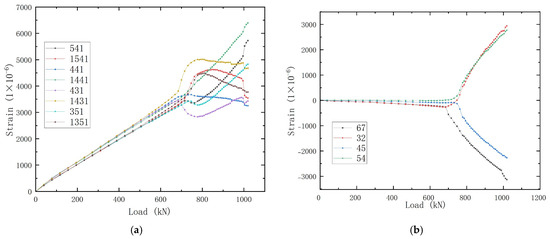
Figure 17.
Typical load−strain curves of experiment for skin and stiffeners in central area under pure shear load condition. (a) Load-strain curves obtained from the skin. (b) Load-strain curves obtained from the stiffeners.
Figure 18 presents the progressive debonding between the stiffeners and skin. When the load reached 845.80 kN, interfacial debonding initiates, which is dominated by shear stress at the skin−stiffener interface, as shown in Figure 18a. The final debonding area is shown in Figure 18b.

Figure 18.
Interfacial debonding of skin and stiffeners in FEM under pure shear. (a) Initial debonding at 845.80 kN. (b) Final debonding area at ultimate load.
The ultimate failure mode of the specimen under shear loading was characterized by diagonal fractures propagating through both the stringers and the skin, coupled with extensive debonding at the skin−stringer interfaces, as illustrated in Figure 19. This failure pattern highlights the complex interaction between shear-induced fracture and interfacial delamination, providing critical insights into the failure mode of fuselage panel under shear-dominated loading conditions.
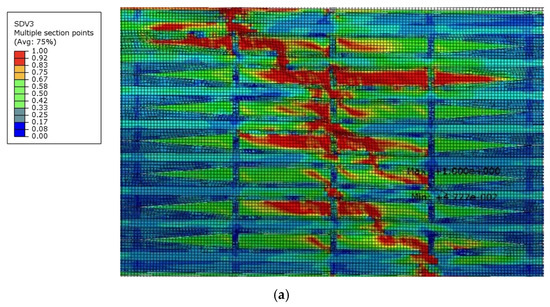
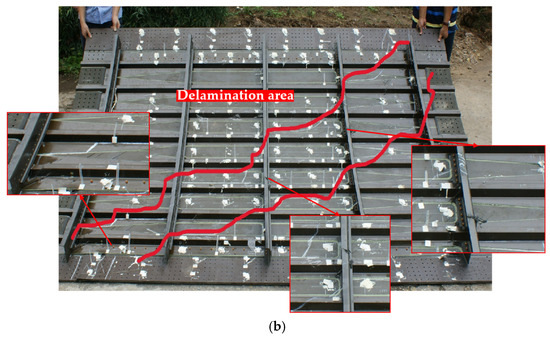
Figure 19.
Comparison of failure modes in the experiment and finite element analysis under shear load case. (a) Matrix tension failure (corresponding to state variable SDV3) in finite element analysis. (b) Failure area in the experiment with debonding regions highlighted by the red line.
4.3. Combined Load Case A
During the combined load case A, the initial buckling load was 881.82 kN (in compression), while the failure load was 1244.12 kN (in compression). The ultimate load capacity exceeded the initial buckling load by 41.09%. In the finite element analysis, the buckling load was determined to be 937.84 kN, and the failure load was 1294.28 kN, with discrepancies noted as 6.35% and 4.10%, respectively. The post-buckling progression of the test specimen under combined load case A is illustrated in Figure 20. The initial buckling point of the purely compressed curved plate is located at gauge No. 351. And Figure 21 presents a comparative analysis of the load-strain curves between the finite element method and the experimental data at the initial buckling point.
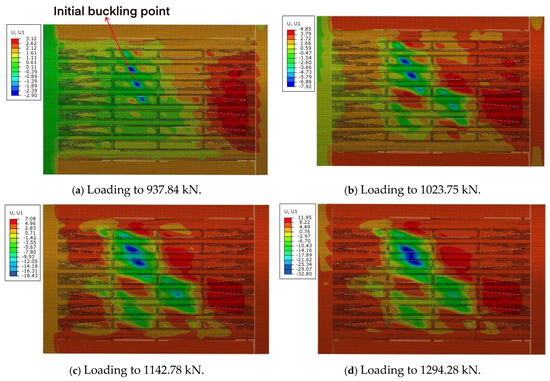
Figure 20.
The displacement of R−direction in post-buckling progression of test specimen under combined load case A. (a) Initial buckling at 937.84 kN. (b) Loading to 1023.75 kN. (c) Loading to 1142.78 kN. (d) Loading to 1294.28 kN.
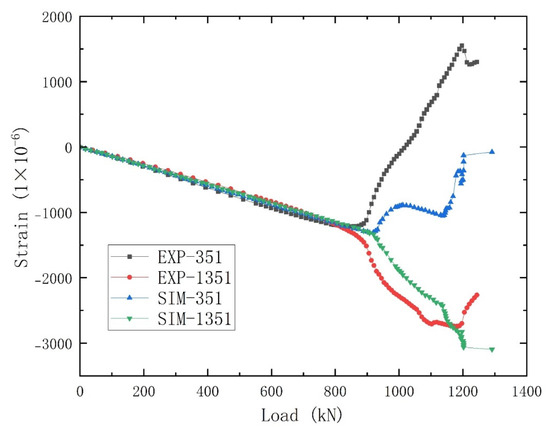
Figure 21.
Load−strain curves of simulation and experiment for initial buckling point (No. 351) under combined load case A.
Figure 22a displays strain readings from four additional skin regions. When the load reached 958 kN, a second inflection point appeared in the strain curves of the panel skin, indicating the occurrence of secondary buckling at this location. As the applied load increased, secondary buckling progressively emerged at multiple locations across the structure. Figure 22b shows the axial strain readings on the top of the stiffeners at four different points adjacent to selected points on the skin. Since the compressive loading capacity of the skin decreases after the skin buckles, the stiffeners begin to bear the majority of the compressive load, which can be observed by the increase in the tangent of the axial compressive strain curves after buckling. When loading to 1081 kN, the stiffener also began to buckle, which is 12.79% higher than the second buckling load of the skin. Buckling of the skin and stiffeners indicates the onset of global structural instability, leading to a rapid redistribution of loads and accelerated structural degradation.
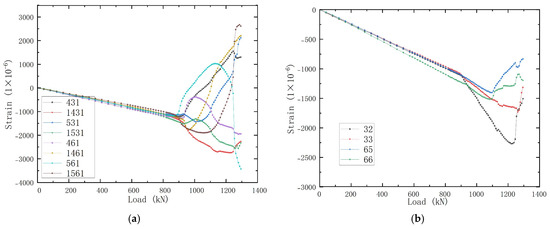
Figure 22.
Typical load−strain curves of experiment for skin and stiffeners in central area under combined load condition A. (a) Load−strain curves obtained from the skin. (b) Load−strain curves obtained from the stiffeners.
Figure 23 presents the progressive debonding between the stiffeners and skin. When the load reached 1061.47 kN, interfacial debonding initiates which is dominated by shear stress at the skin−stiffener interface, as shown in Figure 23a. The final debonding area is shown in Figure 23b.

Figure 23.
Interfacial debonding of skin and stiffeners in FEM under combined load case A. (a) Initial debonding at 1061.47 kN. (b) Final debonding area at ultimate load.
As illustrated in Figure 24, the final failure mode of the fuselage panel under combined load A was characterized by debonding of the stiffeners and skin along a diagonal direction, with a failure inclination angle smaller than that observed under pure shear conditions, indicating interfacial failure as a contributing factor to the overall structural collapse. Furthermore, cracks were identified at the stiffeners and the skin.
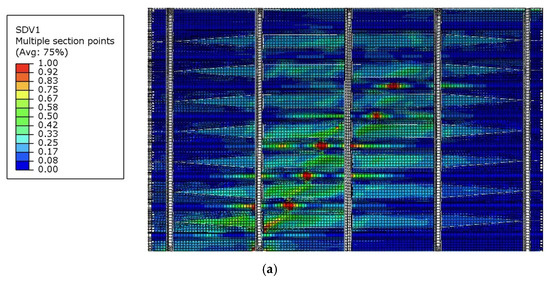
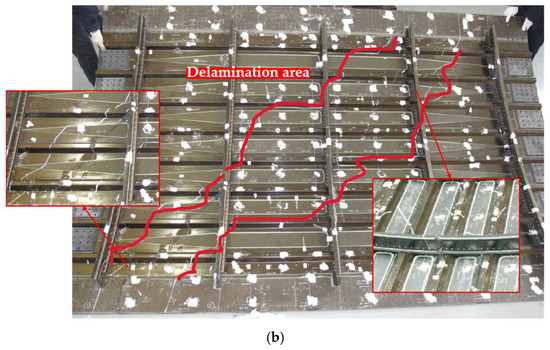
Figure 24.
Comparison of failure modes in the experiment and finite element analysis under combined load case A. (a) Fiber compressive failure (corresponding to state variable SDV1) in finite element analysis. (b) Failure area in the experiment with debonding regions highlighted by the red line.
4.4. Combined Load Case B
The initial buckling compressive load of the curved fuselage during combined load case B was 1356.20 kN (in compression), with a failure load of 1804.71 kN (in compression). The ultimate load capacity exceeded the initial buckling load by 33.08%. In the finite element analysis, the buckling load was determined to be 1430.51 kN, and the failure load was 1908.72 kN, resulting in relative errors of 5.45% and 5.72%, respectively. The post-buckling progression of the test specimen under combined load case B in the finite element analysis is illustrated in Figure 25. The initial buckling point is located near buckling point No. 241. And Figure 26 presents a comparative analysis of the load-strain curves between the finite element method and the experimental data at the initial buckling point.
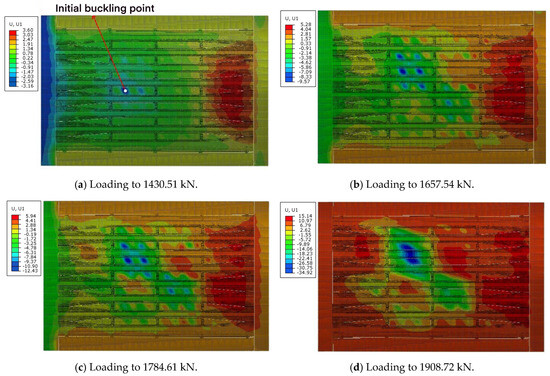
Figure 25.
The displacement of R−direction in post-buckling progression of test specimen under combined load case B. (a) Initial buckling at 1430.51 kN. (b) Loading to 1657.54 kN. (c) Loading to 1784.61 kN. (d) Loading to 1908.72 kN.
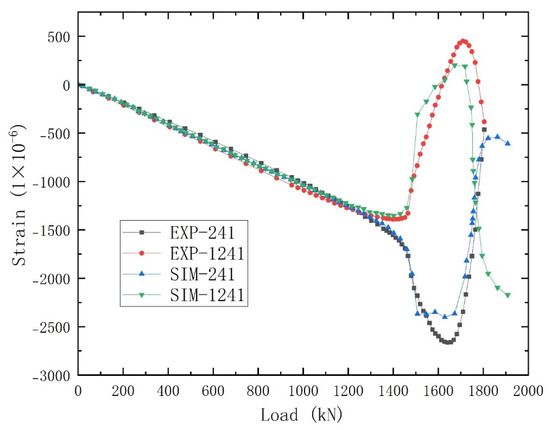
Figure 26.
Load−strain curve of simulation and experiment for initial buckling point (No. 241) under combined load case B.
Figure 27a displays strain readings from four additional regions of the skin. When the load reached 1546.43 kN, a second buckling point appeared in the strain curves of the panel skin. As shown in Figure 27b, the skin’s buckling triggered a progressive load redistribution, with the stiffeners assuming an increasing role in carrying the compressive load, as evidenced by the pronounced tangent in their strain curves and response curves. Following the onset of the skin’s second buckling, as loading to 1613.66 kN, the stiffeners exhibited buckling, which is 4.35% higher than the second buckling load of the skin. This sequential failure mechanism indicates that the stiffener’s loss of stability disrupted the original load-sharing equilibrium, inducing the onset of global structural instability, which triggered a rapid degradation in the structural load-bearing capacity.
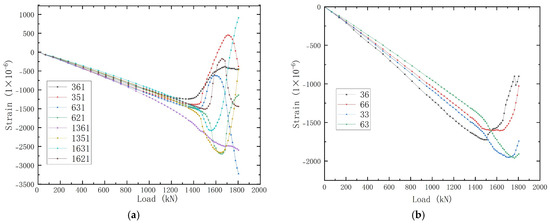
Figure 27.
Typical load−strain curves of experiment for skin and stiffeners in central area under combined load condition B. (a) Load−strain curves obtained from the skin. (b) Load−strain curves obtained from the stiffeners.
Figure 28 presents the progressive debonding between the stiffeners and skin. When the load reached 1629.73 kN, interfacial debonding initiates which is dominated by shear stress at the skin−stiffener interface, as shown in Figure 28a. The final debonding area is shown in Figure 28b.

Figure 28.
Interfacial debonding of skin and stiffeners in FEM under combined load case B. (a) Initial debonding at 1629.73 kN. (b) Final debonding area at ultimate load.
As illustrated in Figure 29, the final failure mode of the fuselage panel exhibited fracture of the stiffeners and skin along an oblique angle, with the failure angle being smaller than that observed under combined load case A.
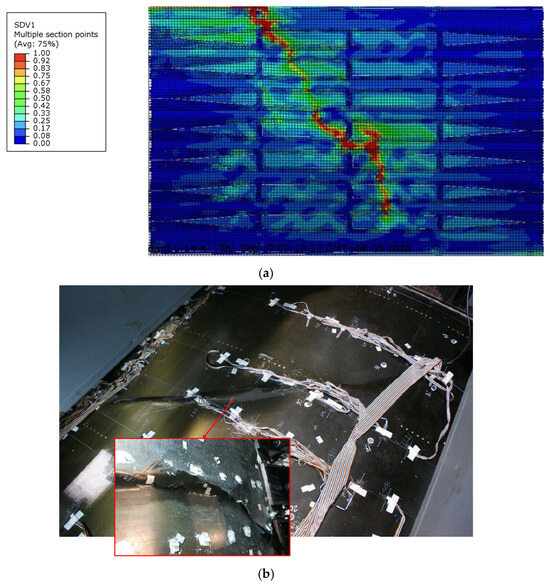
Figure 29.
Comparison of failure modes in the experiment and finite element analysis under combined load case B. (a) Fiber compressive failure (corresponding to state variable SDV1) in finite element analysis. (b) Failure mode in the experiment.
Figure 30 provides a summary of the curved fuselage panels’ structural performance across four loading conditions. The figure contains initial buckling and secondary buckling loads of skin, buckling loads of stiffeners, ultimate loads of specimens, and initial debonding loads in FEM. Through integrated finite element analysis and experimental investigations, the load transfer mechanisms of curved panels were examined.
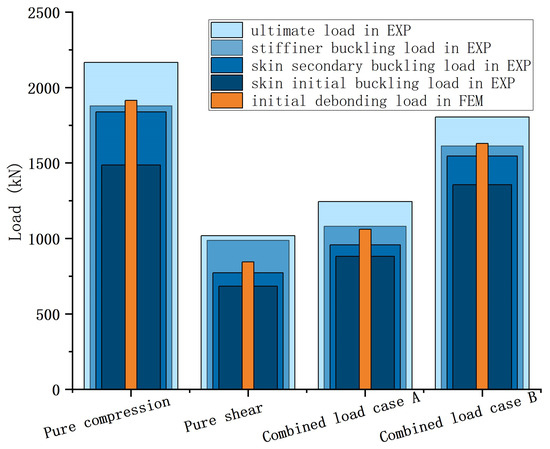
Figure 30.
Summary of important loads in four loading conditions.
The experimental results demonstrate significant post-buckling load-carrying capacity across all loading conditions:
- Pure compression:
The ultimate failure load exceeded the initial buckling load by 45.72%.
- Pure shear:
The ultimate failure load was 48.88% higher than the initial buckling load.
- Combined loading case A:
The ultimate failure load was 41.09% higher than the initial buckling load.
- Combined loading case B:
The ultimate failure load was 33.08% higher than the initial buckling load.
This finding demonstrates that curved panels exhibit a more extended post-buckling progression under uni-axial loading conditions compared to multi-axial stress states. When the panel is subjected to combined compressive and shear loads, the shear load is mainly endured by the skin, while the compressive load is shared by both the skin and the stiffeners. The discontinuity of the loads leads to easier debonding at the interface between the stiffeners and the skin. Additionally, combined loads could introduce stresses in weaker directions, like transverse to the fibers or in shear, which have lower strengths, thus reducing the overall safety factor. This suggests that stress component interactions accelerate failure progression.
Furthermore, across all loading conditions, after the initial buckling of the skin, a progressive load transfer to the stiffeners was observed, as evidenced by the increasing slope of the strain curves. As the applied load continued to increase, a second inflection point emerged in the skin strain curves, signaling the onset of secondary buckling at critical locations. Subsequently, the stiffeners also began to buckle, marking a transition to advanced structural instability. The experimental results reveal significant variations in the buckling resistance between the stiffeners and skin under four loading conditions:
- Pure compression:
The stiffeners’ buckling load exceeded the skin secondary buckling load by 2.01%.
- Pure shear:
The stiffeners’ buckling load was 27.97% higher than the skin secondary buckling load.
- Combined loading case A:
The stiffeners’ buckling load was 12.79% higher than the skin secondary buckling load.
- Combined loading case B:
The stiffeners’ buckling load was 4.52% higher than the skin secondary buckling load.
These experimental findings demonstrate a clear correlation between the loading types and stiffeners’ performance. In compression-dominant loading conditions, the stiffeners are prone to buckle after the skin buckles.
Moreover, the experimental and numerical results showed that the initial debonding loads in FEM were close to the secondary buckling loads of the skin, which demonstrates that the buckling-induced waviness contributes to the skin−stiffener debonding, and the secondary buckling of the skin significantly accelerates interfacial debonding.
Following interfacial debonding, the fuselage panel rapidly progressed to skin wrinkling and ultimate structural failure. The failure mode was characterized by wrinkling patterns on the outer skin surface, fracture of stiffeners, and delamination at the skin−stiffener interfaces. The extent and morphology of the failure zone were found to be directly correlated with the compression-to-shear load ratio, highlighting the influence of multi-axial stress states on failure mechanisms. These findings provide critical insights into the structural performance and failure progression of stiffened fuselage panels under complex loading scenarios.
The finite element analysis results are in good agreement with experimental data, due to mechanical property tests before the fuselage panel experiment and the correct simulation of loading conditions, which provide further proof of the decoupling capability of the test apparatus for combined loads. However, errors still exist, and the causes of these errors include the following:
- FEM models assume perfect materials and adhesion between plies, ignoring manufacturing defects (e.g., fiber fracture, matrix cracking, delamination, voids, resin-rich regions).
- Hashin’s criteria separate fiber and matrix failures but do not account for coupled failure modes (e.g., simultaneous matrix cracking and delamination).
- The mechanical assembly errors between the test specimen and the testing apparatus were not taken into account.
5. Conclusions
This paper focuses on the failure analysis of fuselage panels under uni-axial and multi-axial loads. Experimental and numerical studies have been conducted to examine the post-buckling behaviors of curved panels reinforced with hat-shaped stiffeners. Panel testing was conducted using a novel test facility. Strain gauges were installed in a back-to-back configuration on the skin, enabling identification of the initial buckling of the specimen.
An FE model was developed to simulate loading and boundary conditions. During the simulation, a non-linear analysis was performed. The finite element analysis results are in good agreement with the experimental data, confirming the models’ validity.
Results from the failure tests of four loading conditions showed that the ultimate load of the specimen was at least 30% higher than the initial buckling loads, demonstrating a sufficient load capability during post-buckling progress. Multi-axial loading resulted in more complex stress interactions for the specimens, resulting in a reduction in the strength reserve related to the post-buckling regime compared to the uni-axial loading case. After the initial buckling of the skin, a progressive load transfer to the stiffeners was observed, as evidenced by the increasing slope of the strain curves. Increasing the shear force was found to enlarge the margin between global skin buckling and stiffener buckling, as the shear-induced longitudinal tension along the stiffeners enhanced their stability.
The established FE model was used to identify the load point corresponding to the initial skin−stiffener debonding, which stays close to secondary buckling loads of the skin (i.e., global buckling). This indicates that the escalation of skin waviness induced by global buckling is the primary cause for the skin−stiffener debonding. The structural integrity degrades as the stiffeners lose their ability to arrest the propagation of buckling waviness after debonding. Subsequently, a fracture in the skin and stiffeners occurred immediately, resulting in a sudden collapse of the panel. One important future direction for characterizing the bonding interface damage is to study the stress effort related to mixed fracture modes (i.e., mode I, mode II, and mode III fracture energy) on the damage evolution of the stiffener−skin interface.
6. Patents
- Aircraft Strength Research Institute of China. A Complex Load Test Facility for Fuselage Panel. CN201510221528.6, 29 July 2015 (in Chinese).
- Aircraft Strength Research Institute of China. A Shear Loading Facility for Large Aircraft Panel. CN201510243266.3, 11 November 2015 (in Chinese).
- Aircraft Strength Research Institute of China. A Curved Panel Air Pressurization and Compression Load Test Facility. CN201510240070.9, 29 July 2015 (in Chinese).
- Aircraft Strength Research Institute of China. A Loading Device with Straight Edge Constraint for Curved Panel. CN202010554450.0, 13 October 2020 (in Chinese).
Author Contributions
F.Y. (Fei Yuan): Conceptualization, methodology, programming, investigation and writing; L.C.: validation; X.C.: Conceptualization; F.Y. (Fei Yu); supervision, writing and editing. L.L.: Administration; Y.C.: Conceptualization, administration. All authors have read and agreed to the published version of the manuscript.
Funding
This work was funded by the National Key Lab of Strength and Structural Integrity, as a part of the Independent Research Project Foundation (Grant No. LSSIZZYJ202303).
Data Availability Statement
The data presented in this study are available on request from the corresponding author. The data are not publicly available due to ongoing research findings.
Conflicts of Interest
The authors declare no conflicts of interest.
References
- Chen, X. Buckling Interaction Formulae of Composite Plates under Combined Axial Compression/Tension and Shear Loads. Hangkong Xuebao/Acta Aeronaut. Astronaut. Sin. 2021, 42, 225417. [Google Scholar]
- Zhao, L.; Wang, K.; Ding, F.; Qin, T.; Xu, J.; Liu, F.; Zhang, J. A post-buckling compressive failure analysis framework for composite stiffened panels considering intra-, inter-laminar damage and stiffener debonding. Results Phys. 2019, 13, 102205. [Google Scholar] [CrossRef]
- Li, B.; Gong, Y.; Gao, Y.; Hou, M.; Li, L. Failure Analysis of Hat-Stringer-Stiffened Aircraft Composite Panels under Four-Point Bending Loading. Materials 2022, 15, 2430. [Google Scholar] [CrossRef]
- Bertolini, J.; Castanié, B.; Barrau, J.-J.; Navarro, J.-P. An experimental and numerical study on omega stringer debonding. Compos. Struct. 2008, 86, 233–242. [Google Scholar] [CrossRef]
- Zhang, X.L.; Dai, W.B.; Cai, B. Numerical and Experimental Investigation of Bearing Capacity for Compressed Stiffened Composite Panel with Different Stringer Section Geometries. Appl. Compos. Mater. 2022, 29, 1507–1535. [Google Scholar] [CrossRef]
- Munroe, J.; Wilkins, K.; Gruber, M.; Domack, M. Integral Airframe Structures (IAS): Validated Feasibility Study of Integrally Stiffened Metallic Fuselage Panels for Reducing Manufacturing Costs; NASA/CR-2000-209337; NASA: Washington, DC, USA, 2000. [Google Scholar]
- Wijayratne, D. Validation of Design and Analysis Techniques of Tailored Composite Structures; NASA/CR-2004-212650; NASA: Washington, DC, USA, 2001. [Google Scholar]
- Accardo, A.; Ricci, F.; Lucariello, D.; Polese, P.; Leone, B.; Cozzolino, D.; Sollo, A.; Palmiero, F. Design of a Combined Loads Machine for Tests on Fuselage Barrels and Curved Panels. In Proceedings of the 45th AIAA/ASME/ASCE/AHS/ASC Structures, Structural Dynamics & Materials Conference, Palm Springs, CA, USA, 19–22 April 2004. [Google Scholar] [CrossRef]
- Rouse, M. Methodologies for Combined Loads Tests Using a Multi-actuator Test Machine. In Experimental Mechanics of Composite, Hybrid, and Multifunctional Materials; Tandon, G.P., Tekalur, S.A., Ralph, C., Sottos, N.R., Blaiszik, B., Eds.; Springer International Publishing: Cham, Switzerland, 2014; Volume 6, pp. 205–214. [Google Scholar]
- Andrew, E.L. Configuration and Sizing of a Test Fixture for Panels Under Combined Loads; Bibliogov: Singapore, 2013. [Google Scholar]
- Ambur, D.; Cerro, J.; Dickson, J. Analysis of a D-box fixture for testing curved stiffened aircraft fuselage panels in axial compression and internal pressure. In Proceedings of the 35th Structures, Structural Dynamics, and Materials Conference, Hilton Head, SC, USA, 18–20 April 1994. [Google Scholar] [CrossRef]
- Ambur, D.R.; Cerro, J.A.; Dickson, J. D-box fixture for testing stiffened panels in compression and pressure. J. Aircr. 1995, 32, 1382–1389. [Google Scholar] [CrossRef]
- Rouse, M.; Young, R.D.; Gehrki, R.E. Structural Stability of a Stiffened Aluminum Fuselage Panel Subjected to Combined Mechanical And Internal Pressure Loads. In Proceedings of the 44th AIAA/ASME/ASCE/AHS/ASC Structures, Structural Dynamics, and Materials Conference, Norfolk, VA, USA, 7–10 April 2003. [Google Scholar] [CrossRef]
- Ambur, D.R.; Rouse, M. Design and Evaluation of Composite Fuselage Panels Subjected to Combined Loading Conditions. J. Aircr. 2005, 42, 1037–1045. [Google Scholar] [CrossRef]
- Ambur, D.; Rouse, M.; Young, R.; Perez-Ramos, C. Evaluation of an aluminum fuselage panel with discrete-source damage and subjected to combined loading conditions. In Proceedings of the 40th Structures, Structural Dynamics, and Materials Conference and Exhibit, St. Louis, MO, USA, 12–15 April 1999. [Google Scholar] [CrossRef]
- Miller, M.; Gruber, M.L.; Wilkins, K.E. Full-Scale Testing and Analysis of Fuselage Structure; N95-14485; NASA: Washington, DC, USA, 1995. [Google Scholar]
- Boeing Company. T. E-Fixture. U.S. Patent 7246527B2, 24 July 2007. [Google Scholar]
- The Number One Address for Structural and Material Testing in the Aerospace Industry. Available online: https://www.ima-dresden.de/en/service-portfolio/focus-industries/aerospace/ (accessed on 10 October 2024).
- Zang, W.F.; Dong, D.K.; Zhang, H.Y. Research on test method of fuselage panel subjected to internal pressure load. J. Mech. Strength 2015, 37, 972–977. [Google Scholar] [CrossRef]
- Zang, W.F.; Li, L.; Zhang, H.Y. Test Research on Fuselage Panel Subjected to Combined Internal Pressure and shear Load. Sci. Technol. Eng. 2023, 23, 12300–12306. [Google Scholar] [CrossRef]
- Zang, W.; Su, S.; Zhang, H.; Dong, D. Research on test method of fuselage panel subjected to shear load. J. Mech. Strength 2017, 39, 1310–1314. [Google Scholar]
- Zang, W.F.; Chen, A.; Dong, D.K. Test research on fu-selage panel subjected to internal pressure load. Adv. Aeronaut. Sci. Eng. 2018, 9, 69–76. [Google Scholar] [CrossRef]
- Zang, W.F.; Zhang, H.Y.; Dong, D. Concomitance moving test system for fuselage panel subjected to combined load. Eng. Test 2023, 63, 72–75. [Google Scholar]
- Chen, X.M.; Li, X.X.; Chai, Y.N.; Chen, P.H.; Sun, X.S. Reseach progress in post-buckling design and analysis techniques for composite steffened panel. Acta Mater. Compos. Sin. 2024, 41, 4673–4700. [Google Scholar] [CrossRef]
- Perret, A.; Mistou, S.; Fazzini, M.; Brault, R. Global behaviour of a composite stiffened panel in buckling. Part 2: Experimental investigation. Compos. Struct. 2012, 94, 376–385. [Google Scholar] [CrossRef]
- Ruzek, R.; Kudrna, P.; Kadlec, M.; Karachalios, V.; Tserpes, K.I. Strain and damage monitoring in CFRP fuselage panels using fiber Bragg grating sensors. Part II: Mechanical testing and validation. Compos. Struct. 2014, 107, 737–744. [Google Scholar] [CrossRef]
- Zhu, S.; Yan, J.; Chen, Z.; Tong, M.; Wang, Y. Effect of the stiffener stiffness on the buckling and post-buckling behavior of stiffened composite panels—Experimental investigation. Compos. Struct. 2015, 120, 334–345. [Google Scholar] [CrossRef]
- Liu, D.; Bai, R.; Wang, R.; Lei, Z.; Yan, C. Experimental study on compressive buckling behavior of J-stiffened composite panels. Opt. Lasers Eng. 2019, 120, 31–39. [Google Scholar] [CrossRef]
- Liu, X.; Han, K.; Bai, R.; Lei, Z.; Wang, H. Buckling measurement and numerical analysis of M-type ribs stiffened composite panel. Thin-Walled Struct. 2014, 85, 117–124. [Google Scholar] [CrossRef]
- Duarte, A.P.C.; Pereira, G.B.; Silvestre, N. Numerical study of the influence of the stringers cross-section geometry on the mechanical behavior of compressed curved stiffened composite panels. Mech. Adv. Mater. Struct. 2021, 28, 516–529. [Google Scholar] [CrossRef]
- Featherston, C.A.; Watson, A. Buckling of optimised flat composite plates under shear and in-plane bending. Compos. Sci. Technol. 2005, 65, 839–853. [Google Scholar] [CrossRef]
- Featherston, C.A.; Watson, A. Buckling of optimised curved composite panels under shear and in-plane bending. Compos. Sci. Technol. 2006, 66, 2878–2894. [Google Scholar] [CrossRef]
- Mahdy, W.M.; Zhao, L.; Liu, F.; Pian, R.; Wang, H.; Zhang, J. Buckling and stress-competitive failure analyses of composite laminated cylindrical shell under axial compression and torsional loads. Compos. Struct. 2021, 255, 112977. [Google Scholar] [CrossRef]
- Abramovich, H.; Weller, T. Buckling and postbuckling behavior of laminated composite stringer stiffened curved panels under axial compression: Experiments and design guidelines. J. Mech. Mater. Struct. 2009, 4, 1187–1207. [Google Scholar] [CrossRef]
- Kumar, N.J.; Babu, P.R.; Pandu, R. Investigations on Buckling Behaviour of Laminated Curved Composite Stiffened Panels. Appl. Compos. Mater. 2014, 21, 359–376. [Google Scholar] [CrossRef]
- Li, Z.; Wang, J. Strength analysis and test verification of composite fuselage panels. Acta Aeronaut. Astronaut. Sin. 2020, 41, 223688. [Google Scholar]
- Li, C.; Chai, Y.N.; Wang, B.W.; Chen, X.M.; Yu, Z.B.; Zhou, H. Test technology for complex stress field of large scale fuselage panel. Acta Aeronaut. Astronaut. Sin. 2022, 43, 481–490. [Google Scholar] [CrossRef]
- Deng, F.C.; Chai, Y.N.; Xue, W.M.; Li, C.; Chen, L.M. On the experimental technique for large aircraft fuselage curved panel subjected to multiaxial loading. J. Exp. Mech. 2018, 33, 484–490. [Google Scholar]
- Wang, Z.; Chen, X.; Wang, B.; Huang, Y.; Chen, P. Analysis and experimental evaluation framework for buckling and post-buckling of composite stiffened panels. J. Compos. Mater. 2025, 59, 99–117. [Google Scholar] [CrossRef]
- Yu, F.; Chen, L.; Chen, X.; Pang, B.; Yuan, F.; Li, L.; Wang, B. Experimental study on failure behaviour of stiffened composite panel under combined shear and compressive loading. J. Compos. Mater. 2025, 00219983251329123. [Google Scholar] [CrossRef]
Disclaimer/Publisher’s Note: The statements, opinions and data contained in all publications are solely those of the individual author(s) and contributor(s) and not of MDPI and/or the editor(s). MDPI and/or the editor(s) disclaim responsibility for any injury to people or property resulting from any ideas, methods, instructions or products referred to in the content. |
© 2025 by the authors. Licensee MDPI, Basel, Switzerland. This article is an open access article distributed under the terms and conditions of the Creative Commons Attribution (CC BY) license (https://creativecommons.org/licenses/by/4.0/).