
Wetted and Projected Area Relationships in Commercial Airplane Design

Abstract
1. Introduction
2. Wetted Area
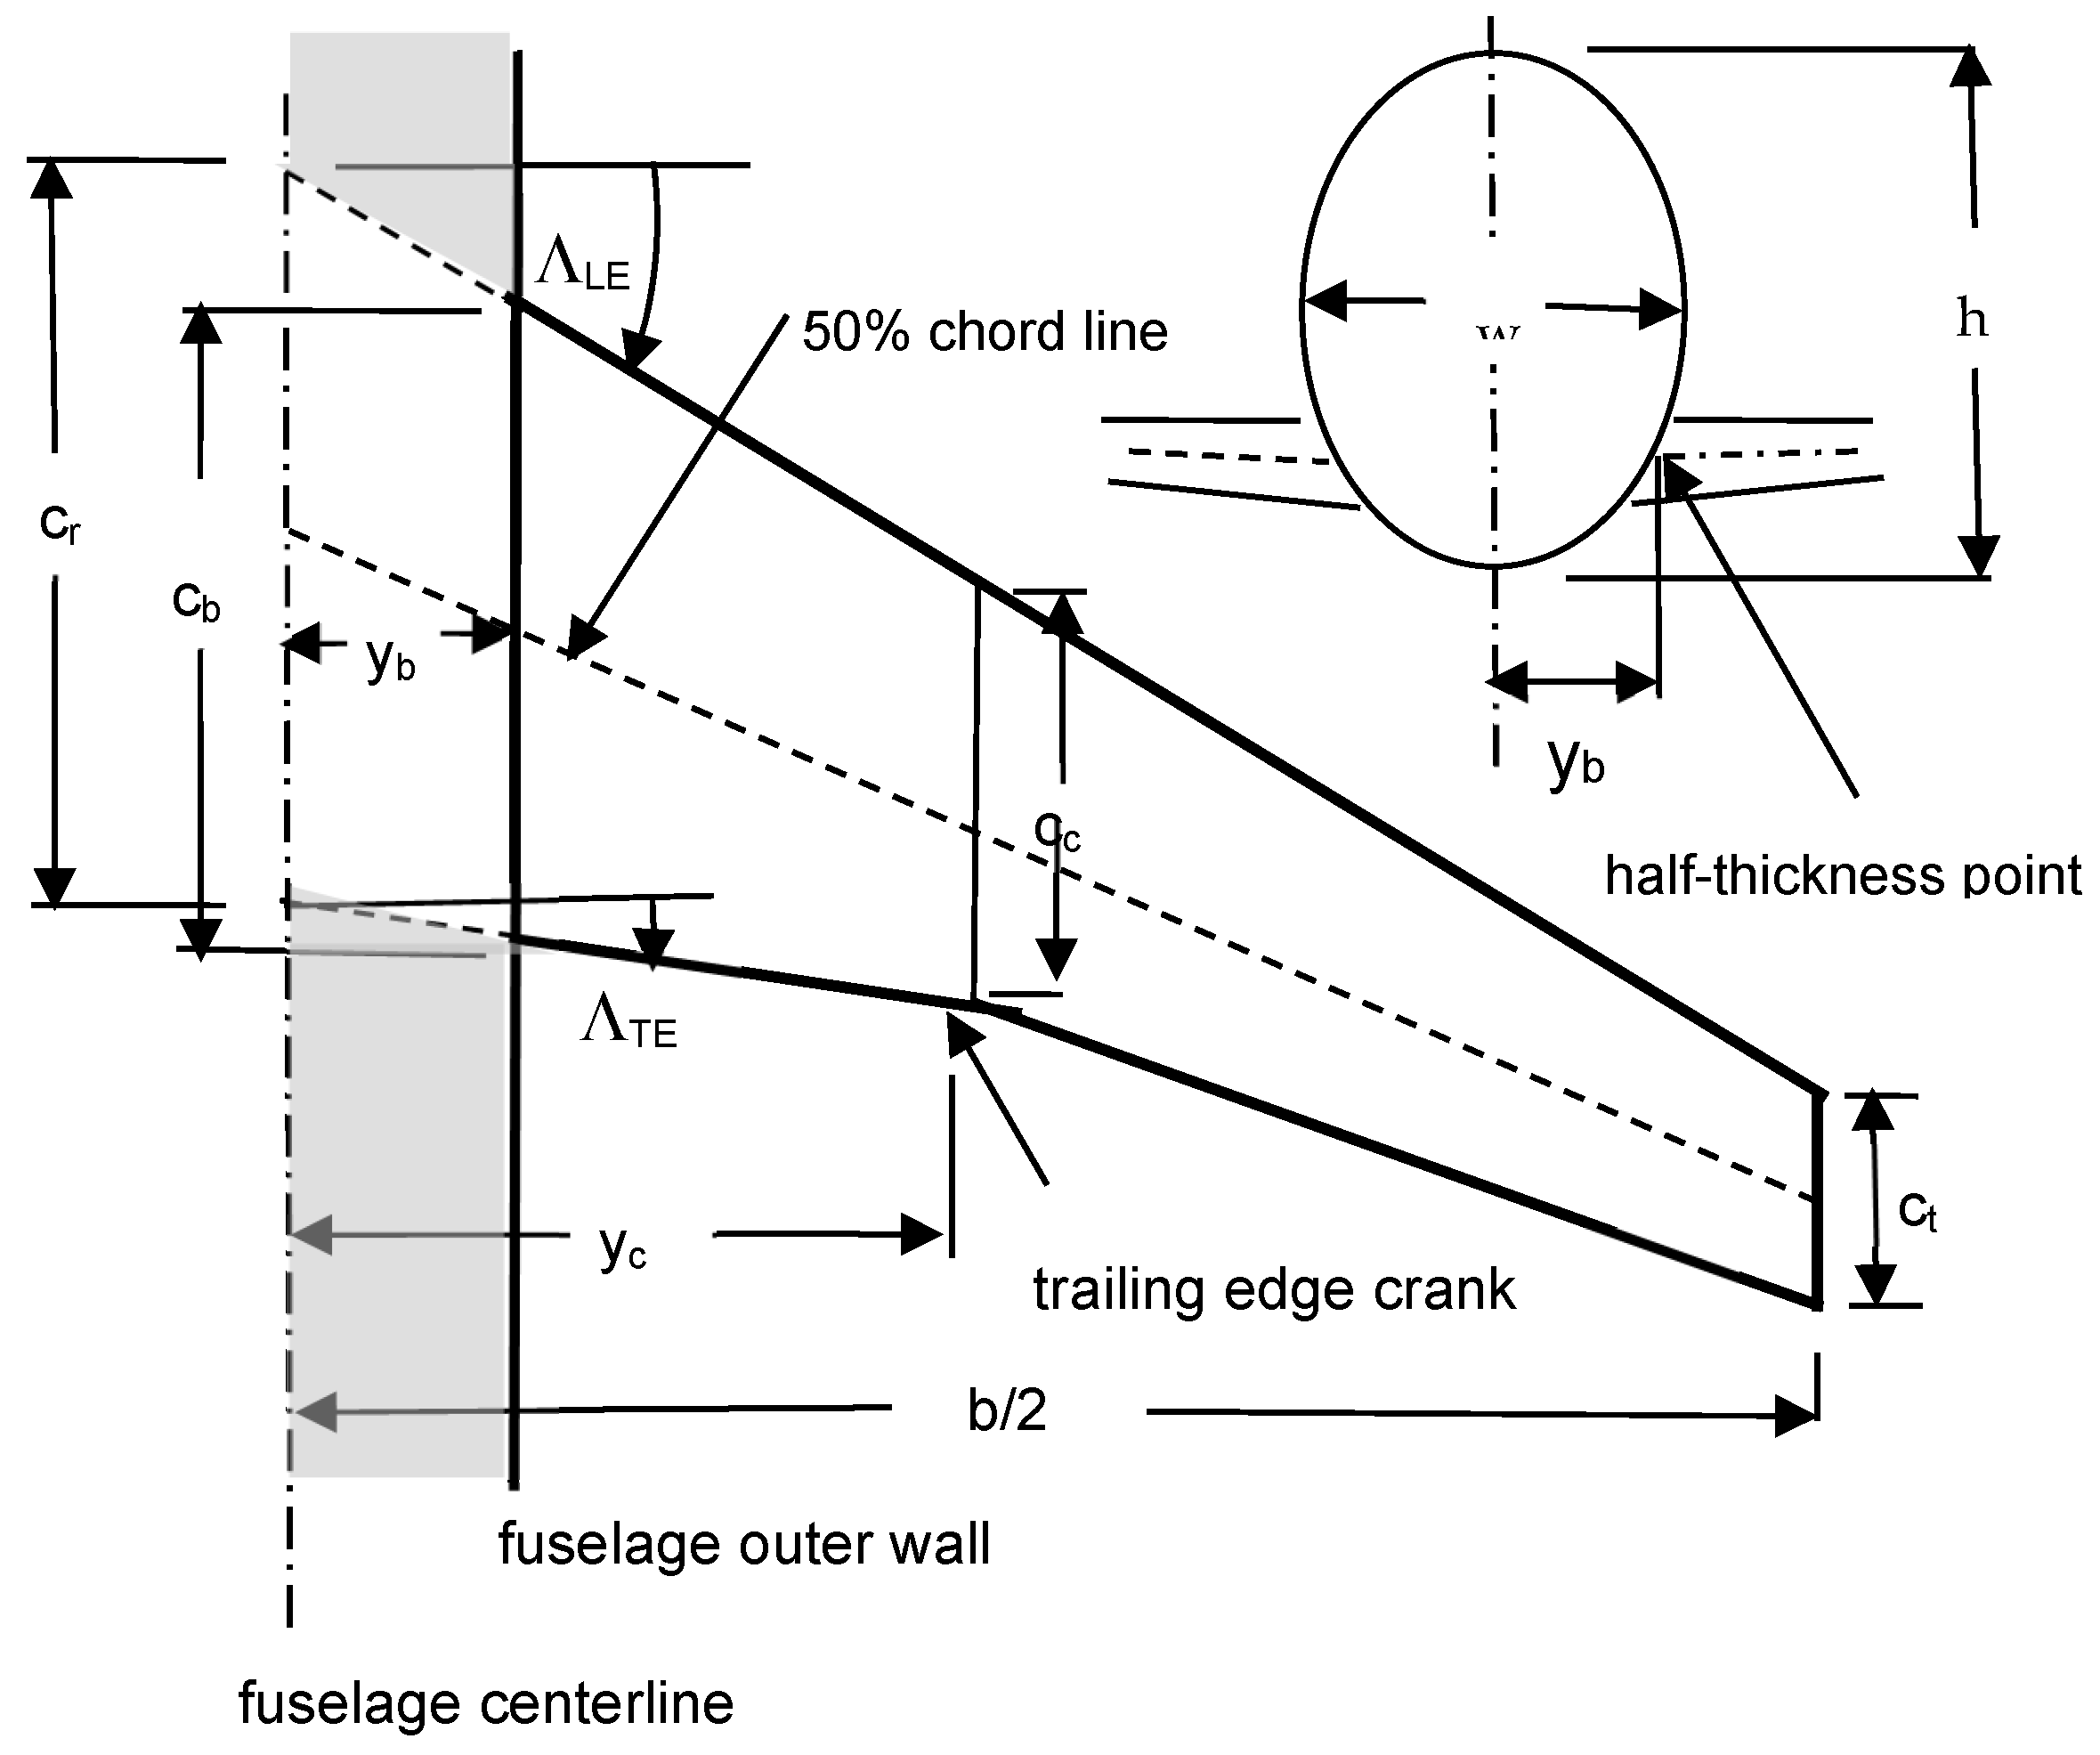
2.1. Wing Wetted Area
2.2. Fuselage Wetted Area
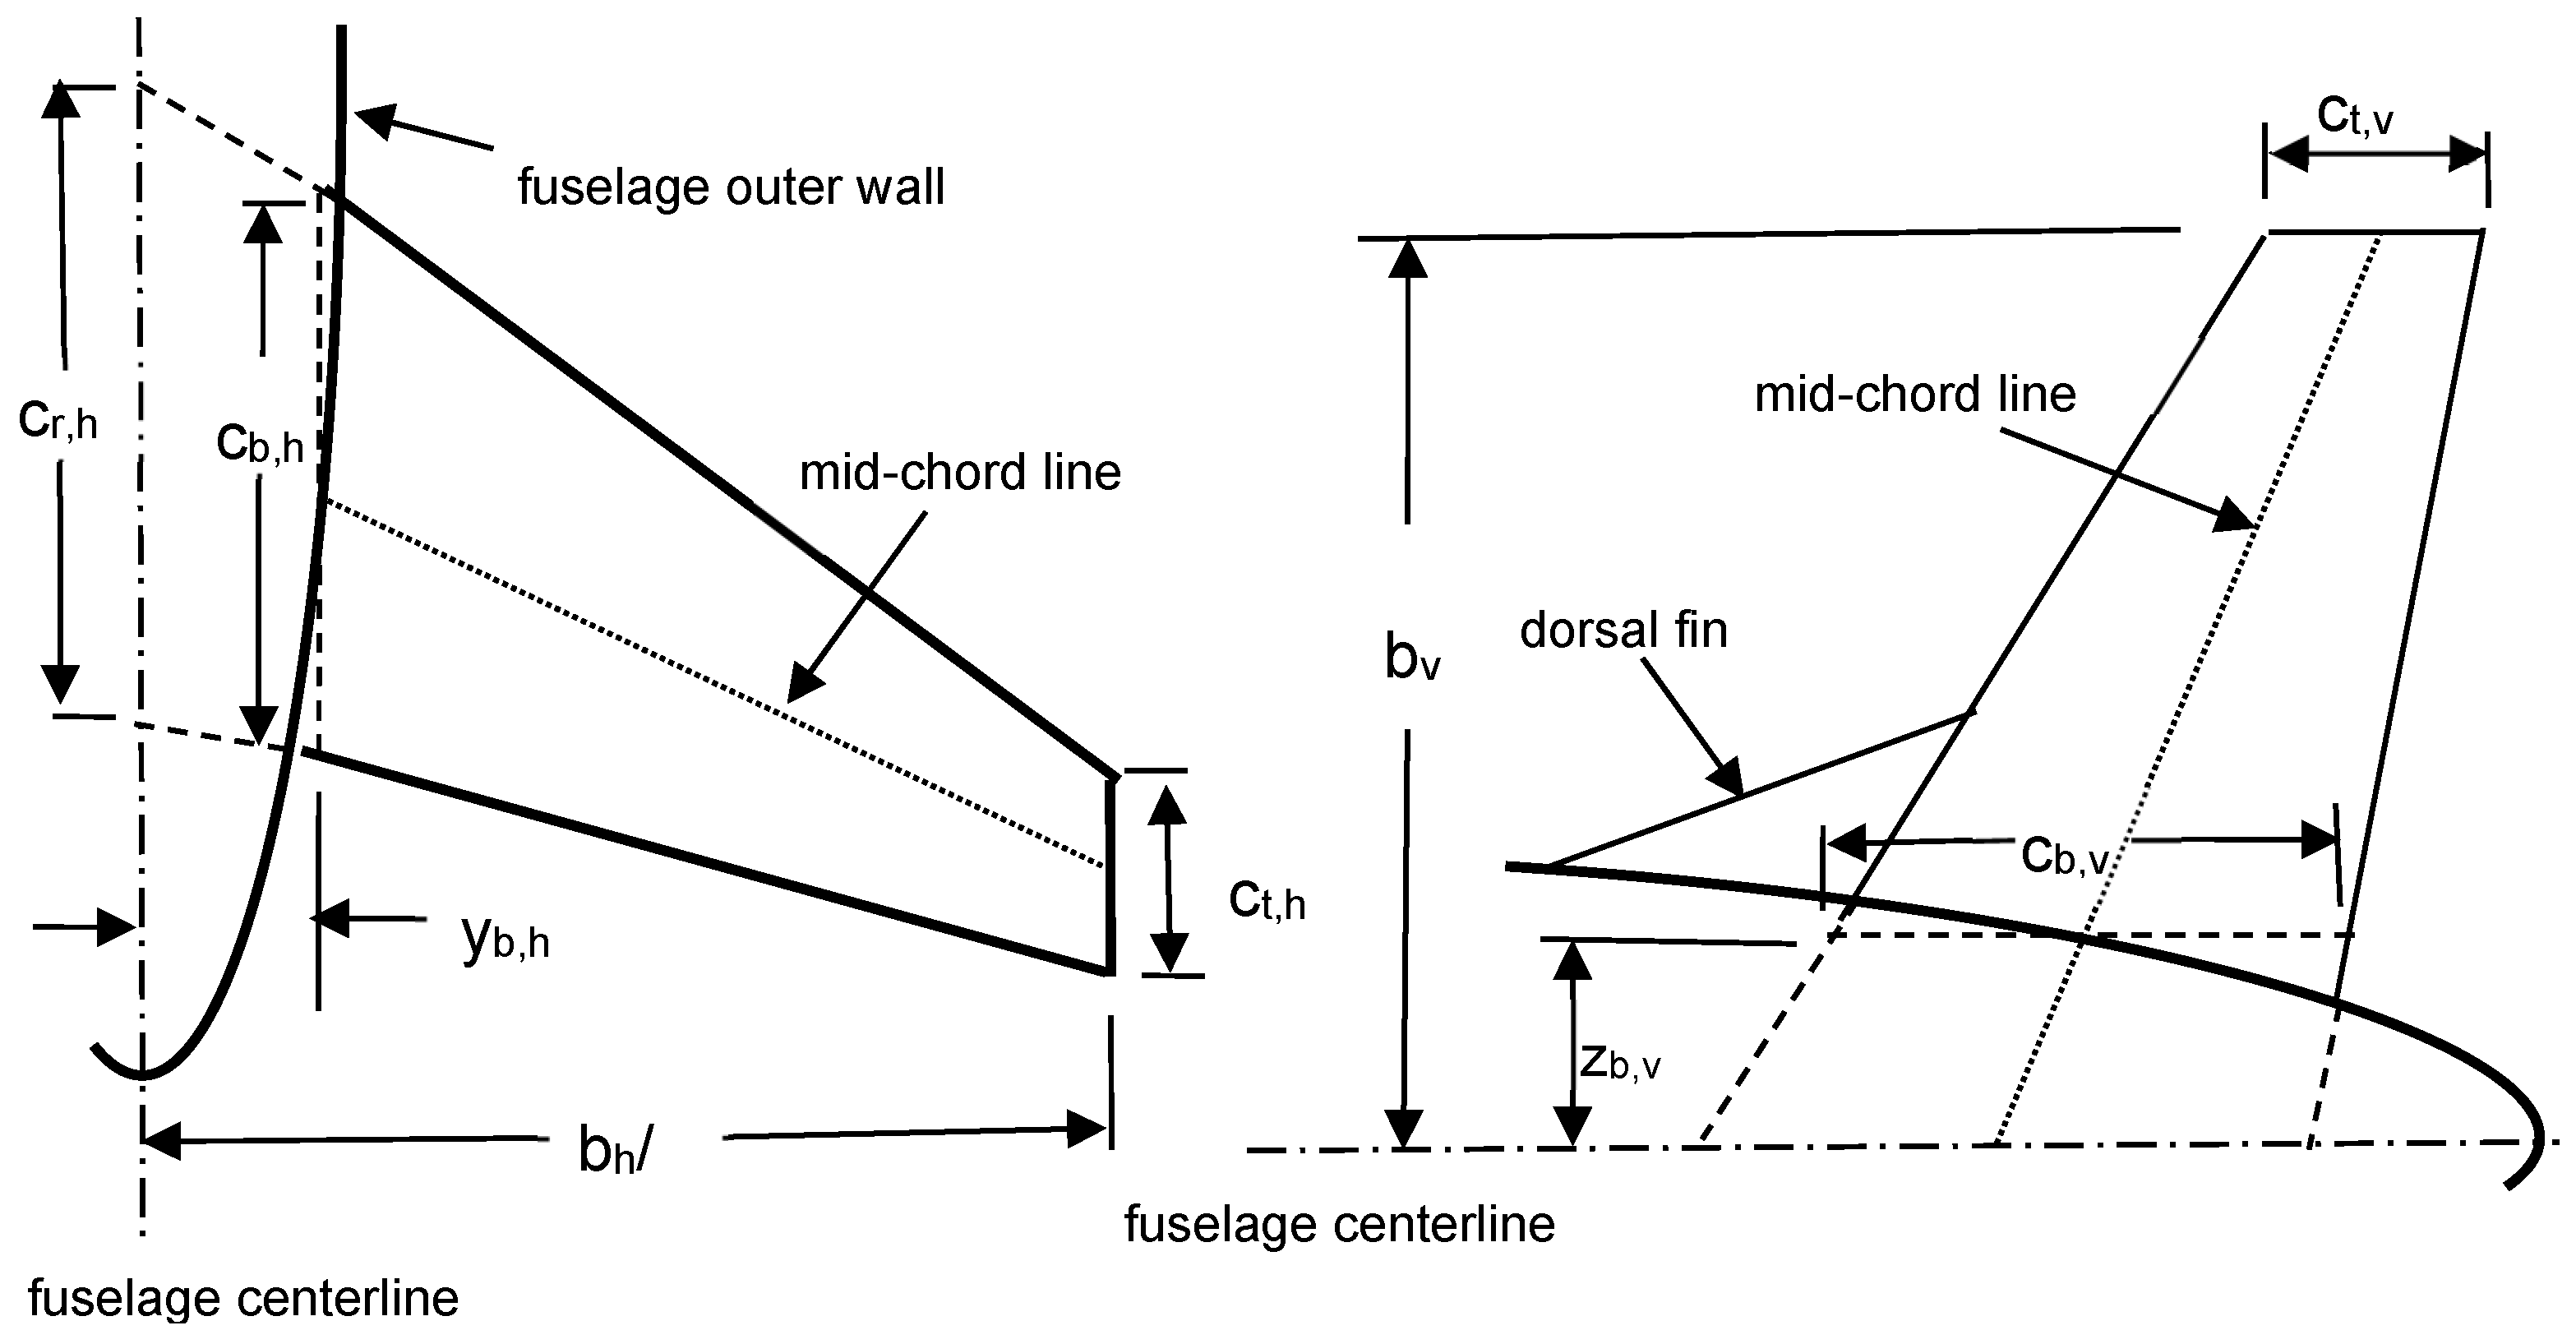
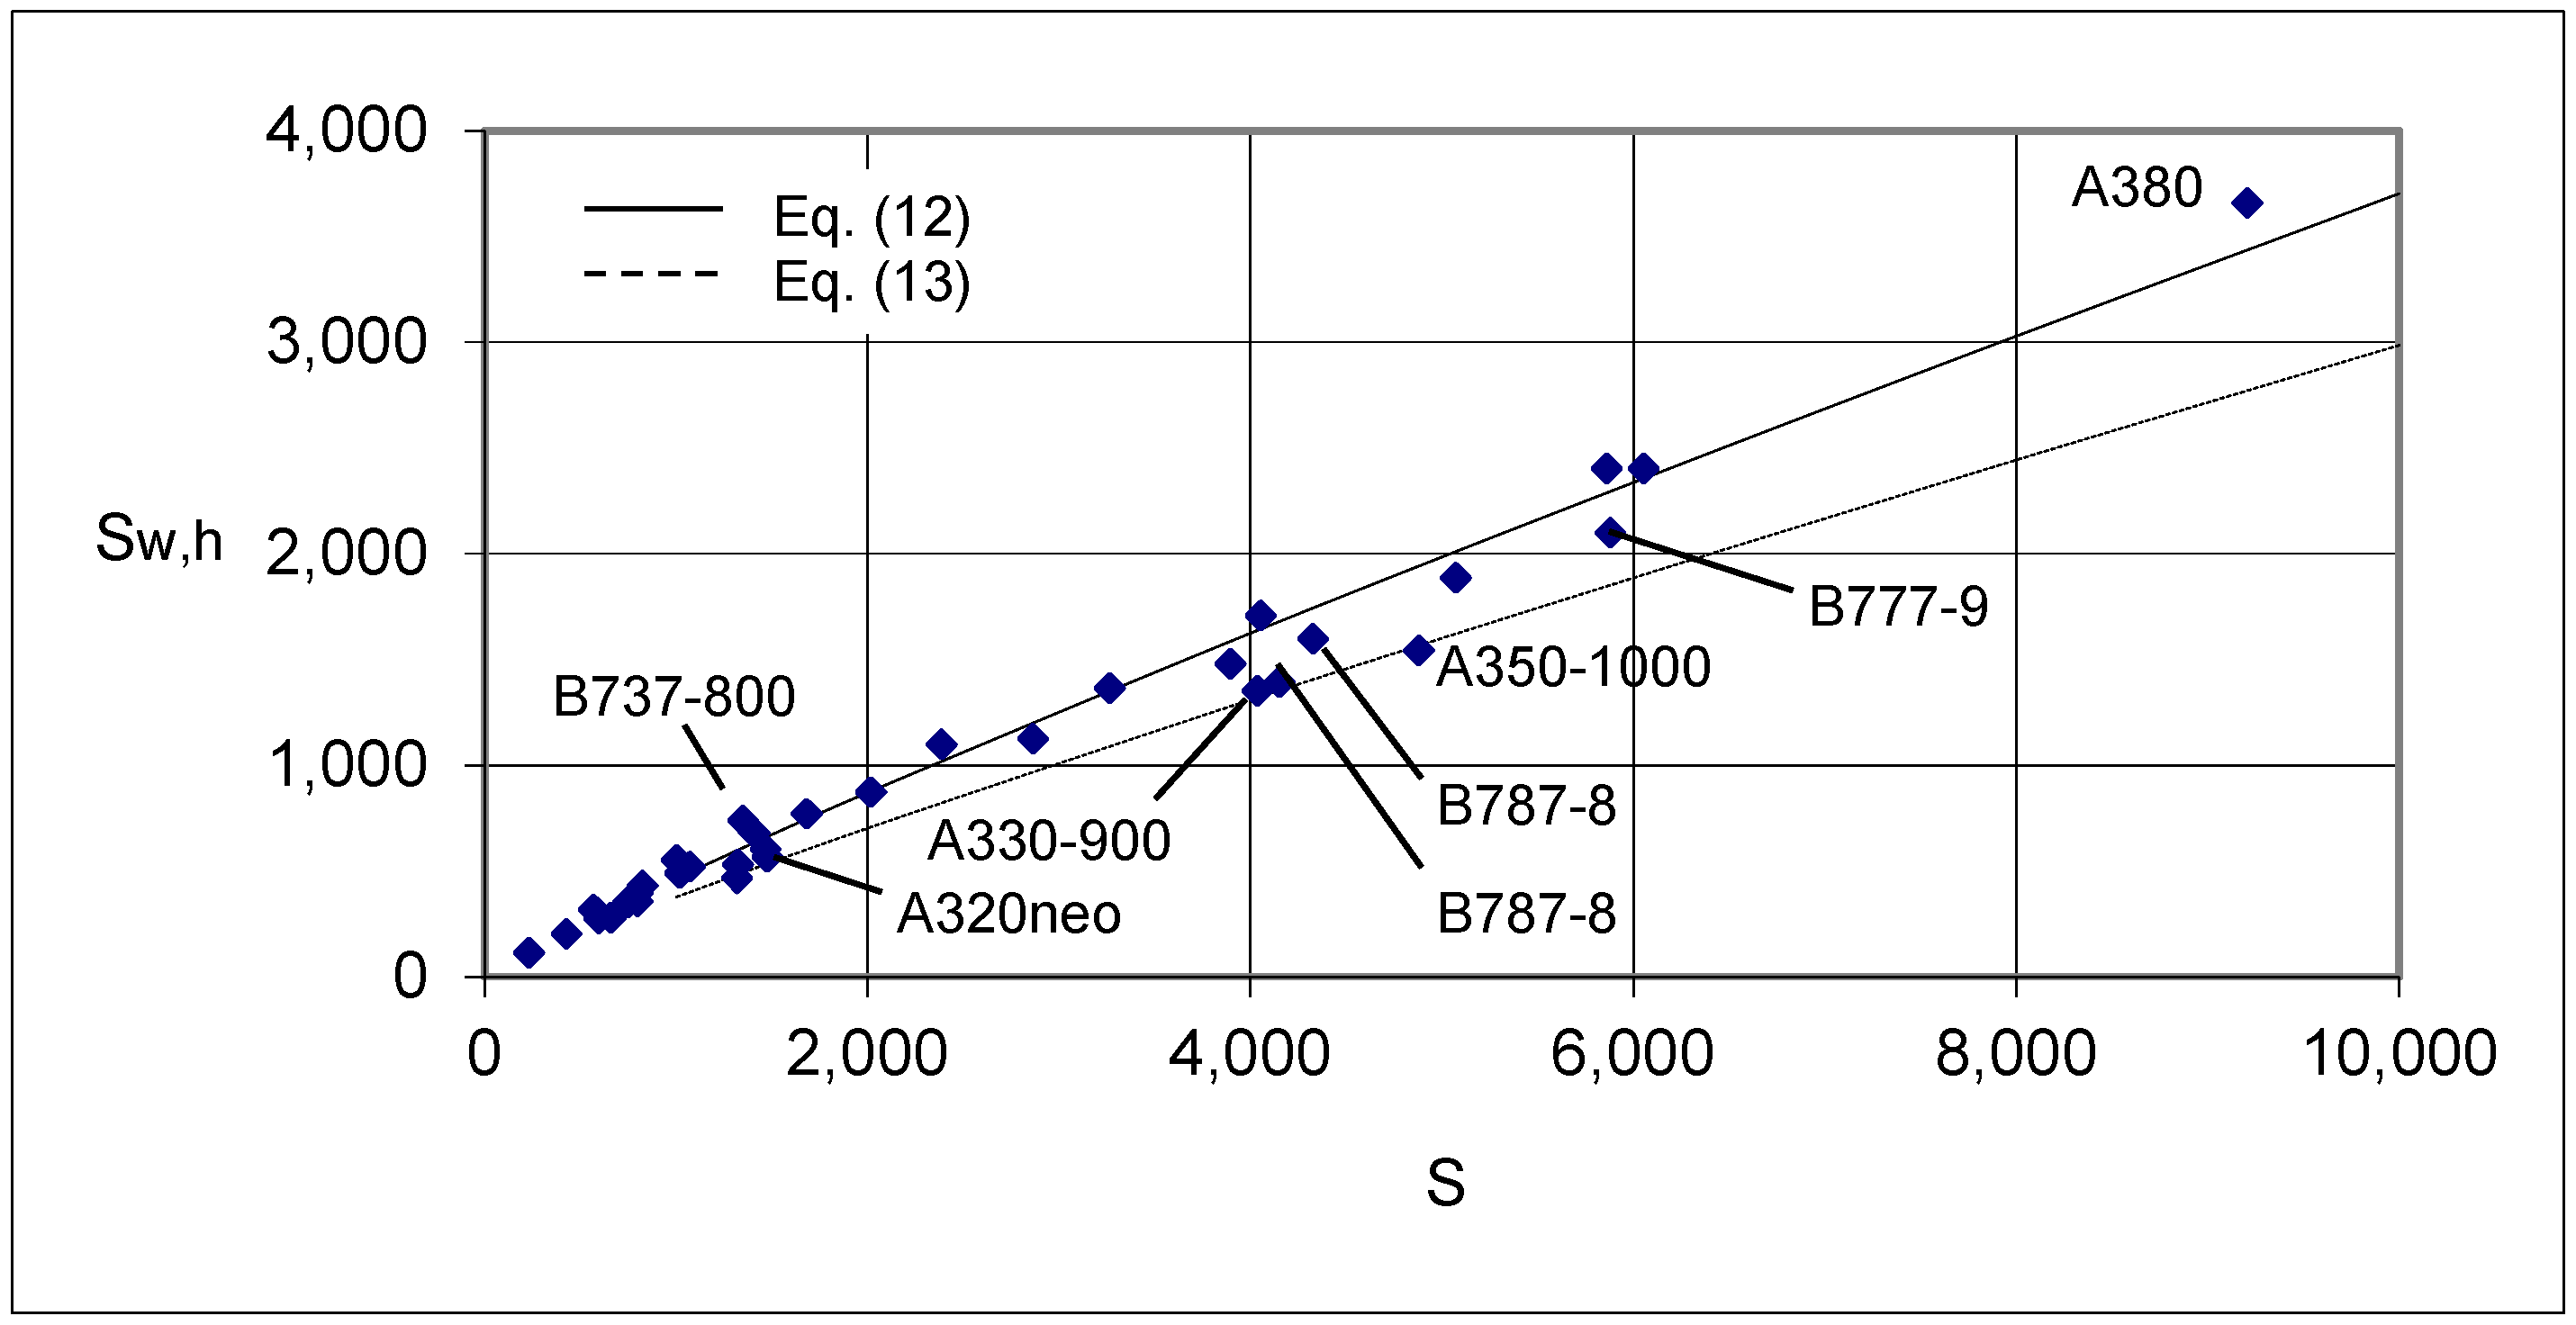
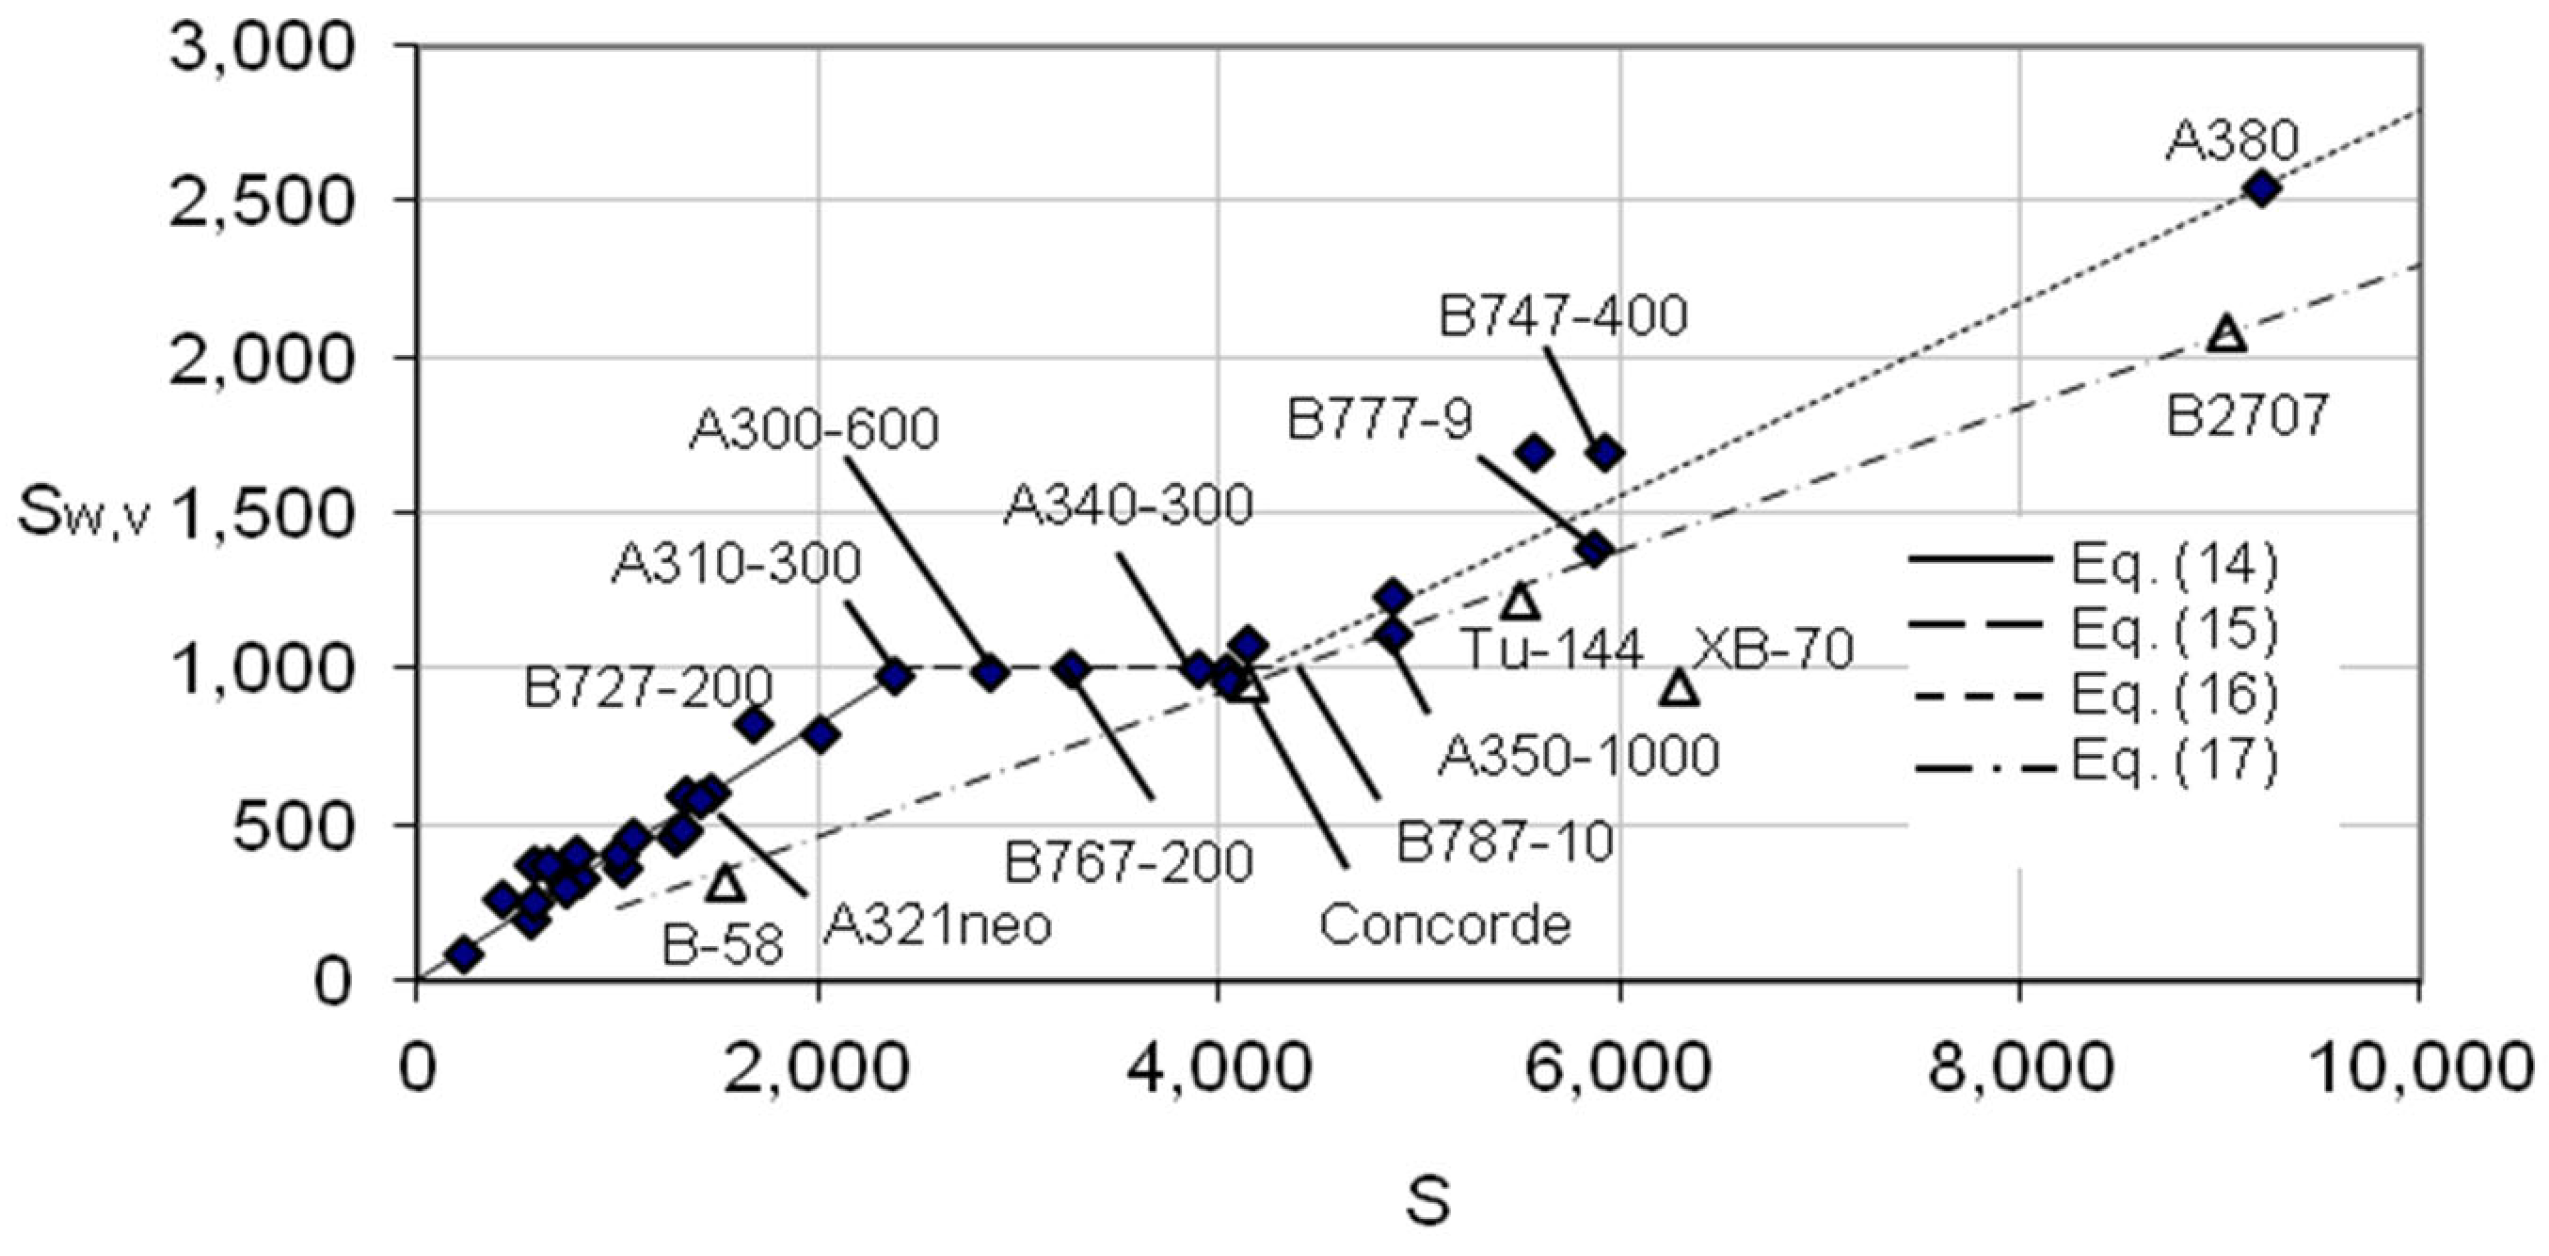
2.3. Tail Surface Wetted Area
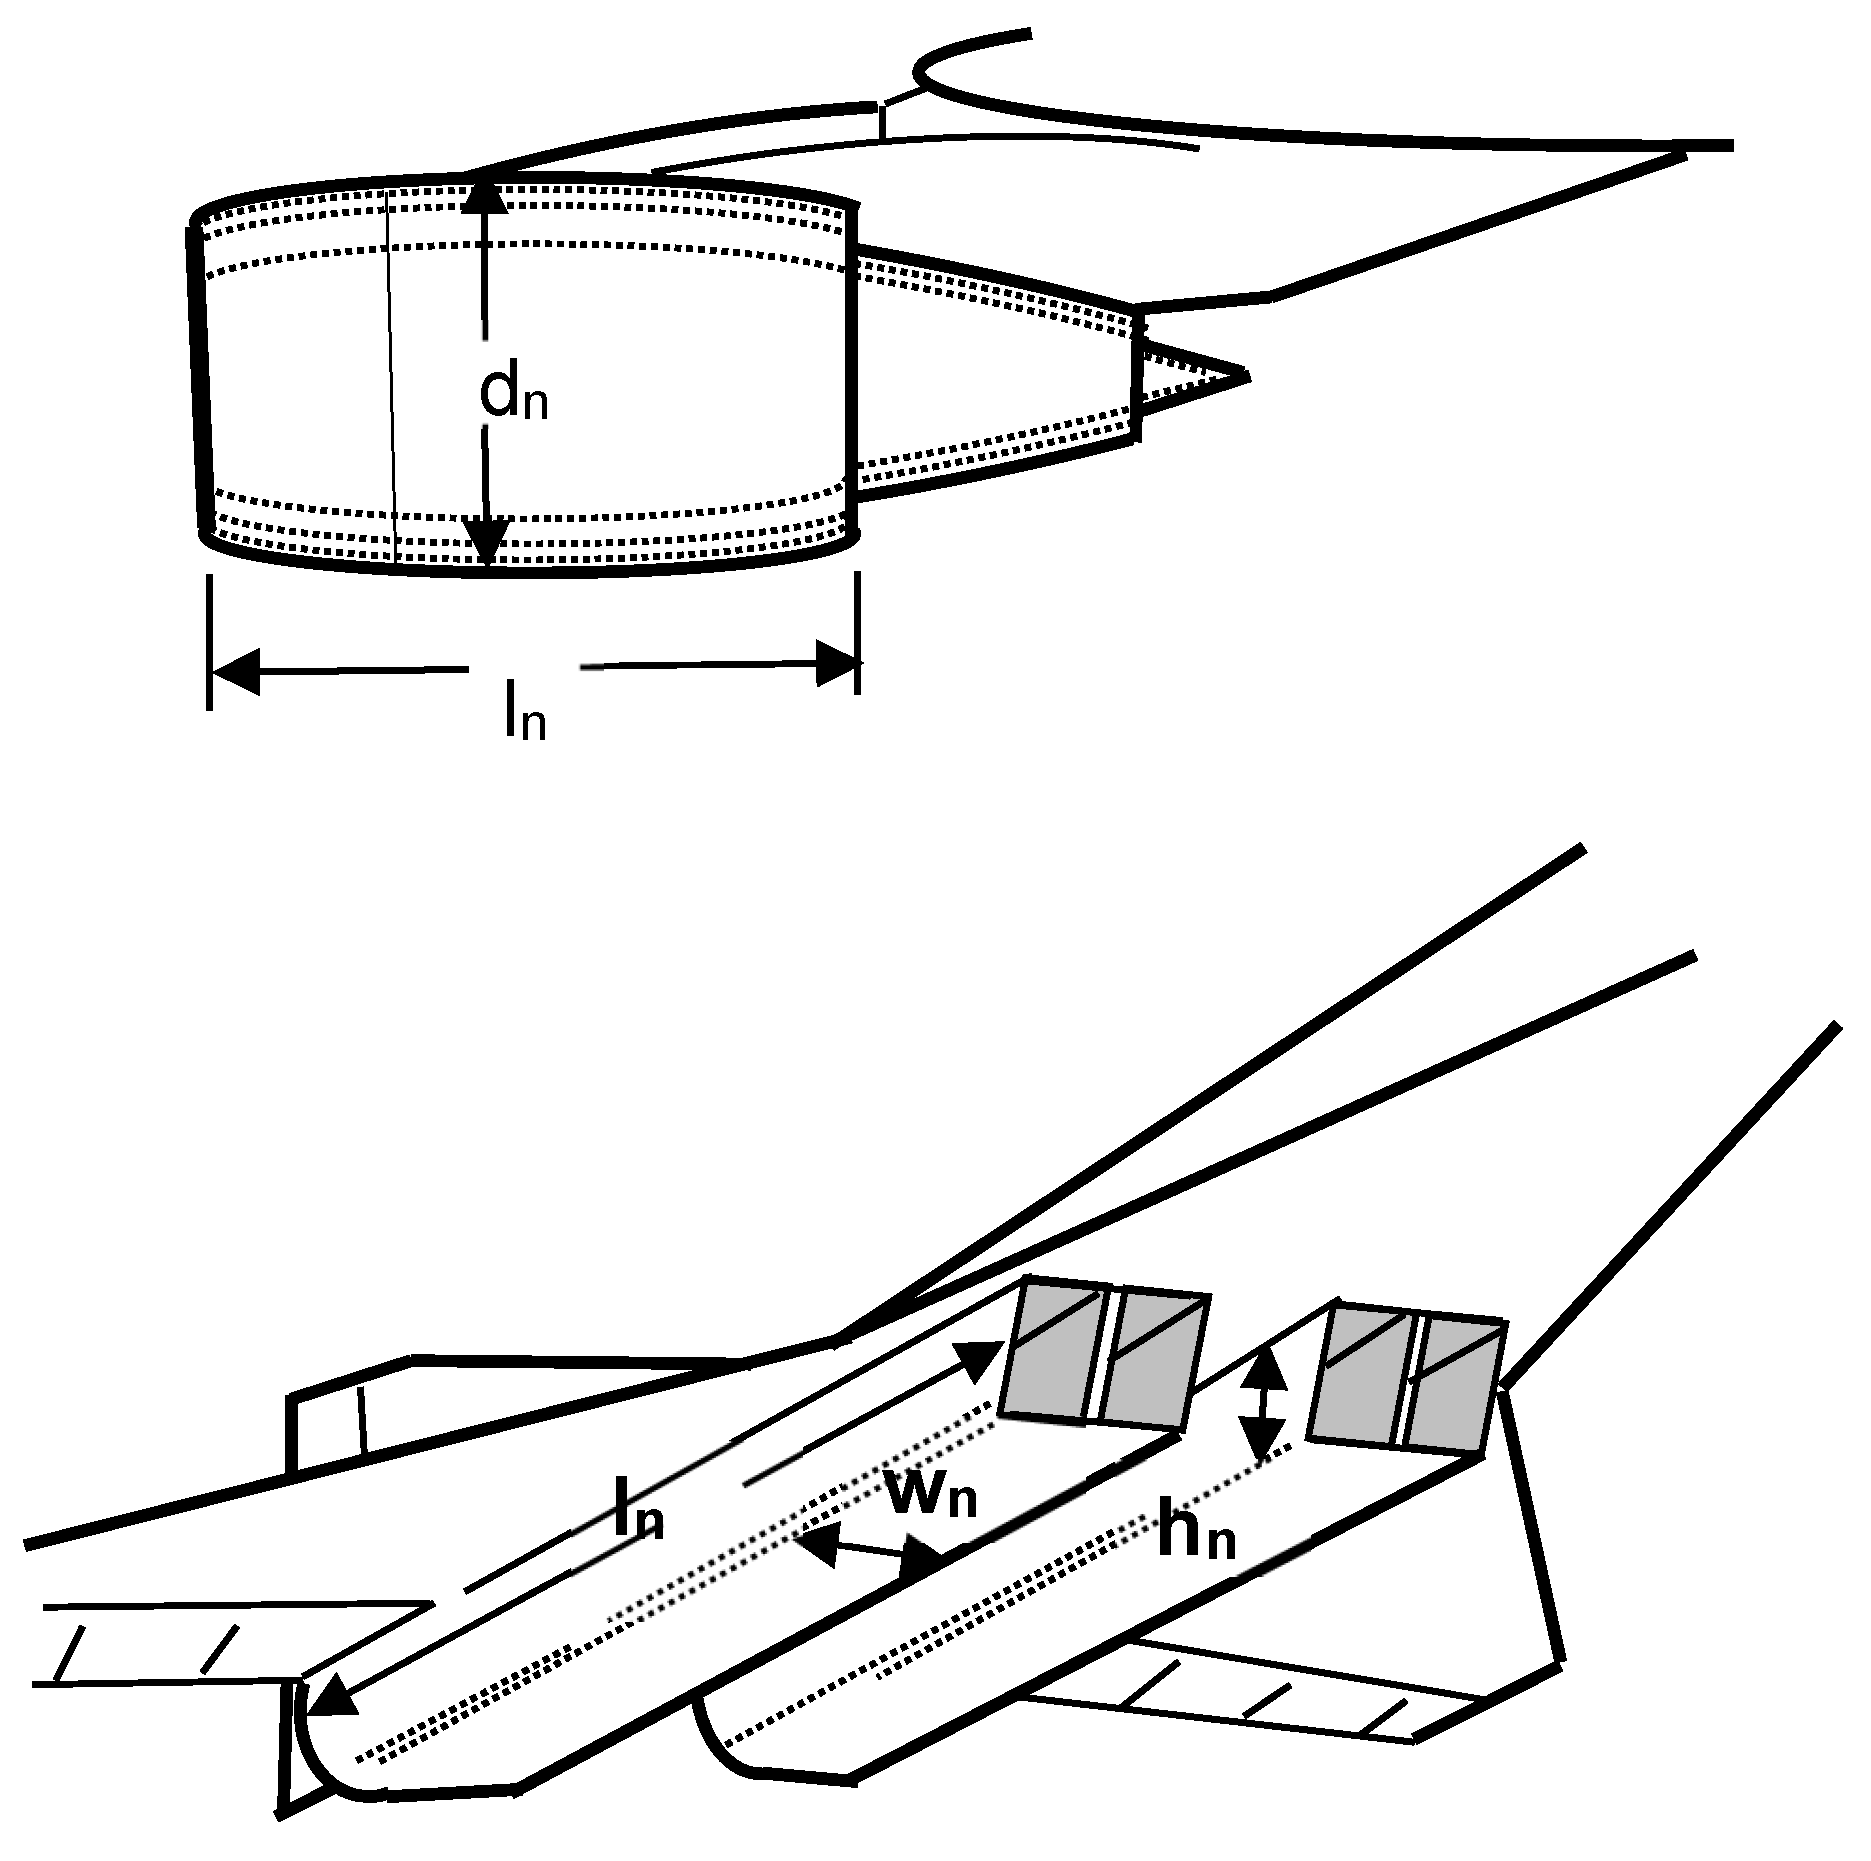
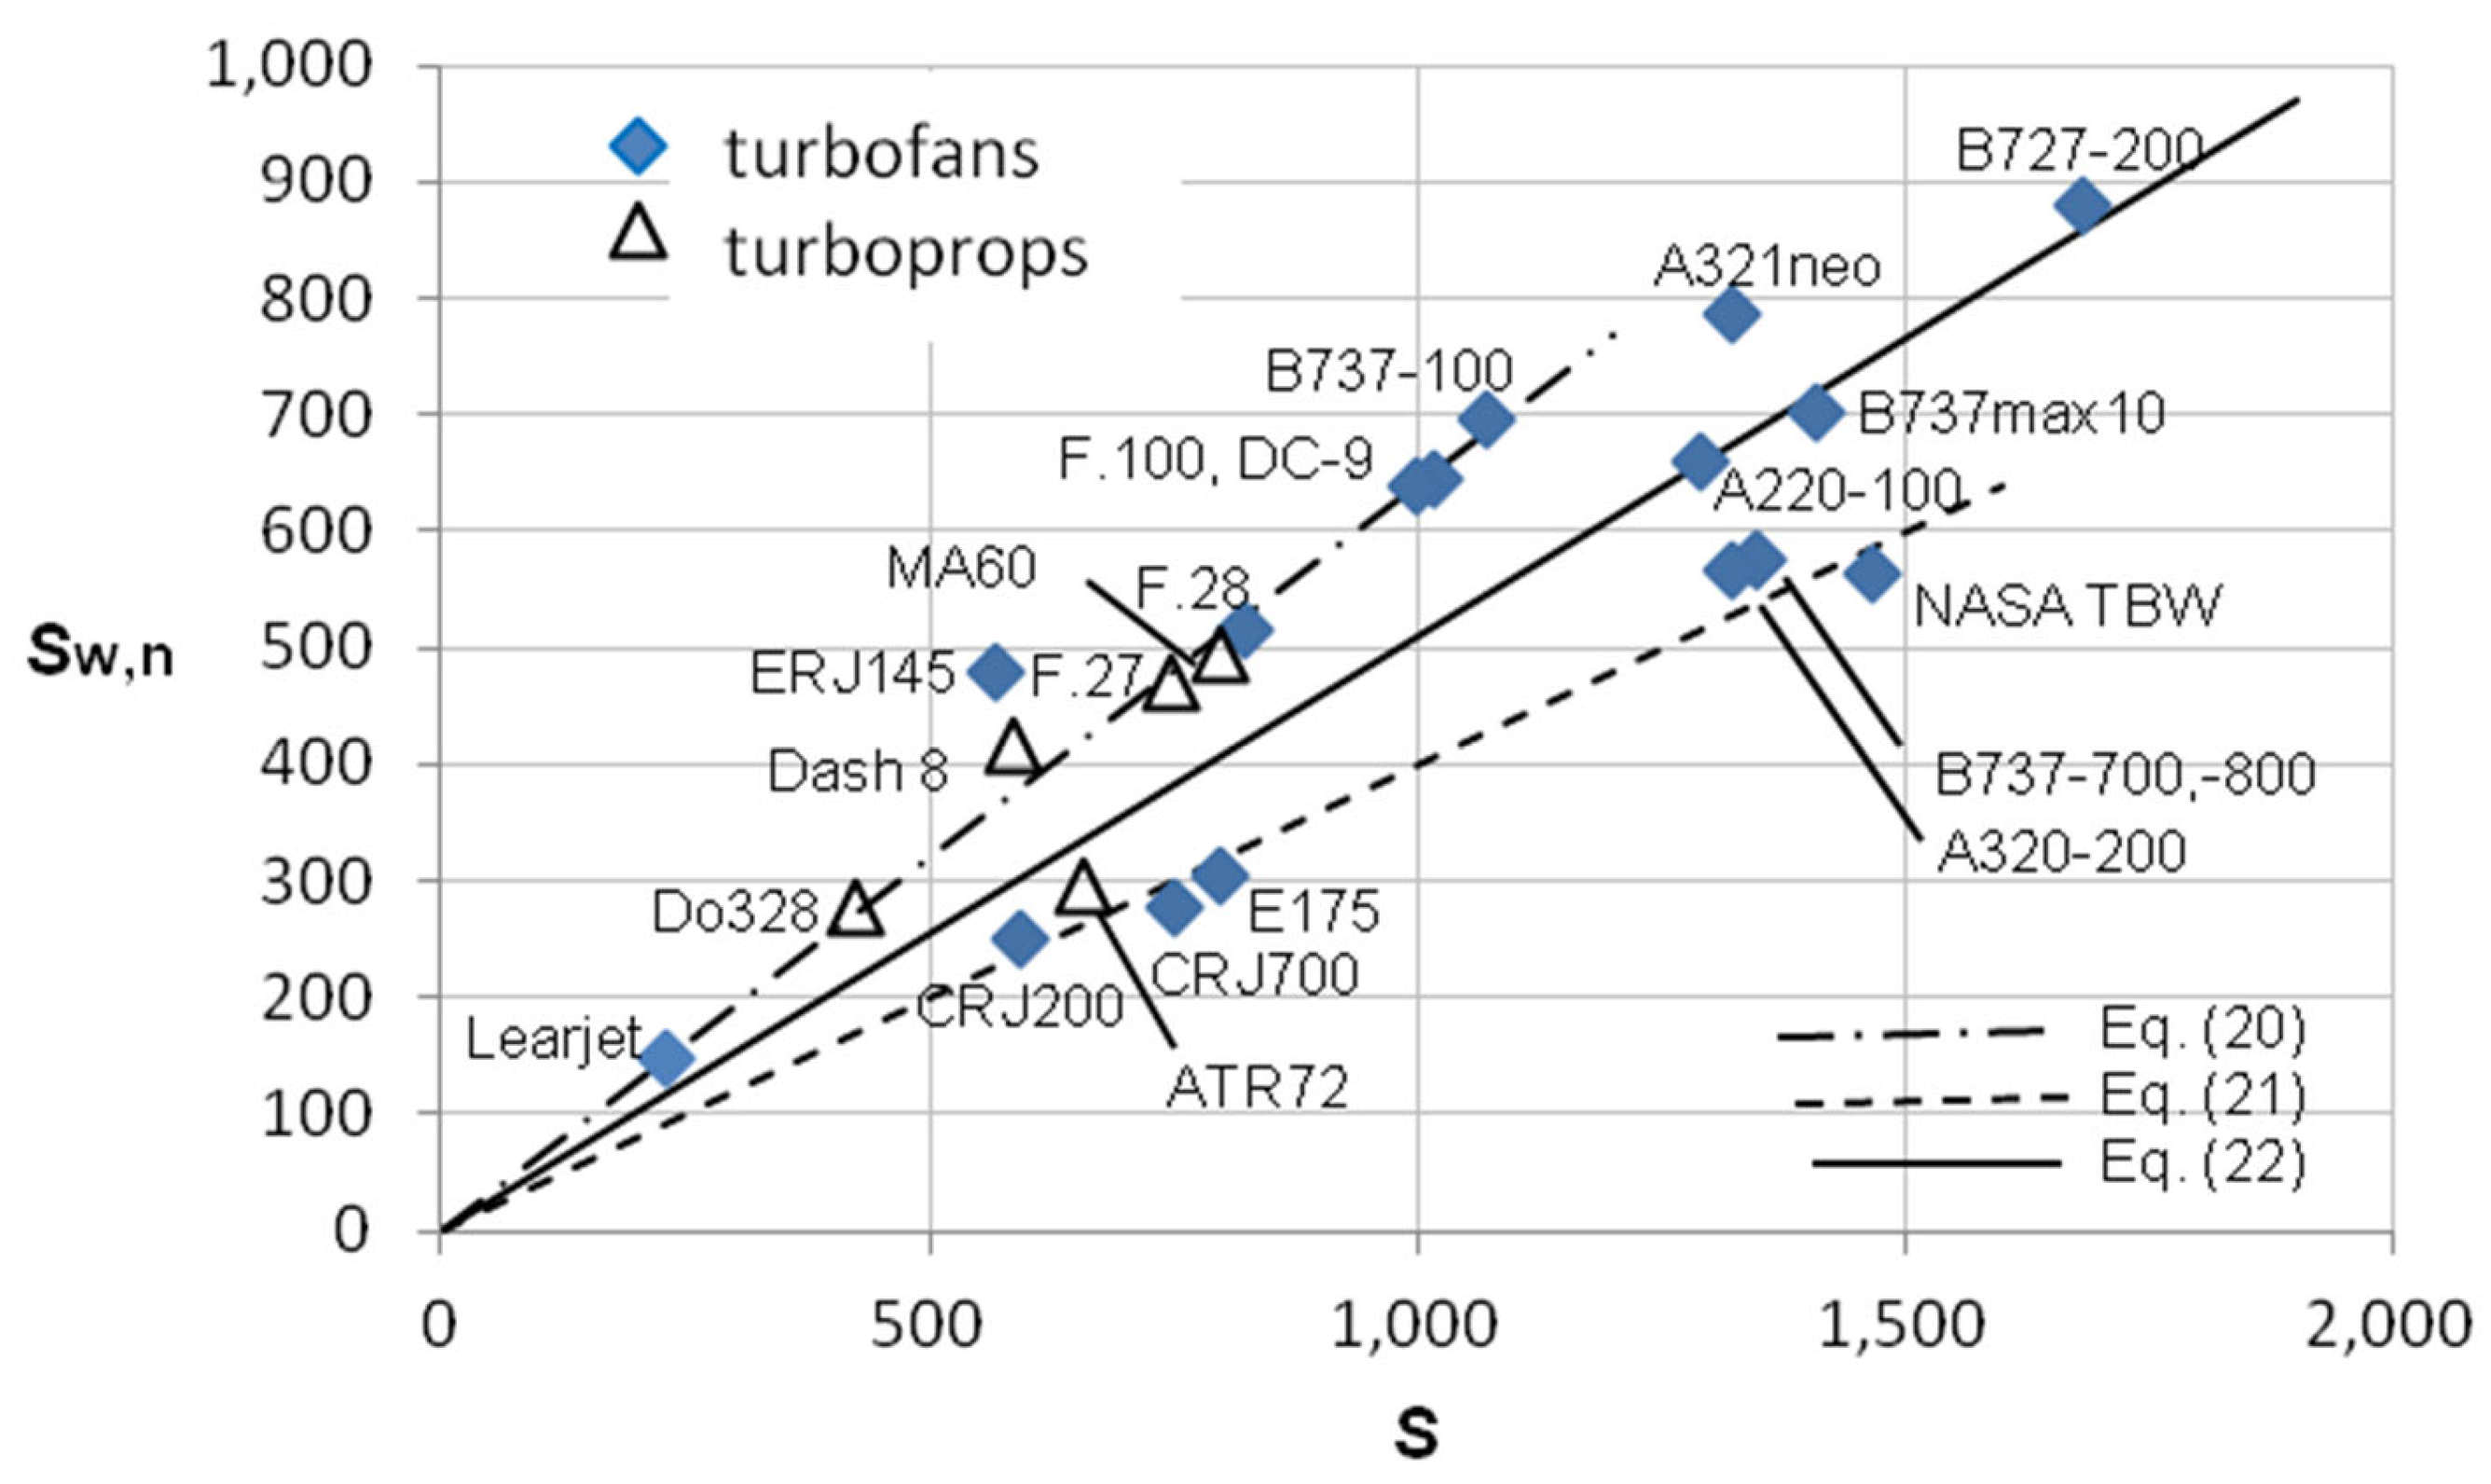
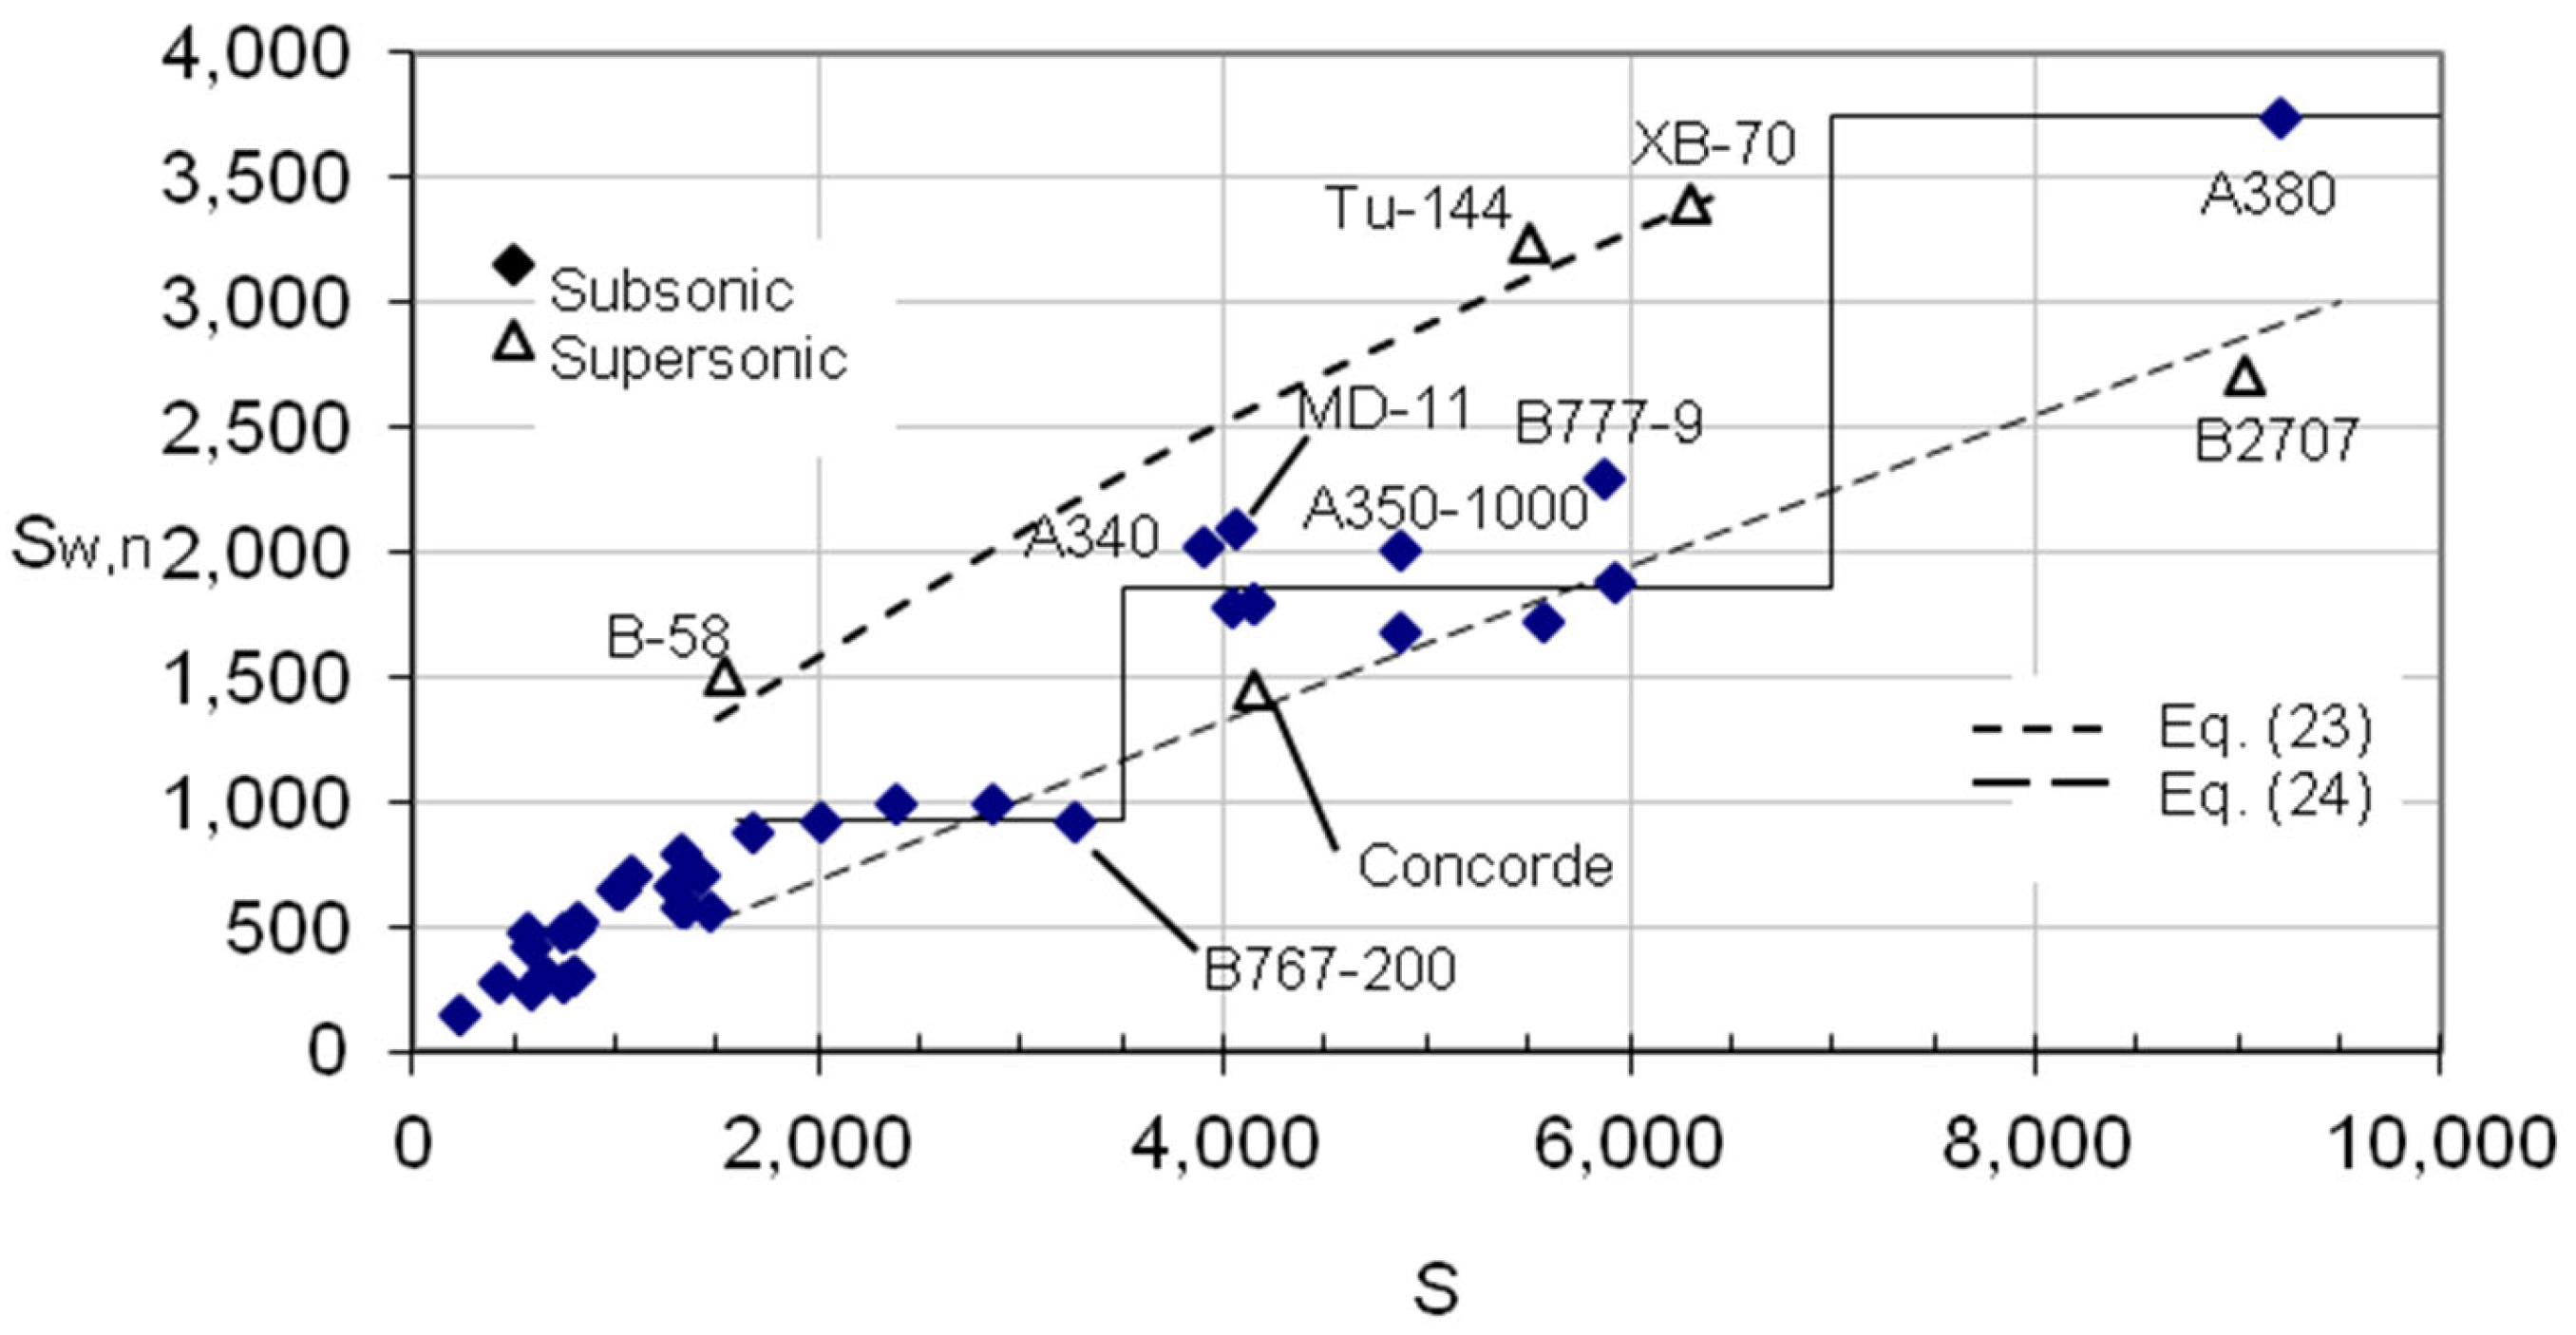
2.4. Nacelle Surface Wetted Area
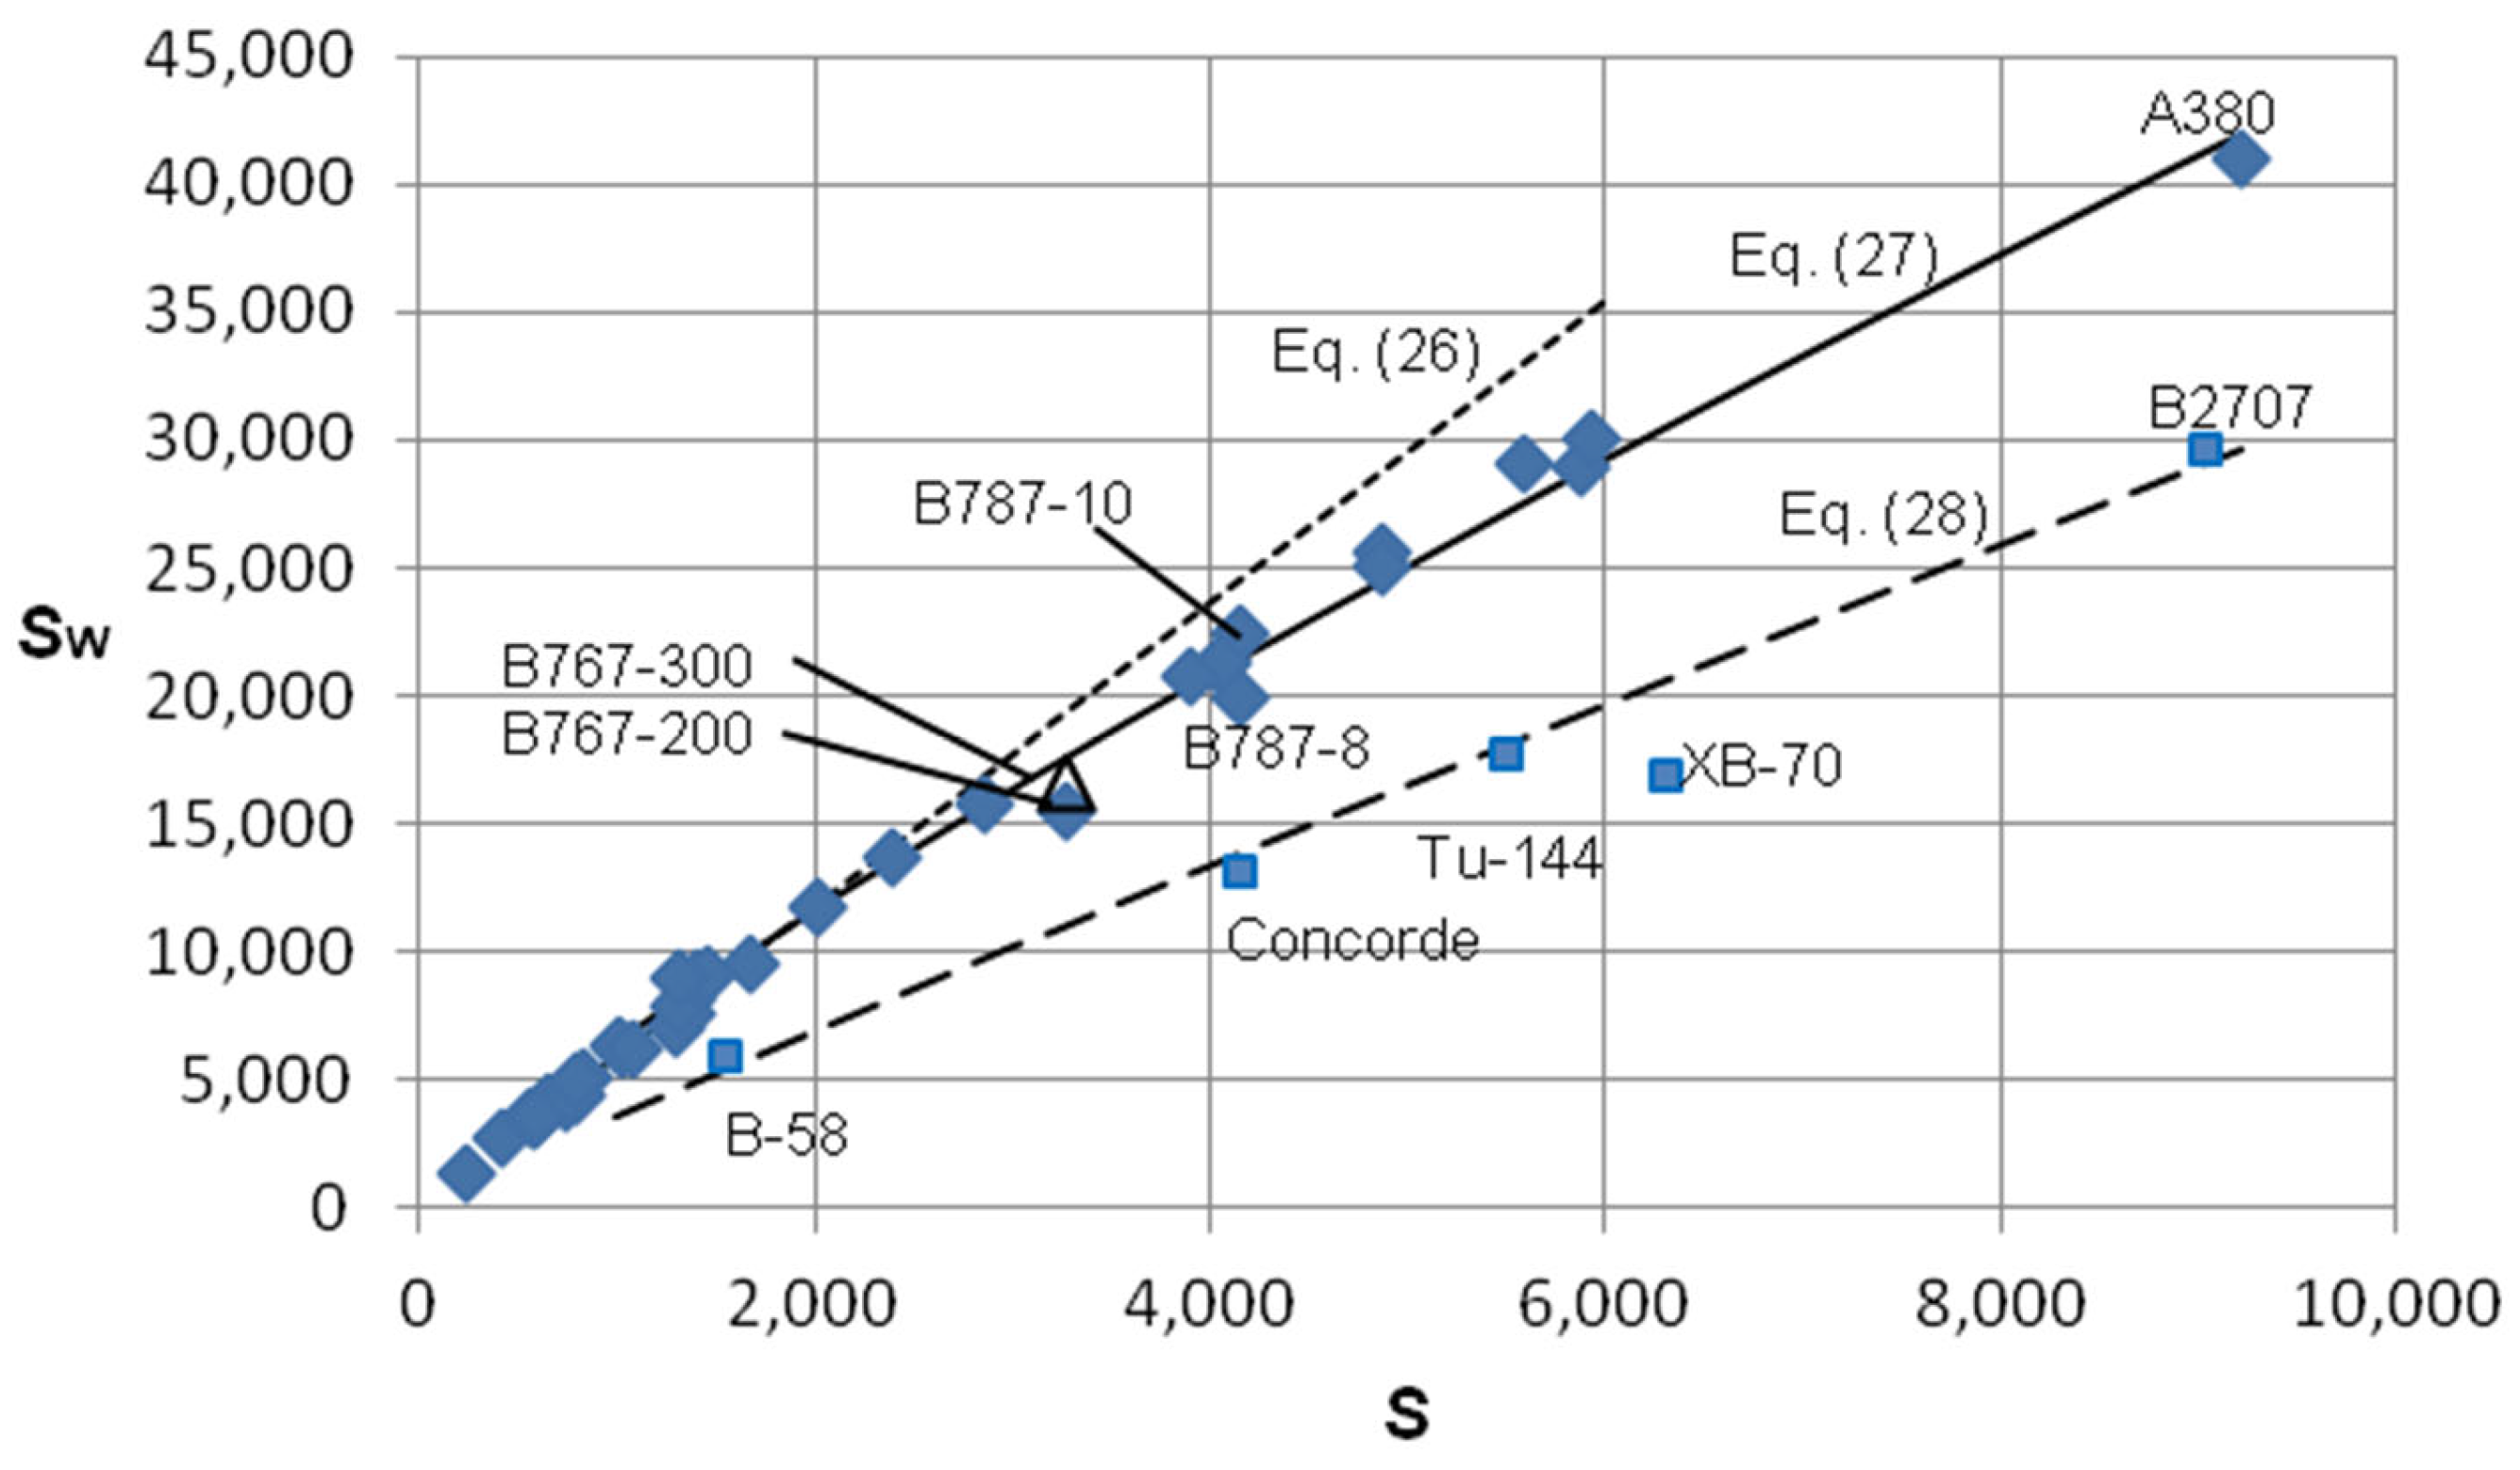
2.5. Total Wetted Area
2.6. Accuracy of the Wetted Area Correlations
3. Influence of Projected and Wetted Areas on Design
3.1. Accounting for Fuselage Stretch
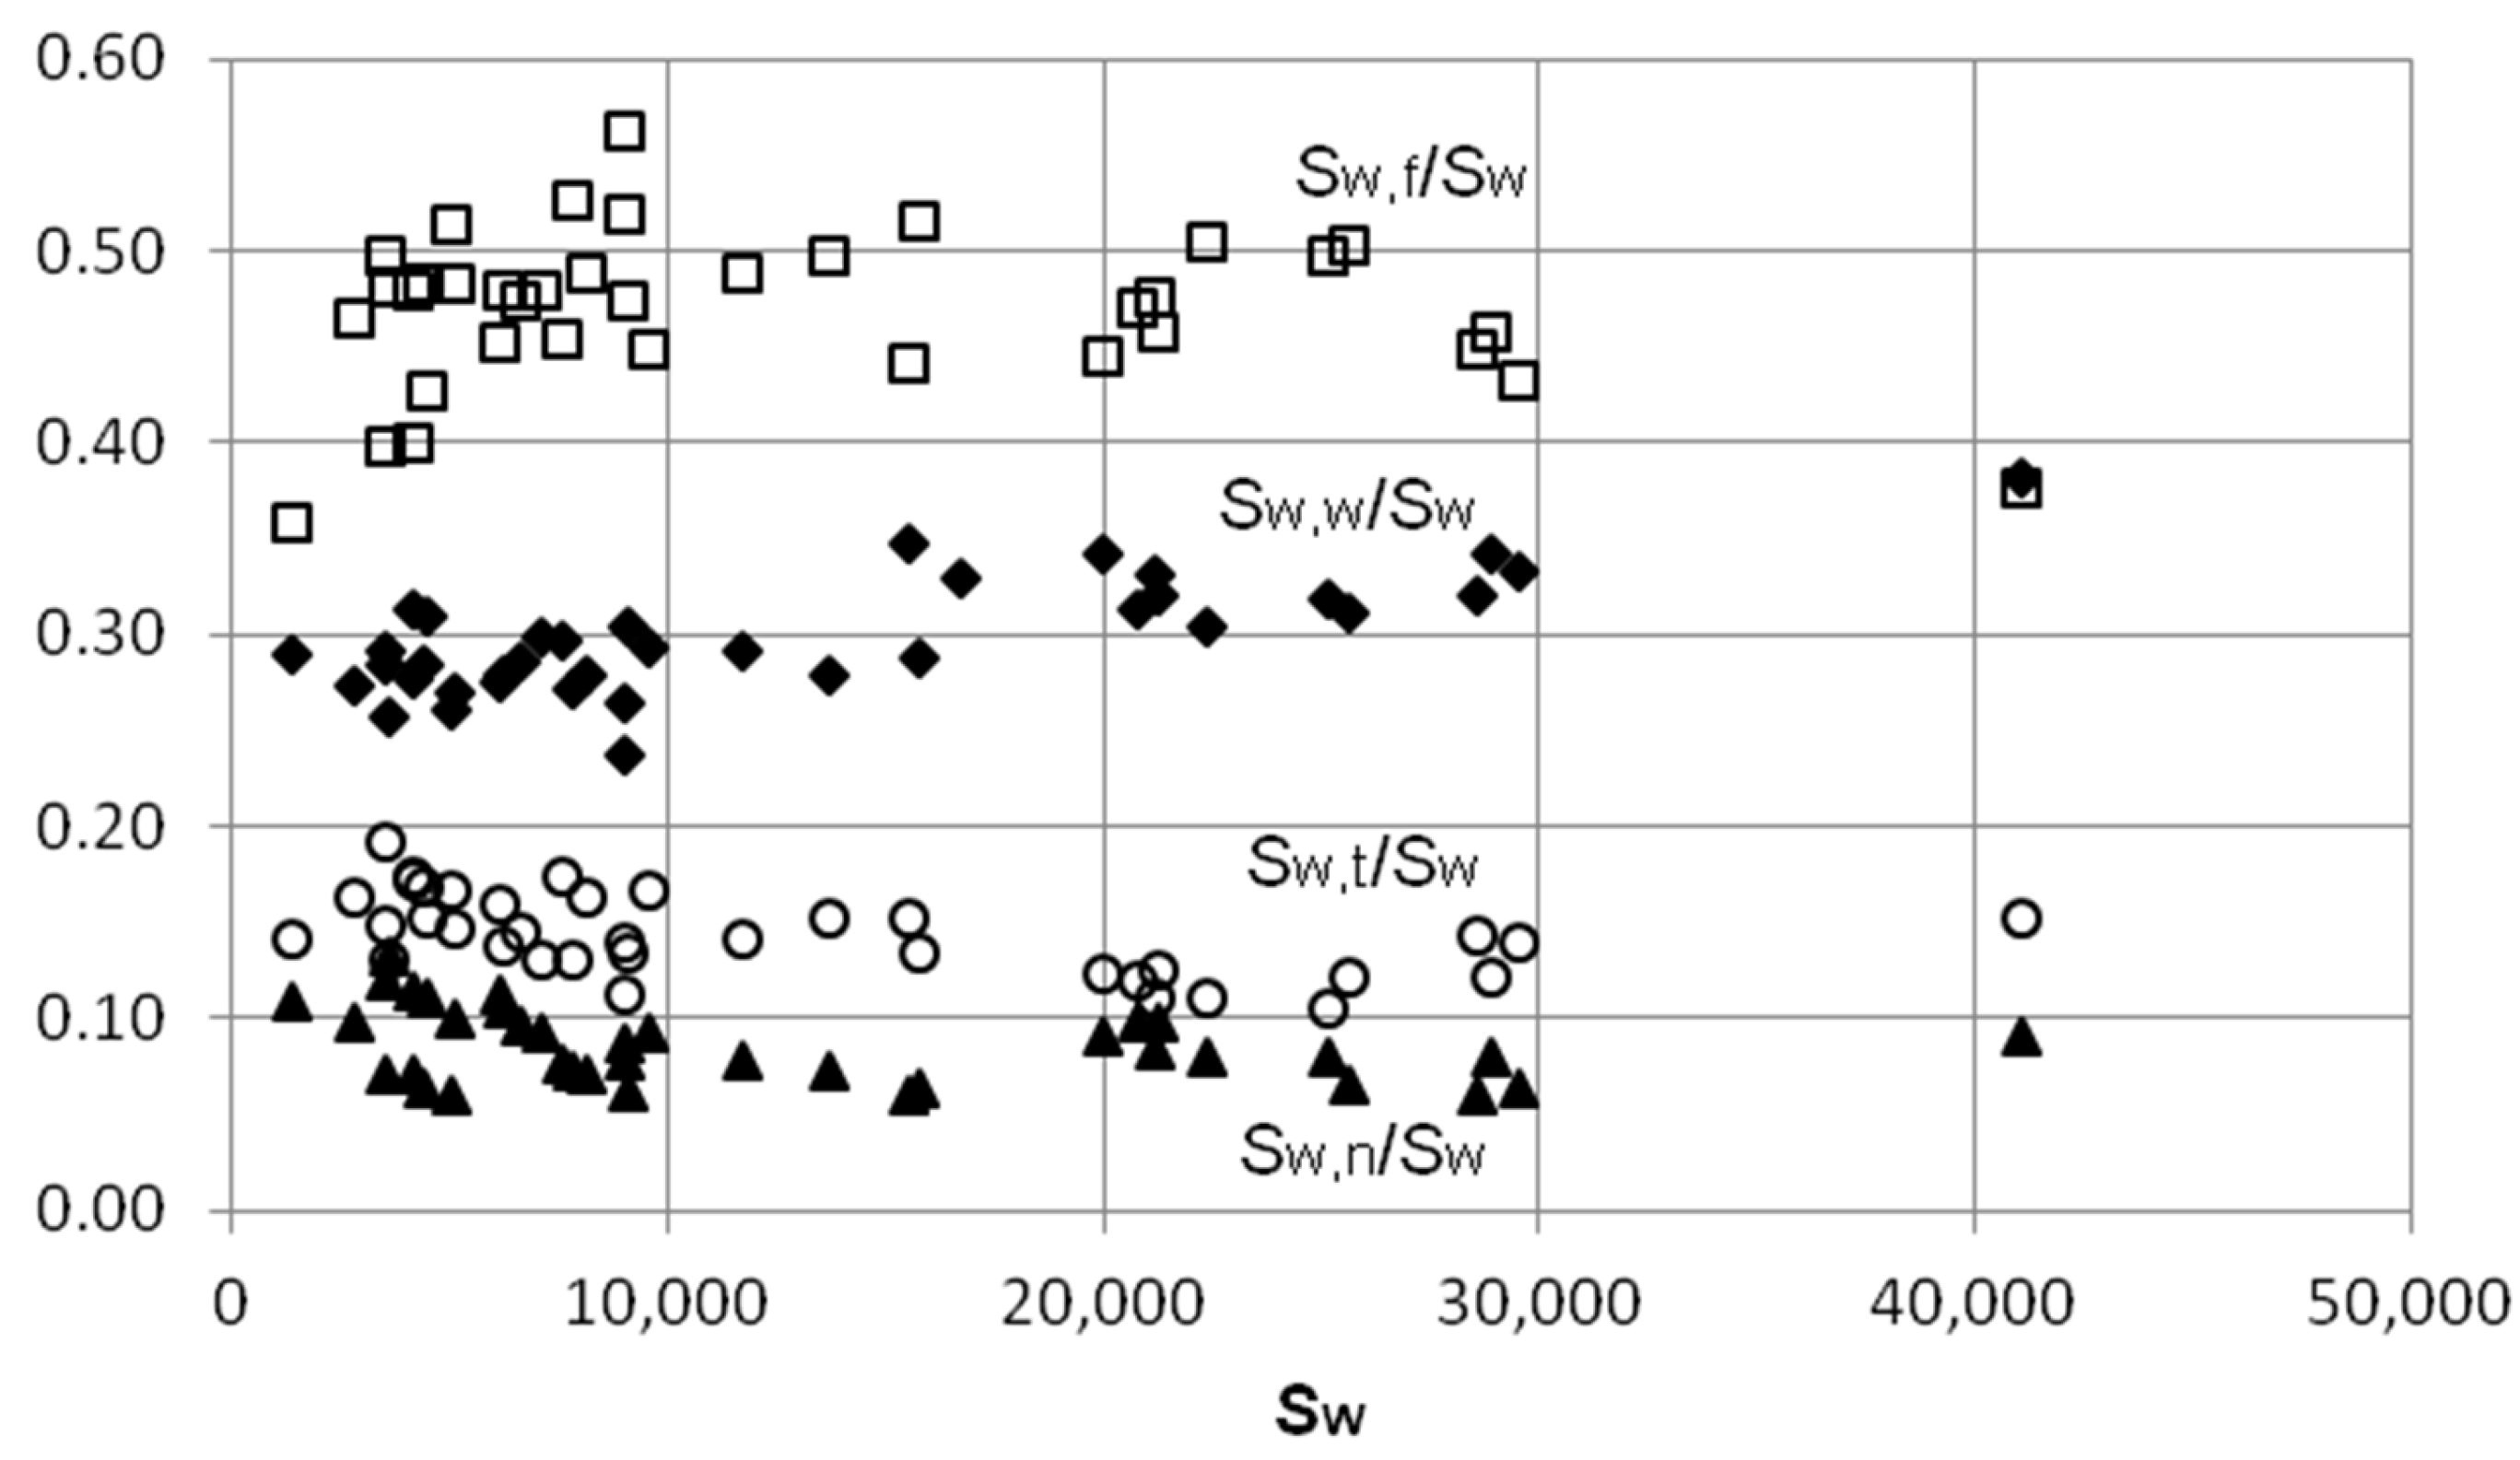
3.2. Trends in Component Wetted Areas
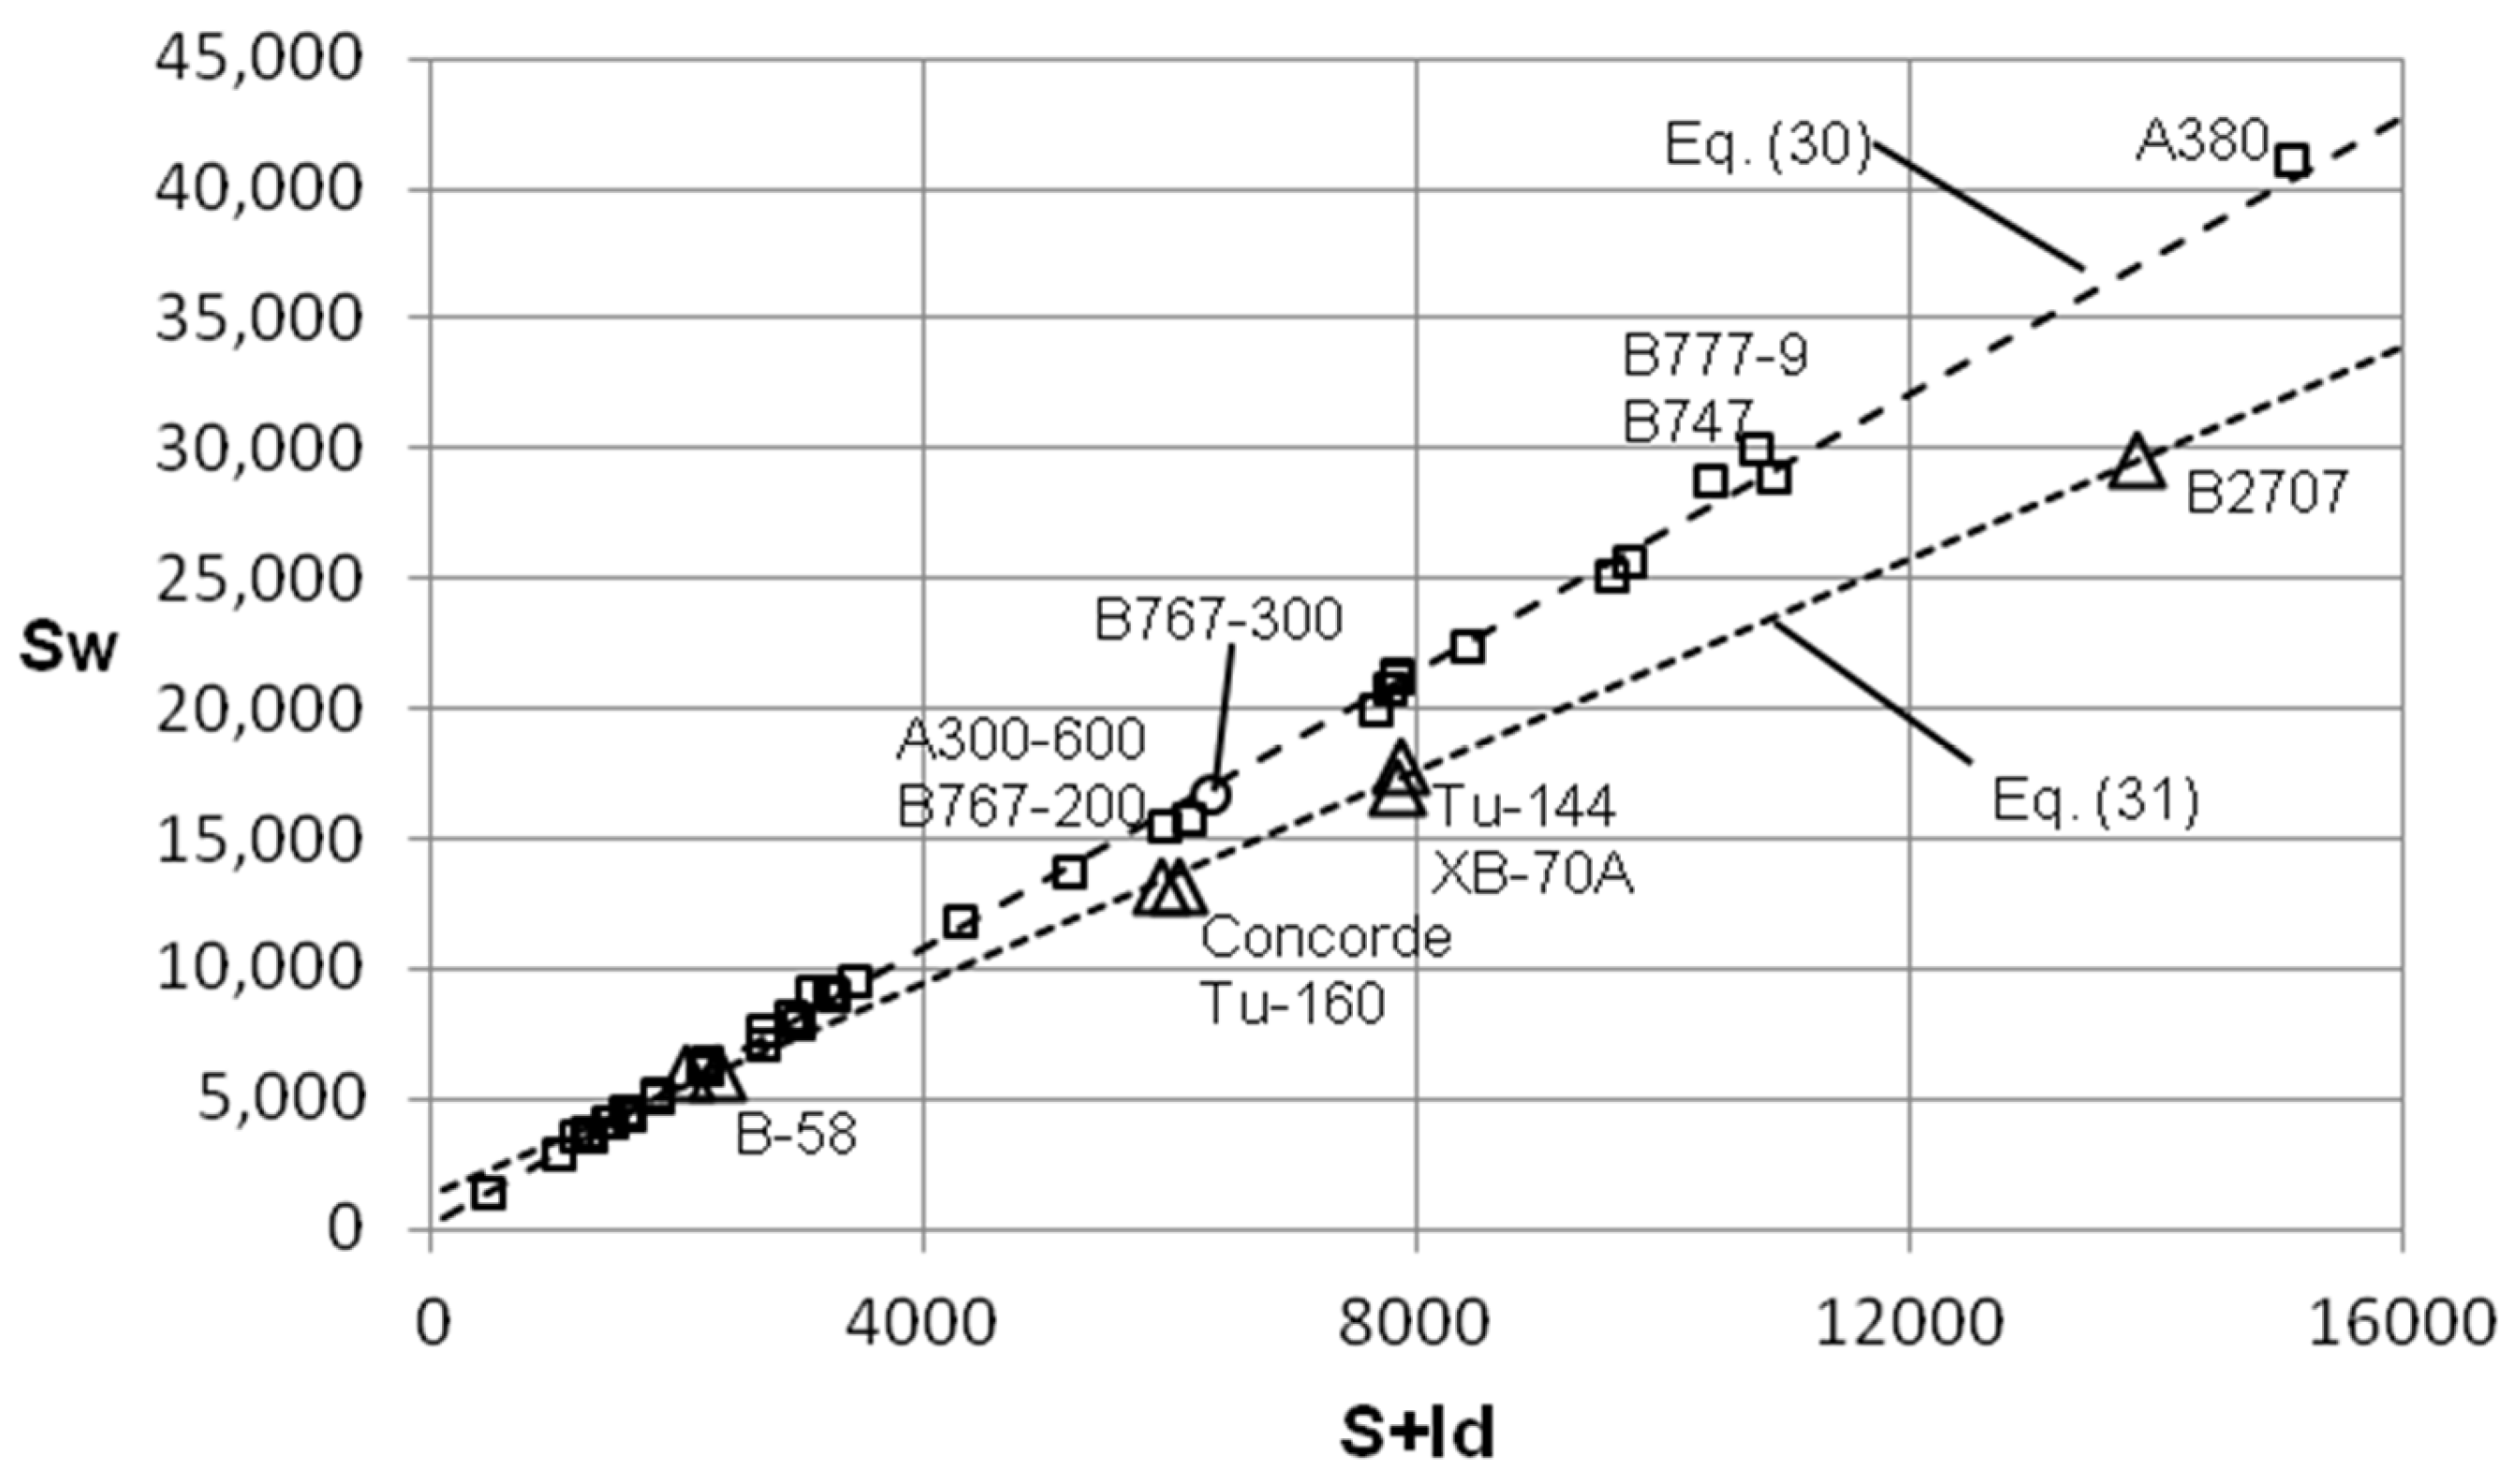
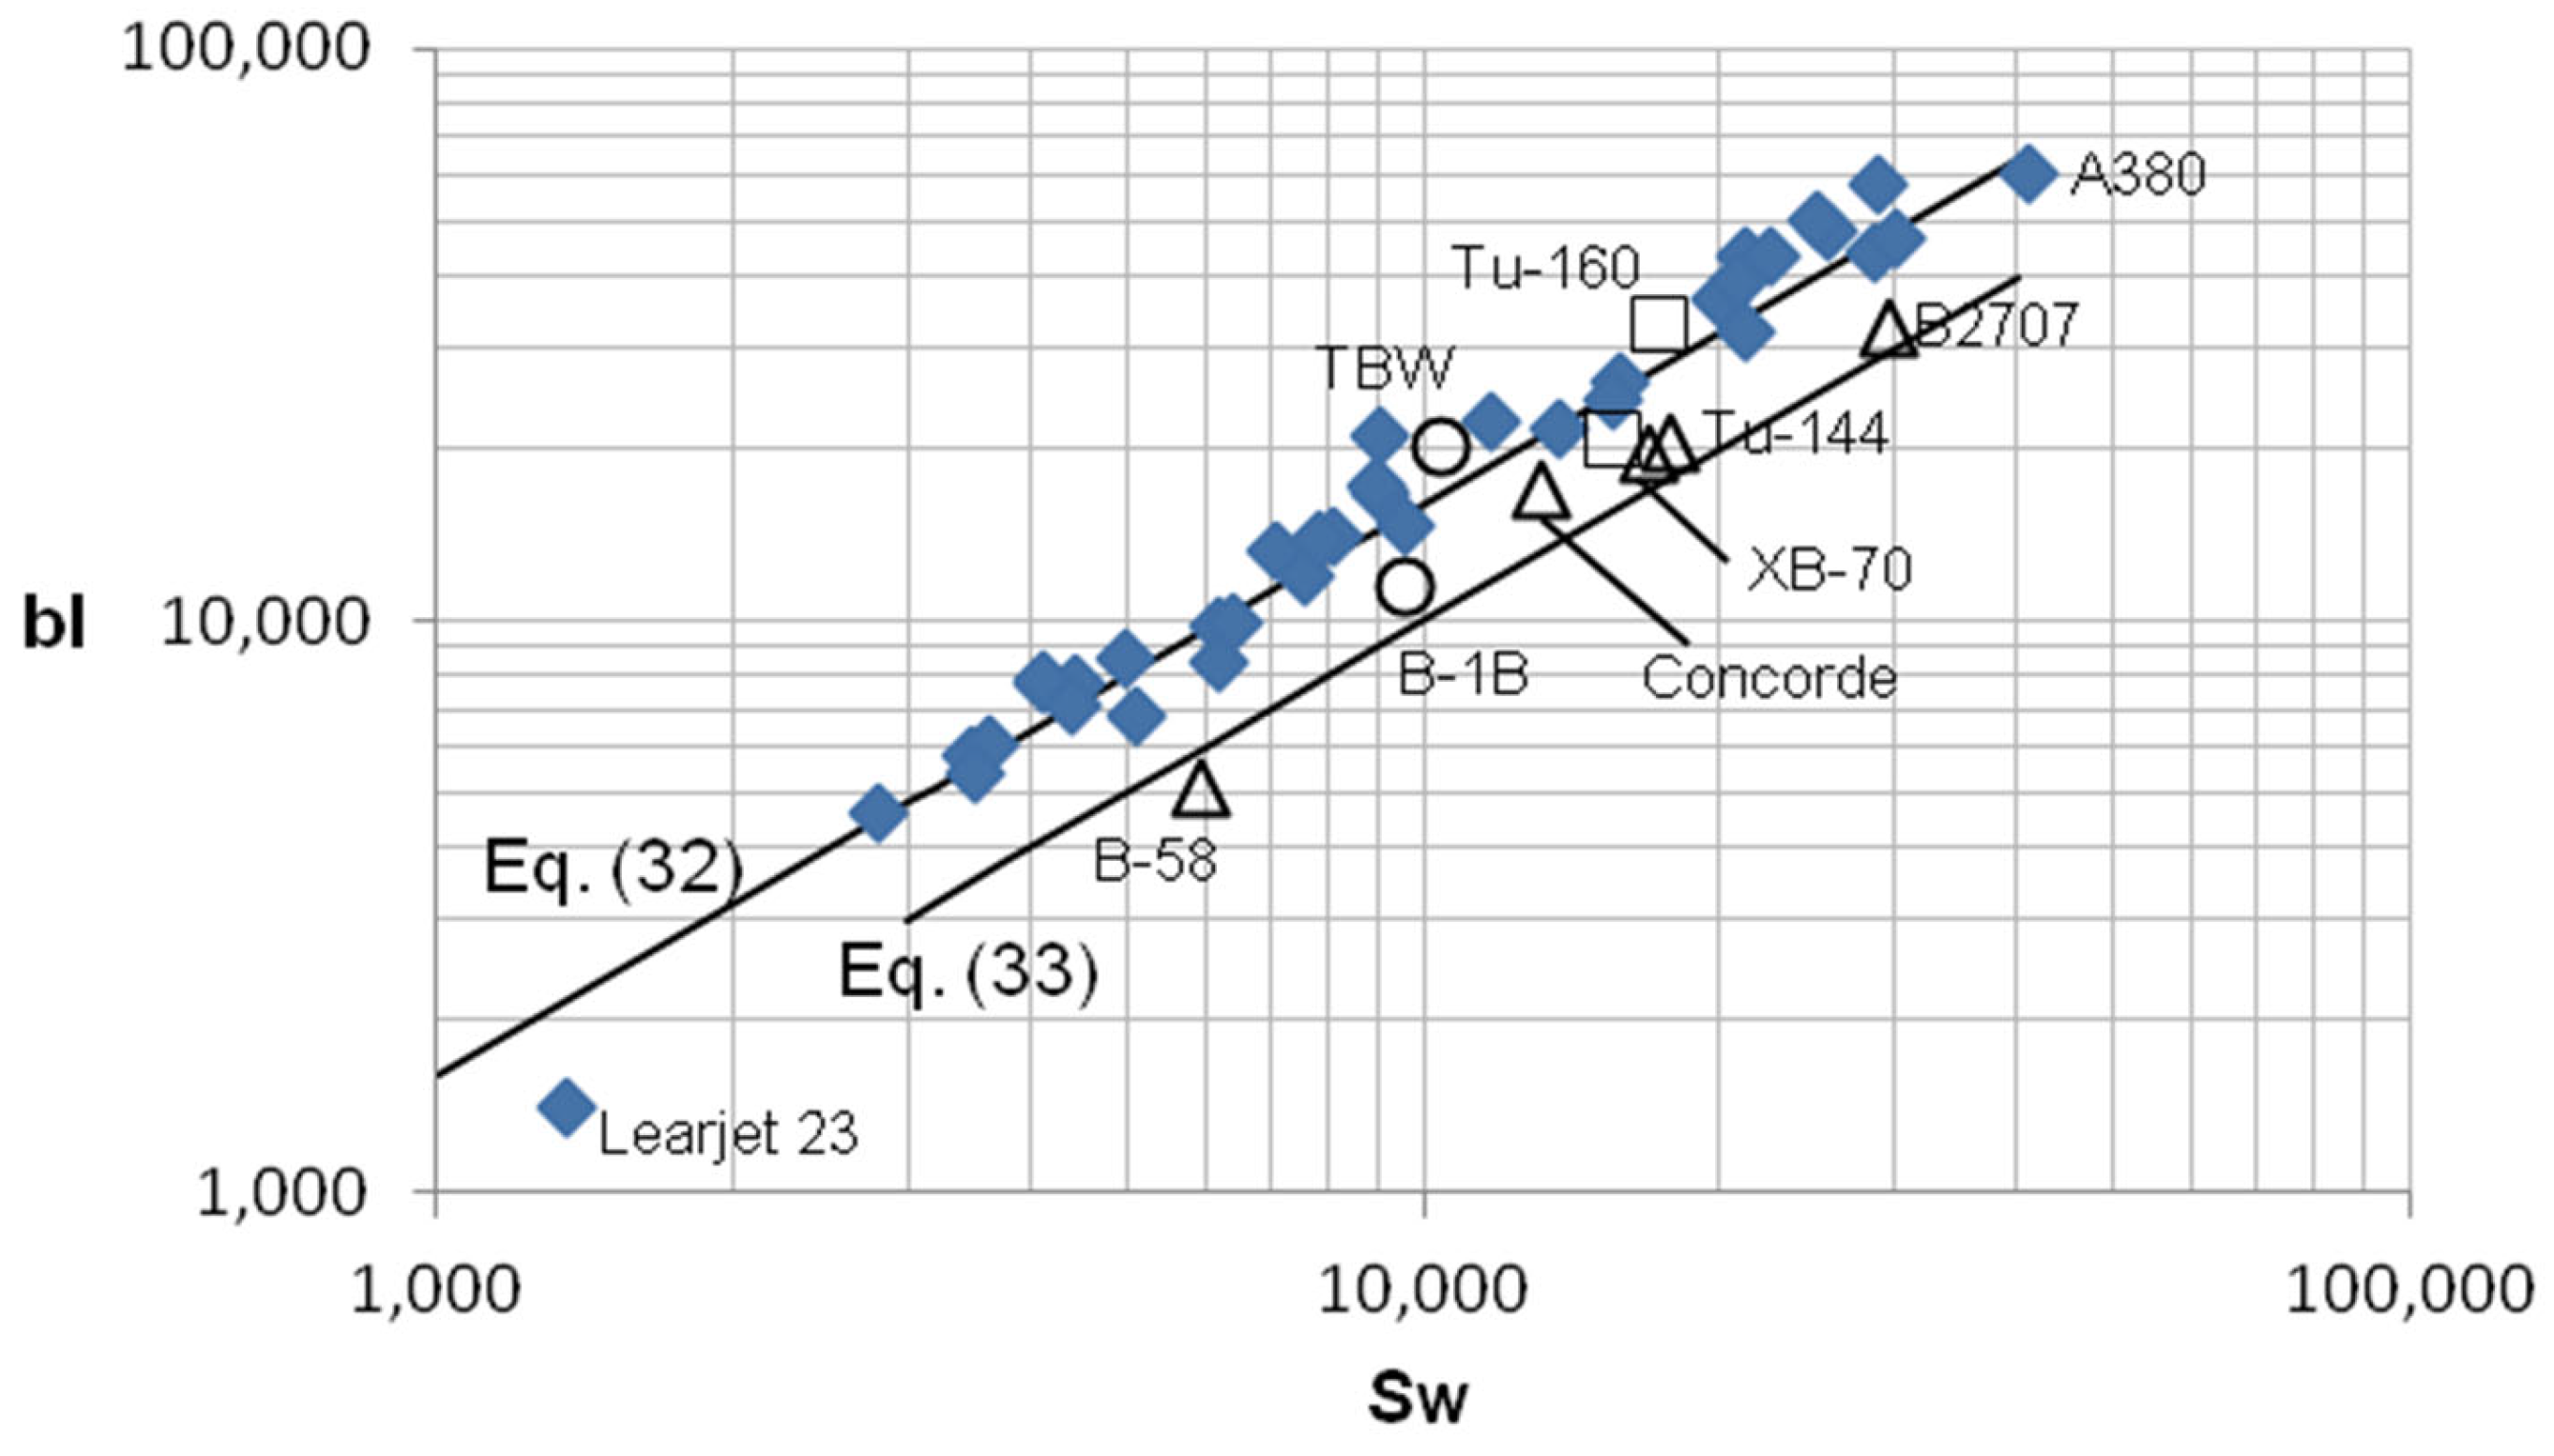
3.3. Planform Envelope and Wetted Area
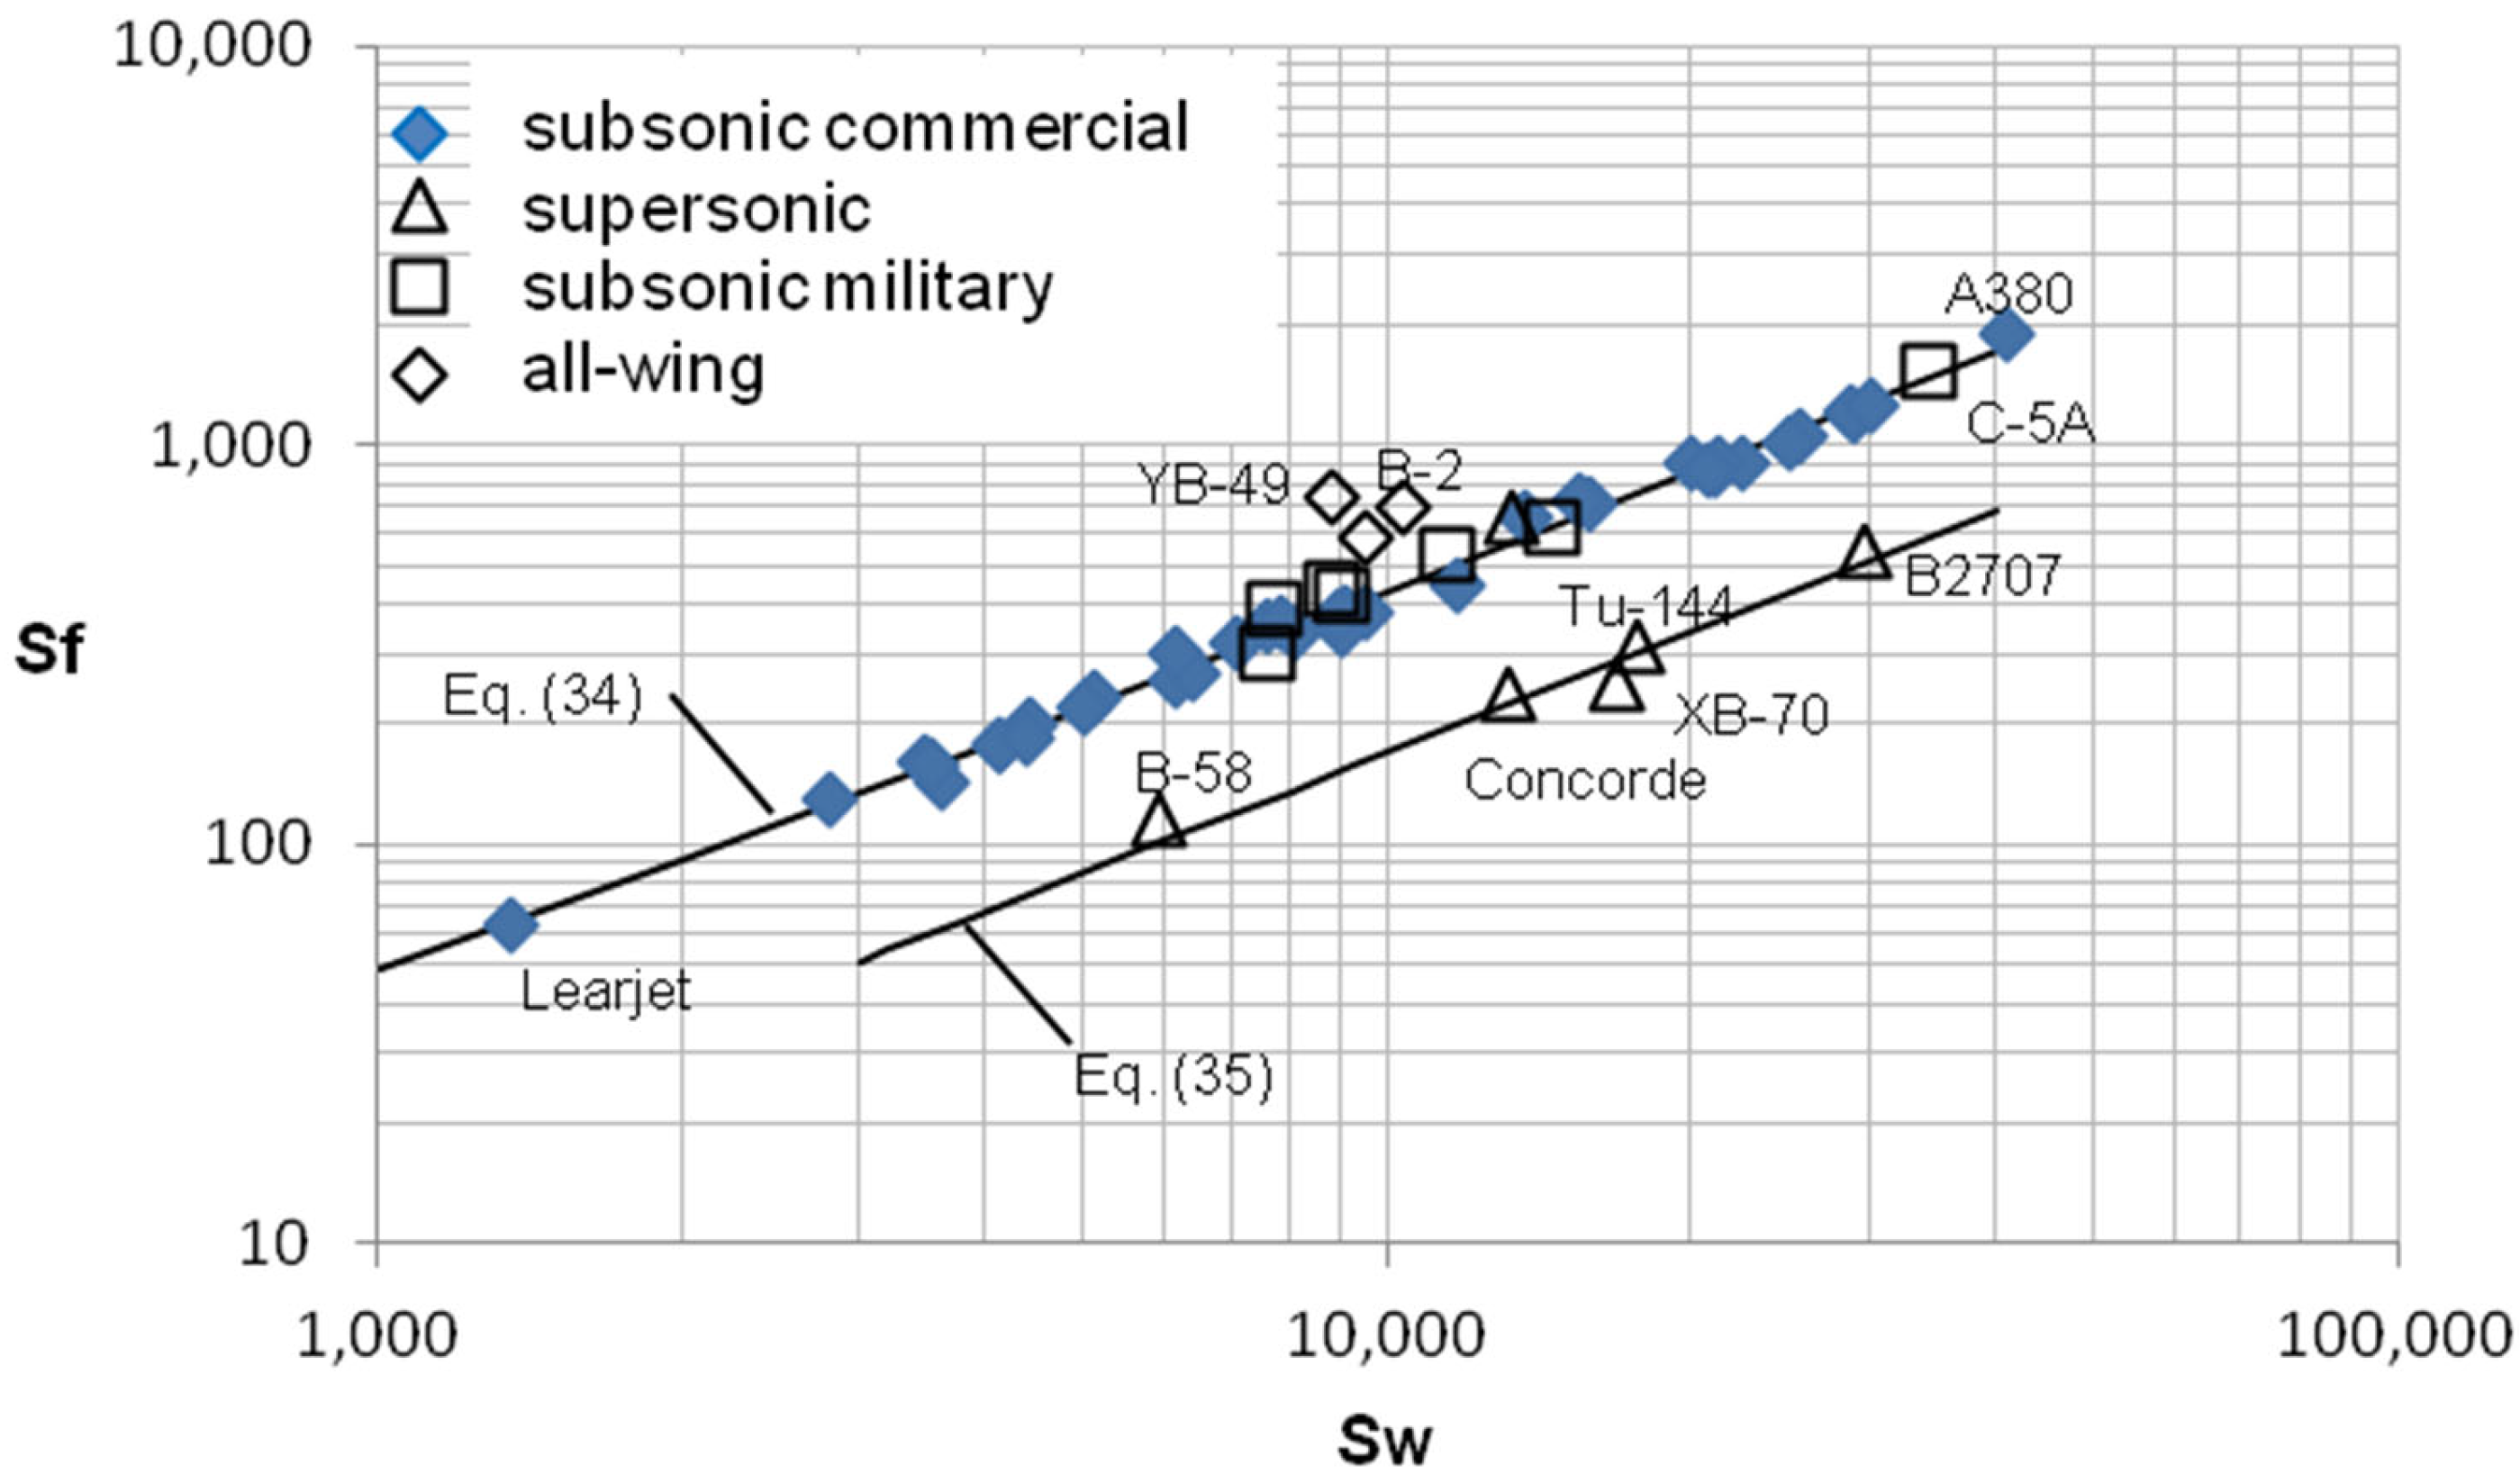
3.4. Frontal Area Relation to Wetted Area
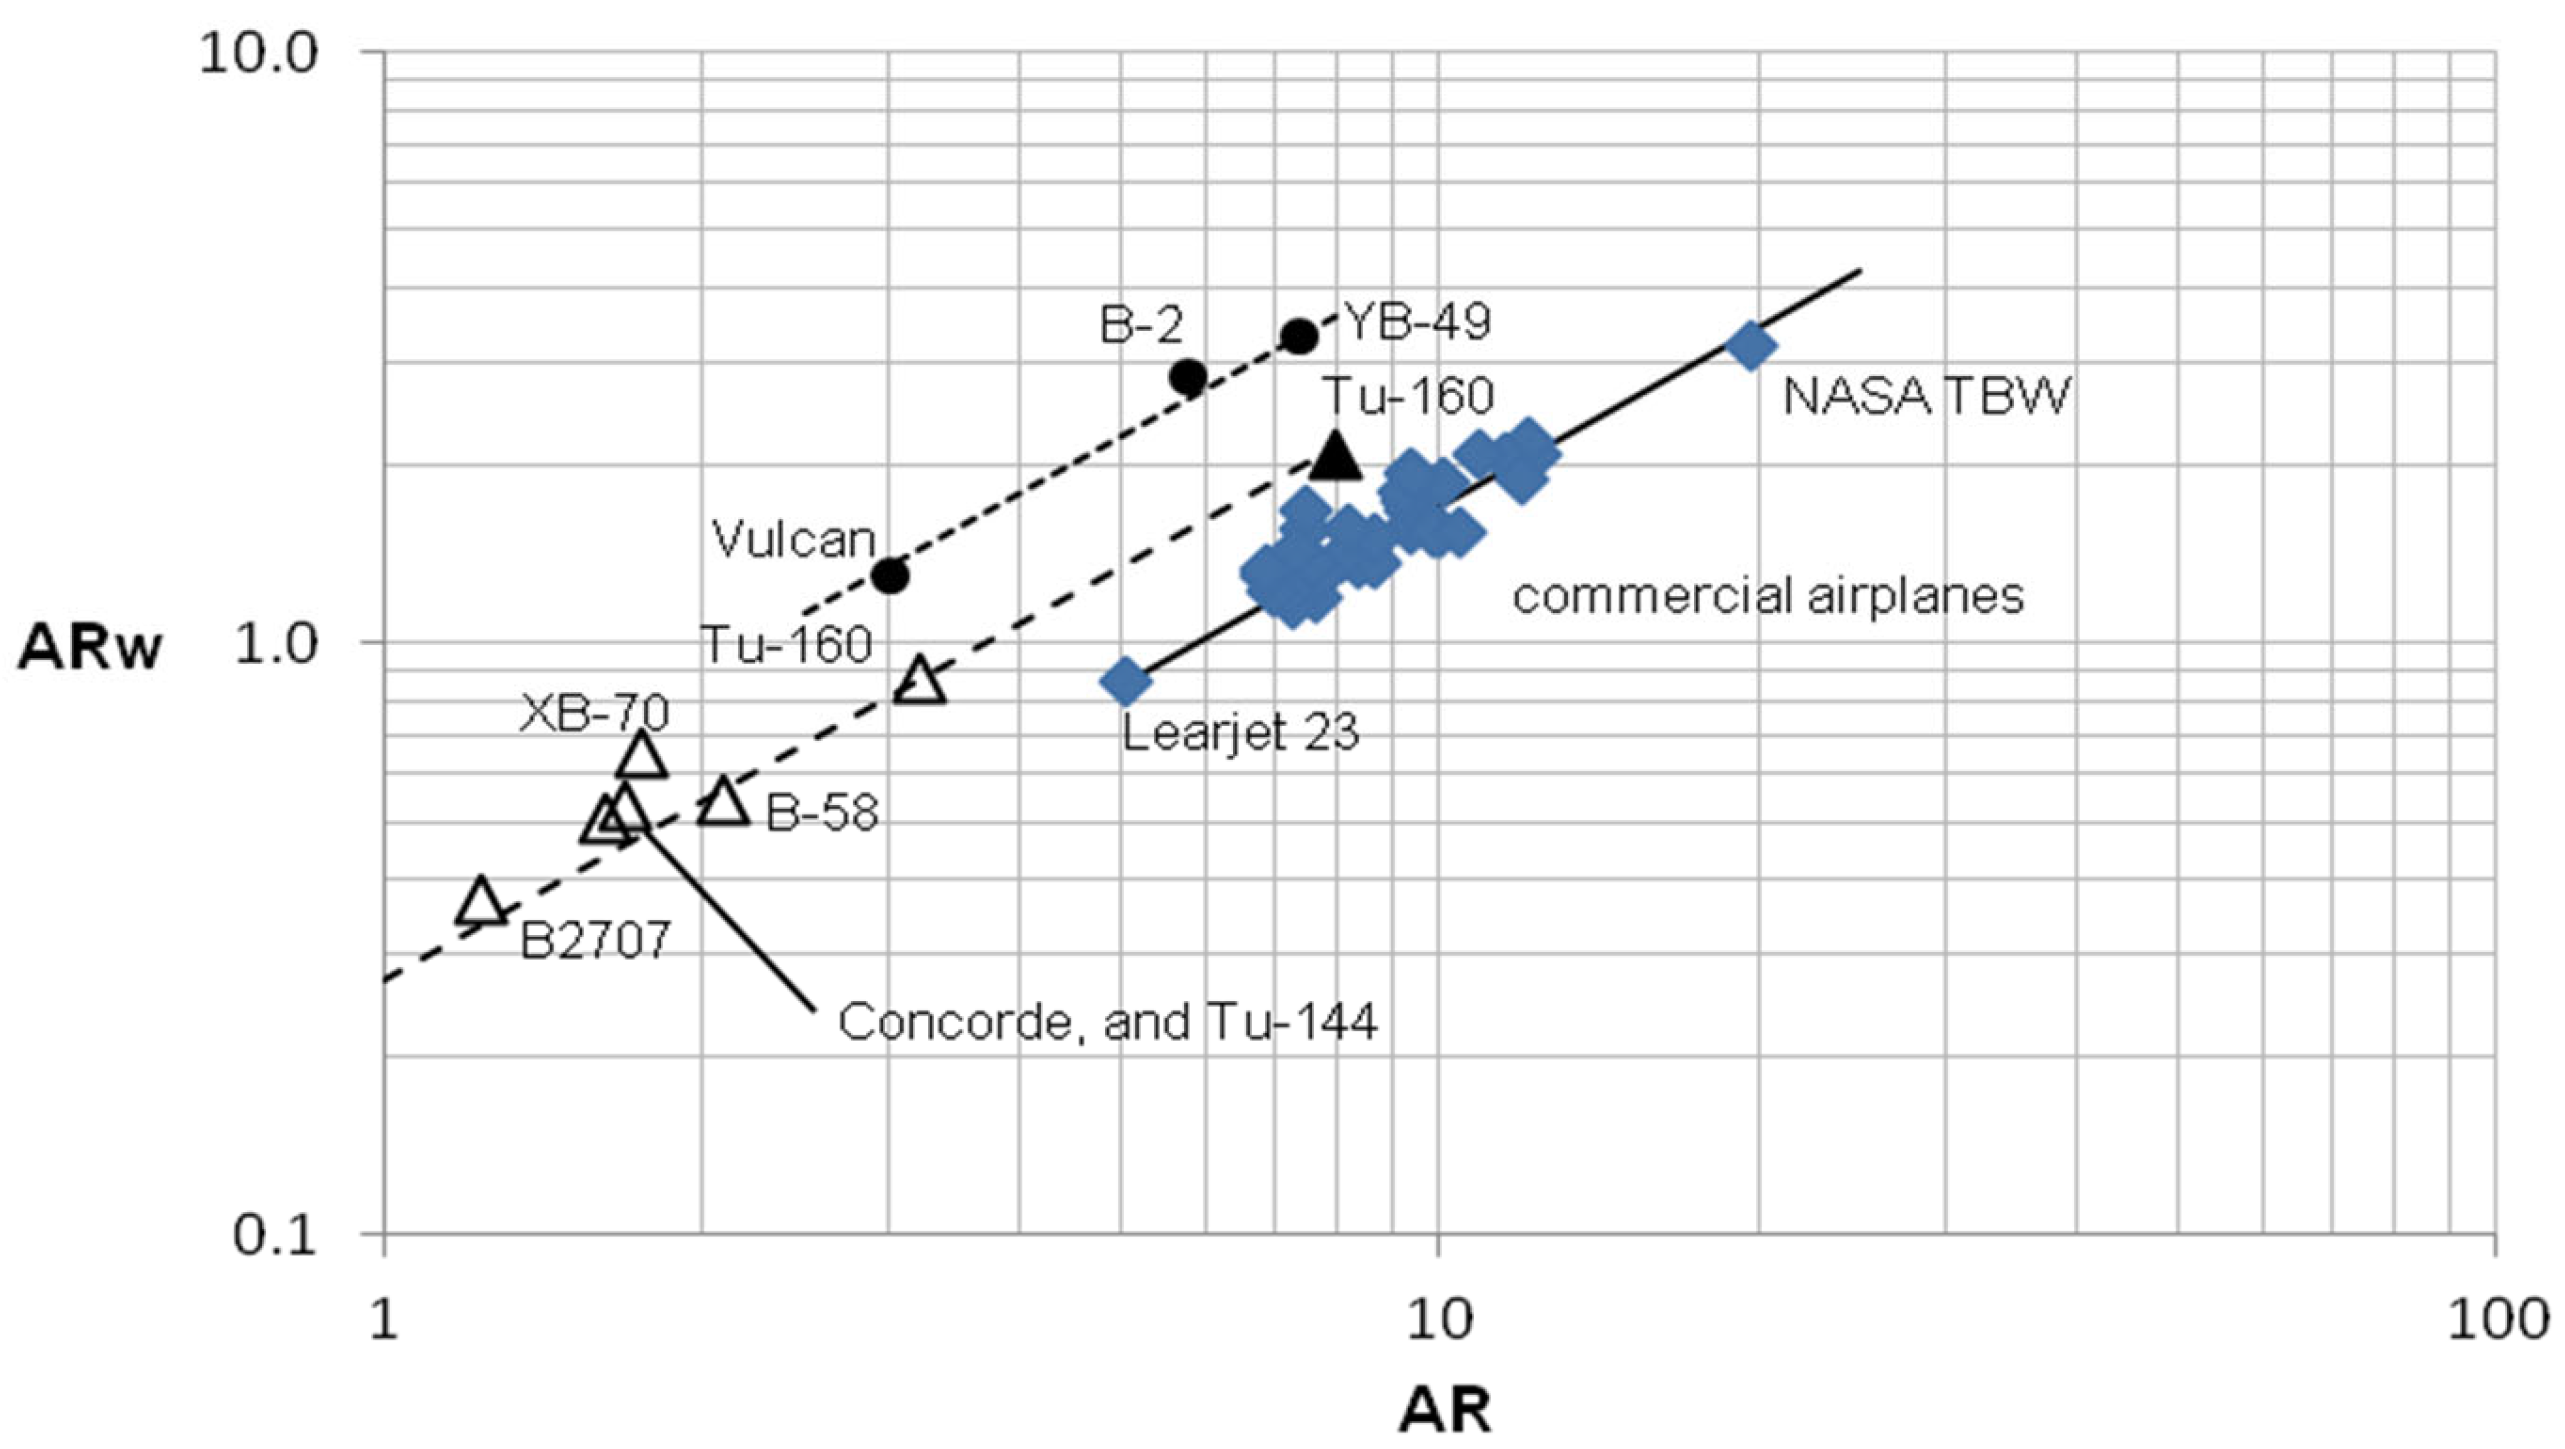
3.5. Aspect Ratios and Their Influence
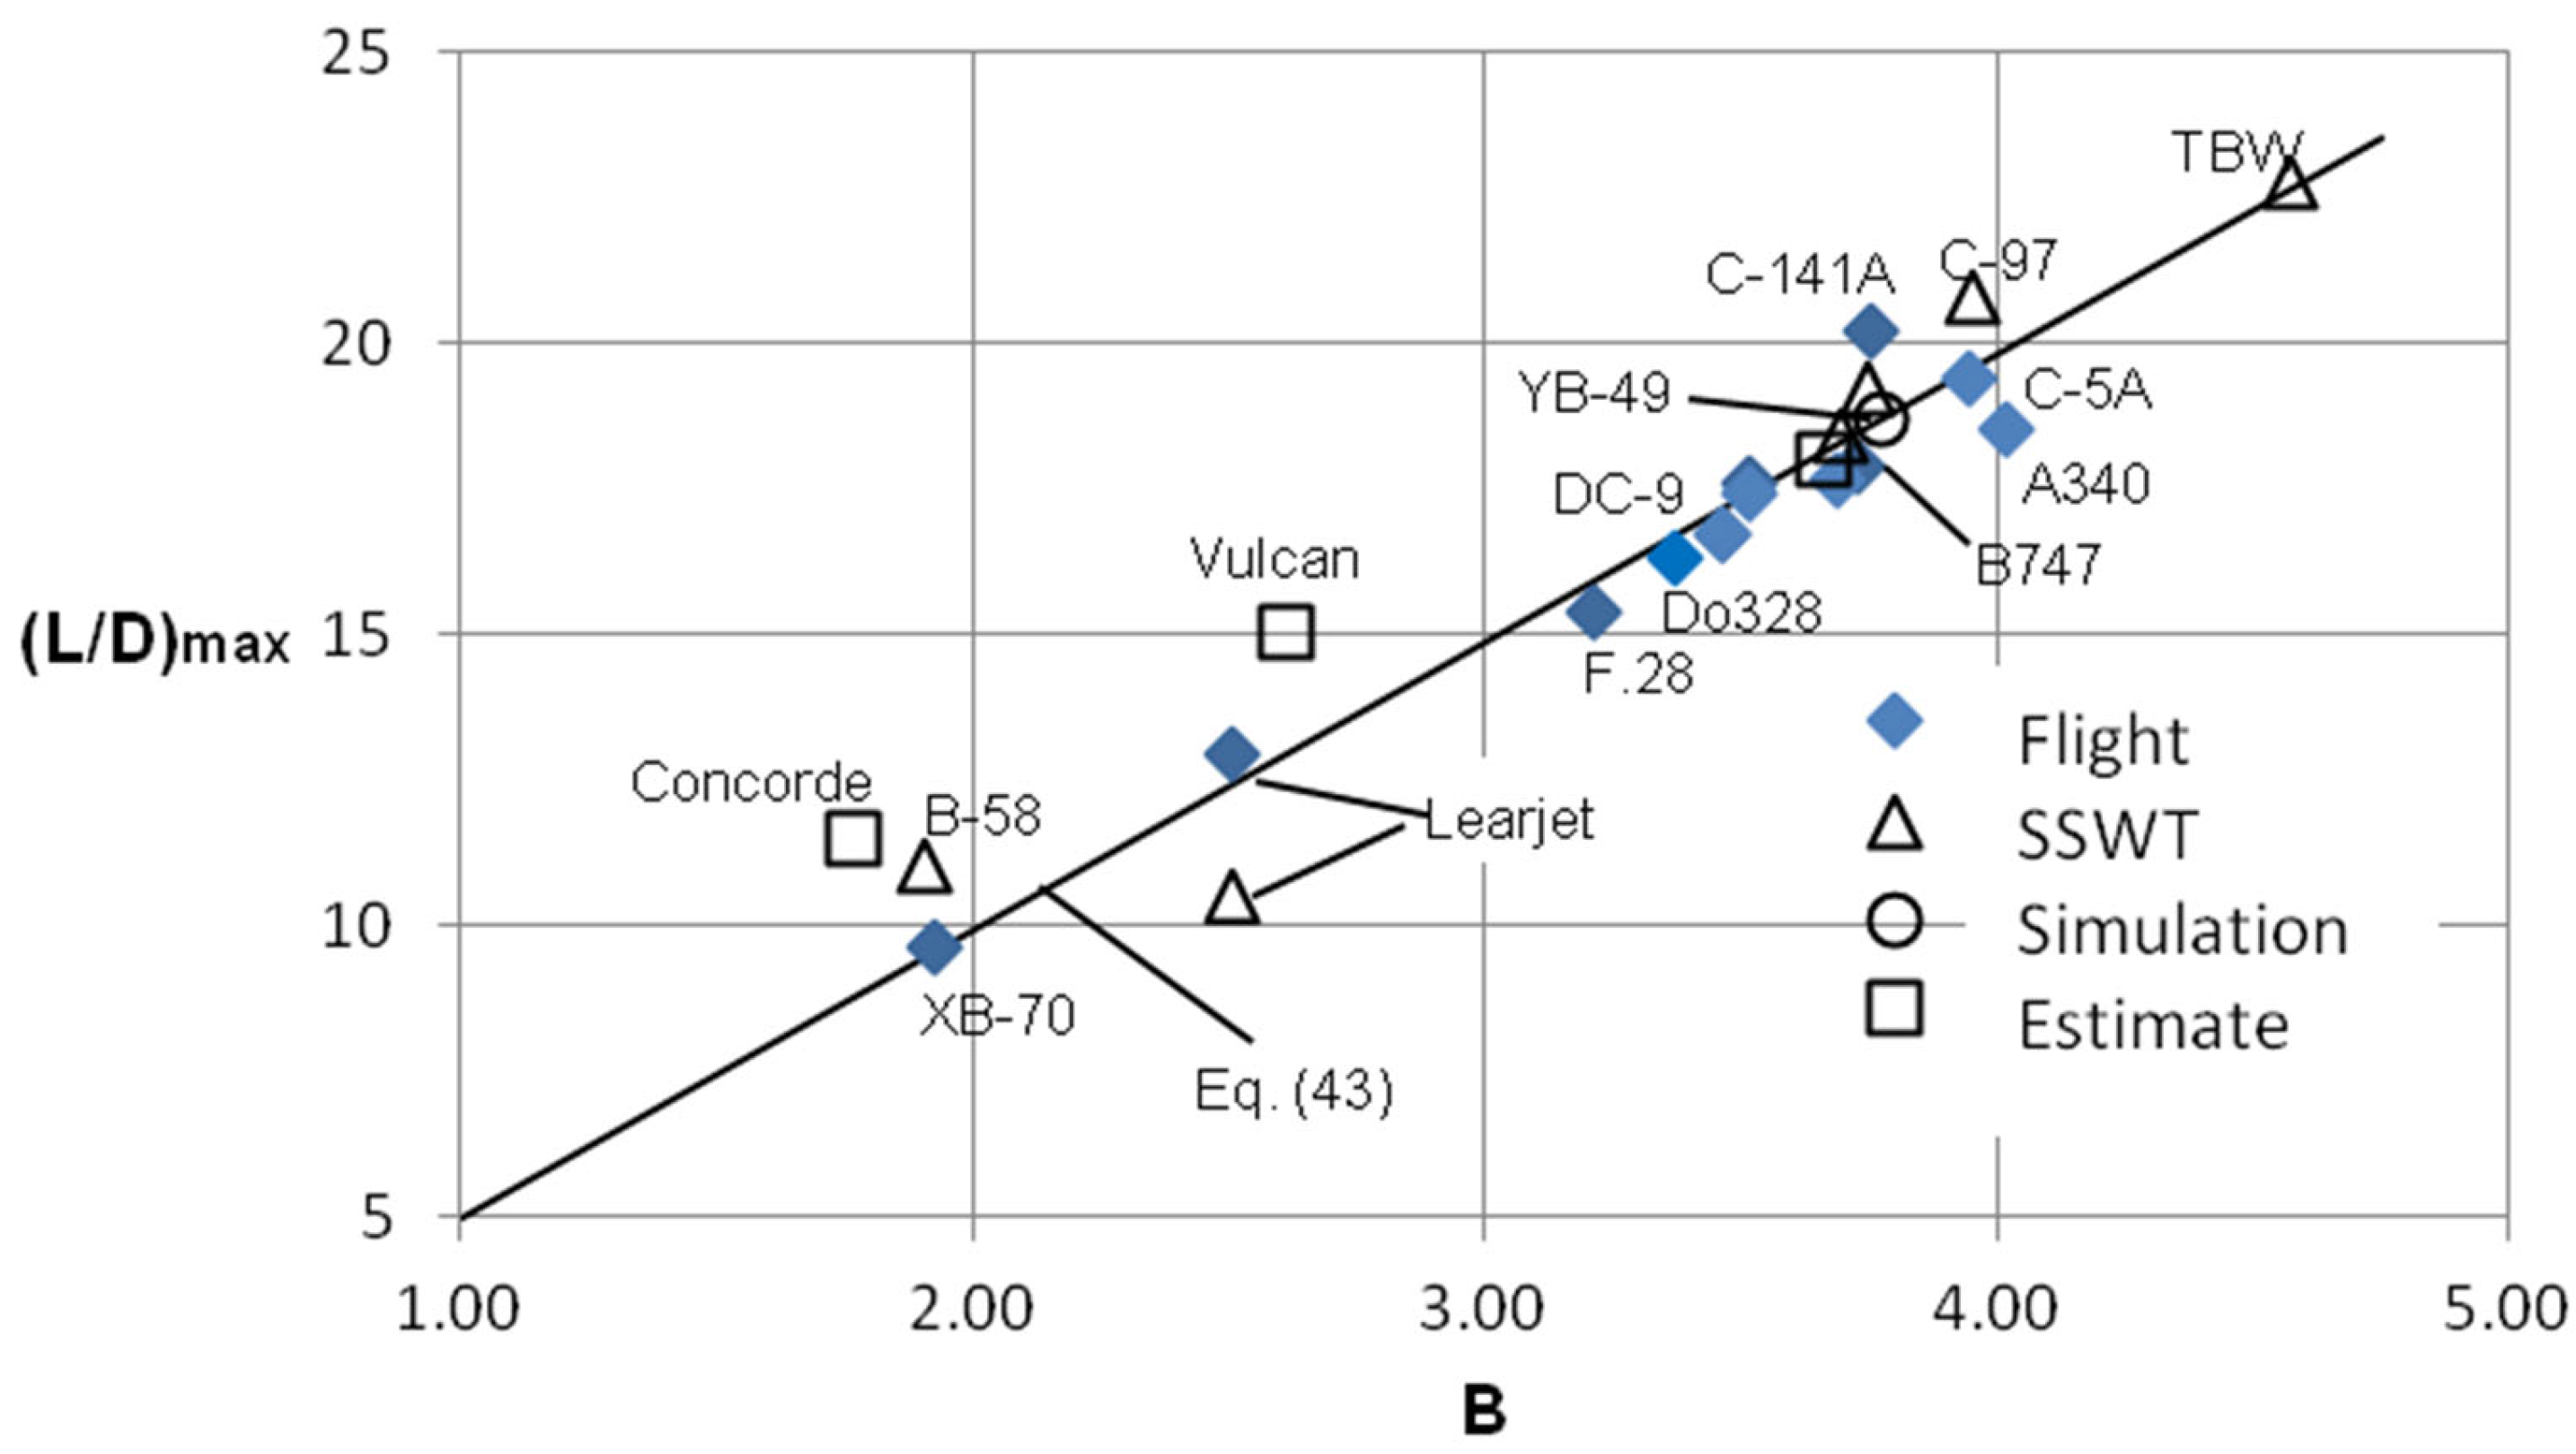
3.6. Influence on (L/D)max Ratios
3.7. Comparisons of Some Dissimilar Airplanes with Some Similar Characteristics
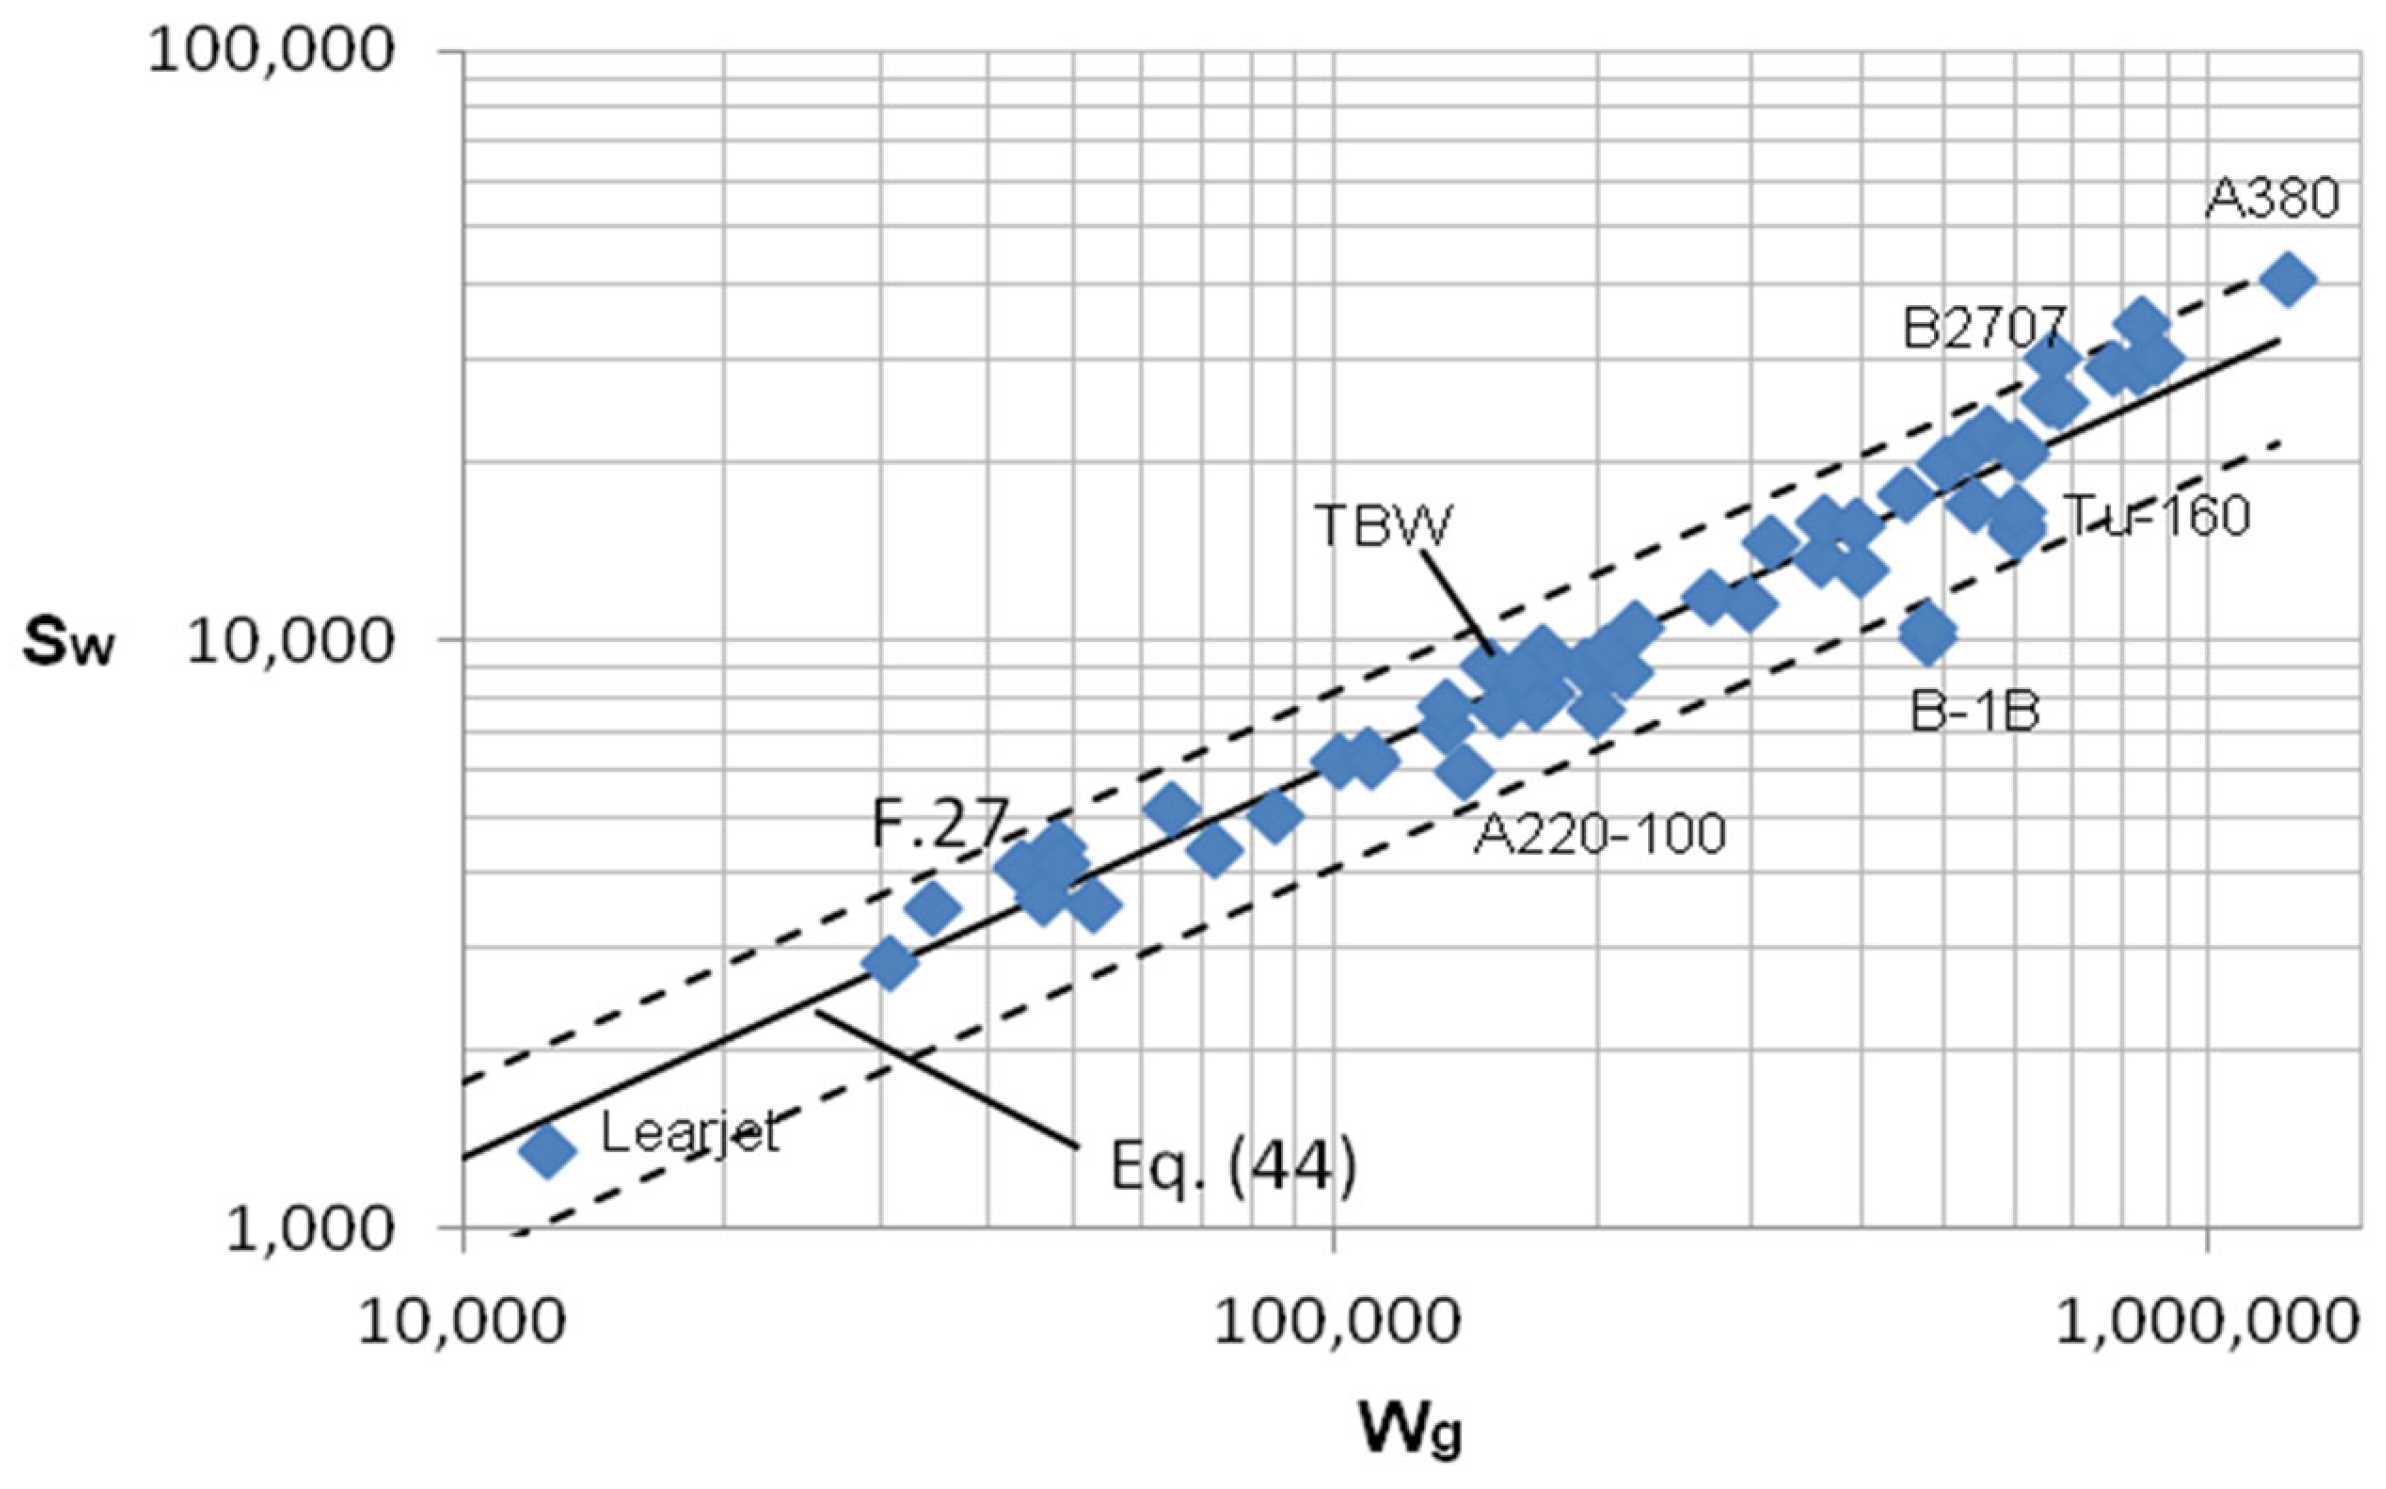
4. Relationship of Total Wetted Area and Gross Weight
5. Conclusions
Funding
Data Availability Statement
Conflicts of Interest
Nomenclature
| AR | aspect ratio b2/S |
| ARw | wetted aspect ratio, b2/Sw |
| B | planform configuration parameter, Equation (44), ft3/16 |
| b | wing span, ft |
| C | constant |
| c | chord, ft |
| cD | drag coefficient |
| cj | specific fuel consumption |
| D | drag, lbs |
| d | maximum equivalent fuselage diameter, ft |
| dn | maximum nacelle diameter, ft |
| f | parasite drag area (see Equation (37)), ft2 |
| k | constant, see Equation (36) |
| k1 | planform shape factor, see Equation (40) |
| L | lift, lbs |
| l | fuselage length, ft |
| ln | nacelle length, ft |
| M | Mach number |
| mg | airplane gross mass, kg |
| nn | number of nacelles |
| p | perimeter, ft |
| S | gross wing planform area, ft2 |
| Se | exposed wing planform area, Equation (3), ft2 |
| Sf | frontal area, ft2 |
| Sw | wetted area, ft2 |
| t | thickness, ft |
| Wg | airplane gross weight, lbs |
| y | spanwise distance measured from the fuselage centerline, ft |
| z | vertical distance measured from the fuselage centerline, or altitude, ft |
| β | turbofan bypass ratio |
| Λ | sweepback angle (see Figure 1), degrees |
| λ | ratio of local chord length to the wing root chord length, c/cr |
| Subscripts | |
| b | fuselage wall location |
| bottom | nacelle duct bottom wall |
| c | crank in wing planform |
| f | fuselage or friction |
| h | horizontal tail |
| LE | leading edge |
| mac | mean aerodynamic chord |
| max | maximum |
| n | nacelle |
| nc | nose cone |
| r | wing root |
| side | nacelle duct side wall |
| TE | trailing edge |
| t | tail or wing tip |
| tc | tail cone |
| v | vertical tail |
| w | wing |
| 0 | zero-lift conditions |
References
- Feagin, R.C.; Morrison, W.D. Delta Method, an Empirical Drag Buildup Technique; NASA N79-17801; NASA: Washington, DC, USA, 1978.
- McCullers, L.A. Aircraft Configuration Optimization Including Optimized Flight Profiles; NASA N87-11743; NASA: Washington, DC, USA, 1984.
- Gur, O.; Mason, W.H.; Schetz, J.A. Full-Configuration Drag Estimation. J. Aircr. 2010, 47, 1356–1367. [Google Scholar] [CrossRef]
- Raymer, D.P. Aircraft Design: A Conceptual Approach; American Institute of Aeronautics and Astronautics: Washington, DC, USA, 1989. [Google Scholar]
- Sforza, P.M. Commercial Airplane Design Principles; Elsevier: New York, NY, USA, 2014. [Google Scholar]
- Sforza, P.M. Estimating Zero-Lift Drag Coefficients and Maximum L/D in Subsonic Flight. In Proceedings of the 2018 AIAA Aerospace Sciences Meeting, Kissimmee, FL, USA, 8–12 January 2018. [Google Scholar] [CrossRef]
- Bradley, M.K.; Droney, C.K.; Allen, T.J. Subsonic Ultra Green Aircraft Research: Phase II—Volume I—Truss Braced Wing Design Exploration; NASA/CR-2015-218704/Volume I; NASA: Washington, DC, USA, 2015.
- van Heerden, A.S.J.; Guenov, M.D.; Molina-Cristóbal, A. Evolvability and Design Reuse in Civil Jet Transport Aircraft. Prog. Aerosp. Sci. 2019, 108, 121–155. [Google Scholar] [CrossRef]
- van Es, G.W.H. Rapid Estimation of the Zero-Lift Drag Coefficient of Transport Aircraft. J. Aircr. 2002, 39, 597–599. [Google Scholar] [CrossRef]
- Obert, E. Aerodynamic Design of Transport Aircraft; Delft University of Technology, IOS Press: Amsterdam, The Netherlands, 2009. [Google Scholar]
- Capone, F.J. Wind Tunnel/Flight Data Correlation for the Boeing 737-100 Transport Airplane; NASA TM X-72715; NASA: Washington, DC, USA, August 1975.
- Lan, C.-T.E.; Roskam, J. Airplane Aerodynamics and Performance; DAR Corp.: Lawrence, KS, USA, 2003. [Google Scholar]
- van Seeters, P.A.; Crossley, W.A.; Ko, A. Revisiting the Boeing B-47 and AVRO Vulcan Configuration: Comparison with Observations Relevant to New Aircraft Concepts. In Proceedings of the 9th AIAA Aviation Technology, Integration, and Operations Conference (ATIO), Hilton Head, SC, USA, 21–23 September 2009. [Google Scholar]
- Perkins, H.D.; Wilson, J.; Raymer, D.P. An Evaluation of Performance Metrics for High Efficiency Tube-and-Wing Aircraft Entering Service in 2030–2035; NASA/TM-2011-217264; NASA: Washington, DC, USA, November 2011.
- Paterson, J.H.; Blackerby, W.T.; Schwanebeck, J.C.; Braddock, W.F. An Analysis of Flight Test Data on the C-141A Aircraft; NASA CR-1558; NASA: Washington, DC, USA, 1970.
- Filipone, A. Advanced Aircraft Flight Performance; Cambridge University Press: New York, NY, USA, 2012. [Google Scholar]
- Tinetti, A.F.; Maglieri, D.J.; Driver, C.; Bobbitt, P. Equivalent Longitudinal Area Distributions of the B-58 and XB-70-1 for Use in Wave Drag and Sonic Boom Calculations; NASA CR-2011-217078; NASA: Washington, DC, USA, 2011.
- Piano-X. Boeing 787-7 (Dreamliner) Sample Analysis. September 2005. Available online: https://www.lissys.uk/samp1/index.html (accessed on 1 June 2012).
- Boeing Supersonic Transport Division. Boeing Model 2707 Aerodynamic Design Report; V2-B2707-3; Boeing Corp.: Seattle, WA, USA, 6 September 1966. [Google Scholar]
- Paterson, J.H.; MacWilkinson, D.G.; Blackerby, W.T. A Survey of Drag Prediction Techniques Applicable to Subsonic and Transonic Aircraft Design. In Aerodynamic Drag; AGARD CP-124; ARC: Neuilly sur Seine, France, 1973; pp. 14-1–14-38. [Google Scholar]
- Sforza, P.M. Direct Calculation of Zero-Lift Drag Coefficients and (L/D)max in Subsonic Cruise. J. Aircr. 2020, 57, 1224–1228. [Google Scholar] [CrossRef]
- Mueller, T. Low Reynolds Number Vehicles; AGARDograph, No. 288; ARC: Neuilly sur Seine, France, 1985. [Google Scholar]
- MacWilkinson, D.G.; Blackerby, W.T.; Paterson, J.H. Correlation of Full-Scale Predictions with Flight Measurements on the C-141A Aircraft, Vol. 1, Drag predictions, Wind Tunnel Data Analysis and Correlation. NASA CR-2333; NASA: Washington, DC, USA, 1974. [Google Scholar]
- Hanke, C.R.; Nordwall, D.R. The Simulation of a Jumbo Jet Transport Aircraft, Volume II: Modeling Data; Boeing Report D6-30643; Boeing Corp.: Seattle, WA, USA, 1970. [Google Scholar]
- Durmus, S. Theoretical model proposal on direct calculation of wetted area and maximum lift-to-drag ratio. Aircr. Eng. Aerosp. Technol. 2021, 93, 1097–1103. [Google Scholar] [CrossRef]

| Aircraft Type | Designation | Wg (lbs) | S (ft2) | Sw (ft2) | b (ft) | l (ft) | d (ft) |
|---|---|---|---|---|---|---|---|
| Commercial Group (37) | |||||||
| Business jet | Learjet 23 | 12,500 | 231 | 1352 | 34.1 | 41.0 | 5.3 |
| Regional turboprops | Dornier 328 | 30,840 | 426 | 2805 | 68.8 | 68.3 | 8.4 |
| Dash 8 | 34,500 | 586 | 3480 | 85.0 | 68.2 | 8.6 | |
| Fokker F.27 | 43,592 | 747 | 4115 | 95.2 | 82.0 | 8.3 | |
| XAC MA60 | 48,050 | 797 | 4439 | 95.8 | 81.0 | 9.5 | |
| ATR72-500 | 48,500 | 658 | 4132 | 88.7 | 89.1 | 9.0 | |
| Regional jet transports | ERJ145LR | 48,500 | 568 | 3633 | 65.8 | 91.7 | 7.5 |
| CRJ200LR | 53,000 | 594 | 3525 | 67.6 | 80.0 | 8.8 | |
| Fokker F.28 | 65,000 | 824 | 5125 | 77.3 | 88.3 | 11.3 | |
| CRJ700ER | 72,750 | 750 | 4404 | 76.3 | 97.4 | 8.8 | |
| E175 | 82,673 | 799 | 5008 | 85.4 | 103.9 | 9.9 | |
| Subsonic jet transports | Fokker F.100 | 100,990 | 1019 | 6189 | 92.2 | 106.6 | 11.0 |
| DC9-30 | 109,000 | 1001 | 6395 | 93.3 | 107.0 | 11.4 | |
| B737-100 | 110,000 | 1073 | 6175 | 93.0 | 90.6 | 12.7 | |
| A220-100 | 134,000 | 1318 | 7075 | 115.1 | 114.8 | 11.9 | |
| NASA TBW | 150,000 | 1467 | 9061 | 169.9 | 124.8 | 13.1 | |
| B737-700 | 154,500 | 1348 | 7594 | 112.6 | 105.6 | 12.7 | |
| B737-800 | 174,200 | 1348 | 8098 | 112.6 | 124.7 | 12.7 | |
| A320-200 | 169,800 | 1323 | 7816 | 117.5 | 123.3 | 13.3 | |
| B727-200 | 172,000 | 1681 | 9542 | 108.0 | 136.2 | 12.8 | |
| B737 max 10 | 193,500 | 1408 | 9041 | 117.9 | 142.5 | 12.8 | |
| A321 neo | 206,130 | 1323 | 8974 | 117.5 | 146 | 13.3 | |
| B757-300 | 270,000 | 2016 | 11,748 | 124.8 | 178.6 | 12.8 | |
| A310-300 | 361,600 | 2385 | 13,709 | 144.0 | 150.5 | 18.5 | |
| A300-600 | 363,760 | 2861 | 15,804 | 147.1 | 177.4 | 18.5 | |
| B767-200ER | 395,000 | 3265 | 15,523 | 156.1 | 156.1 | 17.1 | |
| B787-8 | 502,500 | 4151 | 19,987 | 197.3 | 183.5 | 19.2 | |
| A330-900 | 533,320 | 4036 | 21,185 | 210.0 | 206.2 | 18.5 | |
| B787-10 | 560,000 | 4151 | 22,405 | 197.3 | 221.4 | 19.2 | |
| MD-11 | 602,500 | 4053 | 21,288 | 170.5 | 192.4 | 19.7 | |
| A340-300 | 609,580 | 3896 | 21,011 | 197.8 | 206.0 | 18.9 | |
| B777-300 | 660,000 | 4869 | 25,638 | 199.9 | 239.8 | 20.3 | |
| A350-1000 | 679,000 | 4877 | 25,127 | 212.4 | 237.0 | 19.8 | |
| B777-9 | 777,000 | 5878 | 28,917 | 235.4 | 246.7 | 20.3 | |
| B747-200 | 833,000 | 5857 | 29,014 | 195.7 | 225.2 | 21.3 | |
| B747-400 | 875,500 | 6051 | 30,038 | 213.0 | 225.2 | 21.4 | |
| A380-800 | 1234,600 | 9205 | 41,050 | 261.7 | 231.0 | 25.5 | |
| Supersonic Group (5) | |||||||
| Supersonic transports | Concorde | 400,000 | 4151 | 13,196 | 83.8 | 202.3 | 9.5 |
| Tu-144 | 450,000 | 5504 | 17,724 | 94.5 | 215.5 | 10.9 | |
| B2707 | 666,000 | 9029 | 30,174 | 105.6 | 306.0 | 15.7 | |
| Supersonic bombers | B-58 | 140,000 | 1542 | 5932 | 56.8 | 89.6 | 5.9 |
| XB-70 | 540,000 | 6300 | 16,927 | 105.0 | 185.8 | 8.3 | |
| All-Wing Group (3) | |||||||
| Subsonic bombers | AVRO Vulcan | 204,000 | 4082 | 9485 | 111.0 | 100.0 | NA |
| YB-49 | 213,500 | 4025 | 8791 | 172.0 | 37.5 | NA | |
| B-2 | 220,000 | 5118 | 10,375 | 172 | 69 | NA | |
| Military Group (9) | |||||||
| Subsonic jet bomber | B-47 | 198,180 | 1454 | 7732 | 116.0 | 104.0 | 9.9 |
| Swing-wing bomber | B1-B a | 477,000 | 2334 | 10,002 | 78.2 | 142.0 | 10.0 |
| B1-B b | 477,000 | 2442 | 10,434 | 137.7 | 142.0 | 10.0 | |
| Tu-160 a | 606,260 | 4019 | 15,167 | 116.8 | 177.5 | 9.5 | |
| Tu-160 b | 606,260 | 4342 | 16,528 | 185.8 | 177.5 | 9.5 | |
| Subsonic jet transports | KC-135 | 297,000 | 2452 | 11,485 | 130.8 | 128.8 | 14.6 |
| C-141A | 316,100 | 3230 | 14,566 | 159.9 | 132.3 | 14.2 | |
| C-5A | 840,000 | 6640 | 34,263 | 222.8 | 247.8 | 28.0 | |
| Propeller transports | C-69 | 134,400 | 1652 | 8719 | 123.0 | 116.2 | 12.2 |
| C-130J | 164,000 | 1812 | 8839 | 132.6 | 97.7 | 13.8 | |
| C-97 | 175,000 | 1793 | 9007 | 141.2 | 110.0 | 13.3 |
| Airplane | S | Sw,w | Sw,f | Sw,n | Sw,h | Sw,v | ∆Sw | Sw |
|---|---|---|---|---|---|---|---|---|
| Commercial | ||||||||
| Learjet 23 | 231 | 392 | 484 | 148 | 113 | 78 | 137 a | 1352 |
| Do328 | 426 | 767 | 1305 | 276 | 202 | 255 | 0 | 2805 |
| Dash 8 | 586 | 1012 | 1383 | 416 | 304 | 365 | 0 | 3480 |
| Fokker F27 | 747 | 1285 | 1643 | 469 | 349 | 369 | 0 | 4115 |
| XAC MA60 | 797 | 1375 | 1894 | 493 | 355 | 322 | 0 | 4439 |
| ATR72-500 | 658 | 1146 | 1978 | 295 | 342 | 371 | 0 | 4132 |
| ERJ 145LR | 568 | 930 | 1750 | 479 | 317 | 157 | 0 | 3633 |
| CRJ200LR | 594 | 1002 | 1753 | 250 | 275 | 245 | 0 | 3525 |
| Fokker F28 | 824 | 1380 | 2477 | 515 | 429 | 324 | 0 | 5125 |
| CRJ700ER | 750 | 1253 | 2129 | 278 | 452 | 292 | 0 | 4404 |
| E175 | 799 | 1303 | 2569 | 304 | 425 | 407 | 0 | 5008 |
| DC9-30 | 1001 | 1721 | 3079 | 638 | 552 | 404 | 0 | 6394 |
| Fokker F100 | 1019 | 1729 | 2968 | 646 | 489 | 357 | 0 | 6189 |
| B737-100 | 1073 | 1701 | 2795 | 697 | 527 | 455 | 0 | 6175 |
| A220-100 | 1292 | 2108 | 3385 | 659 | 468 | 455 | 0 | 7075 |
| A320-200 | 1323 | 2123 | 4113 | 568 | 529 | 483 | 0 | 7816 |
| A321neo | 1323 | 2123 | 5053 | 786 | 529 | 483 | 0 | 8974 |
| B737-700 | 1348 | 2253 | 3443 | 576 | 737 | 585 | 0 | 7594 |
| B737-800 | 1348 | 2253 | 3947 | 576 | 737 | 585 | 0 | 8098 |
| B737max10 | 1408 | 2383 | 4698 | 701 | 680 | 579 | 0 | 9041 |
| NASA TBW | 1467 | 2760 | 4285 | 563 | 601 | 605 | 247 b | 9061 |
| B727-200 | 1681 | 2799 | 4277 | 880 | 769 | 817 | 0 | 9542 |
| B757-300 | 2016 | 3425 | 5745 | 921 | 871 | 786 | 0 | 11,748 |
| A310-300 | 2385 | 3819 | 6806 | 992 | 1115 | 977 | 0 | 13,709 |
| A300-600 | 2861 | 4555 | 8145 | 992 | 1125 | 987 | 0 | 15,804 |
| B767-200 | 3265 | 5393 | 6840 | 922 | 1364 | 1004 | 0 | 15,523 |
| A340-300 | 3896 | 6733 | 9773 | 2022 | 1479 | 1004 | 0 | 21,011 |
| A330-900 | 4036 | 7000 | 10,068 | 1780 | 1352 | 985 | 0 | 21,185 |
| MD-11 | 4053 | 6796 | 9737 | 2090 | 1706 | 960 | 0 | 21,288 |
| B787-8 | 4151 | 6819 | 8902 | 1794 | 1392 | 1080 | 0 | 19,987 |
| B787-10 | 4151 | 6819 | 11,320 | 1794 | 1392 | 1080 | 0 | 22,405 |
| A350-1000 | 4877 | 7983 | 12,478 | 2011 | 1543 | 1112 | 0 | 25,127 |
| B777-300 | 4869 | 7958 | 12,896 | 1673 | 1884 | 1227 | 0 | 25,638 |
| B747-200 | 5584 | 9117 | 13,265 | 1719 | 2406 | 1696 | 811 c | 29,014 |
| B777-9 | 5878 | 9892 | 13,243 | 2298 | 2099 | 1385 | 0 | 28,917 |
| B747-400 | 6051 | 9815 | 13,265 | 1876 | 2406 | 1696 | 980 c | 30,038 |
| A380-800 | 9205 | 15,671 | 15,427 | 3747 | 3659 | 2546 | 0 | 41,050 |
| Supersonic | ||||||||
| B-58 | 1542 | 2480 | 1343 | 1511 | 0 | 318 | 280 d | 5932 |
| Concorde | 4151 | 5830 | 4963 | 1452 | 0 | 951 | 0 | 13,196 |
| Tu-144 | 5504 | 7393 | 5869 | 3240 | 0 | 1221 | 0 | 17,724 |
| B2707 | 9029 | 14,903 | 9906 | 3281 | 0 | 2084 | 0 | 30,174 |
| XB-70A | 6300 | 9102 | 2955 | 3395 | 532 | 943 | 0 | 16,927 |
| All-wing | ||||||||
| Vulcan | 4082 | 8324 | 0 | 0 | 0 | 589 | 572 e | 9485 |
| YB-49 | 4025 | 8311 | 0 | 0 | 0 | 321 | 159 e | 8791 |
| B-2 | 5118 | 9658 | 0 | 0 | 0 | 0 | 717 c | 10,375 |
| Military | ||||||||
| B47 | 1454 | 2663 | 2510 | 1280 | 551 | 584 | 144 d | 7732 |
| KC-135 | 2452 | 4305 | 4571 | 950 | 1026 | 633 | 0 | 11,485 |
| C-141A | 3230 | 6001 | 4845 | 1391 | 966 | 832 | 531 f | 14,565 |
| C-5A | 6640 | 11,878 | 16,422 | 1719 | 1879 | 1818 | 547 f | 34,263 |
| B-1B g | 2334 | 3273 | 3460 | 1593 | 1083 | 593 | 0 | 10,002 |
| B-1B h | 2442 | 3705 | 3460 | 1593 | 1083 | 593 | 0 | 10,434 |
| Tu-160 g | 4019 | 6211 | 4394 | 2354 | 1146 | 1061 | 0 | 15,167 |
| Tu-160 h | 4342 | 7573 | 4394 | 2354 | 1146 | 1061 | 0 | 16,528 |
| C-69 | 1652 | 2988 | 3497 | 679 | 949 | 606 | 0 | 8719 |
| C-97 | 1793 | 3304 | 3492 | 784 | 757 | 626 | 0 | 9006 |
| C-130J | 1812 | 3393 | 3218 | 719 | 854 | 655 | 0 | 8839 |
| Component. Wetted Area | Subsonic Constraints | Equation No. | Subsonic Correlation | Supersonic Constrsints | Equation No. | Supersonic Correlation |
|---|---|---|---|---|---|---|
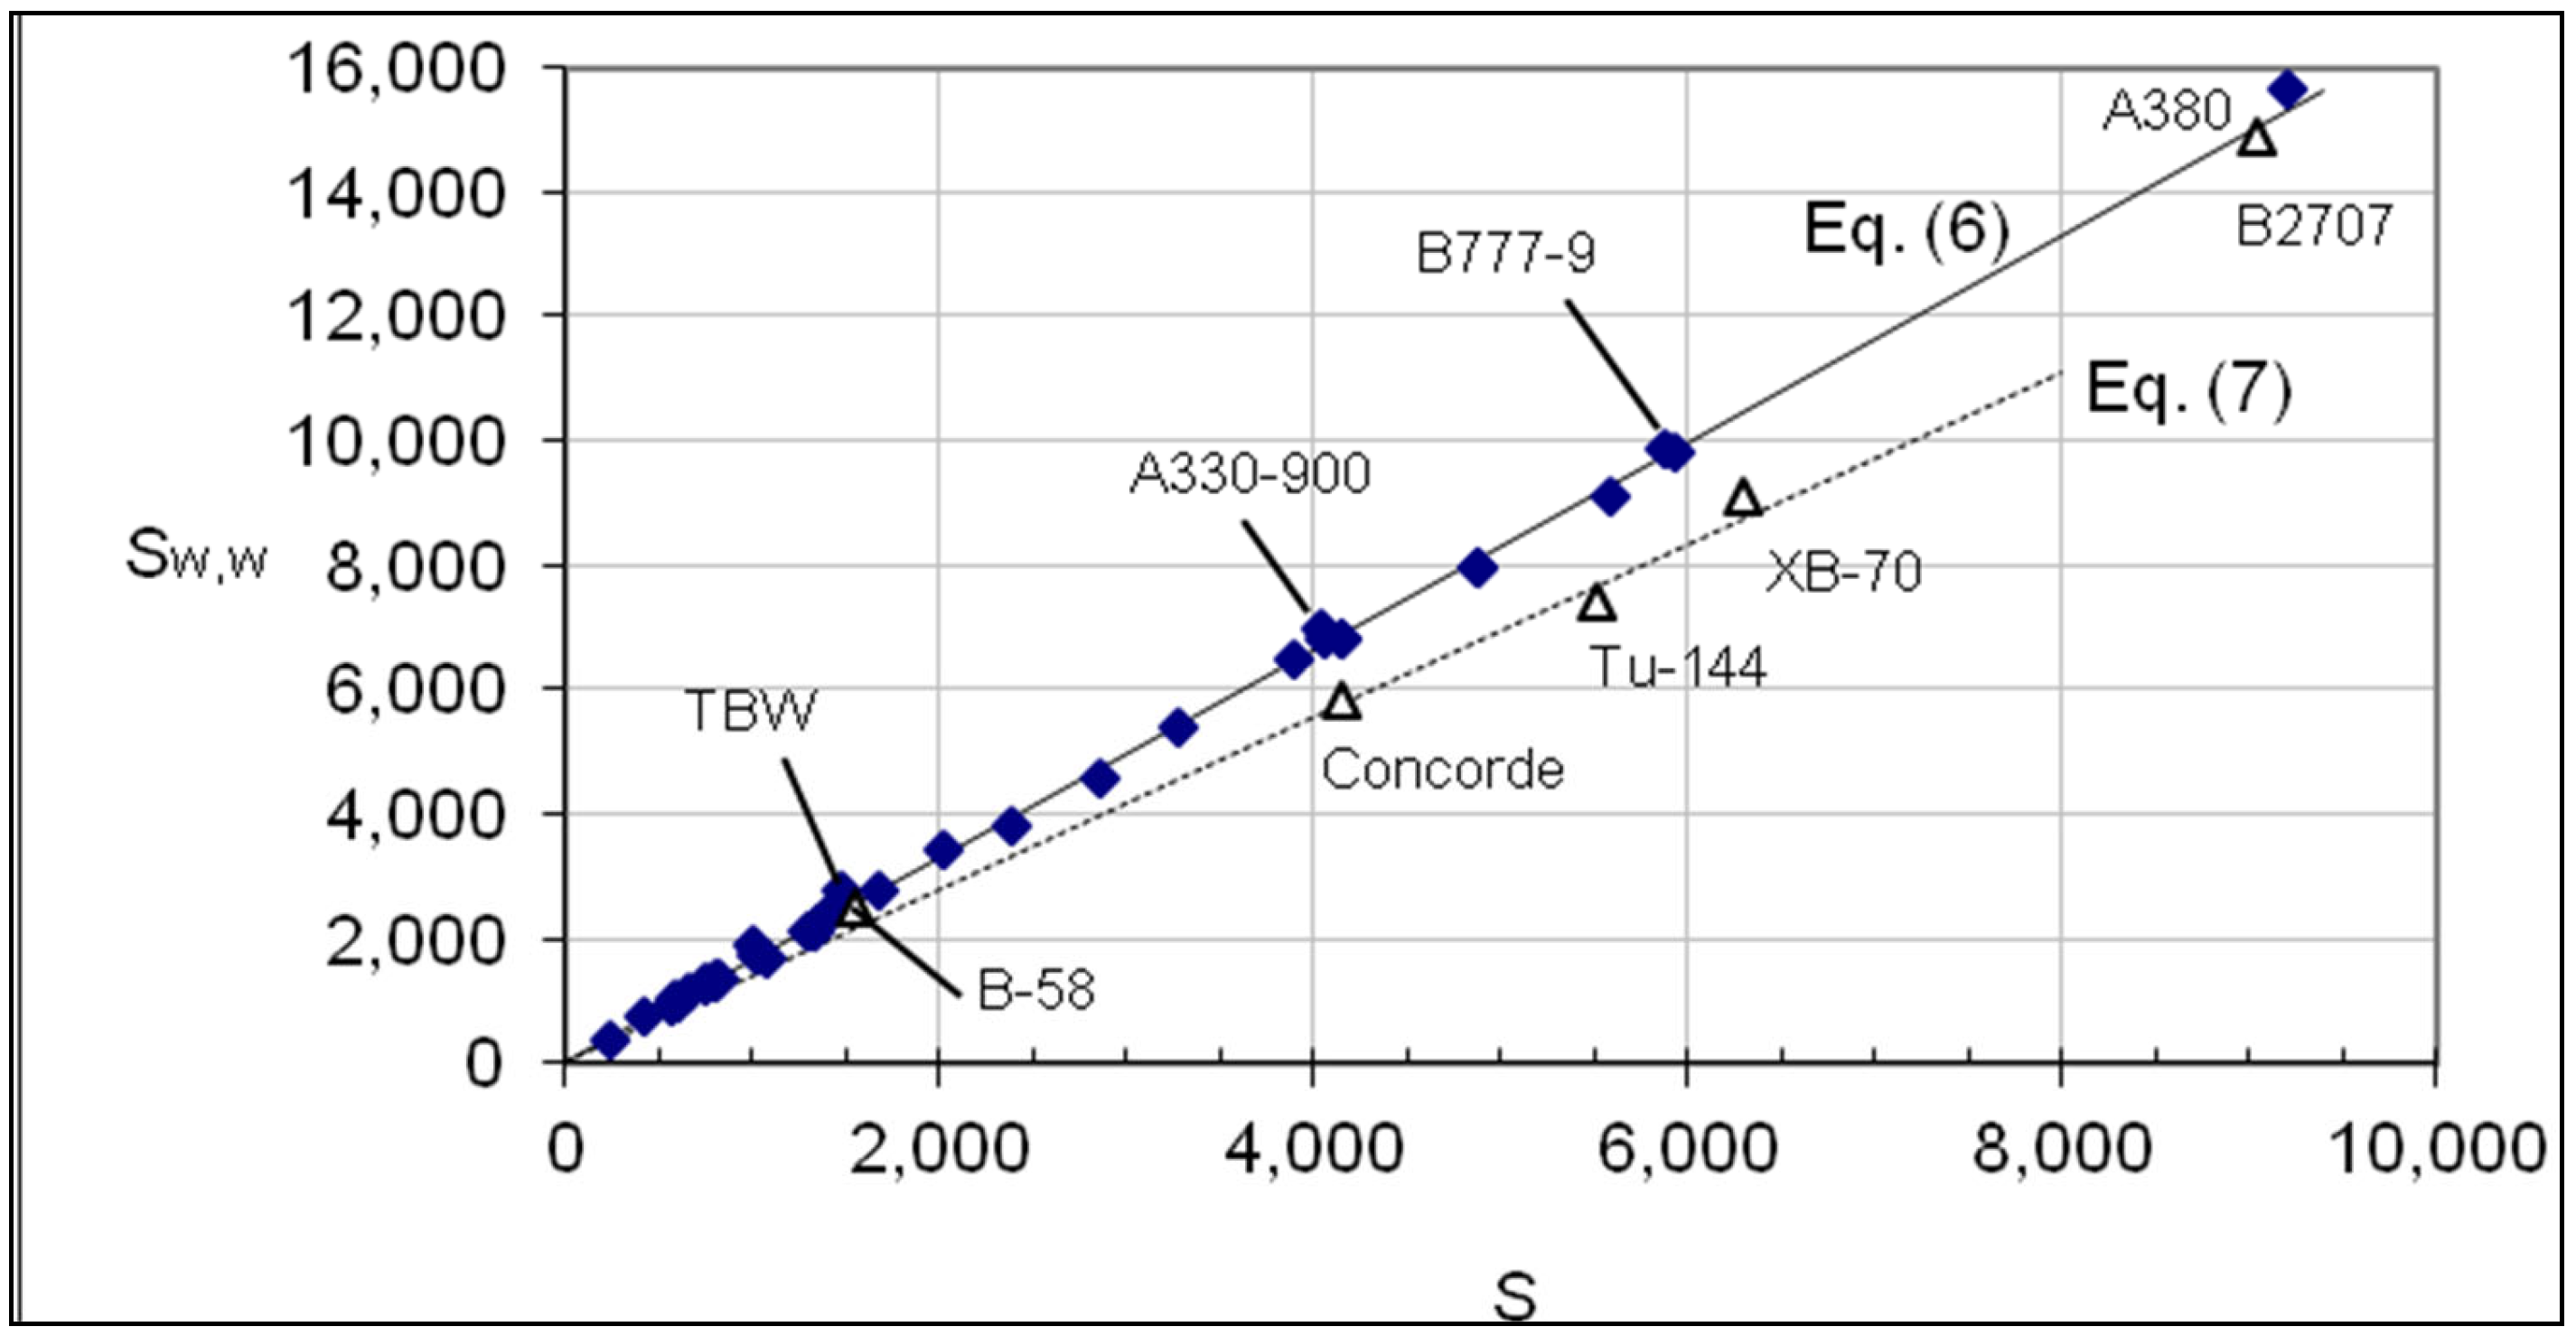
| Sw,w | 6 | 1.66S | 6 | 1.66S (podded) | ||
| 7 | 1.39S (ducted) | |||||
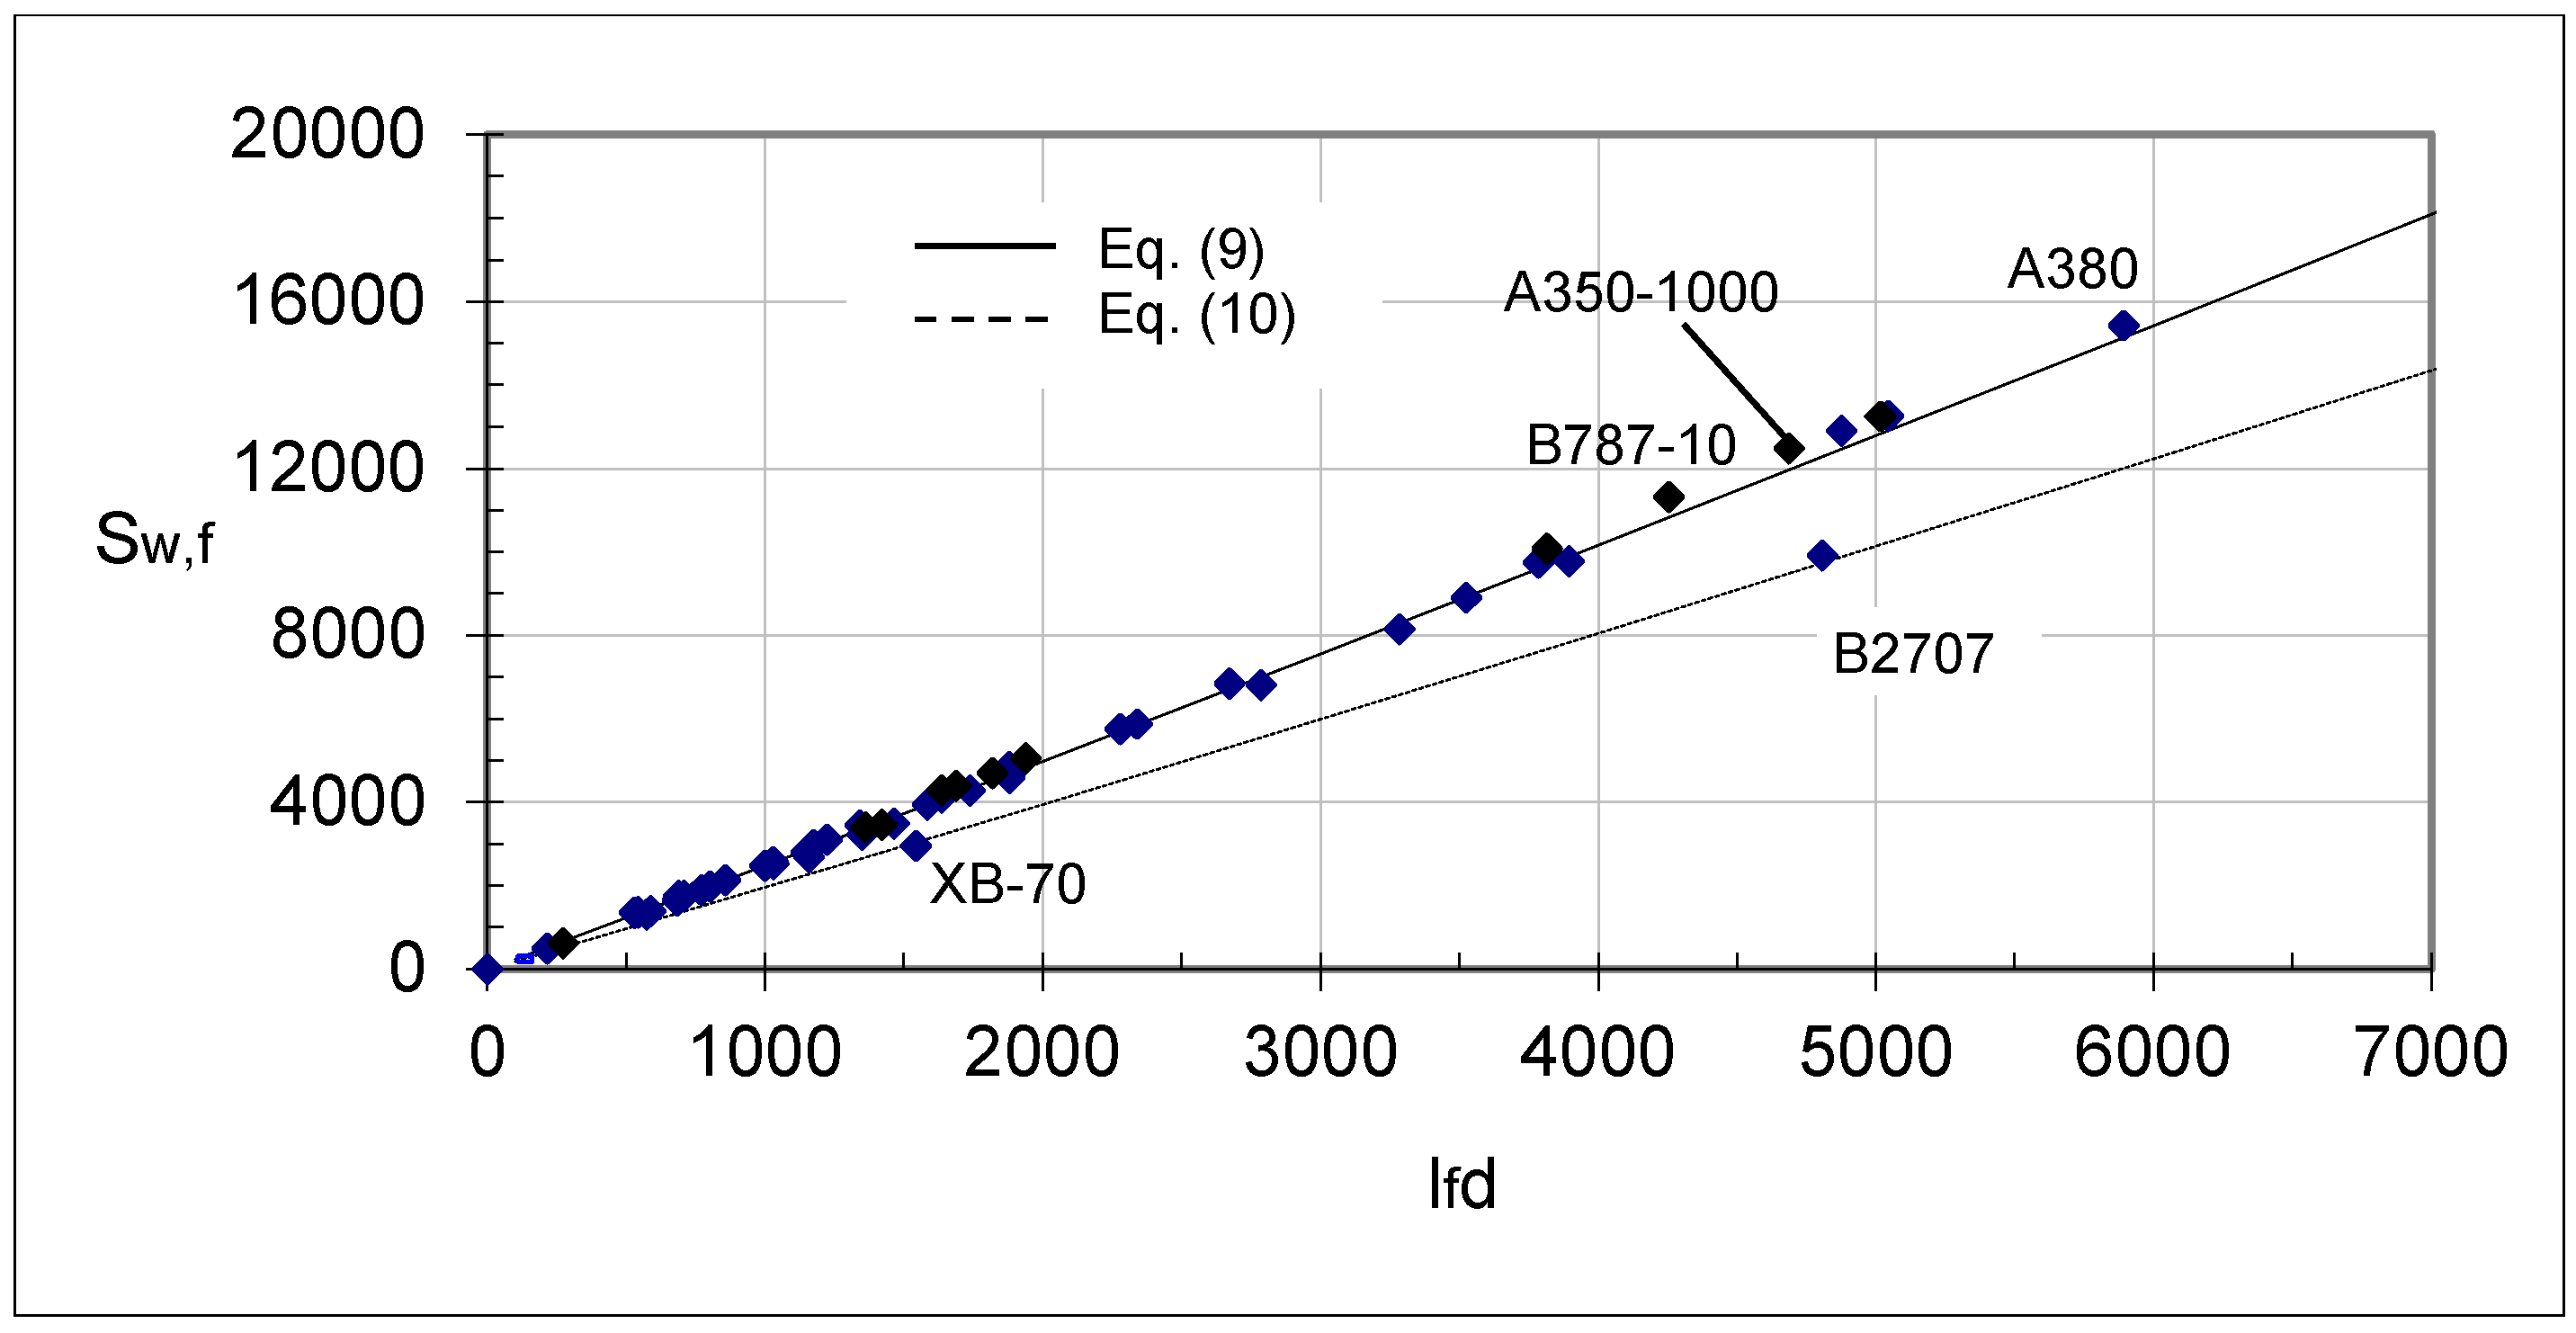
| Sw,f | 9 | 1.98 (ld)1.03 | ltc/d < 5.5 | 9 | 1.98 (ld)1.03 | |
| ltc/d ≥ 5.5 | 10 | 1.57 (ld)1.03 | ||||
| Sw,n | S < 1600 and β < 4 | 20 | 0.63S | ln/l ≥ 0.2 | 23 | 11.5S0.65 |
| S < 1600 and 4 < β < 8 | 21 | 0.40S | ln/l < 0.2 | 24 | 0.5S0.95 | |
| S < 1600 and β > 8 | 22 | 0.51S | ||||
| 1600 ≤ S < 3500 | 932 | |||||
| 3500 ≤ S < 7000 | 1864 | |||||
| 7000 ≤ S < 10,000 | 3750 | |||||
| Sw,h | Older airplanes | 12 | 0.93S0.91 | NA | ||
| Newer airplanes | 13 | 0.75S0.91 | ||||
| Sw,v | S < 2400 | 14 | 0.41S | 17 | 0.23S | |
| 2400 ≤ S < 4300 | 15 | 1030 | ||||
| 4300 < S < 10,000 | 16 | 0.31S-308 | ||||
| Sw | S < 2000 | 26 | 5.91S | 28 | 5.07S0.95 | |
| S ≥ 2000 | 27 | 19.28S0.842 | ||||
| Military airplaness | 15.28S0.842 | |||||
| All-wing airplanes | 8.2S0.842 |
| Airplane | Ref. | Sw | Sw | Difference | Sw | Difference | Sw | Difference |
|---|---|---|---|---|---|---|---|---|
| (Cited) | Equation (25) | (%) | Equations (26)–(28) | (%) | Equation (29) | (%) | ||
| Fokker F.27 | [9] | 3980 | 4120 | +3.5 | 4020 | +1.0 | 4420 | +11 |
| Dornier 328 | [10] | 2840 | 2810 | −1.1 | 2830 | −0.35 | 2520 | −11 |
| B737−100 | [11] | 5990 | 6180 | +3.2 | 6200 | +3.5 | 6340 | +5.8 |
| Fokker F.100 | [10] | 6310 | 6190 | −1.9 | 6100 | −3.3 | 6020 | −4.6 |
| DC9−30 | [9] | 6570 | 6400 | −2.6 | 6160 | −6.2 | 5920 | −9.9 |
| DC9−30 | [12] | 6500 | 6400 | −1.5 | 6160 | −5.2 | 5920 | −8.9 |
| B−47 | [13] a | 7500 | 7730 | +3.1 | N/A | N/A | 7380 | −1.6 |
| B737−800 | [14] b | 8250 | 8100 | −1.8 | 7850 | −4.8 | 7970 | −3.4 |
| Vulcan | [13] a | 9460 | 9490 | +0.32 | N/A | N/A | 9180 | −3.0 |
| B727−200 | [10] | 9640 | 9540 | −1.0 | 9470 | −1.7 | 9940 | +3.1 |
| C−141A | [15] | 14,600 | 14,600 | 0 | N/A | N/A | 14,600 | |
| A300−600 | [16] | 16,400 | 15,800 | −3.7 | 16,200 | −1.2 | 15,700 | −4.3 |
| XB−70A | [17] | 17,100 | 16,900 | −1.2 | 16,600 | −2.9 | 20,400 | +19 |
| B787−8 | [18] | 19,600 | 20,000 | +2.0 | 20,000 | −4.3 | 21,500 | +9.6 |
| B777−300 | [16] | 25,400 | 25,600 | +0.78 | 26,000 | +2.4 | 25,400 | 0 |
| B2707 | [19] | 29,900 | 30,200 | −1.6 | 29,700 | −0.67 | 29,600 | −1.0 |
| B747−400 | [16] | 30,700 | 30,000 | −2.2 | 28,100 | −8.4 | 28,900 | −5.9 |
| C−5A | [20] | 33,000 | 34,300 | +3.9 | N/A | N/A | 28,500 | −14 |
| A380 | [16] | 42,700 | 41,100 | −3.7 | 39,400 | −7.7 | 42,000 | −1.6 |
| Airplane | Type a | S | Sw | b | cmac | A | Aw | Λ | bAR | (L/D)max |
|---|---|---|---|---|---|---|---|---|---|---|
| NASA TBW | TBW | 1467 | 8980 | 169.8 | 9.1 | 19.65 | 3.18 | 11.9 | 3337 | 22.8 b |
| YB-49 | AW | 4025 | 8791 | 172 | 26.2 | 7.35 | 3.37 | 27.0 | 1264 | 18.91 b |
| Vulcan | AW | 4082 | 9485 | 111 | 42.7 | 3.02 | 1.3 | 60.0 | 335 | 15.04 c |
| C-97 | T&W prop. | 1793 | 9006 | 141.2 | 13.4 | 11.1 | 2.21 | 7.0 | 1567 | 20.06 b |
| B-47 | T&W | 1454 | 7588 | 116 | 14.2 | 9.25 | 1.8 | 33.5 | 1073 | 17.98 c |
| B737-10 | T&W. | 1408 | 9041 | 117.9 | 14.3 | 9.87 | 1.54 | 29 | 1164 | 18.93 d |
Disclaimer/Publisher’s Note: The statements, opinions and data contained in all publications are solely those of the individual author(s) and contributor(s) and not of MDPI and/or the editor(s). MDPI and/or the editor(s) disclaim responsibility for any injury to people or property resulting from any ideas, methods, instructions or products referred to in the content. |
© 2025 by the author. Licensee MDPI, Basel, Switzerland. This article is an open access article distributed under the terms and conditions of the Creative Commons Attribution (CC BY) license (https://creativecommons.org/licenses/by/4.0/).
Share and Cite
Sforza, P.M. Wetted and Projected Area Relationships in Commercial Airplane Design. Aerospace 2025, 12, 462. https://doi.org/10.3390/aerospace12060462
Sforza PM. Wetted and Projected Area Relationships in Commercial Airplane Design. Aerospace. 2025; 12(6):462. https://doi.org/10.3390/aerospace12060462
Chicago/Turabian StyleSforza, Pasquale M. 2025. "Wetted and Projected Area Relationships in Commercial Airplane Design" Aerospace 12, no. 6: 462. https://doi.org/10.3390/aerospace12060462
APA StyleSforza, P. M. (2025). Wetted and Projected Area Relationships in Commercial Airplane Design. Aerospace, 12(6), 462. https://doi.org/10.3390/aerospace12060462