
Evaluation of Aerodynamic and Sonic Boom Performance of Supersonic Transport Aircrafts with Multiple Wing Configurations

Abstract
1. Introduction
2. Numerical Methods
2.1. The Topology Optimization Approach
2.2. Three-Dimensional CFD Method
2.3. Estimation of Skin Friction Drag
2.4. Evaluation of Sonic Boom Strength
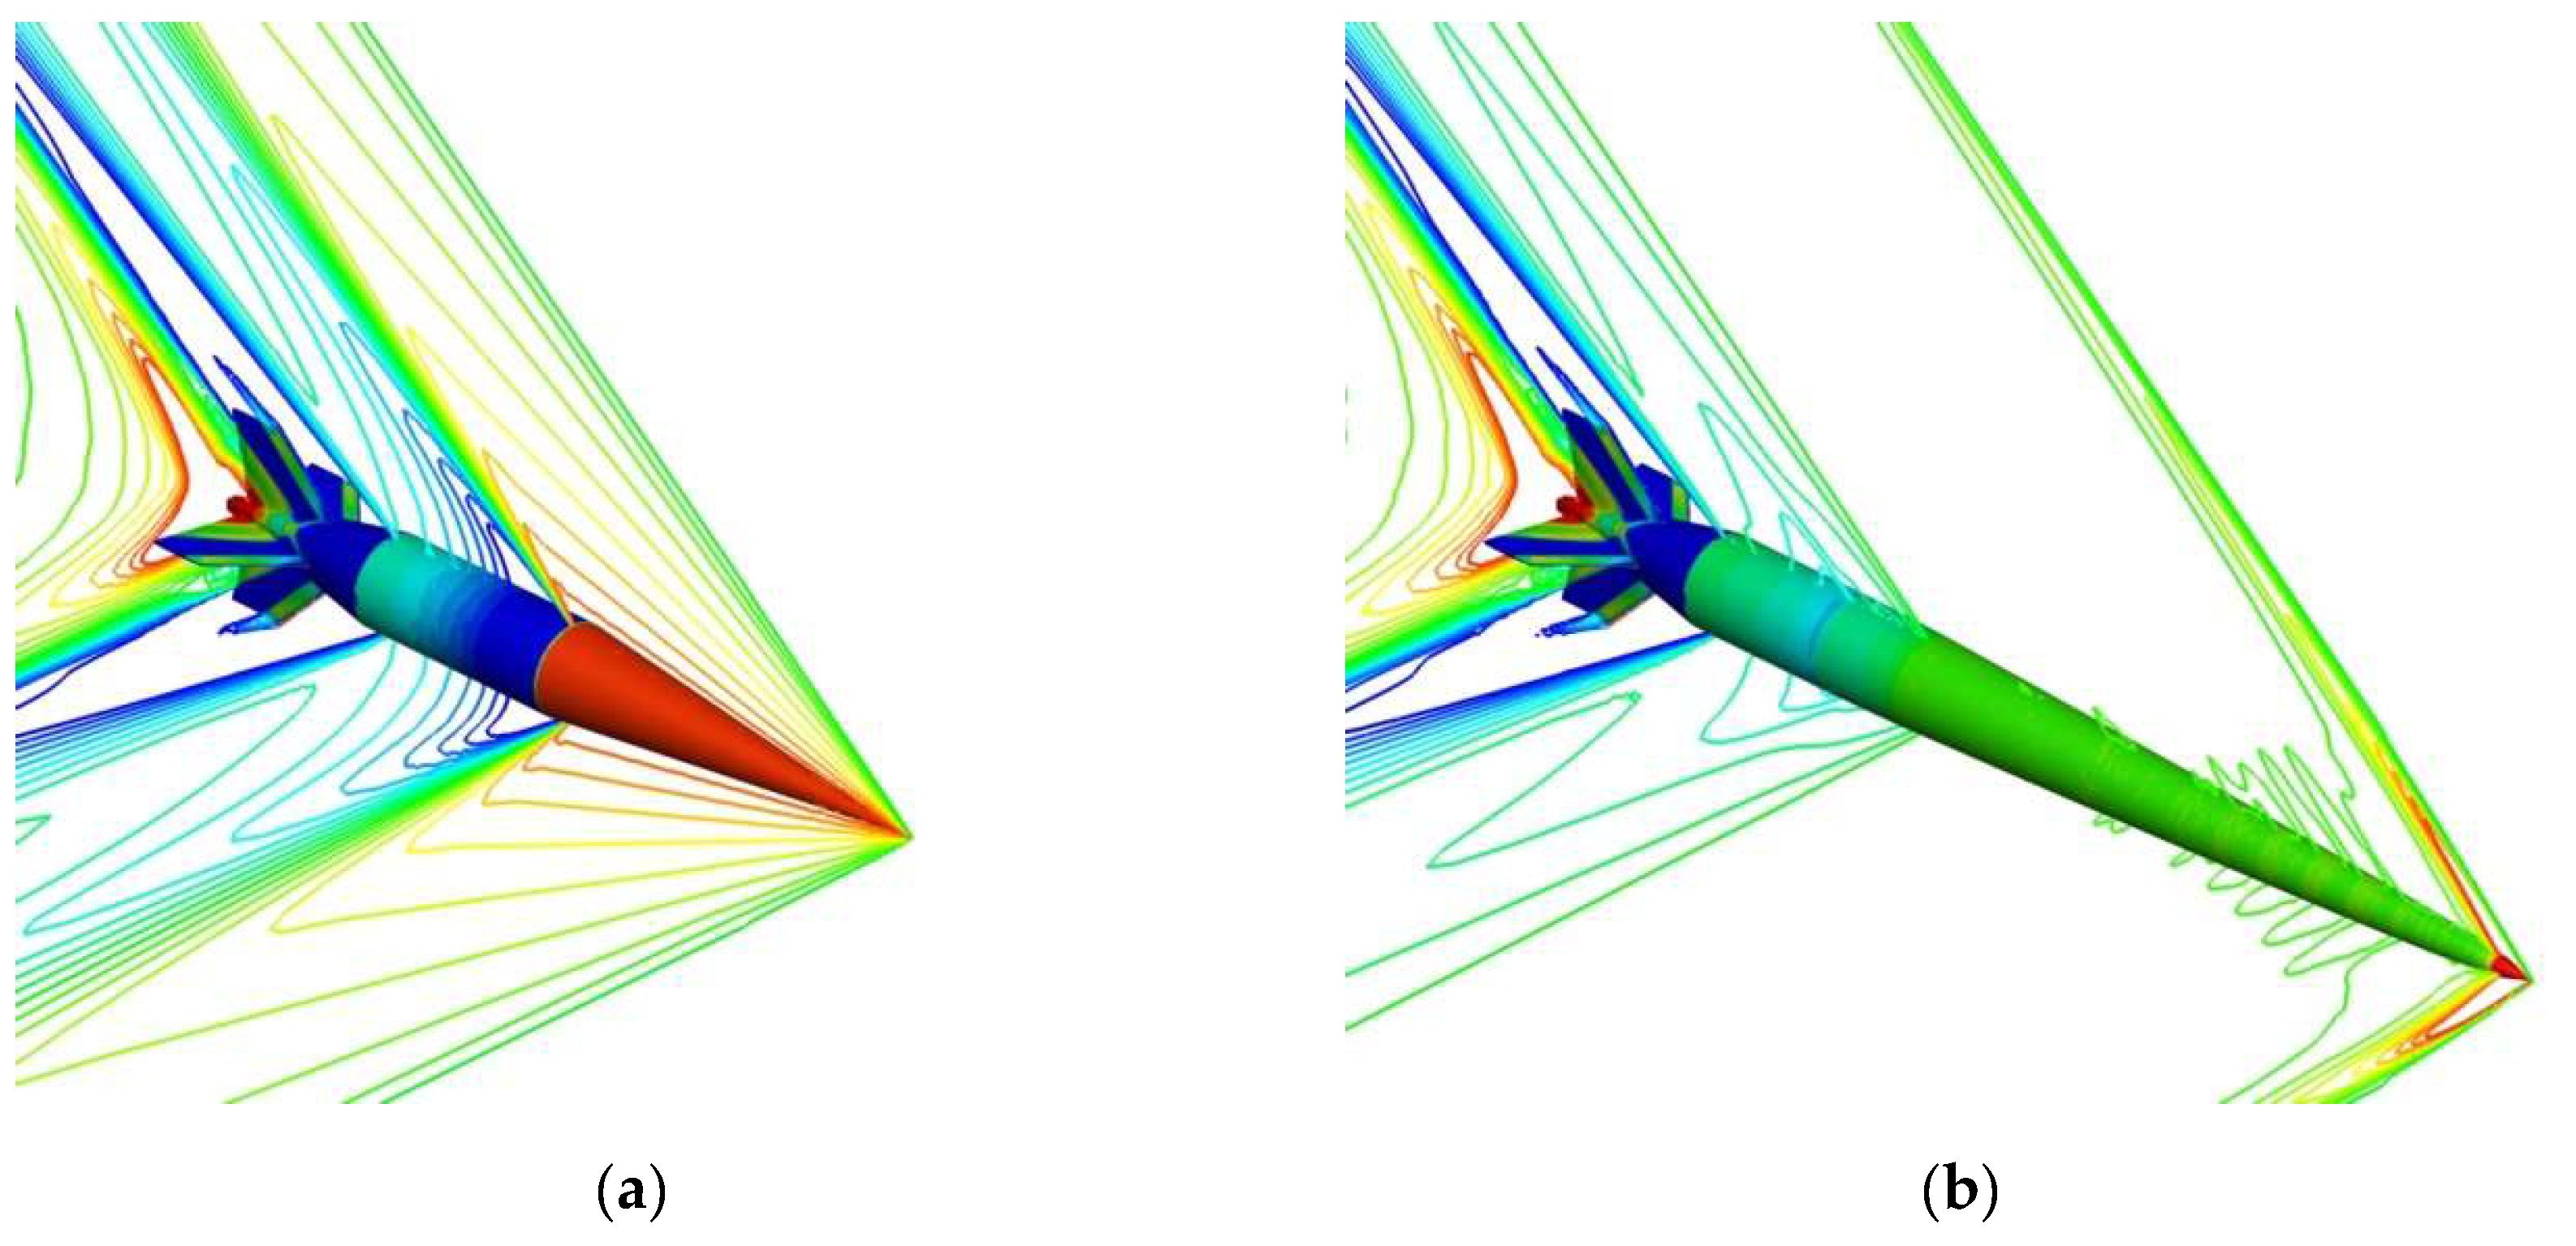
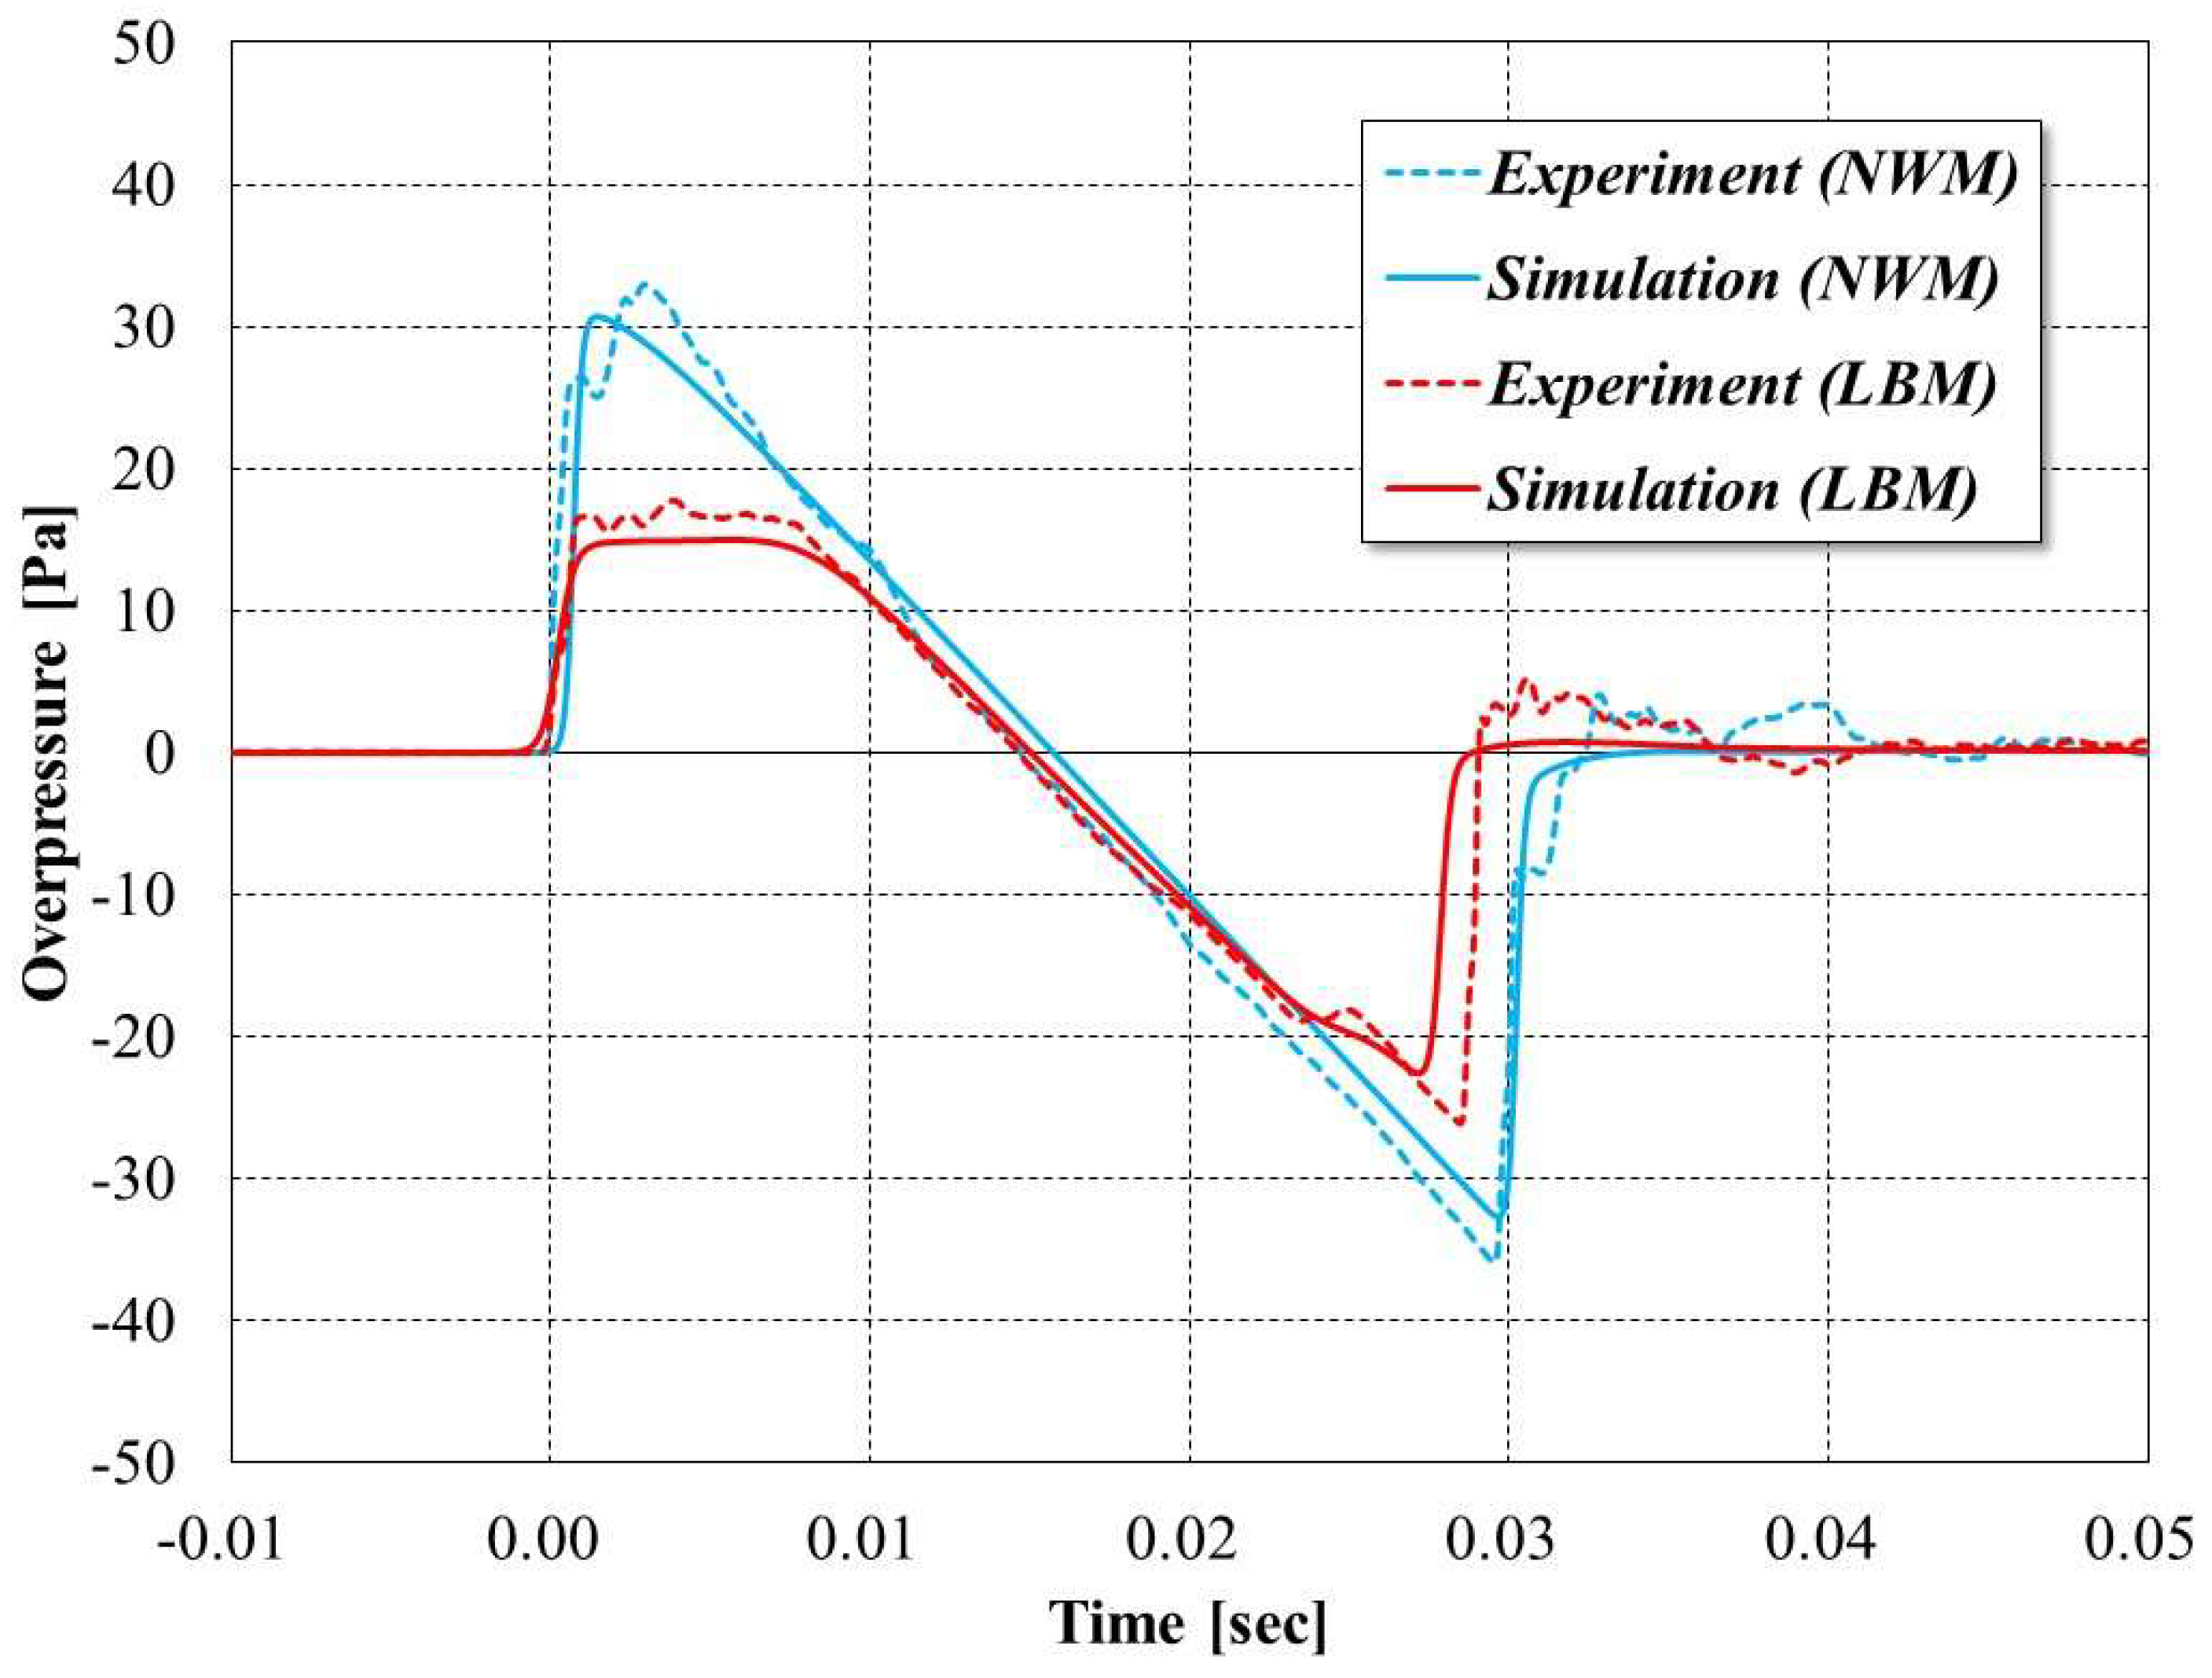
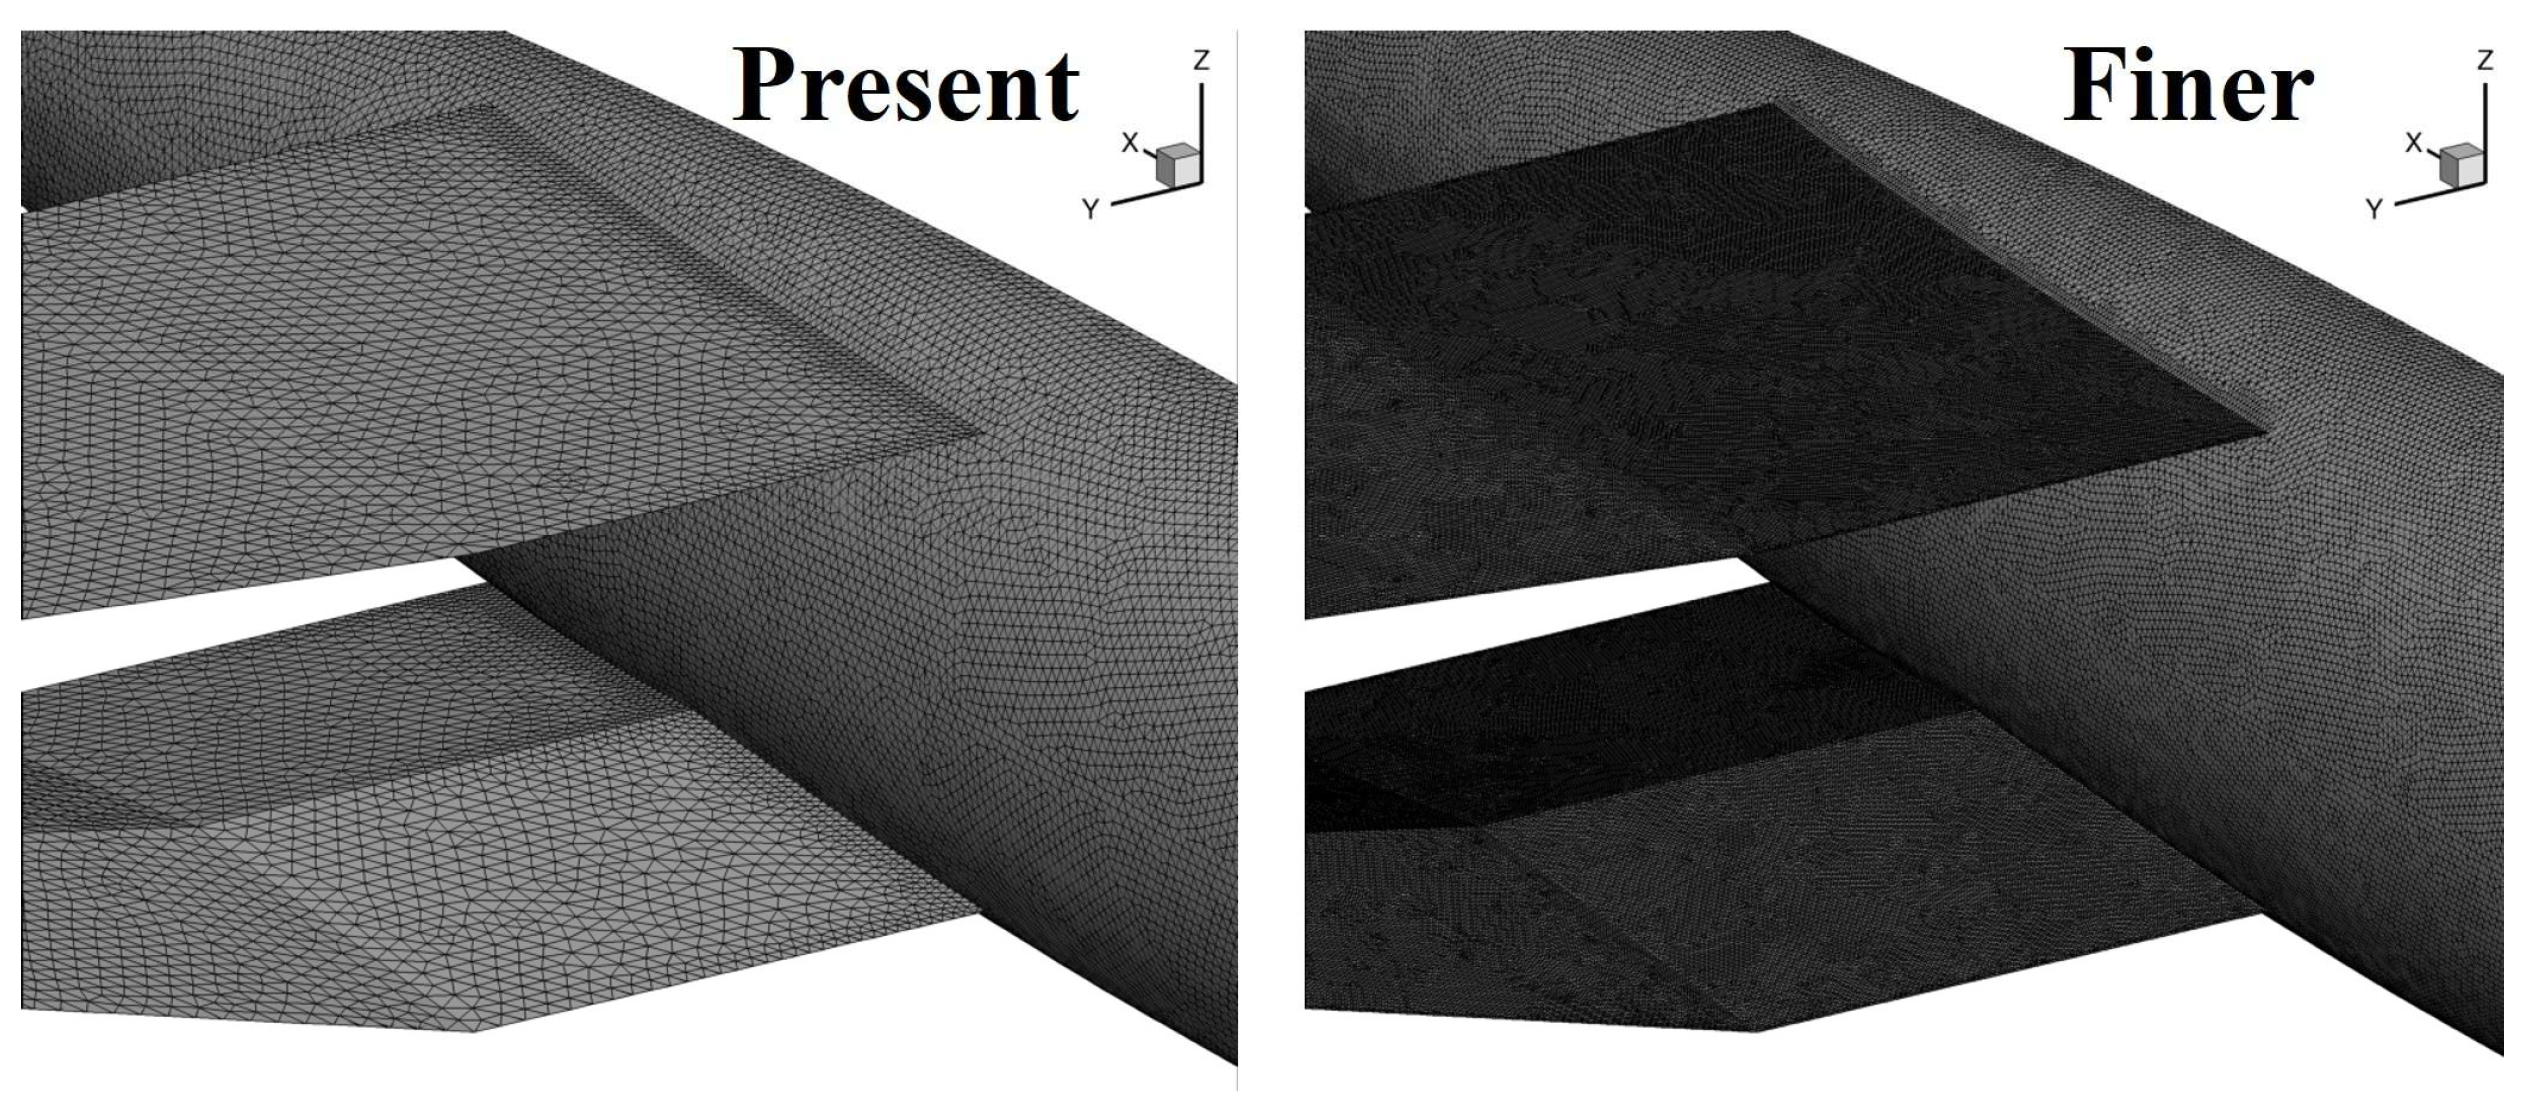
2.5. Validity of Numerical Methods
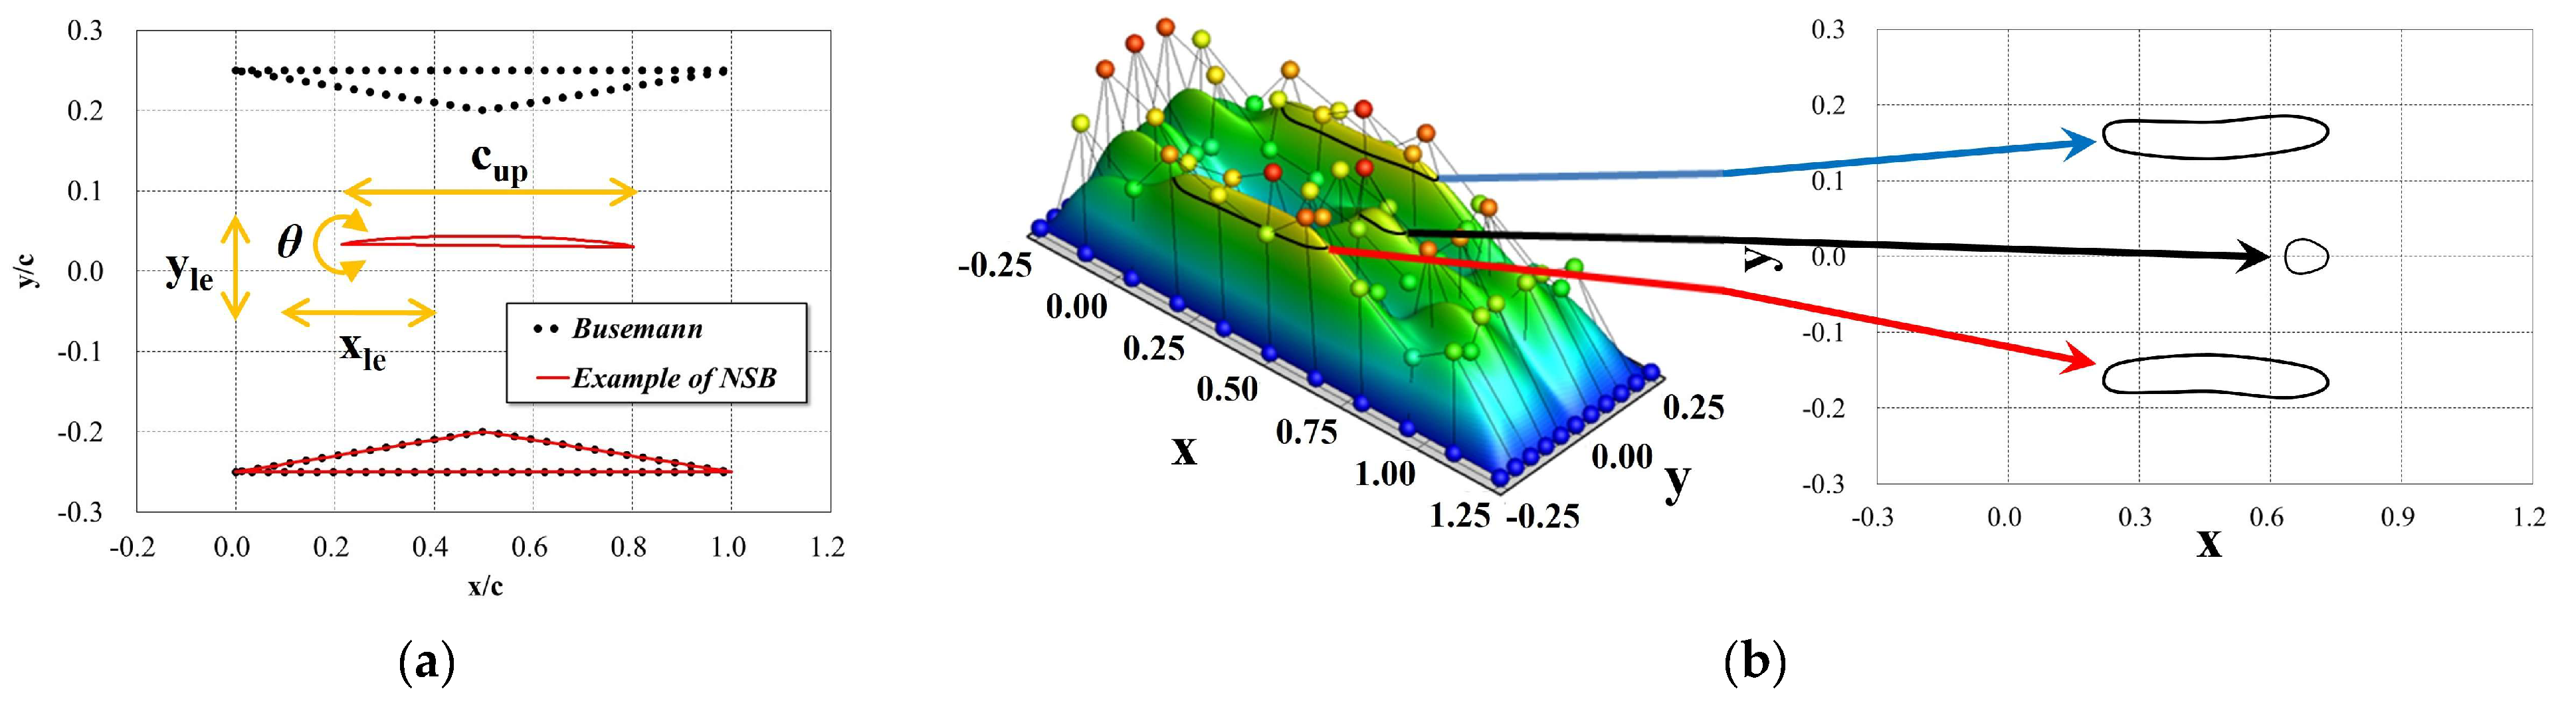
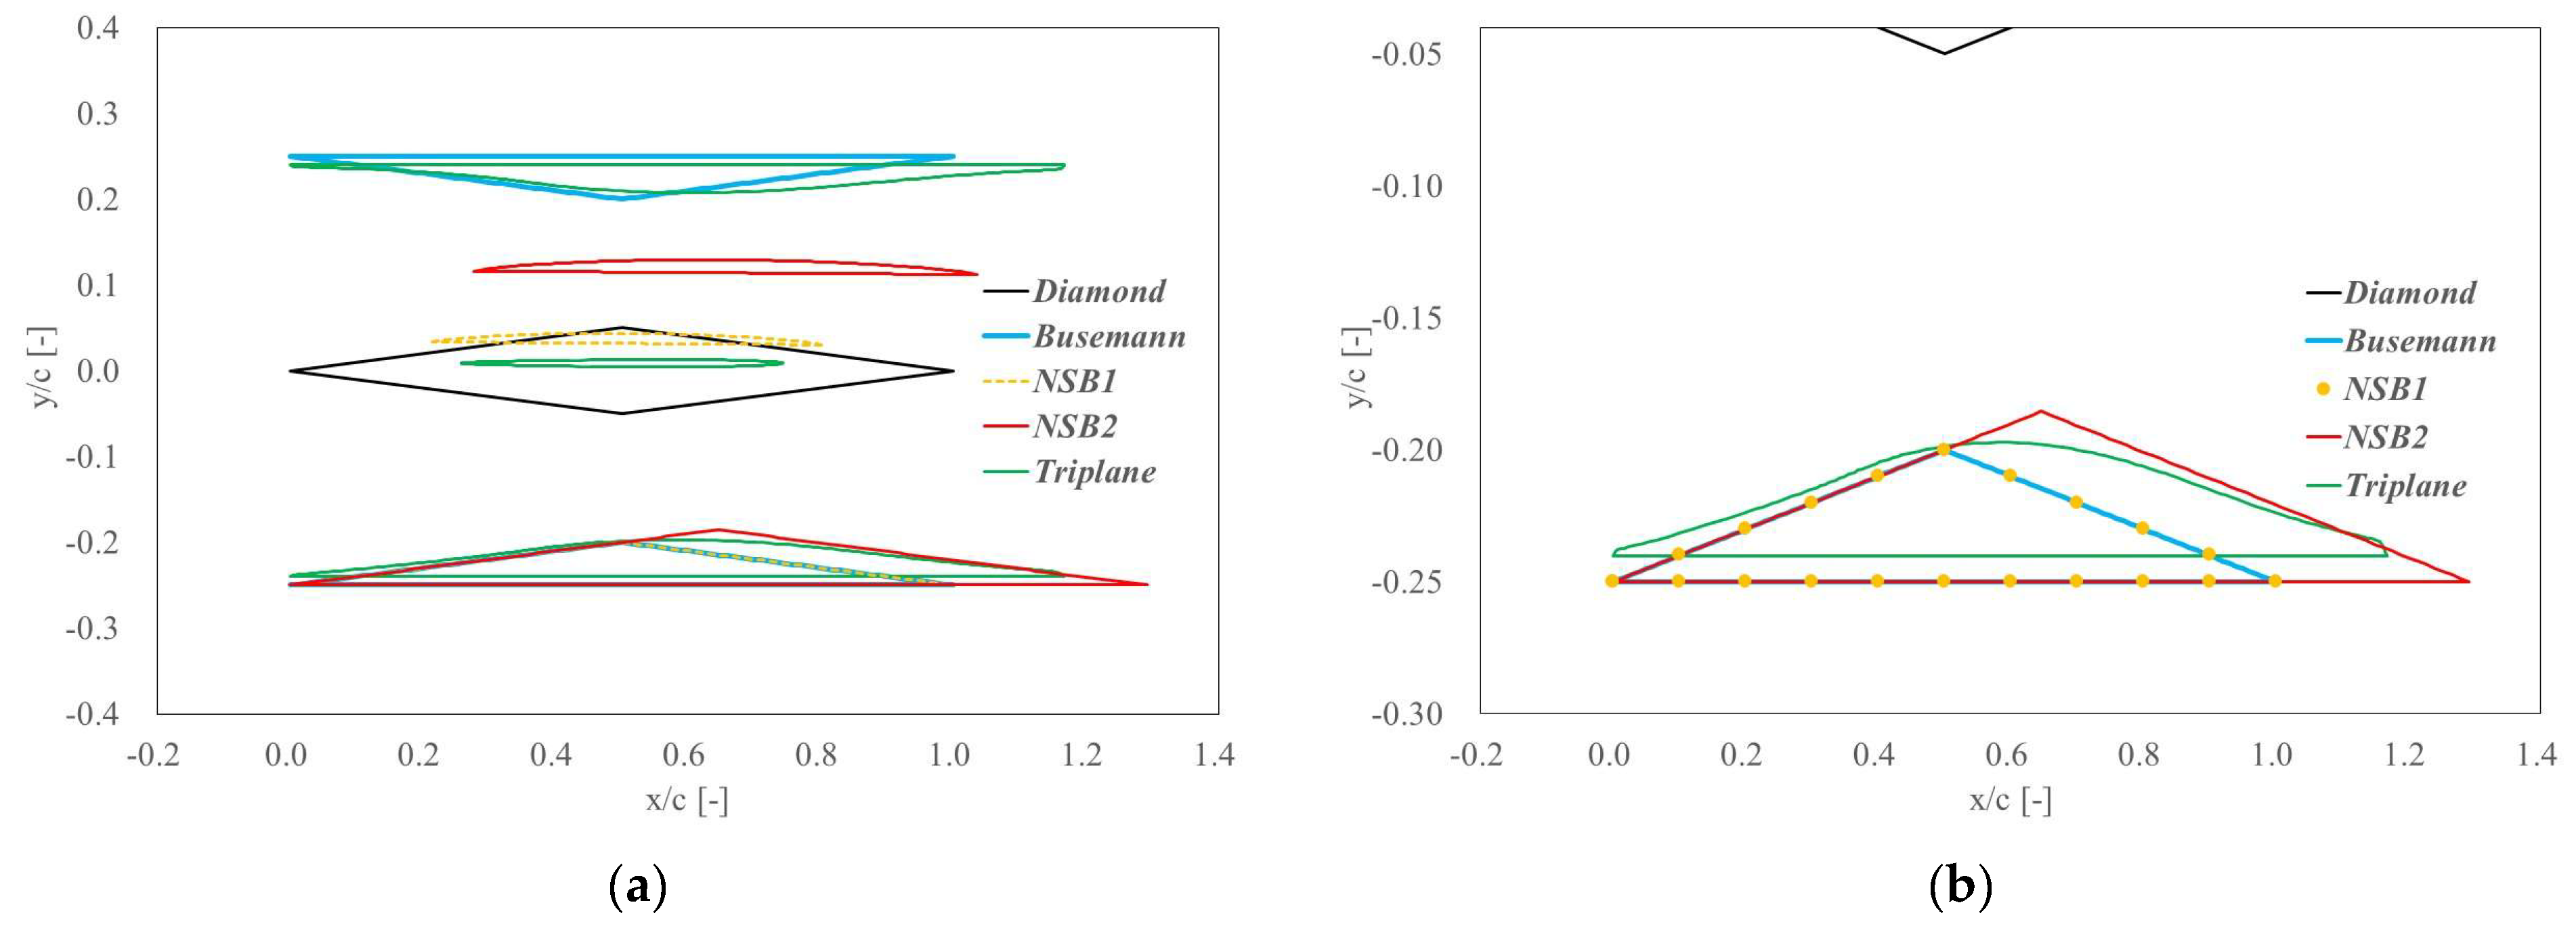
3. Shape Optimization of NSB Airfoil
4. Topology Optimization of Supersonic Airfoil Configuration
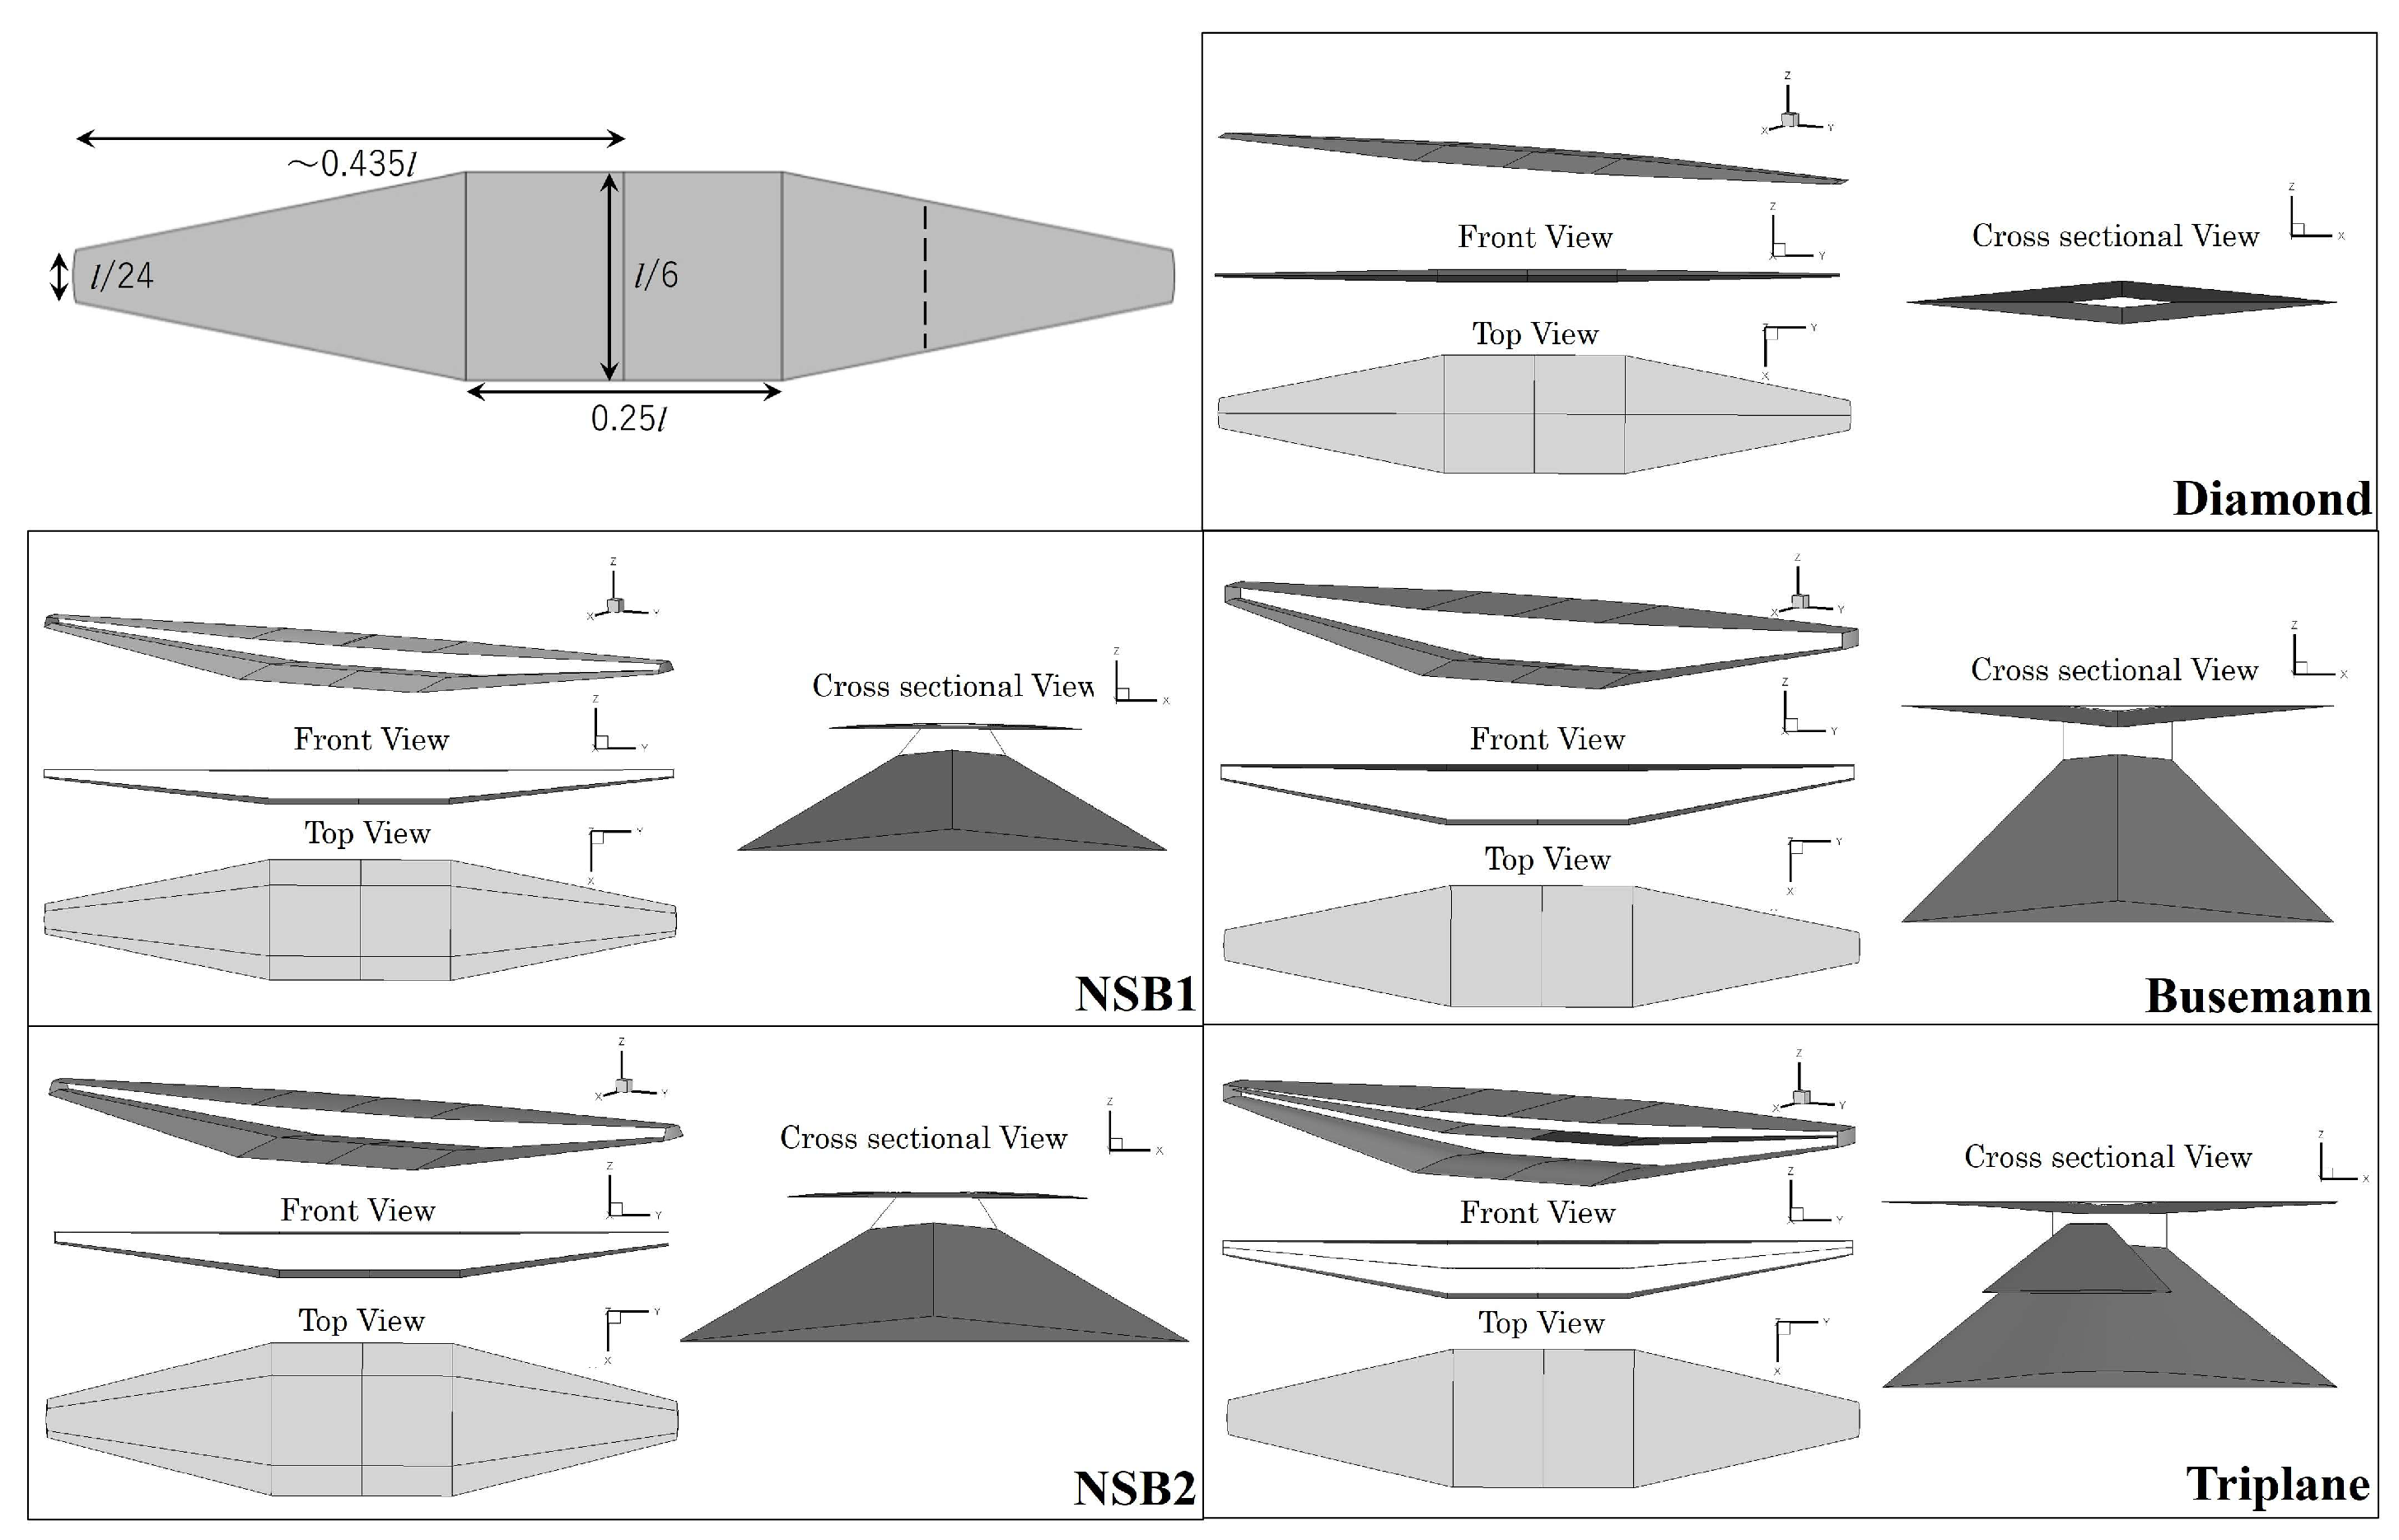
5. Three-Dimensional Wing/Wing–Body Model Design
6. Results of Three-Dimensional Computations
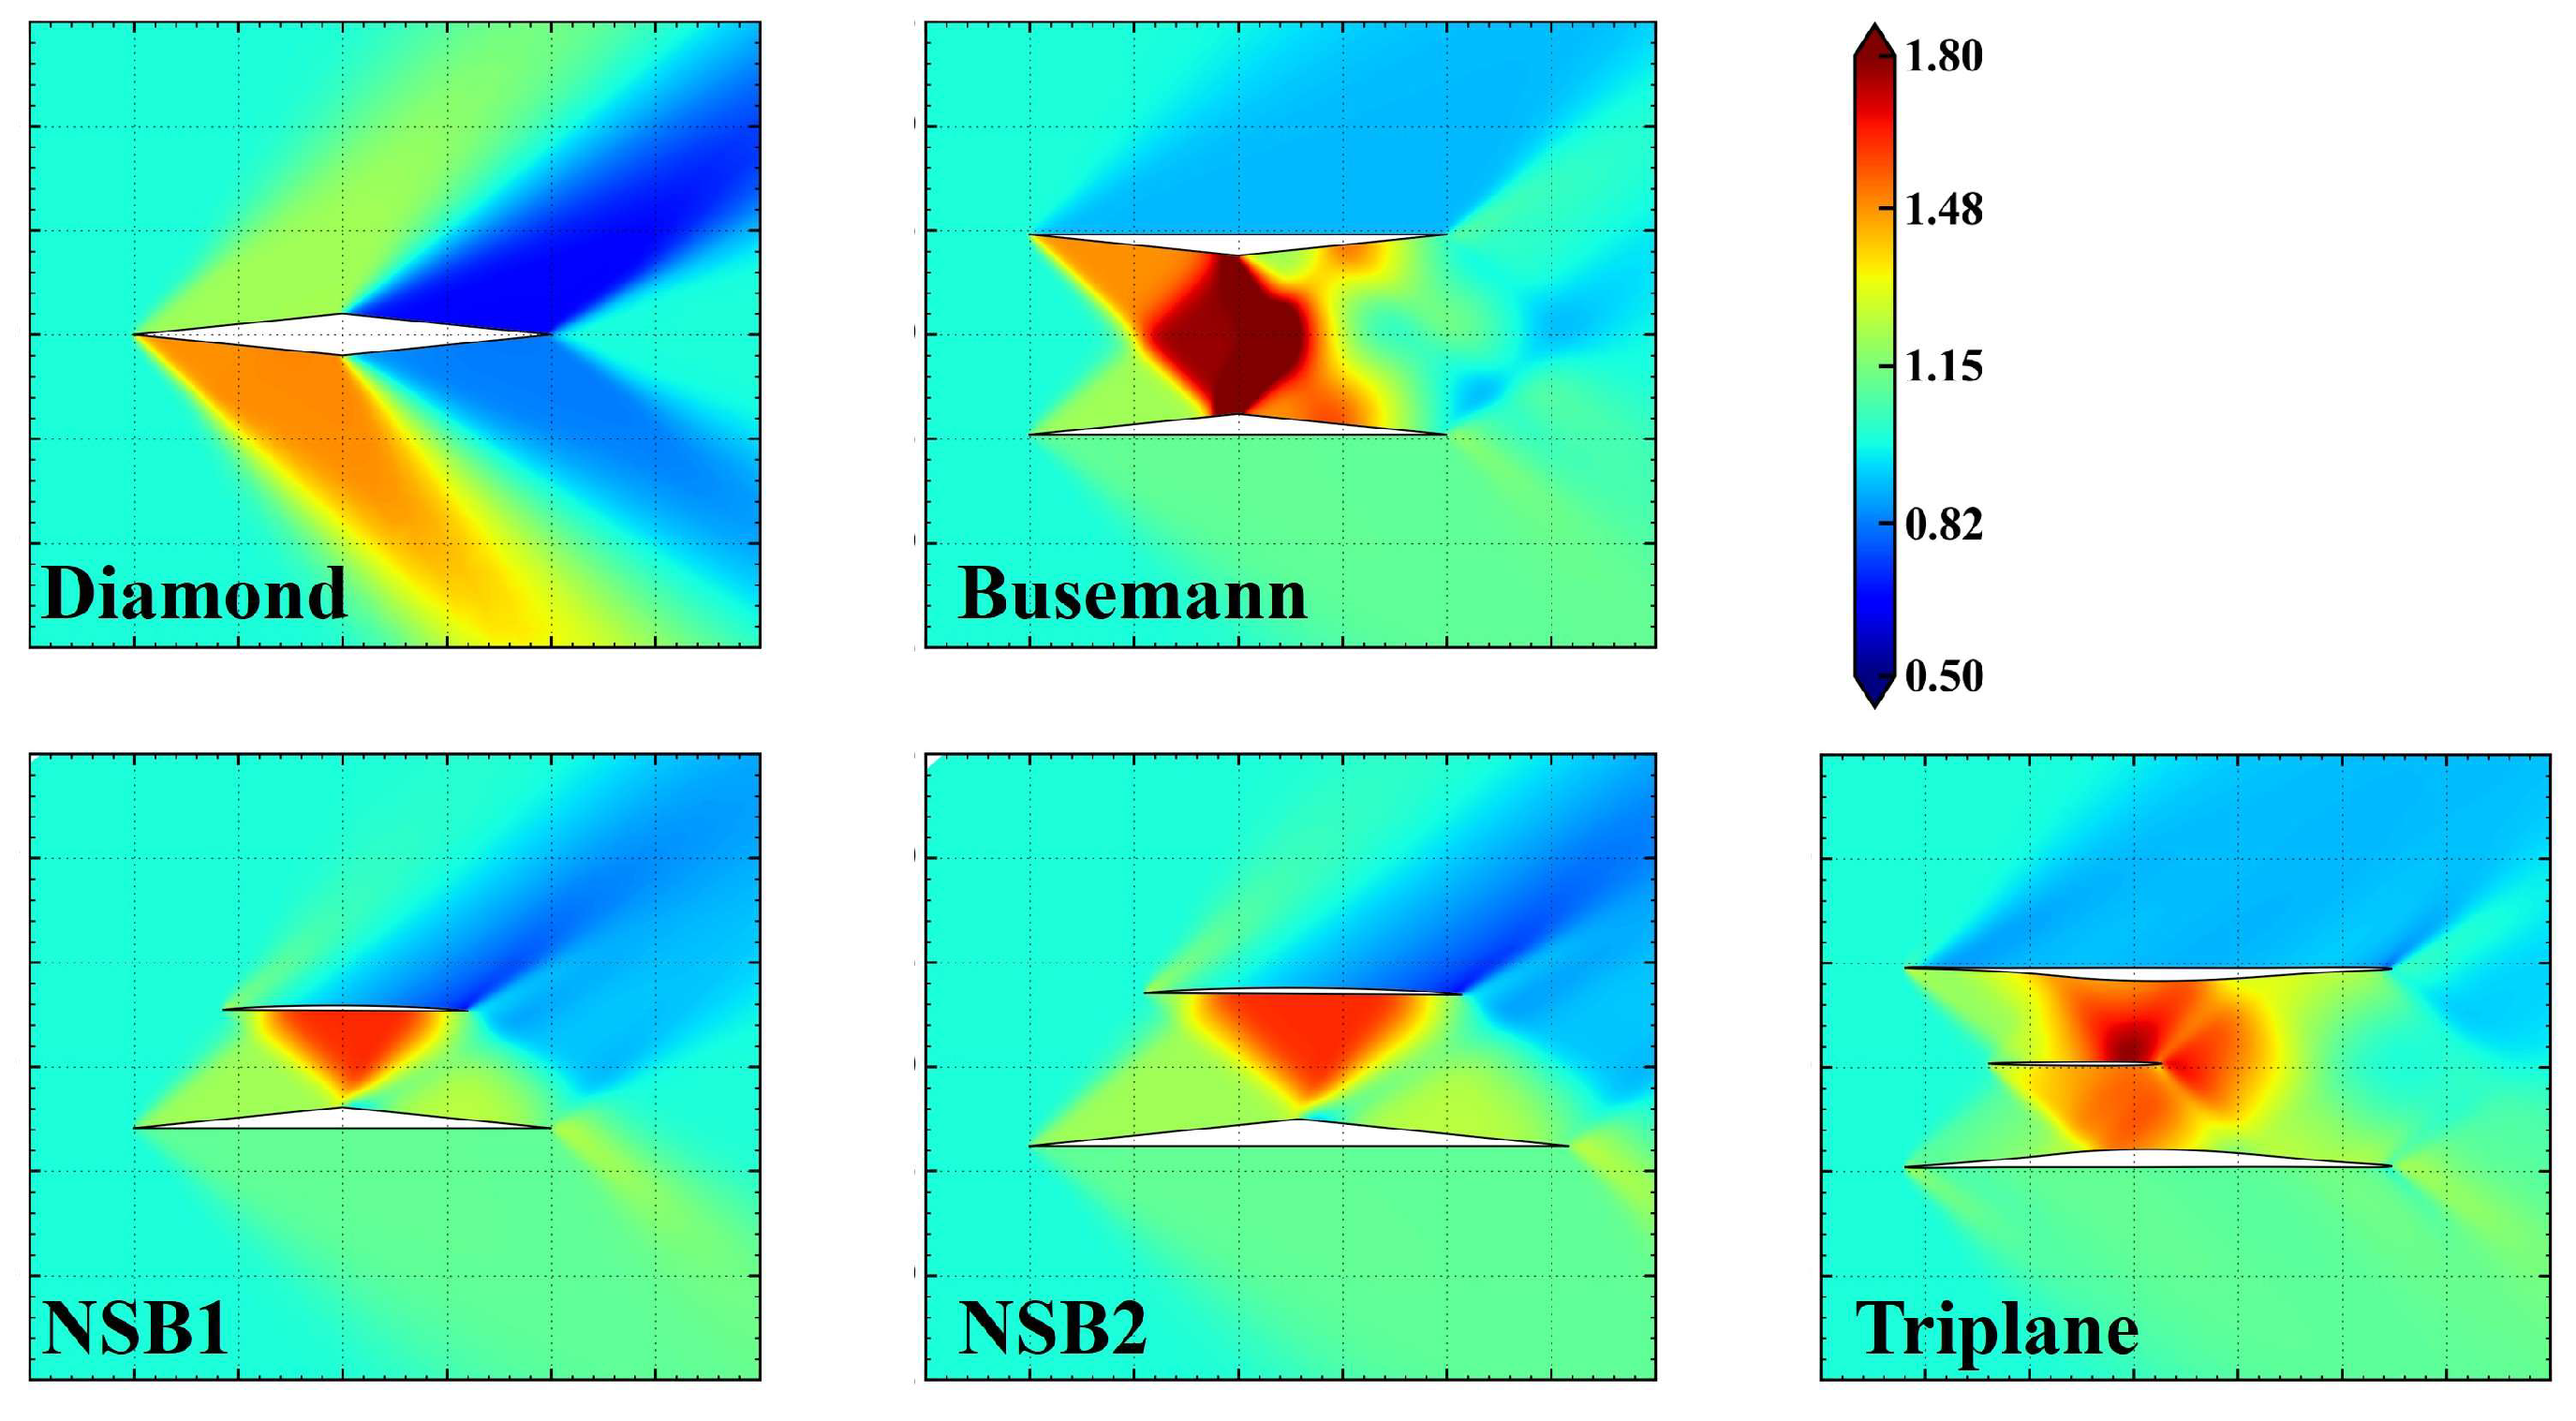
6.1. 3D Simulations of Wing Models
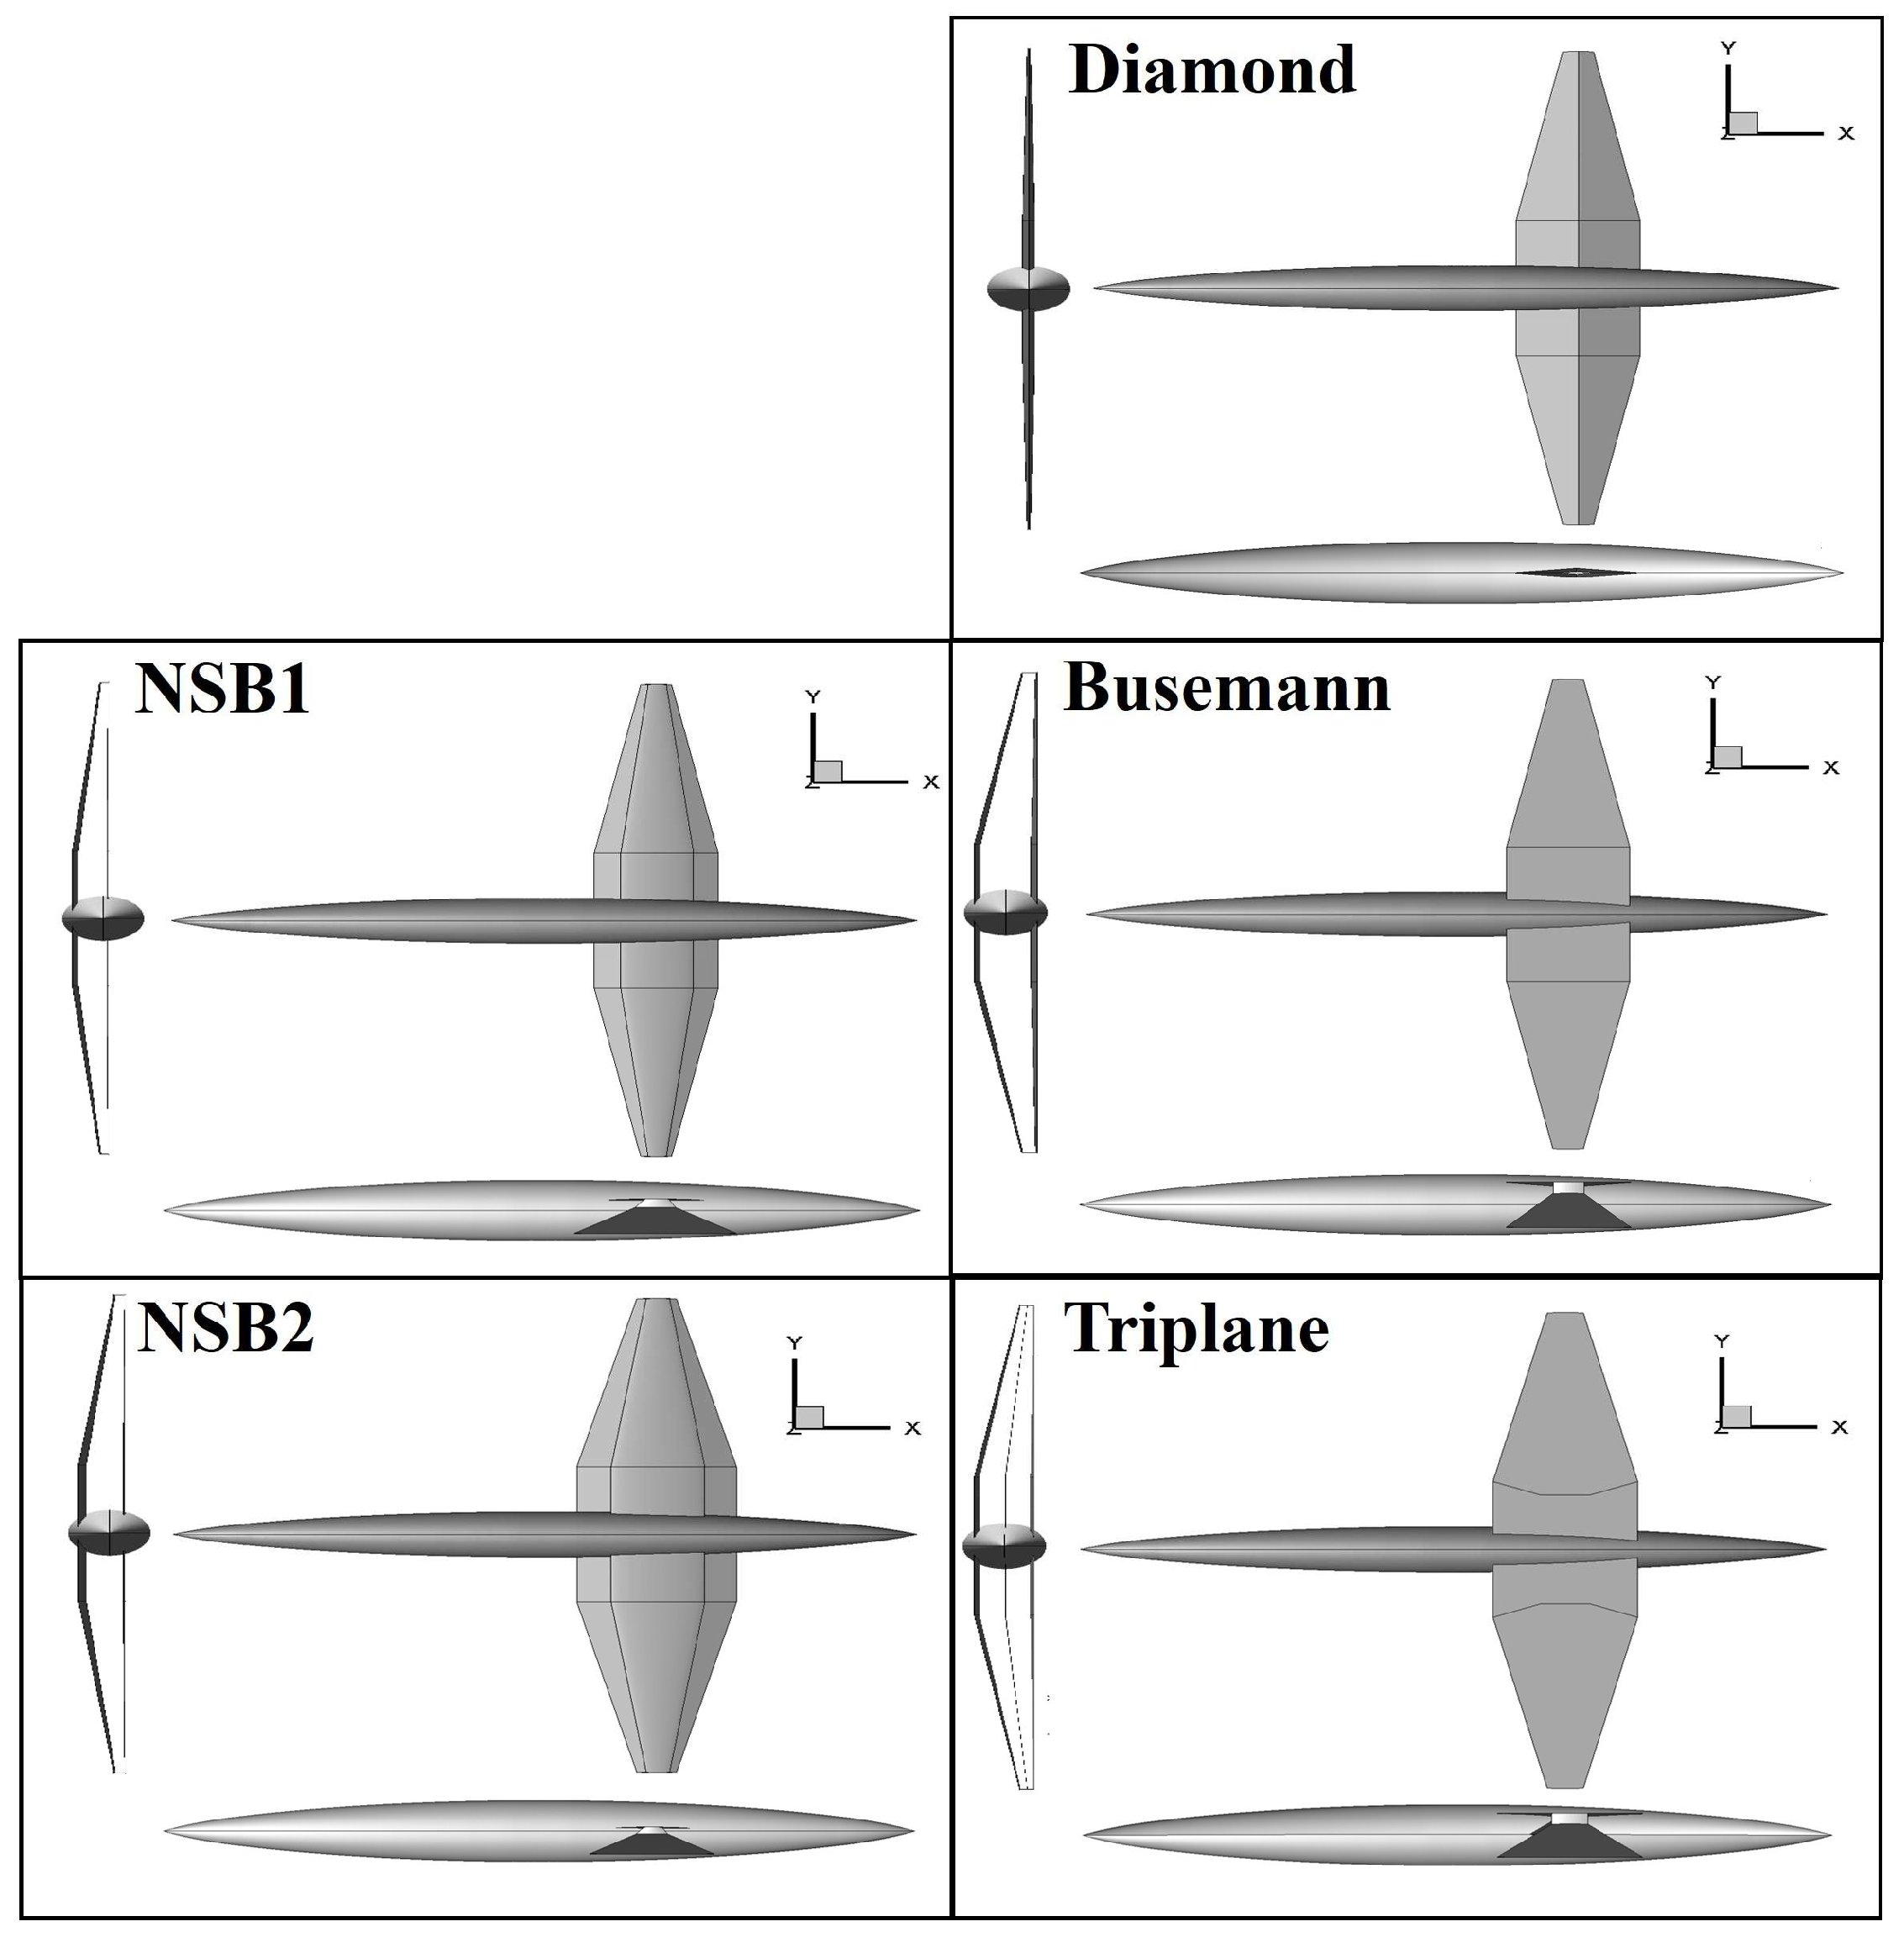
6.2. 3D Simulations of Wing–Body Models
7. Comprehensive Discussion
8. Conclusions
Author Contributions
Funding
Data Availability Statement
Acknowledgments
Conflicts of Interest
References
- Ueno, A.; Watanabe, Y.; Din, I.S.E.; Grenon, R.; Carrier, G. Low Boom/Low Drag Small Size Supersonic Aircraft Design. In Proceedings of the VII European Congress on Computational Methods in Applied Sciences and Engineering, Crete, Greece, 5–10 June 2016. [Google Scholar]
- Quagliarella, D.; Iuliano, E. UQ Sensitivity Analysis and Robust Design Optimization of a Supersonic Natural Laminar Flow Wing-Body. Notes Numer. Fluid Mech. Multidiscip. Des. 2018, 140, 601–628. [Google Scholar] [CrossRef]
- Honda, M.; Yoshida, K. D-SEND Project for Low Sonic Boom Design Technology. In Proceedings of the 28th ICAS Congress, Brisbane, Australia, 23–28 September 2012. [Google Scholar]
- Bons, N.; Martins, J.; Mader, C.A.; McMullen, M.S.; Suen, M. High-fidelity Aerostructural Optimization Studies of the Aerion AS2 Supersonic Business Jet. In Proceedings of the AIAA Aviation 2020 Forum, Virtual, 15–19 June 2020. [Google Scholar] [CrossRef]
- Liebhardt, B.; Lütjens, K.; Ueno, A.; Ishikawa, H. JAXA’s S4 Supersonic Low-Boom Airliner—A Collaborative Study on Aircraft Design, Sonic Boom Simulation, and Market Prospects. In Proceedings of the AIAA Aviation 2020 Forum, Virtual, 15–19 June 2020. [Google Scholar] [CrossRef]
- Jim, T.M.S.; Faza, G.A.; Palar, P.S.; Shimoyama, K. A Multiobjective Surrogate-assisted Optimisation and Exploration of Low-Boom Supersonic Transport Planforms. Aerosp. Sci. Technol. 2022, 128, 107747. [Google Scholar] [CrossRef]
- Liu, C.; Meng, X.; Liu, J.; Zhou, J.; Bai, P. Experimental Investigation for Subsonic, Transonic, and Supersonic Performances of Double-Swept Waverider. AIAA J. 2023, 61, 4247–4258. [Google Scholar] [CrossRef]
- Chen, Q.; Han, Z.H.; Ding, Y.L.; Jianling, Q.; Song, K.; Song, W. Low-Boom Design of a T-tail Supersonic Transport Configuration. In Proceedings of the APISAT 2023, Lingshui, China, 16–18 October 2023. [Google Scholar]
- Buyanbaatar, N.; Yamazaki, W. Efficient Multi-objective Aerodynamic Shape Optimization of 3D Supersonic Transport Using Proper Orthogonal Decomposition. Trans. Jpn. Soc. Aeronaut. Space Sci. 2023, 66, 147–155. [Google Scholar] [CrossRef]
- Bonavolontà, G.; Lawson, C.; Riaz, A. Review of Sonic Boom Prediction and Reduction Methods for Next Generation of Supersonic Aircraft. Aerospace 2023, 10, 917. [Google Scholar] [CrossRef]
- Kusunose, K. Aerodynamic Design of Supersonic Biplane: Cutting Edge and Related Topic; Tohoku University Press: Sendai, Japan, 2007. [Google Scholar]
- Yonezawa, M.; Obayashi, S. Reducing Drag Penalty in the Three-Dimensional Supersonic Biplane. Proc. Inst. Mech. Eng. Part G J. Aerosp. Eng. 2009, 223, 891–899. [Google Scholar] [CrossRef]
- Kusunose, K.; Matsushima, K.; Maruyama, D. Supersonic biplane—A review. Prog. Aerosp. Sci. 2011, 47, 53–87. [Google Scholar] [CrossRef]
- Hu, R.; Jameson, A.; Wang, Q. Adjoint-Based Aerodynamic Optimization of Supersonic Biplane Airfoils. J. Aircr. 2012, 49, 802–814. [Google Scholar] [CrossRef]
- Yamazaki, W.; Kusunose, K. Aerodynamic Study of Twin-Body Fuselage Configuration for Supersonic Transport. Trans. Jpn. Soc. Aeronaut. Space Sci. 2013, 56, 229–236. [Google Scholar] [CrossRef]
- Yamazaki, W.; Kusunose, K. Aerodynamic/Sonic Boom Performance Evaluation of Innovative Supersonic Transport Configurations. J. Aircr. 2016, 53, 942–950. [Google Scholar] [CrossRef]
- Patidar, V.K.; Yadav, R.; Joshi, S. Numerical Investigation of the Effect of Stagger on the Aerodynamic Characteristics of a Busemann Biplane. Aerosp. Sci. Technol. 2016, 55, 252–263. [Google Scholar] [CrossRef]
- Ban, N.; Yamazaki, W.; Kusunose, K. Low-Boom/Low-Drag Design Optimization of Innovative Supersonic Transport Configuration. J. Aircr. 2018, 55, 1071–1081. [Google Scholar] [CrossRef]
- Hanazaki, K.; Yamazaki, W. Robust Design Optimization of Supersonic Biplane Airfoil Using Efficient Uncertainty Analysis Method for Discontinuous Problem. Aerospace 2024, 11, 64. [Google Scholar] [CrossRef]
- Payot, A.D.; Rendall, T.C.S.; Allen, C.B. Restricted Snakes Volume of Solid (RSVS): A Parameterisation Method for Topology Optimisation of External Aerodynamics. Comput. Fluids 2019, 102, 60–84. [Google Scholar] [CrossRef]
- Wood, M.J.; Rendall, T.C.S.; Allen, C.B.; Taylor, N.J.; Fincham, J.; Leppard, N. Gradient-Based Aerodynamic Optimisation for Two- and Three-Dimensional Supersonic Flows Using a Volume-of-Solid Parameterisation. In Proceedings of the AIAA Scitech 2024 Forum, Orlando, FL, USA, 8–12 January 2024. [Google Scholar] [CrossRef]
- Ban, N. Efficient Aerodynamic Topology Optimization on Supersonic Flow Field via Machine Learning Technologies. Ph.D. Thesis, Nagaoka University of Technology, Niigata, Japan, 2019. [Google Scholar]
- Ban, N.; Yamazaki, W. Black-box Function Aerodynamic Topology Optimization Algorithm via Machine Learning Technologies. AIAA J. 2021, 59, 5174–5185. [Google Scholar] [CrossRef]
- Liao, P.; Song, W.; Du, P.; Feng, F.; Zhang, Y. Aerodynamic Intelligent Topology Design (AITD)-A Future Technology for Exploring the New Concept Configuration of Aircraft. Aerospace 2023, 10, 46. [Google Scholar] [CrossRef]
- Hirose, K.; Suzuki, K.; Yamazaki, W. Aerodynamic Topology Optimization of Supersonic Airfoils using Feature Extraction via Dimensionality Reduction Methods. In Proceedings of the APISAT 2024, Adelade, Australia, 28–30 October 2024. [Google Scholar]
- Zhai, J.; Zhang, C.A.; Wang, F.M.; Zhang, W.W. Design of New Supersonic Biplane. Acta Astronaut. 2020, 175, 216–233. [Google Scholar] [CrossRef]
- Ban, N.; Yamazaki, W. Development of Efficient Global Optimization Method for Discontinuous Optimization Problems with Infeasible Region via Classification Method. J. Adv. Mech. Des. Syst. Manuf. 2019, 13, JAMDSM0017. [Google Scholar] [CrossRef]
- Ban, N.; Yamazaki, W. Efficient Global Optimization Method via Clustering/Classification Methods and Exploration Strategy. Optim. Eng. 2021, 22, 521–553. [Google Scholar] [CrossRef]
- Ma, Z.; Chen, H.; Zhou, C. A Study of Point Moving Adaptivity in Gridless Method. Comput. Meth. Appl. Mech. Eng. 2008, 197, 1926–1937. [Google Scholar] [CrossRef]
- Yamazaki, W.; Matsushima, K.; Nakahashi, K. Drag Prediction, Decomposition and Visualization in Unstructured Mesh CFD Solver of TAS-Code. Int. J. Numer. Methods Fluids 2008, 57, 417–436. [Google Scholar] [CrossRef]
- Ito, Y.; Nakahashi, K. Direct Surface Triangulation Using Stereolithography Data. AIAA J. 2002, 40, 490–496. [Google Scholar] [CrossRef]
- Ito, Y.; Nakahashi, K. Surface Triangulation for Polygonal Models Based on CAD Data. Int. J. Numer. Methods Fluids 2002, 39, 75–96. [Google Scholar] [CrossRef]
- Raymer, D.P. Aircraft Design: A Conceptual Approach, 4th ed.; AIAA: Reston, VA, USA, 2006; pp. 327–330. [Google Scholar]
- Krasnov, N.F. Aerodynamics of Bodies of Revolution; Elsevier: New York, NY, USA, 1970; pp. 379–385. [Google Scholar]
- Yamamoto, M.; Hashimoto, A.; Takahashi, T.; Kamamura, T.; Sakai, T. Long-range Sonic Boom Prediction Considering Atmospheric Effects. In Proceedings of the InterNoise 2011, Osaka, Japan, 4–7 September 2011. [Google Scholar]
- Yamamoto, M.; Hashimoto, A.; Takahashi, T.; Kamakura, T.; Sakai, T. Numerical Simulations for Sonic Boom Propagation through an Inhomogeneous Atmosphere with Winds. In Proceedings of the 19th International Symposium on Nonlinear Acoustics, Tokyo, Japan, 21–24 May 2012. [Google Scholar]
- Naka, Y. Sonic Boom Data from D-SEND#1. JAXA Research and Development Memorandum, JAXA RM-11-010E; JAXA: Tokyo, Japan, 2012. [Google Scholar]
- JAXA D-SEND Database Website. Available online: http://d-send.jaxa.jp/d_send_1.html (accessed on 31 March 2025).
- Yamazaki, W.; Mavriplis, D.J. Derivative-enhanced Variable Fidelity Surrogate Modeling for Aerodynamic Functions. AIAA J. 2013, 51, 126–137. [Google Scholar] [CrossRef]


| Cl, Clp | Cdp | Cdf | Cd | L/D | |
|---|---|---|---|---|---|
| Viscous [13] | 0.104 | 0.0329 | 0.00414 | 0.0370 | 2.808 |
| Present | 0.107 | 0.0318 | 0.00402 | 0.0358 | 2.984 |
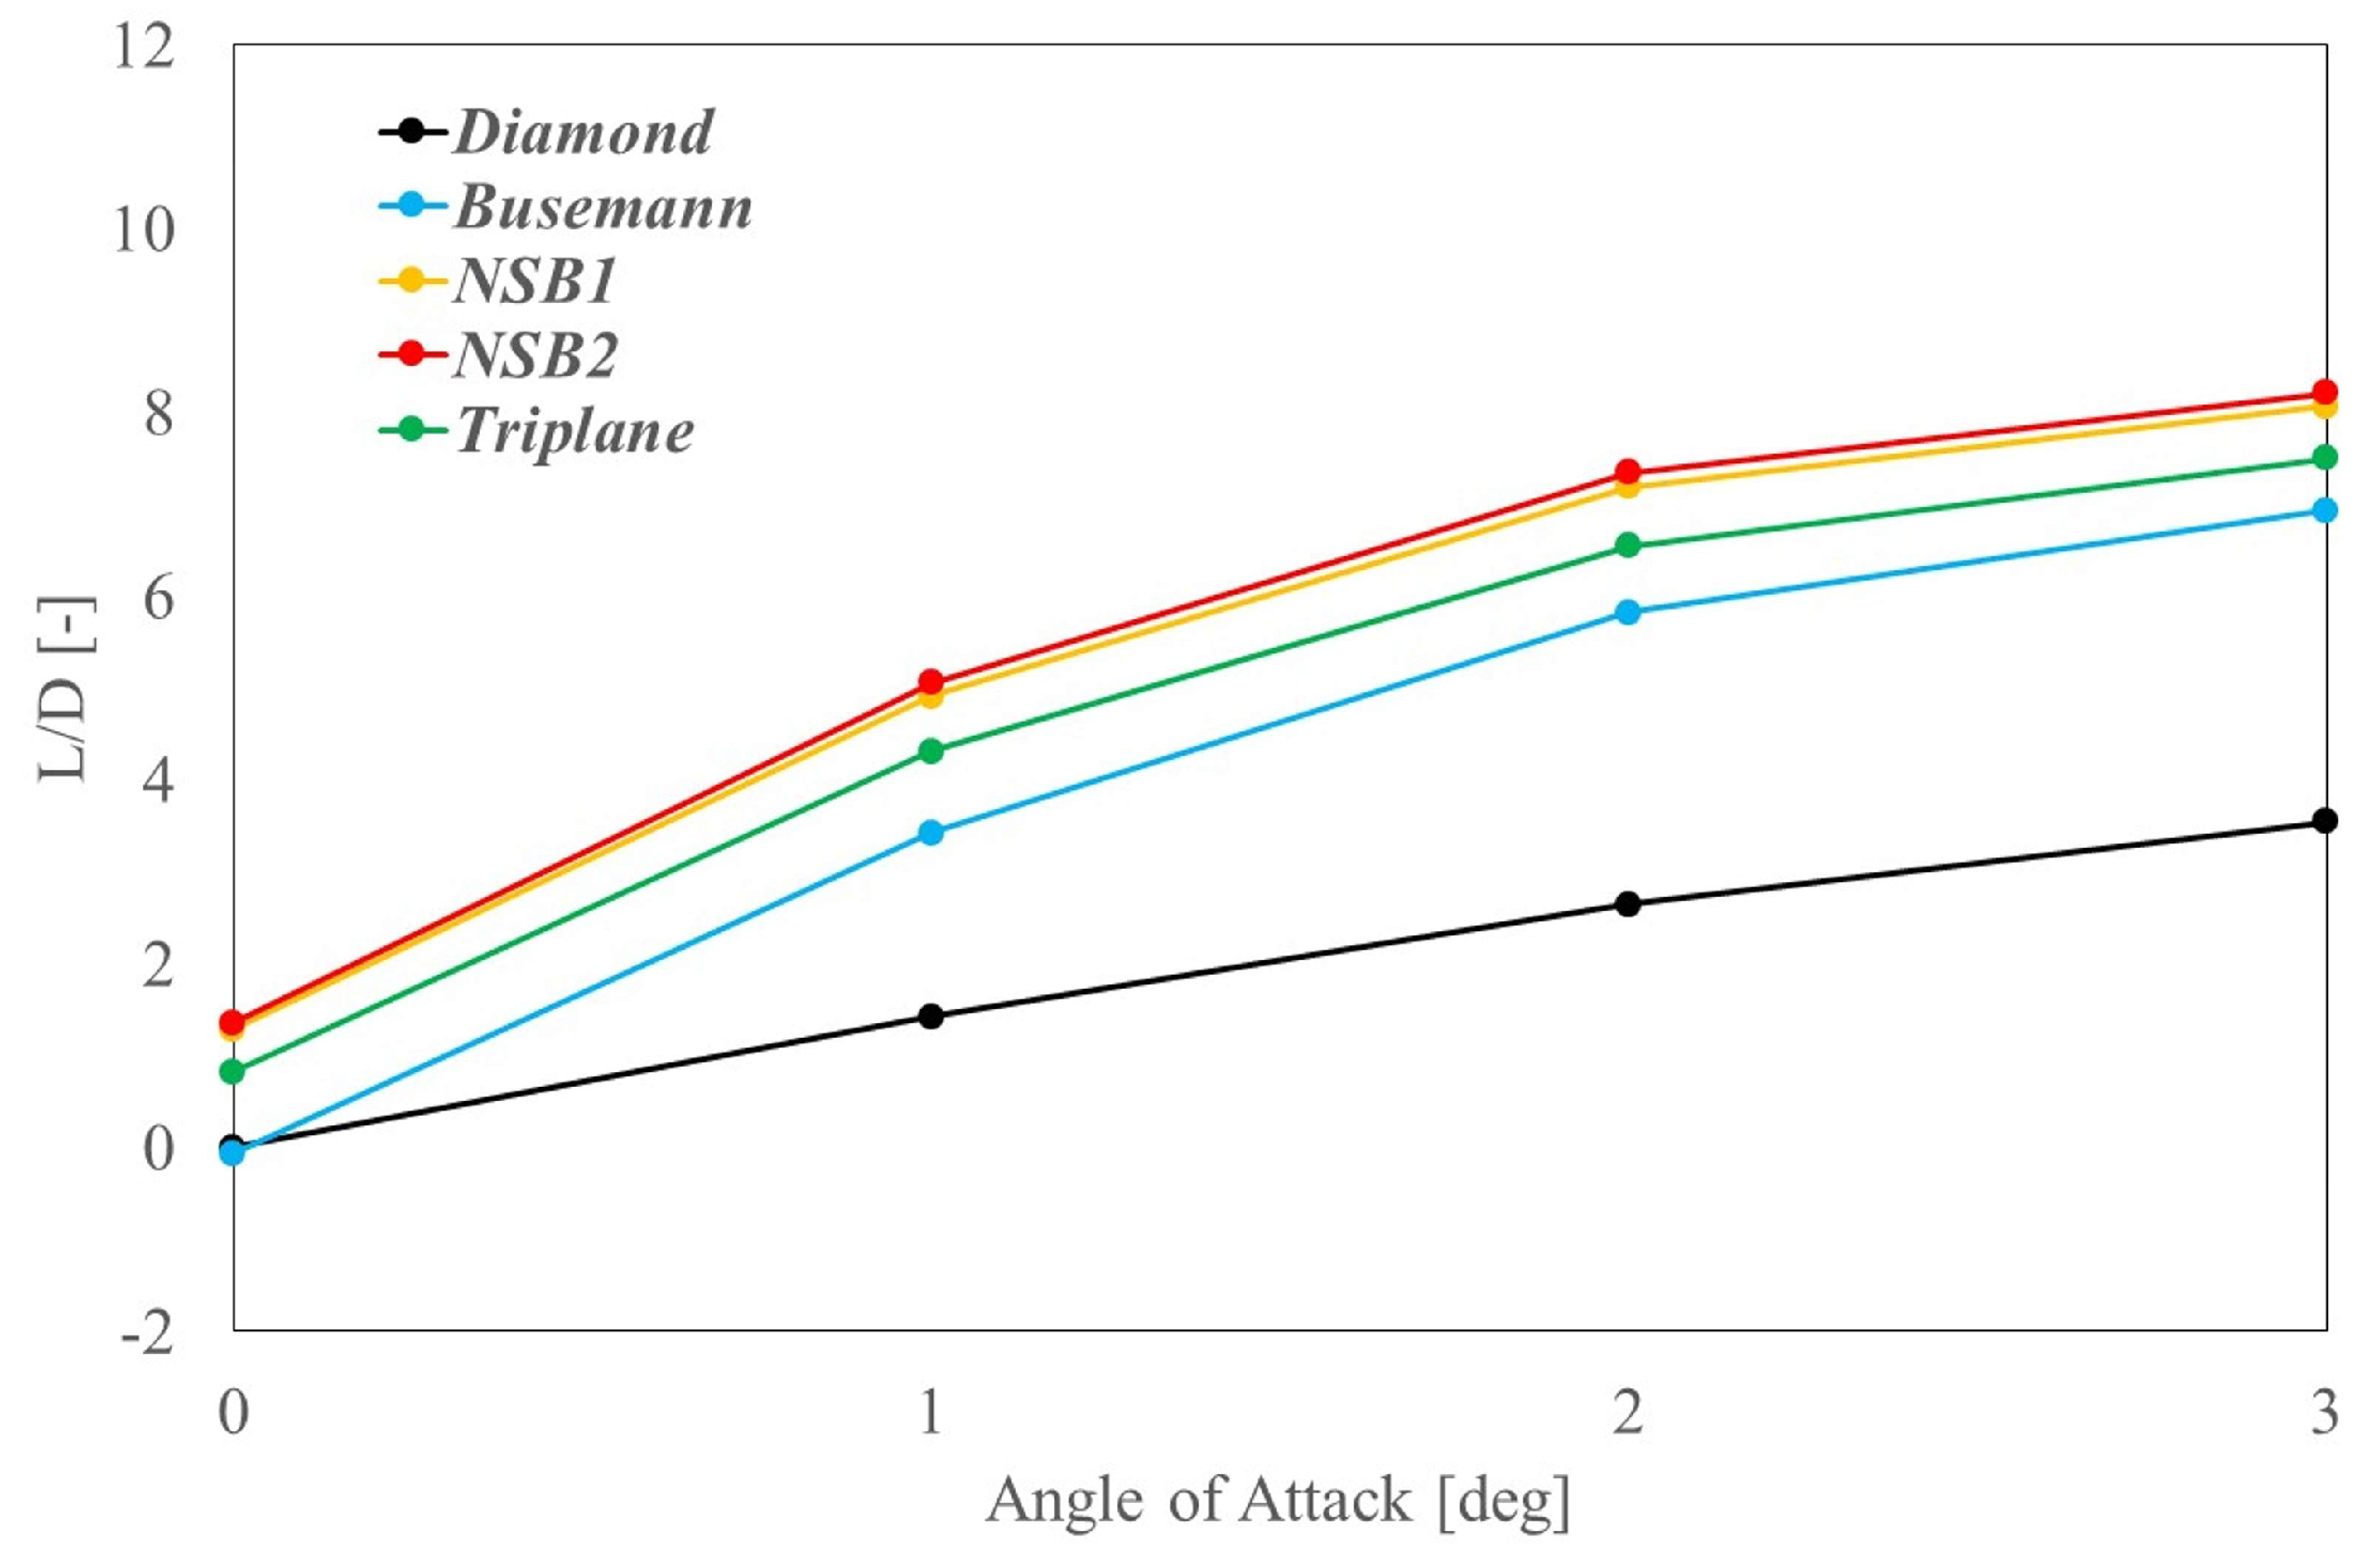
| Clp | Cdp | Cdf | Cd | L/D | |
|---|---|---|---|---|---|
| Diamond | 0.1069 | 0.0318 | 0.0038 | 0.0357 | 2.998 |
| Busemann | 0.1192 | 0.0075 | 0.0077 | 0.0152 | 7.849 |
| NSB1 | 0.1210 | 0.0076 | 0.0061 | 0.0137 | 8.855 |
| NSB2 | 0.1588 | 0.0099 | 0.0078 | 0.0177 | 8.957 |
| Triplane | 0.1638 | 0.0062 | 0.0105 | 0.0167 | 9.811 |
| # of Objects | Area | Features | |
|---|---|---|---|
| Diamond | 1 | 0.050 | 10% thickness airfoil |
| Busemann | 2 | 0.050 | Two triangular airfoils (5% thickness) |
| NSB1 | 2 | 0.030 | Lower element is the same as Busemann |
| NSB2 | 2 | 0.050 | Geometric similarity with NSB1 |
| Triplane | 3 | 0.050 | Topology optimal design |
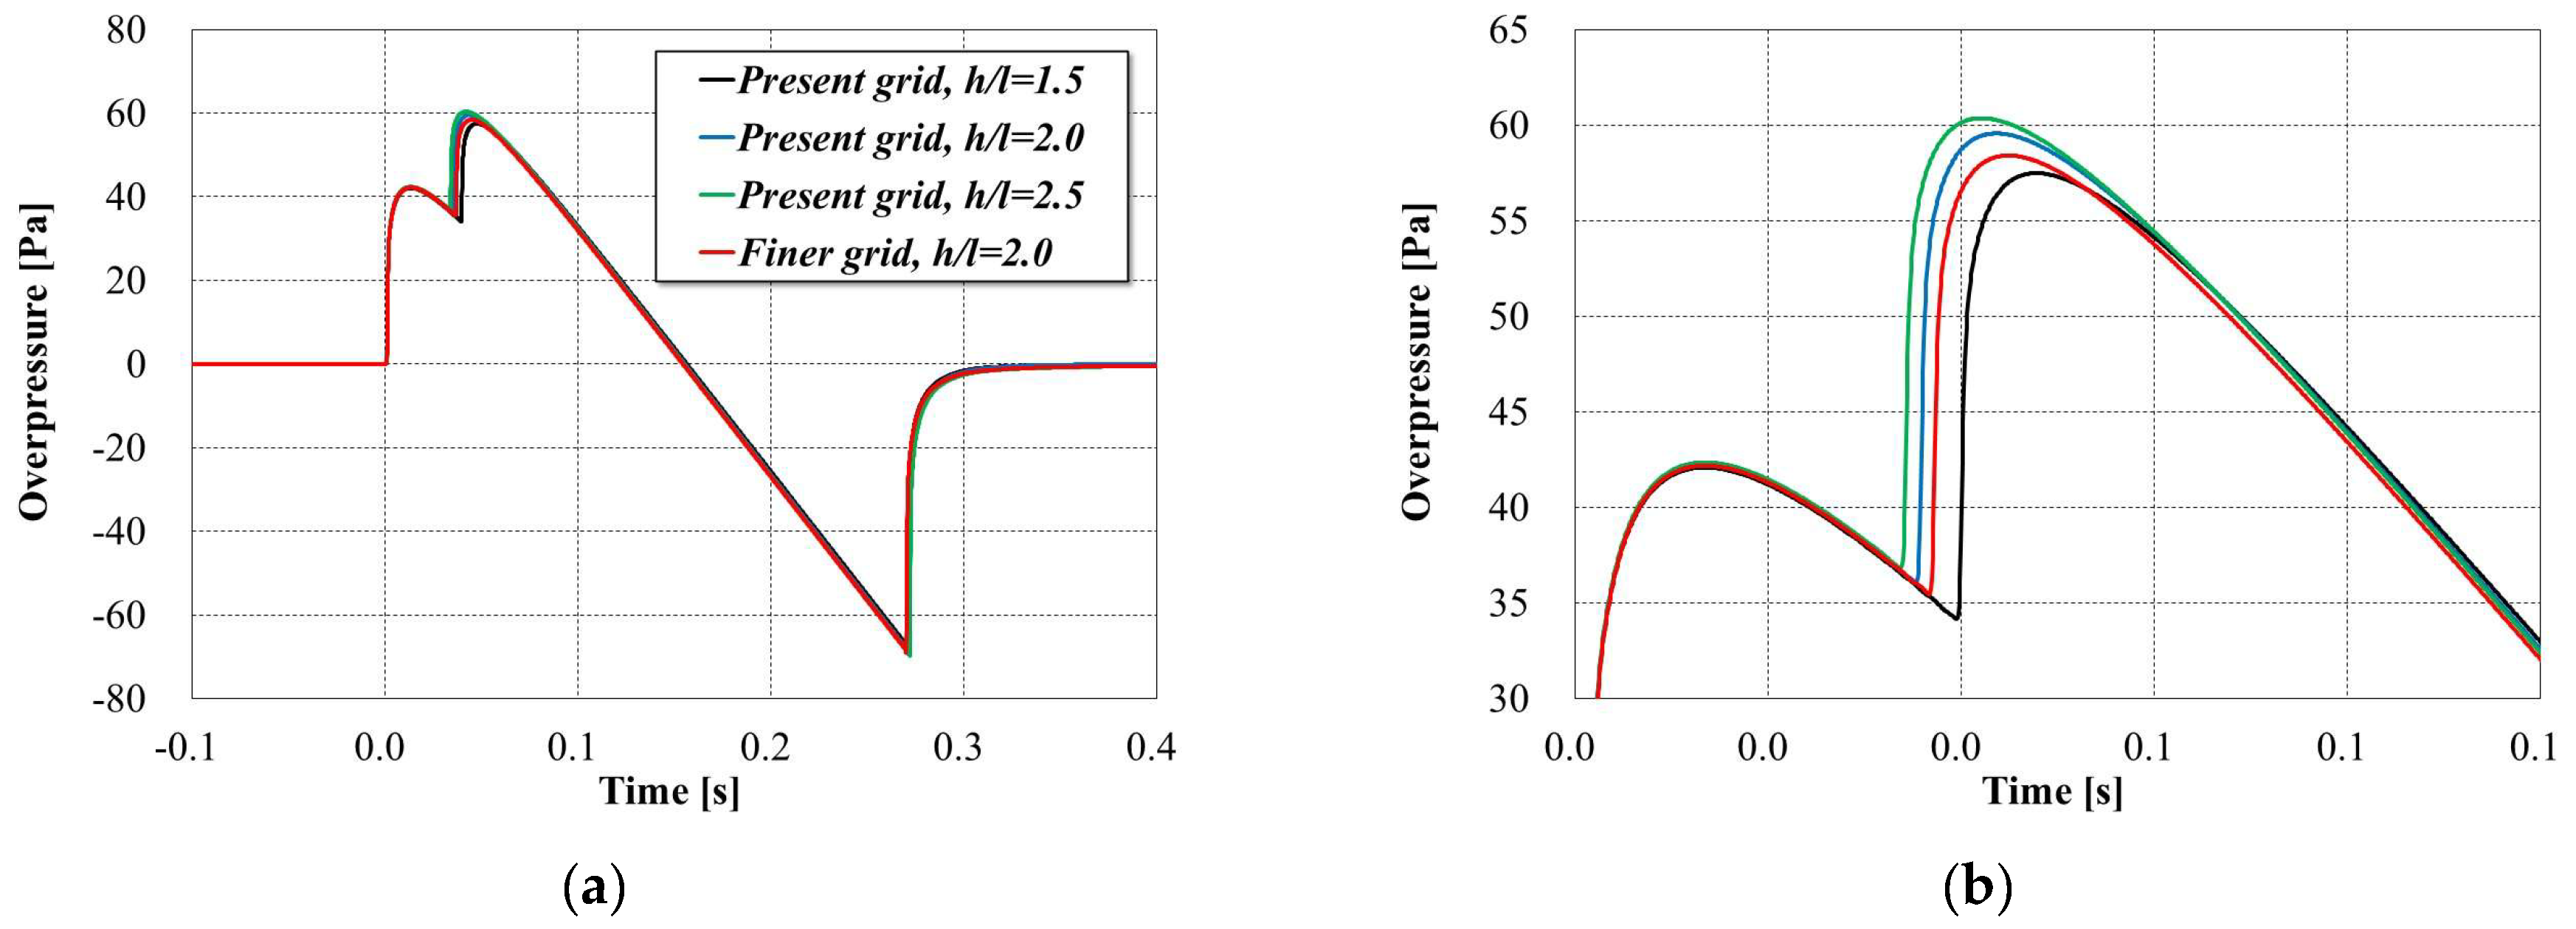
| Grid | CLp | CDp | CDf | CD | L/D | Pmax [Pa] | ASEL [dB] |
|---|---|---|---|---|---|---|---|
| Present | 0.1139 | 0.0145 | 0.0150 | 0.0295 | 3.867 | 59.6 | 84.9 |
| Finer | 0.1168 | 0.0151 | 0.0150 | 0.0301 | 3.880 | 58.4 | 84.8 |
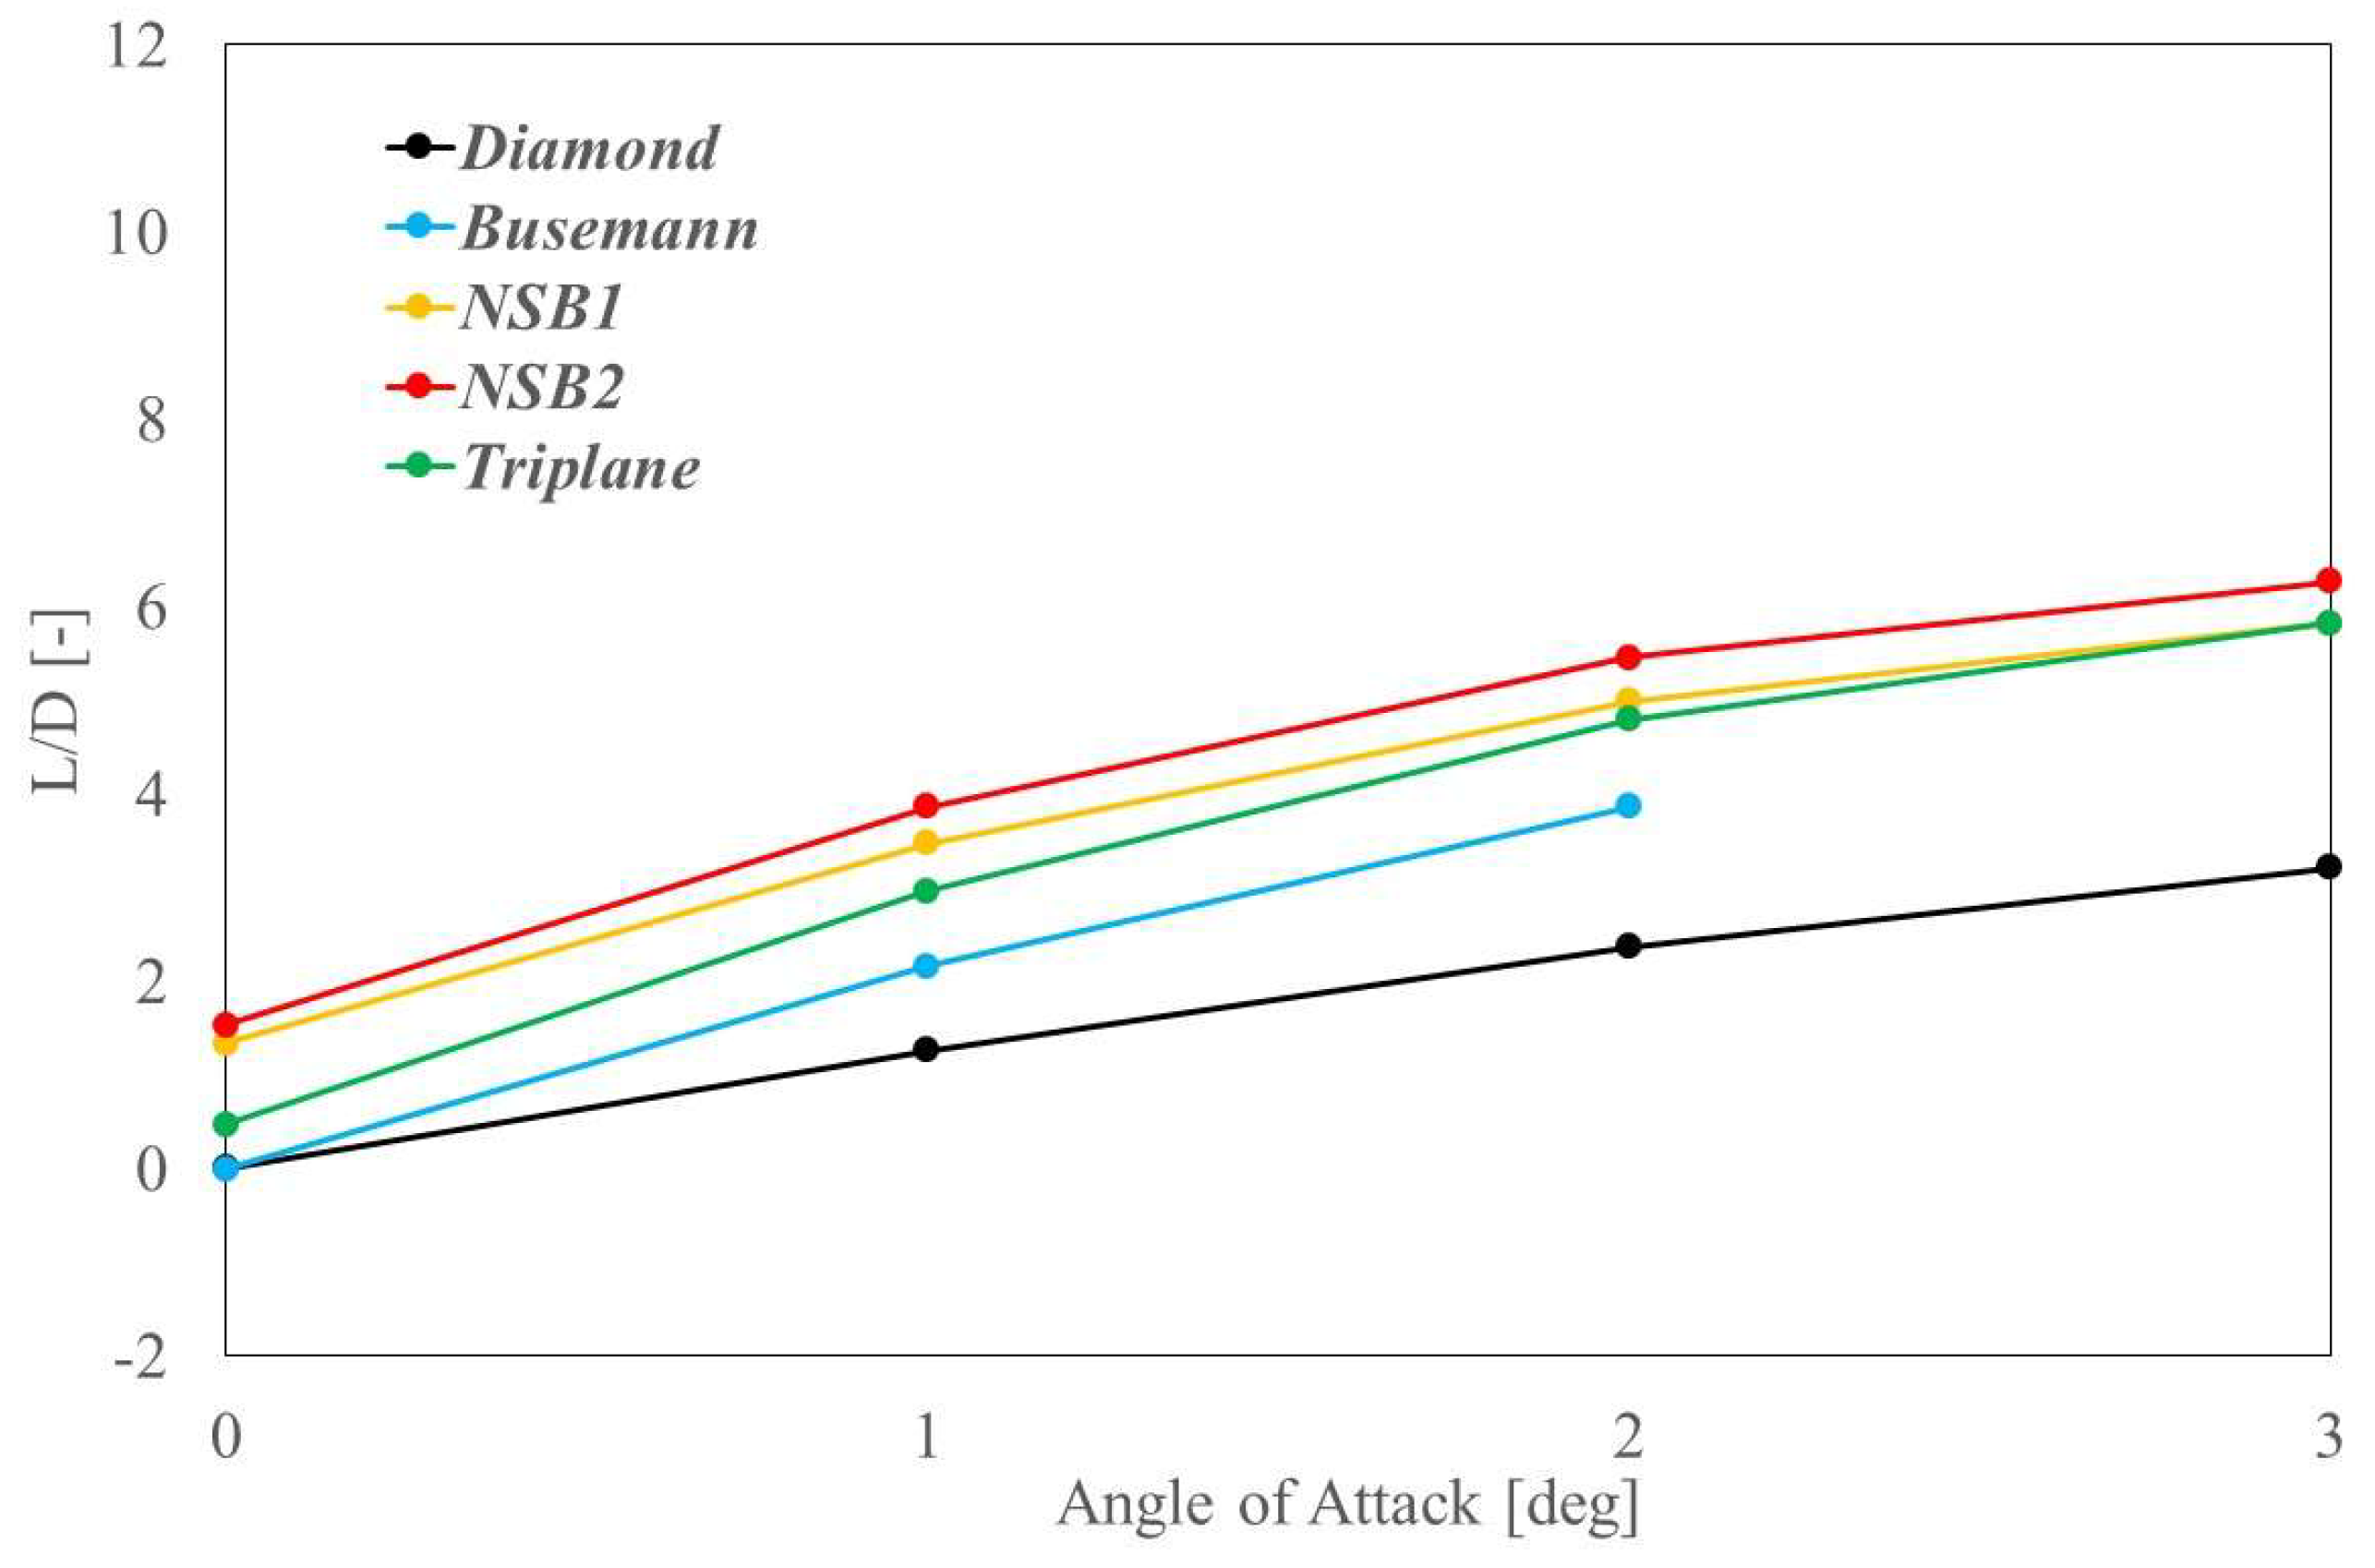
| CLp | CDp | CDf | CD | L/D | |
|---|---|---|---|---|---|
| Diamond | 0.0992 | 0.0317 | 0.0058 | 0.0375 | 2.646 |
| Busemann | 0.1087 | 0.0070 | 0.0117 | 0.0187 | 5.821 |
| NSB1 | 0.1227 | 0.0079 | 0.0092 | 0.0171 | 7.190 |
| NSB2 | 0.1594 | 0.0103 | 0.0114 | 0.0217 | 7.349 |
| Triplane | 0.1634 | 0.0091 | 0.0159 | 0.0250 | 6.547 |
| CLp | CDp | CDf | CD | L/D | Pmax [Pa] | ASEL [dB] | |
|---|---|---|---|---|---|---|---|
| Diamond | 0.1055 | 0.0353 | 0.0093 | 0.0446 | 2.368 | 86.2 | 89.5 |
| Busemann | 0.1139 | 0.0145 | 0.0150 | 0.0295 | 3.867 | 59.6 | 84.9 |
| NSB1 | 0.1406 | 0.0156 | 0.0126 | 0.0282 | 4.993 | 65.7 | 84.7 |
| NSB2 | 0.1804 | 0.0185 | 0.0146 | 0.0331 | 5.459 | 75.0 | 84.8 |
| Triplane | 0.1676 | 0.0162 | 0.0187 | 0.0349 | 4.800 | 73.2 | 85.1 |
Disclaimer/Publisher’s Note: The statements, opinions and data contained in all publications are solely those of the individual author(s) and contributor(s) and not of MDPI and/or the editor(s). MDPI and/or the editor(s) disclaim responsibility for any injury to people or property resulting from any ideas, methods, instructions or products referred to in the content. |
© 2025 by the authors. Licensee MDPI, Basel, Switzerland. This article is an open access article distributed under the terms and conditions of the Creative Commons Attribution (CC BY) license (https://creativecommons.org/licenses/by/4.0/).
Share and Cite
Yamazaki, W.; Ishida, S. Evaluation of Aerodynamic and Sonic Boom Performance of Supersonic Transport Aircrafts with Multiple Wing Configurations. Aerospace 2025, 12, 421. https://doi.org/10.3390/aerospace12050421
Yamazaki W, Ishida S. Evaluation of Aerodynamic and Sonic Boom Performance of Supersonic Transport Aircrafts with Multiple Wing Configurations. Aerospace. 2025; 12(5):421. https://doi.org/10.3390/aerospace12050421
Chicago/Turabian StyleYamazaki, Wataru, and Shu Ishida. 2025. "Evaluation of Aerodynamic and Sonic Boom Performance of Supersonic Transport Aircrafts with Multiple Wing Configurations" Aerospace 12, no. 5: 421. https://doi.org/10.3390/aerospace12050421
APA StyleYamazaki, W., & Ishida, S. (2025). Evaluation of Aerodynamic and Sonic Boom Performance of Supersonic Transport Aircrafts with Multiple Wing Configurations. Aerospace, 12(5), 421. https://doi.org/10.3390/aerospace12050421