Abstract
The load spectrum serves as the foundation for the life analysis of aero-engine turbine disks. To enhance the accuracy of life assessments for turbine disks, this study compiles a time-varying load spectrum for turbine disks. Firstly, a surrogate model for transient processes at the critical points of turbine disks is established, enabling the rapid evaluation of the transient temperature and thermal stress at these points under complex loading histories. Secondly, a performance degradation model is established based on real engine test data, explicitly describing the general trend of performance degradation characteristics with respect to the cycle number and engine power. Finally, a time-varying load spectrum for turbine disks is compiled, considering both short-term transient processes and long-term performance degradation. The life of turbine disks at the fir-tree slot root and disk bore is assessed using the Manson–Coffin equation, Wilshire equation, and linear damage accumulation rule. The results indicate that neglecting transient processes leads to conservative life assessment results while neglecting performance degradation leads to dangerous life assessment results. Compared with traditional methods, the time-varying load spectrum significantly improves the accuracy and scientific nature of turbine disk life assessment.
1. Introduction
Aero-engine turbine disks, as precision load-bearing components operating under severe thermal conditions and mechanical loads, are typical life-limiting parts in aero-engines [1,2]. The load spectrum is an essential basis for stress analysis and determination of the service life of aero-engine turbine disks and other components, which is explicitly stipulated in Chinese military standards [3,4] and U.S. military standards [5,6]. The compilation of a high-precision load spectrum is of great significance for the life assessment of aero-engine turbine disks.
The compilation methods for the load spectrum for aero-engines can be categorized into two types. The first type involves extracting flight maneuver parameters and load spectrum waveform parameters. Researchers such as Niu X [7] and Jin Y [8] adopted this approach to establish the relationship between load spectrum parameters and flight maneuvers, which can be applied to predict the load spectrum for newly developed aero-engines. The second type focuses on extracting load characteristic parameters based on different damage types, obtaining a frequency matrix of steady-state load parameters [9]. Researchers such as Song Y and Gao D [10,11] and Yang X [12] employed this method when compiling a comprehensive mission spectrum, while TURBISTAN [13] utilized it to develop a standard load spectrum, establishing the relationship between load characteristic parameters and damage. Xiao Y [14] and Wang C [15] compiled a turbine disk load spectrum based on fatigue-creep damage equivalence. The aforementioned compilation methods assume that the load spectrum remains steady over short-term periods and does not vary with time over long-term periods. However, in real service conditions, the load spectrum for turbine disks is typically a time-varying load spectrum. The load spectrum compilation methods that are independent of time can significantly affect the accuracy of turbine disk life assessments [16].
The time-varying characteristics of the load spectrum for aero-engine turbine disks mainly include two aspects. First, the transient temperature and thermal stress on turbine disks within a single takeoff and landing cycle cannot be ignored [9,17,18]. The magnitudes of the transient temperature and thermal stress are related to their duration [19]. The transient temperature and stress fields of turbine disks are widely calculated using the Finite Element Method (FEM). Wei J [20] established a two-dimensional transient heat transfer model for turbine disks based on the FEM. Qian W [21] identified the critical points of turbine disks and developed a reliability analysis model using a coupled fluid–thermal–solid approach. Yang F [22] performed a deformation analysis of turbine disks based on the FEM. Javiya U [23] implemented a coupled FE-CFD (Finite Element–Computational Fluid Dynamics) analysis of turbine disks. The Finite Element Method is also employed to achieve transient thermal control in the active thermal management of turbine disks [24,25,26,27,28]. However, the aforementioned methods involve complex boundary condition settings and require extensive computational time and resources for transient calculations under complex load histories, making it difficult to achieve a rapid assessment of transient processes in turbine disks under a time-varying load spectrum.
Second, the performance degradation of turbine components is unavoidable after multiple takeoff and landing cycles [29], and the service load on turbine disks gradually deviates from the design point over time. This degradation is attributed to the accumulation of deposits on gas path components and blade wear during long-term service, which leads to decreased efficiency, flow rate, and thrust in aero-engines, as well as an increased overall thermal load [30]. Currently, research on performance degradation can be categorized into three types [31]: component-level model-based methods [32,33,34], data-driven methods [35,36,37], and hybrid methods [38,39,40]. These studies primarily use the C-MAPSS dataset [41] as a training set to develop more accurate intelligent prediction models. However, few have investigated the impact of performance degradation on the load spectrum. There is also a lack of explicit mathematical expressions for the key load characteristics in the load spectrum as functions of the cycle number and power degradation. This deficiency, to some extent, affects the accuracy of turbine disk life assessment.
In summary, the organization of this paper is as follows: Section 2 presents the theoretical methodology for the life assessment of aero-engine turbine disks based on a time-varying load spectrum. Section 2.1 establishes a transient process surrogate model at the critical points of turbine disks, referring to the simulation results from the Finite Element Method (FEM) to describe short-term, time-varying characteristics. Section 2.2 establishes a performance degradation characteristic model based on the 750 h bench test data of a certain type of aero-engine to describe long-term, time-varying characteristics. Section 2.3 introduces the turbine disk life assessment method based on the Manson–Coffin equation, the Wilshire equation, and the Linear Damage Summation (LDS) rule. Section 3 applies the proposed methods in this paper to a certain type of aero-engine turbine disk. Section 3.1 fits the transient process surrogate model for the turbine disk based on the FEM results. Section 3.2 fits the performance degradation characteristic model based on the engine test data. Section 3.3 compiles the time-varying load spectrum for the turbine disk and conducts a life assessment. Section 4 summarizes the research content of this paper.
2. Methodology
2.1. Surrogate Model for Transient Processes in Turbine Disks
To avoid the complex boundary condition settings and long computation times associated with large-scale FEM calculations, it is necessary to establish a simplified surrogate mathematical model. During the life assessment of turbine disks, attention is often focused on the temperature and stress values at critical points. For hollow turbine disks, these critical points are typically located at the fir-tree slot root and the disk bore, where the former experiences the highest temperature and the latter experiences the maximum stress. Therefore, in this section, using the FEM simulation results as a reference, the temperature and stress at critical points are simplified as first-order linear systems. Surrogate models for the transient temperature and thermal stress at the critical points of turbine disks are established.
2.1.1. Transient Temperature at Critical Points
First, the three-dimensional turbine disk model is simplified to a hollow disk of uniform thickness. Under this assumption, the disk can be considered as a plane axisymmetric problem, where the temperature and stress are functions of the radius only. The transient heat conduction process in the hollow disk of uniform thickness can be expressed by the one-dimensional transient heat conduction differential equation in cylindrical coordinates [42], as shown in Equation (1):
where is the temperature at any point on the disk at any given time, which is the function of the radius and time ; is the thermal diffusivity; and is the internal heat source.
Equation (1) is a binary second-order linear partial differential equation in terms of temperature . The problem involves a type of Sturm–Liouville System, which can be solved analytically using the method of separation of variables and Bessel functions [43]. However, under complex load histories, it is difficult to obtain an analytical solution, as initial and boundary conditions need to be specified step-by-step. If the analysis is focused only on the critical points with a known radius, the transient processes at critical points can be simplified to a first-order linear system. The transient temperature at the fir-tree slot root can be expressed by Equation (2):
where is the time constant of the transient temperature at the fir-tree slot root, is the temperature at the fir-tree slot root at time , and is the steady-state temperature at the fir-tree slot root at time . The steady-state temperature at the fir-tree slot root is mapped to the turbine inlet temperature through finite element steady-state thermal analysis, as shown in Equation (3).
To rapidly solve the response of a first-order linear system under various input conditions, the transfer function method offers significant advantages. By performing Laplace transforms on each term in the differential equation, the transfer function for the transient temperature at the fir-tree slot root can be derived as follows:
Subsequently, the time-domain steady-state temperature input (3) is subjected to a Laplace transform. By leveraging the properties of the transfer function, algebraic operations are performed in the complex domain [44]. The inverse Laplace transform is then applied to the output to obtain the time-domain transient temperature solution (5). This method can conveniently be implemented in Simulink to obtain the dynamic response of the transient processes.
Assuming the disk bore is subject to the first type of thermal boundary condition, the transient temperature response at the disk bore is given by
2.1.2. Transient Thermal Stress at Critical Points
The transient thermal stress in the turbine disk is caused by a temperature gradient. For a hollow and uniform-thickness disk in cylindrical coordinates, the elastic mechanics solution [45] for the circumferential transient thermal stress can be derived as follows:
Given that both the fir-tree slot root and the disk bore are located on the surface of the turbine disks, it follows that . Consequently, the transient thermal stress in the hollow and uniform-thickness disk is equivalent to the transient circumferential thermal stress. By substituting and into Equation (7), the transient thermal stress at the fir-tree slot root and the disk bore can be derived respectively as follows:
Based on Equations (8) and (9), it can be observed that once the radius is determined, the transient thermal stress at the fir-tree slot root and the disk bore can also be simplified to first-order linear systems that vary only with time, which can be expressed as (10) and (11):
where and are the transient thermal stresses at the fir-tree slot root and the disk bore, respectively. and are the time constants of the transient thermal stress systems at the fir-tree slot root and the disk bore, respectively. and are the steady-state thermal stresses at the fir-tree slot root and the disk bore, respectively. The steady-state thermal stresses at these locations are mapped to the turbine inlet temperature through finite element steady-state thermal analysis, as shown in Equations (12) and (13).
The transfer functions for the transient thermal stress systems at the fir-tree slot root and the disk bore are given by the following equations:
By employing the same method used for transient temperature, the time-domain solution for transient thermal stress can be obtained as follows:
In addition to thermal stress, turbine disks are also subjected to centrifugal stress caused by high-speed rotation. Within the elastic range, centrifugal stress is proportional to the square of the rotational speed. Since the rotational inertia of the rotor is much smaller than the thermal inertia caused by temperature, the transient process of centrifugal stress can be neglected. Calculating centrifugal stress using steady-state rotational speed also yields a sufficiently accurate result, which can be derived as follows:
where and are the centrifugal stresses at the fir-tree slot root and the disk bore, corresponding to the maximum rotational speeds, respectively. is the time-varying rotational speed load spectrum, which is derived from the power spectrum based on the aero-engine model. The total stress at the critical points is the superposition of thermal stress caused by a temperature gradient and centrifugal stress caused by rotation. Since both the fir-tree slot root and the disk bore are located on the surface of turbine disks, the stress state at these critical points is uniaxial, with the stress direction being circumferential. Therefore, the transient thermal stress and centrifugal stress can be directly added in scalar form, that is,
2.2. Performance Degradation Characteristic Model
For the majority of two-spool engines, the high-pressure turbine (HPT) is the most critical life-limiting component. The rotational speed of the HPT and the inlet temperature of the HPT are key load characteristics that significantly influence the life of the HPT disks and blades. To enable the model to be directly applied for the correction of the time-varying load spectrum, this section selects the rotational speed variation in the HPT and the inlet temperature variation in the HPT as characteristic parameters of performance degradation. Based on the 750 h real bench engine test data of a certain type of turboshaft engine (the simplified gas-path schematic, as shown in Figure 1), the general trend in performance degradation characteristics, with respect to the cycle number and engine power, is explored and a performance degradation characteristic model is established.
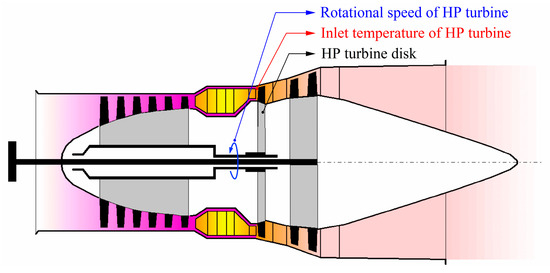
Figure 1.
Simplified gas-path schematic of a certain type of turboshaft engine.
The general trend in aero-engine performance degradation is shown in Figure 2. The horizontal axis represents the engine test cycles, while the vertical axis represents the degradation characteristics or . Each point in this figure corresponds to the same engine power. Performance degradation consists of recoverable and irrecoverable degradation. Recoverable degradation is caused by blade fouling, which leads to a decrease in component efficiency and flow coefficient, resulting in an increase in the rotational speed of the HPT and the inlet temperature of the HPT . This type of degradation accounts for 70% to 85% of the total performance loss [46]. After engine washing, this portion of performance loss can be fully recovered. Irrecoverable degradation is caused by factors such as blade wear, erosion, corrosion, and increased tip clearance, leading to an irreversible increase in the rotational speed of the HPT and the inlet temperature of the HPT . In Figure 2, the magenta line represents irrecoverable degradation, which monotonically increases with the engine test cycles. The blue line represents the total performance degradation, which increases approximately linearly within a wash period. After engine washing, most of the degradation characteristics are recovered. When the power level changes, the degradation characteristic parameters and also increase with the engine power.
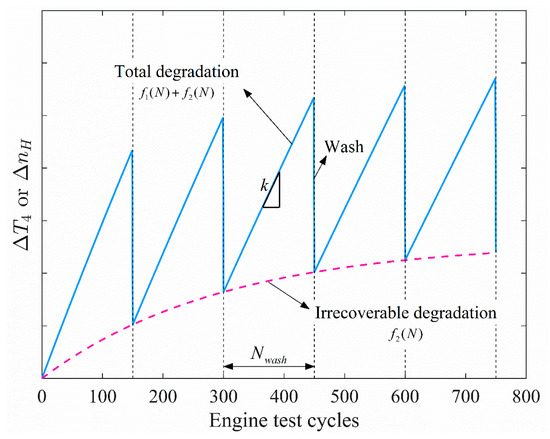
Figure 2.
The general trend in aero-engine performance degradation.
Based on the general trend in performance degradation described above, the following performance degradation characteristic model is proposed:
The left-hand side of the equation represents the performance degradation characteristic parameters and , which are functions of the power and engine test cycles . and , respectively, represent the recoverable degradation functions of and . represents the modulo operation. represents the wash period. and , respectively, represent the rates of increase in and in a wash period. represents the maximum engine power. and , respectively, represent the irrecoverable degradation functions of and .
The interesting aspect of this model is that the use of the modulo operation effectively describes the periodic nature of recoverable degradation, where the degradation characteristic increases within a period and is reset to zero after the wash. It is assumed that the degradation characteristic parameters at different power levels are proportional to the power. Therefore, it is only necessary to fit the degradation characteristics at maximum power to obtain and . For other power levels, the degradation characteristics can be directly obtained proportionally based on the power level. The irrecoverable degradation functions are obtained by fitting the minimum values in each wash period.
2.3. Life Assessment of Turbine Disks
The typical failure mode of aero-engine turbine disks is a creep-fatigue failure. The creep-fatigue life prediction method under the LDS framework is characterized by strong load generalization and broad material applicability, making it highly effective for the life prediction of turbine disks under complex service loads. Within the LDS framework, the TF model [47], the DE model [48], and the modified SEDE models from Takahashi et al. [49] and Wang et al. (W-SEDE) [50] are life prediction methods based on stress, strain, and strain energy density, respectively. Since the time-varying load spectrum proposed in this study is essentially a stress spectrum, the TF model is the most suitable approach.
The creep-fatigue life is expressed as follows:
where represents the creep-fatigue life, calculated in terms of engine test cycles, represents the critical damage, determined based on specific materials and structures, represents the fatigue damage within one engine test cycle, and represents the creep damage within one engine test cycle. According to Miner’s rule, is derived as follows:
where represents the number of the th cycle after rainflow counting within one engine test cycle, and represents the constant amplitude fatigue life of the th cycle. The fatigue life is calculated using the Manson–Coffin equation, as follows:
where represents the fatigue strength coefficient, represents the fatigue ductility coefficient, represents the fatigue strength exponent, and represents the fatigue ductility exponent. Through rainflow counting for one engine test cycle, the mean of stress and the amplitude of stress can be obtained. Substitute into the cyclic stress-strain curve and can be obtained, as follows:
where represents Young’s modulus, and and represent cyclic strength coefficient and cyclic strain hardening exponent, respectively. Using the TF method, can be expressed as follows:
where represents the creep rupture life corresponding to the stress and temperature at the time . It can be obtained through the research previously conducted by our team [51], which includes the Wilshire equation considering the TTC relationship, as shown in Equation (29):
where represents the creep threshold stress, represents the ultimate strength, represents the apparent activation energy, represents the universal gas constant, and and are material constants.
3. Results and Discussion
3.1. Fitting of the Surrogate Model for Transient Processes Based on the FEM Simulation Results
The FEM model of the HPT disk and blade of a certain type of turboshaft engine is shown in Figure 3. The turbine disk is hollow, and the blade material is the single-crystal superalloy DD6, while the turbine disk material is the nickel-based superalloy GH4169. The following contact conditions, force boundary conditions, and thermal boundary conditions are applied to the geometric structure [52]: the temperature boundary condition is applied on the blade surfaces; the frictional constraint is applied on the surfaces of the tenon and slot; the forced convection boundary condition is applied to simulate contact thermal resistance, with the convective heat transfer coefficient taken as and the airflow temperature at 250 °C; the natural convection boundary condition is applied on the disk surface, with the convective heat transfer coefficient taken as and the airflow temperature at 250 °C; and a constant temperature boundary condition is applied at the disk bore, with a temperature of 400 °C. Axial and circumferential displacement boundary conditions are applied at the mounting surface A. The input to the entire turbine disk heat transfer system is the temperature spectrum of the blade, which is derived from the power spectrum, based on the component-level model of the turboshaft engine.
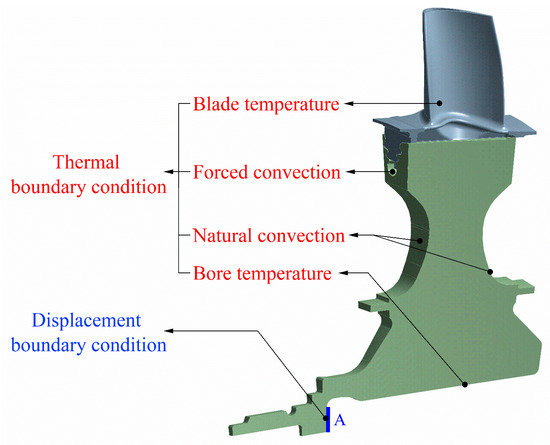
Figure 3.
The FEM model and boundary condition settings of the HPT disk for a certain type of turboshaft engine.
To accurately obtain the time constants , , and , a typical step process was designed in which the engine accelerates from an idle to a maximum state. During this process, the turbine disk experiences the maximum thermal stress, making the computational results the most representative. The initial temperature of the blade surface is , with a step magnitude of . The FEM simulation response was used to fit the three time constants mentioned above. Under this step input, the transient temperature response contour of the turbine disk in 1000 s is shown in Figure 4. It can be observed that the temperature at the fir-tree slot root rises rapidly within the first 50 s. As heat continuously transfers towards the disk bore, the temperature of the entire disk gradually increases and reaches a steady state by 1000 s, forming a stable temperature gradient. Since the temperature increase at the disk bore is extremely slow due to its large thermal inertia, the disk bore is not sensitive to the type of thermal boundary condition. Therefore, setting the disk bore as an isothermal boundary condition in this study will not introduce significant errors and represents a reasonable simplification.
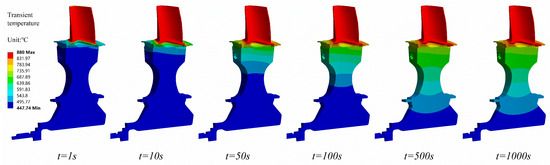
Figure 4.
Transient temperature response contours of the turbine disk under the step input.
Figure 5 shows the transient temperature and thermal stress responses at the fir-tree slot root at t = 1000 s. The temperature at the fir-tree slot root is approximately 650 °C. The thermal stress at this location manifests as compressive stress, which is consistent with the solutions from thermo-elasticity theory, with the minimum value being −579.69 MPa. Both the temperature and stress are distributed relatively uniformly along the axial direction. Figure 6 shows the transient thermal stress at the disk bore at t = 1000 s. The thermal stress at the disk bore manifests as tensile stress, with higher thermal stress values in the interior of the disk compared to the disk surface, reaching a maximum of 326 MPa.
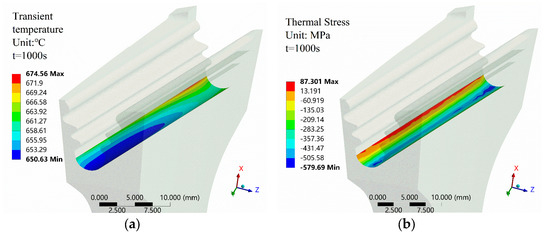
Figure 5.
Transient responses at the fir-tree slot root at t = 1000 s. (a) The transient temperature. (b) The transient thermal stress.
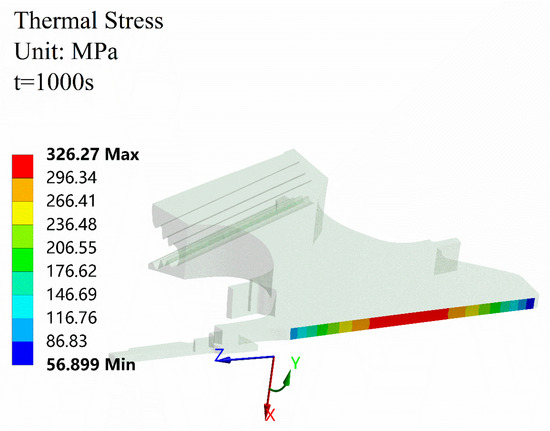
Figure 6.
Transient response of the thermal stress at the disk bore at t = 1000 s.
The mapping relationships between the three steady-state inputs, , and the blade surface temperature input , obtained through FEM steady-state simulations, are explicitly expressed as follows:
Substitute and into (30)–(32), and the transient step responses of the three systems are obtained using the transfer function method, as follows:
The FEM transient response results for the average temperature at the fir-tree slot root, the minimum stress at the fir-tree slot root, and the maximum stress at the disk bore within 1000 s were extracted. The time constants , , and were fitted using the least squares method, as shown in Figure 7. It can be observed that Equations (33)–(35), derived from the proposed model, can fit the FEM simulation data very well, with relative root-mean-square errors (RRMSEs) of 1.03%, 4.32%, and 2.09%, respectively, with all less than 5%. This demonstrates the rationality and accuracy of the model proposed in this study. The transfer functions of the three first-order linear systems are listed in Table 1.
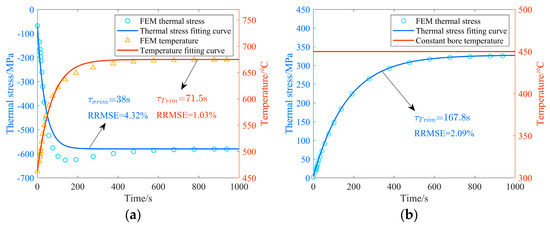
Figure 7.
Fitting of the surrogate model for the transient temperature and the thermal stress at the critical points under step input. (a) At the fir-tree slot root. (b) At the disk bore.

Table 1.
Parameters of the surrogate model for the transient processes at the critical points.
To further validate the applicability of the surrogate model for transient processes under load spectrum inputs, simulations were conducted using both the FEM and the surrogate model. The input load spectrum will be detailed in Section 3.2. The comparison of the simulation results is shown in Figure 8 and Figure 9. In the figures, the dashed lines represent the time-invariant load spectrum inputs, while the solid lines correspond to the responses from the FEM and the proposed model. It can be observed that the surrogate model closely aligns with the FEM results, with RRMSEs of 0.69%, 3.74%, and 2.25%, respectively, as listed in Table 1. Therefore, the surrogate model can fully replace the FEM model for the transient temperature and thermal stress calculations at critical points, thereby avoiding the complex boundary condition settings and long computation times associated with large-scale FEM calculations. This substitution enhances the efficiency of life assessments under load spectrum inputs.
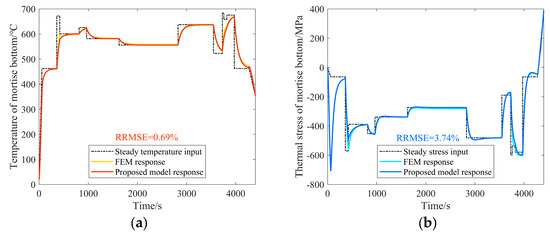
Figure 8.
Comparison of transient responses at the fir-tree slot root under the load spectrum input. (a) The transient temperature. (b) The transient thermal stress.
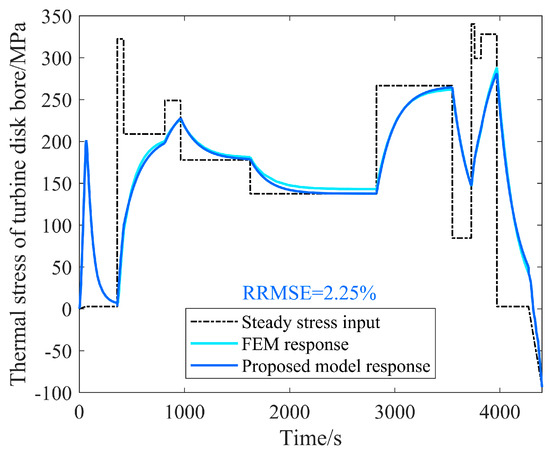
Figure 9.
Comparison of transient responses at the disk bore under the load spectrum input.
3.2. Fitting of the Performance Degradation Characteristic Model
The bench test power spectrum of a certain type of turboshaft engine is shown in Figure 10. This load spectrum reflects the typical usage characteristics of turboshaft engines, including start-up, idle, and ten simulated mission test stages, with the cumulative time of the ten test stages amounting to 60 min. Figure 10a shows the power spectrum, which is typically controlled by the helicopter’s collective pitch lever and determines the engine’s operating state. Figure 10b shows the rotational speed spectrum and temperature spectrum under the standard engine conditions, which are derived from the power spectrum through the engine component-level model.
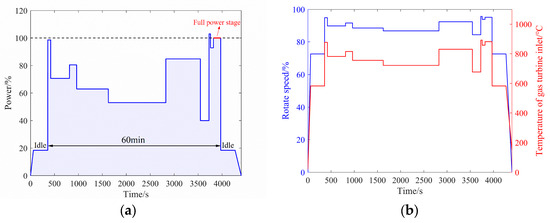
Figure 10.
The bench test spectrum of a certain type of turboshaft engine. (a) The power spectrum. (b) The rotational and temperature spectrum.
First, a model for the recoverable degradation characteristics within a wash period is fitted. In Figure 10a, the last test stage corresponds to the full power level (P = 100%). The rotational speed and temperature at this power level for each engine test cycle are extracted, and the corresponding values for a standard engine under the same power level are subtracted to obtain the degradation characteristic parameters and . The wash period of this engine is . To determine the slopes and of the recoverable degradation trend line within each wash period, the data points from each wash period are shifted to align with the first wash period, ensuring that the degradation at the starting time is approximately zero, as shown in Figure 11. Linear regression is performed on all and data points, under the full power level, to obtain and , with RRMSEs of 0.53% and 0.22%, respectively. The data points mostly fall within a two-error scatter band. This indicates that the recoverable degradation portion of the engine exhibits similar trends across different wash periods and can be described by a linear relationship with the same slope.
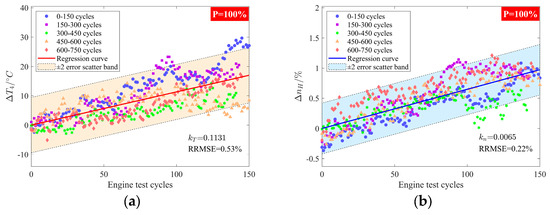
Figure 11.
Variation trend and linear regression of all the performance degradation characteristic data points shifted to the first wash period under the full power level. (a) The variation in with the cycles. (b) The variation in with the cycles.
Second, a model for the irrecoverable performance degradation characteristics for all wash periods is fitted. The distribution of performance degradation characteristics under the full power level for all the test cycles is shown in Figure 12. The average value of the first five points in each wash period is used as the initial value of degradation characteristics within that period. Different functions are employed to fit the initial values of degradation characteristics for all the wash periods. It is found that the initial value of is well-represented by an exponential function (as indicated by the magenta dashed line in Figure 12a), while the initial value of exhibits minimal variation with increasing test cycles (as indicated by the magenta dashed line in Figure 12b). Therefore, the expressions for the irrecoverable degradation characteristics can be written as follows:
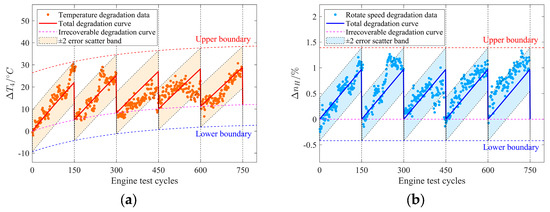
Figure 12.
Variation trend and model fitting of the performance degradation characteristic parameters across all the test cycles under the full power level. (a) The variation in with the cycles. (b) The variation in with the cycles.
After superimposing the recoverable and irrecoverable degradation, the mathematical model for the performance degradation characteristics can be expressed as follows:
By shifting the irrecoverable degradation trend line by two standard deviations in both the positive and negative directions, the upper and lower bounds of the degradation data distribution can be obtained (as indicated by the red and blue dashed lines in Figure 12). It can be observed that the temperature difference between the lower and upper bounds can reach up to 40 °C, while the rotational speed difference between the upper and lower bounds is approximately 1.7%. Considering the quadratic relationship between stress and rotational speed, the difference becomes even more significant. If the time-varying nature of the rotational speed and temperature is not considered, and the life assessment is based solely on the performance parameters of a standard engine, significant errors can occur. These errors often lead to life assessment results that are more hazardous.
3.3. Compilation of Time-Varying Load Spectrum and Life Assessment of Turbine Disks
The time-varying characteristics of the turbine disk load spectrum include short-term and long-term time-varying characteristics. Short-term time-varying characteristics refer to the transient processes within a single takeoff and landing cycle, while long-term time-varying features refer to the performance degradation characteristics over multiple takeoff and landing cycles. Based on the load spectrum under standard engine conditions, the time-varying load spectrum is compiled by considering the effects of both short-term and long-term time-varying characteristics.
3.3.1. Short-Term Time-Varying Characteristics
Firstly, within a single takeoff and landing cycle, the transient temperature and total stress responses at the fir-tree slot root and disk bore of the turbine disk under the bench test load spectrum are simulated using the transient process surrogate model, as shown in Figure 13 and Figure 14.
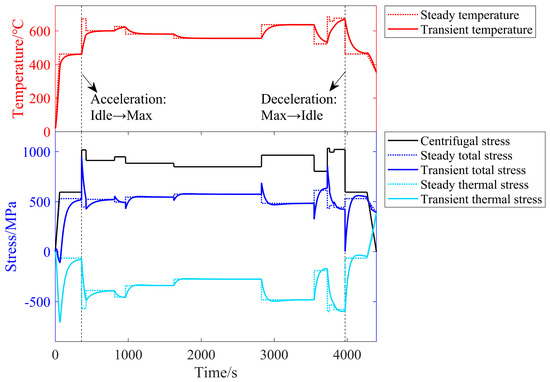
Figure 13.
Transient thermal responses at the fir-tree slot root.
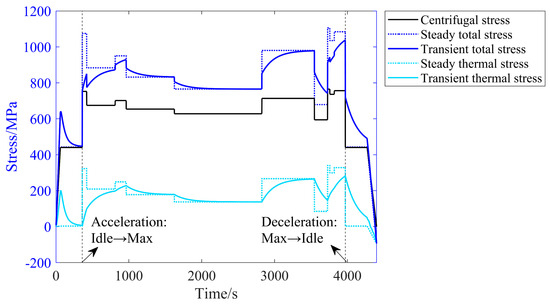
Figure 14.
Transient thermal responses at the disk bore.
Since the thermal stress at the fir-tree slot root manifests as compressive stress, while that at the disk bore manifests as tensile stress, the total stress at the fir-tree slot root is generally less than the centrifugal stress for most of the time except during the shutdown process, whereas the total stress at the disk bore is greater than the centrifugal stress. The variation in thermal stress and centrifugal stress at the fir-tree slot root is opposite, while it is the same at the disk bore. This leads to the following behavior during the idle → maximum rapid acceleration process. The total stress at the fir-tree slot root initially increases rapidly with the centrifugal stress. As heat continuously transfers from the blades to the disk, the temperature gradually rises, the temperature gradient increases, and the absolute value of the thermal stress grows, causing the total stress to gradually decrease towards the steady-state total stress. During the maximum → idle rapid deceleration process, the total stress at the fir-tree slot root initially decreases rapidly with the centrifugal stress. As heat from the blades diminishes and the temperature drops, the absolute value of the thermal stress decreases, and the total stress gradually increases towards the steady-state total stress. The variation pattern in the total stress at the disk bore is the opposite of that at the fir-tree slot root during these two processes. This pattern is observed in all acceleration and deceleration processes, with more significant transient effects occurring over larger state change ranges.
Additionally, during engine cold start, the thermal stress at the fir-tree slot root manifests as significant compressive stress, which largely cancels out with the centrifugal stress, resulting in a total stress of approximately zero, while the thermal stress at the disk bore is tensile and adds to the centrifugal stress, creating an additional stress cycle. During engine shutdown, the faster cooling rate at the rim compared to the disk bore generates a reverse temperature gradient, which is the cause of the tensile thermal stress at the fir-tree slot root and the compressive thermal stress at the disk bore.
The above analysis indicates that the thermal stress in the turbine disk is considerable, amounting to approximately 30% to 40% of the centrifugal stress. Relying solely on centrifugal stress to represent the stress at the critical points of the turbine disk may introduce significant errors. Additionally, due to the presence of thermal inertia, steady-state stress tends to overestimate stress during acceleration and underestimate stress during deceleration, particularly in high-maneuverability mission profiles. Furthermore, the existence of transient processes means that the stress cycles at the fir-tree slot root do not correspond one-to-one with rotational speed cycles, potentially generating additional cycles. The number and peak/valley values of these cycles need to be determined through rainflow counting of the stress profile, considering transient processes. In contrast, the stress cycles at the disk bore essentially correspond to rotational speed cycles, with transient processes only affecting the magnitude of the peak and valley values.
3.3.2. Long-Term Time-Varying Characteristics
Secondly, after multiple takeoff and landing cycles, the high-pressure spool speed and turbine inlet temperature are higher than those of a standard engine due to performance degradation. Considering that the time between overhauls (TBOs) for this turboshaft engine is 1800 h, the variation in the load spectrum after three overhaul periods (5400 h) is shown in Figure 15.
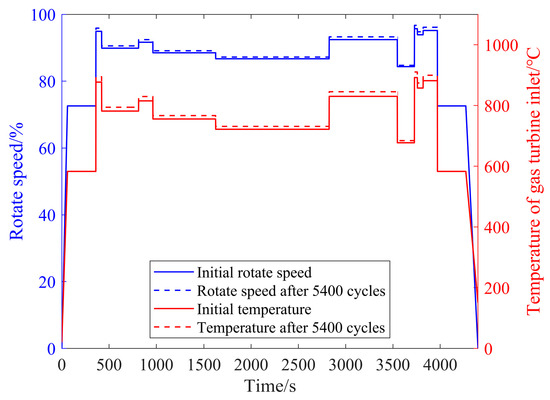
Figure 15.
Bench test rotational speed spectrum and temperature spectrum before and after 5400 cycles of degradation.
Based on the load spectrum in the bench test, after the performance degradation described above, the transient temperature and stress spectra at the fir-tree slot root and disk bore after 5400 h of performance degradation were solved using the transient process surrogate model, as shown in Figure 16. A comparison reveals that after 5400 h, the temperature at the fir-tree slot root has increased by approximately 10 °C, while the total stress has decreased by about 10 MPa. This is because, although the centrifugal stress has increased due to degradation, the rise in temperature has led to an increase in the absolute value of the thermal stress. The net effect, after mutual cancellation, is a reduction in the total stress. In contrast, the stress at the disk bore has increased by about 20 MPa. This is because both the centrifugal stress and thermal stress at the disk bore have increased due to degradation, and since both are tensile stresses, their combined effect results in an increase in the total stress. Although the numerical changes in the temperature and stress after degradation are not large, these changes alter the load levels at any given moment across the entire load spectrum. Over time, these accumulated changes can produce considerable damage and have a non-negligible impact on life.
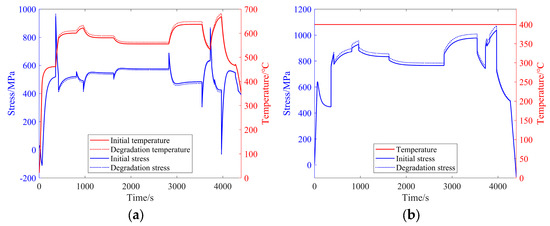
Figure 16.
Comparison of transient temperature and stress spectrum at critical points before and after performance degradation. (a) At fir-tree slot root. (b) At disk bore.
3.3.3. Life Assessment
This study takes GH4169, a typical turbine disk material, as an example to evaluate the service life of the turbine disk. The fatigue life model for GH4169 is based on the Manson–Coffin equation (Equation (26)), with the model parameters shown in Table 2. The creep life model employs the Wilshire equation considering the Time–Temperature–Creep (TTC) relationship (Equation (29)), with the model parameters shown in Table 3.
Table 2.
Parameters of Masson–Coffin equation for GH4169 (550 °C).
Table 3.
Parameters of Wilshire equation considering TTC relationship of GH4169.
The service life corresponding to three different load spectra was assessed: the time-invariant load spectrum without considering transient processes and performance degradation (dashed lines in Figure 13 and Figure 14), the time-varying load spectrum considering only transient processes (solid lines in Figure 13 and Figure 14), and the time-varying load spectrum considering both transient processes and performance degradation (dashed line in Figure 16). These three load spectra are, respectively, named Spectrum A, Spectrum B, and Spectrum C, as shown in Table 4.
Table 4.
The differences in the time-varying characteristics of the load spectra A, B, and C.
Spectrum C is theoretically the closest to the actual service environment of the turbine disk. Based on the field service experience of engines, the probability of crack initiation at the fir-tree slot root is higher than at the disk bore. Therefore, the damage at the fir-tree slot root under Spectrum C, when the number of cycles reaches 5400, is defined as the critical damage , which is evaluated as . According to , the lives of other load spectra and other critical points under the same critical damage condition were determined. The cumulative damage curves for the three load spectra and the two critical points are shown in Figure 17.
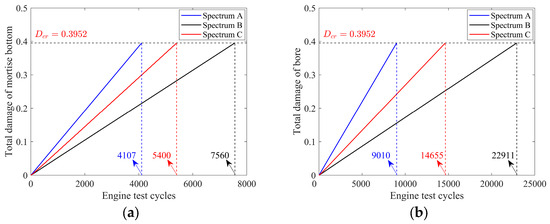
Figure 17.
Comparison of the cumulative damage curves at the critical points of the turbine disk under the three different load spectra. (a) At the fir-tree slot root. (b) At the disk bore.
It can be observed that, whether at the fir-tree slot root or the disk bore, the impact of transient processes and performance degradation on the life of aero-engine turbine disks follows the same pattern. Taking the life under Spectrum C as the benchmark, the life assessment results under Spectrum A are overly conservative, while those under Spectrum B are overly hazardous. This indicates that compiling the load spectrum based on steady-state parameters without considering performance degradation always overestimates the loads endured by the structure and underestimates its service life. Additionally, compiling the load spectrum considering only transient processes overestimates the structure’s service life because it fails to account for the increased loads resulting from performance degradation. The damage curves reveal that the damage curves under all three load spectra are approximately linear due to the LDS assessment method. Although the performance degradation characteristic model exhibits some non-linear behavior, its periodic nature ensures that the damage curve under Spectrum C remains approximately linear.
A comparison of the life assessment results at the fir-tree slot root and the disk bore shows that the life at the fir-tree slot root is shorter than that at the disk bore. The fatigue and creep damage at these two locations is further calculated. The minimum duration for the creep damage assessment is 1 s, with damage calculated based on the stress and temperature values at every second. For the fatigue damage assessment, cycle counting is first performed using the rainflow counting method, followed by damage calculations for each cycle. The total damage is computed using the (LDS) rule. The assessment results are shown in Table 5.
Table 5.
Comparison of the damage and life of the critical points of the turbine disk under the three load spectra.
The assessment results indicate that at the fir-tree slot root, creep damage accounts for more than 50% of the total damage. The different load spectra lead to varying proportions of creep damage, especially for Spectrum A, where creep damage accounts for 100%. This is inconsistent with the engine structural design concept and real damage conditions, indicating significant errors in the time-invariant load spectrum. Spectrum C has a higher proportion of creep damage than Spectrum B, which is attributed to temperature increases caused by performance degradation while stress levels remain relatively unchanged. The creep damage is more sensitive to temperature than the fatigue damage. At the disk bore, the creep damage is nearly zero because the temperature is set at 400 °C, a temperature at which nickel-based superalloys exhibit negligible creep damage. Therefore, the life at the disk bore is primarily determined by the stress levels. Spectrum A, which does not account for the significant thermal inertia at the disk bore, overestimates the stress levels, leading to a shorter life. In contrast, Spectrum B, which does not consider the increased temperature gradients due to performance degradation, underestimates the stress levels, leading to a longer life.
4. Conclusions
This study introduces a method for the life assessment of aero-engine turbine disks based on a time-varying load spectrum. Transient processes and performance degradation represent the short-term and long-term time-varying characteristics of the load spectrum, respectively. A high-precision time-varying load spectrum for turbine disks is compiled and compared with the time-invariant load spectrum to investigate the effects of different time-varying factors on life assessment. The following conclusions can be drawn from this research:
(1) A surrogate model for transient processes at the critical points of turbine disks is established. The transient temperature and thermal stress at the critical points are simplified as first-order linear systems, and the transient responses are solved using the transfer function method. The results indicate that the RRMSE between the surrogate model and the FEM model is less than 5%. This model can fully replace the FEM model for the rapid assessment of transient temperature and thermal stress under complex loading histories.
(2) A performance degradation characteristic model is established. The rotational speed variation of the HPT and the inlet temperature variation of the HPT are selected as the characteristic parameters of performance degradation. The results indicate that the model can effectively fit the 750 h bench engine test data with wash periods, with a fitting RRMSE of less than 1%. Since the degradation parameters are directly related to temperature and stress, this model can be directly used for the compilation of the time-varying load spectrum.
(3) The time-varying load spectrum for the turbine disks is compiled, considering transient processes as short-term time-varying factors and performance degradation as long-term time-varying factors. The life of turbine disks at the fir-tree slot root and disk bore is assessed using the Manson–Coffin equation, Wilshire equation, and LDS rule. Comparisons are made among the life assessment results using the time-invariant load spectrum that does not consider transient processes and performance degradation, the time-varying load spectrum that considers only transient processes, and the time-varying load spectrum that considers both transient processes and performance degradation. The results indicate that, whether at the fir-tree slot root or the disk bore, neglecting transient processes leads to conservative life assessment results, while neglecting performance degradation leads to hazardous life assessment results. Compared with traditional methods, the time-varying load spectrum significantly improves the accuracy and scientific nature of turbine disk life assessment.
Author Contributions
Conceptualization, S.Y. and X.N.; data curation, Z.S.; formal analysis, S.Y. and X.N.; investigation, S.Y.; methodology, S.Y.; project administration, Z.S. and Y.S.; resources, Z.S. and Y.S.; software, S.Y.; supervision, Z.S. and Y.S.; validation, X.N.; visualization, S.Y.; writing—original draft, S.Y.; writing—review and editing, X.N. All authors have read and agreed to the published version of the manuscript.
Funding
This research was funded by the National Major Science and Technology Project of China (Grant No. J2019-V-0009-0103) and the National Natural Science Foundation of China (Grant No. 52205162).
Data Availability Statement
The original contributions presented in this study are included in the article. Further inquiries can be directed to the corresponding author.
Conflicts of Interest
The authors declare no conflicts of interest.
References
- Song, L.; Bai, G.; Fei, C. Probabilistic LCF life assessment for turbine discs with DC strategy-based wavelet neural network regression. Int. J. Fatigue 2019, 119, 204–219. [Google Scholar] [CrossRef]
- Mu, Y.; Lu, S. Reliability prediction on creep rupture and LCF life for a turbine disk. Gas Turbine Exp. Res. 2015, 28, 13–18. [Google Scholar] [CrossRef]
- GJB241A-2010; Engine, Aircraft, Turbojet and Turbofan General Specification for. Equipment Development Department of Central Military Commission of the People’s Republic of China: Beijing, China, 2010.
- GJB/Z101-97; Engine Structural Integrity Guidance. Equipment Development Department of Central Military Commission of the People’s Republic of China: Beijing, China, 1997.
- MIL-E-5007; Engine, Aircraft, Turbojet and Turbofan General Specification for. US-NAVY, The Pentagon: Arlington County, VA, USA, 1973.
- MIL-STD-1783; Engine Structural Integrity Program (ENSIP). US-NAVY, The Pentagon: Arlington County, VA, USA, 1984.
- Niu, X.; Lu, Q.; Sun, Z.; Song, Y. A novel compilation method of comprehensive mission spectrum of aero-engine maneuvering load based on use-related mission segment. Chin. J. Aeronaut. 2023, 36, 161–170. [Google Scholar] [CrossRef]
- Jin, Y.; Sun, Z.; Song, Y.; Lin, X.; Niu, X.; Ding, J. Mission segment division of the whole aeroengine loading spectrum based on flight actions. Chin. J. Aeronaut. 2022, 35, 164–174. [Google Scholar] [CrossRef]
- Su, Q. Guidelines for Determining the Lifespan of Major Components of Aviation Turbojet and Turbofan Engines; Aviation Industrial Publishing Company: Beijing, China, 2004; pp. 24–28, 49–59. ISBN 7-80183-356-2. [Google Scholar]
- Song, Y.; Gao, D. Turbine engine composite route flight loading spectrum derivation. J. Propuls. Technol. 2000, 21, 54–56. [Google Scholar] [CrossRef]
- Song, Y.; Gao, D. Aeroengine composite maneuver loading spectrum derivation. J. Aerosp. Power 2002, 17, 212–216. [Google Scholar] [CrossRef]
- Yang, X.; Ning, X.; Shi, H. Research on turbo shaft aero engine composite flight profiles. J. Mech. Strength 2006, 28, 909–912. [Google Scholar] [CrossRef]
- Ten Have, A. A Cold Turbistan: Final Definition of a Standardized Fatigue Test Loading Sequence for Tactical Aircraft Cold Section Engine Discs; NLR-TR 87054 L; Nationaal Lucht-en Ruimtevaartlaboratorium: Amsterdam, The Netherlands, 1987. [Google Scholar]
- Xiao, Y.; Xu, K.; Qin, H.; Jia, M. Load spectrum compiling and life prediction for turbine disc based on equivalent transformation of fatigue-creep load. J. Propuls. Technol. 2020, 41, 2316–2324. [Google Scholar] [CrossRef]
- Wang, C.; Li, Z.; Qin, H.; Xu, K.; Xiao, Y. Method for load spectrum compiling spectra under high temperature conditions based on generalized equivalent transformation theory of fatigue-creep load. J. Propuls. Technol. 2022, 43, 328–334. [Google Scholar] [CrossRef]
- Wang, Y.; Zhang, H.; Zhang, S.; Qin, T.; Yu, Z. Life consumption comparison between endurance test case and field service case for a type of aeroengine. In Proceedings of the First Symposium on Aviation Maintenance and Management-Volume I, Berlin, Germany, 25–28 November 2013; Springer: Berlin/Heidelberg, Germany, 2014; Volume 296, pp. 157–167. [Google Scholar] [CrossRef]
- Zhang, H.; Zhu, H.; Rong, Y.; Liu, C.; Dong, C.; Fu, C.; Qu, S.; Zhang, Z. Thermal mechanical fatigue cracking of a bladed disk in a turbo engine. Eng. Fail. Anal. 2024, 165, 108743. [Google Scholar] [CrossRef]
- Bruzzone, S.; Mantero, M.; Patrone, S.; Santolini, B.M.; Silingardi, A.; Traversone, L. Thermo-mechanical rotor analysis tuned by engine operational data. In Proceedings of the ASME Turbo Expo: Turbine Technical Conference and Exposition, Montreal, QC, Canada, 15–19 June 2015; Volume 5c, ISSN 978-0-7918-5673-4. [Google Scholar]
- Ding, S.; Zhang, G.; Li, Y.; Zhou, Y. Safety analysis of transient loads on turbine disk. In Proceedings of the 2009 International Symposium on Aircraft Airworthiness, Toulouse, France, 19–21 November 2013; pp. 362–369, ISSN 978-0-982-24414-2. [Google Scholar]
- Wei, J.; Yang, H.; Zheng, P.; Wang, B.; Zheng, X. Transient tip clearance prediction model considering transient radial temperature distribution of discs in a gas turbine engine. J. Turbomach. 2024, 146, 041012. [Google Scholar] [CrossRef]
- Qian, W.; Zeng, X.; Huang, S.; Yin, X. Reliability analysis of multi-site damage with failure dependency of the turbine based on flow-thermal-solid coupling analysis and the Monte Carlo validated simulations. Eksploat. I Niezawodn.—Maint. Reliab. 2023, 25, 168771. [Google Scholar] [CrossRef]
- Fengna, Y.; Chengxiong, P.; Dongfang, Z.; Jian, T.; Jing, Y. Stress distribution and deformation analysis of gas turbine blades and disk with FEM method. In Proceedings of the ASME Power Conference Joint with ICOPE-17, Charlotte, NC, USA, 26–30 June 2017; Volume 1. [Google Scholar] [CrossRef]
- Javiya, U.; Chew, J.; Hills, N.; Scanlon, T. Coupled FE–CFD thermal analysis for a cooled turbine disk. Proc. Inst. Mech. Eng. Part C J. Mech. Eng. Sci. 2015, 229, 3417–3432. [Google Scholar] [CrossRef]
- Li, G.; Ding, S.; Bao, M.; Sun, H. Effect of actively managed thermal-loading in optimal design of an aeroengine turbine disk. Int. Commun. Heat Mass Transf. 2017, 81, 257–268. [Google Scholar] [CrossRef]
- Ding, S.; Wang, Z.; Li, G.; Liu, C.; Yang, L. Transient stress control of aeroengine disks based on active thermal management. Appl. Therm. Eng. 2016, 103, 16–27. [Google Scholar] [CrossRef]
- Ding, S.; Li, Y. A safety design evaluation on transient thermal stress in turbine disk. Procedia Eng. 2014, 80, 609–627. [Google Scholar] [CrossRef][Green Version]
- Ding, S.; Li, Y.; Li, G. Evaluation of thermal loadings to ameliorate stress in a rotating disk. J. Thermophys. Heat Transf. 2014, 28, 667–678. [Google Scholar] [CrossRef]
- Ding, S.; Li, G.; Deng, M. Experimental study of an actively managed thermal loading method in turbine disk. J. Thermophys. Heat Transf. 2014, 28, 39–49. [Google Scholar] [CrossRef]
- Hunag, J.; Wang, Q.; Lu, F. Research status and prospect of gas path fault diagnosis for aeroengine. J. Nanjing Univ. Aeronaut. Astronaut. 2020, 52, 507–522. [Google Scholar] [CrossRef]
- NASA. Adaptive Gas Turbine Engine Control for Deterioration Compensation Due to Aging; NASA: Washington, DC, USA, 2003. [Google Scholar]
- Li, X.; Ding, Q.; Sun, J. Remaining useful life estimation in prognostics using deep convolution neural networks. Reliab. Eng. Syst. Saf. 2018, 172, 1–11. [Google Scholar] [CrossRef]
- Sun, X.; Jafari, S.; Fashandi, S.A.M.; Nikolaidis, T. Compressor degradation management strategies for gas turbine aero-engine controller design. Energies 2021, 14, 5711. [Google Scholar] [CrossRef]
- Pang, S.; Li, Q.; Feng, H. A hybrid onboard adaptive model for aero-engine parameter prediction. Aerosp. Sci. Technol. 2020, 105, 105951. [Google Scholar] [CrossRef]
- Li, Y. Gas turbine performance and health status estimation using adaptive gas path analysis. J. Eng. Gas Turbines Power 2010, 132, 041701. [Google Scholar] [CrossRef]
- Zhang, Y.; Xin, Y.; Liu, Z.-W.; Chi, M.; Ma, G. Health status assessment and remaining useful life prediction of aero-engine based on BiGRU and MMoE. Reliab. Eng. Syst. Saf. 2022, 220, 108263. [Google Scholar] [CrossRef]
- Kim, T.; Sohn, S. Multitask learning for health condition identification and remaining useful life prediction: Deep convolutional neural network approach. J. Intell. Manuf. 2021, 32, 2169–2179. [Google Scholar] [CrossRef]
- Li, Z.; Wu, J.; Yue, X. A shape-constrained neural data fusion network for health index construction and residual life prediction. IEEE Trans. Neural Netw. Learn. Syst. 2021, 32, 5022–5033. [Google Scholar] [CrossRef]
- Li, Y.; Chen, Y.; Hu, Z.; Zhang, H. Remaining useful life prediction of aero-engine enabled by fusing knowledge and deep learning models. Reliab. Eng. Syst. Saf. 2023, 229, 108869. [Google Scholar] [CrossRef]
- Ren, L.; Qin, H.; Cai, N.; Li, B.; Xie, Z. A hybrid degradation evaluation model for aero-engines. Sustainability 2023, 15, 29. [Google Scholar] [CrossRef]
- Wei, Z.; Jafari, S.; Zhang, S.; Nikolaidis, T. Hybrid wiener model: An on-board approach using post-flight data for gas turbine aero-engines modelling. Appl. Therm. Eng. 2021, 184, 116350. [Google Scholar] [CrossRef]
- Saxena, A.; Goebel, K. Turbofan Engine Degradation Simulation Data Set. NASA Prognostics Data Repository, NASA AMES Research Center, Moffett Field, CA. 2008. Available online: https://phm-datasets.s3.amazonaws.com/NASA/6.+Turbofan+Engine+Degradation+Simulation+Data+Set.zip (accessed on 28 March 2025).
- Zhang, J.; Chang, H. Heat Transfer; Science Press: Beijing, China, 2015; pp. 26–27. ISBN 978-7-03-043342-8. [Google Scholar]
- Debnath, L. Linear Partial Differential Equations for Scientists and Engineers, 4th ed.; Birkhauser: Boston, MA, USA, 2007; ISBN 978-0-8176-4560-1. [Google Scholar]
- Hu, S. Automatic control Theory; Science Press: Beijing, China, 2013; pp. 29–30. ISBN 978-7-03-037056-3. [Google Scholar]
- Xu, B.; Liu, X. Applications Elastoplastic Mechanical; Tsinghua University Press Pub: Beijing, China, 1995; pp. 385–388. ISBN 7-302-01800-6. [Google Scholar]
- Diakunchak, I. Performance deterioration in industrial gas-turbines. J. Eng. Gas Turbines Power-Trans. ASME 1992, 114, 161–168. [Google Scholar] [CrossRef]
- Robinson, E.L. Effect of temperature variation on the long-time rupture strength of steels. Trans. Am. Soc. Mech. Eng. 1952, 74, 777–780. [Google Scholar] [CrossRef]
- Hales, R. A method of creep damage summation based on accumulated strain for the assessment of creep-fatigue endurance. Fatigue Fract. Eng. Mater. Struct. 1983, 6, 121–135. [Google Scholar] [CrossRef]
- Takahashi, Y.; Dogan, B.; Gandy, D. Systematic evaluation of creep-fatigue life prediction methods for various alloys. J. Press. Vessel Technol. 2013, 135, 061204. [Google Scholar] [CrossRef]
- Wang, R.-Z.; Zhang, X.-C.; Tu, S.-T.; Zhu, S.-P.; Zhang, C.-C. A modified strain energy density exhaustion model for creep–fatigue life prediction. Int. J. Fatigue 2016, 90, 12–22. [Google Scholar] [CrossRef]
- Zhao, X.; Niu, X.; Song, Y.; Sun, Z. A novel damage constitutive model for creep deformation and damage evolution prediction. Fatigue Fract. Eng. Mater. Struct. 2023, 46, 798–813. [Google Scholar] [CrossRef]
- Mu, L. Investigation on Low Cycle fatigue Life Prediction Method of Single Crystal Turbine Blades Based on Critical Plane Approach. Ph.D. Thesis, University of Chinese Academy of Sciences, Beijing, China, 2017. [Google Scholar]
Disclaimer/Publisher’s Note: The statements, opinions and data contained in all publications are solely those of the individual author(s) and contributor(s) and not of MDPI and/or the editor(s). MDPI and/or the editor(s) disclaim responsibility for any injury to people or property resulting from any ideas, methods, instructions or products referred to in the content. |
© 2025 by the authors. Licensee MDPI, Basel, Switzerland. This article is an open access article distributed under the terms and conditions of the Creative Commons Attribution (CC BY) license (https://creativecommons.org/licenses/by/4.0/).