Article

Numerical Analysis of Ejector Flow Performance for High-Altitude Simulation

1
KLLV-III System Team, Korea Aerospace Research Institute, 169-84, Gwahak-ro, Yuseong-gu, Daejeon 34133, Republic of Korea
2
KLLV-III Program Office, Korea Aerospace Research Institute, 169-84, Gwahak-ro, Yuseong-gu, Daejeon 34133, Republic of Korea
*
Author to whom correspondence should be addressed.
Aerospace 2025, 12(5), 380; https://doi.org/10.3390/aerospace12050380
Submission received: 20 March 2025 / Revised: 25 April 2025 / Accepted: 27 April 2025 / Published: 28 April 2025
(This article belongs to the Section Astronautics & Space Science)

Abstract

:
In this study we perform a computational numerical analysis to examine the flow characteristics of a system composed of a rocket engine, supersonic diffuser, and ejector system. When the nozzle expansion ratio of a rocket engine increases, it is necessary to maintain high-vacuum conditions during ground hot testing, which requires a supersonic diffuser and ejector system. The integrated model, consisting of multiple systems and a single-ejector system model, exhibits a difference in the initial volume to be evacuated. Although some differences are observed during the initial vacuum transition process, both models maintain the same final vacuum pressure (4 kPa). During the initial vacuum process, if the injection pressure of the ejector decreases below the design pressure, vacuum degradation occurs because of momentum deficiency, followed by pressure perturbations as the vacuum process resumes. Once the rocket engine ignites and flow is supplied to the suction region, two flow regions exist around the ejector nozzle exit. As these flows mix and move downstream, flow separation occurs in the expansion region. When the injection pressure of the ejector falls below the design pressure, the flow separation region moves forward, and this shift helps maintain the designed vacuum suction conditions.

1. Introduction

During the development of rocket engines, it is necessary to use test facilities to validate the combustion performance of the rocket engines on the ground. Particularly, for upper-stage rocket engines ignited under high-altitude vacuum conditions, a high-altitude simulation test facility is required to replicate these conditions on the ground [1,2,3,4,5,6,7,8,9,10,11,12,13,14]. To simulate high-altitude environments, a vacuum chamber is typically used to maintain a vacuum around the rocket engine, along with a supersonic diffuser for air intake. A supersonic diffuser works by creating a self-pumping effect, in which the rocket engine exhaust flows through the supersonic diffuser, draws air from the vacuum chamber, and maintains the desired vacuum level around the rocket engine [4,5,6,7,8,9]. When the nozzle expansion ratio exceeds 100, or throttling is required by lowering the combustor chamber pressure to adjust the thrust, relying solely on a supersonic diffuser can render stable combustion testing challenging. When the expansion ratio of a rocket engine nozzle is larger, a radiative cooling method is typically used to reduce the weight of the nozzle, making it very thin (approximately 1 mm). During ground rocket engine testing, severe vibrations can occur during the transition phase after ignition, resulting in nozzle damage. Therefore, before a rocket engine is started, a high-altitude simulation facility must maintain a vacuum to ensure stable ignition. To address this issue and enhance the vacuum performance of high-altitude simulation facilities, an ejector system is additionally required [8,9,10,11,12,13]. When the ejector system is operational, it creates vacuum conditions within the simulation facility before the rocket engine ignites, thereby maintaining a vacuum around the rocket engine. Once the rocket engine runs, the ejector system handles the exhaust gas intake, thereby enabling the simulation facility to create the necessary conditions for testing the rocket engine based on its mission objectives.
An ejector system utilizes momentum and energy transfer from a high-speed primary flow to induce a secondary fluid flow [15,16]. The basic design and analysis of ejectors were initially presented by Keenan and Neumann, and mathematical models for ejectors were established in the 1950s [15,16]. Ejectors have been extensively studied for applications such as compressors in refrigeration systems and power sources in air circulation devices using well-developed 1-D mathematical models [17,18,19,20,21]. Huang’s mathematical equations have also been used in the design of ejectors for high-altitude simulation facilities [8,9,13]. Therefore, this study adopts Huang’s equations as the fundamental formulas for designing ejectors for such facilities. Using Huang’s mathematical formulas, once the injection flow rate and ejector nozzle shape are determined, isentropic relations, area–Mach relations, momentum balance relations, and energy equations are iteratively calculated until the characteristic pressure is satisfied [17,22,23]. For ejectors in high-altitude simulation facilities, the primary design factors are the required suction flow rate relative to the main injection flow rate, and the vacuum pressure of the suction flow. Therefore, instead of using the characteristic pressure, Huang’s formula is modified to iterate the calculations until the required suction flow rate is achieved. Within the ejector system, supersonic flows and shock waves are formed; to recover to atmospheric pressure, a horizontal section of the ejector diffuser (or mixing zone) is necessary [8,9]. Owing to the frictional losses in this diffuser section, the accuracy is improved by applying the Fanno flow and Darcy friction considerations [13,22,23].
The key factors influencing the performance of the ejector system include the ejector injection pressure (or flow rate), temperature of the injected and suction fluids, and shapes of the ejector nozzle and diffuser [8,9,11,17,18,19,20,21]. In this study, the geometric ratios proposed as optimal in previous studies are applied to the key shape parameters of the formulas used in the calculations. Once the required suction flow rate and vacuum pressure are determined, iterative calculations are performed to optimize the injection pressure and flow rate to satisfy these requirements. Typically, when the shape of an ejector system is established, verification analyses are conducted to ensure that the vacuum performance and entrainment ratio satisfy the requirements when the ejector injection pressure increases. However, limited research has been conducted on ejector systems for creating initial vacuum conditions in high-altitude simulation facilities [12]. Furthermore, previous research has confirmed that the horizontal section of the supersonic diffuser enables it to operate normally at pressures lower than anticipated under throttling conditions, even when the engine thrust decreases [14]. Therefore, it is necessary to verify whether the performance of the ejector diffuser is maintained when the pressure in the ejector nozzle decreases below the design pressure.
In this study, computational numerical analysis methods are used to perform an initial vacuum analysis based on a model comprising a rocket engine, supersonic diffuser, and ejector system. As previous studies [8,9,11,13] have primarily focused on analyses using the ejector system, the analysis in this study is divided into integrated and single-ejector system models. This approach enables the examination of the vacuum and flow characteristics of the ejector system based on the required suction volume. In addition, by analyzing the relationship between the horizontal section of the ejector diffuser and the injection pressure, this study focuses on how conditions lower than the design specifications affect the overall ejector performance and flow characteristics.

2. Numerical Models and Methods

2.1. Numerical Setup

The commercial simulation software Simcenter Star-CCM+ (version 2206), based on a density-based coupled solver, was used to predict the flow characteristics of the integrated model [24]. The governing equations are as follows:
The continuity equation is
ρ t + ( ρ u i ) x i = 0
where ρ is the density and u i is the velocity component of the xi-direction.
The momentum equation is
t ρ u i + x j ρ u i u j = p x i + x j [ μ ( u i x j + u j x i 2 3 u j x j δ i j ) ] + x j ( ρ u i u j ¯ )
where p , μ , and δ i j are the pressure, viscosity, and the Kronecker symbol, respectively. u i u j ¯ is the Reynolds stress tensor.
The energy equation is
ρ t ( ρ E ) + x i [ u i ρ E + p ] = x j [ α + C p μ t P r t T x j + u i ( τ i j ) e f f ]
where α, E, Cp, Prt, μ t , and T are the thermal conductivity, total energy, specific heat, turbulent Prandtl number, turbulent viscosity, and temperature, respectively. ( τ i j ) e f f is the stress tensor, and is defined as follows:
( τ i j ) e f f = μ e f f ( u i x j + u j x i 2 3 u k x k δ i j )
where δ i j is the viscous heating due to the dissipation. The turbulent viscosity ( μ t ) is computed by combining k and ε as follows:
μ t = ρ C μ k 2 ε
where Cμ is a constant.
The realizable two-layer k-epsilon (ε) turbulence model was chosen for turbulence modeling, which has been widely used in previous studies [6,14,25,26,27,28,29]. In addition, the turbulence model demonstrated high accuracy in both the numerical simulation results and experiments during a previous high-altitude combustion test validation using a full-scale rocket engine [14]; the same conditions were applied in this study. The realizable two-layer k-ε turbulence model combines the realizable k-ε model with the two-layer approach. The realizable k-ε turbulence model exhibits good predictions for boundary layers under strong adverse pressure gradients, separation, and recirculation [25].
The software employs a fully coupled, implicit, compressible flow solver and utilizes the advection upstream splitting method (AUSM) + flux vector splitting (FVS) scheme, which is effective in handling strong shock waves and rarefaction waves in supersonic flows. The rocket engine, supersonic diffuser, and ejector system had symmetrical shapes; therefore, an axisymmetric solver was chosen to reduce the computational time [8,9,11,13,14]. To analyze the conditions before engine ignition and the flow dynamics after engine start, an implicit unsteady condition was used with a time step of 10−6 s and first-order implicit temporal discretization. More detailed information can be found in a previous study [14].

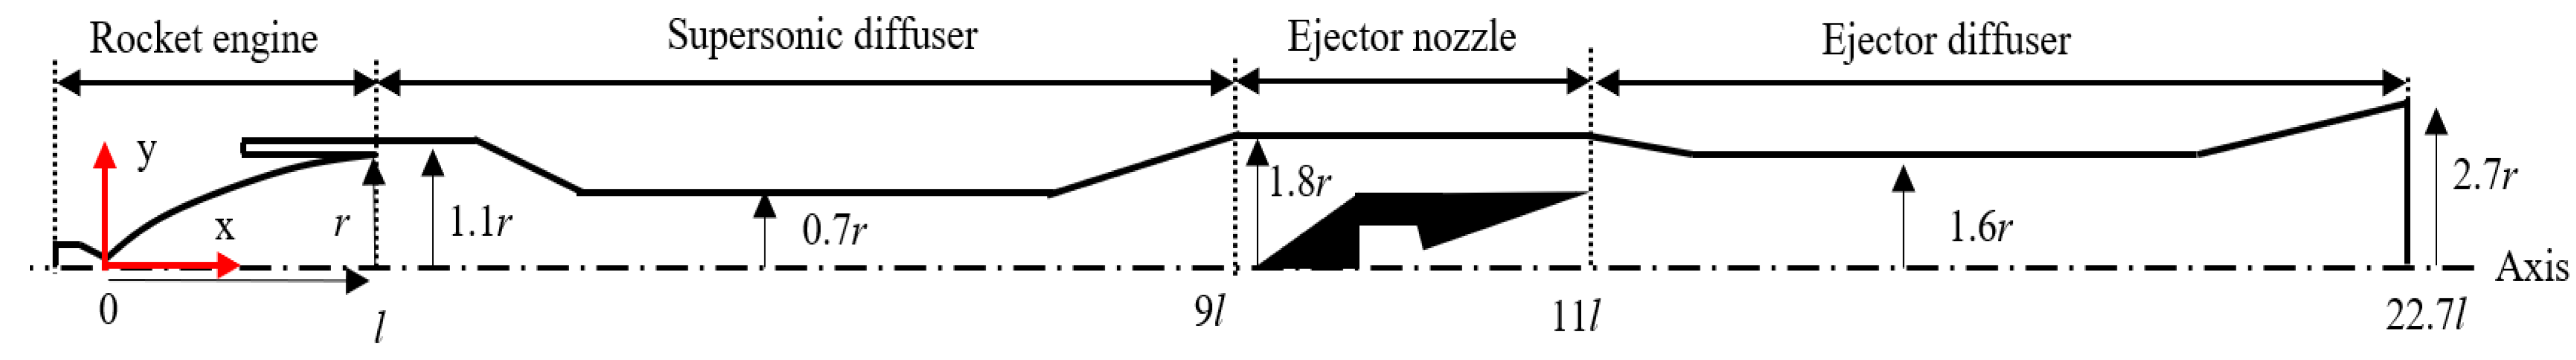
2.2. Geometry and Input Conditions

The test model was primarily composed of four parts: a rocket engine, supersonic diffuser, ejector nozzle, and ejector diffuser, as shown in Figure 1. The part comprising the ejector nozzle and diffuser was defined as the ejector system in this study. A supersonic diffuser was numerically investigated in a previous study [14]. The geometric size of the supersonic diffuser was selected based on the starting conditions of the rocket engine. The dimensions were normalized using the rocket nozzle exit radius (r) and nozzle length (l). The rocket engine was a 10-class staged combustion cycle engine with a chamber pressure of 10 MPa and a temperature of 3728 K. It used a kerosene-based fuel and a cryogenic oxidizer with material properties derived from the NASA Chemical Equilibrium with Application (CEA) program utilized as inlet conditions for the rocket engine [30]. The mixed gas of engine combustion gases and coolant inside the supersonic diffuser was calculated using an in-house code, resulting in the following properties: temperature of 400 K, molecular weight of 19.75 kg/kmol, thermal conductivity of 0.0345 W/(mK), and specific heat capacity of 1718. Applying a safety factor of 1.5 to the calculated flow rate, the ejector system was required to handle an intake flow rate of 122 kg/s. The expansion ratio of the ejector nozzle was 6. Reaction calculations involving a kerosene-based fuel, a cryogenic oxidizer, and water were performed using the CEA code. The inlet conditions for the ejector nozzle were as follows: temperature of 600 K, molecular weight of 21.24 kg/kmol, thermal conductivity of 0.0345 W/(mK), and specific heat capacity of 2933. In the ejector design method, the total pressure of the ejector nozzle, which was calculated under the conditions of ingesting a flow of 122 kg/s and maintaining a pressure of 50 kPa downstream of the supersonic diffuser, was 1.5 MPa. The ratio of the intake flow rate to the ejector nozzle discharge flow rate (entrainment ratio) was approximately 0.5. To verify the difference in flow between the initial vacuum conditions and the post-start conditions of the rocket engine, comparisons were made by reducing the pressure from 1.5 to 1.3 MPa and 1.2 MPa. The input parameters are listed in Table 1.

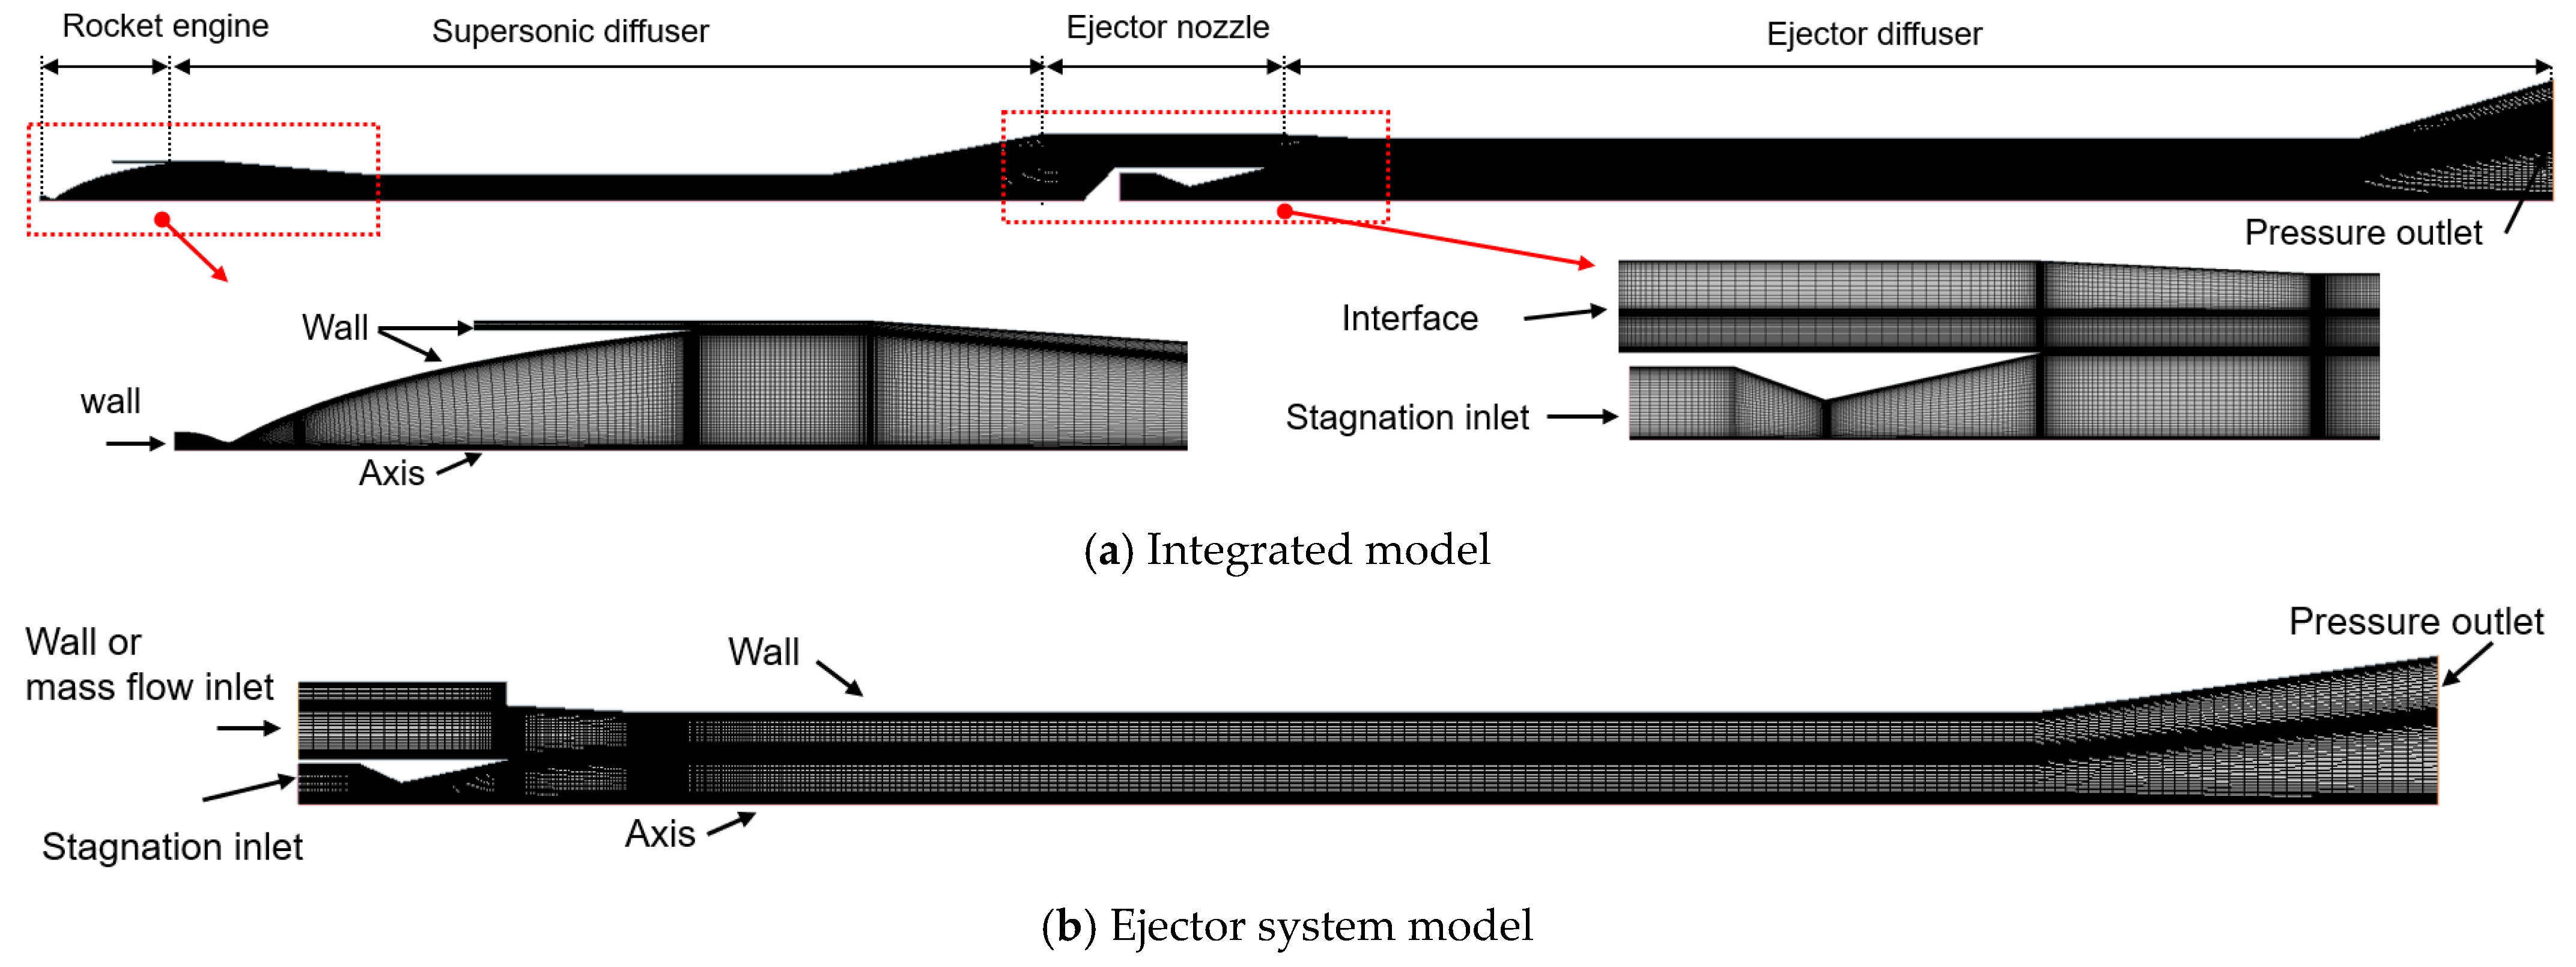
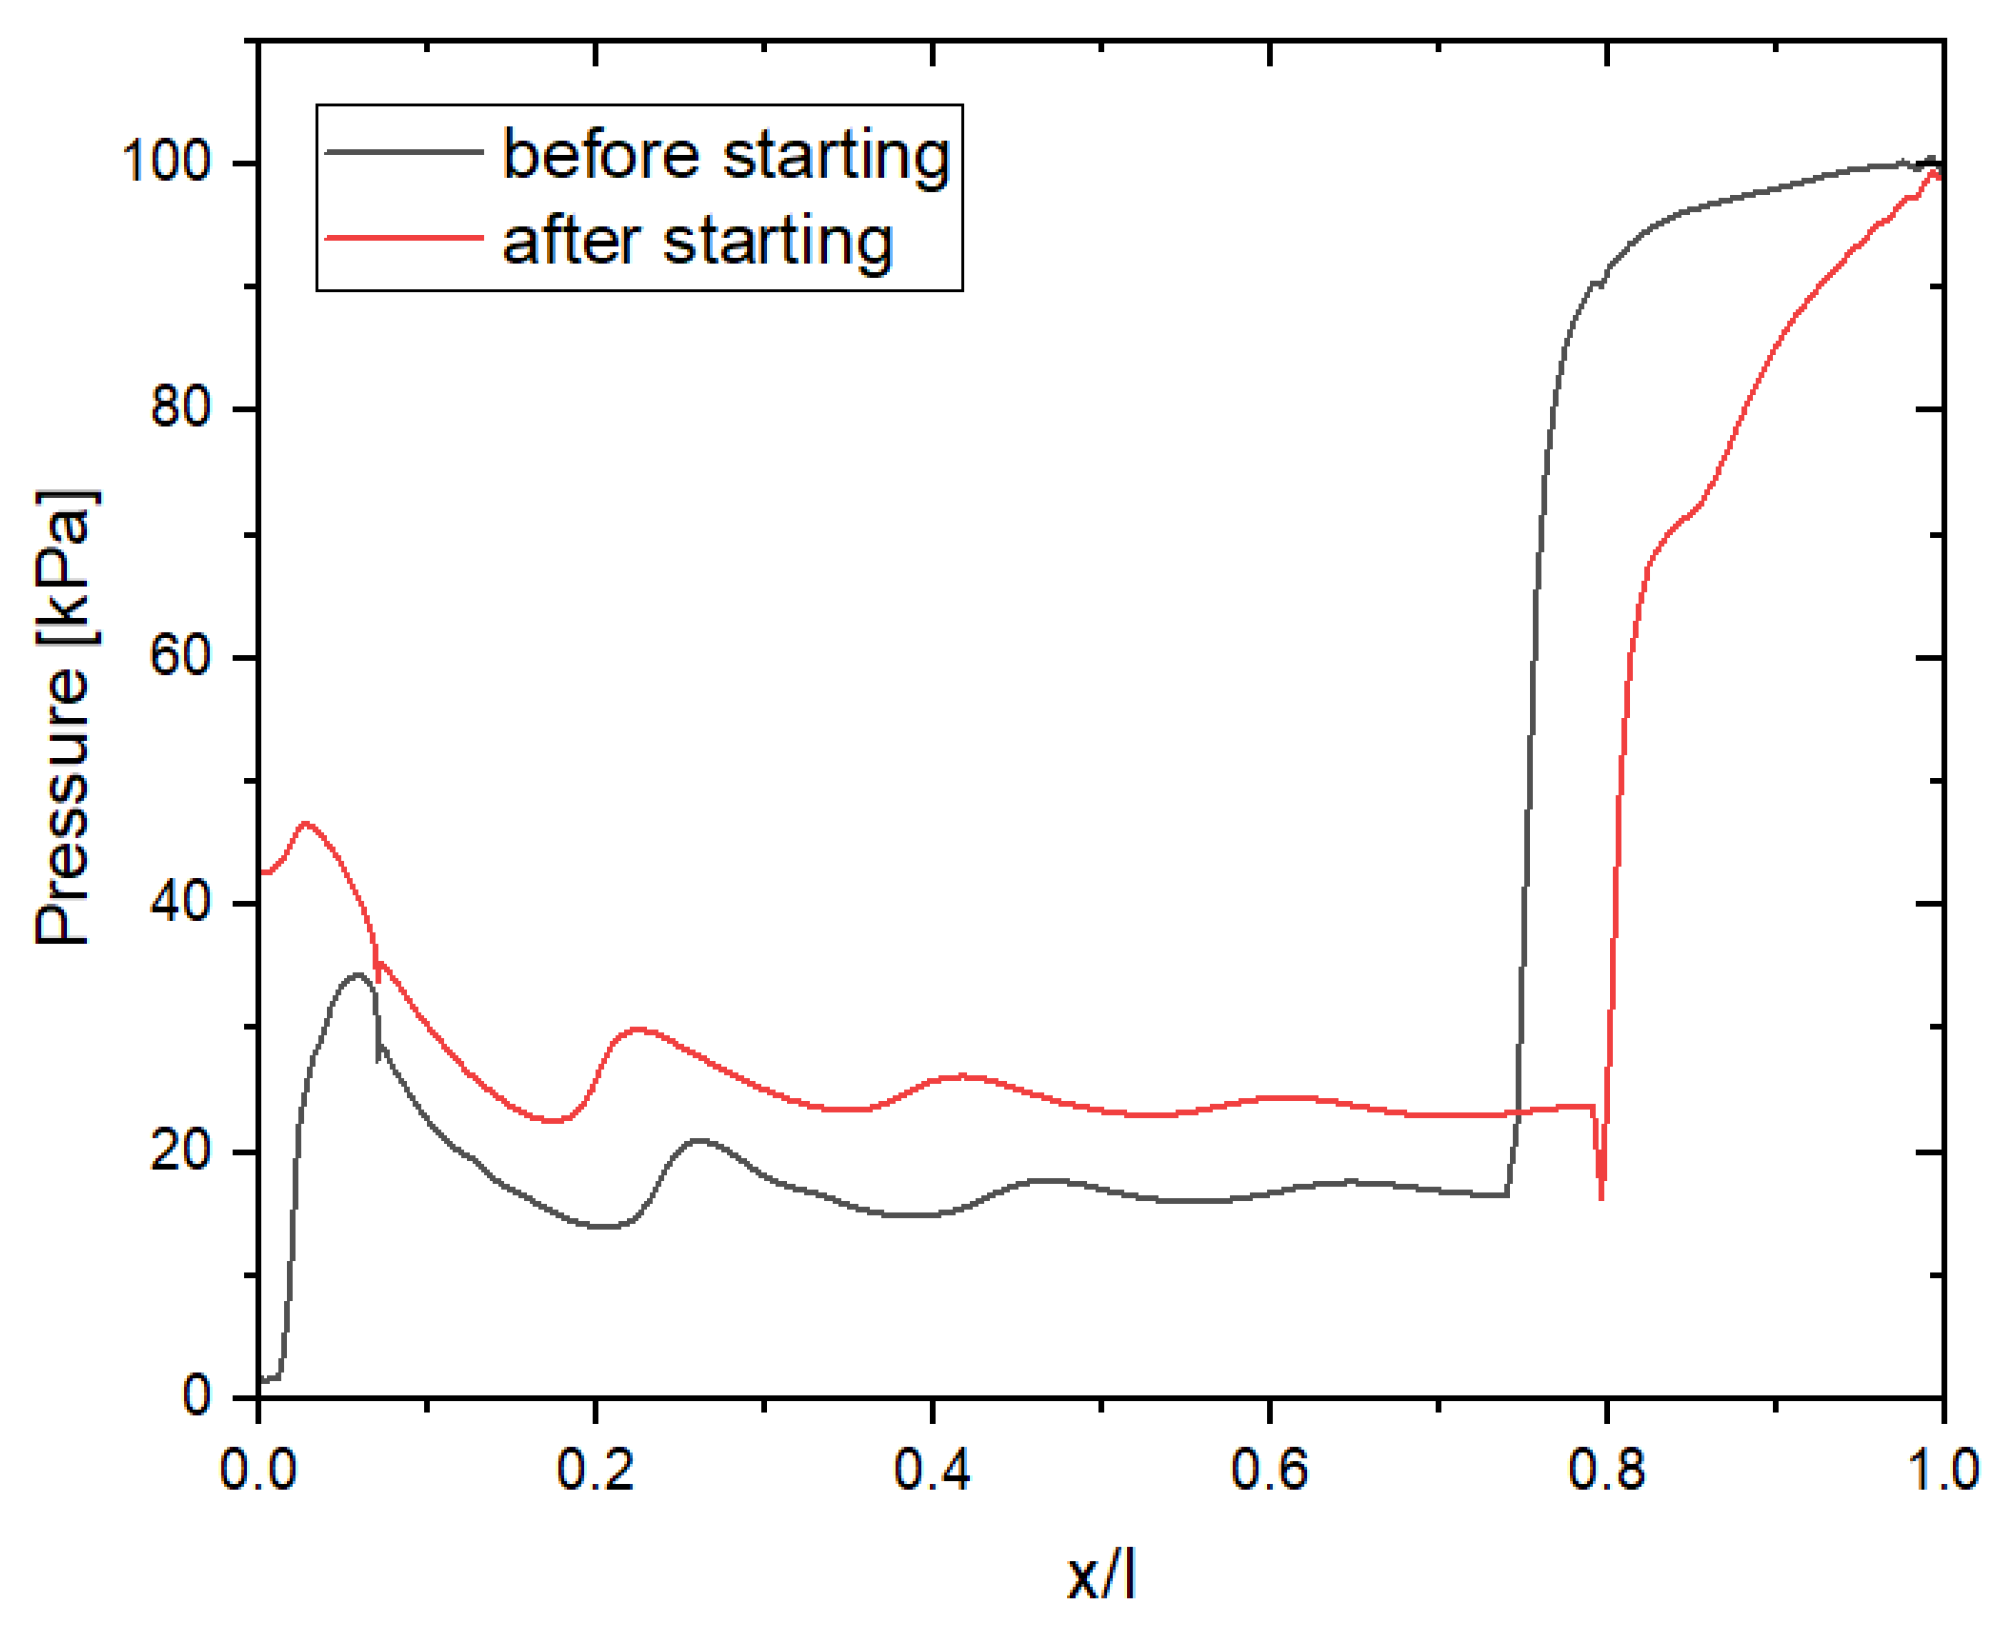
2.3. Grid Conditions and Validations

The grid conditions used for the numerical analysis are shown in Figure 2. The integrated model consisted of a rocket engine, supersonic diffuser, ejector nozzle, and ejector diffuser. The configuration of a rocket engine with a supersonic diffuser has been described in a previous study [14]. In this case, grid independence tests were conducted with four different grid numbers, 77,600, 83,600, 92,600, and 107,600, and a grid of 92,600 cells was selected, as shown in Figure 3a. The grid was structured with a wall-adjacent cell spacing of 1 μm, and y+ was less than one. The average skewness angle was approximately 0.87°. Each face was orthogonal to the line connecting the centroids of adjacent cells. The grid conditions applied were the same for both the integrated and ejector system models. In the integrated model calculation, as shown in Figure 2a, the rocket engine inlet was set at the wall and the stagnation inlet was set at the ejector nozzle. To compare the integrated and ejector system models, the ejector nozzle and diffuser were computed separately, as shown in Figure 2b. In the ejector system model, the ejector nozzle was set at the stagnation inlet. For the interface in the integrated model, shown in Figure 2a, a wall condition was applied to simulate the pre-engine-start conditions, whereas a mass flow inlet condition was used to simulate the post-engine-start conditions, as shown in Figure 2b. The pressure outlet was set at the outer region. For a grid independence study of the ejector system model, as shown in Figure 3b, 85,000 cells were selected from different grids: 76,400, 85,800, and 95,200. In the integrated model, the grids for the rocket engine, supersonic diffuser, ejector nozzle, and diffuser were combined, resulting in a total grid count of 194,400. The wall pressure (Pw) was normalized to ambient pressure (Pa).

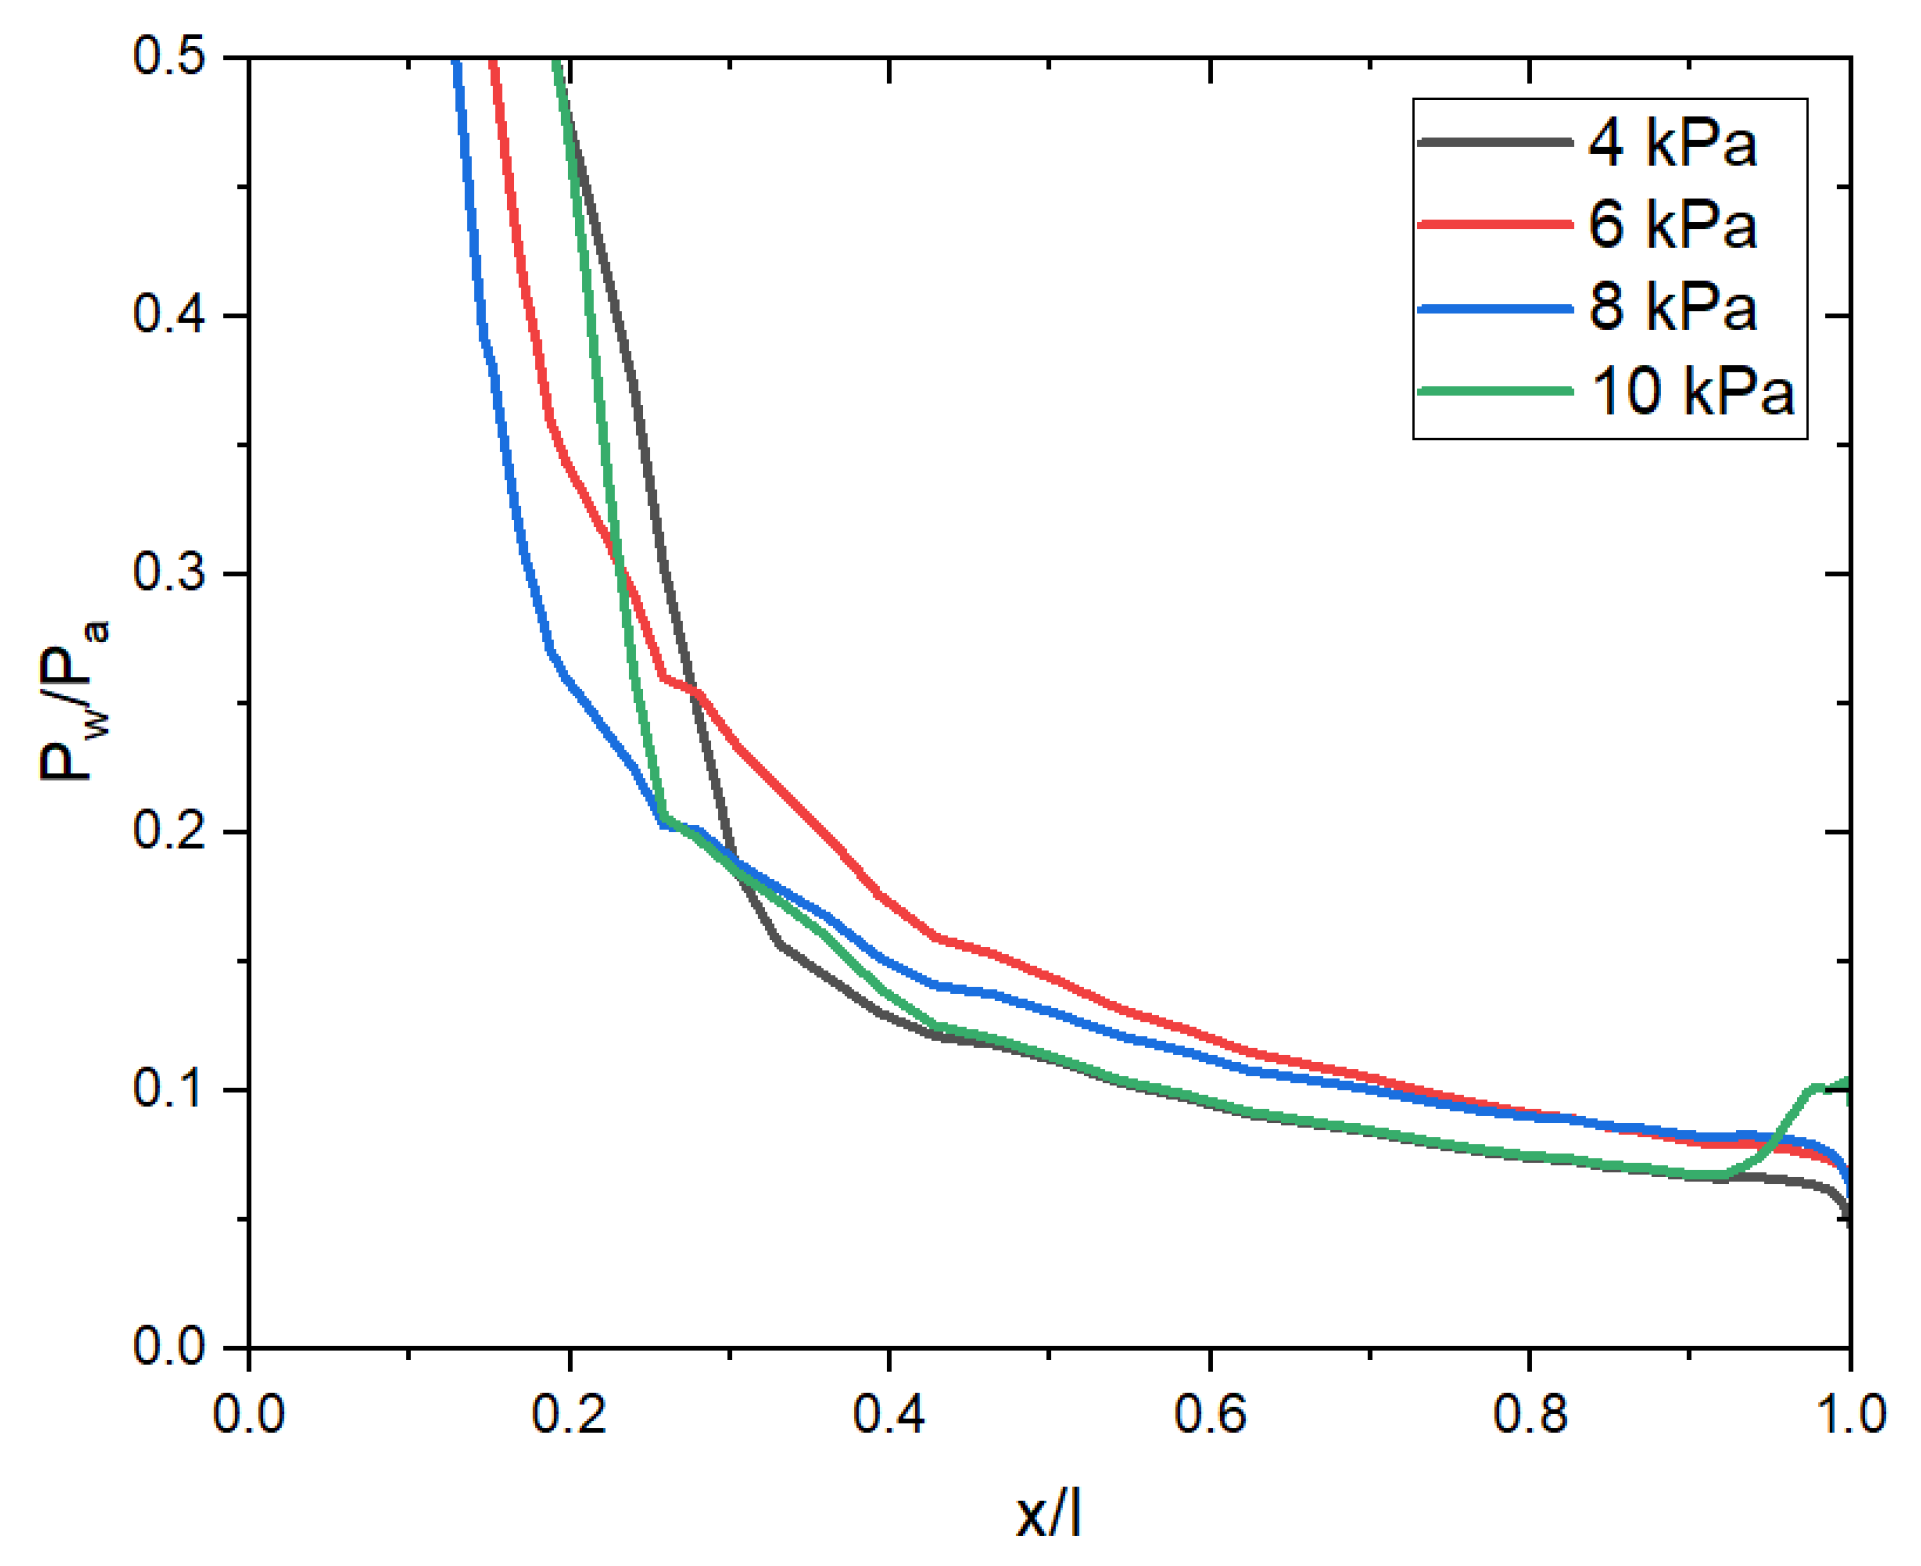
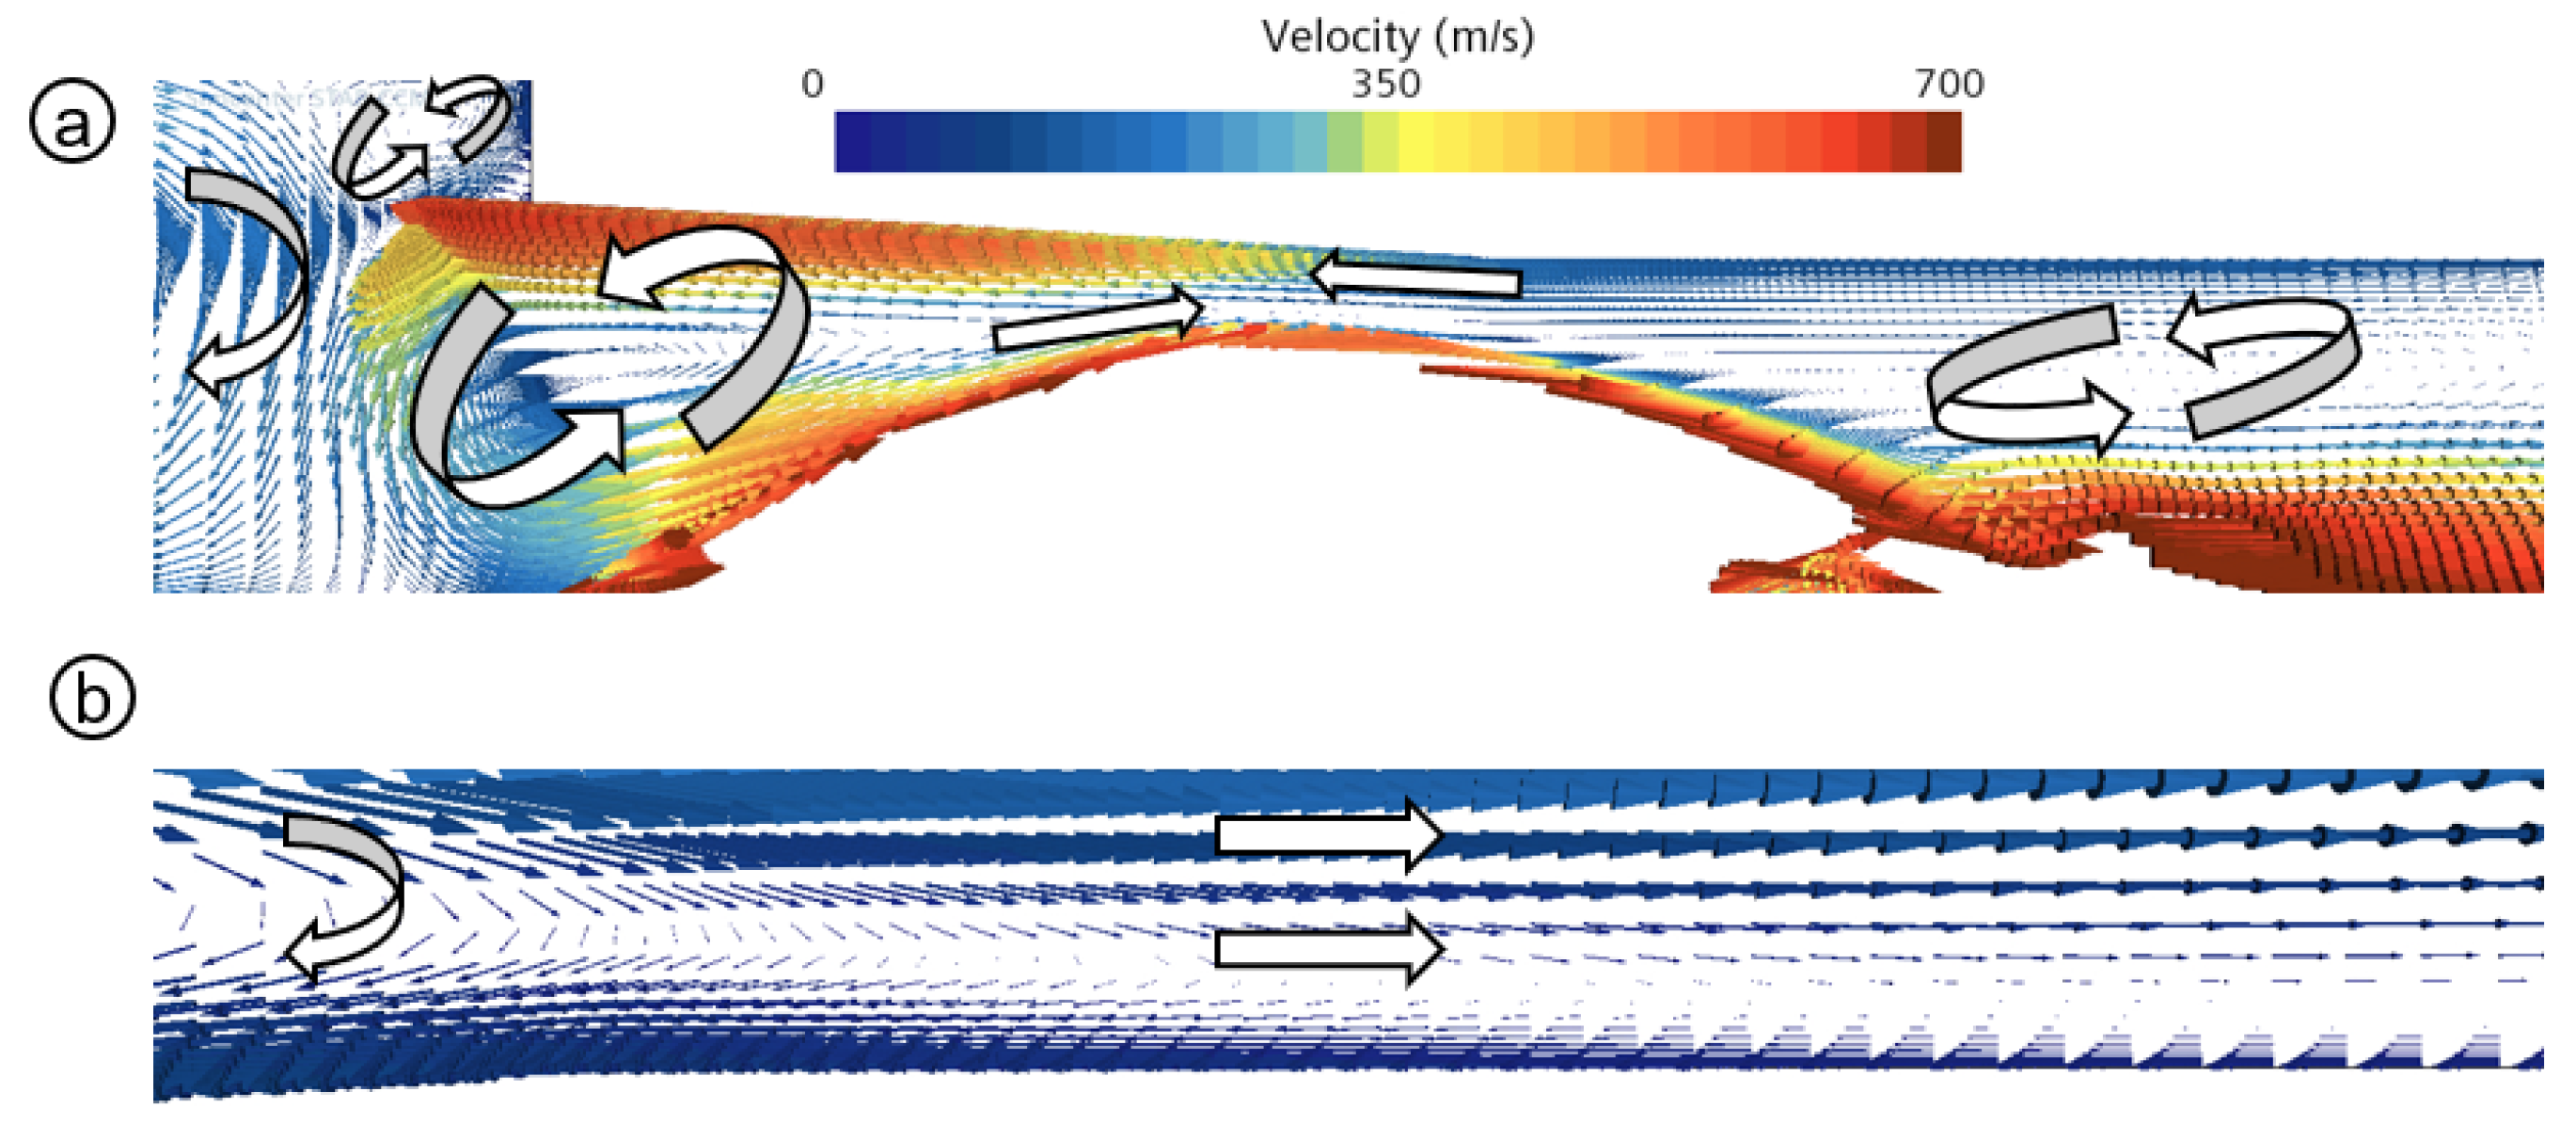
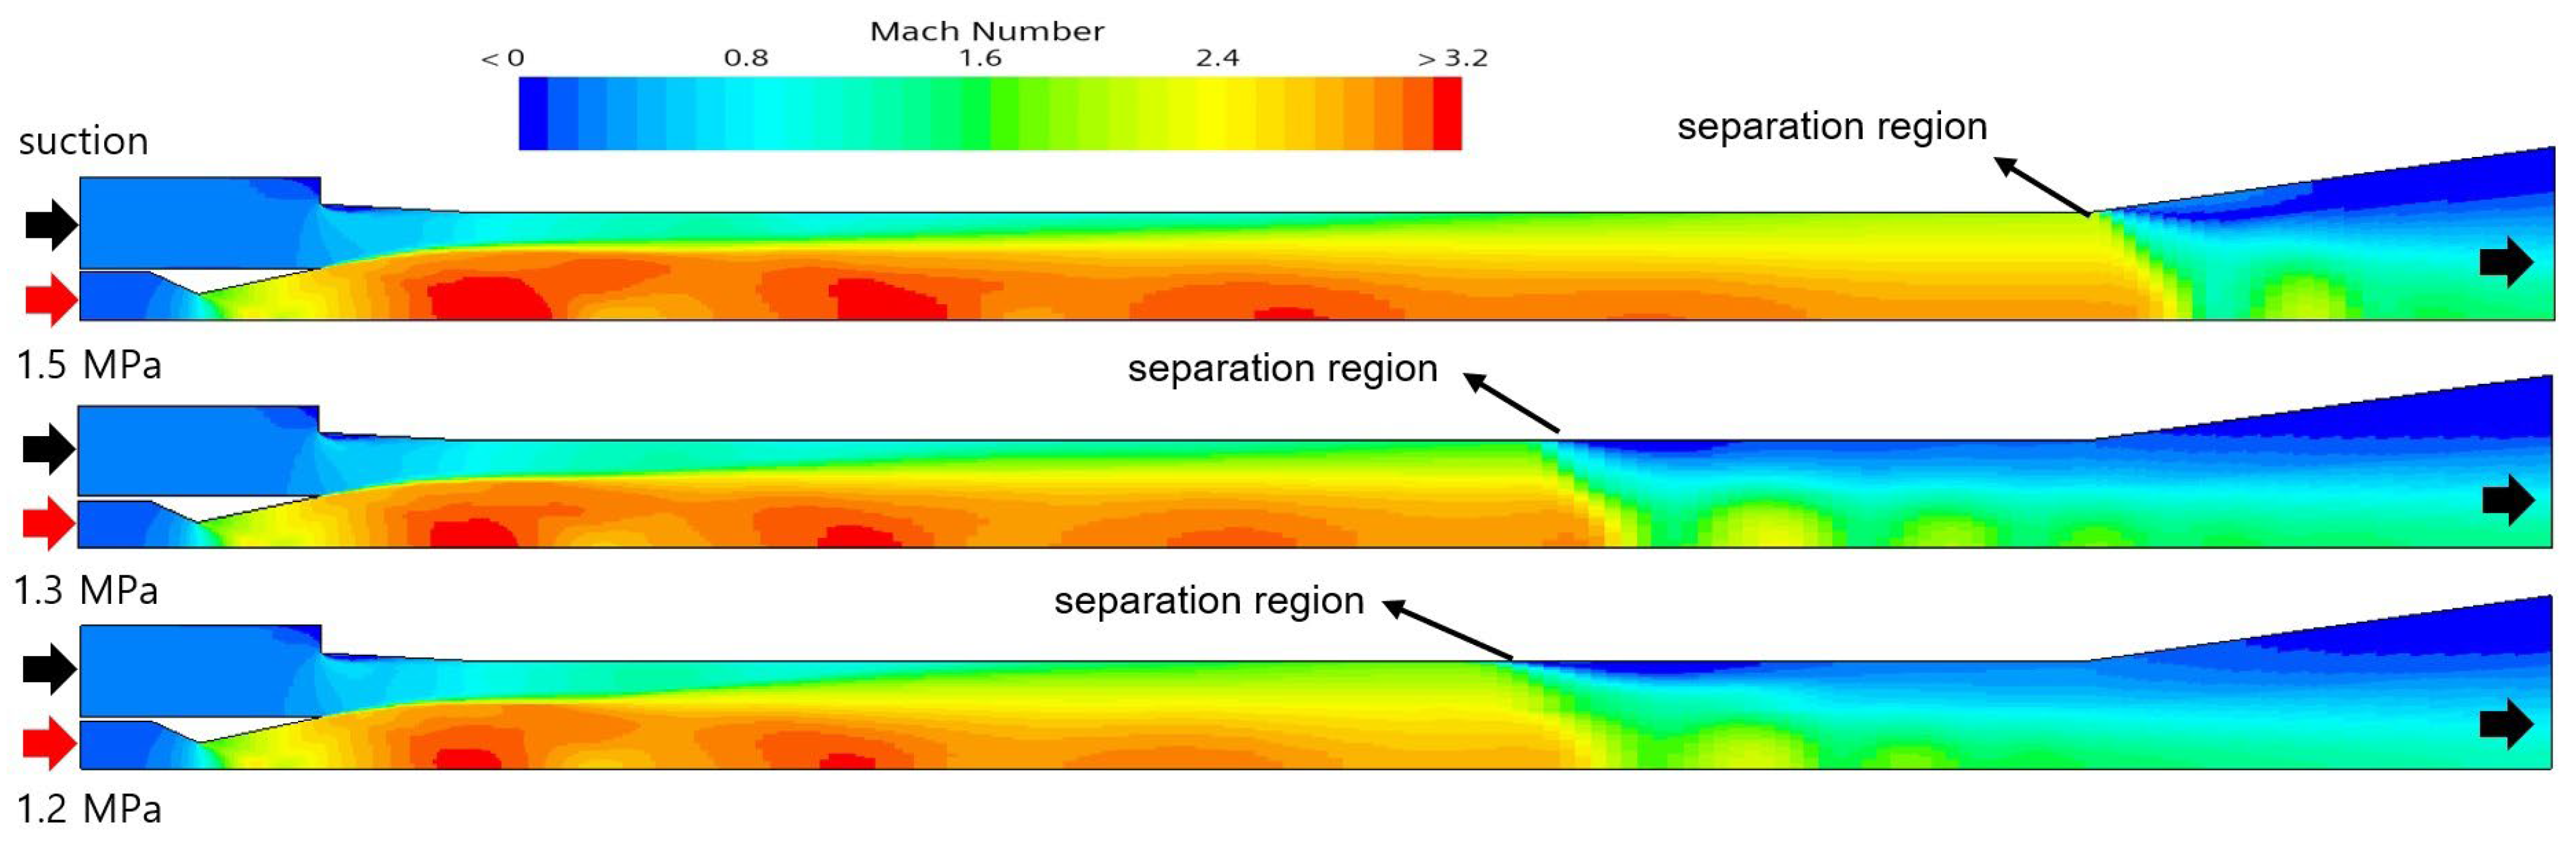
2.4. Flow Separation Inside the Nozzle

Figure 4 shows the internal pressure distribution in the nozzle as a function of external ambient pressure. The expansion ratio of the rocket engine currently under development (SCCE: staged combustion cycle engine) was approximately 187, which is larger than that of a 7-ton-class liquid rocket engine (95) [31]. Due to its thinness, a radiative cooling method was used to cool the end area of the SCCE nozzle. Previous research has shown that vibrations caused by flow separation occur inside the engine nozzle during engine startup and shutdown [31]. Although these vibrations have a limited effect on the stability of a 7-ton-class rocket engine nozzle, a thicker nozzle mitigates the impact of these vibrations. However, a thinner SCCE poses the risk of damage owing to vibrations during engine startup and shutdown. The pressure on the internal walls of the nozzle was measured and plotted as a function of the ambient pressure. Flow separation occurred at the end of the nozzle at an ambient pressure of 10 kPa. Flow separation did not occur when the ambient pressure was less than 10 kPa. Once the engine was fully started and the supersonic diffuser became operational, self-pumping occurred. At this point, the ambient pressure around the engine nozzle was maintained at the vacuum level to prevent flow separation inside the nozzle. To ensure that the SCCE nozzle operated normally without causing damage, the ambient pressure around the engine nozzle was maintained below 10 kPa before starting the SCCE. In this study, it was necessary to verify whether the vacuum inside the high-altitude simulation facility was maintained below 10 kPa before starting the engine. This is discussed in the following section.

3. Results and Discussion

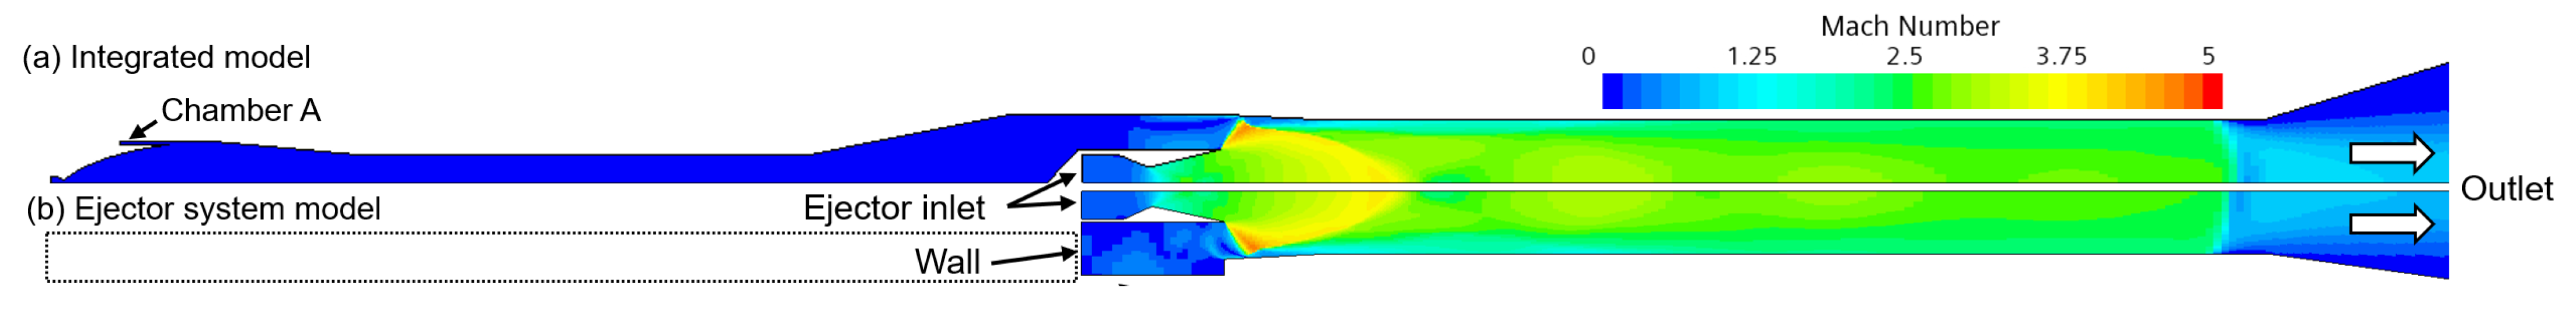
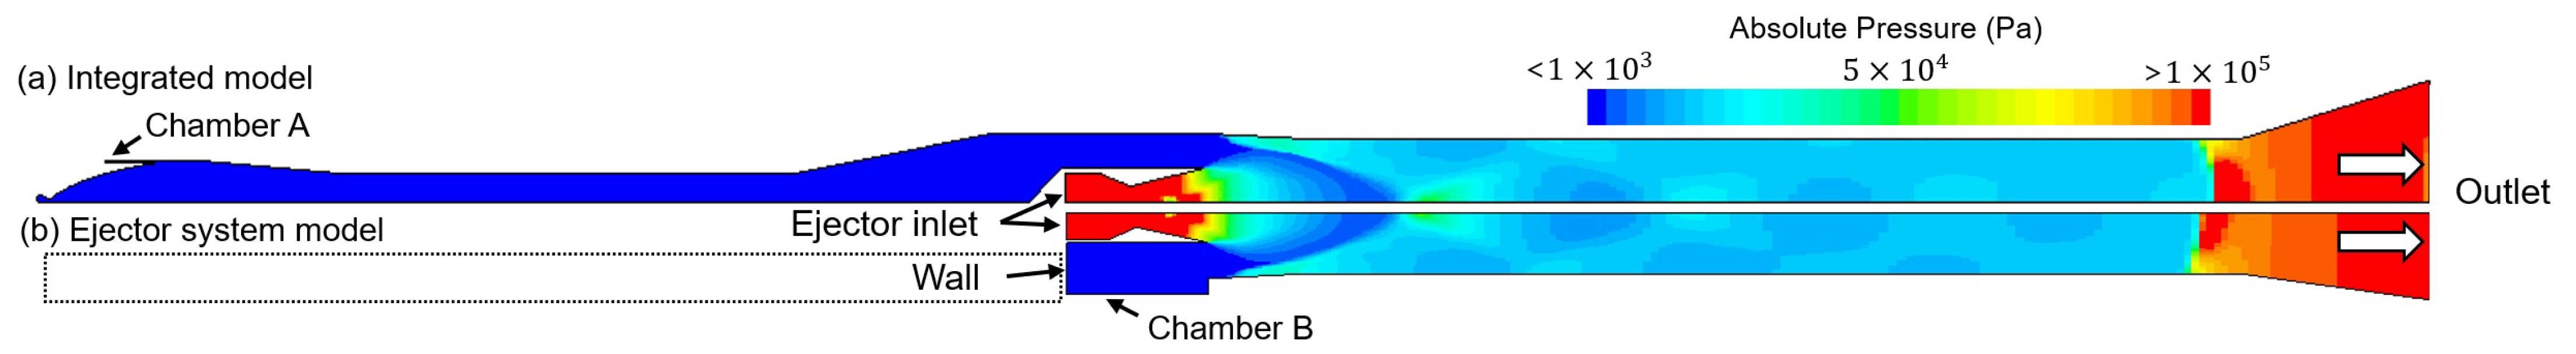
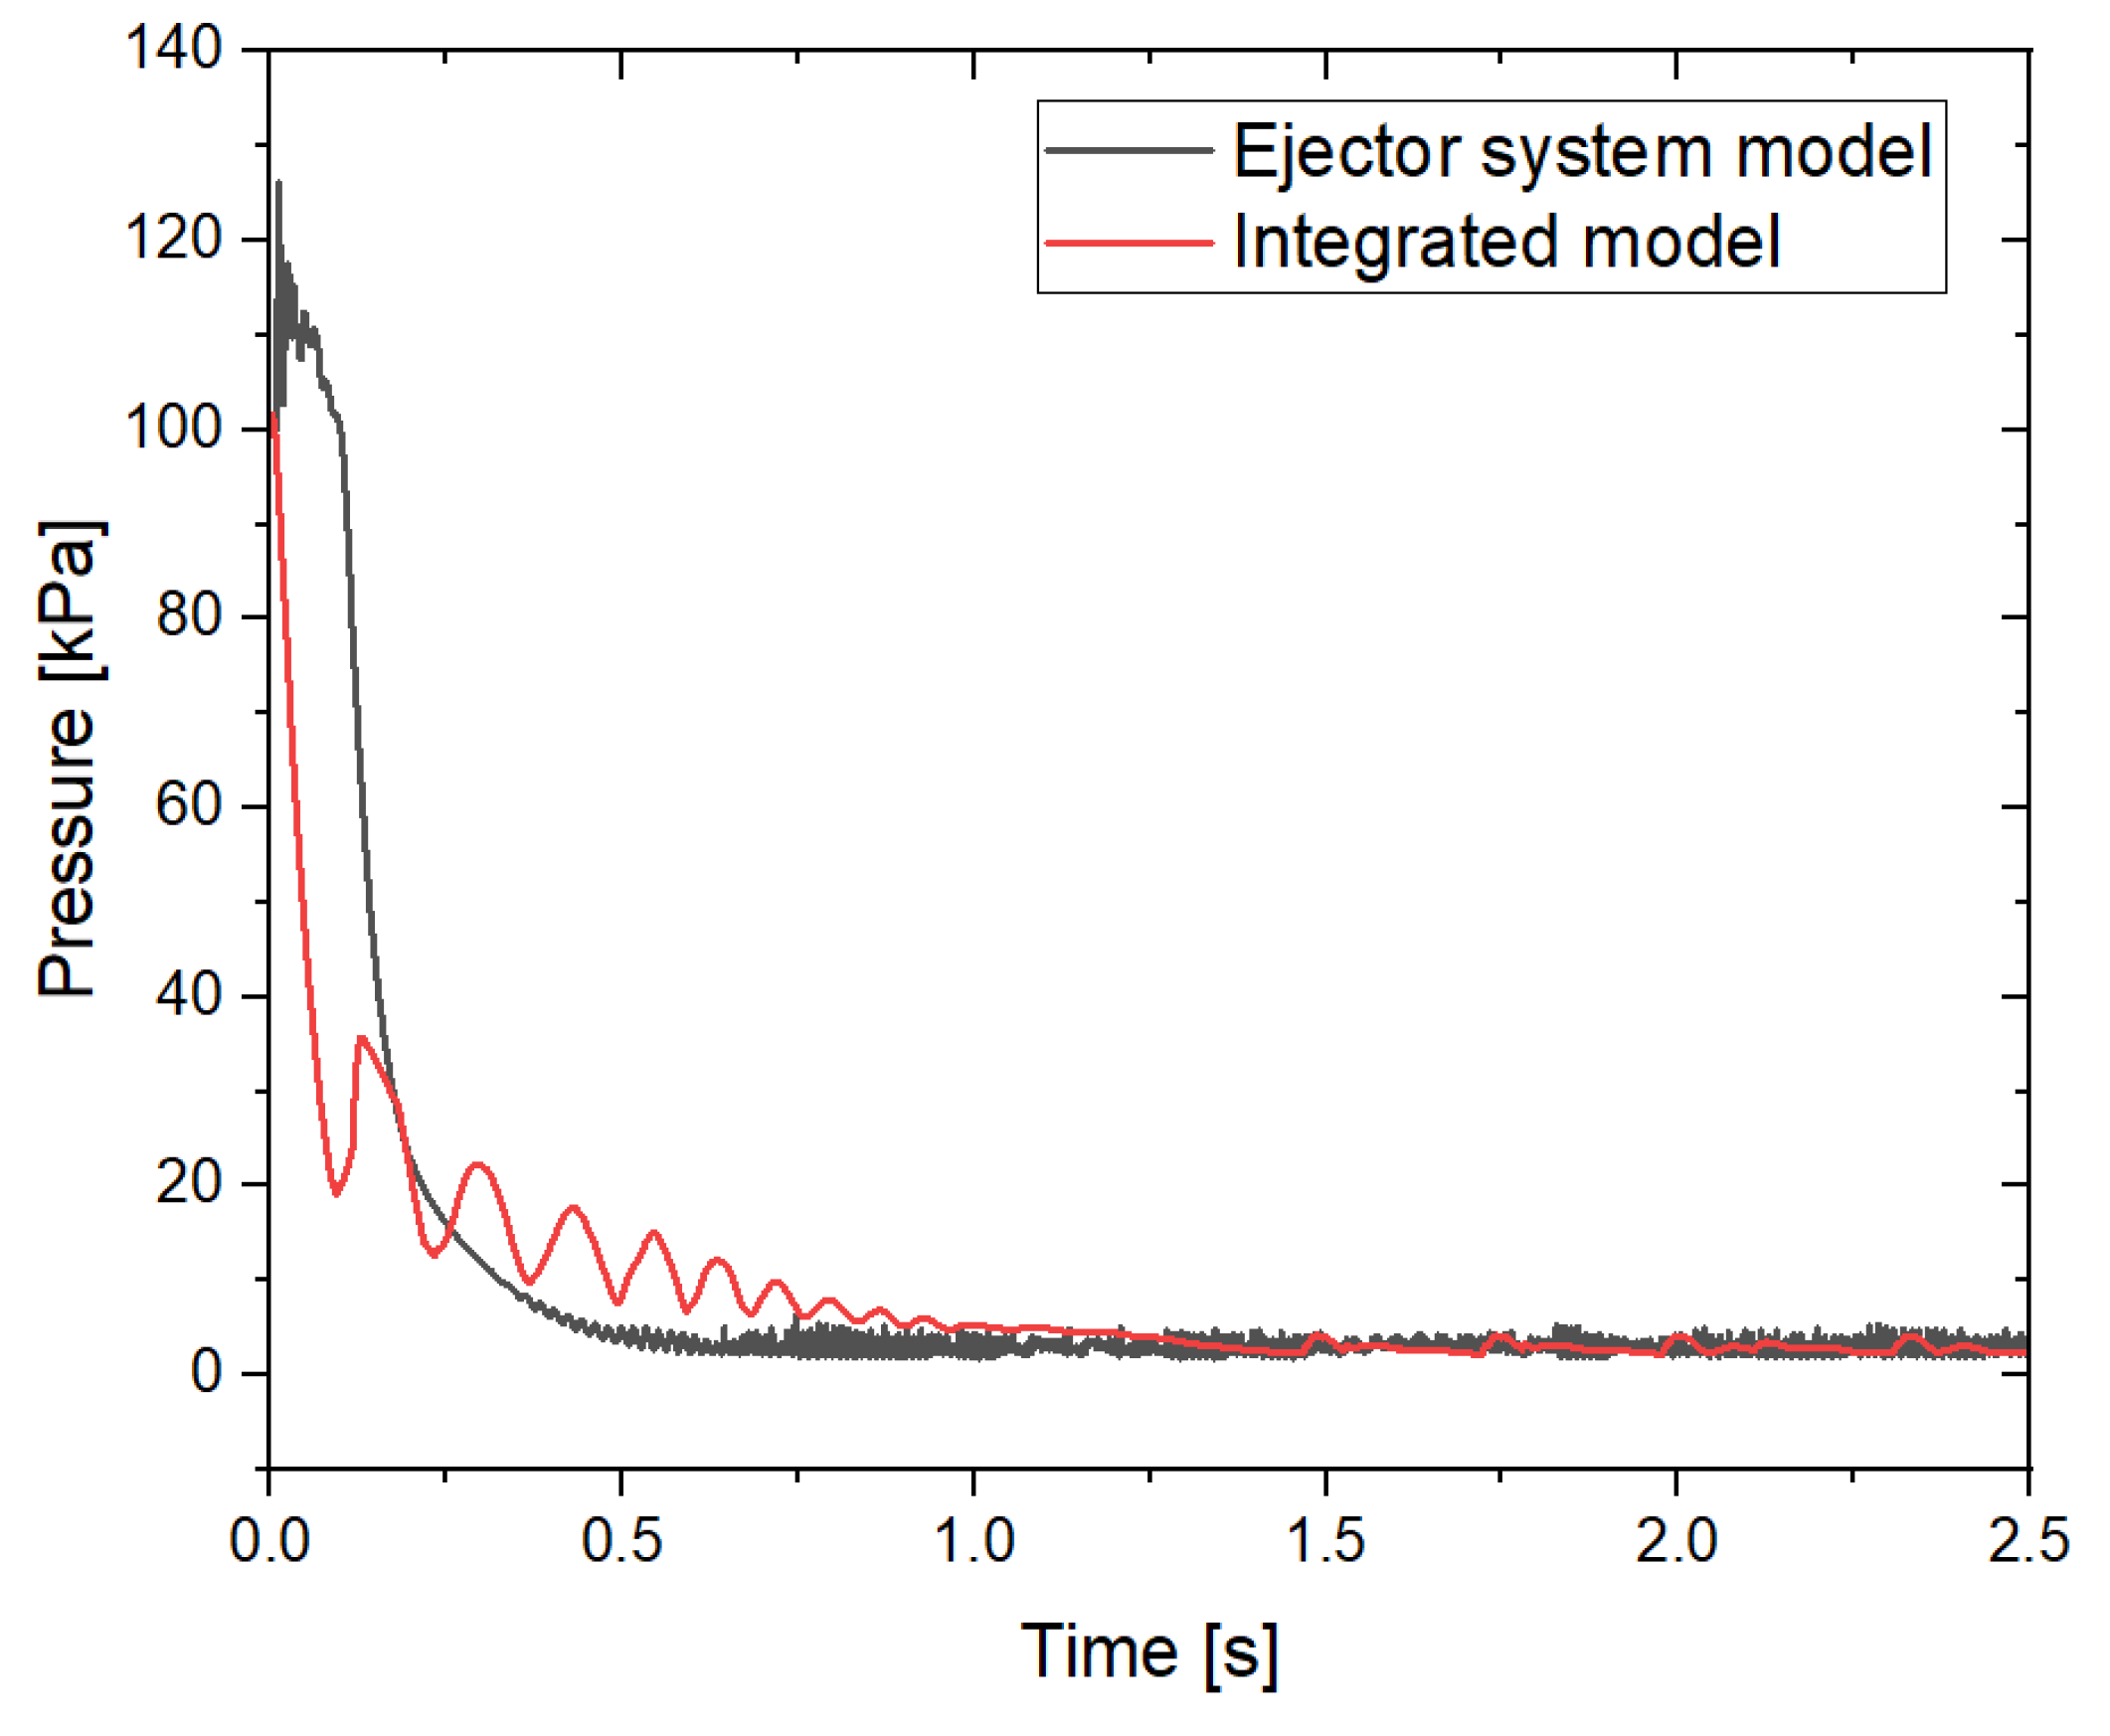
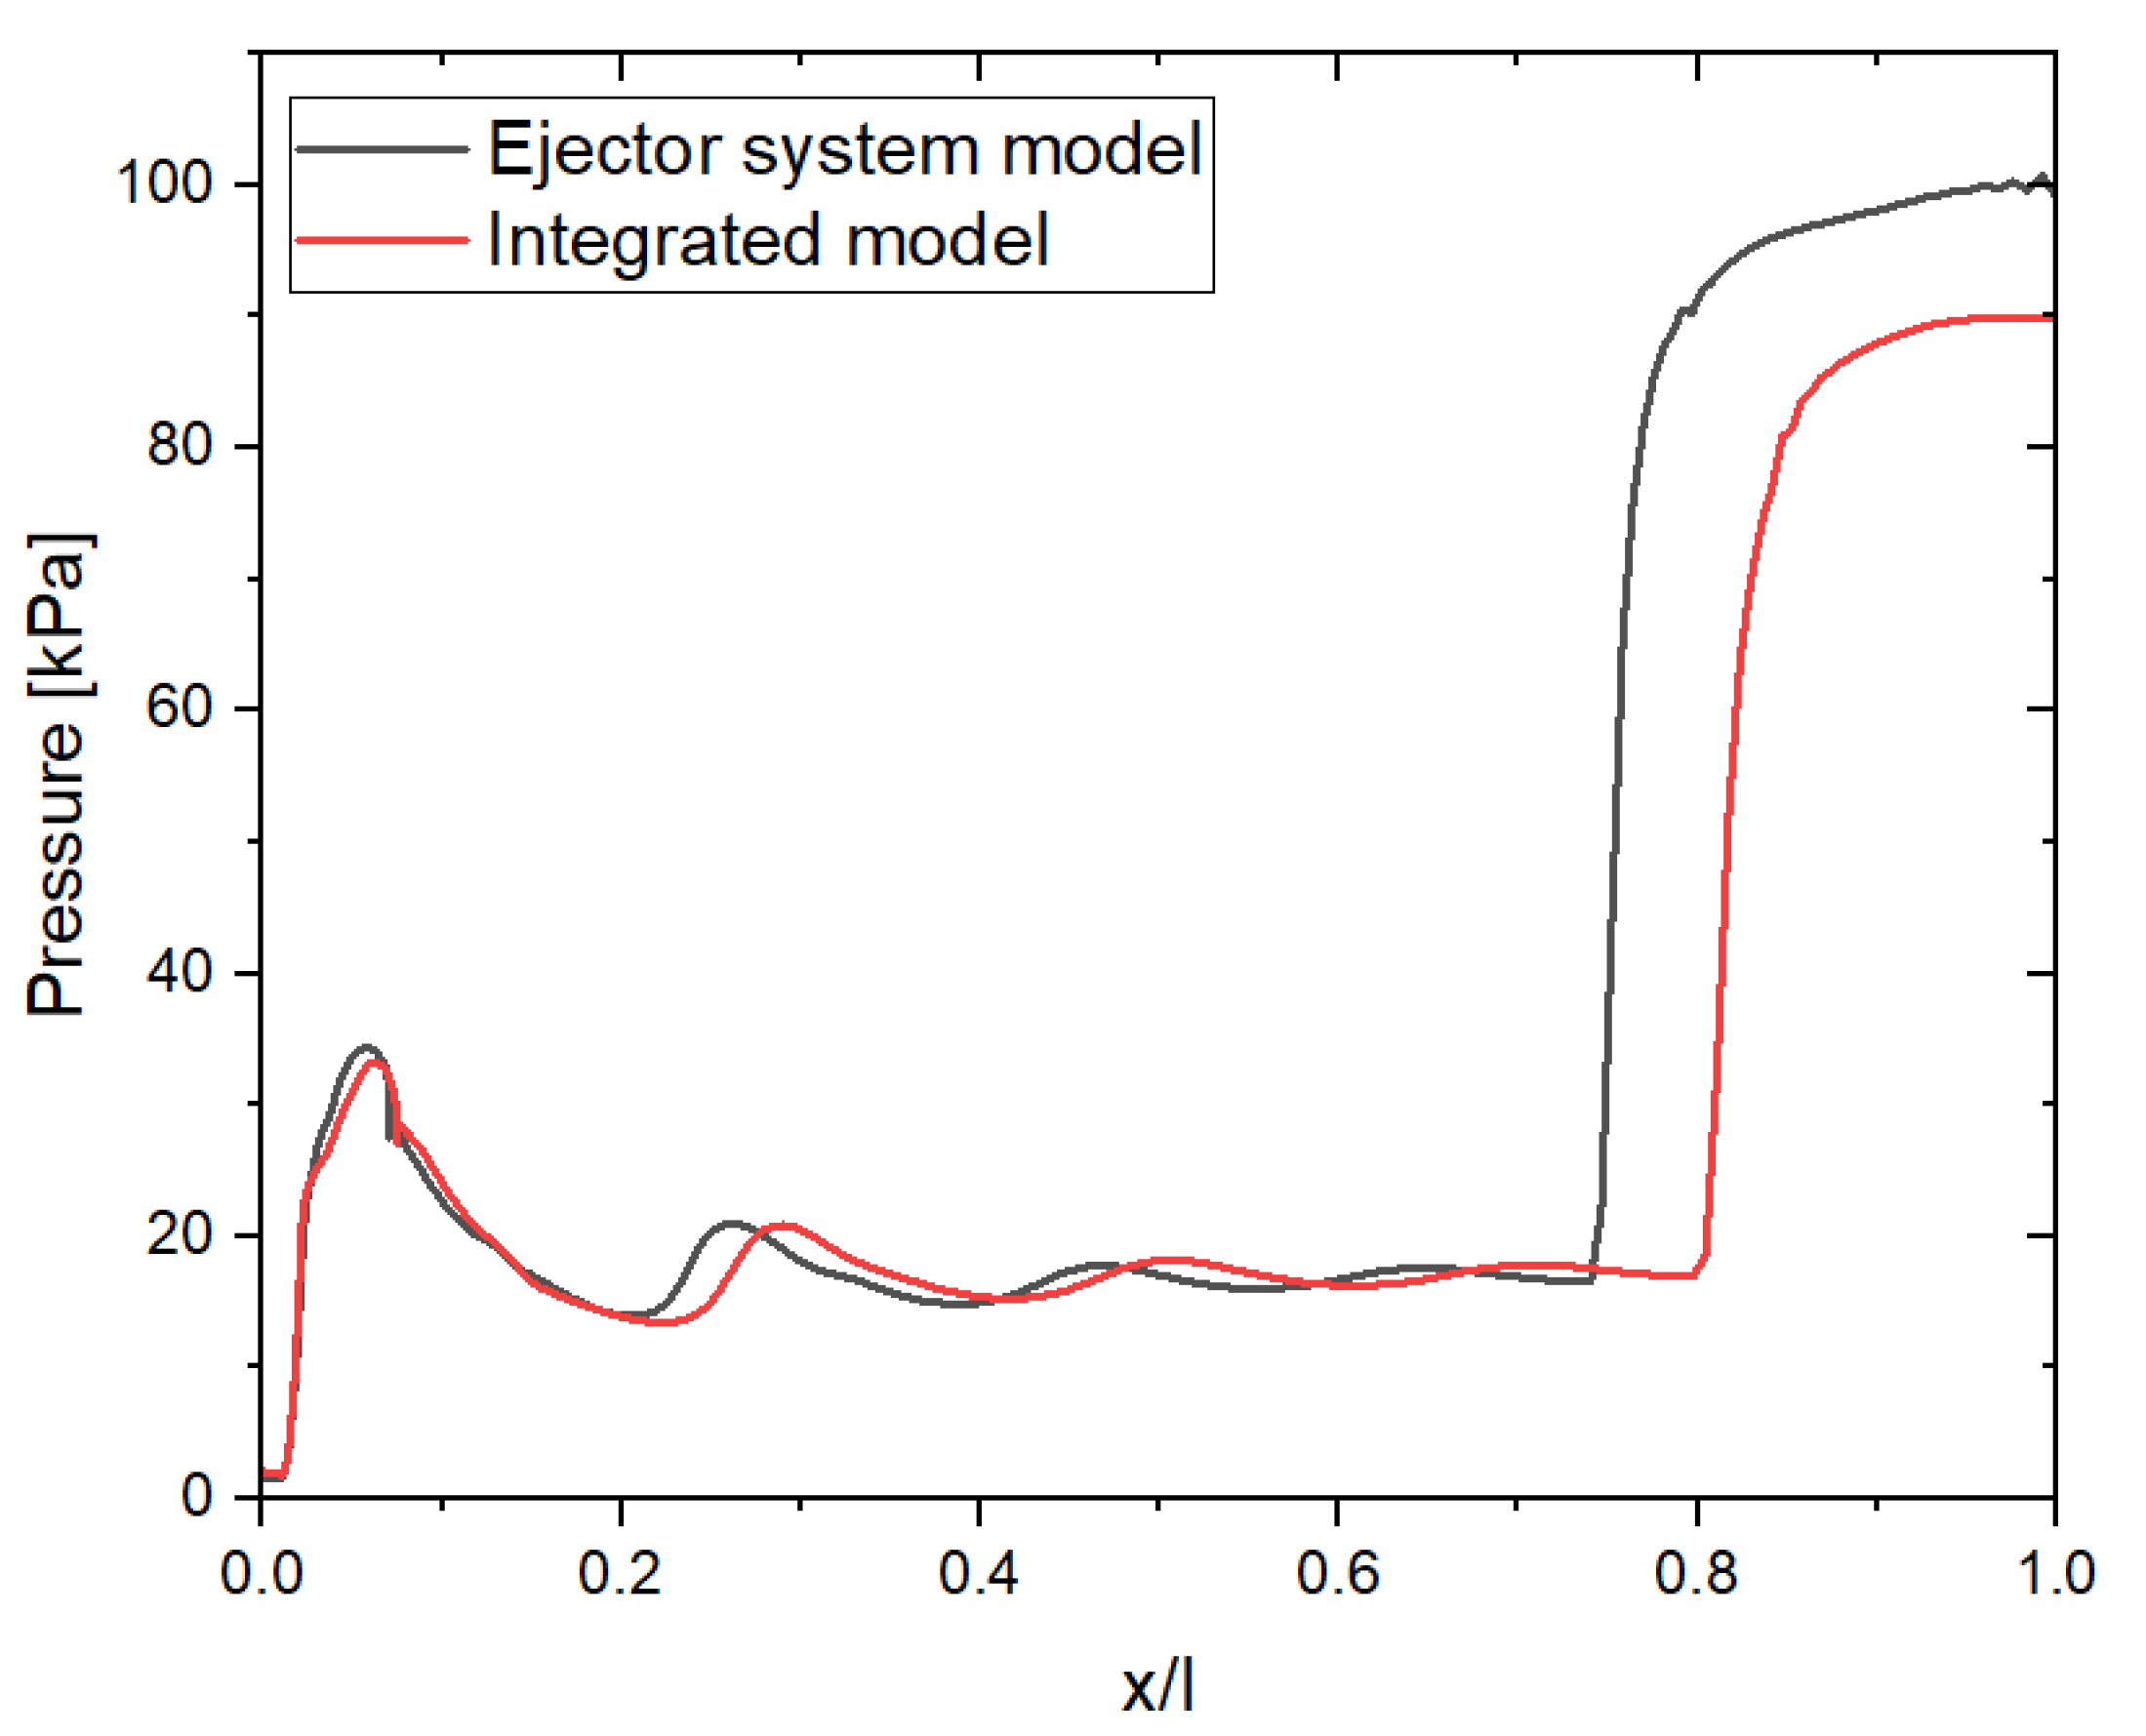
3.1. Integrated and Ejector System Models

Typically, a numerical analysis of the ejector system is performed by setting the flow rate that the ejector needs to intake, and only the ejector system model is analyzed, excluding the engine and supersonic diffuser. To verify the validity of this conventional approach, numerical calculations were conducted and compared for both the ejector system model and the integrated model, which included a rocket engine, a supersonic diffuser, and an ejector system. In addition, because of the thinness of the nozzle tip in the current rocket engine, it was necessary to create a vacuum around the nozzle before startup. To prevent damage to the nozzle from vibrations occurring during startup, an ejector system was used to maintain a vacuum state inside the rocket engine, and a supersonic diffuser was used before ignition.
The calculation conditions were as follows. The rocket engine and supersonic diffuser were set with wall boundary conditions, and only the ejector nozzle was in operation. The Mach contour after 2 s of physical simulation time, when the system was stabilized, is shown in Figure 5. At the tip of the ejector nozzle, the exhaust gas expanded rapidly and collided with the wall of the ejector diffuser inlet, as shown in Figure 5a. The colliding flow then contracted toward the center, increasing the velocity, and a shock train of contraction and expansion formed within the ejector diffuser. The shock train exhibited a vertical flow pattern at the rear end of the ejector diffuser and the boundary of the expansion section, transitioning to a subsonic flow thereafter. The ejector diffuser continuously drew in a large volume of flow; therefore, a light-blue flow was visible along the wall of the ejector diffuser, as shown in Figure 5a. Typically, a supersonic diffuser draws flow from a confined space (chamber A), causing the exhaust flow from the engine nozzle to fill the entire supersonic diffuser. However, in the case of the ejector diffuser, a distinct flow pattern was formed along the walls owing to the dynamics of the incoming suctioned flow. In the suction area (chamber B), shown in Figure 5b, a weak flow pattern was observed owing to the suction from the ejector flow. Figure 5 shows that the overall flow patterns of the two models and the point of the separation region downstream of the ejector diffuser were similar.
To clearly visualize the pressure gradient, the pressure range is shown from 1 kPa to 0.1 MPa in Figure 6. For the integrated model in Figure 6a, the supersonic diffuser from the rocket nozzle was in a vacuum state (dark blue), and for the ejector system model in Figure 6b, chamber B was in a stabilized vacuum state. In both models, the pressure gradient inside the ejector diffuser was caused by the shock train, and at the end of the ejector diffuser, the pressure recovered to atmospheric pressure, along with a strong flow separation. In this case, the integrated and ejector system models exhibited similar results.
The progress of the vacuum in the two models over time is shown in Figure 7. The pressures of the integrated and ejector system models were measured in chambers A and B, respectively. For the ejector system model, pressure variation was observed before 0.05 s, followed by a rapid decrease with a steep gradient. Such initial pressure oscillations were observed in previous studies involving unsteady simulations using a single ejector [11]. In particular, when a rapid-evacuation ejector is employed in high-altitude simulation facilities, these fluctuations occur during the rapid-evacuation phase under extremely low-pressure conditions. During this stage, the pressure ramp-up induces a temporary breakdown of the vacuum, followed by its reestablishment through a hysteresis-driven process. The decrease in pressure became gradual at approximately 0.2 s and stabilized at a constant pressure from 0.5 s onward. In the integrated model, the pressure initially decreased rapidly without variation and then exhibited oscillations starting at 0.09 s. In the integrated model, the substantially larger volume that must be evacuated to establish vacuum conditions led to a delayed manifestation of pressure fluctuation patterns compared with those observed in the ejector system model with a small evacuated volume. The amplitudes of these pressure oscillations decreased over time and no pressure oscillations were observed after 1 s. A constant pressure was maintained from 1.5 s onward. For both models, there was a difference in the pattern of the initial pressure decrease. However, after approximately 1 s, the vacuum pressure (4 kPa) stabilized, and both models showed similar vacuum pressures. As a result, it was confirmed that the ejector system required 1 s to create a pressure of 4 kPa inside the rocket engine and the supersonic diffuser, which reliably maintained a vacuum level lower than 10 kPa, at which separation occurred in the rocket nozzle, as shown in Figure 4.
In Figure 8, the pressures measured along the ejector diffuser wall of both models at 2 s when the vacuum pressure was considered to have been sufficiently stabilized are compared. Both models exhibited the same pressure patterns. At a length ratio (x/l) of 0.1, the pressure increased because of the collision of the expanded flow from the ejector nozzle at the inlet of the ejector diffuser. This was followed by a secondary pressure increase at approximately x/l = 0.3 due to another collision, as shown in Figure 6. Subsequently, the pressure stabilized and rapid recovery to atmospheric pressure was observed near the expansion section of the diffuser.
Previous results have confirmed that the ejector system model exhibits flow patterns similar to those of the integrated model. Therefore, this study focused exclusively on describing the flow characteristics of the ejector system model.

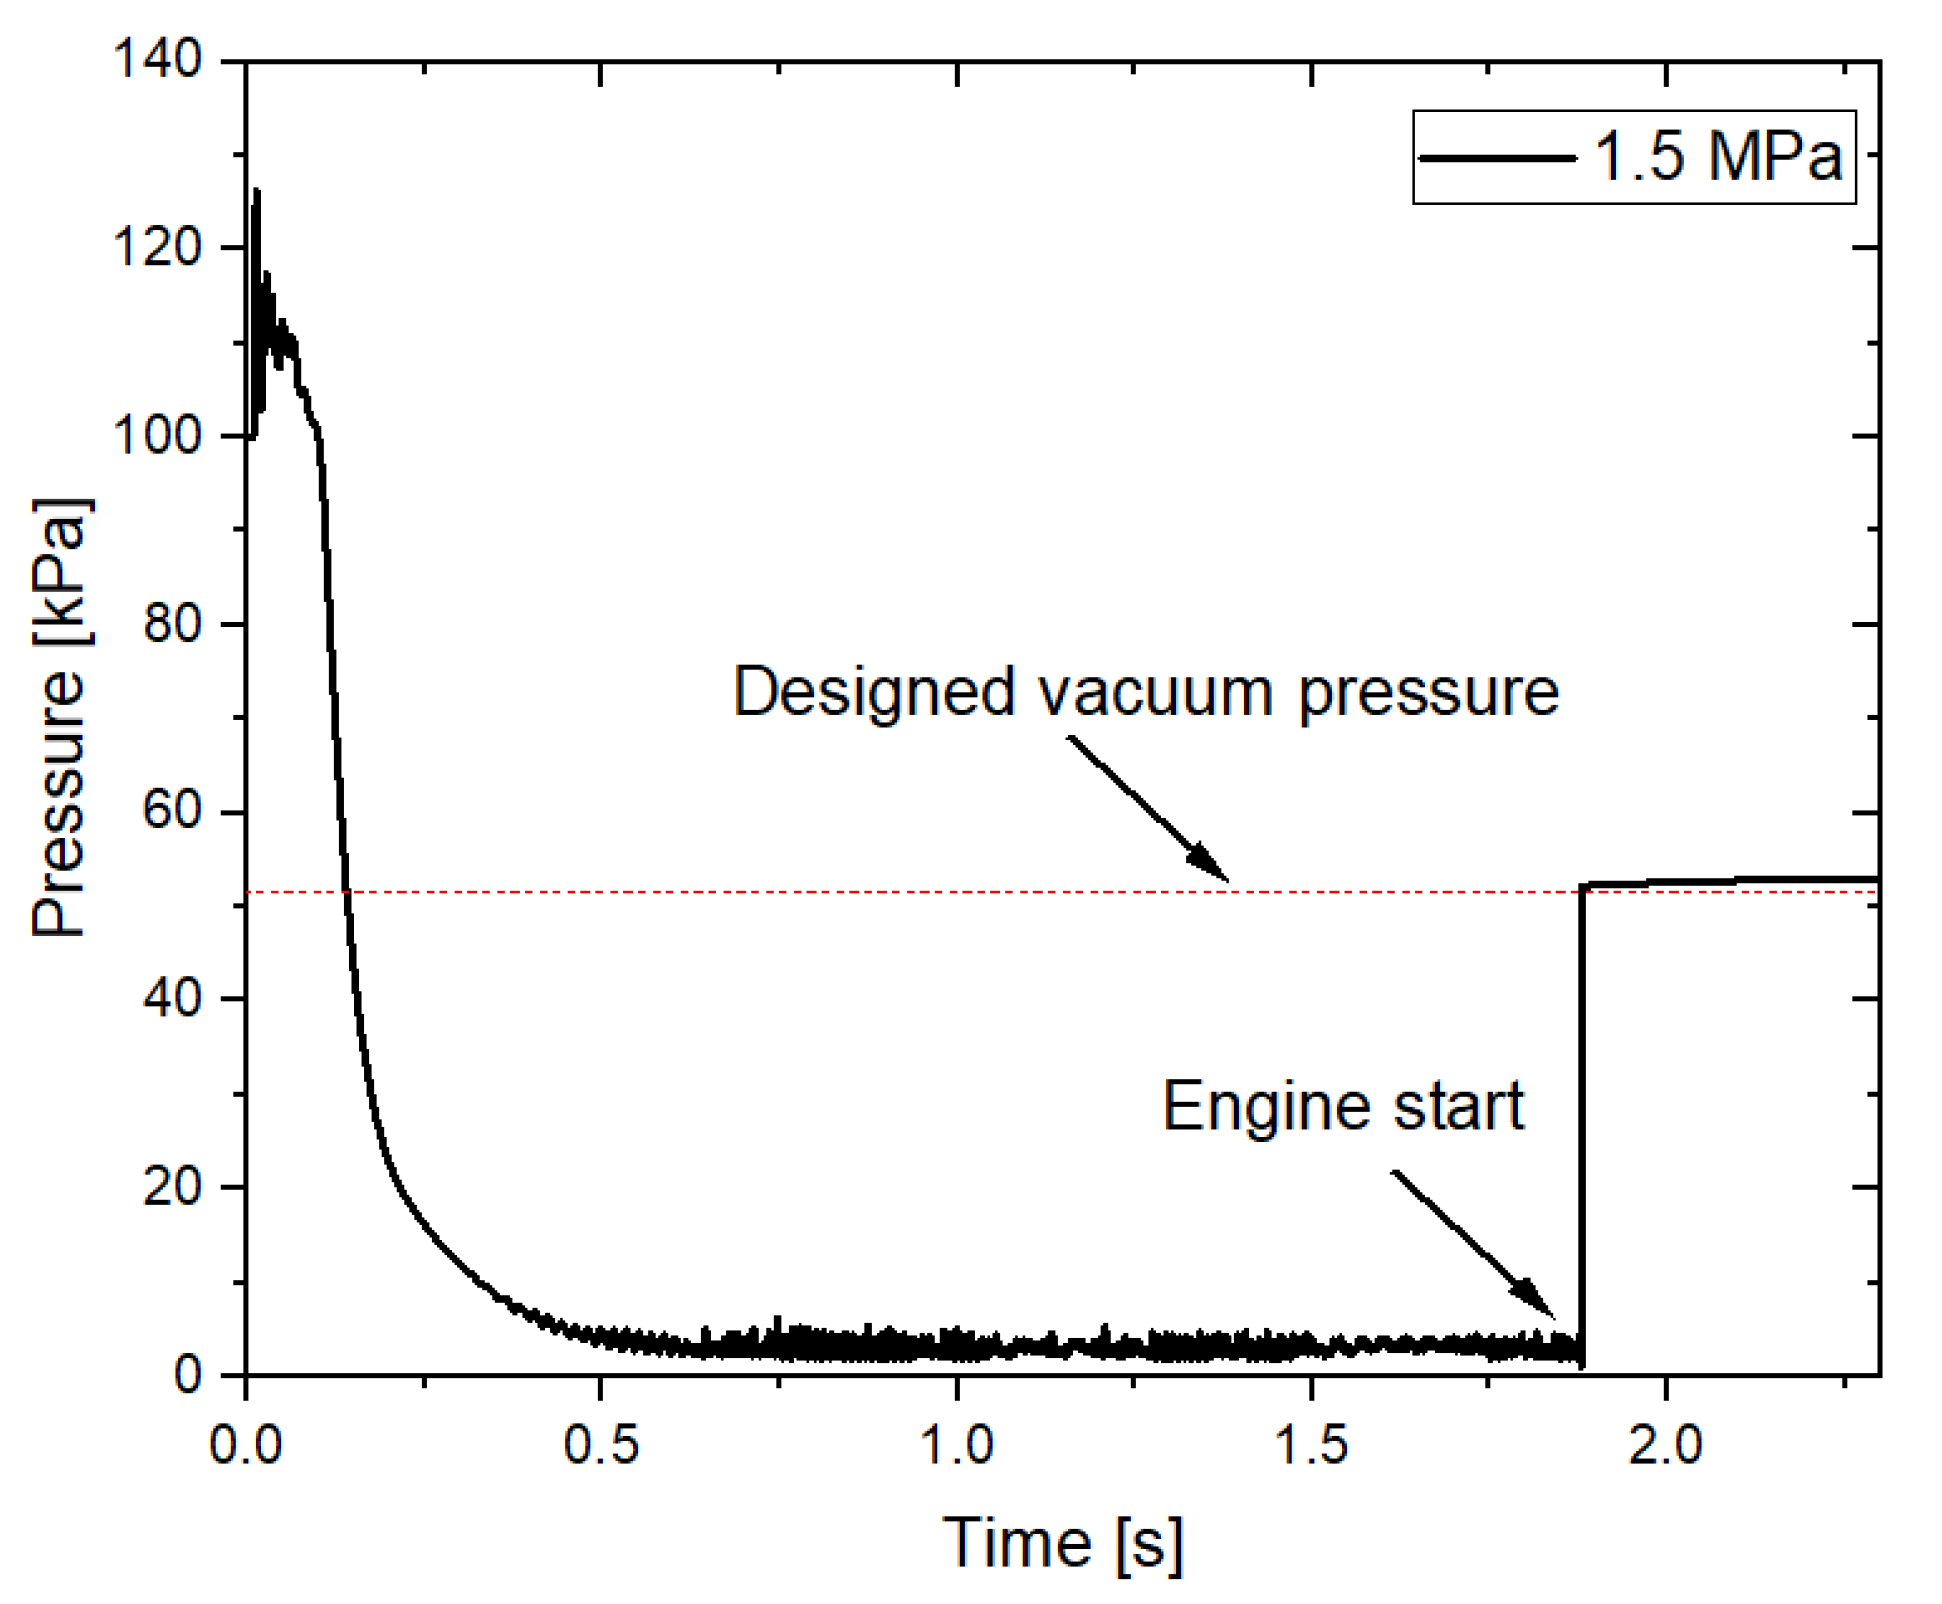
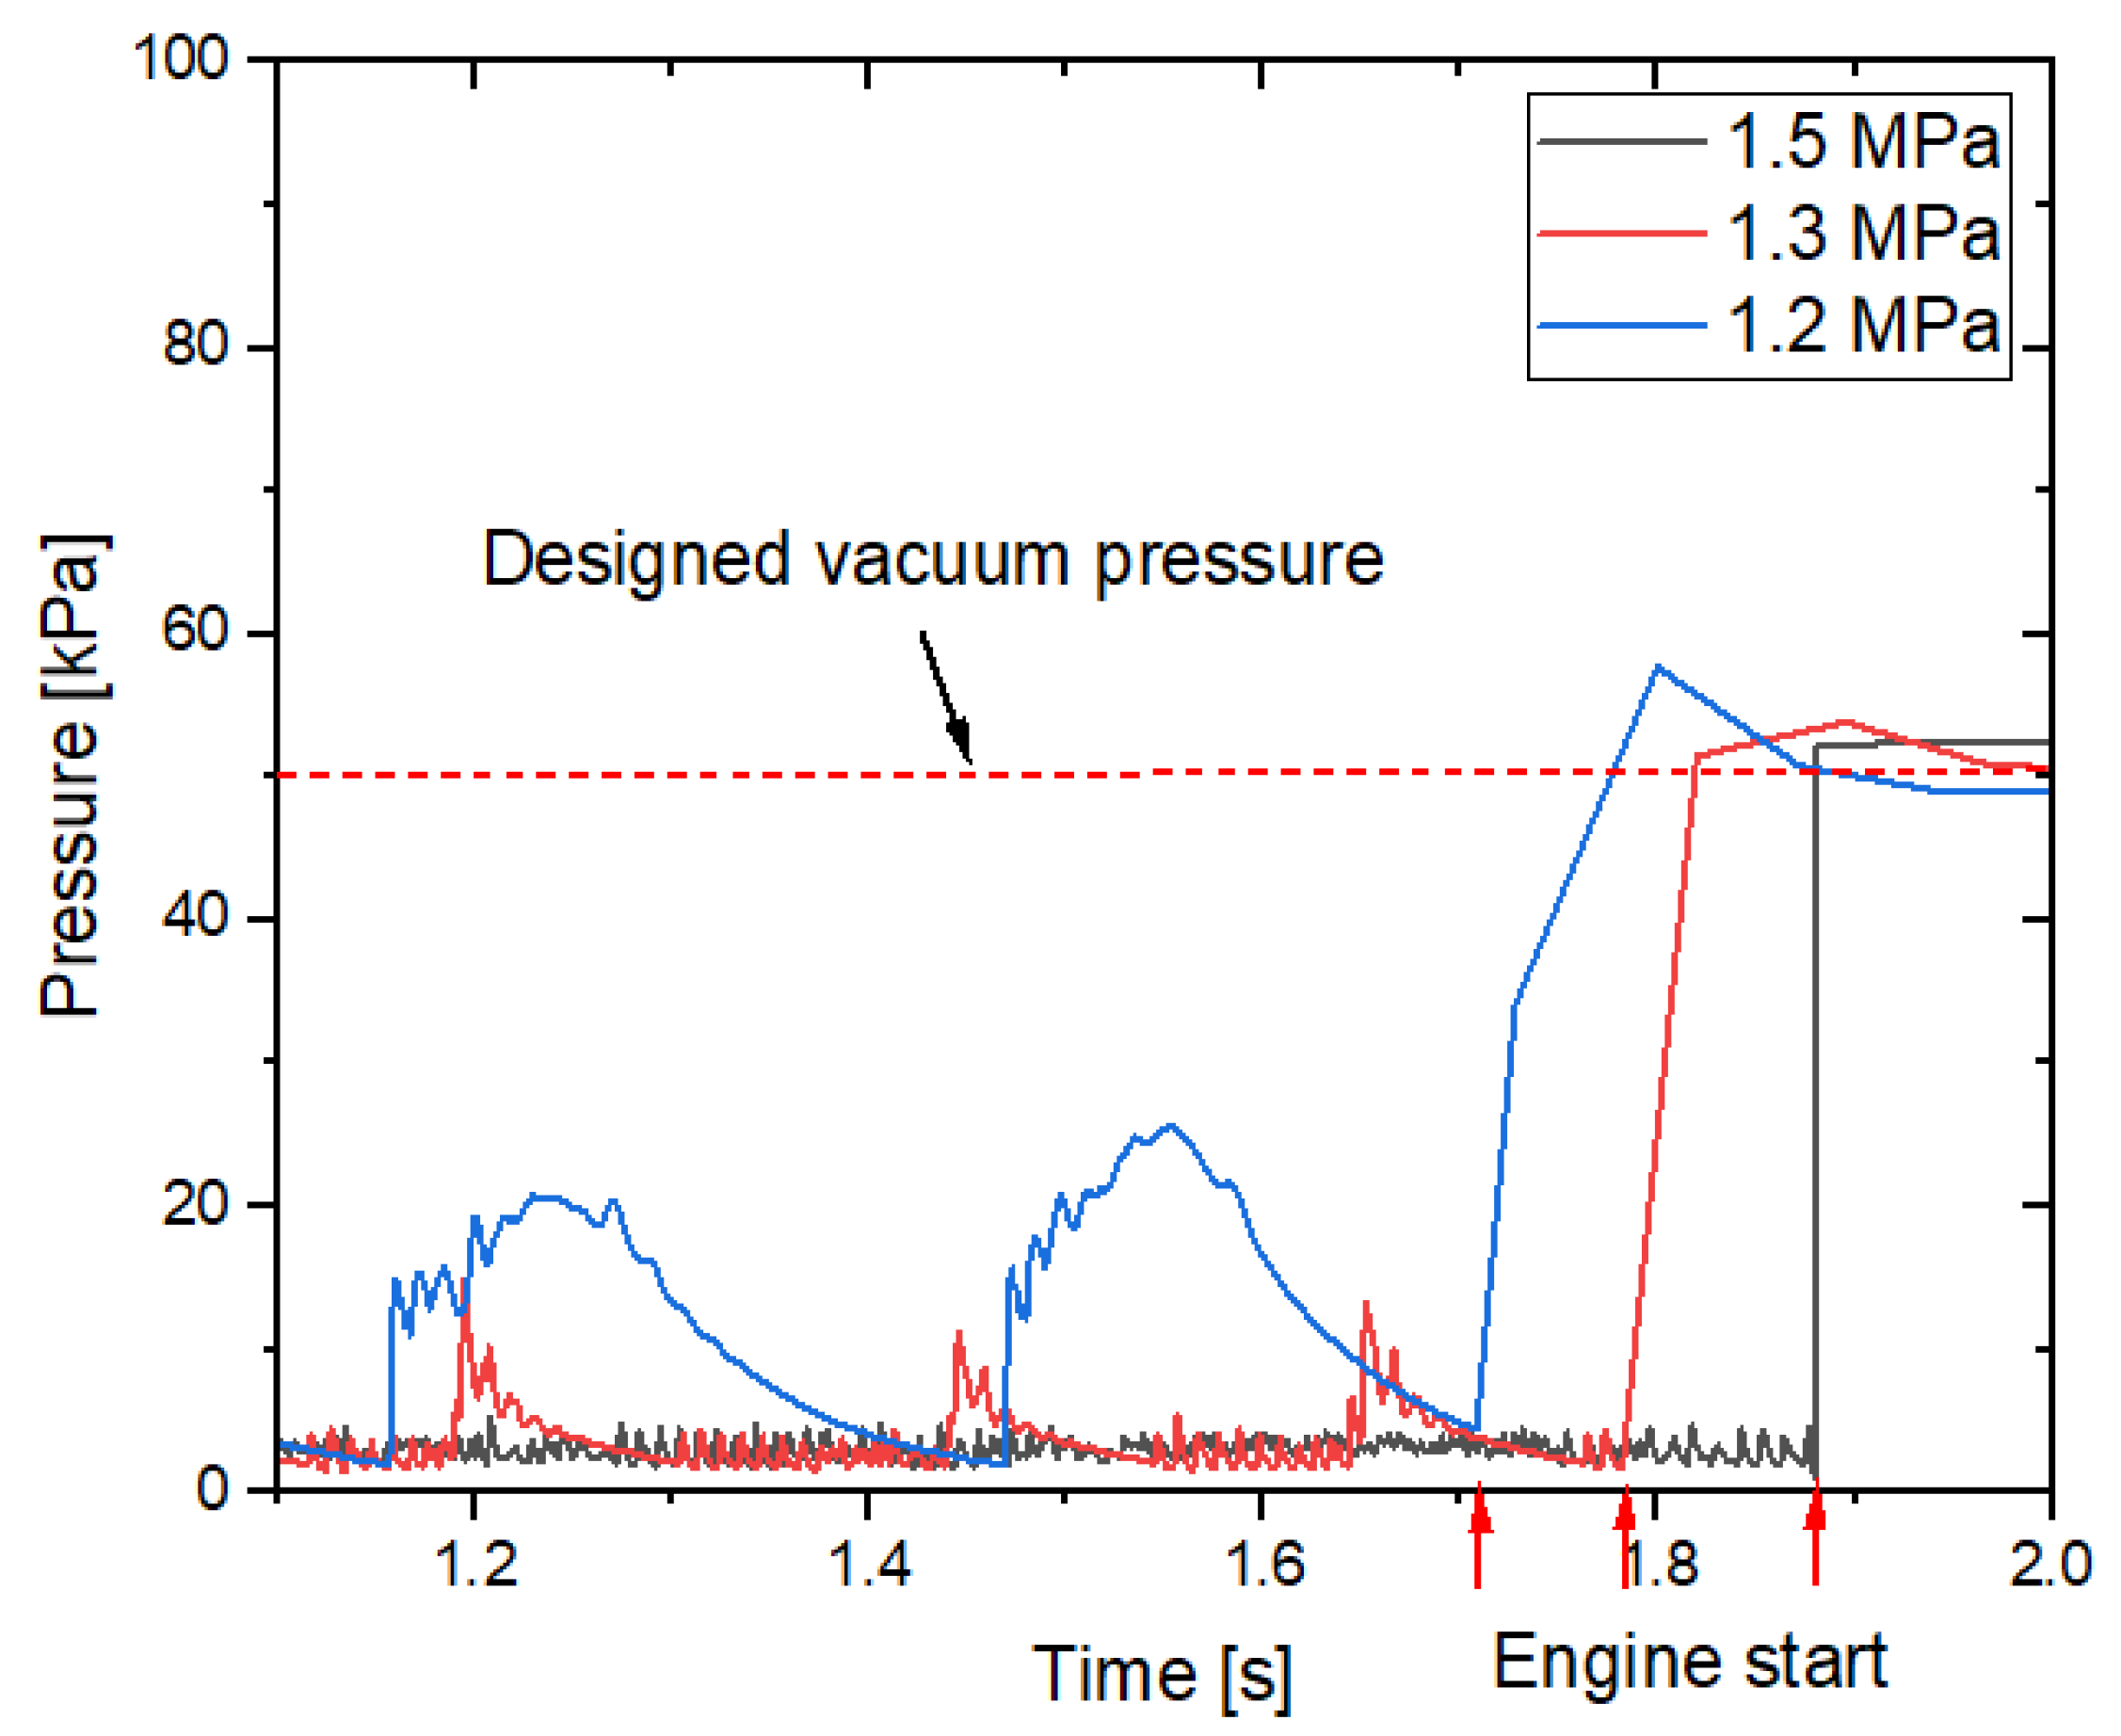
3.2. Initial Vacuum Characteristics Based on the Ejector Nozzle Injection Pressure

The vacuum pressure reduction patterns in chamber B are compared in Figure 9, when the stagnation pressure of the ejector nozzle was decreased from 1.5 MPa under identical calculation conditions. At a supply pressure of 1.5 MPa, the vacuum pressure was remained constant (4 kPa), with a gentle slope after 0.5 s. However, when the supply pressure was reduced to 1.3 MPa, perturbations with a pressure difference of approximately 9 kPa occurred at intervals of approximately 0.4 s, starting from 1 s. As the supply pressure decreased to 1.2 MPa, pressure perturbations started at 0.5 s. The initial peak pressure was approximately 40 kPa but was sustained at approximately 20 kPa.
The third pressure perturbation in Figure 9, at a supply pressure of 1.2 MPa, is shown in Figure 10. The pressure initially decreased (1) and then suddenly increased (2), followed by pressure oscillations and a slow increase (3). The increasing pressure steadily decreased (4) before repeating the pattern of pressure increase.
The changes in the Mach number flow related to the pressure variations shown in Figure 10 are illustrated in Figure 11. During the pressure decrease phase (1), the flow ejected from the ejector nozzle contacted the ejector diffuser wall but barely filled the rear section of the diffuser. The shock train flow then remained detached from the diffuser wall. Under steady operating conditions, the pressure induced by the nozzle flow of the ejector was balanced with the pressure in chamber B. However, when the pressure in chamber B decreased below a critical threshold, this pressure ratio was no longer maintained. As a result, a reverse flow into chamber B occurred, as shown in Figure 11, leading to a subsequent increase in pressure. In the phase in which the pressure suddenly increased (2), the exhaust flow from the ejector nozzle in contact with the diffuser wall collapsed, leading to a strong flow disturbance in chamber B. The flow injected from the ejector nozzle began to stabilize again (3). A flow passage was formed between the injection flow and diffuser wall, through which the flow in chamber B was discharged in the downstream region. In addition, the expanded flow from the ejector nozzle approached the diffuser wall more closely. The flow passage between the diffuser wall and ejector nozzle narrowed, and the flow, which initially appeared bright blue (3), became less distinct and faded owing to the reduction in the intake flow rate from chamber B (4). The flow pattern in (4) returned to that in (1). This repeated cycle from (1) to (4) caused a pressure perturbation, as shown in Figure 9.
The flow vector patterns at points a and b in Figure 11 are shown in Figure 12. As shown in Figure 12a, multiple recirculating flows were formed in chamber B and around the ejector nozzle exit, and the flow moved actively. In addition, the flows were exchanged through a narrow flow passage, and a recirculation zone developed downstream of the expanded flow from the ejector nozzle. As shown in Figure 12b, most of the flow moved downstream from chamber B through a narrow flow passage.

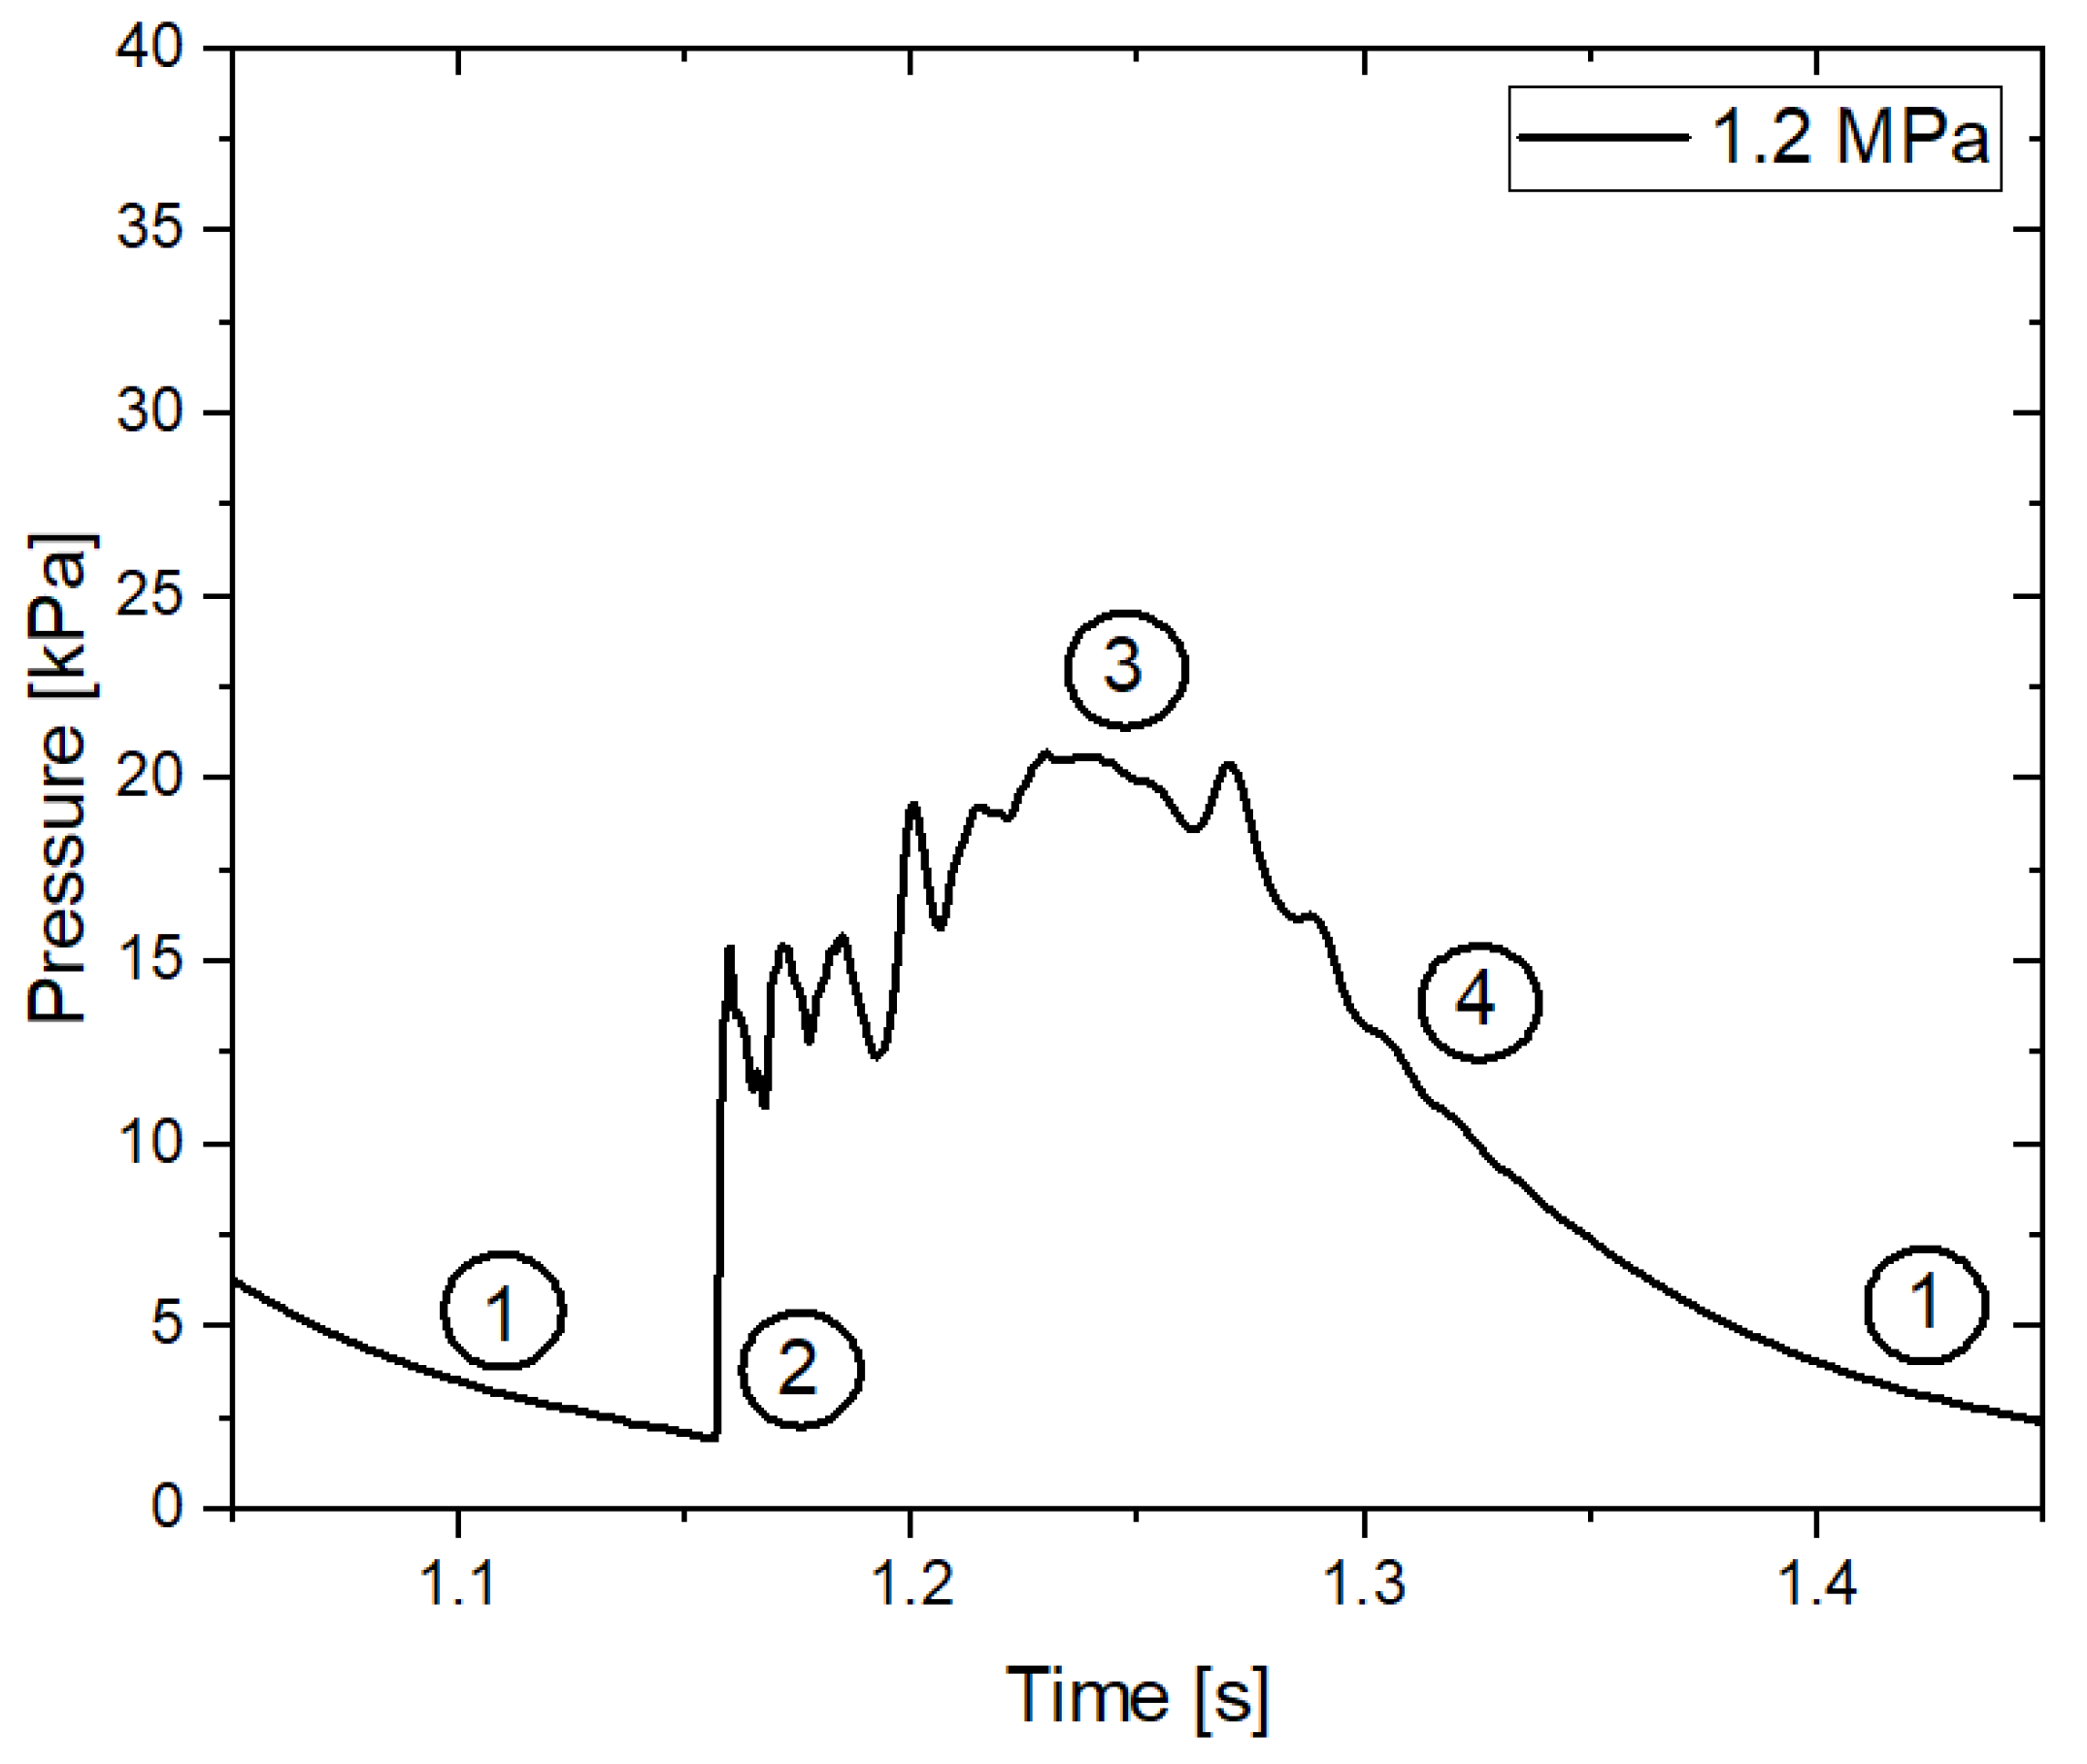
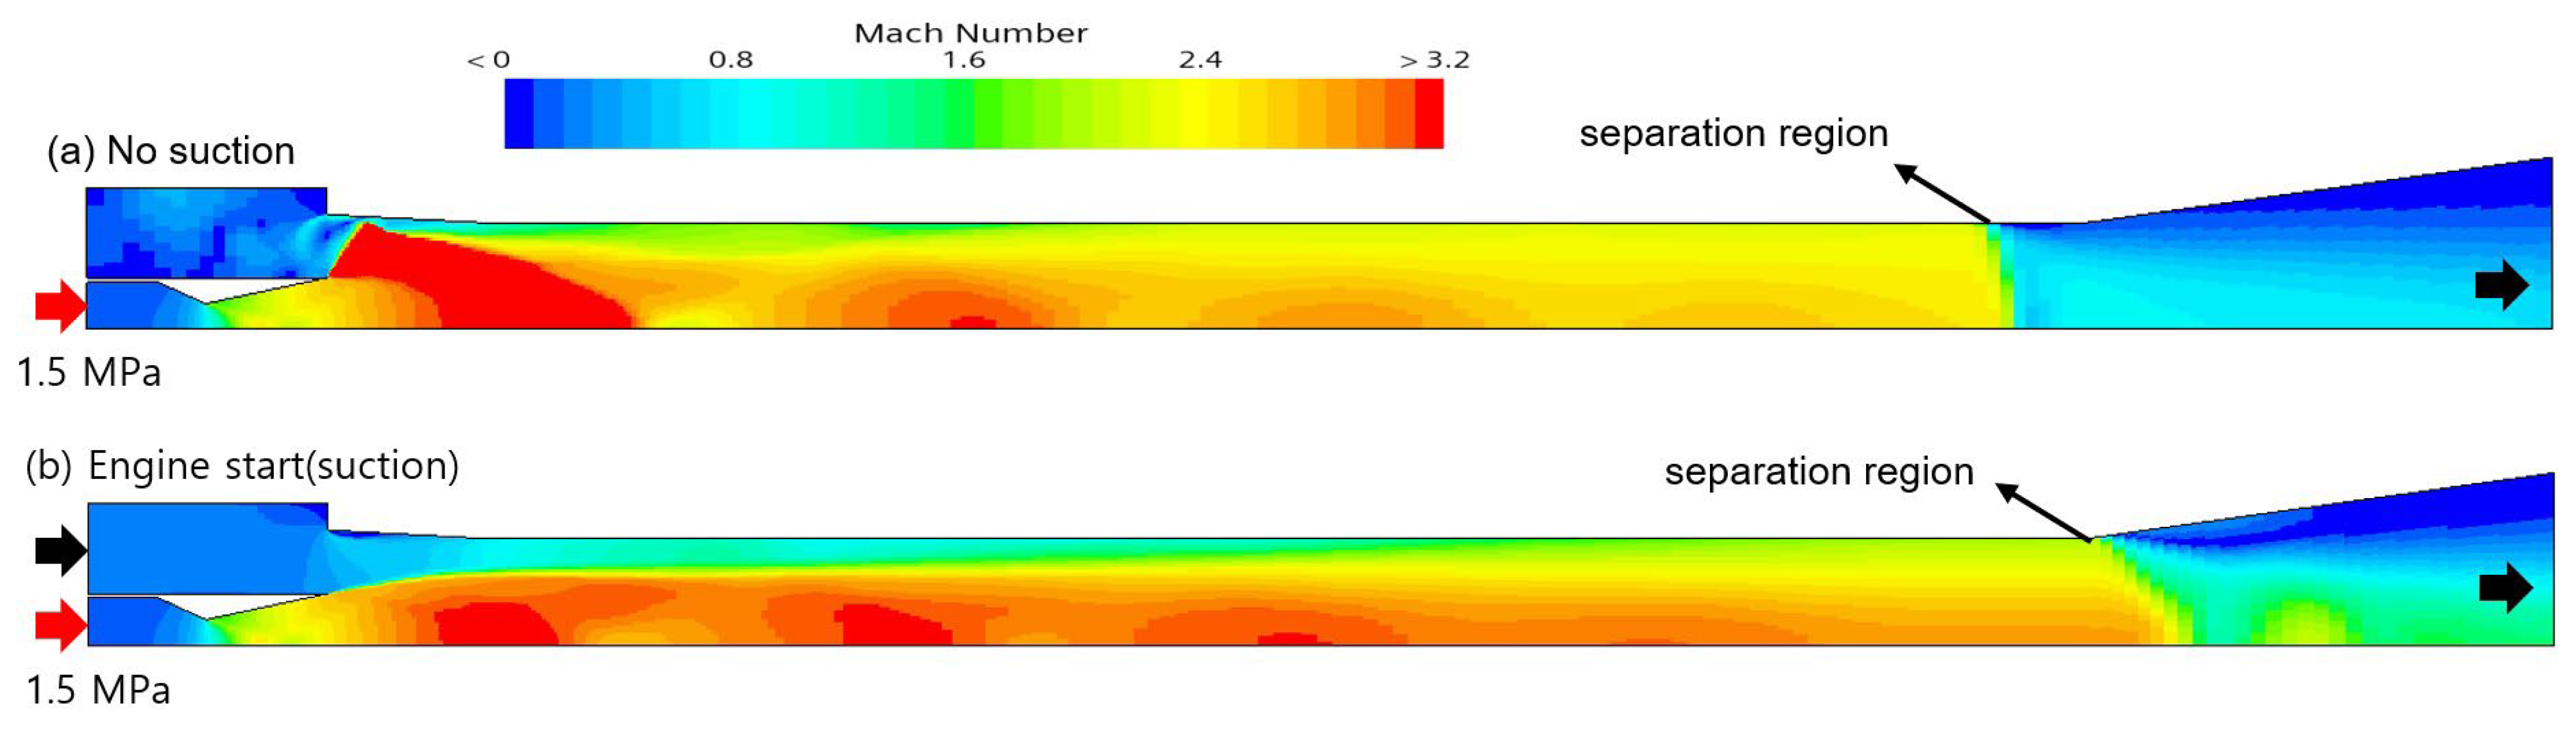
3.3. Ejector System Characteristics During Rocket Engine Startup

After the internal vacuum pressure of the ejector stabilized at 4 kPa for a supply pressure of 1.5 MPa, the rocket engine was started, and a large flow of fluid entered the ejector. The pressure distributions over time under these conditions are shown in Figure 13. Once the rocket engine was started, the pressure was increased vertically to a designed vacuum pressure of 50 kPa and remained constant. This confirms that the ejector can immediately maintain the designed vacuum pressure under the specified flow rate conditions.
Before the rocket engine started, the flow ejected from the ejector nozzle exhibited a large expansion angle, as shown in Figure 14a. The flow beyond the expansion angle of the nozzle collided with the ejector diffuser inlet at an extremely high speed. The flow that hit the diffuser wall moved toward the center of the ejector diffuser and formed a shock train. The flow ejected from the ejector nozzle filled the diffuser and moved downstream. Before the start of the expansion section, the flow separated from the separation surface perpendicular to the flow direction, leading to a rapid transition from supersonic to subsonic speeds. However, when the rocket engine and flow intake began, the flow ejected from the ejector nozzle expanded smoothly along the nozzle expansion angle, as shown in Figure 14b. A consistent flow passage was formed between the expanded flow boundary and ejector diffuser wall, which narrowed downstream and then mixed as it approached the expansion section. This space acts as an aerodynamic throat that is relevant to flow suction. While the expansion section exhibited a vertical separation surface and an abrupt flow change in the absence of the intake flow in Figure 14a, after the rocket engine started, flow separation began at the beginning of the expansion sector, resulting in a gradual slope surface and transition from supersonic to subsonic flow, shown in Figure 14b.
Figure 15 compares the ejector diffuser wall pressures before and after rocket engine startup. Before the rocket engine was started, the pressure was 4 kPa, which rapidly increased to 35 kPa at x/l = 0.05, and then decreased. At x/l = 0.2, the pressure increased again owing to the influence of the shock train and exhibited weak pressure fluctuations as it moved downstream, stabilizing at approximately 20 kPa. In the separation region (x/l = 0.7), the pressure exhibited a sharp increase and recovered to atmospheric pressure. In contrast, when the rocket engine was operating, the pressure started at approximately 42 kPa, increased to 49 kPa at x/l = 0.03, and then decreased until x/l = 0.17. Subsequently, the pressure exhibited a fluctuating pattern owing to the shock train before stabilization. At x/l = 0.8, the pressure decreased suddenly owing to rapid expansion but eventually recovered to atmospheric pressure.
Before the rocket engine started, the Mach number along the centerline increased to Mach 3.8 at x/l = 0.16 due to over-expansion, as shown in Figure 16. The Mach number decreased sharply to Mach 2.2 at x/l = 0.2, then increased to Mach 3.1 at x/l = 0.32, and subsequently exhibited a steady pattern with weak fluctuations and decreased before decreasing sharply at x/l = 0.76, transitioning to a subsonic Mach number below 1. When the rocket engine was running, the Mach number increased to Mach 3.3 at x/l = 0.12, and then decreased to Mach 2.73 at x/l = 0.17 before increasing again. As it moved downstream, the Mach number exhibited a fluctuating pattern; however, overall, the Mach number tended to be higher than that before rocket engine startup. At x/l = 0.8, the Mach number decreased significantly but remained supersonic with fluctuations, remaining above Mach 1.

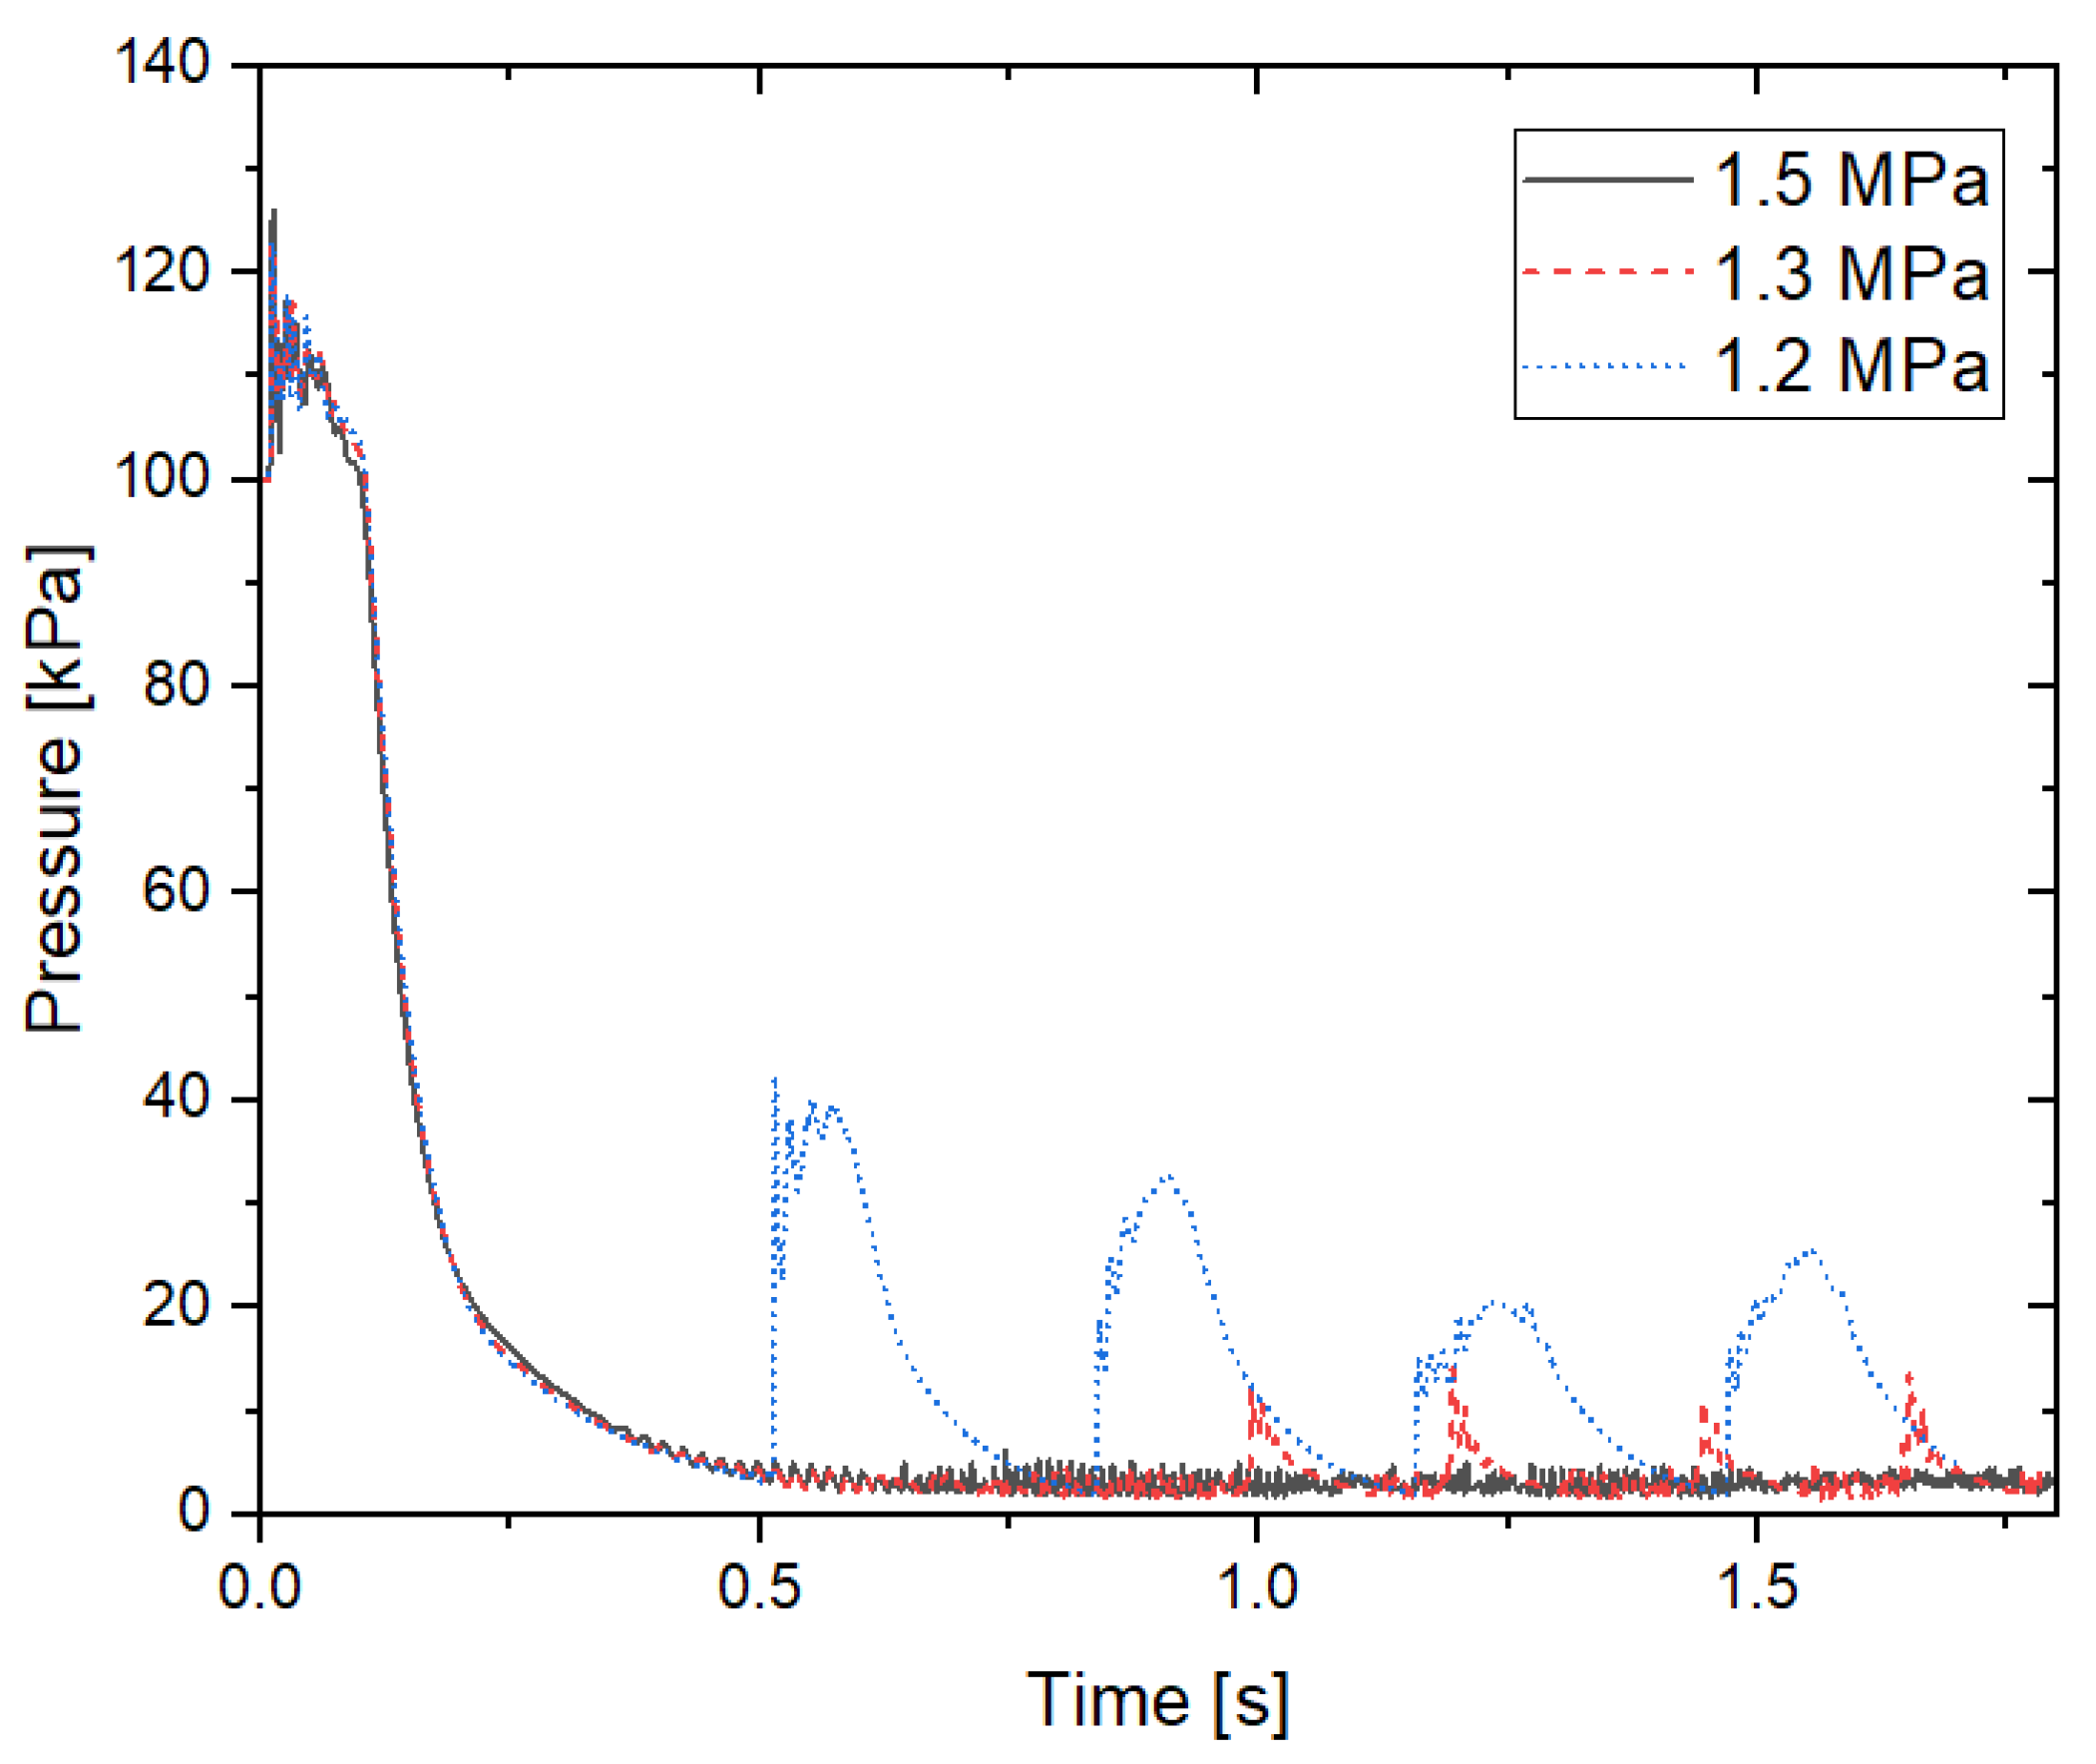
3.4. Ejector System Characteristics According to the Supply Pressure Difference

At an injection pressure of 1.5 MPa, after the vacuum pressure inside the ejector diffuser was stabilized and the engine started, the pressure increased to the design pressure and remained steady. Figure 17 shows how the pressure changed after the engine started for the ejector injection pressures of 1.3 and 1.2 MPa, which exhibited pressure perturbations before the engine started. For an ejector injection pressure of 1.5 MPa, the pressure increased vertically upon engine startup and then remained constant. For an ejector injection pressure of 1.3 MPa, the pressure increased with a gentle slope upon engine startup, showing a slight overshoot before stabilizing at the design vacuum pressure (50 kPa). For an ejector injection pressure of 1.2 MPa, unlike the other two cases, the pressure increase curve exhibited a single inflection point upon engine startup. This was speculated to be due to an insufficient intake performance, which caused a reduction in the slope. After the overshoot, the pressure stabilized. Although there were differences in the transition process from the initial vacuum pressure to the designed vacuum pressure, all three ejector-injection cases maintained a constant pressure within the designed pressure range.
Figure 18 shows the Mach number distribution inside the ejector diffuser at different injection pressures. At the ejector injection pressure of 1.5 MPa, flow separation occurred at the start of the expansion section. When the ejector injection pressure was reduced to 1.3 MPa, there was a limited change in the flow near the inlet of the ejector diffuser. However, the flow separation region shifted toward the front of the horizontal section of the ejector diffuser. After separation, a shock train still existed along the centerline, but disappeared as it moved downstream into the expansion section. When the ejector injection pressure was further reduced to 1.2 MPa, the flow separation region shifted further toward the front of the horizontal section of the ejector diffuser. Apart from the movement of the separation region, no significant differences in the flow were observed compared with previous cases.
Figure 19 shows the wall pressure distribution of the ejector diffuser at different ejector injection pressures. At an ejector injection pressure of 1.5 MPa, the pressure increased sharply in the flow separation region, which was at the end of the ejector diffuser, and subsequently recovered to atmospheric pressure. Although there were slight differences in pressure due to flow perturbations from the starting point to the separation point of the ejector diffuser, the overall pressure patterns were similar across the different ejector injection pressures.
Figure 20 shows the Mach number distribution along the centerline for different ejector-injection pressures. For an ejector injection pressure of 1.5 MPa, the Mach number decreased gradually with the oscillation and then decreased sharply at the separation point (x/l = 0.82), followed by a strong single-amplitude peak. For the ejector injection pressures of 1.3 and 1.2 MPa, the Mach number patterns were generally similar. The Mach number decreased with the oscillations and experienced a sharp decrease at the separation point, followed by a continuous decrease with a strong oscillatory pattern. In all three cases, the Mach number remained greater than 1 at the end of the ejector diffuser.

4. Conclusions

A computational fluid dynamics (CFD) analysis of an ejector nozzle and diffuser used gases intended for engine combustion tests. The design of an ejector generally involves determining the shape of the ejector nozzle and the injection pressure to match the required intake flow rate and vacuum conditions. Suction is then created by the flow structure formed within the ejector diffuser. In this study, an ejector nozzle and a diffuser were designed to handle a flow rate of 122 kg/s and maintain a vacuum pressure of 50 kPa at the exit of a supersonic diffuser with a design injection pressure of 1.5 MPa. However, data on the ejector performance for creating initial vacuum conditions are scarce. Therefore, this study performed a CFD analysis of the initial vacuum pressures at the design pressures of 1.5, 1.3, and 1.2 MPa. When comparing the integrated model of the rocket engine to the ejector diffuser with the single-ejector model, it was observed that both models exhibited the same vacuum pressure values once stabilized.
During the transition process to achieve vacuum, there were differences in the pressure decrease between the two models. However, once the vacuum pressure stabilized, both models exhibited the same vacuum pressure values, indicating that the results from the single-ejector model closely predicted those from the integrated model.
In the single-ejector model, when the ejector injection pressure was reduced below the designed value, the vacuum pressure did not stabilize and exhibited perturbations, the magnitude of which increased as the injection pressure decreased. Analysis of the flow in the perturbation region revealed that the exhaust gases injected from the ejector nozzle formed a flow structure that facilitated suction by approaching the ejector diffuser wall. However, to maintain a vacuum pressure of 4 kPa, the momentum of the exhaust flow from the ejector nozzle was insufficient, which caused the flow structure to collapse and allowed the downstream flow to mix with the forward flow. The exhaust gas flow then re-expanded toward the diffuser wall, creating suction, and this cycle of collapse and expansion was repeated at a vacuum pressure of 4 kPa. To prevent this, the injection pressure of the ejector had to be increased to maintain a low initial vacuum pressure.
When the engine was started, the vacuum pressure in the suction area increased from a very low initial pressure of 4 kPa to the designed vacuum pressure of 50 kPa and remained stable. Before engine startup, the flow around the ejector nozzle expanded rapidly; however, once the engine was running and the flow was supplied, the flow around the ejector nozzle expanded more gradually. Additionally, the continuous flow supply in the suction section created a region where the flow from the ejector nozzle and the suction flow around the ejector diffuser wall coexisted. This led to complete mixing at the exit of the ejector diffuser, with flow separation occurring at the end of the ejector diffuser and pressure recovery to atmospheric levels in the expansion section.
In the cases where the ejector injection pressures were 1.3 and 1.2 MPa, which initially exhibited unstable pressure patterns before the engine started, the vacuum pressure increased to the designed value of 50 kPa and remained stable once the engine was running. Analysis of the flow patterns inside the ejector diffuser showed that as the ejection injection pressure decreased, the separation region shifted toward the forward flow. Apart from this shift, no significant differences were observed in the flow patterns around the ejector nozzle owing to the variations in the ejector injection pressure.
In conclusion, as long as the intake flow rate remains constant, the designed suction vacuum pressure can be maintained even if the ejector injection pressure is low, owing to the movement of the separation point within the ejector diffuser. However, without a flow supply, the initial vacuum pressure is significantly lower than the designed vacuum pressure, making it difficult to sustain the suction action if the ejector injection pressure falls below the designed value.

Author Contributions

Conceptualization, C.-H.K.; methodology, C.-H.K.; software, C.-H.K.; validation, C.-H.K.; formal analysis, C.-H.K.; writing—original draft preparation, C.-H.K.; writing—review and editing, C.-H.K. and C.-S.P.; project administration, C.-S.P.; funding acquisition, C.-S.P. All authors have read and agreed to the published version of the manuscript.

Funding

This research was funded by Korea Space Launch Vehicle-III Development Program, grant number RS2023-00301757.

Data Availability Statement

The original contributions presented in this study are included in the article. Further inquiries can be directed to the corresponding author.

Conflicts of Interest

The authors declare no conflicts of interest.

References

  1. Kantrowitz, A.; Donaldson, C. Preliminary Investigation of Supersonic Diffusers; NACA ACR, No. L5D20; NACA Research Memorandum: Washington, DC, USA, 1945. [Google Scholar]
  2. Massier, P.F.; Roschke, E.J. Experimental Investigation of Exhaust Diffuser for Rocket Engines; NASA CR 51076; NACA Research Memorandum: Washington, DC, USA, 1960. [Google Scholar]
  3. Jones, R.D.; Allgood, C.D.; Saunders, P.M. Passive Rocket Diffuser Testing: Reacting Flow Performance of Four Second-Throat Geometries; NASA TM-219221; NACA Research Memorandum: Washington, DC, USA, 2016. [Google Scholar]
  4. Fouladi, N.; Farahani, M.; Mirbabaei, A.R. Performance evaluation of a second throat exhaust diffuser with a thrust optimized parabolic nozzle. Aerosp. Sci. Technol. 2019, 94, 105406. [Google Scholar] [CrossRef]
  5. Kumaran, R.M.; Sundararajan, T.; Manohar, D.R. Performance evaluation of second throat diffuser for high-altitude-test facility. J. Propuls. Power 2010, 26, 248–258. [Google Scholar] [CrossRef]
  6. Park, B.; Lim, J.; Park, S.; Lee, J.; Yoon, W. Design and analysis of a second throat exhaust diffuser for altitude simulation. J. Propuls. Power 2012, 28, 1091–1104. [Google Scholar] [CrossRef]
  7. Fouladi, N.; Mohamadi, A.; Rezaei, H. Numerical investigation of pre-evacuation influences of second-throat exhaust diffuser. Fluid Mech. Aerodyn. 2017, 5, 55–69. [Google Scholar]
  8. Kumaran, R.M.; Vivekanand, P.K.; Sundararajan, T.; Kumaresan, K.; Manohar, D.R. Optimization of Second Throat Ejectors for High-Altitude Test Facility. J. Propuls. Power 2009, 25, 697–706. [Google Scholar] [CrossRef]
  9. Kumaran, R.M.; Sundararajan, T.; Manohar, D.R.; Dason, D. Modeling of Two-Stage Ejector for High-Altitude Testing of Satellite Thrusters. AIAA J. 2012, 50, 1398–1408. [Google Scholar] [CrossRef]
  10. Frank, A.; Lutz, P.; Regenbrecht, D. The test centre Lampoldshausen and its role in Ariane 6 development and beyond. In Proceedings of the AIAA 2016-2503 SpaceOps Conference, Daejeon, Republic of Korea, 6–20 May 2016. [Google Scholar]
  11. Ghanshyam, B.; Arun, K.R. Starting transients in second throat vacuum ejectors for high altitude testing facilities. Aerosp. Sci. Technol. 2021, 113, 106687. [Google Scholar]
  12. Tao, L.; Zhiyan, L.; Letian, Z.; Wei, Y.; Wanwu, X.; Saiqiang, Z. Experimental study on the performance and shock train oscillation of the constant area two strut supersonic ejector. Aerosp. Sci. Technol. 2025, 158, 109884. [Google Scholar]
  13. Kong, F.; Kim, H.D. Analytical and computational studies on the performance of a two-stage ejector–diffuser system. Int. J. Heat Mass Transfer. 2015, 85, 71–87. [Google Scholar] [CrossRef]
  14. Kim, C.; Kim, S.; Jeon, J.; Kim, S.; Lee, K. Design and analysis of a supersonic diffuser for altitude testing of upper-stage liquid rocket engines. Aerosp. Sci. Technol. 2023, 142, 108–662. [Google Scholar] [CrossRef]
  15. Keenan, J.H.; Neumann, E.P. A Simple Air Ejector. J. Appl. Mech. 1942, 9, 75–81. [Google Scholar] [CrossRef]
  16. Keenan, J.H.; Neumann, E.P. An Investigation of Ejector Design by Analysis and Experiment. J. Appl. Mech. 1950, 72, 299–309. [Google Scholar] [CrossRef]
  17. Huang, B.J.; Chang, J.N.; Wang, C.P.; Petrenko, V.A. A 1-D Analysis of Ejector Performance. Int. J. Refrig. 1999, 22, 354–364. [Google Scholar] [CrossRef]
  18. He, S.; Li, Y.; Wang, R.Z. Progress of mathematical modeling on ejectors. Renew. Sustain. Energy. 2009, 13, 1760–1780. [Google Scholar] [CrossRef]
  19. Doniazed, S.; Mahmoud, B.; Ahmed, B. Investigation of an ejector powered double effect absorption/recompression refrigeration cycle. Int. J. Refrig. 2019, 99, 453–468. [Google Scholar]
  20. Eames, I.W.; Wu, S.; Worall, M.; Aphornratana, S. An experimental investigation of steam ejectors for applications in jet-pump refrigerators powered by low grade heat. Proc. Inst. Mech. Eng. Part A J. Power Energy 1999, 213, 351–361. [Google Scholar] [CrossRef]
  21. Chen, W.; Liu, M.; Chong, D.; Yan, J.; Little, A.B.; Bartosiewicz, Y. A 1D model to predict ejector performance at critical and sub-critical operational regimes. Int. J. Refrig. 2013, 36, 1750–1761. [Google Scholar] [CrossRef]
  22. Anderson, J.D. Modern Compressible Flow: With Historical Perspective; McGrawHill: New York, NY, USA, 1990. [Google Scholar]
  23. Staff, A.R. Equations, Tables, and Charts for Compressible Flow; NACA Report 1135; NACA Research Memorandum: Washington, DC, USA, 1953. [Google Scholar]
  24. Weiss, J.M.; Smith, W.A. Preconditioning applied to variable density and constant density flows. AIAA J. 1995, 33, 2050–2057. [Google Scholar] [CrossRef]
  25. Shih, T.H.; Liou, W.W.; Shabbir, A.; Yang, Z.; Zhu, J. A new k-ε eddy-viscosity model for high reynolds number turbulent flows. Comput. Fluids. 1995, 24, 227–238. [Google Scholar] [CrossRef]
  26. Sung, H.; Yeom, H.; Yoon, S.; Kim, S.; Kim, J. Investigation of rocket exhaust diffusers for altitude simulation. J. Propuls. Power. 2010, 26, 240–247. [Google Scholar] [CrossRef]
  27. Choi, D.; Baek, J.; Kim, K. Efficient diffuser design for plasma wind tunnels with a large blockage model. Aerosp. Sci. Technol. 2021, 119, 107206. [Google Scholar] [CrossRef]
  28. Park, B.; Lee, J.; Yoon, W. Studies on the starting transient of a straight cylindrical supersonic exhaust diffuser: Effects of diffuser length and pre-evacuation state. Int. J. Heat Fluid Flow 2023, 29, 1369–1379. [Google Scholar] [CrossRef]
  29. Prabakar, S.M.; Panchabudhe, L.M.; Muruganandam, T.M.; Sundararajan, T. A study on the performance characteristics of two-stream supersonic diffusers. Aerosp. Sci. Technol. 2019, 95, 105470. [Google Scholar] [CrossRef]
  30. Gordon, S.; McBride, B.J. Computer Program for Calculation of Complex Chemical Equilibrium Compositions and Applications. Part I. Analysis; NASA Reference Publication 1311; NACA Research Memorandum: Washington, DC, USA, 1994. [Google Scholar]
  31. Lee, C.; Choi, K.; Kim, C.; Han, S. Computational investigation of flow separation in a thrust-optimized parabolic nozzle during high-altitude testing. Comput. Fluids 2020, 197, 104363. [Google Scholar] [CrossRef]
Figure 1. Image of integrated model consisting of rocket engine, supersonic diffuser, ejector nozzle, and ejector diffuser. Units: m.
Aerospace 12 00380 g001
Figure 2. Computational domain and boundary conditions: (a) integrated model and (b) ejector system model.
Aerospace 12 00380 g002
Figure 3. Grid independence of each model: (a) supersonic diffuser [14]; (b) ejector system.
Aerospace 12 00380 g003
Figure 4. Pressure distribution inside the rocket engine nozzle as a function of external nozzle pressure.
Aerospace 12 00380 g004
Figure 5. Mach contour image: the integrated model of rocket engine, supersonic diffuser, and ejector model (top) and the ejector system model (bottom).
Aerospace 12 00380 g005
Figure 6. Absolute pressure contour image: the integrated model of rocket engine, supersonic diffuser, and ejector model (top) and the ejector system model (bottom).
Aerospace 12 00380 g006
Figure 7. Pressure reduction pattern over physical simulation time for two models.
Aerospace 12 00380 g007
Figure 8. Comparison of ejector diffuser wall pressures for two models at 2 s.
Aerospace 12 00380 g008
Figure 9. Vacuum pressure patterns over time under conditions of ejector nozzle injection pressure reduction.
Aerospace 12 00380 g009
Figure 10. Detailed pressure pattern of the third pressure perturbation at an injection pressure of 1.2 MPa; (1) pressure reduction, (2) vacuum break and pressure increase, (3) pressure stabilization, and (4) pressure reduction.
Aerospace 12 00380 g010
Figure 11. Mach number flow changes related to pressure transition; (1) flow associated with vacuum formation as pressure decreases, (2) complex flow around the flow passage (a) when the vacuum is disrupted, (3) process of stabilization along the flow passage, and (4) re-establishment of the vacuum through the flow passage (b) as the pressure decreases.
Aerospace 12 00380 g011
Figure 12. Comparison of flow vector patterns between the ejector nozzle flow and the ejector diffuser wall at (a,b) in Figure 11; the arrows indicate the flow of the fluid and the recirculating flow paths.
Aerospace 12 00380 g012
Figure 13. Pressure distribution over time after rocket engine start under the vacuum condition of the ejector system.
Aerospace 12 00380 g013
Figure 14. Comparison of Mach number distribution inside the ejector diffuser before and after the rocket engine starts.
Aerospace 12 00380 g014
Figure 15. Comparison of the ejector diffuser wall pressure before and after rocket engine startup.
Aerospace 12 00380 g015
Figure 16. Comparison of the Mach number along the centerline before and after rocket engine startup.
Aerospace 12 00380 g016
Figure 17. Pressure changes over time after engine startup in a vacuum.
Aerospace 12 00380 g017
Figure 18. Mach number distribution inside the ejector diffuser according to the ejector injection pressure.
Aerospace 12 00380 g018
Figure 19. Pressure distribution on the ejector diffuser wall according to differences in ejector injection pressure.
Aerospace 12 00380 g019
Figure 20. Mach number distribution along the centerline according to differences in ejector injection pressure.
Aerospace 12 00380 g020
Table 1. Numerical input parameters.
Integrated ModelEjector System Model
Stagnation inlet
   P [MPa] 1.5, 1.3, 1.21.5, 1.3, 1.2
   T [K]600600
Mass flow inlet
   P [MPa]-0.1
   T [K]-400
   m [kg/s]-122
Entrainment ratio-0.5
Disclaimer/Publisher’s Note: The statements, opinions and data contained in all publications are solely those of the individual author(s) and contributor(s) and not of MDPI and/or the editor(s). MDPI and/or the editor(s) disclaim responsibility for any injury to people or property resulting from any ideas, methods, instructions or products referred to in the content.

