Abstract
The rapid expansion of China’s civil aviation sector, particularly within the Beijing-Tianjin-Hebei airport cluster, has led to significant airspace congestion and operational inefficiencies. This study develops a dynamic flight slot allocation model that integrates both airport and airspace capacity constraints, accounting for real-time fluctuations in resource availability. The model aims to optimize slot distribution, minimize delays, and enhance operational efficiency by adapting to variations in airport and waypoint capacities, offering a more flexible solution compared with traditional static approaches. A case study based on real-world data from the Beijing-Tianjin-Hebei region demonstrates the model’s effectiveness. Computational experiments show that incorporating capacity fluctuations significantly reduces the need for slot adjustments, particularly at secondary airports with volatile demand. The results indicate a marked improvement in operational efficiency, including reduced adjustment times and fewer affected flights. This research underscores the value of adaptive data-driven strategies in managing complex air traffic systems and provides valuable insights for policymakers and aviation authorities. Future research could extend this work by incorporating additional dynamic factors, such as weather conditions and emerging technologies, to further enhance the sustainability and efficiency of air traffic management.
1. Introduction
China’s civil aviation transport industry has undergone a remarkable transformation in recent years, characterized by substantial growth in both the number and scale of airports. The Civil Aviation Administration of China (CAAC)’s 13th Five-Year Plan for civil aviation development, introduced in 2017, emphasizes the creation of a “National Integrated Airport System” consisting of three world-class airport clusters: Beijing-Tianjin-Hebei, Yangtze River Delta, and the Guangdong–Hong Kong–Macao Greater Bay Area. This system incorporates 29 regional hubs, along with non-hub and general airports, which collectively serve as vital supplements to the overall network [1]. Among these clusters, the Beijing-Tianjin-Hebei airport cluster stands out as the largest and most rapidly expanding, playing a critical role in China’s air transport infrastructure. Despite this growth, the increasing demand for air transport services is expected to outpace the expansion of airport infrastructure and airspace resources, as forecasted by the Aviation Industry Corporation of China (AVIC) [2].
This airport cluster is particularly challenged by its shared terminal area airspace, routes, and key waypoints, which often lead to airspace congestion, underutilization of available resources, and limited enhancement of overall airspace capacity. As a result, significant congestion issues arise, manifesting in flight delays and cancellations that negatively affect passengers and airlines alike. To address this challenge, three strategies have been proposed as follows: (i) infrastructure expansion, (ii) demand management interventions, and (iii) operational improvements, which include the adoption of new air traffic management (ATM) technologies [3].
While infrastructure expansion remains the most effective long-term solution to alleviate congestion, it is costly, time-consuming, and often unfeasible, especially in densely populated urban areas where airspace capacity is nearing its limit. In situations where infrastructure development is not viable, operational management can be optimized by adjusting air traffic flows to better align with available capacity, thereby reducing flight delays. This strategy falls under the domain of tactical air traffic flow management (ATFM), which includes measures such as aircraft scheduling, ground delay programs (GDPs), control of arrival and departure rates, and the optimization of runway configurations [4,5,6,7,8,9,10,11,12,13]. However, these measures tend to be effective only over short timeframes (typically less than 24 h) and may not sufficiently address the long-term challenges posed by sustained demand growth.
When improvements in infrastructure or operational efficiency are not immediately possible, demand management strategies offer a viable medium-term solution. These strategies, which are implemented months in advance, fall under the umbrella of strategic ATFM. They seek to alleviate capacity constraints and mitigate delays by limiting scheduled flight numbers during peak periods or modifying their temporal characteristics [14]. Demand management approaches can be broadly classified into two categories: (i) market-based measures, such as congestion pricing or slot auctions, which use economic mechanisms to allocate capacity, and (ii) administrative measures, which involve non-monetary adjustments to flight schedules made by designated scheduling entities [15,16,17,18,19,20].
A critical element in these demand management strategies is flight slot allocation. The process ensures the efficient distribution of available airport capacity, especially during peak periods, thereby minimizing delays and optimizing resource use. However, traditional methods for flight slot allocation often overlook the dynamic nature of airport and airspace resource availability, leading to suboptimal scheduling and significant delays. Recent studies have increasingly focused on developing models that account for both airport and airspace capacity, along with fluctuations in available resources. These models aim to improve the allocation process by providing more accurate predictions of available flight slots, thereby reducing operational inefficiencies and enhancing air traffic flow.
This study addresses these challenges by developing a mathematical model for flight slot allocation tailored to the Beijing-Tianjin-Hebei airport cluster. The model integrates both airport and airspace capacity constraints, accounting for fluctuations in actual capacity. By incorporating real-time demand variations and capacity constraints, the model optimizes flight slot allocation, minimizing disruptions and reducing delays at both major and secondary airports in the cluster.
To demonstrate the effectiveness of the proposed model, a case study is conducted using real-world data from the Beijing-Tianjin-Hebei region. Computational experiments are performed to compare the outcomes of slot allocation with and without considering capacity fluctuations. The results show significant improvements in efficiency when fluctuations are accounted for, particularly in secondary airports with fluctuating demands. The findings of this study provide valuable insights into the importance of adaptive data-driven flight slot allocation strategies, particularly in regions with complex air traffic and airport systems.
The remainder of this paper is organized as follows: Section 2 discusses previous related work and describes the contributions of this paper. Section 3 presents a detailed description of the problem and the development of the mathematical model for flight slot allocation, while Section 4 outlines the case study setup, including the data used, experimental design, and results. Finally, Section 5 summarizes the research conclusions and provides directions for future research.
2. Literature Review
The literature relevant to this research primarily focuses on slot allocation and scheduling, encompassing a variety of research streams aimed at improving efficiency, fairness, and operational performance in airport and air traffic management. These studies explore multiple facets of slot allocation, such as the optimization of available capacity, fairness considerations, and flexibility in response to dynamic operational conditions. A significant portion of this research has been guided by the IATA Worldwide Slot Guidelines, which set the administrative framework for slot scheduling across the global aviation network.
2.1. Allocative Efficiency in Slot Scheduling
Allocative efficiency has been a central concern in the slot allocation literature, particularly with the goal of optimizing the distribution of available slots to minimize congestion and delays. Zografos (2012) developed an optimization-based model that addresses discrepancies between requested and allocated slot times, factoring in EU/IATA regulations and operational constraints. His study demonstrated substantial efficiency improvements in slot allocation, with gains ranging from 14% to 95% depending on the operational context [17]. Androutsopoulos et al. (2020) [21] further advanced this area by introducing a hybrid heuristic algorithm that combines the objective feasibility pump (FP) algorithm with large neighborhood search (LNS) to improve slot allocation at regional airports. Their model effectively approximated the efficient frontier of the problem and yielded improved operational performance when applied to real-world data from a Greek regional airport [19]. Additionally, Fairbrother (2021) examined strategies for mitigating schedule blocking and the impact of slot period length adjustments in congested airports, highlighting the importance of hierarchical and holistic slot allocation policies in managing congestion without sacrificing regularity [22]. While these models demonstrate allocative efficiency gains, they often lack adaptability to real-time capacity fluctuations and airport cluster interdependencies.
2.2. Distributive Efficiency and Fairness
Fairness in slot allocation has garnered increasing attention, particularly in terms of distributive efficiency across airlines. Jacquillat (2018) [19] introduced a novel approach that integrates inter-airline equity objectives into airport scheduling. This approach balances on-time performance, airline preferences, and fairness, providing a more comprehensive solution to slot allocation by focusing on equity between stakeholders. Jacquillat’s model uses multilevel architecture to evaluate different intervention strategies, making it applicable to both scheduling and network connectivity constraints [19]. In a similar vein, Ribeiro et al. (2018) developed the priority-based slot allocation model (PSAM), which optimizes slot allocation by considering multiple airline priorities in accordance with the IATA guidelines. This model demonstrated improvements in slot allocation efficiency, particularly for larger airports, by better aligning allocations with airline requests while maintaining equity and minimizing congestion [14]. Zografos (2019) explored the trade-off between slot efficiency and fairness by comparing hierarchical and non-hierarchical allocation systems. The study provided valuable insights into how different approaches to fairness impact overall efficiency and equity, both at the aggregate and disaggregate levels [16]. Androutsopoulos et al. (2019) further expanded on fairness considerations by incorporating a congestion pricing mechanism to ensure that airlines absorb their fair share of congestion. Their model highlighted the impact of fairness on efficiency and service levels, providing insights into balancing equity and operational performance in slot allocation [20]. Though fairness mechanisms improve equity, they may reduce overall system efficiency when applied rigidly in dynamic operational environments.
2.2.1. Flexibility and Dynamic Allocation
The dynamic nature of air traffic requires flexibility in slot allocation, which has been addressed by several studies focusing on the adaptability of slot scheduling systems. Zografos (2021) proposed a framework that incorporates airlines’ flexibility preferences in slot allocation, optimizing for minimized rejection rates, total displacement, and maximum displacement while adhering to IATA guidelines. The study introduced the timing flexibility indicator (TFI) to account for flexibility preferences, showing that such frameworks improve airport capacity utilization and passenger satisfaction by reducing displacement [23]. Zeng (2021) also contributed to this area with a data-driven approach that optimizes scheduling decisions to minimize operational delays and align airline interests. By analyzing historical data to predict displacement probabilities, Zeng’s model reduces delays and improves operational efficiency, thus enhancing the overall performance of slot allocation in dynamic environments [24]. Existing flexibility frameworks remain limited in handling simultaneous capacity variations across multiple airports within a cluster.
2.2.2. Robust Model-Based Optimization
Robust and optimization-based models have been crucial in addressing uncertainties in slot allocation. Wang (2020) introduced a robust optimization model for simultaneous slot allocation in an airport network, accounting for daily fluctuations in airport capacity. This approach minimizes conflicts in scheduling and offers sustainable solutions to capacity uncertainties, making it applicable to long-term strategic planning in air traffic management [25]. Similarly, Cheung (2021) developed a mixed integer programming (MIP) model that optimizes slot allocation during peak traffic periods while considering dynamic airport capacity. The model demonstrated its capacity to handle increased demand and minimize major schedule disruptions by dynamically estimating available airport capacity [11]. Recent advancements in metaheuristic optimization, particularly evolutionary algorithms, have expanded solution methodologies for complex ATM problems. Durand et al. provided a comprehensive survey of such techniques, demonstrating their applicability to slot allocation challenges [26]. While robust against uncertainties, these models become computationally intensive when scaling to large airport networks.
2.2.3. Airport Network and Cluster-Based Slot Allocation
A growing body of the literature has shifted its focus toward airport networks and clusters rather than individual airports. Corolli (2014) introduced stochastic programming models for allocating slots across airport networks. His model accounts for operational uncertainties and airline preferences while capturing the stochastic nature of capacity reductions across multiple airports. This approach has proven effective in balancing schedule discrepancies with operational delays in networked airport systems [18]. Zografos (2021) expanded on this concept by proposing a tri-objective slot allocation model that integrates multiple scheduling objectives. The model addresses total schedule displacement, maximum schedule displacement, and demand-based fairness, providing a comprehensive approach to airport network management [27]. Zhang (2021) also contributed to the study of airport clusters with a two-stage stochastic programming model for optimizing flight schedules across multiple airports over several operational days. The model accounts for capacity uncertainty and optimizes service rates for arrivals and departures, demonstrating its efficacy in reducing delays and improving operational efficiency across an airport network [28]. Network-level approaches still require better integration of real-time operational data and multi-stakeholder priorities.
In a nutshell, despite significant advancements, the current research still exhibits several limitations. Many studies focus on static models that fail to account for the dynamic fluctuations in air traffic and airport operations. While numerous models address capacity constraints and fairness, few integrate real-time fluctuations in airport and airspace capacity, which can have a profound impact on the accuracy and effectiveness of slot allocation. Moreover, most studies tend to treat airports as isolated units, failing to account for the interdependencies within airport clusters and broader airspace systems. Furthermore, while optimization techniques have made substantial strides, many models do not fully incorporate real-time data or external factors, such as weather conditions, air traffic control restrictions, or emergency events, that can significantly influence operational decisions.
The aim of this paper is to bridge these gaps by developing a flight slot allocation model specifically tailored to the Beijing-Tianjin-Hebei airport cluster. This model integrates both airport and airspace resource constraints and factors in fluctuations in actual capacity, presenting a more dynamic and adaptive solution to slot allocation. By incorporating real-time demand variations and capacity fluctuations, this study aims to offer a more realistic and operationally efficient framework that minimizes the need for disruptive slot adjustments. In particular, the findings suggest that incorporating dynamic factors into slot allocation models can substantially improve operational efficiency, especially at secondary airports where capacity demands are more volatile. Ultimately, this research contributes to the growing body of knowledge on airport network management and provides a foundation for future studies on more sustainable and adaptive air traffic management systems.
3. Problem Description and Mathematical Modeling
3.1. Problem Overview
The airspace capacity of an airport cluster is typically fixed, with each airport sharing a common airspace. This implies that the number of inbound and outbound waypoints at each airport remains constant. The ground capacity of an airport, declared by the airport authority, is influenced by three primary factors:
- Infrastructure elements: runway capacity, apron capacity, and terminal capacity;
- Movement types: variations based on arrivals, departures, and total traffic;
- Time blocks: capacities defined per hour, 15 min intervals, 5 min intervals, and daily, weekly, monthly, or yearly periods.
Typically, about one year before the start of each operational season, the declared capacities of all scheduled and coordinated airports are publicly disclosed. Generally, the declared capacity is set lower than the actual assessed capacity, often around 80%. However, in practice, the available capacity of an airport can fluctuate, being either lower or higher than the declared capacity due to various factors such as adverse weather conditions or traffic control measures. As a result, flight schedules may not always align with the initially planned timeframes, potentially causing delays. To address these issues, procedures such as ground holding or air holding are implemented to manage traffic conflicts.
This study focuses on the airport cluster as its subject and establishes a flight slot allocation model that considers both declared capacity and waypoint capacity limitations. The model aims to perform the following:
- Ensure fair resource allocation among airports within the cluster;
- Coordinate flight time allocation to balance the interests of each airport;
- Optimize flight slots while maintaining airport and airspace resource limits.
The ultimate goal is to achieve a balance among stakeholders’ needs, improve fairness in resource allocation, and enhance operational efficiency within the Beijing-Tianjin-Hebei airport cluster.
3.2. Optimization Models
3.2.1. Description of Parameters
For the sake of simplicity, we assume that flight slots are allocated in 5 min intervals. Table 1 provides a list of the parameters used in this model:

Table 1.
Explanation of notations used in the model.
3.2.2. Objective Function
The objective of the model is to minimize the total adjustment cost associated with slot assignments. The objective function is expressed as follows:
where
represents the adjustment cost of flight due to the difference between the assigned slot and the planned requested slot.
refers to the number of days that flight is scheduled to operate.
denotes the slot requested by flight .
The adjustment cost reflects operational penalties proportional to schedule displacement, incorporating fuel burn, crew scheduling impacts, and passenger connectivity costs. This linear cost structure aligns with airline prioritization of minimal displacement for widebody/hub flights versus greater tolerance for regional aircraft. Adjustment costs were derived from historical airline delay penalties and operational priorities. In experiments, costs were proportional to displacement time (e.g., 1 cost unit per minute).
The absolute value in Equation (1) is linearized using standard MILP techniques by introducing auxiliary variables representing positive/negative deviations:
where
3.2.3. Constraints
Uniqueness Constraints for Flight Slot Allocation
Each flight must be assigned to exactly one slot. This is represented by the following equation:
Airport Capacity Constraints
The total number of inbound and outbound flights at each airport should not exceed the corresponding declared capacity, adjusted by the fluctuation factors. These constraints are given by the following equations:
Waypoint Capacity Constraints
The total number of flights passing through each waypoint during a given time must not exceed the waypoint’s capacity. This constraint is given by:
where
represents the time taken for flight from airport to waypoint , or from waypoint to airport .
Turnaround Time Constraints
For connecting flights, the arrival time of the previous flight and the takeoff time of the subsequent flight must fall within the allowable turnaround time range. This is represented by:
Binary Decision Variable Constraints
The decision variable can only take values of 0 or 1, ensuring a proper assignment of flight slots:
4. Case Study and Results
4.1. Data Processing
4.1.1. Data Selection
The Beijing-Tianjin-Hebei airport cluster is one of China’s most significant international transportation hubs. The primary airports in this cluster include Beijing Capital Airport (ZBAA), Beijing Daxing Airport (ZBAD), Tianjin Binhai Airport (ZBTJ), and Shijiazhuang Zhengding Airport (ZBSJ). For this study, data from the 2021 winter domestic schedule were sourced from the Pre-Flight Plan Management System (AFPMS), a centralized platform used by CAAC for pre-tactical flight coordination. The system provides verified historical schedules including requested slots, aircraft types, routes, and waypoints.
Upon analyzing the data, a clear discrepancy emerged in the flight volumes between ZBSJ and the other airports in the cluster, particularly evident in Figure 1 and Figure 2. Flight data were extracted from AFPMS for Wednesday, 17 November 2021—a representative winter season operational day. These figures show a significant divergence in the outbound flight volumes at ZBAA and ZBSJ.
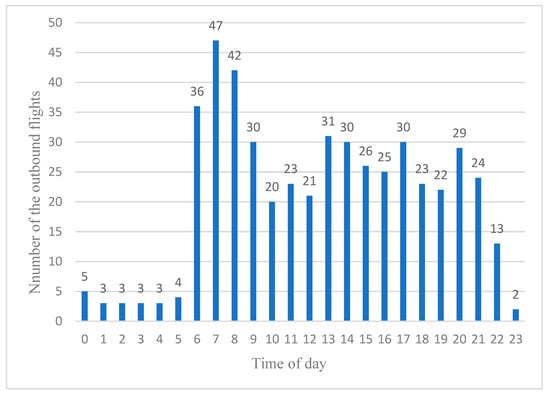
Figure 1.
Outbound flights at ZBAA.
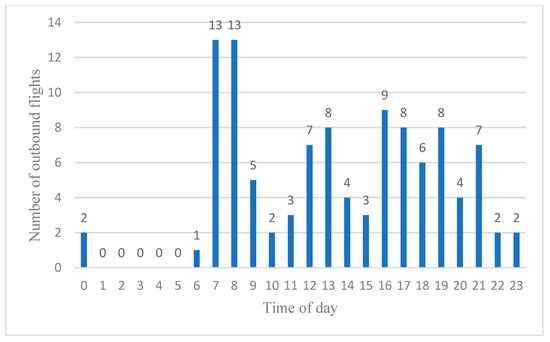
Figure 2.
Outbound flight at ZBSJ.
As shown in the figures, ZBAA recorded 495 outbound flights, while ZBSJ had only 107 flights—less than a quarter of ZBAA’s flights. To better compare the flight distribution across the four airports, we focused on Wednesdays and created a flight occupancy chart for the Beijing-Tianjin-Hebei airport cluster, as illustrated in Figure 3.
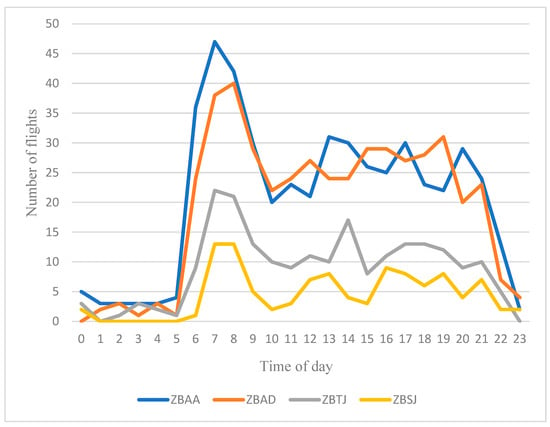
Figure 3.
Beijing-Tianjin-Hebei regional airport cluster flight occupancy.
It is apparent that ZBSJ’s flight volume was significantly lower than the other three airports. Given that flight management in the cluster primarily focused on coordinating the main airports (ZBAA, ZBAD, ZBTJ) and treated ZBSJ as a secondary airport, it was excluded from further analysis. Consequently, this study analyzes only ZBAA, ZBAD, and ZBTJ.
4.1.2. Maximum Adjustment Constraints
Given that slot adjustments often result in economic losses, it is critical to limit the difference between the optimized slot and the applied slot to avoid excessive discrepancies that could financially burden airlines. Therefore, an upper limit for this deviation is established. In this study, the permissible range for the difference between the optimized slot and the requested slot is set as .
To ensure slot assignments remain within 0 to 60 min (12 × 5 min intervals) of requested times, the following constraint could be added to the model proposed in Section 3.2:
4.1.3. Waypoint Capacity Constraints
The Beijing terminal area encompasses three airports, ZBAA, ZBAD, and ZBTJ, each connected by seven outbound waypoints (RUSDO, IDKEX, BOTPU, PEGSO, ELKUR, OMDEK, IGMOR) and five inbound waypoints (DUGEB, GUVBA, AVBOX, BLEAX, ELAPU). A detailed visualization of the airspace structure is provided in Figure 4.
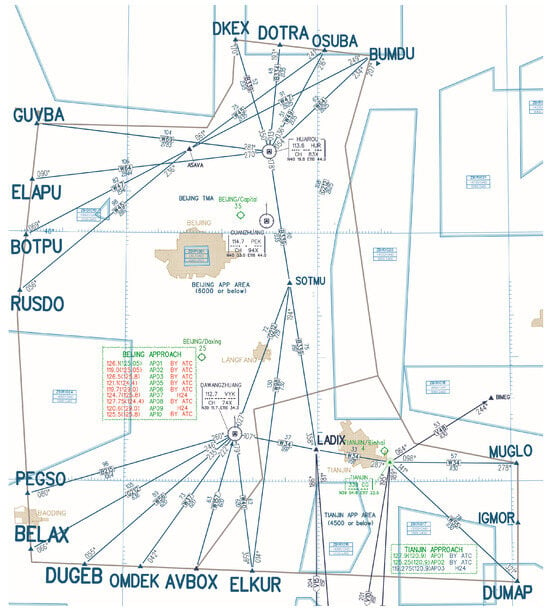
Figure 4.
Airspace structure of Beijing terminal area.
For data processing, flight requests were arranged in chronological order and then categorized based on the waypoints they passed through. This allowed for the calculation of the difference between the optimized and applied slots, leading to the creation of an adjustment time matrix.
It is important to note that the COVID-19 pandemic significantly impacted flight volumes, resulting in an overall decrease in the number of flights. To better estimate the actual operational capacity of the waypoints, congested key points from October to December 2021 were used for traffic statistics. The resulting data are shown in Table 2.

Table 2.
Flight flow statistics for the Beijing-Tianjin-Hebei region (December 2021).
These statistical data form the basis for defining waypoint capacity constraints and enhancing the reliability of the analysis. The results are presented in Table 3 and Table 4.

Table 3.
Outbound waypoint capacity.

Table 4.
Inbound waypoint capacity.
For ease of analysis, the waypoints are categorized by general direction (e.g., northeast, southwest) for further calculations.
4.1.4. Airport Capacity Constraints
The declared capacity for the Beijing-Tianjin-Hebei airport cluster during the 2021 winter flight season, as defined by the CAAC North China Regional Administration, specifies the maximum allowable aircraft movements per hour for each airport, as shown in Table 5.

Table 5.
Beijing-Tianjin-Hebei airport capacity.
4.1.5. Determination of Average Flight Time
Based on the research data of the North China Air Traffic Control Administration (NCAA), the time taken by inbound and outbound flights is shown in Table 6 and Table 7. Flight time data for inbound and outbound flights were sourced from the North China Air Traffic Management Bureau. The following Table 6 and Table 7 provide the average times for flights from the runway to the respective waypoints.

Table 6.
Time taken by outbound flights.

Table 7.
Time taken by inbound flights.
4.2. Results and Analyses
The computational experiments were performed on a Windows 10 machine with an Intel® Core™ i7-7820HQ CPU which manufactured by Intel Corporation, a multinational technology company headquartered in Santa Clara, California, United States running at 2.90 GHz and equipped with 32 GB of RAM. MATLAB R2017a was used for implementing algorithms, while ILOG CPLEX 22.1.1solved the data, and Excel was employed for data statistics. The mixed-integer linear program was solved using ILOG CPLEX 22.1.1 with the branch-and-cut algorithm, convergence tolerance set to 0.1%, and a 1 h time limit. Parallel processing utilized eight threads on the test machine. These settings aligned with established practices for slot allocation problems, balancing solution quality and computational efficiency [29]. The average solve time was 47 min for full-day instances.
To demonstrate the optimization impact of the fluctuation factor, the results were divided into two sections: one considering the fluctuation factor and one not.
4.2.1. Computational Results for Fixed Capacity
Without considering the fluctuation factor, the number of flights adjusted was found to be 817, covering a 24 h period. Statistical analysis across the three airports was performed on the results, generating graphical representations where the horizontal axis represents time and the vertical axis represents the adjustment volume, as shown in Figure 5, Figure 6 and Figure 7.
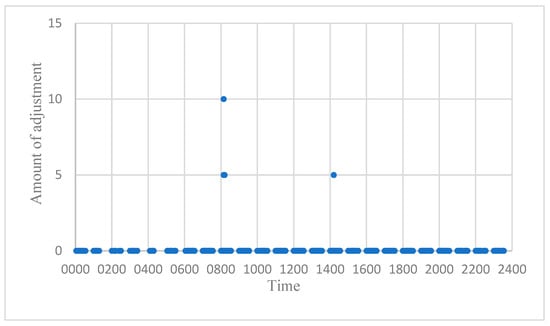
Figure 5.
Adjustment at ZBAA without fluctuation factor.
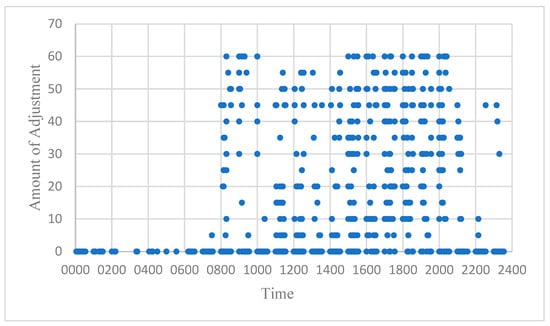
Figure 6.
Adjustment at ZBAD without fluctuation factor.
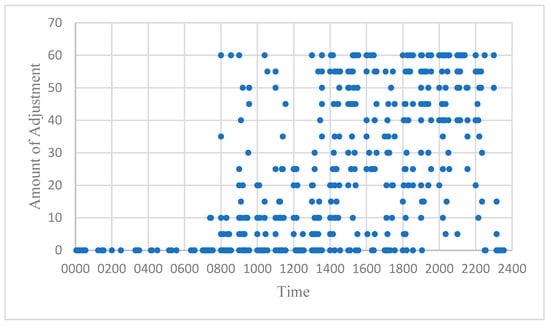
Figure 7.
Adjustment at ZBTJ without fluctuation factor.
From the figures, it is clear that, aside from ZBAA, where demand and capacity were relatively balanced, substantial adjustments occurred at both ZBAD and ZBTJ. For detailed data regarding the adjustment volume and the number of affected flights at each airport, refer to Table 8.

Table 8.
Adjustment statistics for three airports without fluctuation factor.
Table 8 shows that ZBAA experienced minimal adjustments, with only six flights affected. In contrast, both ZBAD and ZBTJ exhibited substantial adjustments. ZBTJ had the largest adjustment, followed by ZBAD.
This suggests that ZBAA operates at a balanced capacity level, potentially leaving unallocated slots during peak hours. Therefore, ZBAA could redistribute some of its unused capacity to ZBAD and ZBTJ during high-demand periods. Such a redistribution would help alleviate demand–capacity imbalances at the other two airports. Essentially, if any of the three airports has spare capacity during specific hours, it could allocate some of this surplus to the others, thus optimizing the system. This dynamic adjustment of airport capacities, within the bounds of the fluctuation factor, ensures that the total capacity across all three airports remains constant while their individual capacities fluctuate as needed.
4.2.2. Calculation of the Fluctuation Factor
To calculate the fluctuation factor for the three airports, we statistically analyzed the morning peak flight data, as shown in Table 9.

Table 9.
Adjustment statistics for the three airports from 7 to 11 AM during peak hours.
The fluctuation factors for the three airports are as follows:
- ZBAA: with an hourly average of 64 flights, the difference between the hourly average and the total number of inbound and outbound flights is 6 flights per hour;
- ZBAD: the hourly average is 58.75 flights, and the difference is 3 flights per hour;
- ZBTJ: with an hourly average of 35 flights, the difference is 4 flights per hour.
The fluctuation factor represents the average deviation between the hourly average flight volume and the total number of inbound and outbound flights during peak hours.
4.2.3. Computational Results Considering Fluctuation Factor
When the fluctuation factor is incorporated into the model, the optimized result yields a total adjustment of 16,720. This represents a significant reduction from the initial solution, demonstrating the efficiency of the adjustment process. To visualize the results, we again plot the adjustment volumes for the three airports, using time on the horizontal axis and adjustment volume on the vertical axis. These are shown in Figure 8, Figure 9 and Figure 10.
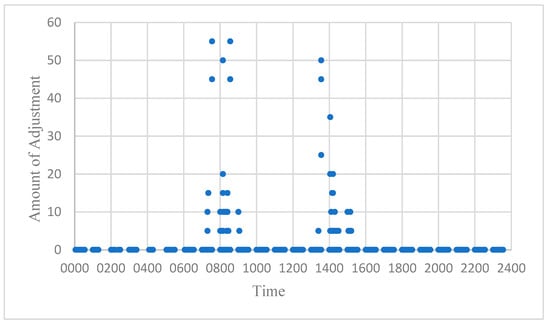
Figure 8.
Adjustment at ZBAA considering fluctuation factor.
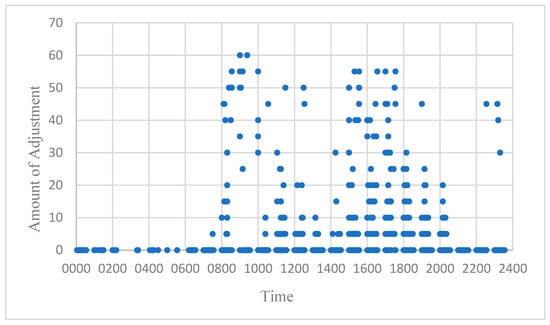
Figure 9.
Adjustment at ZBAD considering fluctuation factor.
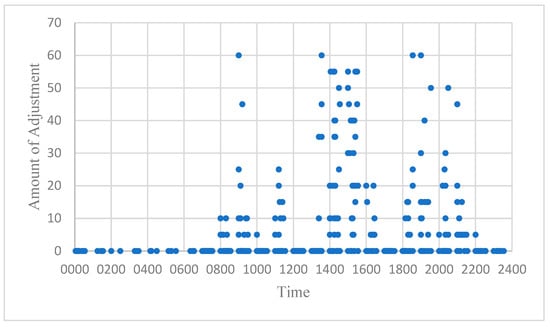
Figure 10.
Adjustment at ZBTJ considering fluctuation factor.
By comparing these results with Figure 5, Figure 6 and Figure 7, it is evident that the inclusion of the fluctuation factor reduced the overall adjustment volume. Notably, adjustments at ZBAA increased slightly, leading to reduced adjustments at ZBAD and ZBTJ. Detailed adjustment data are provided in Table 10.

Table 10.
Adjustment statistics for the three airports considering fluctuation factor.
When compared with the initial results, we observed that both the adjustment time and the total number of adjusted flights decreased, thereby optimizing the allocation of flight slots based on variable airport capacities. This confirms the feasibility of the model. For a more visual comparison, the hourly adjustments both with and without the fluctuation factor are shown in Figure 11 and Figure 12.
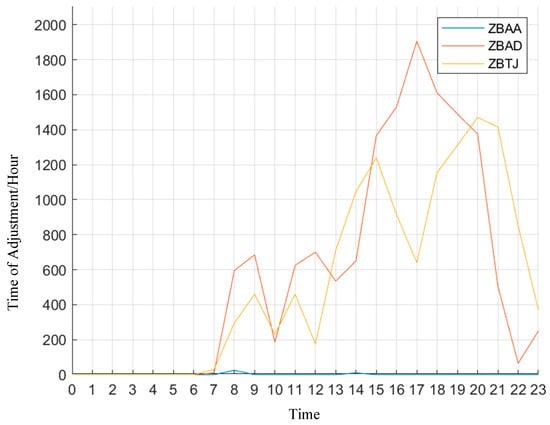
Figure 11.
Hourly adjustment statistics for the three airports without fluctuation factor.
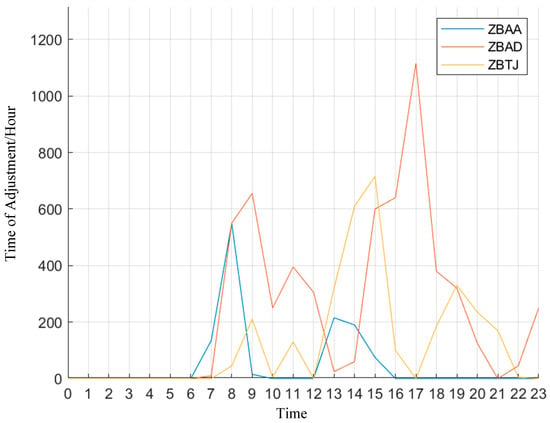
Figure 12.
Hourly adjustment statistics for the three airports with fluctuation factor.
The inclusion of the fluctuation factor led to significant improvements. Following are the key observations:
- Without the fluctuation factor: Adjustments at ZBAA were minimal, while ZBAD and ZBTJ saw substantial adjustments. ZBAD had a maximum hourly adjustment of 1900 min, while ZBTJ peaked at 1450 min;
- With the fluctuation factor: adjustments at ZBAD and ZBTJ were reduced to 1100 and 500 min, respectively, with a slight increase at ZBAA;
- Total and average adjustments: Without the fluctuation factor, the total adjustment across all three airports was 29,480 min, with an average hourly adjustment of approximately 1230 min. With the fluctuation factor, the total adjustment dropped to 9965 min, and the average hourly adjustment decreased to around 415 min;
- Total number of adjusted flights: the inclusion of the fluctuation factor reduced the total number of adjusted flights from 817 to 511, representing 306 fewer affected flights.
To further analyze the optimization by direction, we separated all flights at the three airports into five directions (Northeast, Southwest, Northwest, Central-South, and East China). The adjustments from 0:00 to 6:00, 7:00 to 12:00, 13:00 to 18:00, and 19:00 to 23:00 were calculated, and the results are shown in Figure 13 and Figure 14.
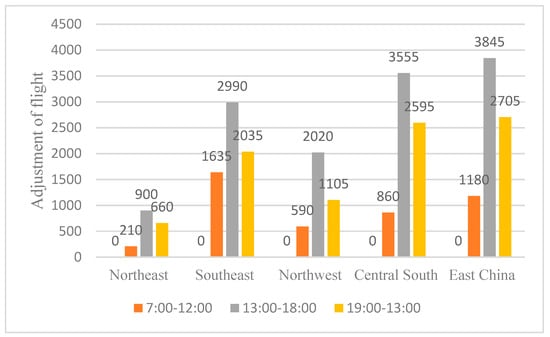
Figure 13.
Waypoint adjustment statistics without fluctuation factor.
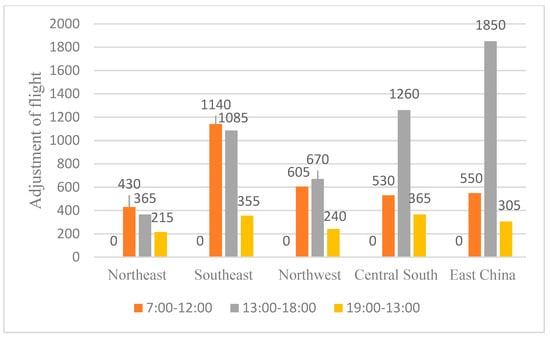
Figure 14.
Waypoint adjustment statistics with fluctuation factor.
The charts illustrate that, due to low flight volume between 0:00 and 6:00, no adjustments were necessary during this time. For the period 13:00–18:00, the adjustments without the fluctuation factor were concentrated, with high volumes leading to significant delays. After optimization, the adjustments during this time period were redistributed, and, in many directions (especially Central-South and East China), they decreased significantly.
After the statistical analysis, the adjustment volumes with and without the fluctuation factor in each direction are presented in Table 11 and Table 12.

Table 11.
Adjustment statistics by slot in each direction without fluctuation factor.

Table 12.
Adjustment statistics by slot in each direction with fluctuation factor.
From the tables, it is evident that incorporating the fluctuation factor resulted in reduced adjustments across all time periods for each direction. Specifically, the total adjustments in all directions, except for the Northeast, were significantly reduced by more than half. The optimization effect was particularly pronounced for the Central-South and East China directions, which typically experience high flight volumes. This reduction demonstrates the substantial improvement in efficiency achieved by considering the fluctuation factor.
5. Conclusions
This study develops and evaluates a flight slot allocation model for the Beijing-Tianjin-Hebei airport cluster, addressing key challenges related to airport and waypoint capacity limitations. By integrating airport and airspace resource constraints, the proposed model ensures optimal slot distribution while minimizing operational disruptions. The results highlight the importance of accounting for capacity fluctuations, demonstrating that incorporating fluctuation factors significantly enhances the allocation process and reduces the need for extensive slot adjustments. In particular, the analysis of the Beijing-Tianjin-Hebei airport cluster underscores the varying demands at different airports, suggesting that tailored slot allocation strategies can improve overall efficiency.
The computational experiments revealed that, without considering capacity fluctuations, substantial adjustments were required, especially at secondary airports. Conversely, factoring in the fluctuation aspect improved the alignment of flight schedules with actual capacity, thereby reducing operational inefficiencies. This study also emphasizes the importance of maintaining a balance between the declared capacity, the fluctuating actual capacity, and the demand for slots.
Future research could extend the model by incorporating additional dynamic factors such as real-time weather conditions, air traffic control restrictions, and emergency events. Additionally, the potential impact of emerging technologies such as automation and AI in air traffic management could be explored to further optimize flight slot allocation processes and improve the sustainability of air transport networks.
This research contributes to the broader understanding of airspace and airport management in highly congested regions and offers practical insights for policymakers and aviation authorities seeking to enhance the efficiency of air traffic systems. By adopting more adaptive and data-driven allocation frameworks, airports can better accommodate fluctuating demands while minimizing the economic and operational costs associated with flight delays and schedule disruptions.
Author Contributions
Conceptualization, J.R.; Methodology, J.R.; Software, C.L.; Formal analysis, Z.S.; Writing—original draft, J.R.; Writing—review & editing, S.Q.; Visualization, L.M.; Supervision, S.Q.; Project administration, L.W.; Funding acquisition, L.W. All authors have read and agreed to the published version of the manuscript.
Funding
This research was funded by the Fundamental Research Funds for the Central Universities of China, grant number 3122024042.
Data Availability Statement
The data presented in this study are available on request from the corresponding author. The data are not publicly available due to privacy.
Conflicts of Interest
The authors declare no conflict of interest.
References
- ADR in Beijing: Civil Aircraft Market Forecast Annual Report 2020–2039. 2020. Available online: https://www.avic.com/c/2020-12-22/513568.shtml (accessed on 22 December 2020).
- Jacquillat, A.; Odoni, A.R. A roadmap toward airport demand and capacity management. Transp. Res. Part A Policy Pract. 2018, 114, 168–185. [Google Scholar] [CrossRef]
- Jacquillat, A.; Odoni, A.R. Endogenous control of service rates in stochastic and dynamic queuing models of airport congestion. Transp. Res. Part E Logist. Transp. Rev. 2015, 73, 133–151. [Google Scholar] [CrossRef][Green Version]
- Yan, C.; Vaze, V.; Barnhart, C. Airline-driven ground delay programs: A benefits assessment. Transp. Res. Part C Emerg. Technol. 2018, 89, 268–288. [Google Scholar] [CrossRef]
- Liu, H.; Zhang, X.; Zhang, X. Multiscale complexity analysis on airport air traffic flow volume time series. Phys. A Stat. Mech. Appl. 2020, 548, 124485. [Google Scholar] [CrossRef]
- Wang, Y.; Zhang, Y. Prediction of runway configurations and airport acceptance rates for multi-airport system using gridded weather forecast. Transp. Res. Part C Emerg. Technol. 2021, 125, 103049. [Google Scholar] [CrossRef]
- Mannino, C.; Nakkerud, A.; Sartor, G. Air traffic flow management with layered workload constraints. Comput. Oper. Res. 2021, 127, 105159. [Google Scholar] [CrossRef]
- Jiang, Y.; Xue, Q.; Wang, Y.; Cai, M.; Zhang, H.; Li, Y. Traffic congestion mechanism in mega-airport surface. Phys. A Stat. Mech. Appl. 2021, 577, 125966. [Google Scholar] [CrossRef]
- Huo, Y.; Delahaye, D. A probabilistic model based optimization for aircraft scheduling in terminal area under uncertainty. Transp. Res. Part C Emerg. Technol. 2021, 132, 103374. [Google Scholar] [CrossRef]
- Ikli, S.; Mancel, C.; Mongeau, M.; Olive, X.; Rachelson, E. The aircraft runway scheduling problem: A survey. Comput. Oper. Res. 2021, 132, 105336. [Google Scholar] [CrossRef]
- Cheung, W.L.; Piplani, R.; Alam, S.; Bernard-Peyre, L. Dynamic capacity and variable runway configurations in airport slot allocation. Comput. Ind. Eng. 2021, 159, 107480. [Google Scholar] [CrossRef]
- Pawełek, A.; Lichota, P.; Dalmau, R.; Prats, X. Fuel-efficient trajectories traffic synchronization. J. Aircr. 2018, 56, 481–492. [Google Scholar] [CrossRef]
- Sun, R.; Li, J.; Niu, K.; Tian, Y.; Xu, C. Research on Joint Ground Movement Optimization Based on Bilevel Programming. Aerospace 2022, 9, 502. [Google Scholar] [CrossRef]
- Ribeiro, N.A.; Jacquillat, A.; Antunes, A.P.; Odoni, A.R.; Pita, J.P. An optimization approach for airport slot allocation under IATA guidelines. Transp. Res. Part B Methodol. 2018, 112, 132–156. [Google Scholar] [CrossRef]
- Jacquillat, A.; Odoni, A.R. An Integrated Scheduling and Operations Approach to Airport Congestion Mitigation. Oper. Res. Soc. Am. Oper. Res. 2015, 63, 1390–1410. [Google Scholar] [CrossRef]
- Zografos, K.G.; Jiang, Y. A Bi-objective efficiency-fairness model for scheduling slots at congested airports. Transp. Res. Part C Emerg. Technol. 2019, 102, 336–350. [Google Scholar] [CrossRef]
- Zografos, K.G.; Salouras, Y.; Madas, M.A. Dealing with the efficient allocation of scarce resources at congested airports. Transp. Res. Part C Emerg. Technol. 2012, 21, 244–256. [Google Scholar] [CrossRef]
- Corolli, L.; Lulli, G.; Ntaimo, L. The time slot allocation problem under uncertain capacity. Transp. Res. Part C Emerg. Technol. 2014, 46, 16–29. [Google Scholar] [CrossRef]
- Jacquillat, A.; Vaze, V. Interairline Equity in Airport Scheduling Interventions. Transp. Sci. 2018, 52, 941–964. [Google Scholar] [CrossRef]
- Androutsopoulos, K.N.; Madas, M.A. Being fair or efficient? A fairness-driven modeling extension to the strategic airport slot scheduling problem. Transp. Res. Part E Logist. Transp. Rev. 2019, 130, 37–60. [Google Scholar] [CrossRef]
- Androutsopoulos, K.N.; Manousakis, E.G.; Madas, M.A. Modeling and solving a bi-objective airport slot scheduling problem. Eur. J. Oper. Res. 2020, 284, 135–151. [Google Scholar] [CrossRef]
- Fairbrother, J.; Zografos, K.G. Optimal scheduling of slots with season segmentation. Eur. J. Oper. Res. 2021, 291, 961–982. [Google Scholar] [CrossRef]
- Katsigiannis, F.A.; Zografos, K.G. Optimising airport slot allocation considering flight-scheduling flexibility and total airport capacity constraints. Transp. Res. Part B Methodol. 2021, 146, 50–87. [Google Scholar] [CrossRef]
- Zeng, W.; Ren, Y.; Wei, W.; Yang, Z. A data-driven flight schedule optimization model considering the uncertainty of operational displacement. Comput. Oper. Res. 2021, 133, 105328. [Google Scholar] [CrossRef]
- Wang, D.; Zhao, Q. A simultaneous optimization model for airport network slot allocation under uncertain capacity. Sustainability 2020, 12, 5512. [Google Scholar] [CrossRef]
- Durand, N.; David; Gotteland, J.B.; Alliot, J.M. Metaheuristics for Air Traffic Management; John Wiley & Sons: Hoboken, NJ, USA, 2015. [Google Scholar]
- Katsigiannis, F.A.; Zografos, K.G.; Fairbrother, J. Modelling and solving the airport slot-scheduling problem with multi-objective, multi-level considerations. Transp. Res. Part C Emerg. Technol. 2021, 124, 102914. [Google Scholar] [CrossRef]
- Zhang, Y.; Yinge, A.; Wang, B.; Tian, W.; Wen, T. Stochastic programming model and algorithm for flight schedule optimization. J. Intell. Fuzzy Syst. 2021, 41, 5087–5098. [Google Scholar] [CrossRef]
- Pawelek, A.; Lichota, P. Tactical and Strategic Air Traffic Sequencing with Minimum-Fuel Trajectories. J. Theor. Appl. Mech. 2024, 63, 27–36. [Google Scholar] [CrossRef]
Disclaimer/Publisher’s Note: The statements, opinions and data contained in all publications are solely those of the individual author(s) and contributor(s) and not of MDPI and/or the editor(s). MDPI and/or the editor(s) disclaim responsibility for any injury to people or property resulting from any ideas, methods, instructions or products referred to in the content. |
© 2025 by the authors. Licensee MDPI, Basel, Switzerland. This article is an open access article distributed under the terms and conditions of the Creative Commons Attribution (CC BY) license (https://creativecommons.org/licenses/by/4.0/).