Article

Numerical Study of Wind Tunnel Wall Effects on Icing Cloud Distribution and Water Collection in Aero-Engine Nacelles

1
State Key Laboratory of Aerodynamics, Mianyang 621000, China
2
LowSpeed Aerodynamics Institute, China Aerodynamics Research and Development Center, Mianyang 621000, China
*
Author to whom correspondence should be addressed.
Aerospace 2025, 12(4), 335; https://doi.org/10.3390/aerospace12040335
Submission received: 10 March 2025 / Revised: 6 April 2025 / Accepted: 11 April 2025 / Published: 13 April 2025

Abstract

:
Icing wind tunnel tests play a critical role in evaluating ice accretion on aero-engine nacelles. However, the effects of the wind tunnel wall (WTW) on the dynamics of the icing cloud remain insufficiently quantified. This study employs an experimentally validated Eulerian–Eulerian multiphase approach to quantify WTW-induced alterations in Liquid Water Content (LWC) distribution inside the nacelle and droplet collection efficiency (β) on its surfaces. The results show that the WTW-induced flow deflection redirects droplets toward the outer nacelle surface, leading to an increase in the maximum droplet collection efficiency (βmax) and the total collected water mass on the nacelle under baseline conditions (Mach Number = 0.206) and causing a banded regime of the deviation in LWC. Parametric analysis further shows that higher inflow velocities and Median Volumetric Diameters (MVDs) enhanced the WTW’s effect on the change in LWC inside the nacelle and increased the maximum droplet collection efficiency on the nacelle’s surface. However, the increase in the intake flow rates exhibits a counteracting trend for the effect of the WTW for both the deviation in LWC and the maximum droplet collection efficiency and the total collected water mass. The findings highlight the necessity of accounting for WTW effects in icing wind tunnel testing protocols to improve flight condition extrapolation accuracy.

1. Introduction

When an aircraft flies through clouds containing supercooled water droplets, ice can accumulate on the windward surface of the wing and engine inlet components [1,2], which seriously endangers flight safety [3,4]. The nacelle of the aero-engine is one of the most crucial components vulnerable to icing [5]. Ice accumulation on the nacelle alters its aerodynamic properties and blocks the engine’s inlet, reducing the inlet flow and potentially causing engine surges. Different from the external components like wings, engine nacelles are primarily mostly internal icing. In considering that the LWC of the icing cloud is a key parameter for studying icing issues [6,7], LWC variations along the engine’s flow path differ significantly across incoming conditions and are interrelated. Therefore, icing on the nacelle and the variation in the icing cloud inside it have drawn a lot of attention from researchers worldwide [6].
Experimental studies and numerical simulations are essential methods for investigating cloud variations. From the numerical standpoint, various ice prediction codes, such as NASA LEWICE [8], FENSAP-ICE [9,10], ICECREMO [11], CIRA Multi-ICE [12,13], ONERA [14], and PoliMIce [15], have been developed by research institutions. These codes serve as valuable tools for aircraft design and certification. This method has the advantages of low cost and short cycles. Once validated by wind tunnel tests, their results are highly reliable and not constrained by physical scale or specific working conditions. Experimental studies play a crucial role in understanding the physics of icing and in developing reliable icing simulation methods. The primary ground-based facilities for icing research are icing wind tunnels, with notable examples operated by NASA [16], Boeing [17], NRC [18], Cox [19], CIRA [20], and others. Engine icing test cells are classified into sea-level and altitude types. They are used to observe ice accretion on engine inlets and to evaluate engine performance under icing conditions. Tests to evaluate the anti-icing systems of engine components are typically conducted in icing wind tunnels, as they are more cost-effective than tests performed in engine icing test cells. Al-Khalil et al. [21] developed a hybrid ice protection system and conducted tests in the NASA Icing Research Tunnel (IRT) using a stabilizer section from a light business jet. Burick and Ryan [22] described the key engineering and testing efforts required to obtain commercial certification for the C-130 J transport aircraft’s ice protection system. Planquart et al. [23] used infrared thermography combined with a heating foil method to measure convective heat transfer in an anti-icing system, employing a full-scale wing leading-edge model. Papadakis et al. [24] conducted experiments in the NASA IRT to investigate the performance of a hot-air ice protection system on a business jet wing. The tests were conducted under a warm hold, a cold hold, and descent in-flight icing conditions, with varying bleed air parameters. Dong et al. [25,26] performed experiments using the YFB-02 icing wind tunnel to evaluate the performance of hot-air and hot-lubrication-oil anti-icing systems. These experiments systematically investigate ice accumulation on engine components under complex conditions, providing diverse ice shapes and measurement data. The test results support model validation in numerical simulations and enhance the accuracy and reliability of simulations [27,28].
However, the WTW restricts natural airflow [29], causing the icing conditions in the WTW to differ from actual free-flow conditions. This leads to a deviation in the β and variations in internal cloud parameters compared to actual flight conditions. Increasing the wind tunnel size or reducing the nacelle model size can minimize the error caused by the interference of the WTW. However, expanding the size of the wind tunnel is difficult due to construction challenges, engineering investment, and operating costs [30], while reducing the test model size also has limitations because of the complexity of the scaling law for icing tests [30,31]. Therefore, it is crucial to study how the WTW affects the icing cloud inside the nacelle and the β on the nacelle surface during icing wind tunnel tests [32].
Most studies on the effect of the WTW in the literature have primarily focused on the aerodynamic effects on airfoils, while a few studies have also been conducted on the effect of the WTW on the β for airfoils [29]. Qin [33] numerically studied the effect of the WTW on the impingement of water droplets on swept wings. The results showed that the WTW can cause a shift in the maximum β in cases of large blockages. Clark [34] experimentally found that the effect of the WTW on the β at a stationary point is negligible when the product of the Droplet Reynolds Number is less than 100. Zocca [29] observed that the WTW could alter the ice shape on the airfoil and cause a deviation of more than 10% in the lift coefficient. Guo [35] numerically investigated the effect of the WTW on ice accretion on airfoils, revealing that the WTW can change the droplet velocity direction and cause shifts in the βmax.
Currently, there is limited research on the effect of the WTW on the β of the nacelle and the distribution of the LWC of the water droplets inside the nacelle. However, some studies have already been conducted on the effect of the WTW on the aerodynamic forces of the nacelle. Rae and Pope [36] suggested that the blockage ratio should not exceed 7.5%, as the nacelle’s size can cause a higher blockage effect than a wing. In contrast, the Federal Aviation Administration (FAA) [37] recommends that the blockage ratio should not exceed 10%. Burk [38] conducted a series of experimental and numerical studies on wind tunnel blockage in engine intake during icing wind tunnel tests and revealed that the WTW affects the uneven distribution of pressure inside the nacelle. Matthew [39] tested multiple nacelles and found that the presence of the WTW can introduce additional blockage effects that distort the flow around the nacelle. Additionally, there are also some studies on icing and β on nacelle walls in the literature.
Isobe [40] and Suzuki developed a numerical program to predict supercooled large droplet (SLD) icing on a nacelle wall. Their results demonstrated that SLD icing significantly affects fan blade performance inside the nacelle, reducing aerodynamic efficiency and potentially causing severe accidents. Wang [41] numerically studied the icing phenomenon at the engine nacelle lip, revealing that a low-pressure area appears on the inside of the lip, and under the influence of increased velocity and reduced pressure, icing is more likely to occur. Guan [42] conducted a numerical study on the icing phenomena of the engine’s nacelle, focusing primarily on the β and icing characteristics across the cowling blades and lip area at varying inlet velocities. The above studies primarily concentrated on the external flow field of the nacelle or the area near the lip, while the effects of the WTW on the LWC inside the nacelle and the β of the nacelle remain insufficiently explored.
It is crucial to understand the effect of the WTW on the β of a nacelle and the distribution of icing clouds inside it during an icing wind tunnel test, yet few studies in the literature address this issue. To bridge this gap, this paper numerically investigates the effect of the WTW on the distributions of LWC inside a nacelle and β, comparing results with and without the WTW. Based on this, the effects of the WTW on LWC and β under different incoming flow velocities, water droplet diameters, and inlet flow rates were also studied.

2. Methods

2.1. Governing Equations

The Eulerian–Eulerian method is used to simulate air droplet flow [43], which considers only the momentum and energy transferred from the air to the droplets, assuming the airflow and droplet flow are continuous. The calculation involves two steps: First, this study primarily investigates the internal flow within the engine nacelle, where near-wall resolution is not the primary concern. Therefore, a density-based solver is used to solve the Reynolds-Averaged Navier–Stokes (RANS) equations [30], coupled with the realizable k-ε turbulence model. A second-order upwind scheme is applied for spatial discretization to enhance numerical accuracy. The convergence criterion for the residuals of all field variables is set to 10−12. All key parameters meet this threshold during the iterative process, ensuring the reliability of the numerical results.
Then, the Eulerian method is used to calculate the droplet trajectories, enabling the prediction of LWC variation inside the nacelle and droplet collection efficiency on the surface. This method was selected because the two-phase flow inside the nacelle is dilute, with relatively low droplet concentrations. As a result, the momentum exchange from droplets to the air can be reasonably neglected in the simulation [44]. It is worth noting that, for computational simplicity, this study does not consider the actual droplet size distribution within clouds. Instead, calculations are performed using the MVD under the assumption of a uniform distribution [45].
The numerical method used in this study has exhibited adequate computational accuracy in prior applications. Its robustness and reliability are widely acknowledged in the field of icing simulation, thereby reinforcing the credibility of the results [39,44].
The airflow is simulated by solving the RANS equations. The continuity equation is
x i ρ v a i = 0 ,
where x i and v a i are the spatial coordinates and velocity of the air, respectively.
The momentum equation can then be written as
x i ρ v a i v a j = x j μ v a i x j ρ v a i v a j ¯ P x i ,
where ρ v a i v a j ¯ is the Reynolds stress, which is modeled using the realizable k–ε model. μ is the viscosity of gas molecules and P is the pressure.
x i ρ v a i c p T = x j κ t μ e f f T x i + v a i x j μ e f f v a i x j + v a j x i 2 3 μ e f f v a k x k ,
where c p is the heat capacity of gas and T is the temperature. κ t and μ e f f are the thermal conductivity and viscosity of air, respectively.
The water droplets are also treated as a continuous fluid in the Eulerian–Eulerian method. The concentration of droplets is represented by the volume fraction, α. The continuity equation for water droplets is
x j ρ w α v i = 0 ,
where v i and ρ w are the velocity and density of the water droplets, respectively, and α is the volume fraction of the water droplets. Considering that LWC is equivalent to the ρ w α , LWC was selected as the analysis factor of droplet flow.
The momentum equation can then be written as
x j ρ w α v i v j = ρ w α K v a i v i + ρ w α g i ,
where K is the momentum transfer coefficient between the air and water droplets, which is
K = 18 μ a ρ w d 2 C d Re w 24 ,
where Cd is the drag coefficient calculated using the Schiller–Naumann model as
C d = max 24 Re w 1 + 0.15 Re w 0.687 , 0.44 ,
where Rew is the relative Reynolds number defined as
R e w = ρ a v a v d μ a ,
Here, d is the diameter of the water droplets, and va and v are the velocity vectors for the air and water, respectively.
The local water collection coefficient is defined as
β = ρ w α v n L W C U ,
where v n is the normal velocity of water droplets on the wall, and U and LWC are the incoming velocity and Liquid Water Content, respectively.

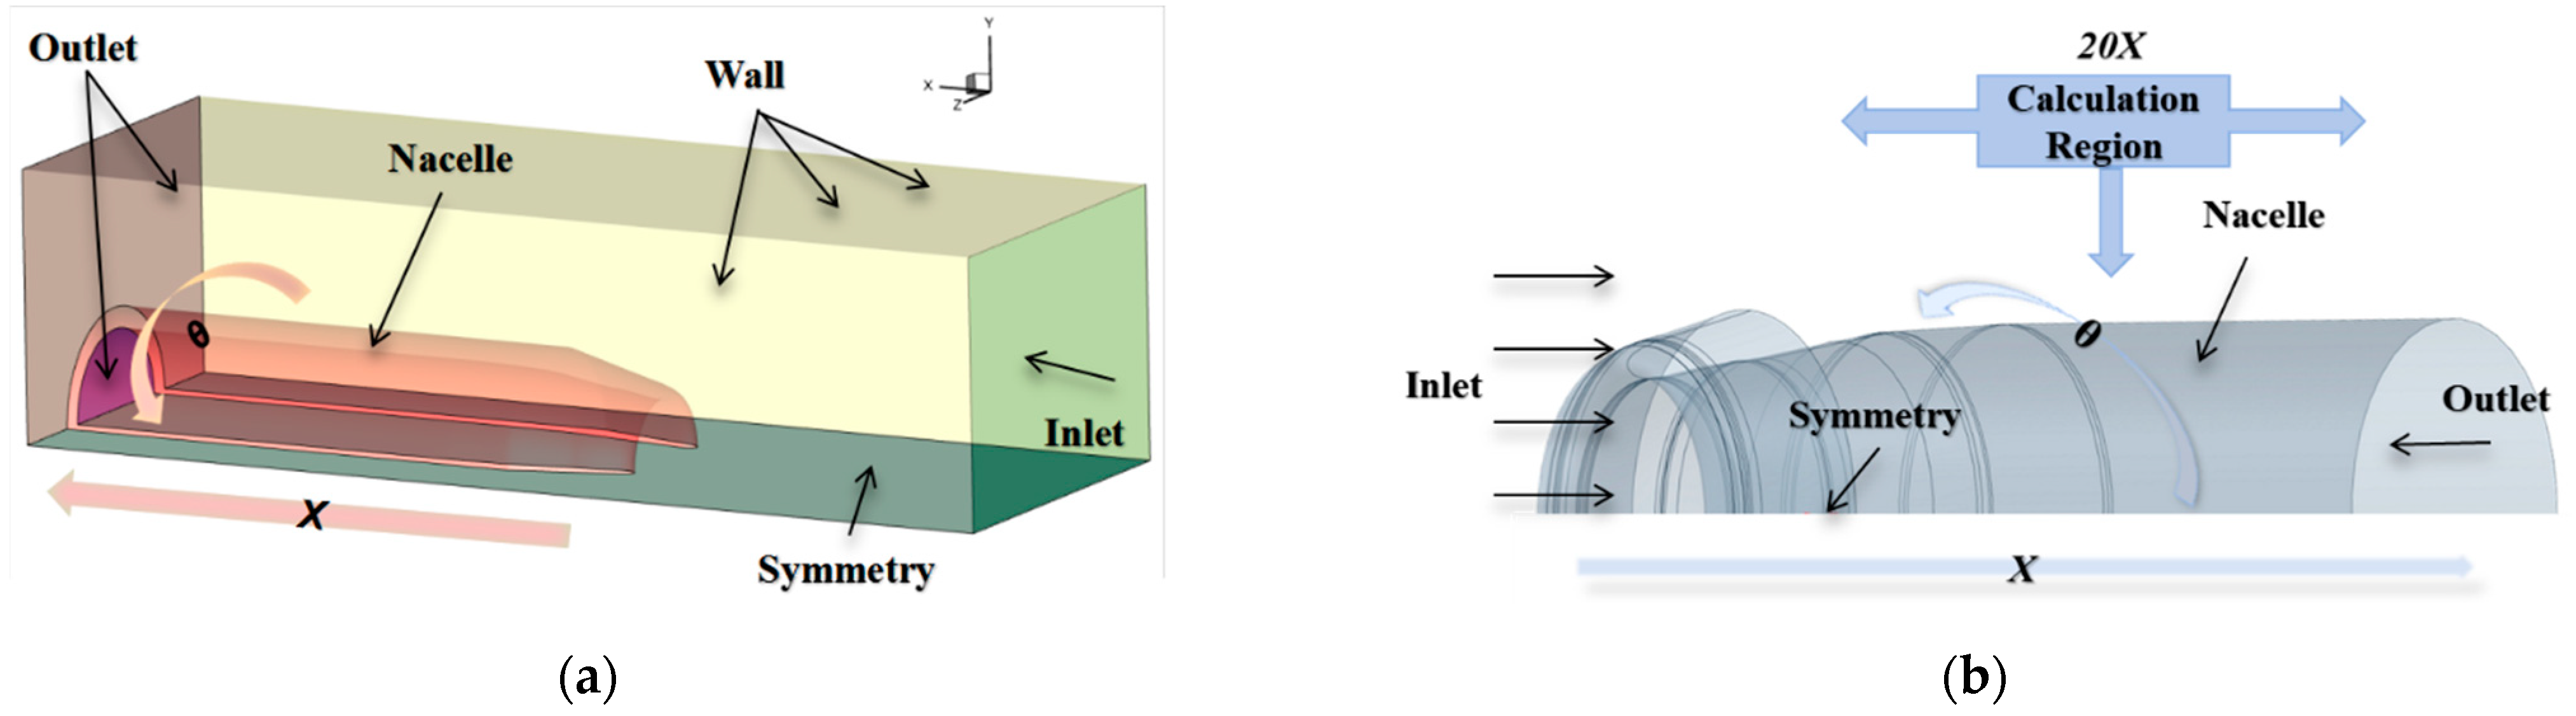
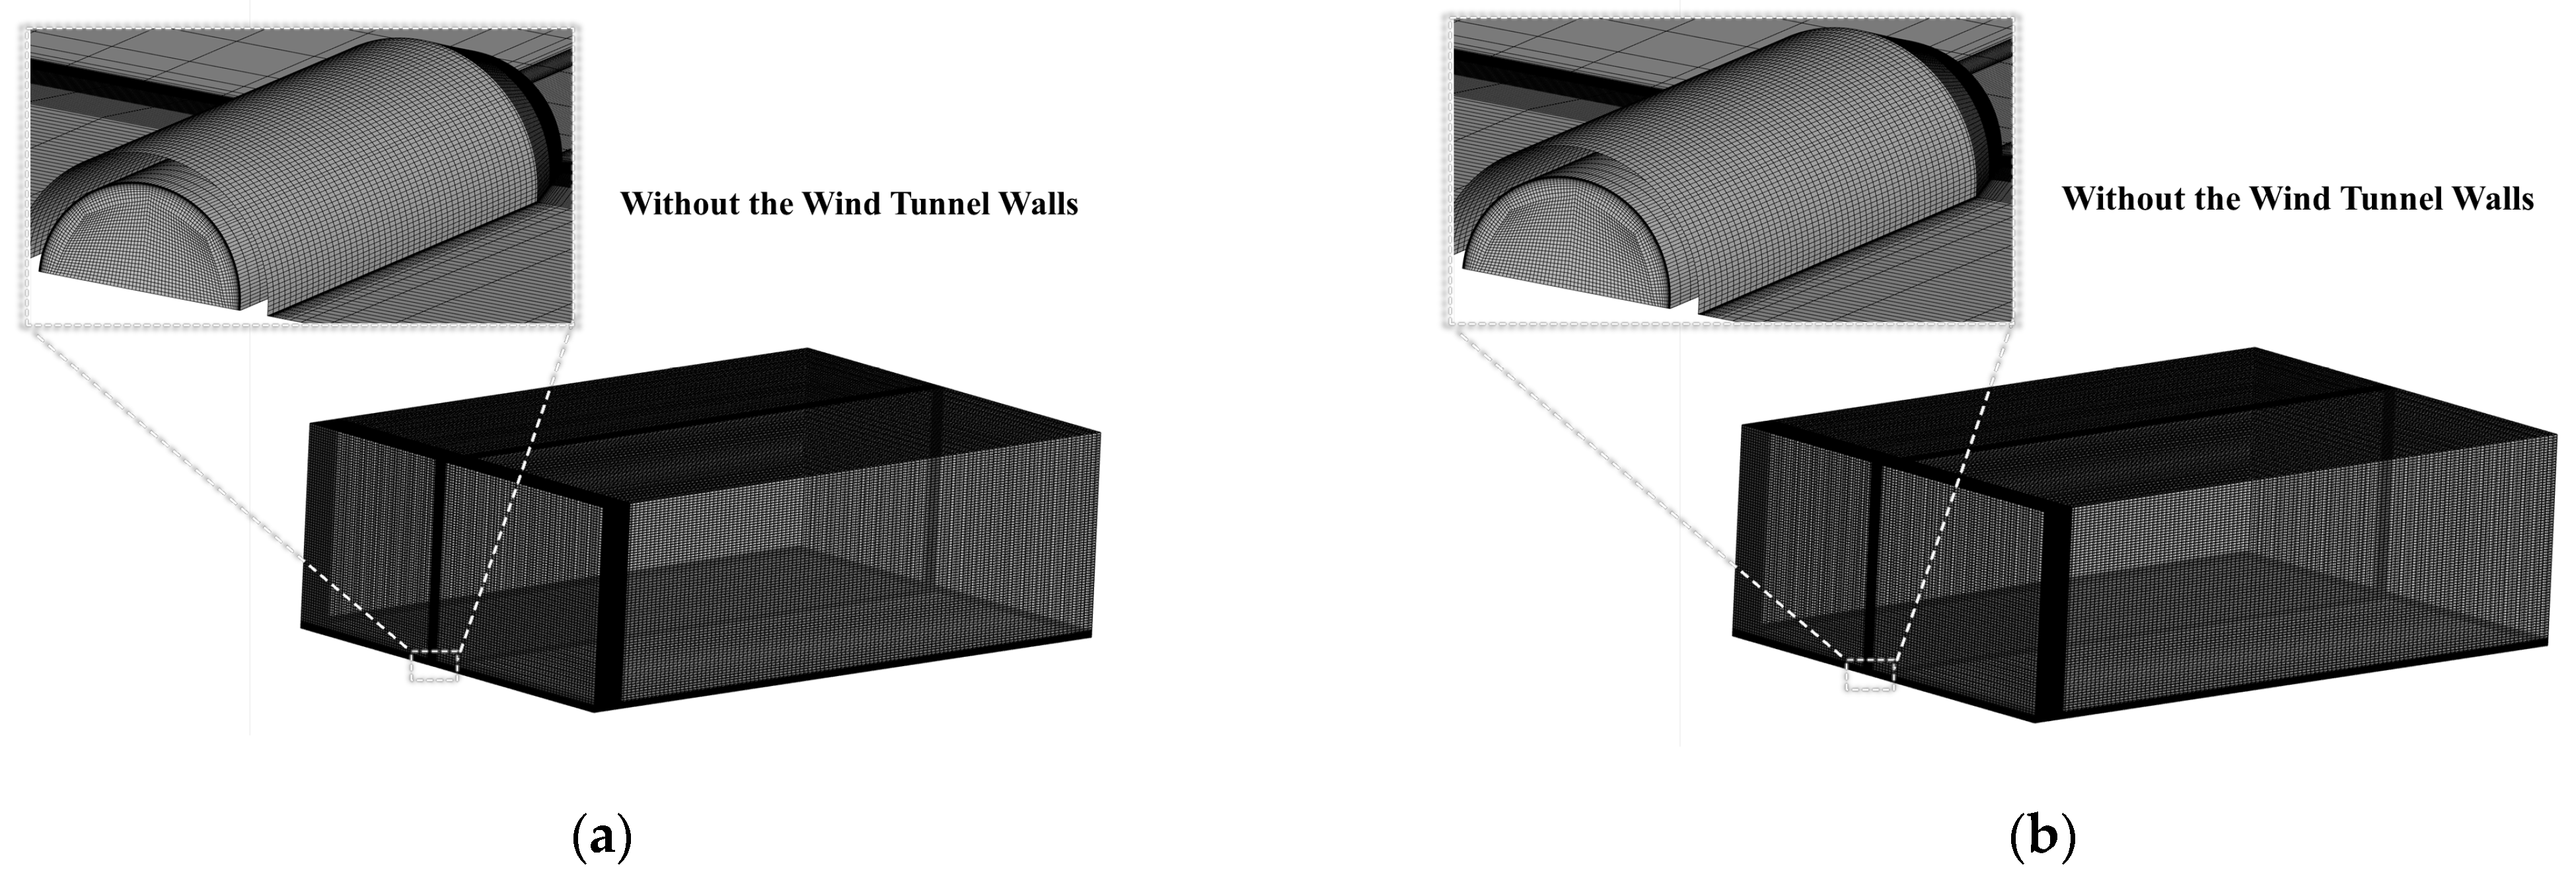
2.2. Geometry Model and Mesh

The aero-engine nacelle studied in this paper has an axisymmetric geometric shape. To reduce the mesh size, a half-model was employed, and the details of the nacelle are shown in Figure 1. Figure 1 illustrates a schematic of the nacelle and the computational domain. To analyze the effect of the WTW on droplet flow, two different computational domains were established for the same nacelle geometry. In the configuration without the WTW, a far-field boundary condition was applied, with the computational domain extended to 20 times the nacelle length in all directions to minimize the influence of artificial boundaries.
The far-field surfaces were set as pressured far-field boundaries to simulate open atmospheric conditions. In contrast, for the configuration with the WTW, the computational domain had fixed dimensions of 3.2 m × 4.8 m in the y and z directions, consistent with the actual wind tunnel test section. The side walls of the test section were modeled as no-slip walls to represent the solid tunnel boundaries. In both configurations, the nacelle surface was defined as a no-slip wall, and the nacelle outlet was specified with a fixed mass flow outlet condition to simulate the engine intake flow rate. In Figure 1, X represents the characteristic length of the nacelle, and θ represents the angle in the radial direction. Considering the geometric symmetry, the subsequent analysis was conducted on the θ = 0° (z = 0 m) cross-section.
The structured grids with a refinement near the nacelle lip are used in both cases, as shown in Figure 2. The boundary layer grid near the nacelle wall for both cases has a height of around 0.04 mm to maintain the y+ around 15 in the calculation. The first set had 2,551,452, 4,805,623, and 7,108,943 cells. The second set, with a larger domain, had 6,908,921, 9,837,632, and 12,642,756 cells. Grid independence was verified for both cases. Figure 3 shows the variation in the average LWC at the nacelle outlet and the βmax on the nacelle surface with different mesh densities. The results indicate that both the average LWC and the βmax on the nacelle surface gradually stabilize as the number of mesh cells increases. Therefore, a medium-density (4,805,632 and 9,837,632) grid was selected for this study to balance accuracy and efficiency.
In Table 1, Ma represents the Mach number. To quantify the effects of wall interference, the analysis was conducted under the same conditions for both cases with and without a WTW, which are shown in Table 1. First, Case_1 was used to analyze the impact of the WTW on the LWC variations within the nacelle and the droplet impact characteristics on the surface. Then, the effects of the WTW were compared under different conditions. These conditions included varying incoming flow speeds (Case_1–Case_3), intake flow rates Q (Case_6, Case_7, Case_3), and MVDs (Case_3–Case_5). It should be noted that, because the water droplets are assumed to be uniformly distributed, the d is equal to the MVD.

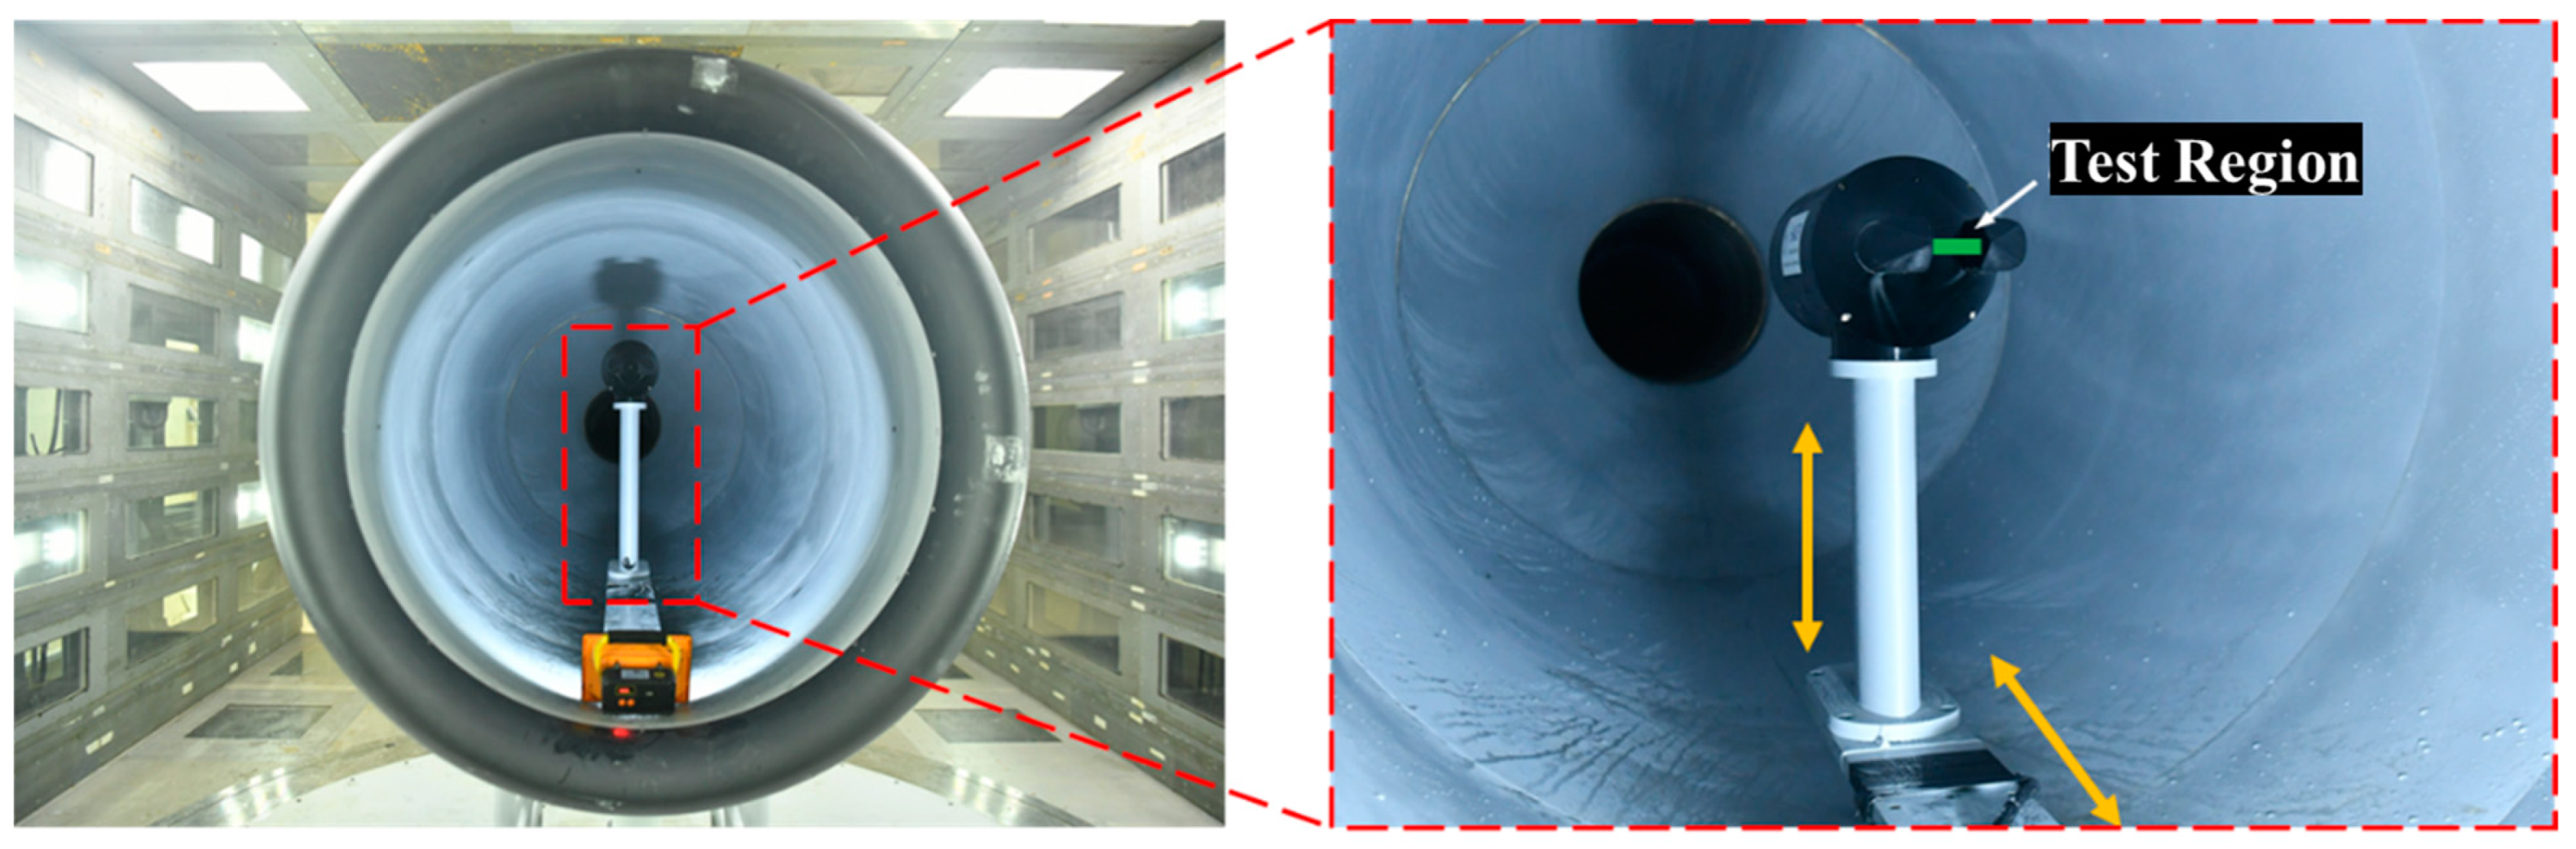
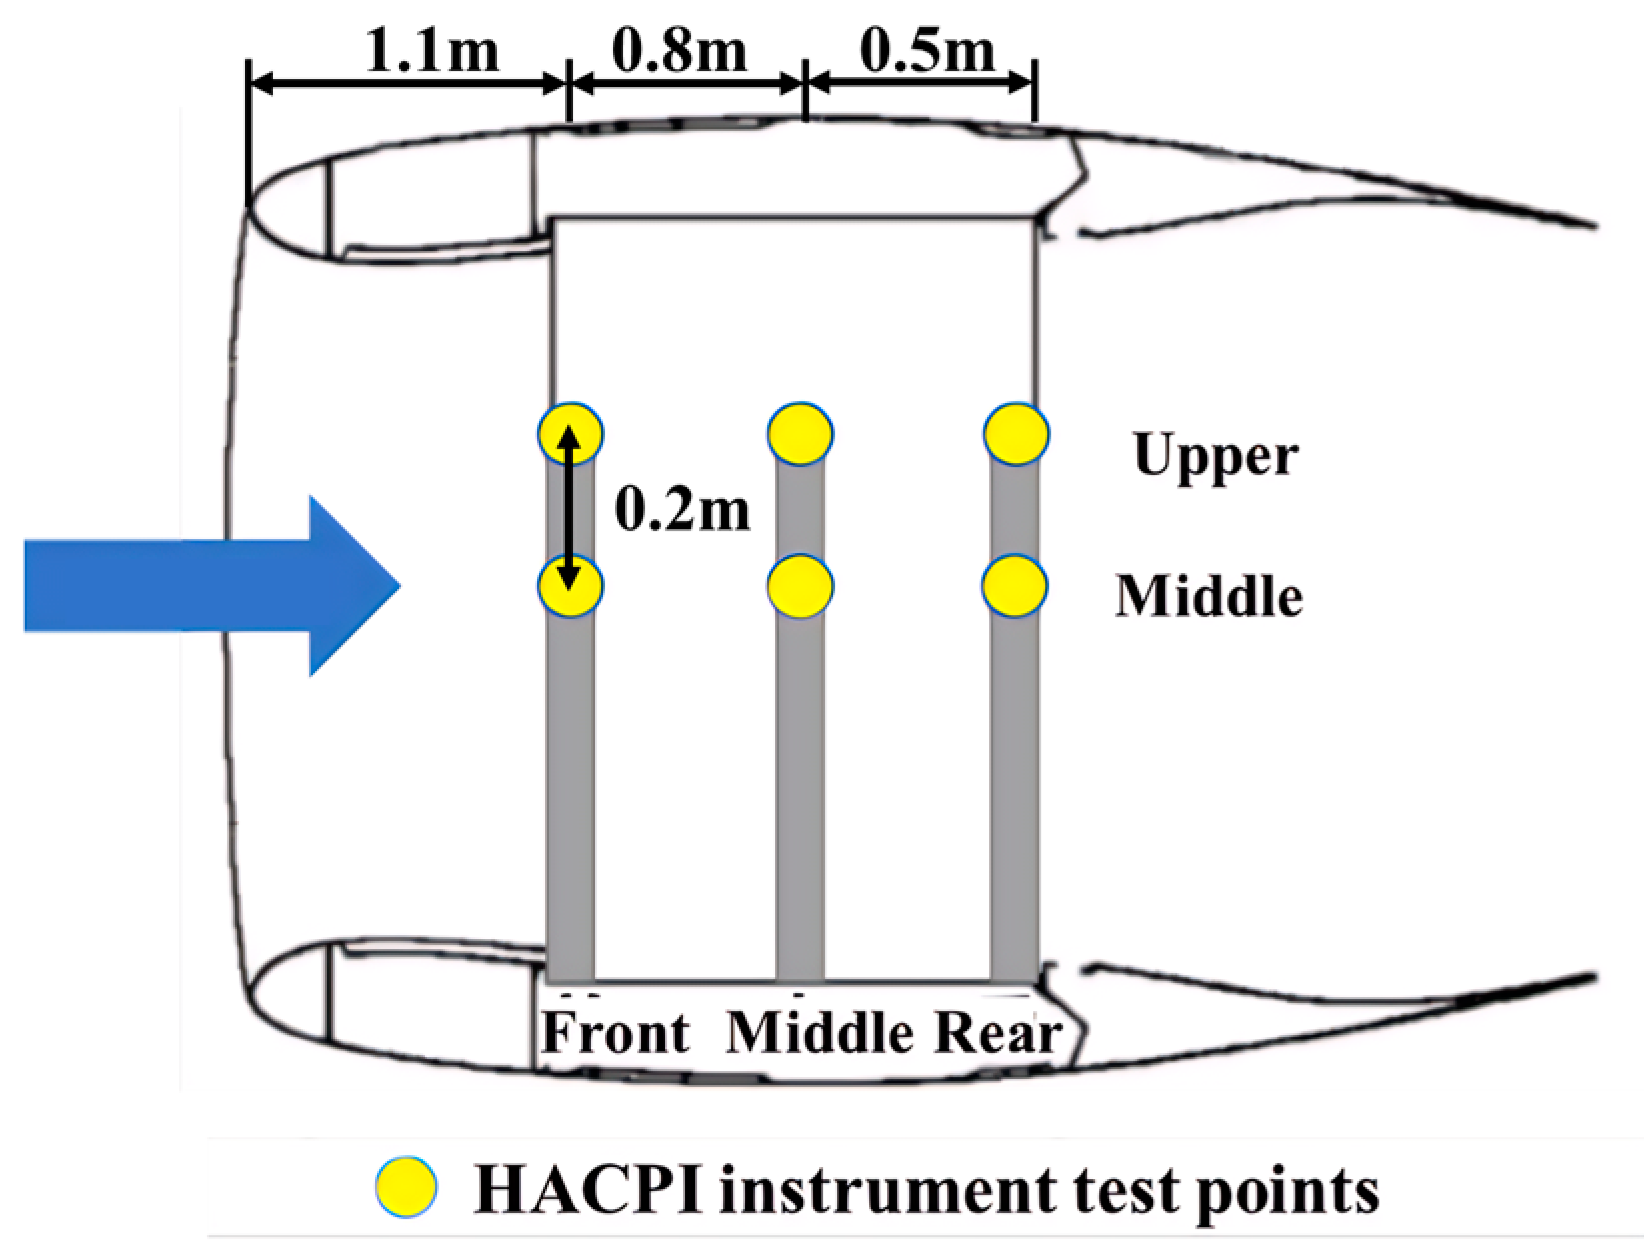
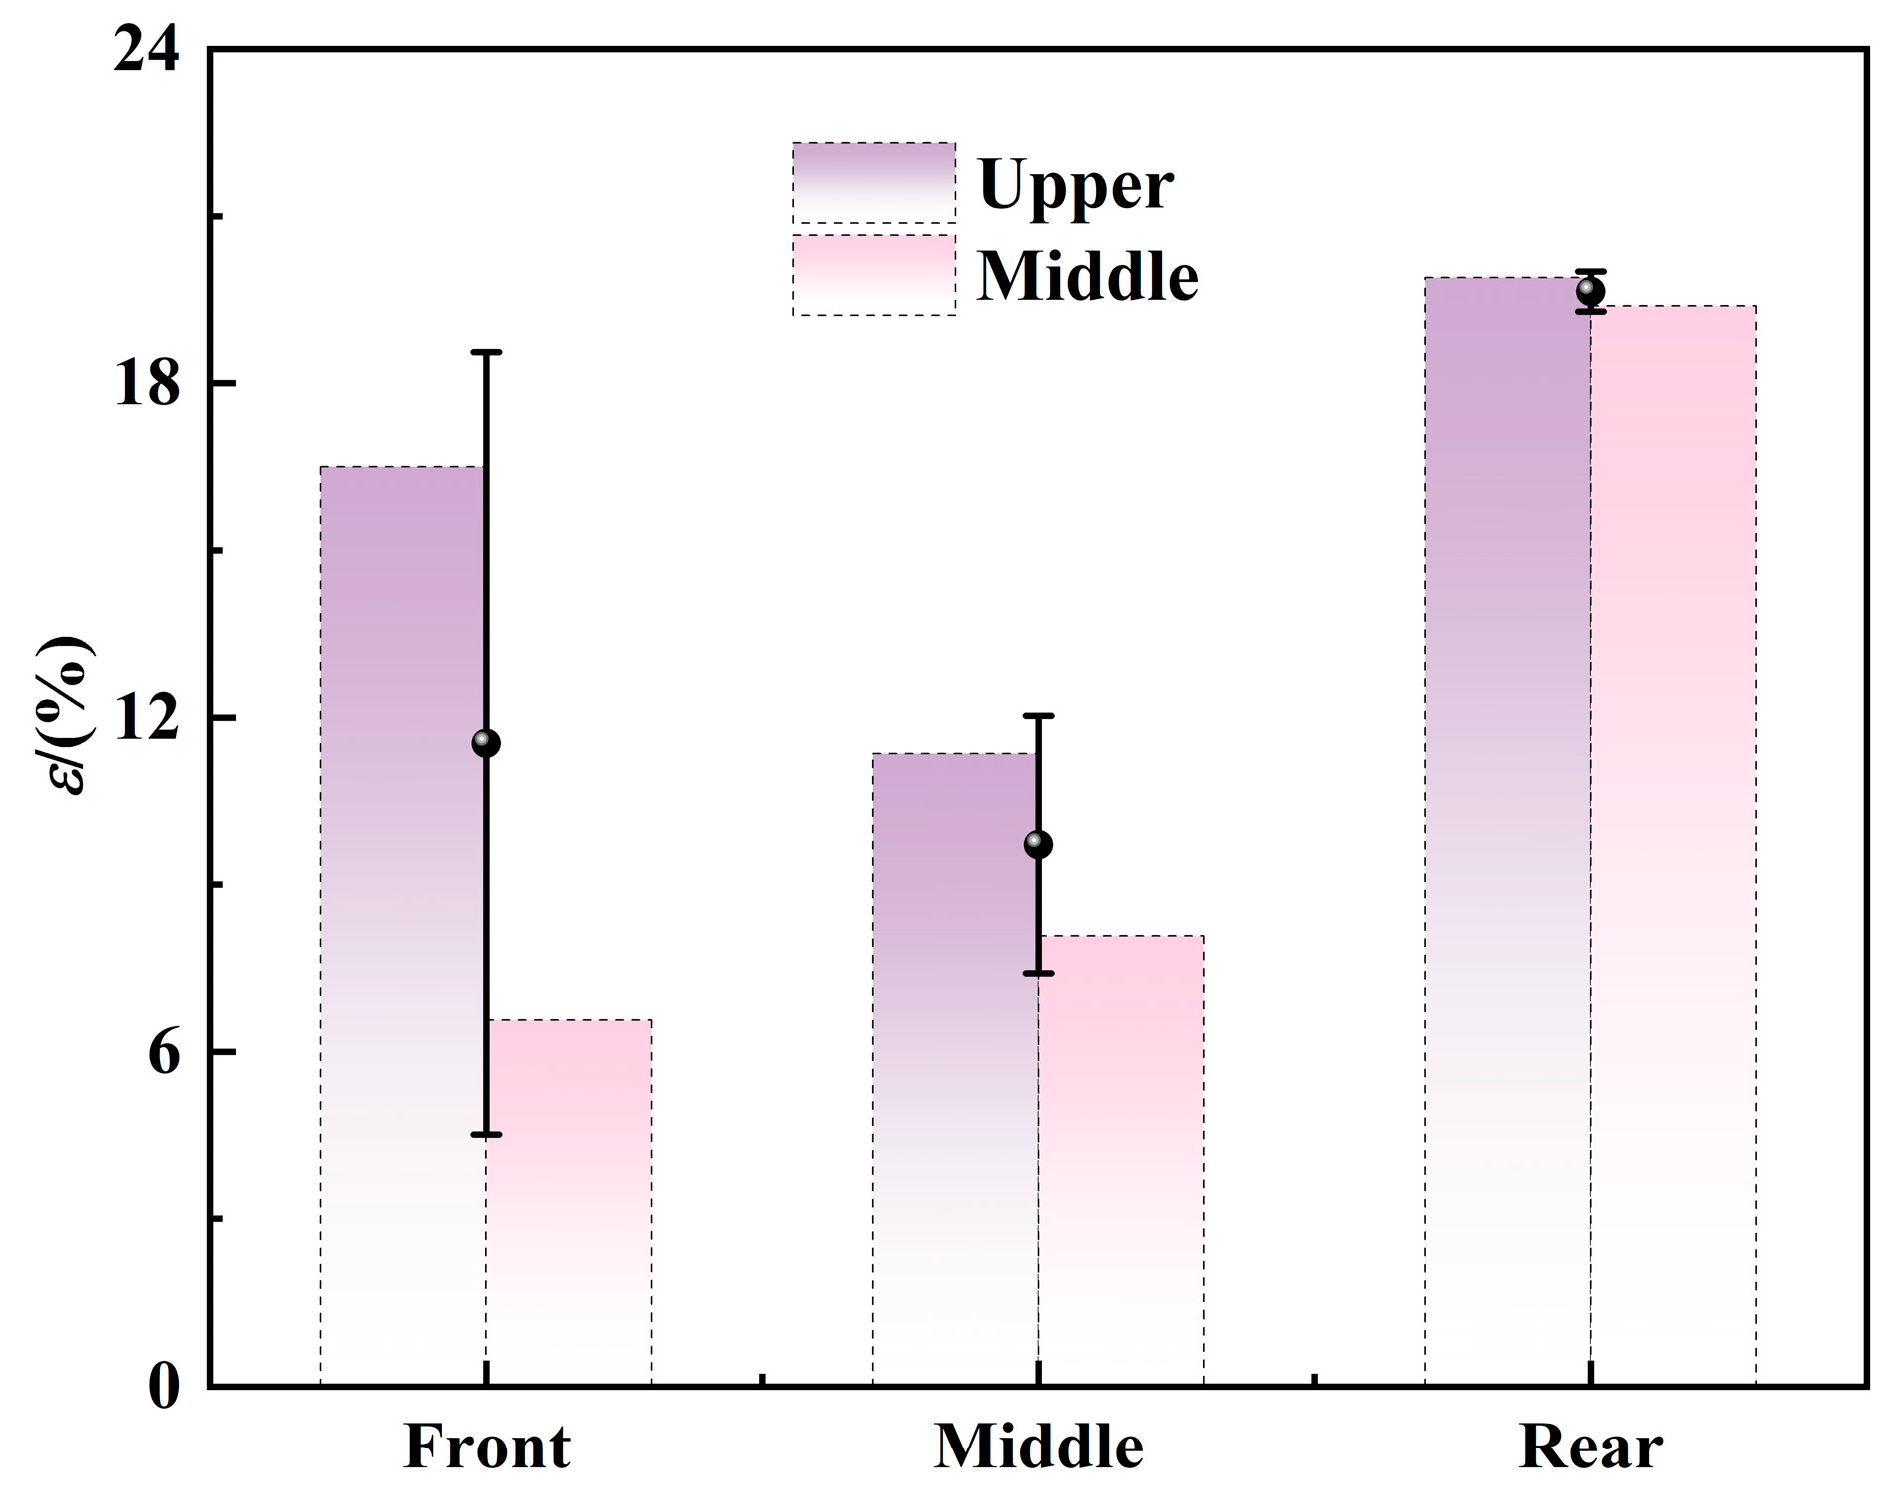
2.3. Experimental Validation of the Numerical Method

To validate the numerical method, an experiment was performed for the same nacelle shown in Figure 1 in the CARDC’s icing wind tunnel [30] to measure LWC in the icing cloud inside the nacelle (see Figure 3). The experiment was performed in the 3.2 m × 4.8 m test section of the icing wind tunnel [46], and the LWC was measured using the Holographic Airborne for Cloud Particle Imager (HACPI) developed by Zhejiang University whose equipment error is 8.12% [47] in Figure 4. It needs to be noted separately that the droplet size distribution approximately followed a normal distribution in the experiments.
To study the variation in cloud parameters along the nacelle, six measurement positions were set: Front-Upper, Front-Middle, Middle-Upper, Middle-Middle, Rear-Upper, and Rear-Middle. These positions covered three axial and two vertical locations, as shown in Figure 5. In the experiment, the HACPI was automatically moved to these different sections to measure the LWC in the same test set. The air velocity VTS was set to 20 m/s, the LWC to 1 g/m3, the MVD to 40 μm, the Q to 30 kg/s, and the T to 263 K.
The data and numerical results of the experiments are shown in Table 2. Figure 6 shows the comparison of numerical and experimental results. It is worth noting that the measurement of LWC inside the nacelle poses significant experimental challenges. Due to spatial limitations and harsh testing conditions, LWC measurements require relatively large instruments, which inevitably disturb the local flow field and compromise measurement accuracy. Considering these constraints, a relative error of approximately 20% between numerical predictions and experimental results is considered acceptable within the current experimental setup. Thus, the absolute relative error between the calculated LWC and experimental results is less than 20% in the large icing wind tunnel test, indicating good agreement between the numerical and experimental data and validating the feasibility of the calculation method used in the current paper.

3. Results and Discussion

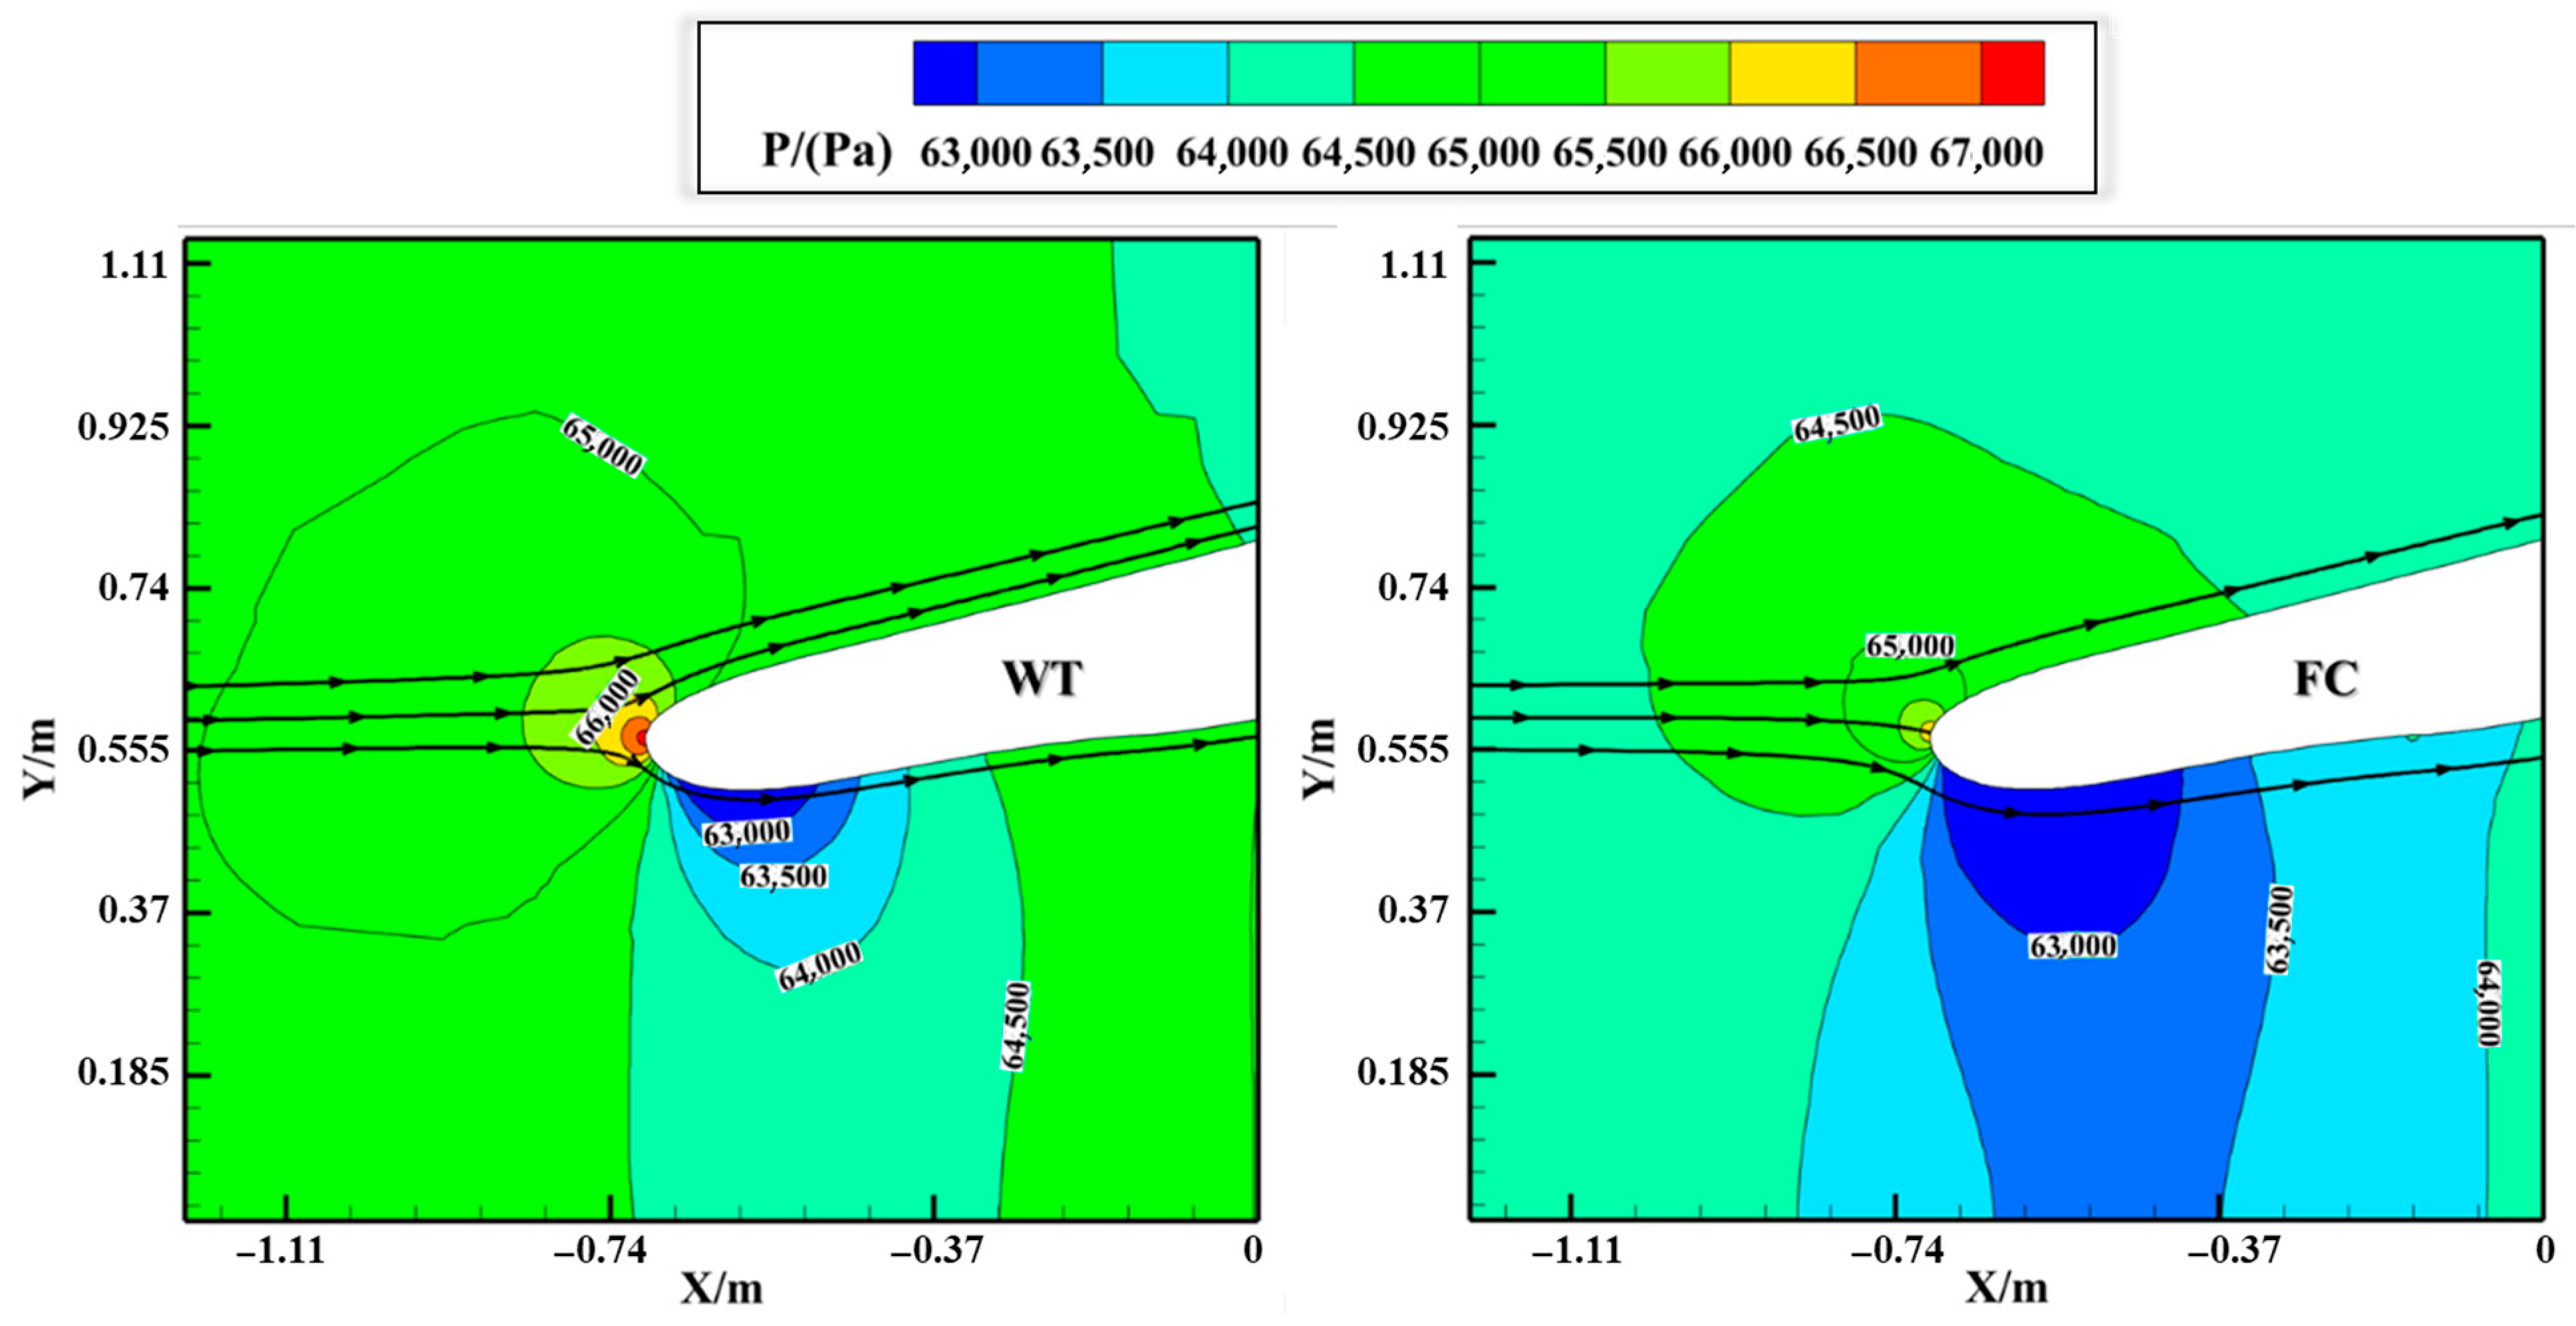
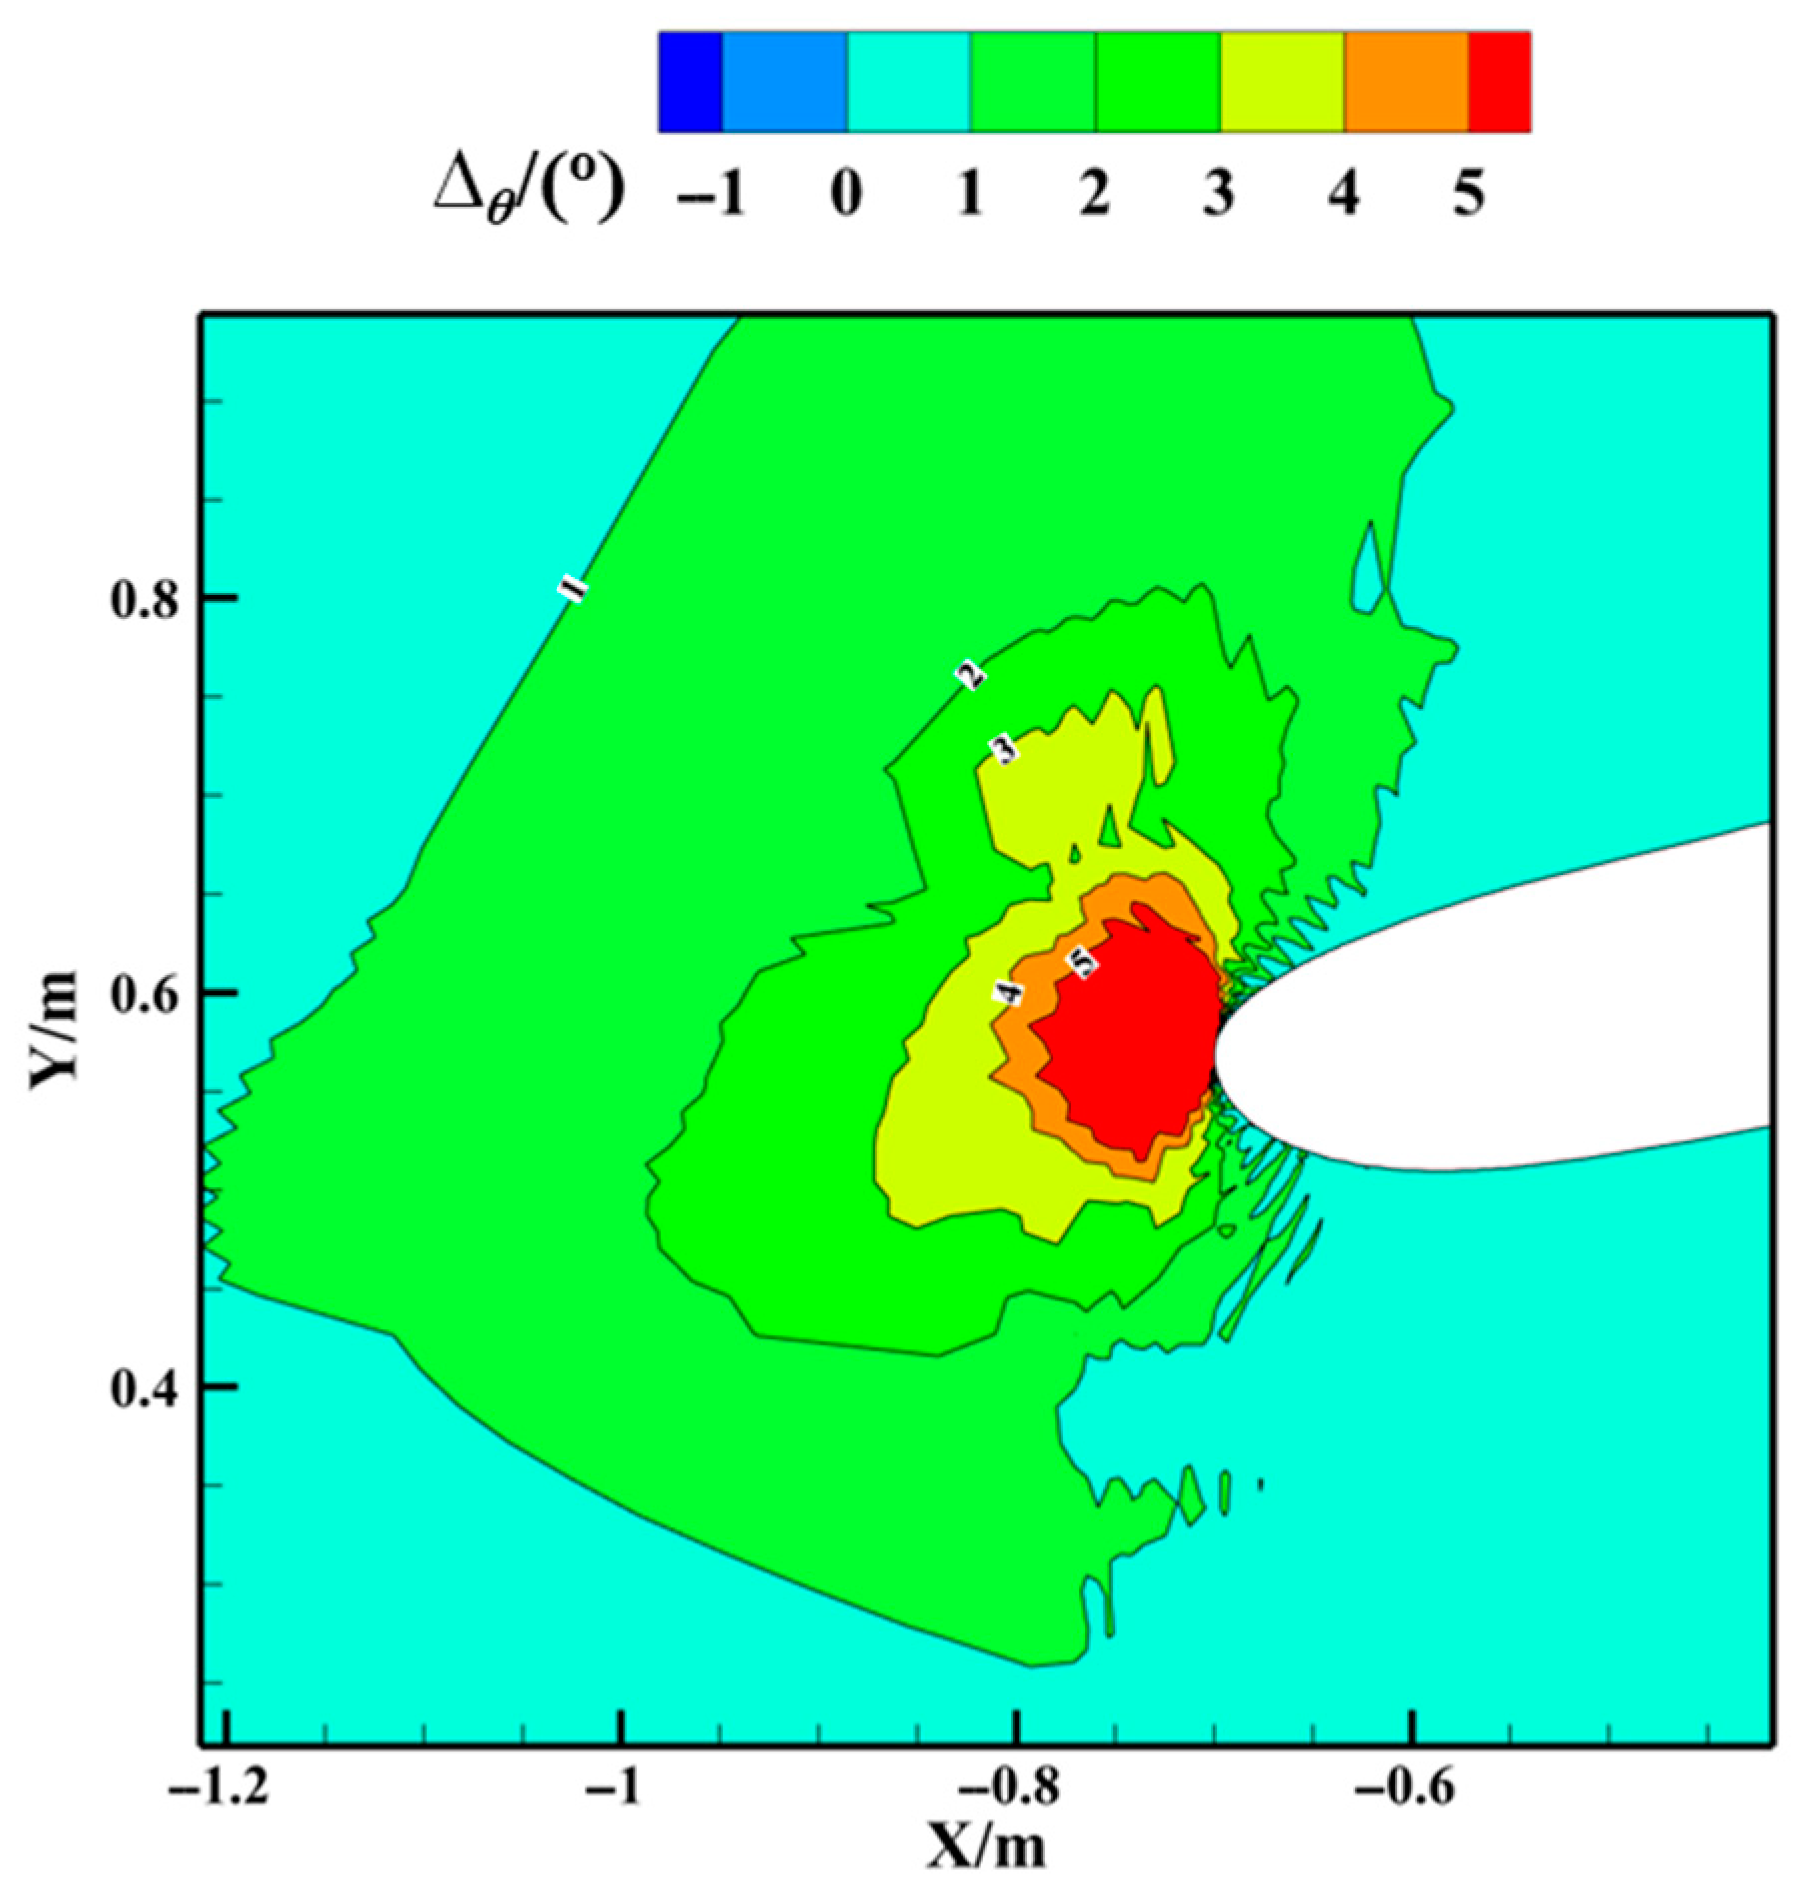
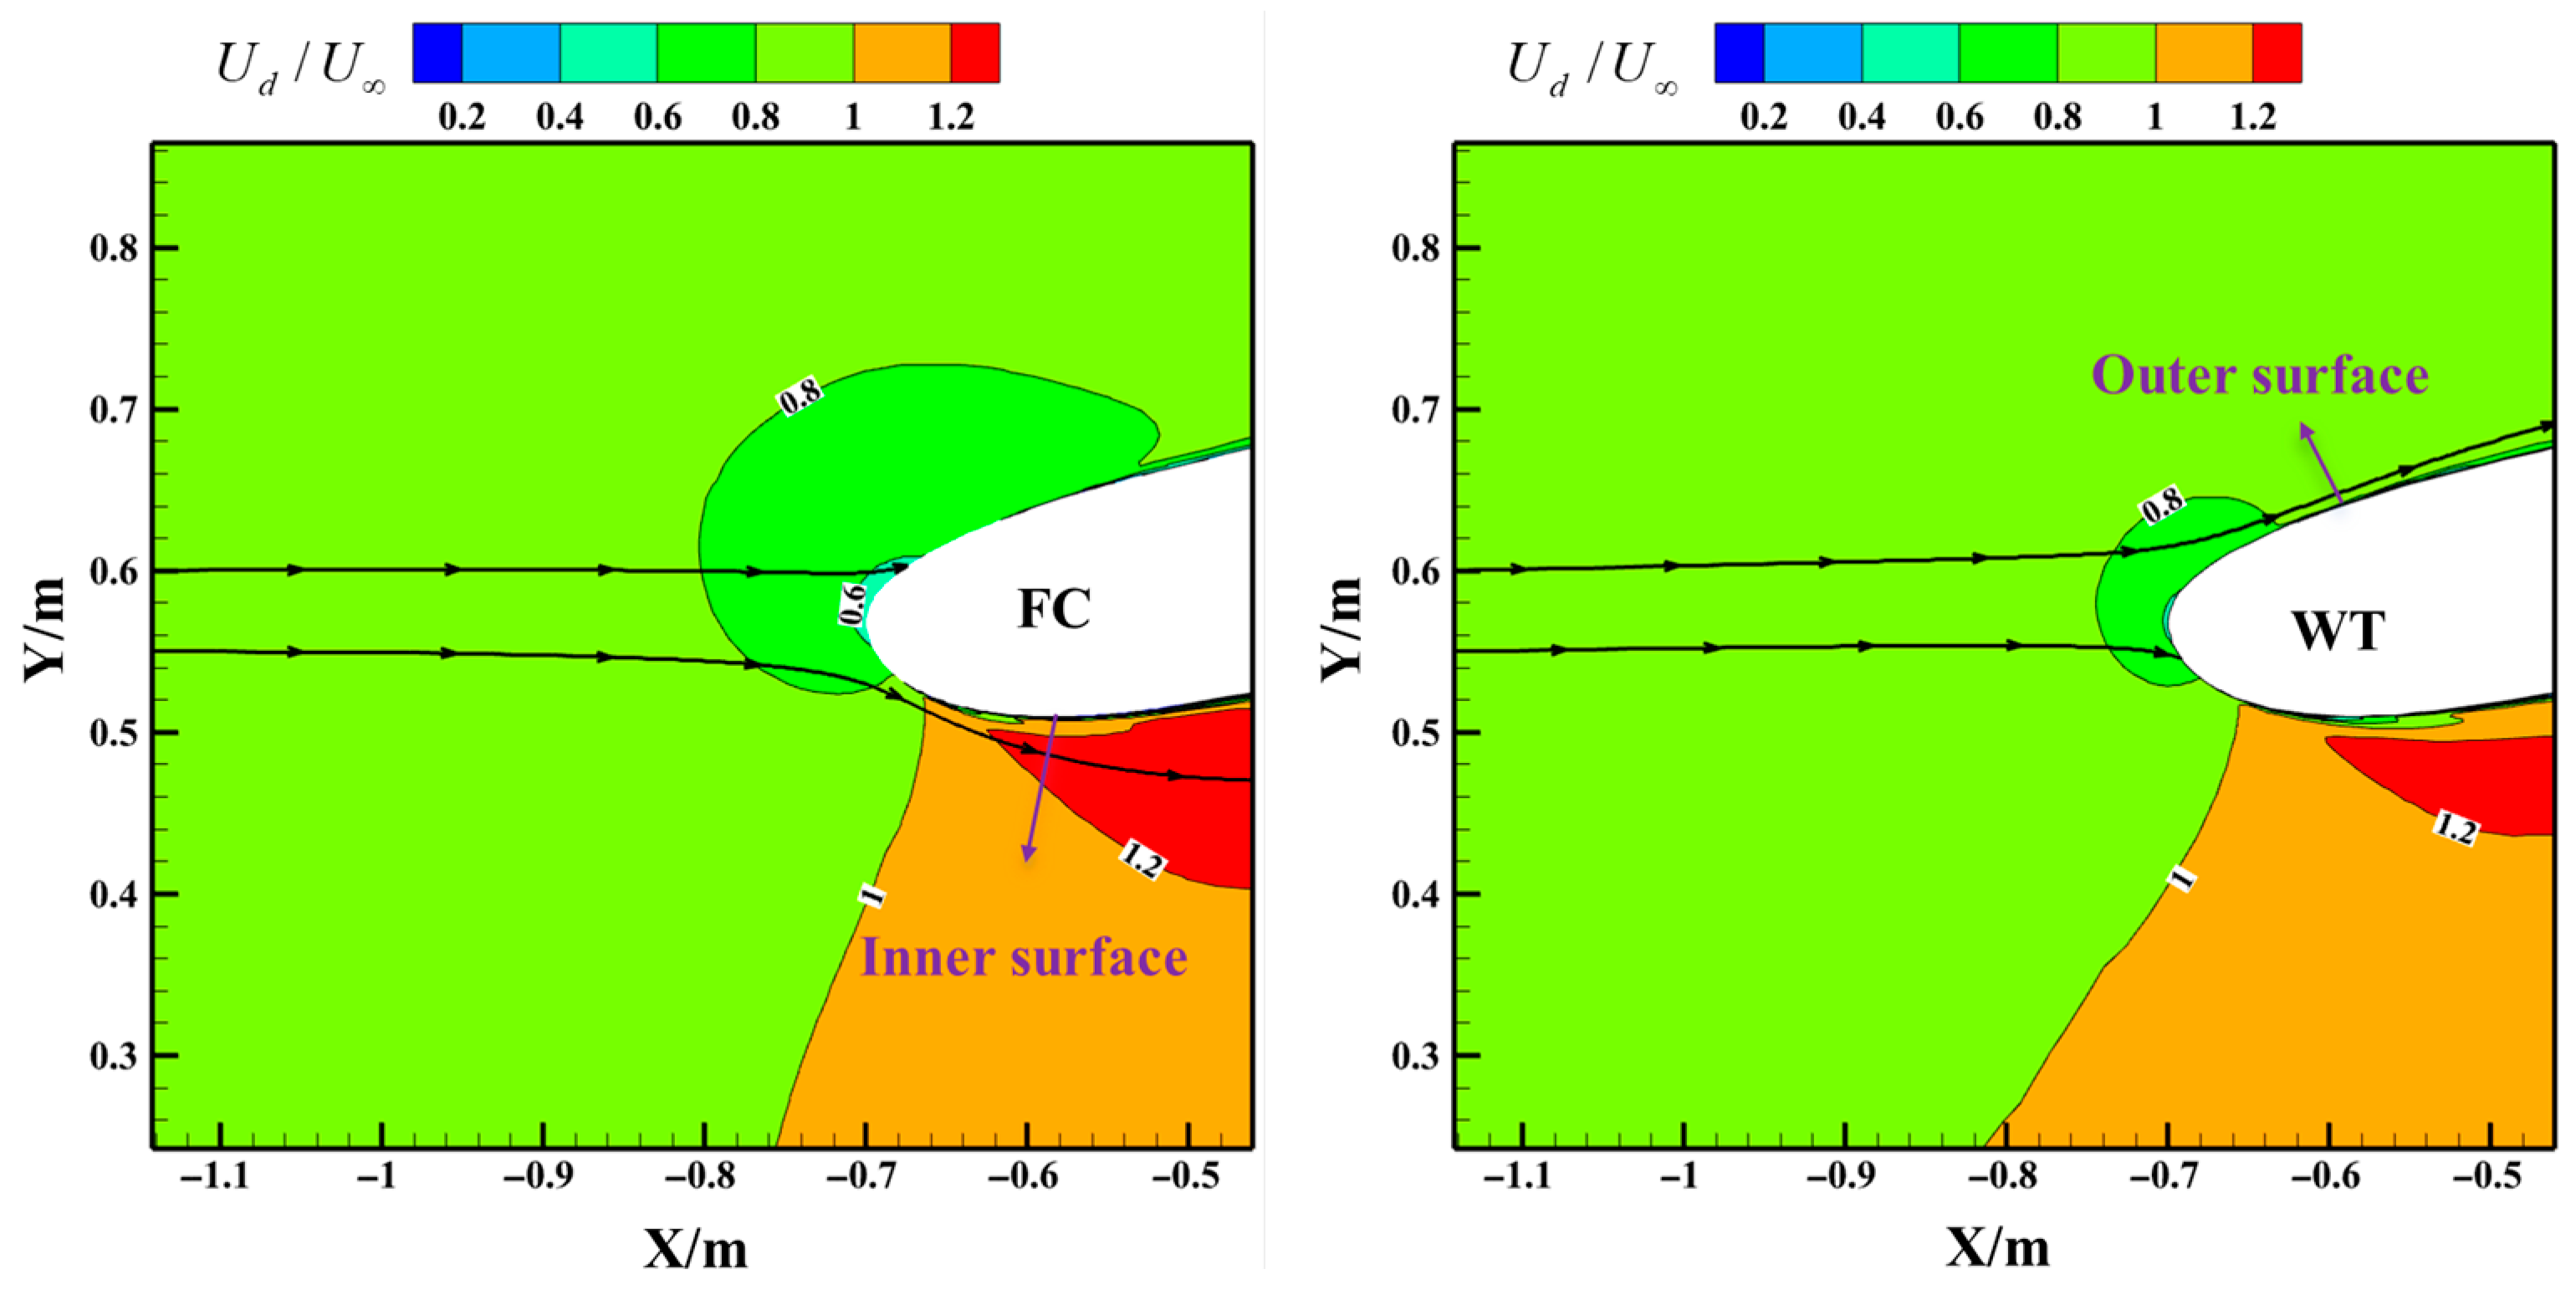
3.1. WTW Effects on the LWC Distribution Within the Nacelle

Figure 7 compares the distribution of LWC with and without the WTW under the Case_1 condition. “FC” represents cases without the WTW, and “WT” refers to cases with the WTW. As illustrated in Figure 7a, a region of low LWC develops adjacent to the nacelle wall in both scenarios. This phenomenon occurs because the water droplets have higher inertia compared to the surrounding airflow. Consequently, when the droplets approach the nacelle’s leading edge, they are unable to fully adjust their trajectory to align with the airflow direction, ultimately resulting in the formation of the water droplet shielding area. In addition, a large LWC regime occurs near the boundary of the shielding regime because of the accumulation of water droplets in this area. Figure 7b illustrates the deviation in LWC ( Δ L W C = L W C W T L W C F C ) between cases with and without the WTW. As depicted, the presence of the WTW reduces LWC near the outer surface of the nacelle. However, inside the nacelle, the WTW induces the formation of two adjacent banded zones. In the band zone near the inside wall, the LWC increases, while LWC decreases in the other band regime. These banded zones inside the nacelle are caused by the slight shift in the regime of accumulated water droplets near the shielding area inside the nacelle, as shown in Figure 7a.
The alteration in LWC due to the WTW is primarily driven by the effect of the WTW on the airflow field. Figure 7 compares the pressure field and streamlines of airflow for scenarios with and without the WTW. As illustrated, the geometric profile of the nacelle can induce a negative angle for axial airflow. Additionally, the suction effect of the airflow inside the nacelle causes the airflow outside the nacelle to move toward the core regime of the nacelle and proceed downstream, further increasing the negative angle of attack of the leading-edge airflow. Consequently, the pressure regime changes near the front inside the nacelle without the WTW. Define the airflow deflection angle Δ θ . The presence of the WTW establishes a contraction channel between the nacelle’s outer wall and the WTW surface, inducing local airflow acceleration. As evidenced in Figure 8, this configuration alters the airflow direction near the nacelle fore section, deviating from the axial orientation ( Δ θ > 0 ) in Figure 9. Consequently, the aerodynamic adjustment reduces the effective negative angle of attack, thereby diminishing the low-pressure zone within the nacelle as depicted in Figure 7. This airflow realignment also modifies the LWC distribution patterns. Specifically, the accumulated LWC regime shifts inward along the nacelle’s interior wall (Figure 7a), forming the characteristic band structure observed in Figure 7b. Simultaneously, the modified flow field establishes a distinct LWC decrease adjacent to the nacelle’s exterior surface.

3.2. WTW Effects on the Water Collection Coefficient on the Nacelle Wall

Figure 10 compares the values of the water collection coefficient β on the nacelle’s surface (at z = 0 m section) for Case_1, with and without the presence of the WTW. With the WTW present, the β increases notably near the lip region and on the inner surface of the nacelle. In contrast, the WTW has a minimal effect on β on the outer surface of the nacelle. Additionally, the droplet impact limit increases on the inner surface, and the βmax shifts toward the inner surface. This phenomenon occurs because the WTW redirects the droplet velocity more radially, thereby increasing the impacted water droplets on the inside wall of the nacelle in Figure 11. Additionally, with the WTW presented, the increment in the maximum water collection coefficient Δβmax rises by 9.73%, and the increment in the total collected water mass on the nacelle wall ΔM increases by 9.46%. These results demonstrate that the WTW significantly enhances water collection on the nacelle wall.

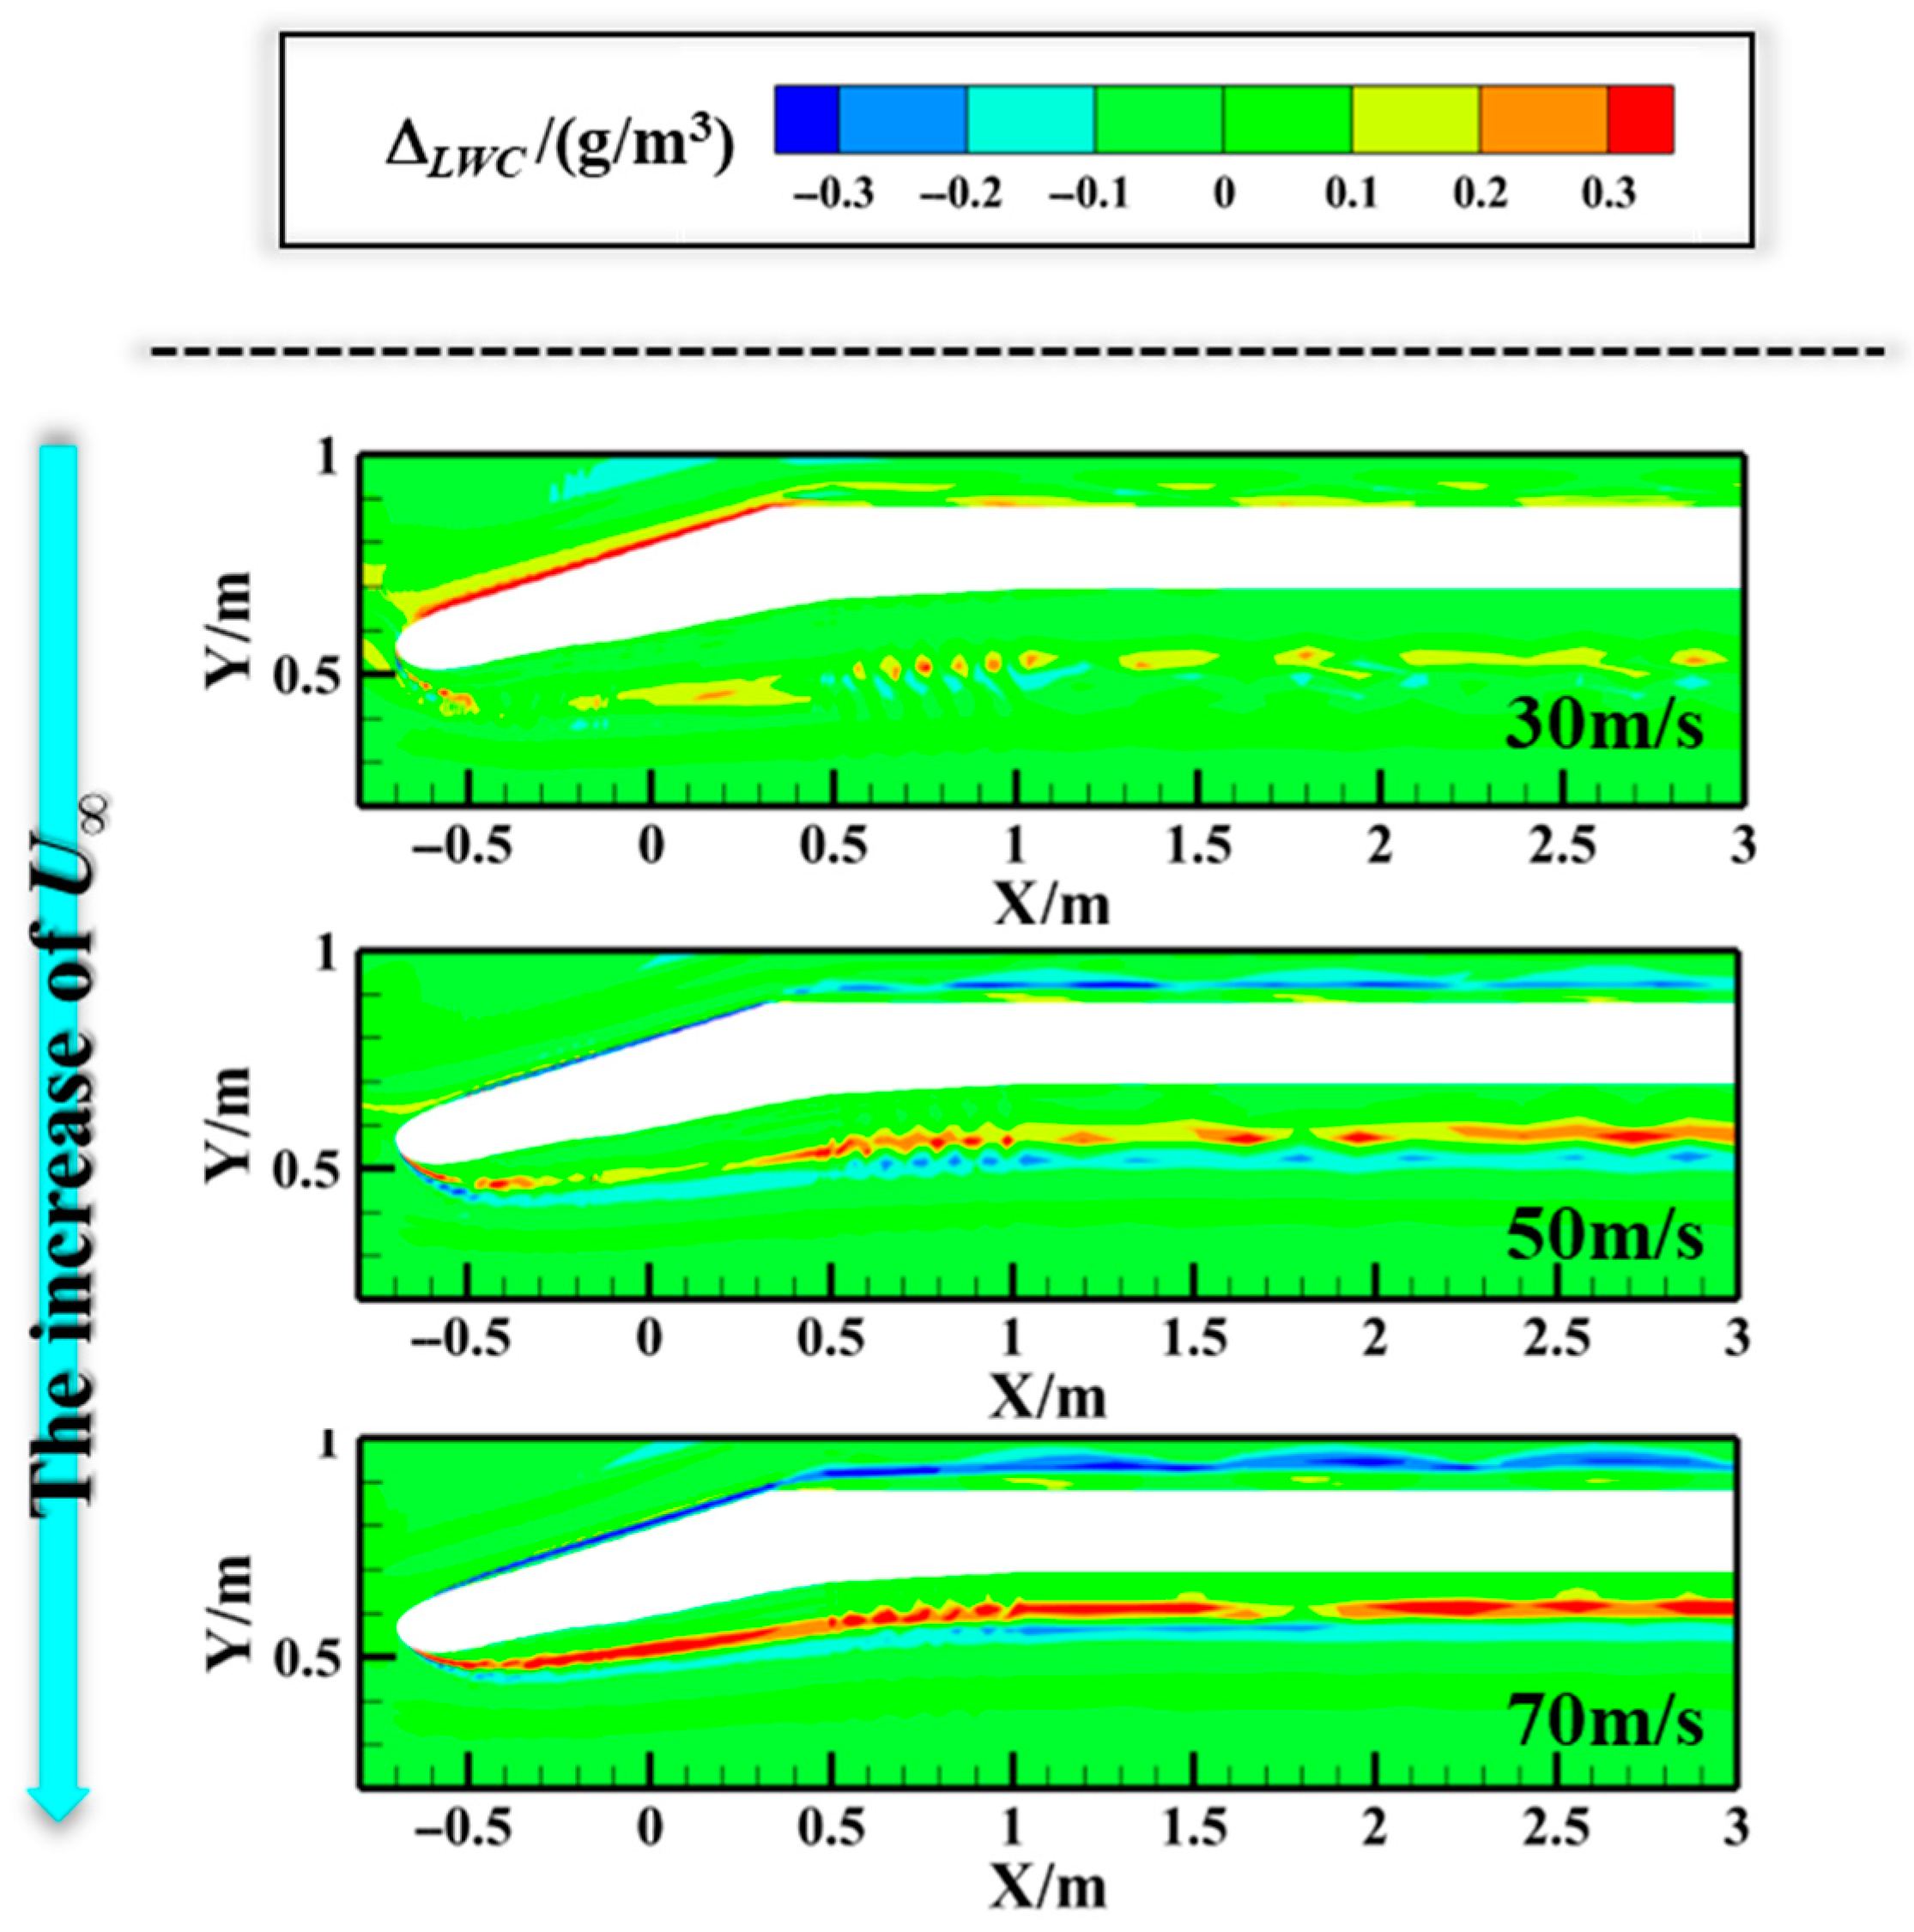
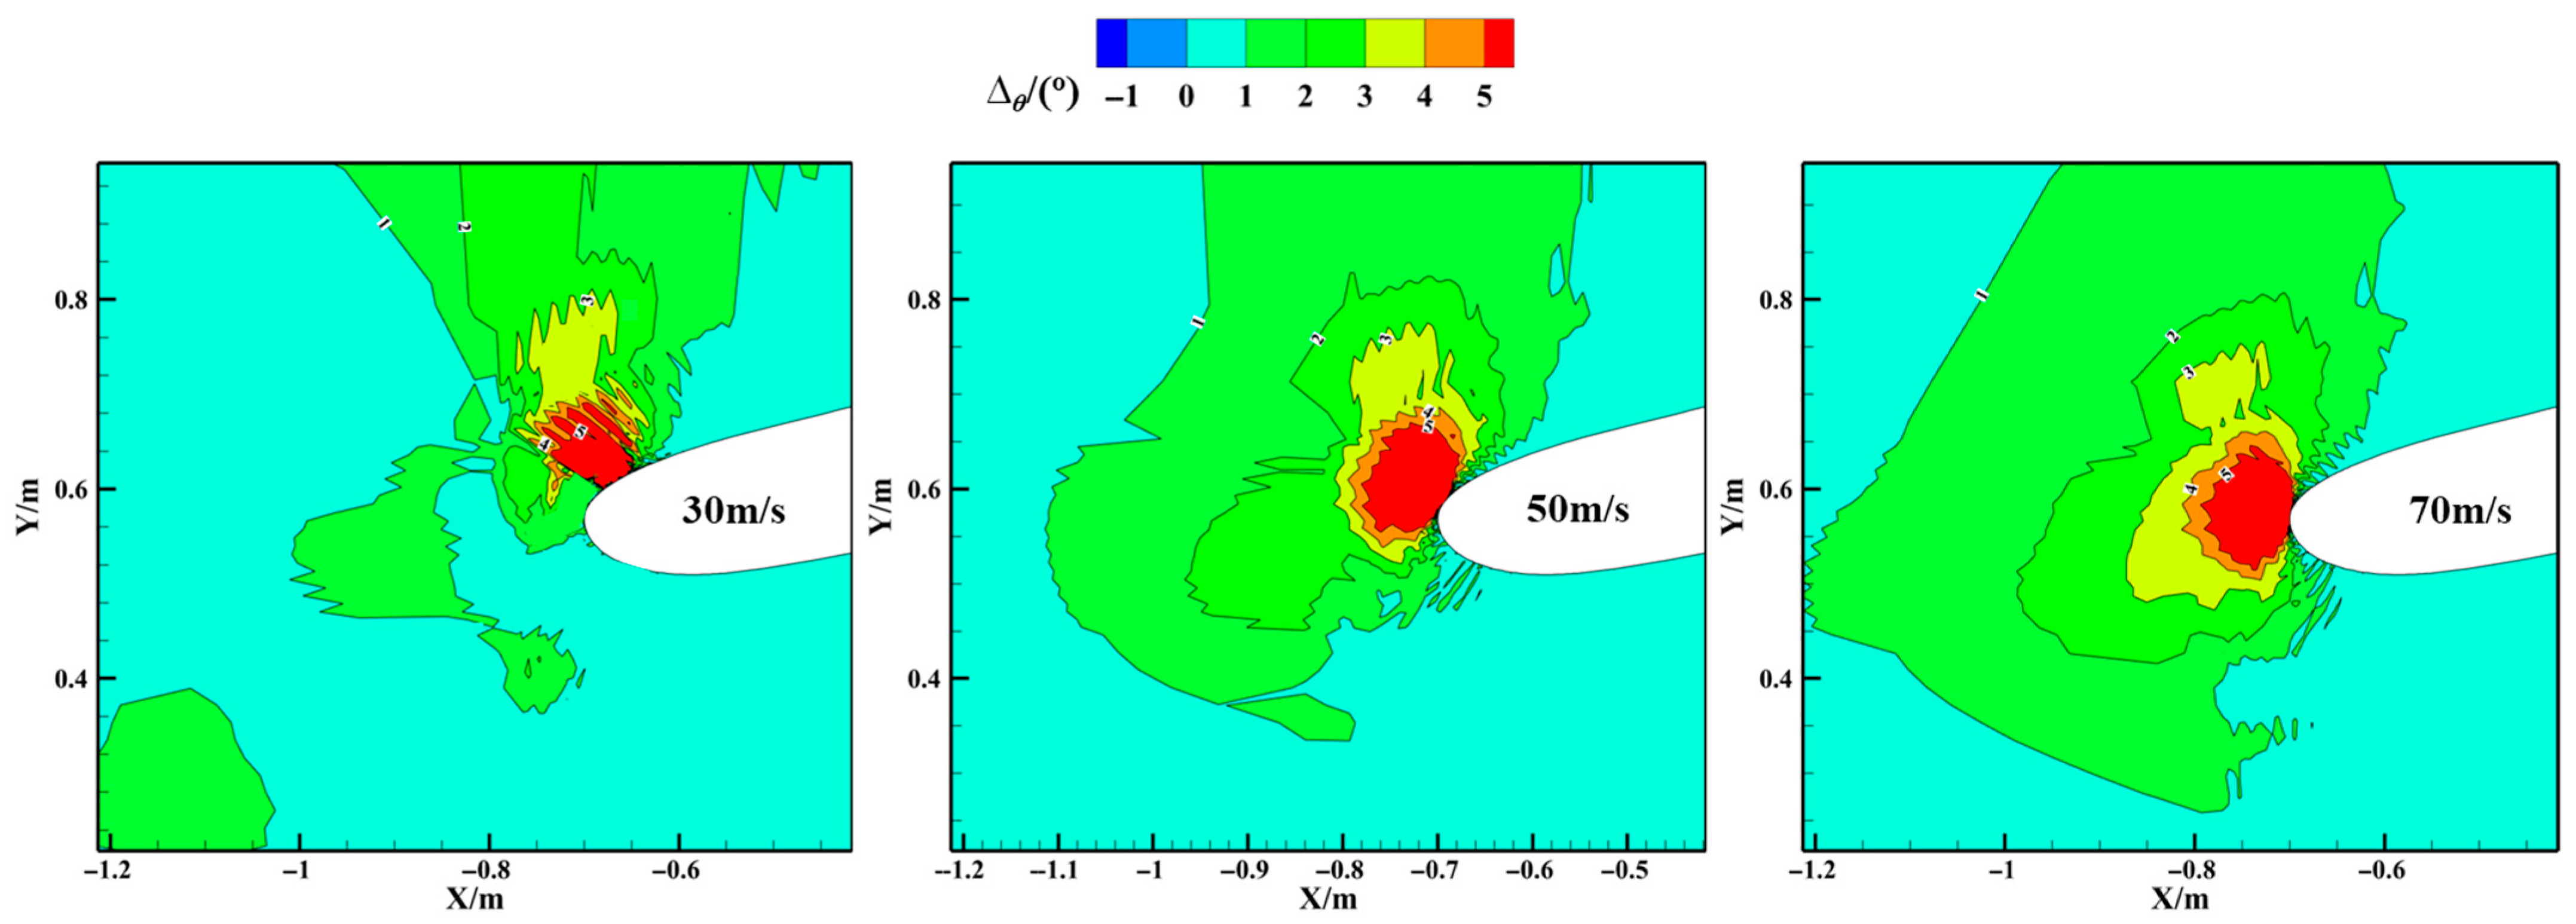
3.3. WTW Effects Under Different Incoming Velocity Conditions

Figure 12 compares the LWC distribution inside the nacelle and without the WTW at different velocities. When the incoming velocity is low (30 m/s), the presence of the WTW results in an increase in LWC near the outer wall of the nacelle. As the incoming velocity increases, the ΔLWC near the outer surface of the nacelle changes from positive to negative. This indicates that the WTW contributes to a reduction in LWC near the nacelle’s outer surface as the velocity increases. This phenomenon occurs because, at lower velocities (30 m/s), the WTW causes the airflow to deflect toward the outer surface, enhancing the airflow near the nacelle outer surface and increasing the LWC. As the velocity increases, the deflection effect near the nacelle’s outer surface becomes more pronounced (see Figure 12), leading to a greater outward deflection of the airflow in Figure 13. Consequently, more water droplets are carried away from the nacelle’s outer surface, resulting in a decrease in LWC in this region. Inside the nacelle, the formation of two adjacent banded zones within the nacelle (increment and reduction zones) becomes more pronounced as the income velocity increases. As illustrated in Figure 12, the ∆θ increases as the incoming velocity increases, causing the LWC change region to shift towards the nacelle surface.
As the incoming flow velocity increases from 30 m/s to 70 m/s, the Δβmax caused by the effect of the WTW increases to 9.73%. This results from the increased Δ θ caused by the WTW with higher velocity, which redirects more airflow toward the nacelle’s outer surface, leading to greater droplet impact and an increase in Δβmax. However, the ΔM decreases as velocity increases, from 9.7% to 7.8%. This occurs because higher-velocity droplets tend to deviate from their original path, reducing the WTW effect.

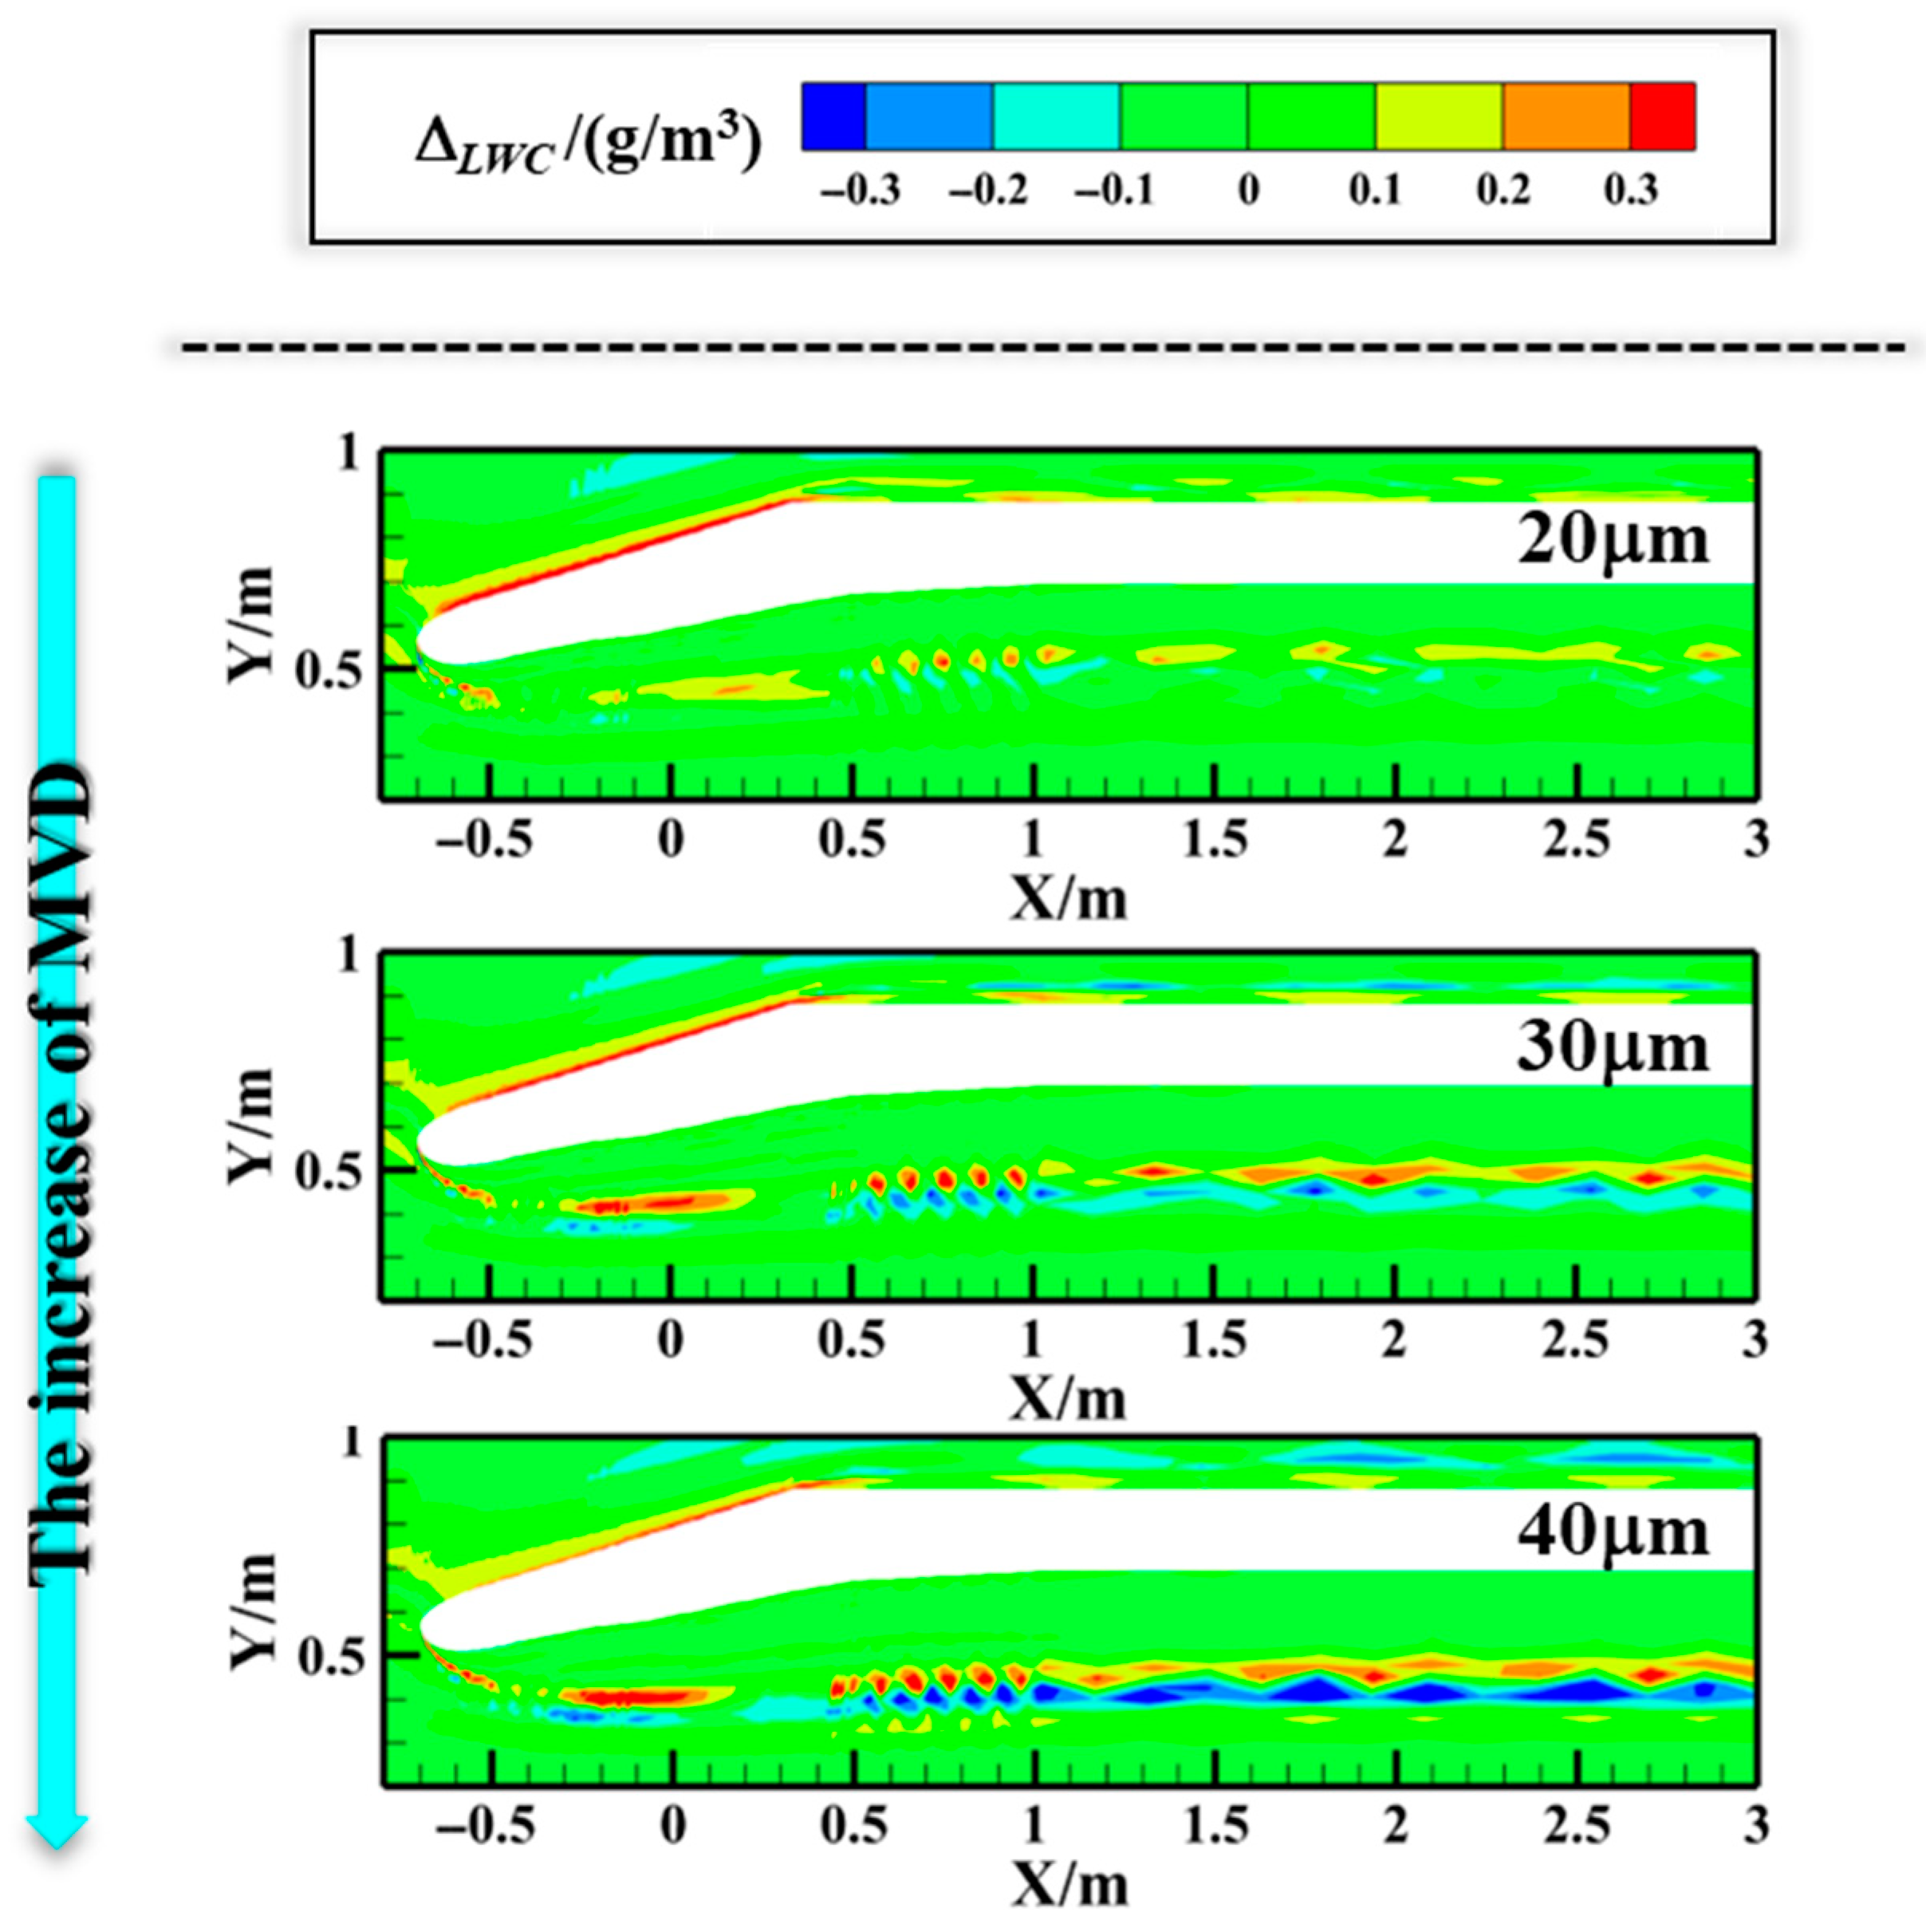
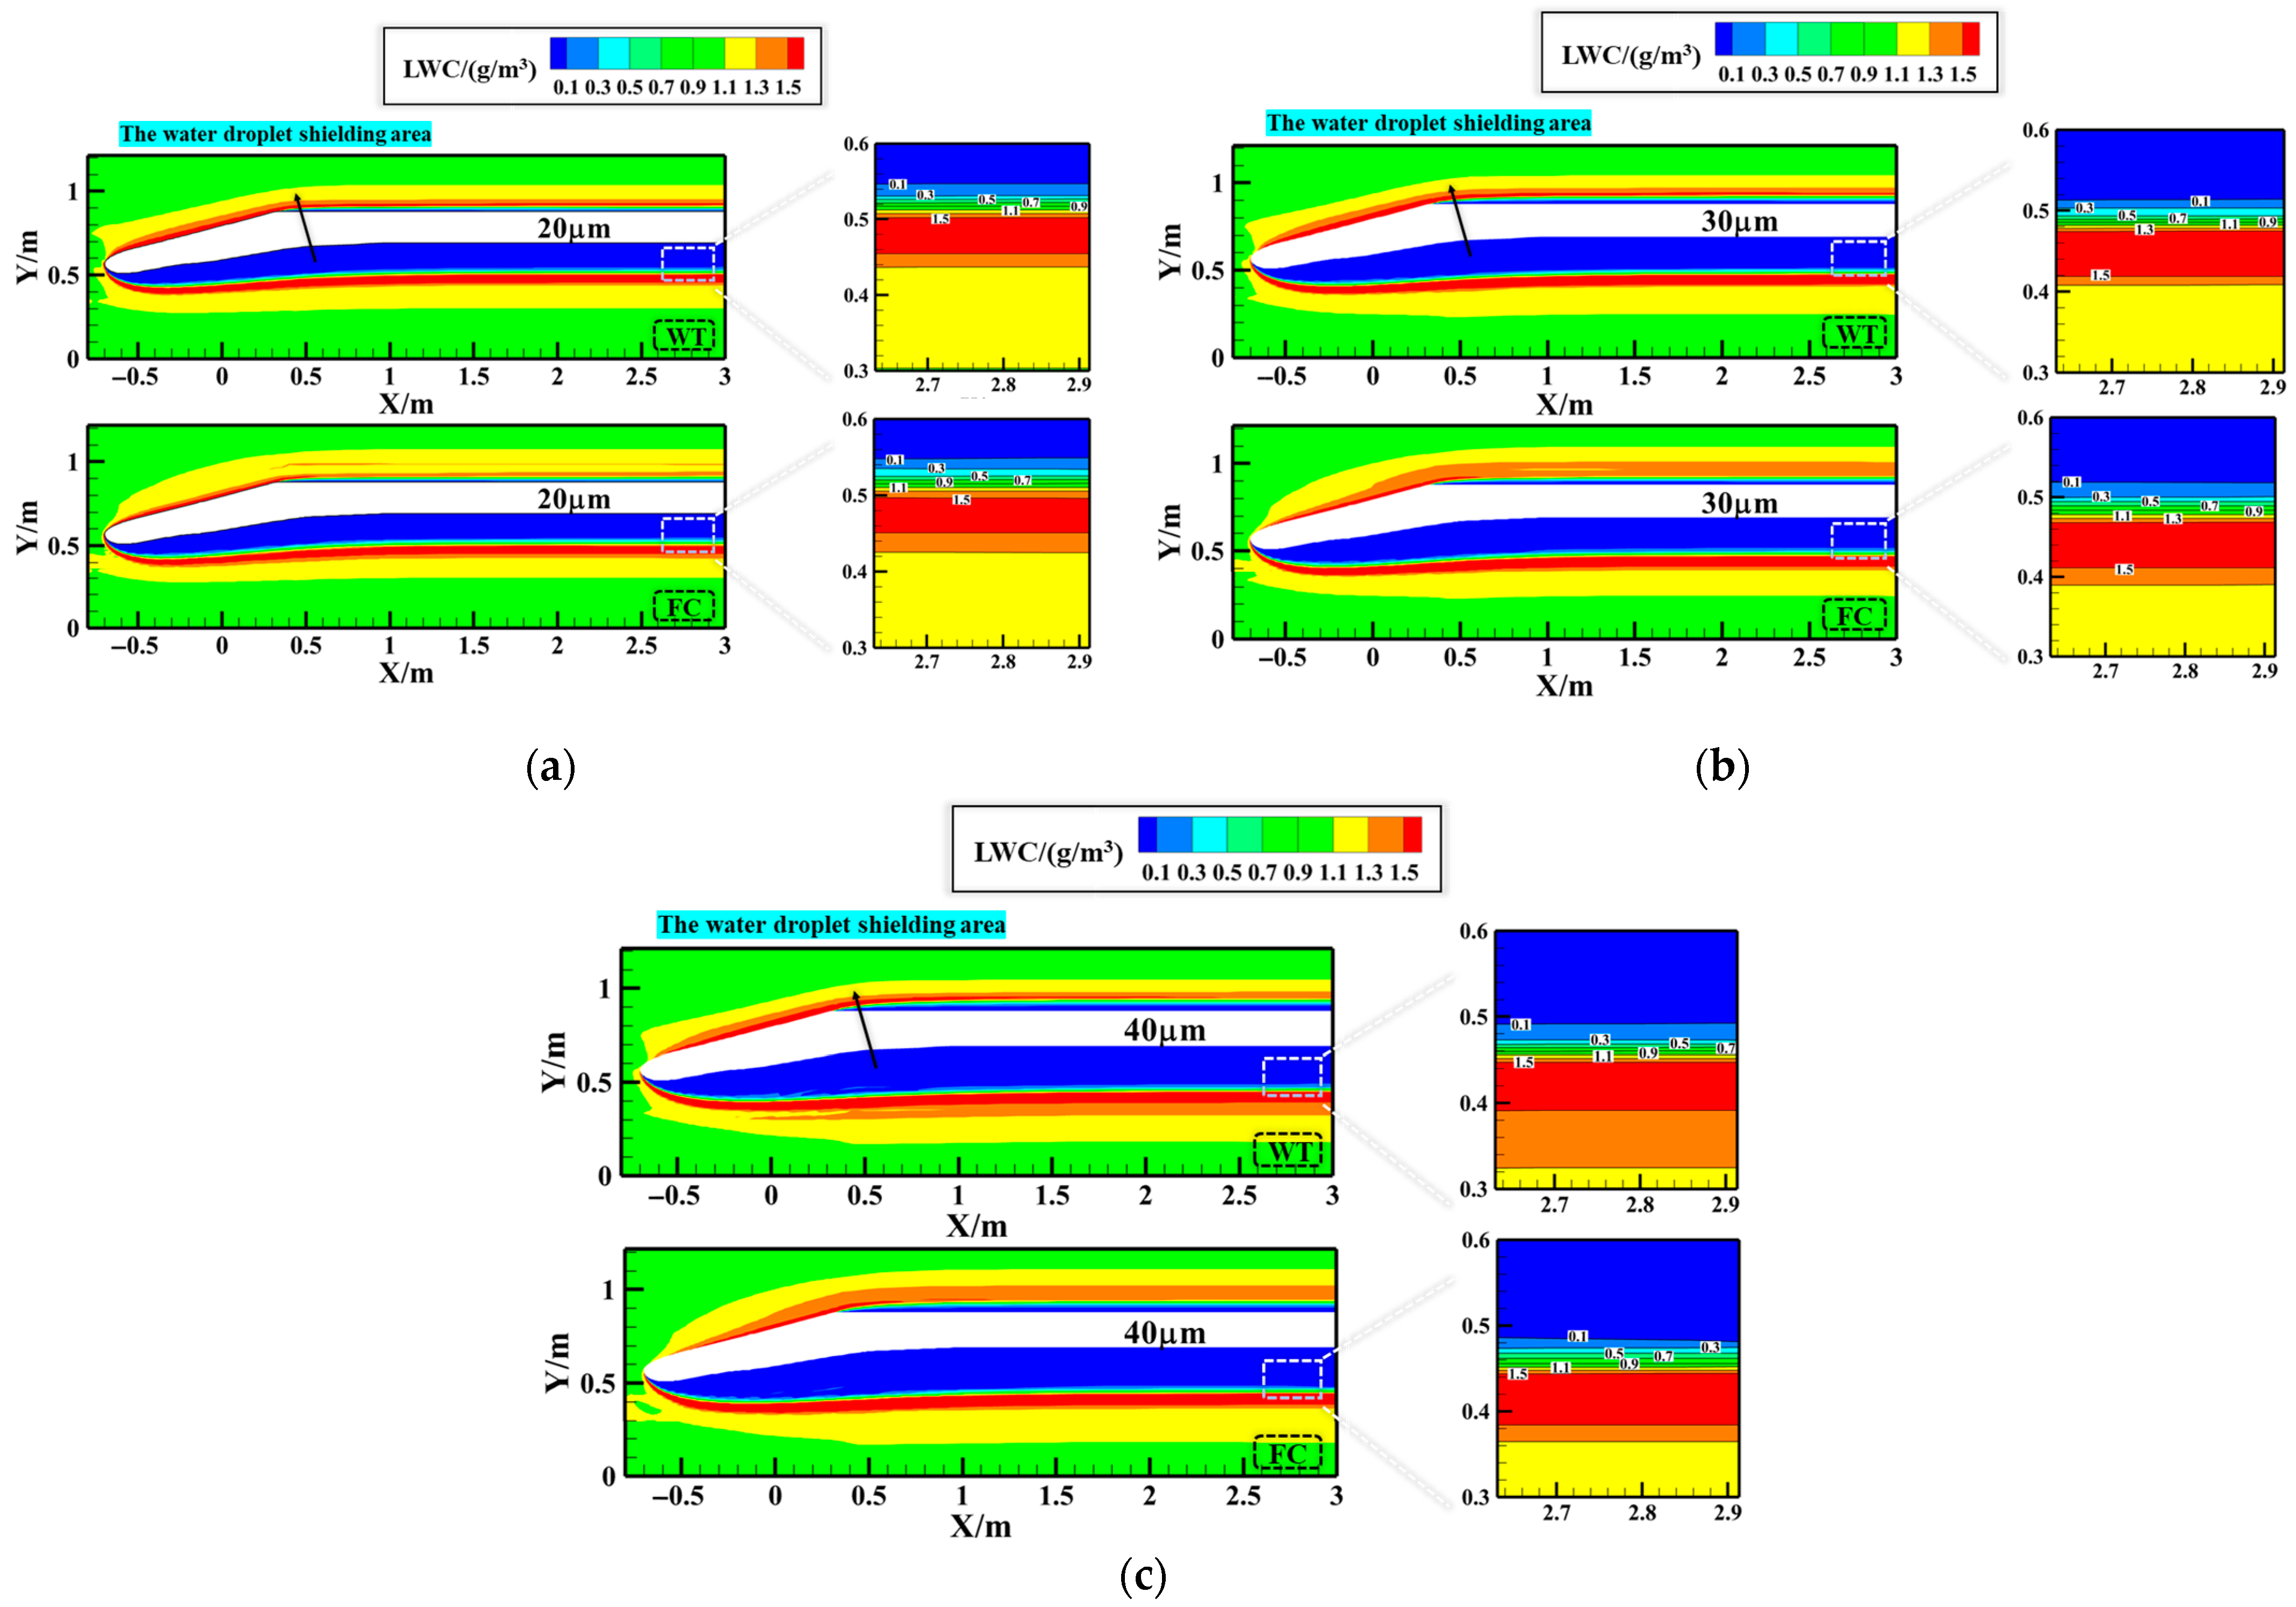
3.4. WTW Effects Under Different MVD Conditions

Although the airflow field remains unchanged, increasing the MVD still alters the effect of the WTW on the LWC distribution. As demonstrated in Figure 14, the progression of the MVD enhances the formation of distinct banded patterns of Δ LWC within the nacelle. Notably, when the MVD reaches 40 μm, the original dual-peak LWC distribution evolves into a distinctive trilaminar structure. Specifically, two regions with elevated LWC concentration appear symmetrically on both sides of a central region where the LWC is significantly lower. This forms a clear stratified structure resembling a sandwich, in which the high-concentration layers act as the “bread” and the central low-concentration zone serves as the “filling”. This sandwich-type stratification reflects the lateral redistribution of droplets caused by aerodynamic deflection and highlights the impact of droplet inertia at larger MVD values in Figure 15. The variation in Δ LWC with the MVD is because droplets with large diameters possess greater inertia, making their velocity directions difficult to alter by the airflow. Therefore, the enhanced regime near the shielding area inside the nacelle will increase with the MVD (see Figure 14), leading to the enhanced band regime of Δ LWC inside the nacelle and eventually resulting in the formation of the trilaminar structure of Δ LWC .
As the MVD increases from 20 μm to 40 μm, the WTW effect induces respective increments of 24.43% in the ∆βmax and 9.80% in ∆M. This phenomenon arises from two counteracting mechanisms: The enhanced droplet inertia associated with larger particle sizes reduces trajectory deviations from airflow disturbances, while simultaneously amplifying impingement probability on nacelle surfaces. The preferential influence on ∆βmax reflects its critical dependence on localized flow redirection near the leading-edge lip—a region particularly susceptible to WTW-induced flow field modifications. In contrast, ∆M demonstrates more moderate growth due to its characterization of bulk mass transport efficiency, which remains principally governed by momentum transfer fundamentals rather than localized flow distortions. The differing sensitivity of these parameters highlights that the WTW primarily affects local flow realignment rather than global mass transfer characteristics.

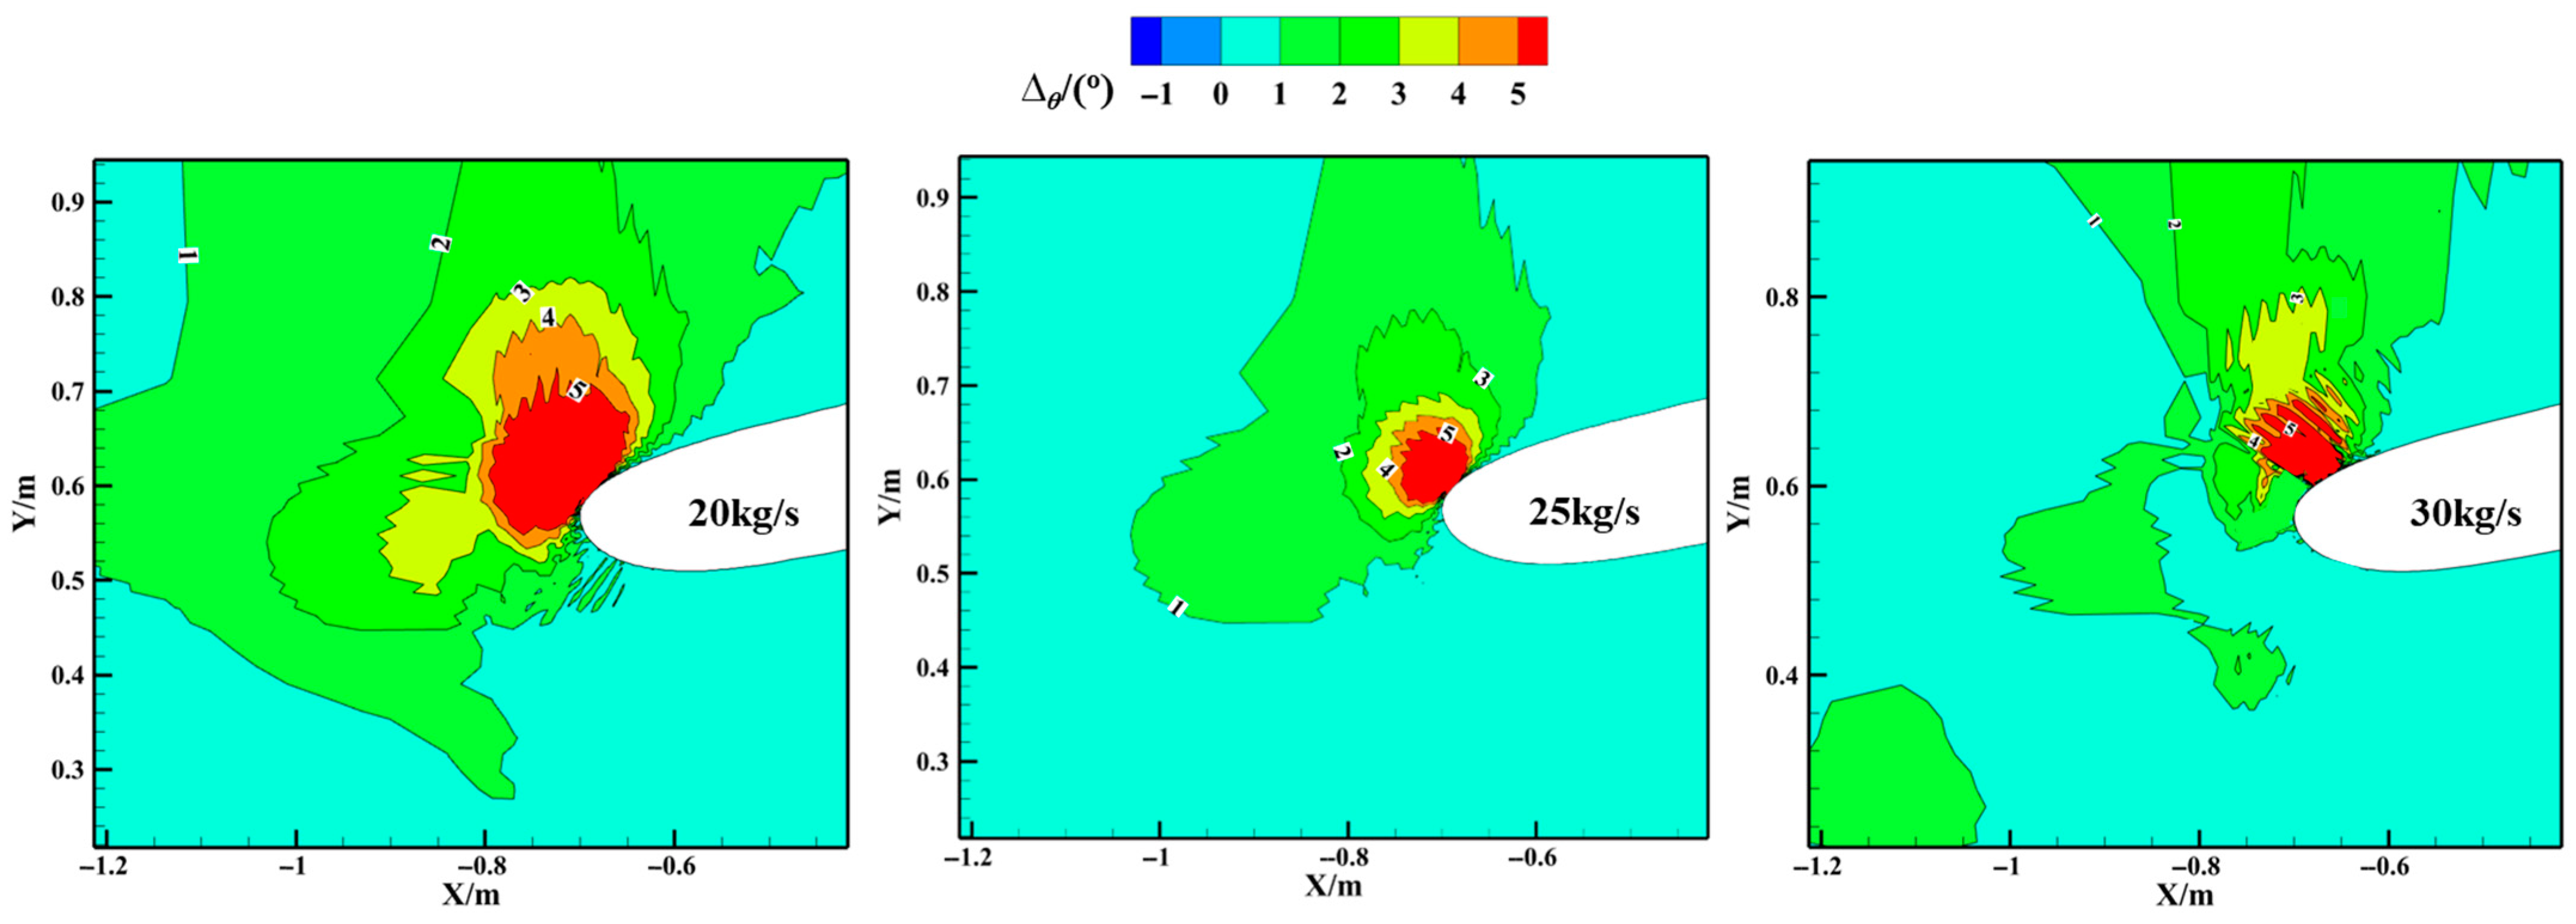
3.5. WTW Effects Under Different Intake Flow Rate Conditions

Figure 16 demonstrates the WTW effects on LWC distributions under different intake mass flow rate conditions. Notably contrasting with the trend observed under varying inflow velocities, the ΔLWC near the nacelle’s outer surface undergoes polarity reversal (from negative to positive values) as intake airflow increases. Simultaneously, the characteristic dual-band pattern of affected regions (consisting of adjacent LWC increment and reduction zones) shifts centripetally towards the nacelle axis. This phenomenon can primarily be attributed to two interrelated factors: (1) the gradual diminishing of deflection angle Δθ (Figure 17), reflecting reduced airflow redirection; and (2) the weakening of aerodynamic deflection effects associated with elevated inlet flow rates. This combination induces a systematic migration of the LWC variation zone toward the nacelle’s central region.
A critical observation reveals that increased intake flow significantly attenuates the formation intensity of dual-band structures within the nacelle. This attenuation stems from the geometric constraint imposed by the nacelle’s outer wall, which functions as a physical barrier to airflow. Enhanced mass flow rates diminish the flow deflection magnitude, promoting airflow accumulation along the exterior surface. Consequently, this redistribution of flow energy reduces spatial variations in LWC within the internal nacelle region.
As the intake flow rate increases, analysis reveals a pronounced reduction in WTW effects—the relative increments in ∆βmax decrease from 28.4% to 4.39%, while ∆M decreases from 21.74% to 4.39%. This reduction is attributed to the aerodynamic interactions between intake airflow and wind tunnel confinement boundaries. Enhanced inlet mass flow alters flow field characteristics, diminishing the airflow deflection toward the nacelle’s outer surface—a trend contrary to that observed with incoming velocity variations. The differential response between ∆M and ∆βmax stems from their distinct physical causes: While ∆βmax reflects localized path corrections near the leading edge, ∆M represents integrated collection over the affected outer surface. Notably, WTW interference primarily affects the lip region hydromechanics, leading to more significant alterations in βmax compared to total water impingement.

4. Conclusions

This study systematically investigated the influence of the WTW on LWC distribution and β within an aero-engine nacelle using validated numerical simulations. The key findings are summarized as follows:
  • The presence of the WTW alters local airflow patterns, deflecting droplets toward the outer nacelle surface. Under baseline conditions (Ma = 0.206), this aerodynamic redirection increases the βmax by 9.73% and total collected water mass (ΔM) by 9.46%, while forming distinct banded regimes of LWC variation (ΔLWC) within the nacelle.
  • As the inflow velocity increased from 30 m/s to 70 m/s, the WTW-induced aerodynamic deflection intensified, amplifying LWC gradients near the outer nacelle surface. This resulted in a 24.43% increase in βmax and a 9.8% rise in ΔM. The enhanced deflection at higher velocities underscores the dominance of inertial effects in redirecting droplets toward the outer wall.
  • Increasing the MVD of droplets from 20 μm to 40 μm transformed the LWC distribution from a dual-peak to a sandwich-type stratification. Larger droplets, due to their higher inertia, exhibited reduced trajectory compliance with airflow redirection, shifting impingement zones inward. Consequently, βmax and ΔM increased by 24.43% and 9.8%, respectively, highlighting the nonlinear interaction between droplet inertia and WTW-induced flow modifications.
  • Elevating the intake flow rate from 20 kg/s to 30 kg/s suppressed WTW interference effects, reducing βmax and ΔM by 28.4% to 4.39%. Higher intake flow rates redirected airflow toward the nacelle core, redistributing LWC variations centripetally and diminishing outer-wall droplet accumulation. This demonstrates the counteractive regulation capability of intake flow rates in mitigating WTW-induced aerodynamic distortions.
  • Based on the observed influence of the WTW on the distribution of LWC, several strategies can be proposed to mitigate wall-induced interference. These strategies include enlarging the test section by moving the tunnel walls outward or applying icing similarity criteria to correct the experimental data, thereby enhancing the representativeness of wind tunnel results under real-flight conditions.

Author Contributions

Conceptualization, C.L. and N.C.; Methodology, C.L., N.C. and X.Y.; Software, C.L. and N.C.; Validation, C.L., N.C., X.Y. and Q.L.; Formal analysis, C.L. and N.C.; Investigation, N.C.; Resources, Q.L. All authors have read and agreed to the published version of the manuscript.

Funding

This research received no external funding.

Data Availability Statement

The original contributions presented in this study are included in the article. Further inquiries can be directed to the corresponding author.

Conflicts of Interest

The authors declare no conflict of interest.

Abbreviations

The following abbreviations are used in this manuscript:
MaMach number
βDroplet Collection Coefficient
βmaxThe Maximum Droplet Collection Coefficient
VTSThe Air Velocity in The Wind Tunnel Tests
QInlet Air Flow
UIncoming Velocity
TAtmospheric Temperature
PAtmospheric Pressure
Δ L W C The amount of Influence of the WTW on the LWC
Δ θ Airflow Deflection Angle
Δ M Relative Additional Increment in the Total Droplet Collection
ΔβmaxRelative Additional Increment in the Maximum Water Collection Efficiency
LWCLiquid Water Content
MVDMedium Water Droplet Diameter
FAAFederal Aviation Administration
WTWWind Tunnel Wall
FCFree Stream
NASANational Aeronautics and Space Administration
IRTIcing Research Tunnel

References

  1. Baumert, A.; Bansmer, S.; Trontin, P.; Villedieu, P. Experimental and Numerical Investigations on Aircraft Icing at Mixed Phase Conditions. Int. J. Heat Mass Transf. 2018, 123, 957–978. [Google Scholar] [CrossRef]
  2. Chen, N.; Yi, X.; Ren, J.; Wang, Q.; Li, K. Study on the Anti-Icing of Conical Rotating Spinners with Different Cone Angles. J. Aircr. 2024, 61, 1621–1628. [Google Scholar] [CrossRef]
  3. Liu, Y.; Li, L.; Ning, Z.; Tian, W.; Hu, H. Experimental Investigation on the Dynamic Icing Process over a Rotating Propeller Model. J. Propuls. Power 2018, 34, 933–946. [Google Scholar] [CrossRef]
  4. Tian, L.; Li, L.; Hu, H.; Hu, H. Experimental Study of Dynamic Ice Accretion Process over Rotating Aeroengine Fan Blades. J. Thermophys. Heat Transf. 2022, 37, 353364. [Google Scholar] [CrossRef]
  5. Dong, W.; Zheng, M.; Zhu, J.; Lei, G.; Zhao, Q. Experimental Investigation on Anti-Icing Performance of an Engine Inlet Strut. J. Propuls. Power 2017, 33, 379–386. [Google Scholar] [CrossRef]
  6. Tetteh, E.; Loth, E.; Loebig, J.; Cummings, J.; Harvell, J. A Compact Icing Research Tunnel for Ice Adhesion Characterization. J. Thermophys. Heat Transf. 2021, 35, 600–610. [Google Scholar] [CrossRef]
  7. Henry, R.C.; Guffond, D.; Garnier, F.; Bouveret, A. Heat Transfer Coefficient Measurement on Iced Airfoil in Small Icing Wind Tunnel. J. Thermophys. Heat Transf. 2000, 14, 348–354. [Google Scholar] [CrossRef]
  8. Wright, W. User’s Manual for LEWICE Version 3.2.; NASA CR2008-214255; NASA: Washington, DC, USA, 2008.
  9. Beaugendre, H.; Morency, F.; Habashi, W.G. FENSAP-ICE’s Three-Dimensional In-Flight Ice Accretion Module: ICE3D. J. Aircr. 2003, 40, 239–247. [Google Scholar] [CrossRef]
  10. Aliaga, C.N.; Aubé, M.S.; Baruzzi, G.S.; Habashi, W.G. FENSAP-ICE-Unsteady: Unified In-Flight Icing Simulation Methodology for Aircraft, Rotorcraft, and Jet Engines. J. Aircr. 2011, 48, 119–126. [Google Scholar] [CrossRef]
  11. Myers, T.G.; Charpin, J.P.F. A Mathematical Model for Atmospheric Ice Accretion and Water Low on a Cold Surface. Int. J. Heat Mass Transf. 2004, 47, 5483–5500. [Google Scholar] [CrossRef]
  12. Mingione, G.; Brandi, V. Ice Accretion Prediction on Multielement Airfoils. J. Aircr. 1998, 35, 240–246. [Google Scholar] [CrossRef]
  13. Petrosino, F.; Mingione, G.; Carozza, A.; Gilardoni, T.; D’Agostini, G. Ice Accretion Model on Multi-Element Airfoil. J. Aircr. 2011, 48, 1913–1920. [Google Scholar] [CrossRef]
  14. Hedde, T.; Guffond, D. ONERA Three-Dimensional Icing Model. AIAA J. 1995, 33, 1038–1045. [Google Scholar] [CrossRef]
  15. Gori, G.; Zocca, M.; Garabelli, M.; Guardone, A.; Quaranta, G. PoliMIce: A Simulation Framework for Three-Dimensional Ice Accretion. Appl. Math. Comput. 2015, 267, 96–107. [Google Scholar] [CrossRef]
  16. Ide, R.F.; Sheldon, D.W. 2006 Icing Cloud Calibration of the NASA Glenn Icing Research Tunnel; NASA Technical Memorandum TM-2008-215177; NASA: Washington, DC, USA, 2008.
  17. Chintamani, S.H.; Belter, D.L. Design Features and Flow Qualities of the Boeing Research Aerodynamic Icing Wind Tunnel. In Proceedings of the 32nd Aerospace Sciences Meeting and Exhibit, Reno, NV, USA, 10–13 January 1994. AIAA 1994-0540. [Google Scholar]
  18. Oleskiw, M.M.; Hyde, F.H.; Penna, P.J. In-Flight Icing Simulation Capabilities of NRC’s Altitude Icing Wind Tunnel. In Proceedings of the 39th Aerospace Sciences Meeting and Exhibit, Reno, NV, USA, 8–11 January 2001. AIAA 2001-0094. [Google Scholar]
  19. Al-Khalil, K.; Salamon, L.; Tenison, G. Development of the Cox Icing Research Facility. In Proceedings of the 36th AIAA Aerospace Sciences Meeting and Exhibit, Reno, NV, USA, 12–15 January 1998. AIAA 1998-0097. [Google Scholar]
  20. Vecchione, L.; De Matteis, P.P.; Leone, G. An Overview of the CIRA Icing Wind Tunnel. In Proceedings of the 41st Aerospace Sciences Meeting and Exhibit, Reno, NV, USA, 6–9 January 2003. AIAA 2003-900. [Google Scholar] [CrossRef]
  21. AI-Khalil, K.M.; Ferguson, T.W.; Phillips, D.M. A Hybrid Anti-Icing Ice Protection System. In Proceedings of the 35th Aerospace Sciences Meeting and Exhibit, Reno, NV, USA, 6–9 January 1997. AIAA 1997-0302. [Google Scholar]
  22. Burick, R.A.; Ryan, R.J. FAA Certification of the Lockheed Martin C-130J Transport Ice Protection System. In Proceedings of the 24th Atmospheric Flight Mechanics Conference, San Antonio, TX, USA, 12–15 June 1999. AIAA 1999-4016. [Google Scholar]
  23. Planquart, P.; Borre, G.V.; Buchlin, J.M. Experimental and Numerical Optimization of a Wing Leading Edge Hot Air Anti-Icing System. In Proceedings of the 43rd AIAA Aerospace Sciences Meeting and Exhibit, Reno, NV, USA, 10–13 January 2005. AIAA 2005-1277. [Google Scholar]
  24. Papadakis, M.; Wong, S.H.; Yeong, H.; Wong, S.C. Icing Tunnel Experiments with a Hot Air Anti-Icing System. In Proceedings of the 46th AIAA Aerospace Sciences Meeting and Exhibit, Reno, NV, USA, 7–10 January 2008. AIAA 2008-0444. [Google Scholar]
  25. Dong, W.; Zhu, J.; Zhou, Z.; Chi, X. Heat Transfer and Temperature Analysis of an Anti-Icing System for an Aero-Engine Strut Under Icing Condition. In Proceedings of the 43rd AIAA Thermophysics Conference, New Orleans, LA, USA, 25–28 June 2012. AIAA 2012-2753. [Google Scholar]
  26. Dong, W.; Zhu, J.; Zhao, Q.Y. Numerical Simulation Analysis of a Guide Vane Hot Air Anti-Icing System. In Proceedings of the 42nd AIAA Thermophysics Conference, Honolulu, HI, USA, 27–30 June 2011. AIAA 2011-3944. [Google Scholar]
  27. Tetteh, E.; Loth, E.; Neuteboom, M.O.; Fisher, J. In-Flight Gas Turbine Engine Icing: Review. AIAA J. 2022, 60, 5610–5632. [Google Scholar] [CrossRef]
  28. Huang, R.; Zhao, Y.; Hu, H. Wind-Tunnel Tests for Active Flutter Control and Closed-Loop Flutter Identification. AIAA J. 2016, 54, 2089–2099. [Google Scholar] [CrossRef]
  29. Zocca, M.; Gori, G.; Guardone, A. Blockage and Three-Dimensional Effects in Wind-Tunnel Testing of Ice Accretion over Wings. J. Aircr. 2017, 54, 759–767. [Google Scholar] [CrossRef]
  30. Liu, Y.; Wang, Q.; Yi, X.; Chen, N.; Ren, J.; Li, W. An Anti-Icing Scaling Method for Wind Tunnel Tests of Aircraft Thermal Ice Protection System. Chin. J. Aeronaut. 2024, 37, 1–6. [Google Scholar] [CrossRef]
  31. Belligoli, Z.; Dwight, R.P.; Eitelberg, G. Nonlinear Wind-Tunnel Wall-Interference Corrections Using Data Assimilation. AIAA J. 2021, 59, 596–606. [Google Scholar] [CrossRef]
  32. Vivekanandan, J.; Zhang, G.; Politovich, M.K. An Assessment of Droplet Size and Liquid Water Content Derived from Dual-Wavelength Radar Measurements to the Application of Aircraft Icing Detection. J. Atmos. Ocean. Technol. 2001, 18, 1787–1798. [Google Scholar] [CrossRef]
  33. Qin, C.; Loth, E. Numerical Study of Droplet Trajectory and Collection Efficiency in IRT with Large Blockage Effects. In Proceedings of the 9th AIAA Atmospheric and Space Environments Conference, Denver, CO, USA, 5–9 June 2017. [Google Scholar]
  34. Clark, C. Effects of Aerodynamic Blockage on Stagnation Collection Efficiency in a Wind Tunnel Icing Environment. In Proceedings of the 2018 Atmospheric and Space Environments Conference, Denver, CO, USA, 25–29 June 2018. [Google Scholar]
  35. Guo, Q.L.; Liu, S.Y.; Yi, X.; Guo, X.D. Influence of Sidewall Interference in Wind Tunnel on Rime Ice on Airfoil. J. Aerosp. Power 2021, 36, 2197–2206. [Google Scholar] [CrossRef]
  36. Barlow, J.B.; Rae, W.H.; Pope, A.; Kassaee, A. Low-Speed Wind Tunnel Testing, 2nd ed.; John Wiley & Sons: New York, NY, USA, 1984; ISBN 9780471874027. [Google Scholar]
  37. Munson, R.L.; Patterson, W.D. Aircraft Icing Wind Tunnel Testing; FAA-AC-20-73B; Federal Aviation Administration (FAA): Washington, DC, USA, 2004.
  38. Burk, G.G.; Vickery, P.A.; McKinney, W.R. Wind-Tunnel Blockage and Actuation Systems Test of a Two-Dimensional Scramjet Inlet Unstart Model at Mach 6. Available online: https://ntrs.nasa.gov/citations/19950009483 (accessed on 21 January 2024).
  39. Robinson, M.; MacManus, D.G.; Sheaf, C. Aspects of Aero-Engine Nacelle Drag. Proc. Inst. Mech. Eng. G J. Aerosp. Eng. 2019, 233, 1667–1682. [Google Scholar] [CrossRef]
  40. Isobe, K.; Suzuki, M.; Yamamoto, M. Numerical Investigation on Super-Cooled Large Droplet Icing of Fan Rotor Blade in Jet Engine. J. Therm. Sci. 2014, 23, 432–437. [Google Scholar] [CrossRef]
  41. Wang, Z.; Guan, N.; Lu, Y.; Gao, X. Super-Cooled Droplet Impact and Ice Accretion on an Aircraft Engine Nacelle Lip. J. Phys. Conf. Ser. 2024, 2691, 012003. [Google Scholar] [CrossRef]
  42. Guan, N.; Hou, X.; Zhu, Q.; Chen, F. Numerical Simulation of Engine Nacelle Icing with a Propeller. In Proceedings of the 2022 4th International Academic Exchange Conference on Science and Technology Innovation (IAECST), Guangzhou, China, 9–11 December 2022. [Google Scholar]
  43. Panchal, A.; Menon, S. A Hybrid Eulerian-Eulerian/Eulerian-Lagrangian Method for Dense-to-Dilute Dispersed Phase Flows. J. Comput. Phys. 2021, 439, 110339. [Google Scholar] [CrossRef]
  44. Chen, N.; Du, J.; Hu, Y.; Ji, H.; Yuan, Y. Study of the flow and impingement of water droplets inside an inertial particle separator. AIP Adv. 2020, 10, 045313. [Google Scholar] [CrossRef]
  45. Esposito, B. Application of optical methods for icing wind tunnel cloud simulation extension to supercooled large droplets. In Proceedings of the 23rd Annual Conference on Liquid Atomization and Spray Systems, Ventura, CA, USA, 15–18 May 2011. [Google Scholar]
  46. Wang, Q.; Chen, N.; Wang, Y.; Li, W.; Liu, Y.; Yi, X. Scallop Ice Shape Characteristics of Swept Wing Based on Large-Scale Icing Wind Tunnel Experiment. Chin. J. Aeronaut. 2023, 36, 214–230. [Google Scholar] [CrossRef]
  47. Wang, B.; Zhang, L.; Huang, X.; Guo, X.; Wu, Y.; Wu, X.; Song, X.; Bai, P.; Shi, P.; Zhu, S.; et al. Simultaneous Measurements of Morphology, Size Distribution and Concentration of Ice Crystals in Icing Wind Tunnel with HACPI. Exp. Therm. Fluid Sci. 2024, 159, 111266. [Google Scholar] [CrossRef]
Figure 1. Diagram of the computational model. (a) Computational model with the wind tunnel wall; (b) computational model without the wind tunnel wall.
Aerospace 12 00335 g001
Figure 2. Grid used for the simulation. (a) Grid of the model with the wind tunnel wall; (b) grid of the model without a wind tunnel wall.
Aerospace 12 00335 g002
Figure 3. Grid independence examination for the calculations. (a) The average LWC; (b) the β.
Aerospace 12 00335 g003
Figure 4. Mounting of the HACPI inside the nacelle in the ice wind tunnel.
Aerospace 12 00335 g004
Figure 5. Schematic of the installation positions of the HACPI.
Aerospace 12 00335 g005
Figure 6. Validation of the numerical results with the experimental data.
Aerospace 12 00335 g006
Figure 7. Contour plot of LWC distribution for Case_1 with and without the WTW. (a) LWC distribution map (WT at the top and FC at the bottom); (b) Δ L W C distribution map.
Aerospace 12 00335 g007
Figure 8. Pressure distribution and streamlines near the lip at the z = 0 m section for Case_1 ((left) of the WT and (right) of the FC).
Aerospace 12 00335 g008
Figure 9. Distribution of deflection angle ∆θ near the lip in the z = 0 m section. Δ θ = θ W T θ F C , and θ is the angle between the velocity and the axial direction.
Aerospace 12 00335 g009
Figure 10. Distribution of β near the lip in the WT and FC under Case_1 conditions.
Aerospace 12 00335 g010
Figure 11. Droplet velocity distribution and streamlines near the lip at the z = 0 m section for Case_1 ((left) of the FC and (right) of the WT).
Aerospace 12 00335 g011
Figure 12. Variation in LWC at the z = 0 m with speed.
Aerospace 12 00335 g012
Figure 13. Variation in ∆θ in the z = 0 m with speed.
Aerospace 12 00335 g013
Figure 14. Variation in LWC in z = 0 m with droplet size.
Aerospace 12 00335 g014
Figure 15. Variation in LWC in z = 0 m with droplet size. (a) Case_3; (b) Case_4; (c) Case_5 (WTW at the top and FC at the bottom).
Aerospace 12 00335 g015
Figure 16. Variation in LWC in z = 0 m with intake flow rate.
Aerospace 12 00335 g016
Figure 17. Variation in ∆θ in the z = 0 m with intake flow rate.
Aerospace 12 00335 g017
Table 1. Computational conditions.
ConditionMaLWC, g/m3MVD, μmQ, kg/sT, KP, Pa
Case_10.2061203025363,544
Case_20.1471203025363,544
Case_30.0881203025363,544
Case_40.0881303025363,544
Case_50.0881403025363,544
Case_60.0881202025363,544
Case_70.0881202525363,544
Table 2. Experimental and numerical data.
ConditionLWC, g/m3ε, %
ExperimentNumerical
Front-Upper1.872.24−16.52
Front-Middle1.851.986.57
Middle-Upper2.032.2911.35
Middle-Middle2.161.988.08
Rear-Upper1.812.2619.91
Rear-Middle2.341.9619.39
Disclaimer/Publisher’s Note: The statements, opinions and data contained in all publications are solely those of the individual author(s) and contributor(s) and not of MDPI and/or the editor(s). MDPI and/or the editor(s) disclaim responsibility for any injury to people or property resulting from any ideas, methods, instructions or products referred to in the content.

