Article

Theoretical and Numerical Study on a Scale Model Test of Planetary Cratering Impact

1
National Key Laboratory of Intense Pulsed Radiation Simulation and Effect, Northwest Institute of Nuclear Technology, Xi’an 710024, China
2
State Key Laboratory of Explosion Science and Technology, Beijing Institute of Technology, Beijing 100081, China
*
Author to whom correspondence should be addressed.
Aerospace 2025, 12(4), 333; https://doi.org/10.3390/aerospace12040333
Submission received: 3 December 2024 / Revised: 6 April 2025 / Accepted: 8 April 2025 / Published: 12 April 2025
(This article belongs to the Special Issue Lunar, Planetary, and Small-Body Exploration)

Abstract

:
Our investigation delves into the scaling law governing planetary cratering impacts. We meticulously analyze the interplay between dimensionless parameters driving crater growth and the morphological transition of craters and construct the scaling analysis between the scale model tests and the prototype tests by numerical simulation. With practical engineering applications in mind, we design scale model tests based on the experimental setups of geotechnical centrifuges, ensuring the robust validity of test designs. This meticulous approach is integral to achieving fidelity between simulations and experimental scenarios. Validation of our scale model tests is conducted through a numerical modeling framework, coupling the finite element-smoothed particle hydrodynamics adaptive method (FE-SPH). This validation procedure serves to bolster the reliability and credibility of our methodology, facilitating an accurate depiction of the cratering mechanism. Of particular interest is the investigation into the depth-to-diameter ratio of impact craters, wherein we explore its intricate relationship with projectile diameter and gravity. Through rigorous analysis, we delineate the transition diameter at which terrestrial impact craters manifest a transition from simple to complex morphologies, thereby shedding light on the underlying dynamics of crater formation. Moreover, our study meticulously scrutinizes the relationship of crater formation time between the scaling model tests and the prototype tests. Our research underscores the consistency of the crater depth–diameter ratio in the scale model tests and the prototype tests and affirms applicability in replicating prototype tests by scale model tests. Notably, our findings reveal compelling correlations between the depth-to-diameter ratio of impact craters and gravity, as well as projectile diameter, providing valuable insights into the governing dynamics of impact crater formation. These insights not only advance our fundamental understanding of planetary cratering processes but also hold implications for practical applications in planetary science and engineering.

1. Introduction

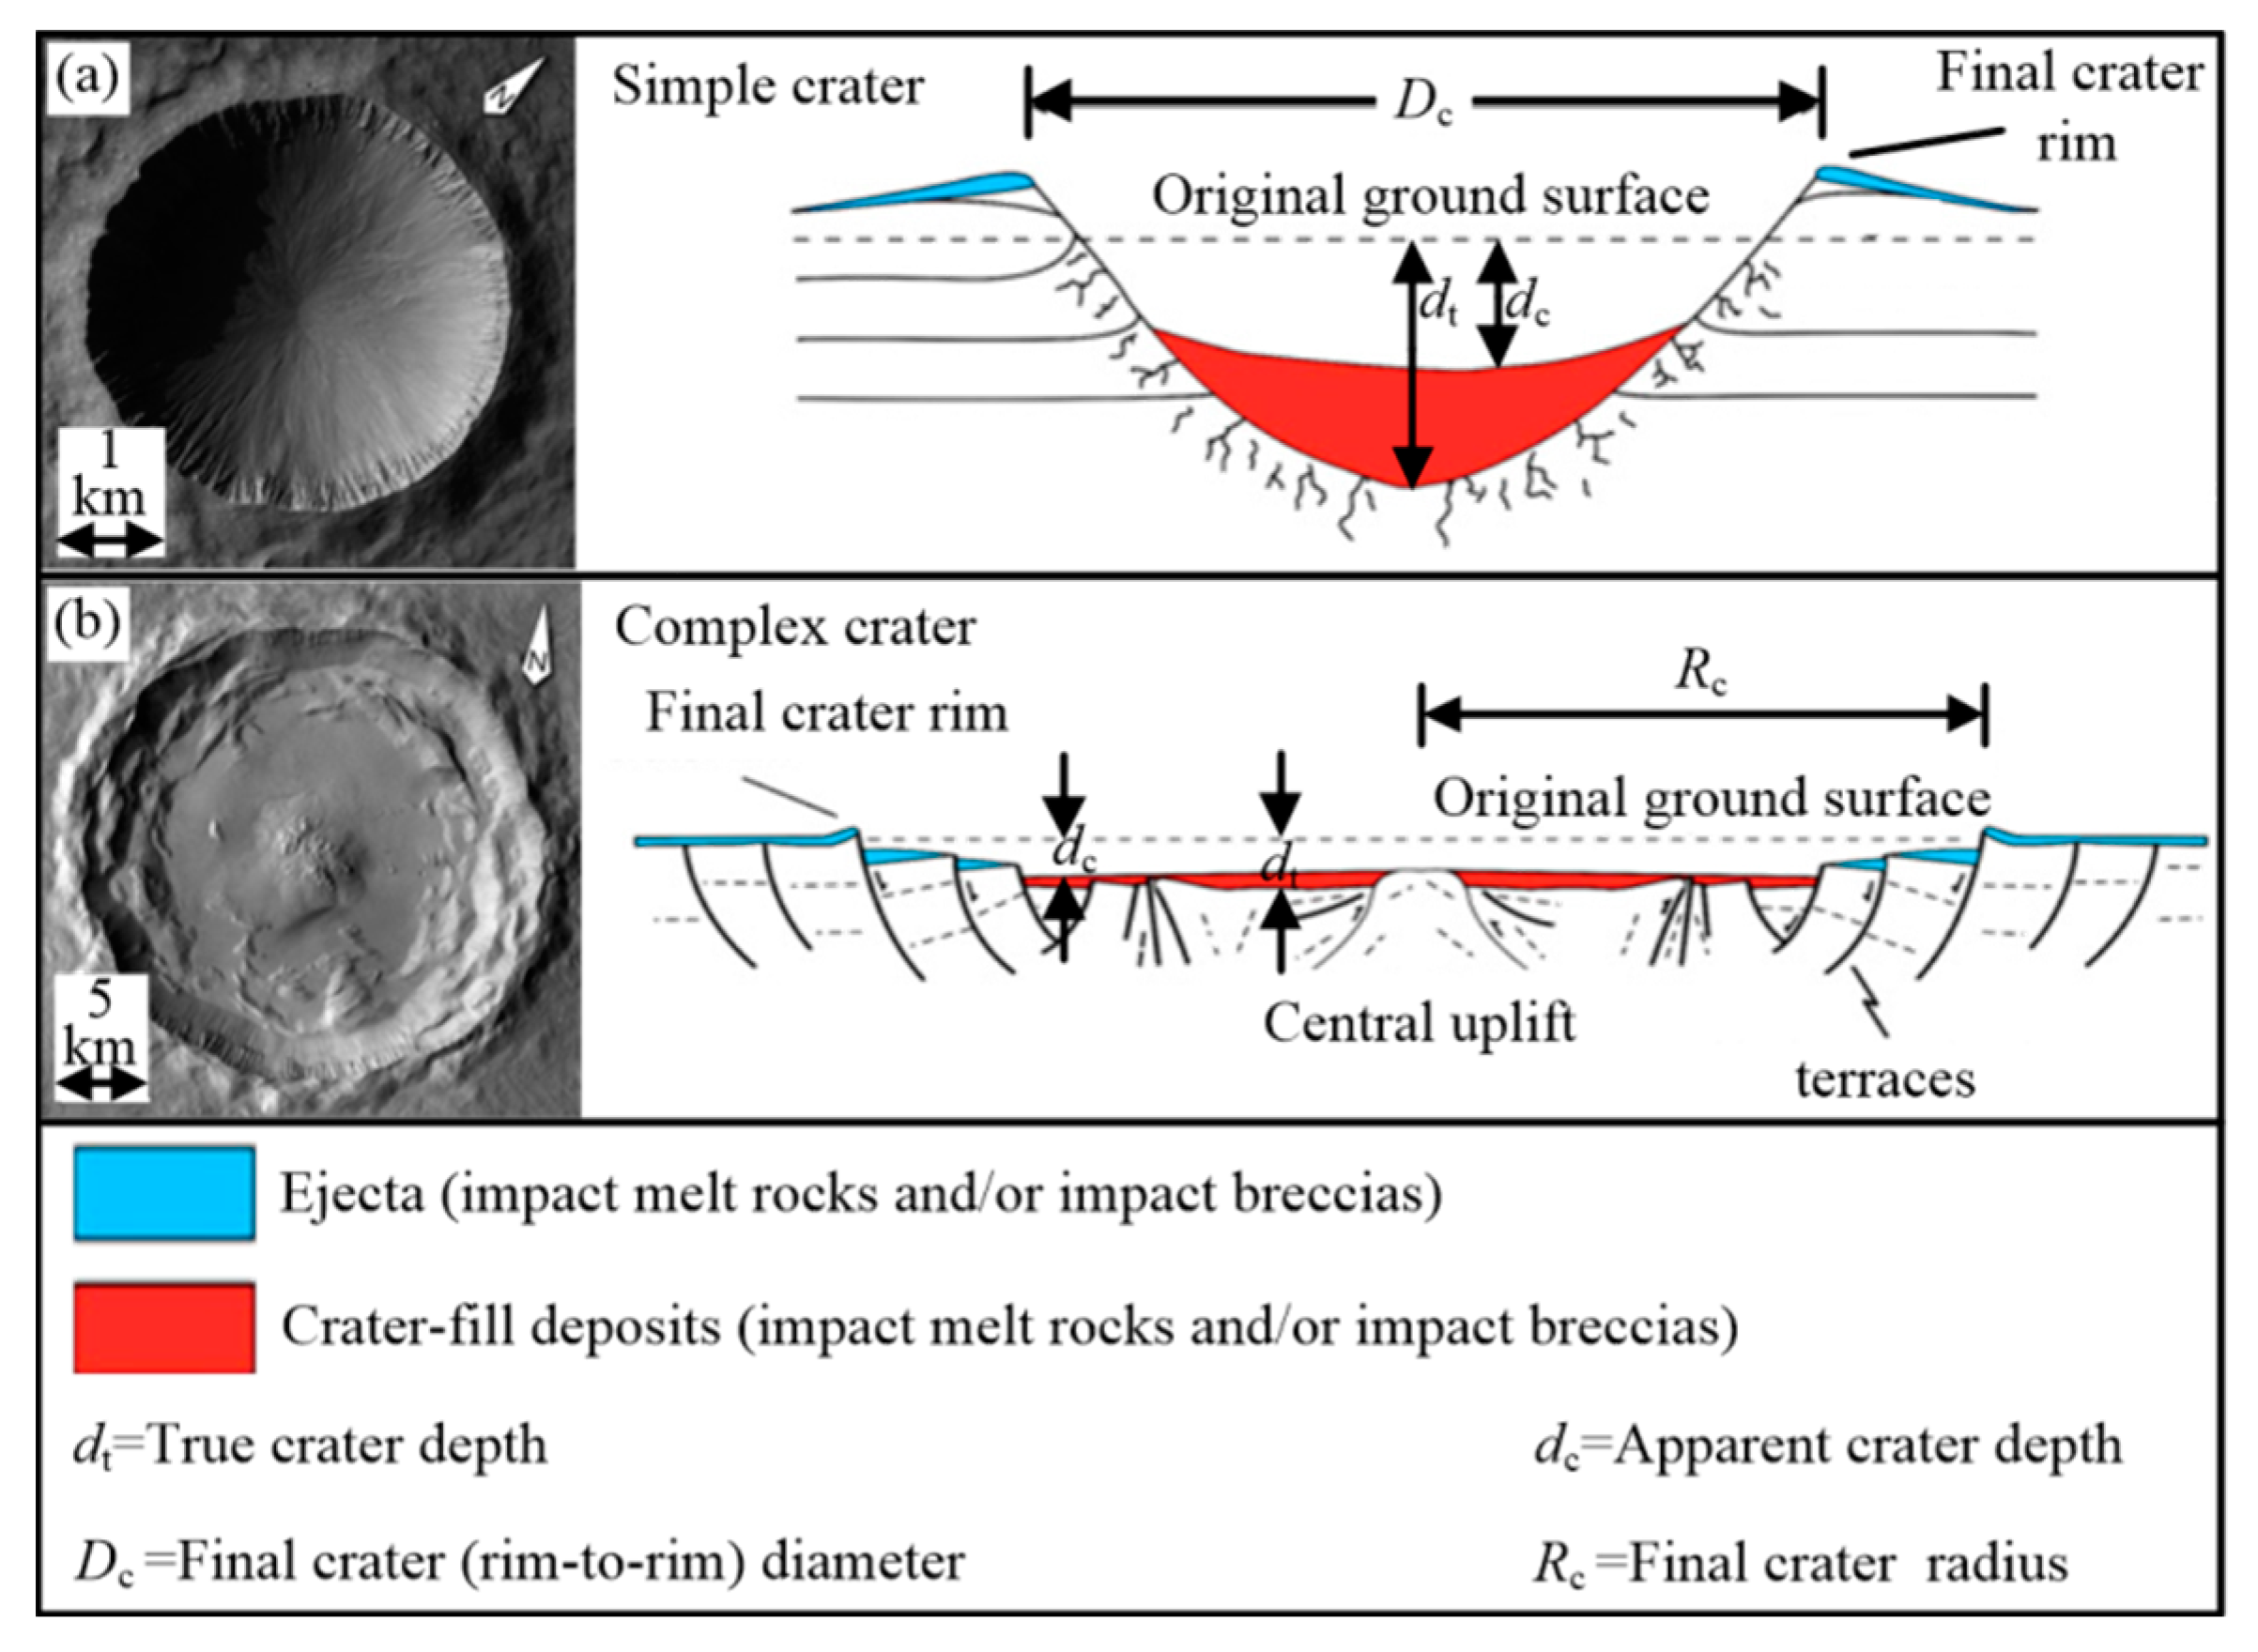
There are numerous impact craters on the surface of solid celestial bodies. These craters exhibit distinct morphological characteristics, leading to their classification into two broad categories: simple and complex. Figure 1 illustrates the morphology and cross-section of both types, with accompanying scale bars for reference. In particular, the crater radius (Rc) is defined as the horizontal distance between the crater rim and its center of impact. At the base of these craters, a sedimentary layer forms as a result of the convergence of breccia and impact melt rock. The apparent crater depth (dc) is determined as the vertical distance between this sedimentary layer and the original ground surface.
Figure 1a illustrates the morphology of a simple crater. The crater rim is slightly above the original ground surface, and overall it presents as a bowl-shaped cavity with a flat bottom. As one moves farther from the crater center, the sedimentary layer becomes thinner. Figure 1b describes the morphology of a complex crater, which has a rim terrace and central uplift.
Replicating planetary cratering impacts at a large scale through experiments faces significant challenges with current technology. However, researchers often utilize scaling laws to correlate experimental results with large-scale impact events. Investigating the scaling laws of planetary cratering impacts is crucial for advancing our understanding of crater formation mechanisms and supporting the design of scale model tests. This inquiry primarily revolves around two key factors: material strength and gravity.
In much of the relevant research, the influence of gravity on impact cratering is often overlooked, particularly when material strength plays a dominant role in the formation process of simple craters. Investigating the scaling laws governing planetary cratering impacts involving cohesive rock is of paramount importance, necessitating a combined approach employing numerical modeling and laboratory experimentation [3,4,5]. Housen and Holsapple studied the scale effect of impact cratering on terrestrial planets under the strength-dominated conditions and established the corresponding analysis model of the scaling law [6]. In particular, the effect of target properties on transient crater scaling for simple craters is studied, and the effects of the coefficient of friction and porosity on impact cratering are emphasized [7].
In the realm of cratering studies, where gravity forces reign supreme, leveraging the geotechnical centrifuge (depicted in Figure 2) becomes pivotal for altering gravity within the experimental setting when investigating scale model tests of planetary impact craters [8]. This apparatus serves to validate the reliability and precision of scaling models. Furthermore, in the domain of numerical simulations, the coupling parameter scaling theory [9] intertwines the influences of projectile diameter, impact velocity, and material density on crater formation, thereby establishing a robust scaling law model. Notably, Schmidt and Holsapple employed the geotechnical centrifuge to corroborate scale model tests via numerical simulations, culminating in the derivation of a functional relationship between crater dimensions and pertinent physical parameters [10].
Complex craters typically emerge under the gravity regime. The scaling law pertaining to complex craters elucidates an inherent correlation between the transition crater diameter and the ultimate crater diameter [11]. Gravity exerts a profound influence on the mass, velocity, and morphological evolution of ejecta during the cratering process [12], underscoring the imperative to incorporate gravity into the scaling model governing ejecta mass and velocity [13]. The theoretical framework of the point source solution [14] serves as a conduit for deeper comprehension of planetary cratering phenomena [15]. By integrating material strength and gravitational effects, Holsapple forged a scaling model delineating the impact of spherical projectiles of varying sizes on planetary surfaces [16]. Additionally, besides material strength and gravity, prudent consideration of impact angle and topographical features in the scaling model is warranted [17]. Liu et al. conducted a comprehensive review elucidating the intricacies of cratering scaling laws [18]. Based on the review of the study on impact crater formation on celestial bodies, the research progress of scaling analysis theory was summarized and supplemented [19].
While extensive research has been conducted on the scaling laws associated with planetary cratering impacts, previous reviews [19] highlight that existing studies have not established a comprehensive relationship between large-scale and small-scale impact events, especially when scale differences exceed two orders of magnitude. Specifically, key parameters such as impact crater morphology, the depth-to-diameter ratio, and cratering formation times remain underexplored. Additionally, no methodology currently exists for analyzing the gravity threshold in the morphological transition process of planetary cratering impacts.
Especially, Lv et al. established a complete numerical model of planetary impact cratering through the finite element-smoothed particle hydrodynamics adaptive method (FE-SPH), and a series of cases were designed to conduct a comparative analysis between the FE-SPH adaptive method and the iSALE method (a widely used mainstream algorithm) in the numerical simulation of planetary cratering impacts. The results highlight the advantages of the FE-SPH adaptive method in terms of computational efficiency, accuracy, and fragment morphology analysis [20]. The FE-SPH model for planetary cratering impacts incorporates a gravity preload model, alongside significant developments in the optimization of numerical parameters.
The geotechnical centrifuge system enables impact experiments under varying gravitational conditions. Inspired by the pioneering work of Housen et al., who conducted a series of centrifuge impact experiments to simulate crater formation in porous media across different gravitational conditions—thereby establishing a novel methodology for experimental studies of impact cratering [8]. Building upon the FE-SPH model for planetary cratering impacts [20] and the experimental study of the geotechnical centrifuge system [8], this paper develops a geometric scaling model for impact craters through dimensional analysis. We identify the dimensionless parameters that govern crater formation and thereby delving into their intricate relationship with the morphological transition of craters.
Then, we propose a design methodology of scaled model tests for large-scale meteorite impact cratering and validate its reliability using numerical simulations. The gravitational conditions required for these scaled model tests can be achieved using a geotechnical centrifuge. This framework establishes a theoretical bridge for analyzing large-scale hypervelocity impacts (prototype tests) via low-speed scale model tests. Furthermore, a new scaling law analysis methodology is proposed to examine the transition diameter, gravity threshold, and cratering time across impacts of different scales. We compare the results of the scale model test with reference [20] to verify the design reliability of the scale model test.
Our investigation extends beyond theoretical realms into practical engineering applications. By leveraging insights garnered from prototype tests, we meticulously design corresponding scale model tests. These scale model tests are not only meticulously crafted but are also rigorously validated through numerical simulations, ensuring their reliability and applicability in impact events on a large scale. This study provides both a conceptual framework and a theoretical foundation for the design of scaled model tests investigating large-scale impact events.
Of particular significance in our inquiry is the delineation of the threshold marking the transition in impact crater morphology. We endeavor to predict, with precision, the diameter at which Earth’s craters transition from simple to complex. Moreover, we delve into the influence of projectile diameter and gravity on the depth–diameter ratio of craters, unraveling the intricate interplay of these factors. Furthermore, we meticulously analyze the relationship between the formation time of craters in scale model tests and their counterparts in prototype tests.

2. Numerical Model and Scaling Model of the Scale Model Tests

While empirical formulas derived from experimental data fitting provide valuable insights into large-scale impact events, it is imperative to acknowledge the current limitations in verifying related conclusions using existing experimental technologies. Compared with a simple crater, the multi-factor coupling of large-scale impact events is more complicated. Therefore, the analytical conclusions obtained from experimental data fitting cannot accurately describe various scale impact events.
A significant experimental challenge in planetary cratering impacts arises from the inability of current experimental setups to replicate hypervelocity impacts (10–20 km/s) from large-diameter projectiles (ranging from meters to kilometers in size). This study aims to establish a scaling law analysis model for planetary cratering impacts, linking large-scale impacts with scale model geotechnical centrifuge tests. The model focuses on two key non-dimensional parameters: the Cauchy number and the Froude number. By utilizing low-speed impact tests on scaled models, the objective is to recreate large-scale hypervelocity impacts, thereby offering theoretical guidance for the design of laboratory-scale model tests.
Building upon prior research endeavors, we integrate advancements in geotechnical centrifuge technology into our study. This integration facilitates the establishment of a robust scaling model for meteorite impact, encompassing both prototype and scale model tests. The reliability of our proposed model is rigorously assessed and validated through comprehensive numerical simulations, thereby underscoring its efficacy and utility in deepening our understanding of cratering impacts.

2.1. Numerical Method and Geometry Model

Both the impact-simplified arbitrary Lagrangian Eulerian (iSALE) [21] and the finite element-smoothed particle hydrodynamics adaptive method (FE-SPH) [20] have been employed to simulate the formation process of planetary cratering impacts. FE-SPH, which combines the strengths of finite element and SPH, facilitates particle and element interaction through coupling algorithms governing forces, energy, and momentum [22]. Comparative analyses reveal that, at identical grid resolutions, the FE-SPH model exhibits superior numerical precision over the Euler method for simulating planetary cratering impacts [20]. Consequently, the FE-SPH method has been selected to establish the numerical model. Figure 3 illustrates the operational principle of the FE-SPH adaptive method, depicting the projectile (highlighted in red) and the target (highlighted in blue).
In Figure 3, the red and blue colors represent the projectile and target elements, respectively. Figure 3a illustrates the scenario where both the projectile and the target remain intact. Figure 3b demonstrates that elements near the contact interface experience slight deformation. The method employed involves updating the contact surface at each time step and verifying whether the elements meet the failure criteria. Any element that satisfies criteria is removed and replaced by a corresponding particle located at the same position, inheriting identical parameters such as mass, velocity, and material properties. As shown in Figure 3c, a few particles are activated, indicating that the corresponding elements have reached the failure threshold. The contact boundaries are then updated with the residual elements, and the activated particles are coupled with these residual elements. Subsequently, a progressive failure mechanism is observed as additional finite elements undergo fracture and subsequent conversion to SPH particles, as depicted in Figure 3d.
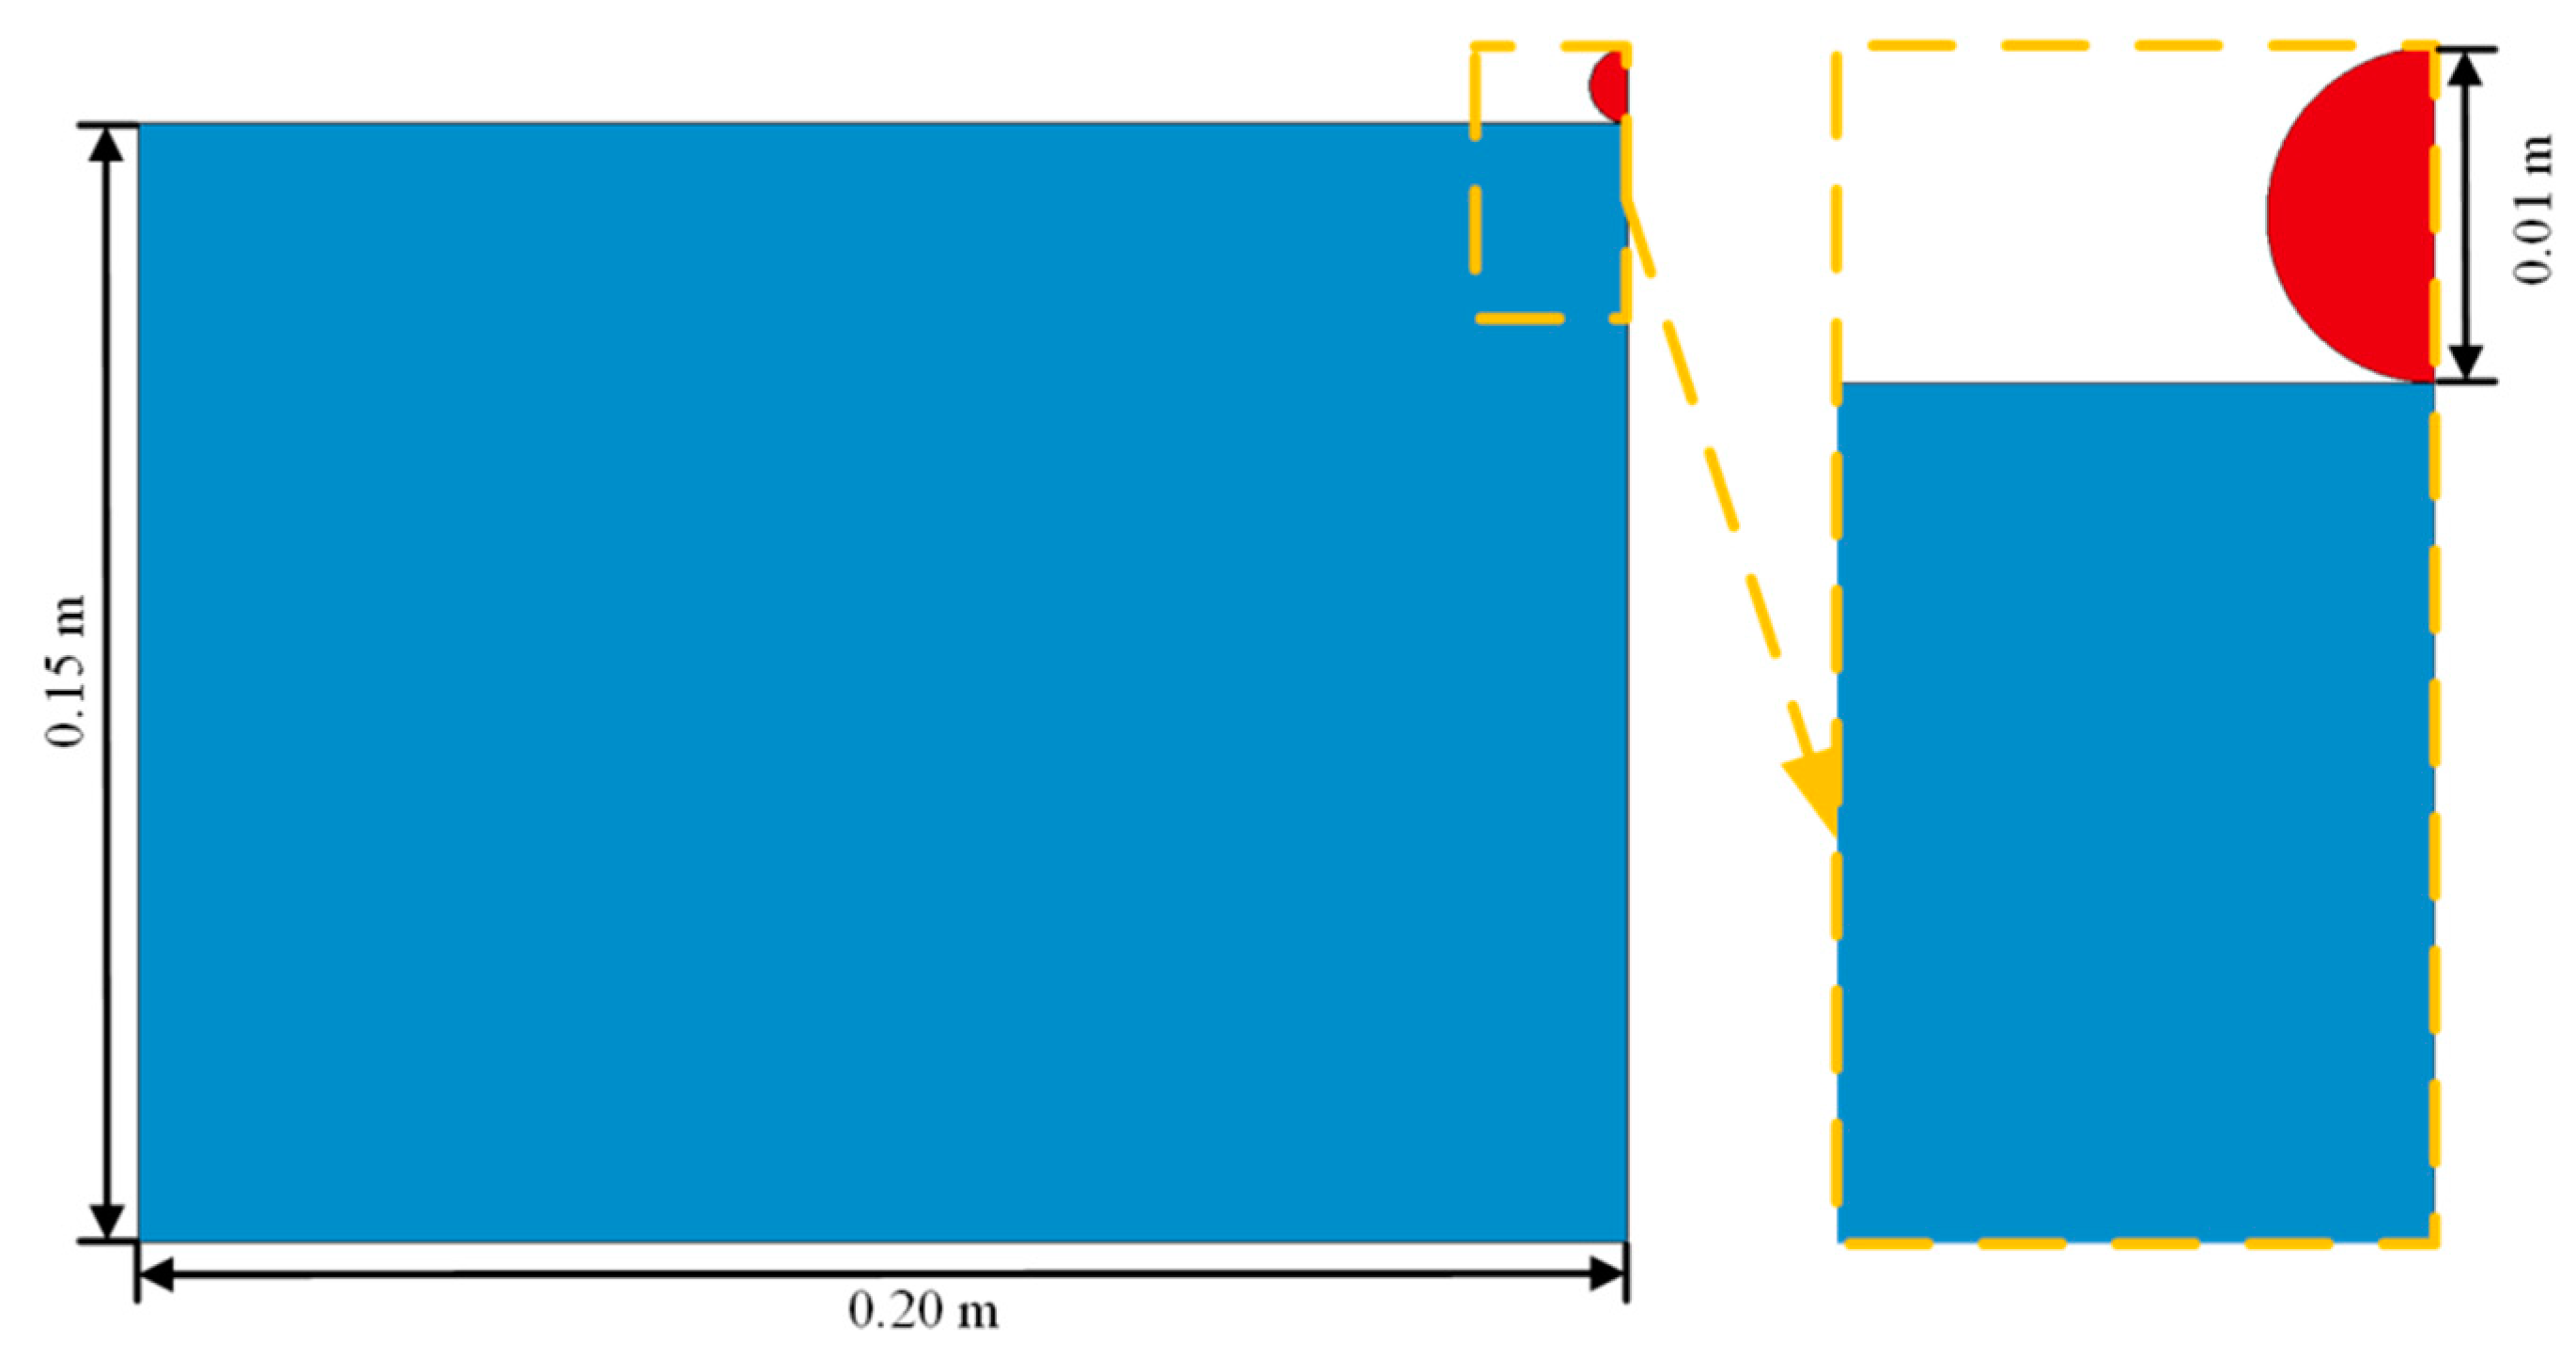
The geometric models used in both prototype and scale model tests are analogous in structure, differing primarily in size. The 2D finite element axisymmetric geometric model, as depicted in Figure 4, showcases this similarity. Notably, the yellow frame denotes the locally enlarged region surrounding the initial impact point, with the distance between the projectile and target set at 0. The grid resolution of the geometric model significantly influences the accuracy of numerical outcomes, with resolution positively correlating with precision. Comparative studies indicate that the FE-SPH method outperforms iSALE at equivalent resolutions [20]. Moreover, the morphology evolution of impact craters demonstrates limited sensitivity to grid resolution. To balance computational accuracy with time efficiency, a grid resolution of 10 to 20 cells per projectile radius (CPPR) is deemed appropriate [23]. Consequently, the grid resolution of the geometric model has been fixed at 10 CPPR.
To ensure consistency between the design of scale model tests and the experimental conditions within the geotechnical centrifuge, fixed boundaries have been imposed on the sides and bottom of the target in the numerical simulation of scale model tests. The influence of boundary on the design basis of scaling model tests is discussed in Section 4.

2.2. Scaling Analysis Model

During the contact compression stage, the impact pressure significantly surpasses the material strength, rendering the material akin to compressible fluids. Consequently, simulations of planetary cratering impacts necessitate the consideration of both solid mechanics and fluid dynamics [9]. A comprehensive understanding of the cratering process entails the identification and analysis of various influential parameters. Of particular interest is the relationship between crater volume (Vc) and the following parameters [15]:
V c = f a , ρ p , U p , ρ t , T p , T t , Y t , E p , E t , C p , C t , n p , n t , g
where Vc is crater volume, a is the projectile radius, ρ is the density, Up is the projectile impact velocity, T is temperature, Yt is the material strength of target, E is the elastic modulus of material, C is the sound speed of material, n is the porosity of material, and g is gravity. The variables with subscripts “p”, “t” and “c” represent the relevant parameters of the projectile, target and crater, respectively.
In general, the material of the projectile and the target is different, which indicates that the density, strength, sound velocity, modulus and porosity of the projectile and target are different [8]. In this case, the projectile radius a, impact velocity Up, temperature Tp, strength Yt, and porosity np are taken as the basic dimension, and Equation (1) can be simplified by dimensional analysis as follows:
π v = ρ t V c m p = f 1 , ρ p U p 2 Y t , 1 , ρ t U p 2 Y t , 1 , T t T p , 1 , E p Y t , E t Y t , C p U p , C t U p , 1 , n t n p , g a U p 2
The first term on the left of Equation (2) is the ratio of “crater mass” to the projectile mass, and this ratio represents the cratering efficiency πv, where mp = (4πρpa3)/3 represents projectile mass. When the initial temperature of the projectile and target is assumed to be the same, the elastic effect of the material is ignored, and the impact cratering is regarded as an approximate adiabatic process; the simplified Equation (2) can be obtained as follows:
ρ t V c m p = f ρ p ρ t · ρ t U p 2 Y t , ρ t U p 2 Y t , C p C t · C t U p , C t U p , n t n p , g a U p 2
By eliminating similar terms and further simplifying Equation (3), the following is obtained:
ρ t V c m p = f ρ p ρ t , ρ t U p 2 Y t , C p C t , C t U p , n t n p , g a U p 2
Crater volume Vc is a function of crater diameter Dc and apparent crater depth dc, and projectile mass mp is a function of projectile radius a. Equation (4) can obtain the function of dc/a, as shown in Equation (5). Similarly, the Equation (4) can also obtain the function of Dc/a, as shown in Equation (6). Next, the dimensional analysis of dc/a is discussed as an example.
d c a = f ρ p ρ t , ρ t U p 2 Y t , C p C t , C t U p , n t n p , g a U p 2
D c a = f 1 ρ p ρ t , ρ t U p 2 Y t , C p C t , C t U p , n t n p , g a U p 2
The first item on the right of Equation (5) is the density ratio of projectile to target, which can affect crater size and the target’s damage. The second term is the dimensionless quantity related to material strength, which can represent the Cauchy number (Ca). The third term is the ratio of sound speed between the projectile and target, which describes the compressibility of the projectile and target. The fourth term is the ratio of compressibility to inertia. The fifth item is the ratio of the porosity of the projectile and target. The sixth term represents the reciprocal of the Froude number F, which is denoted as π2.
When the porosity under hypervelocity impact (HVI) is ignored, Equation (5) can be further simplified as follows:
d c a = f ρ p ρ t , ρ t U p 2 Y t , C p C t , C t U p , g a U p 2
In delineating the mechanisms governing the formation of planetary craters, it is recognized that the formation process of simple and complex craters is governed by distinct factors [16]. Simple crater formation is primarily governed by material strength, whereas complex crater formation is predominantly influenced by gravity. Hence, analyses of the scaling laws governing planetary cratering impacts typically focus on the dominant factors to facilitate discussion.
Regarding the simple crater, the gravity factor is ignored in the analysis of a simple crater, so Equation (7) can be further simplified as follows:
d c a = f ρ p ρ t , ρ t U p 2 Y t , C p C t , C t U p
When the material compressibility and gravity are ignored, the results of the scaling law for HVI cratering of a thick target [18] show that the crater depth dc is as follows:
d c a = 0.27 ρ p ρ t 2 / 3 ρ t U p 2 Y t 1 / 3
On the other hand, the strength factor is ignored in the analysis of a complex crater, and Equation (7) can be further simplified as follows:
d c a = f ρ p ρ t , C p C t , C t U p , g a U p 2
When the material of the projectile and the target is the same, and the compressibility of material is ignored, Equation (7) can be simplified as follows:
d c a = f ρ t U p 2 Y t , g a U p 2 = f C a , F 1 = f C a , π 2

3. Design of Scale Model Tests

Through scaling analyses, it has been established that for projectiles and targets of identical material composition, the principal dimensionless quantities characterizing planetary crater impacts are the Cauchy number (Ca) and the Froude number (F) [8]. Consequently, an assessment of the scale model test design feasibility is conducted through Equation (11) and is written as follows:
d c a = α 1 ρ t U p 2 Y t β 1 g a U p 2 γ 1
The expression of Dc/a can be obtained by dimensionality analysis from Equation (6) and is written as follows:
D c a = α 2 ρ t U p 2 Y t β 2 g a U p 2 γ 2
where α, β, and γ are undetermined coefficients, which can be obtained by data fitting.
In particular, the formation process of simple and complex craters is dominated by strength and gravity, even though their effects are quite different for simple and complex craters. As for the scaling model, the values of the undetermined coefficients are different, especially β and γ. Therefore, the γ is closer to 0 than the β in the analysis of simple craters, and the β is closer to 0 than the γ in the analysis of complex craters.
According to the analysis of Equations (12) and (13), the coefficients α, β, and γ should have the definite values under the same crater type. For example, if Ca and F of the scale model test and prototype test correspond, the Dc/a and dc/a of the scale model test and prototype test should be approximately the same, respectively. Further, the depth–diameter ratio dc/Dc of the crater in the scale model test and prototype test is approximately the same.
Quartzite projectiles with different diameters impact a thick quartzite target at 12 km/s as prototype tests. The scale model tests are designed according to the experimental conditions of the geotechnical centrifuge. The projectile diameter Dp = 2a = 0.01 m, the impact velocity is 2 km/s, and the target size is 0.4 × 0.15 m. The scaling law between the prototype test and the scale model test can be explored and verified by numerical simulation.
It is noteworthy that the primary focus lies in exploring and validating the scaling laws between scale model tests and prototype tests, rather than determining specific coefficient values. As such, considerations regarding material preparation are not within the scope of this discussion. In hydrodynamic analyses, gravity and inertial forces emerge as pivotal factors. To ensure dynamic scaling between impact events across different scales, it is imperative that the Froude number (F) remain consistent between the scale model tests and prototype tests.
F = ( π 2 ) 1 = U ps 2 g s a s = U py 2 g y a y
The subscript “s” represents the parameters of the scale model tests, and the subscript “y” represents the parameters of the prototype tests.
The scale model test adopts the same Ca with the prototype test, and the geometric shape and impact angle are the same. Therefore, the scale model test and prototype test meet Cauchy number scaling.
C a = ρ ts U ps 2 Y ts = ρ ty U py 2 Y ty
With Yt set as the cohesion strength, Wünnemann and Ivanov designed a parameter S to analyze the morphology transition from a simple to a complex crater [24].
S = Y t ρ g d max + φ ,
where dmax is the maximum “strengthless” crater depth and φ is the internal friction.
Wünnemann and Ivanov established the coefficients of cohesion (Yt) and internal friction (φ) as 25 kPa and 1, respectively [24]. The cohesion strength (Yt) of 25 kPa is notably lower than the average rock value, and φ is inherently linked to material properties. Hence, these parameters are empirical in nature, aligning well with the utilization of the acoustic fluidization (A-F) model [24] and the iSALE method. However, it is crucial to acknowledge that these values may not universally satisfy all material models and numerical methods. Rock damage mechanisms primarily involve tensile and shear stresses. Consequently, in our study, Yt is defined as the tensile strength of the target, while the parameter S′ is formulated based on F (Froude number) and Ca (Cauchy number), as delineated in Equation (17). F is determined as the reciprocal of π2.
S = F C a = Y t ρ t g a
Through the manipulation of F and Ca, both the prototype and scale model tests adhere to the dynamic scaling and Cauchy number scaling, thereby establishing a scaling law between prototype and scale model tests. Considering the complexity of multi-parameter composition in F and Ca, there exists diversification in the design approaches for scale model tests. However, the geotechnical centrifuge surpasses conventional HVI equipment in its capability to alter gravity, thus making gravity the preferred control variable in test design, especially when considering engineering applications.
With the projectile diameter Dp as the control variable, cases 1, 2, 3, 4, and 5 are designed as prototype tests, as shown in Table 1. The material of the projectile and target is quartzite, the impact velocity Up is 12 km/s, the gravity is 9.81 m/s2, the material density is 2600 kg/m3, and the Yt is 18 MPa. Then the corresponding scale model tests 1′, 2′, 3′, 4′, and 5′ are designed according to Equations (14) and (15). The parameters of test design are shown in Table 1.
In the scale model test, the projectile diameter Dp is 0.01 m, the impact velocity Up is 2 km/s, and the target density is 1800 kg/m3, where S′ can be obtained by Equation (17). The prototype test and corresponding scale model test are grouped together. For example, case 1 and 1′ are denoted as group G1, and then five groups (G1, G2, G3, G4, and G5) are obtained.
The projectile diameter Dp in cases 1, 2, 3, 4, and 5 increases successively, and the gravity g in cases 1′, 2′, 3′, 4′, and 5′ increases successively. S′ decreases as π2 increases under the same Ca. The prototype test and scale model test meet Cauchy number scaling and dynamic scaling. Therefore, the S′ of the prototype test and its scale model test are equal. S′ of cases 1, 2, 3, 4, and 5 decrease successively, and the cratering types of cases 1 and 5 are simple and complex, respectively. It indicates that S′ is related to the morphology transition of impact craters.
Without considering the strength and compressibility of material, Schmidt and Holsapple designed a series of tests by geotechnical centrifuge and numerical simulation and obtained the function between the crater radius Rc and relevant quantities [10], written as follows:
R c = 0.825 ρ p 0.33 ρ t 0.07 g 0.22 E k 0.26 U p 0.09
where Ek is the cratering kinetic energy. In order to analyze the effect of g and Dp on the crater diameter Dc, Equation (18) is derived, written as follows:
D c = 1.65 ρ p 0.33 ρ t 0.07 g 0.22 E k 0.26 U p 0.09
The control variable of cases 2 and 1 is the projectile diameter Dp, and the control variable of cases 2′ and 1′ is gravity g. Therefore, the ratio of the crater diameter in different cases can be obtained from Equation (19) and is written as follows:
D c 2 D c 1 = E k 2 0.26 E k 1 0.26 = m p 2 0.26 m p 1 0.26 = a 2 0.78 a 1 0.78 = ( a 2 a 1 ) 0.78 D c 2 D c 1 = g 2 0.22 g 1 0.22 = ( g 2 g 1 ) 0.22
The subscript number represents the case number, and mp represents projectile mass. Equation (20) indicates that Dc is positively correlated with Dp and negatively correlated with g.
Currently, the scaling law for planetary cratering impacts encompasses dominant factors. Typically, the analytical model for the scaling law is segmented into the strength regime and the gravity regime, respectively. In the strength regime analysis, gravity is disregarded, while in the gravity regime, strength is neglected. Hence, crater research conducted without accounting for gravity can be interpreted as scaling analysis within the strength regime. Based on prototype tests, we consider F and Ca to design the scale model tests, and the effect of projectile diameter and gravity on crater diameter is analyzed.

4. Numerical Verification and Comparative Analysis of Scale Model Tests

In accordance with the scaling analysis outlined above, it is observed that experiments employing identical F and Ca adhere to both dynamic and Cauchy number scaling. Consequently, the depth-to-diameter ratio (dc/Dc) ought to remain consistent between prototype and scale model tests. Subsequent validation of the accuracy and dependability of scale model test designs is achieved through numerical simulations.

4.1. Boundary Effect on Numerical Simulation of Scale Model Tests

The boundary conditions can affect the evolution of the wave system, consequently affecting material damage. The extent of this influence is contingent upon various factors, including impact conditions and material properties. Throughout the cratering process, the shock wave undergoes rapid attenuation as it propagates. While the boundary effect on impacts against semi-infinite targets is constrained by target thickness and material properties, it is comparatively more pronounced in thin target impacts. In the simulation of impacts against semi-infinite targets, non-reflecting boundary conditions are typically employed to mimic realistic scenarios [22].
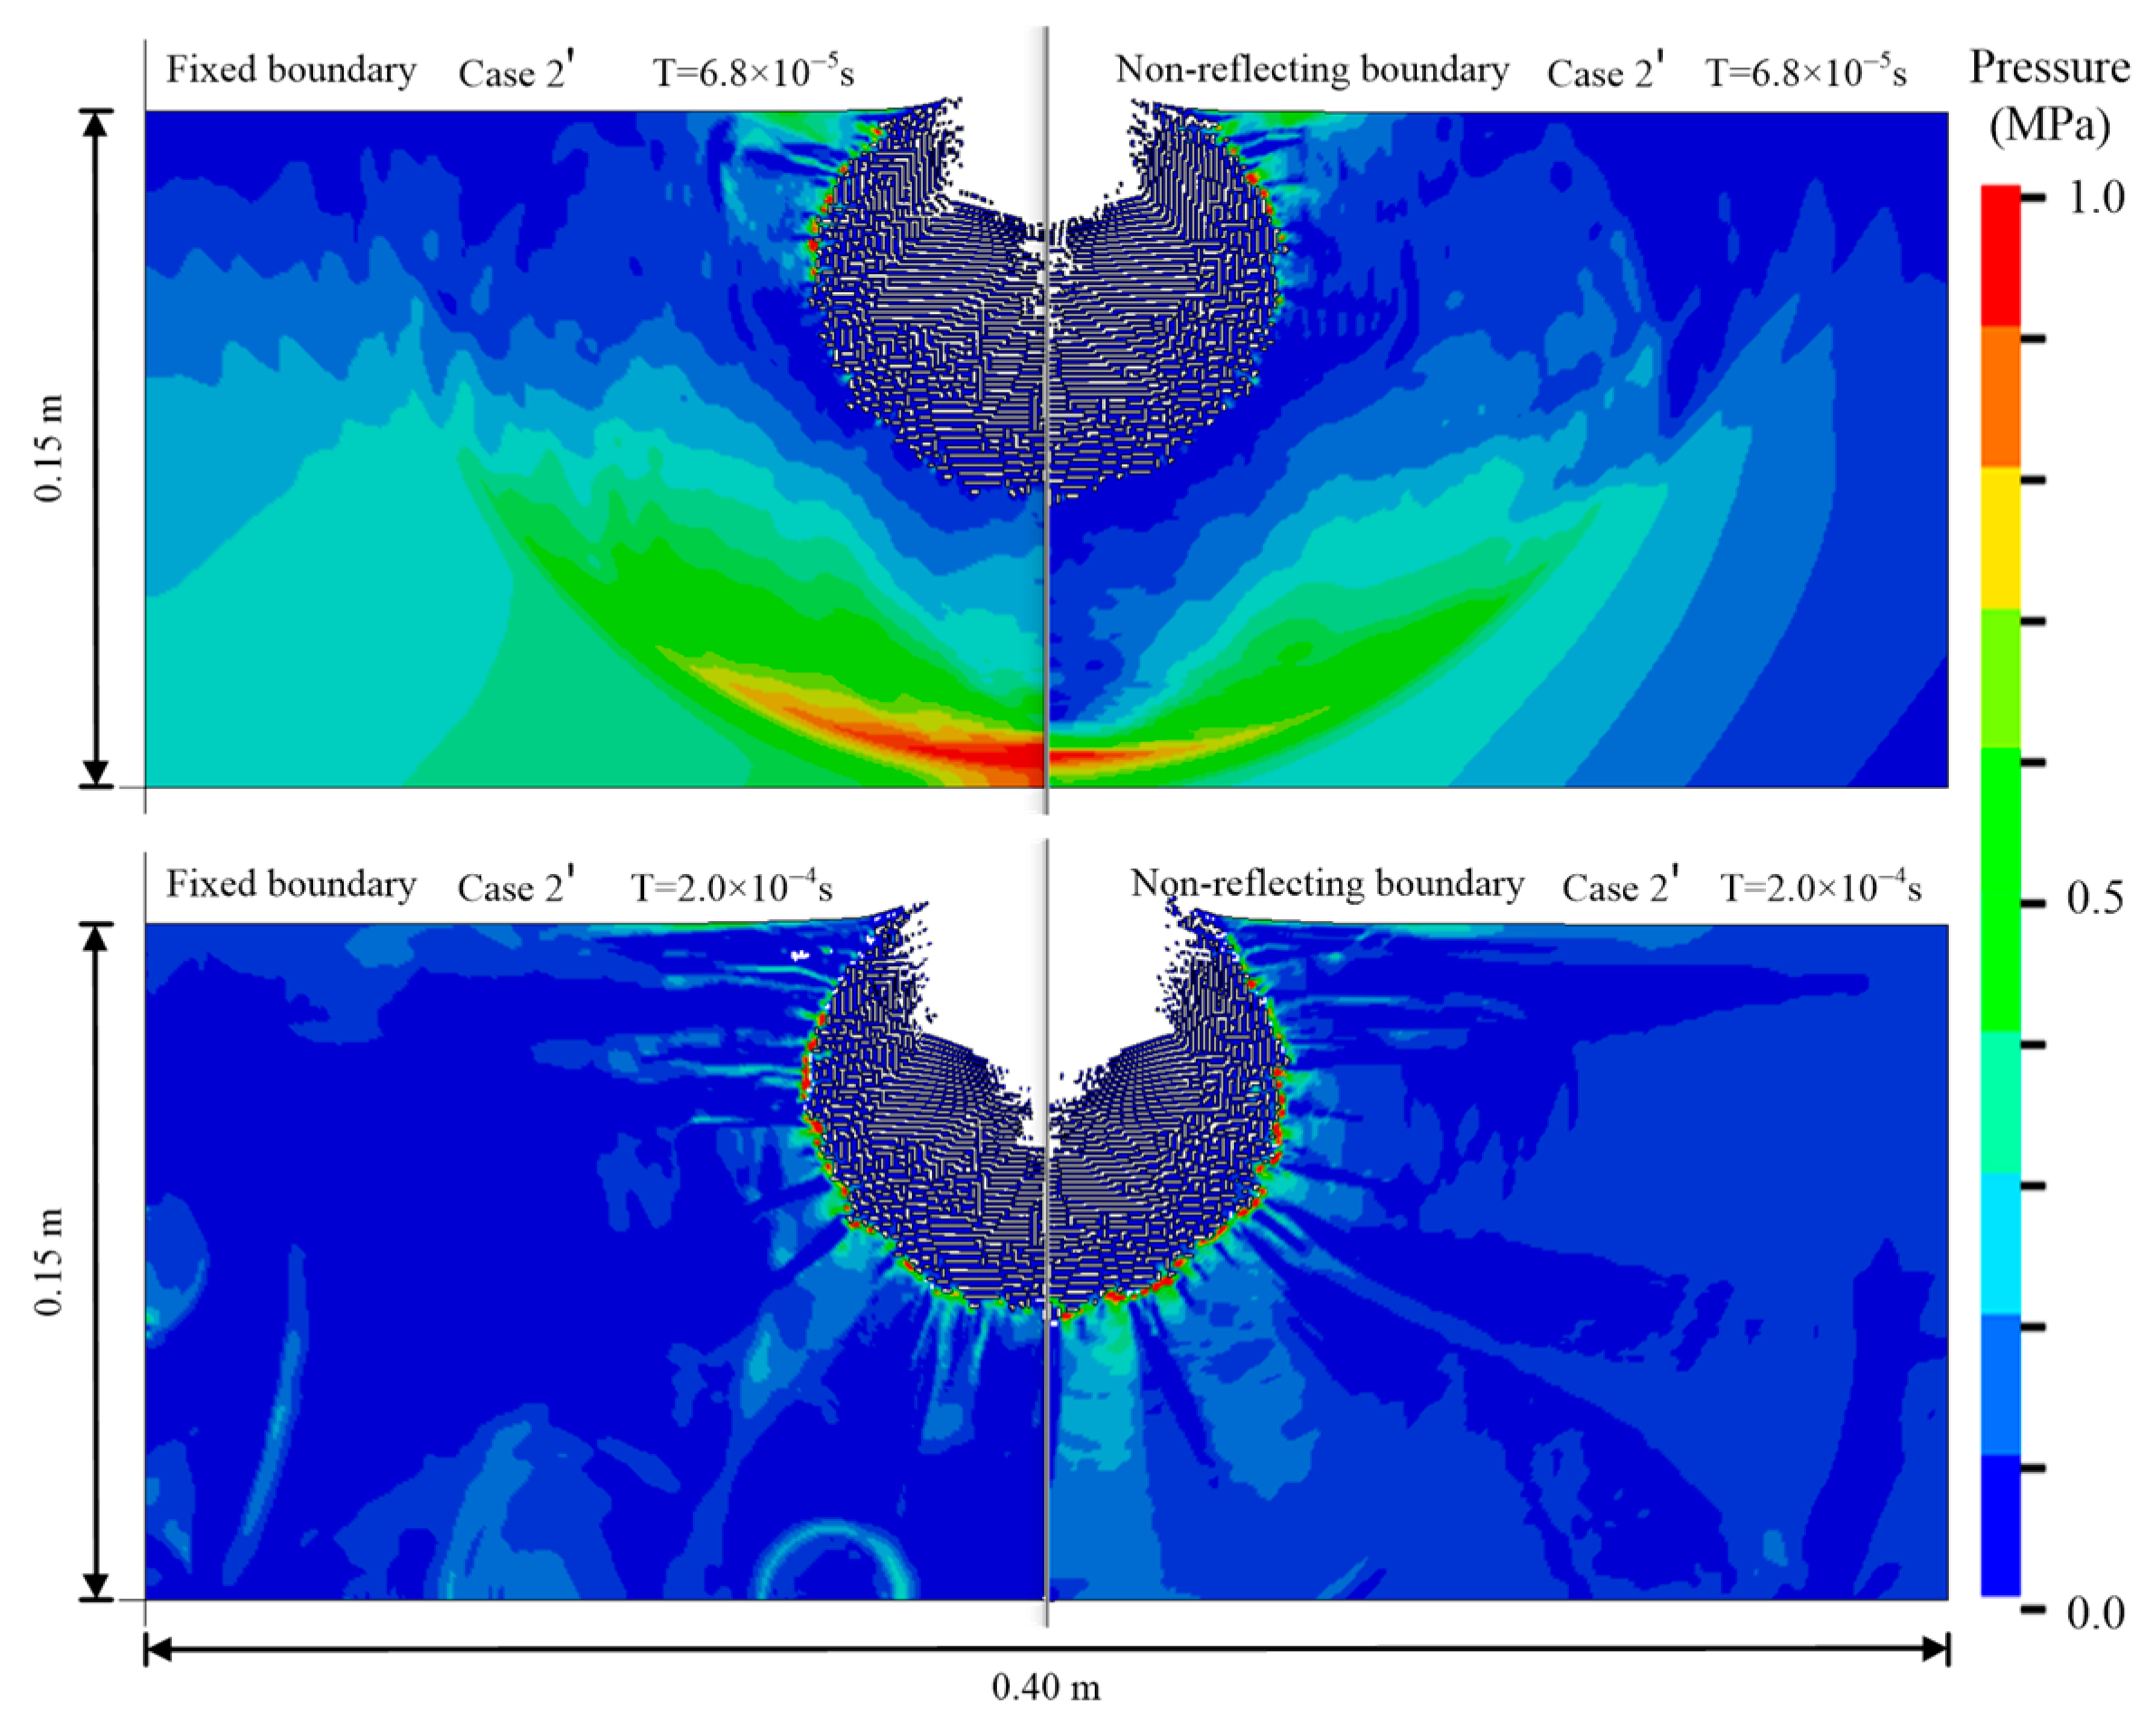
However, in practical engineering applications such as geotechnical centrifuge testing and vertical ballistic experiments, thick targets are often situated within circular grooves [8]. This configuration inherently imposes limitations on the target boundaries, rendering them fixed. Consequently, we illustrate the effects of boundary conditions on the numerical outcomes of scaling model tests using the example of the scale model test (case 1′), as depicted in Figure 5. To facilitate a clearer comparison of target damage, SPH particles are obscured.
Observations indicate that the shock wave reaches the bottom boundary of the target at T = 6.8 × 10⁻⁵ s. A comparative analysis between the left and right sides of Figure 5 reveals that the target damage in case 1′ remains largely consistent under both fixed and non-reflecting boundary conditions, albeit exhibiting variations in pressure distribution due to boundary effects. Notably, the target maintains low pressure at T = 2.0 × 10⁻⁴ s, with the damage inflicted under both boundary conditions in case 1′ exhibiting minimal disparity. Therefore, in order to make the simulation match the engineering application, the fixed boundary conditions are adopted in all simulations of the scale model tests.

4.2. Numerical Simulation Verification of Scale Model Tests

The crater test data obtained by numerical simulation are shown in Table 2. Table 2 demonstrates a consistent depth–diameter ratio among craters in both prototype and scale model tests, indicating the fidelity of scale model tests in replicating prototype conditions. Moreover, Table 1 illustrates that the parameter S′ effectively characterizes the morphological transitions of craters from simple to complex. In our tests setup, the projectile diameter serves as the controlled variable for cases 1, 2, 3, 4, and 5. Our findings reveal a positive correlation between projectile diameter and crater depth, diameter, and formation time, while the depth–diameter ratio and parameter S′ exhibit a negative correlation with projectile diameter. Conversely, in cases 1′, 2′, 3′, 4′, and 5′, where gravity serves as the control variable, we observe a negative correlation between gravity and crater depth, diameter, formation time, depth–diameter ratio, and parameter S′. Notably, the results derived from numerical simulations align with the analytical predictions of Equation (20).
The dimensions of crater depth (dc) and diameter (Dc) in scale model tests exhibit a negative correlation with gravity, leading to a corresponding negative correlation between crater volume (Vc) and gravity, as Vc is contingent upon both dc and Dc. Additionally, under constant projectile mass, Equation (2) elucidates that cratering efficiency (πv) inversely relates to gravity.
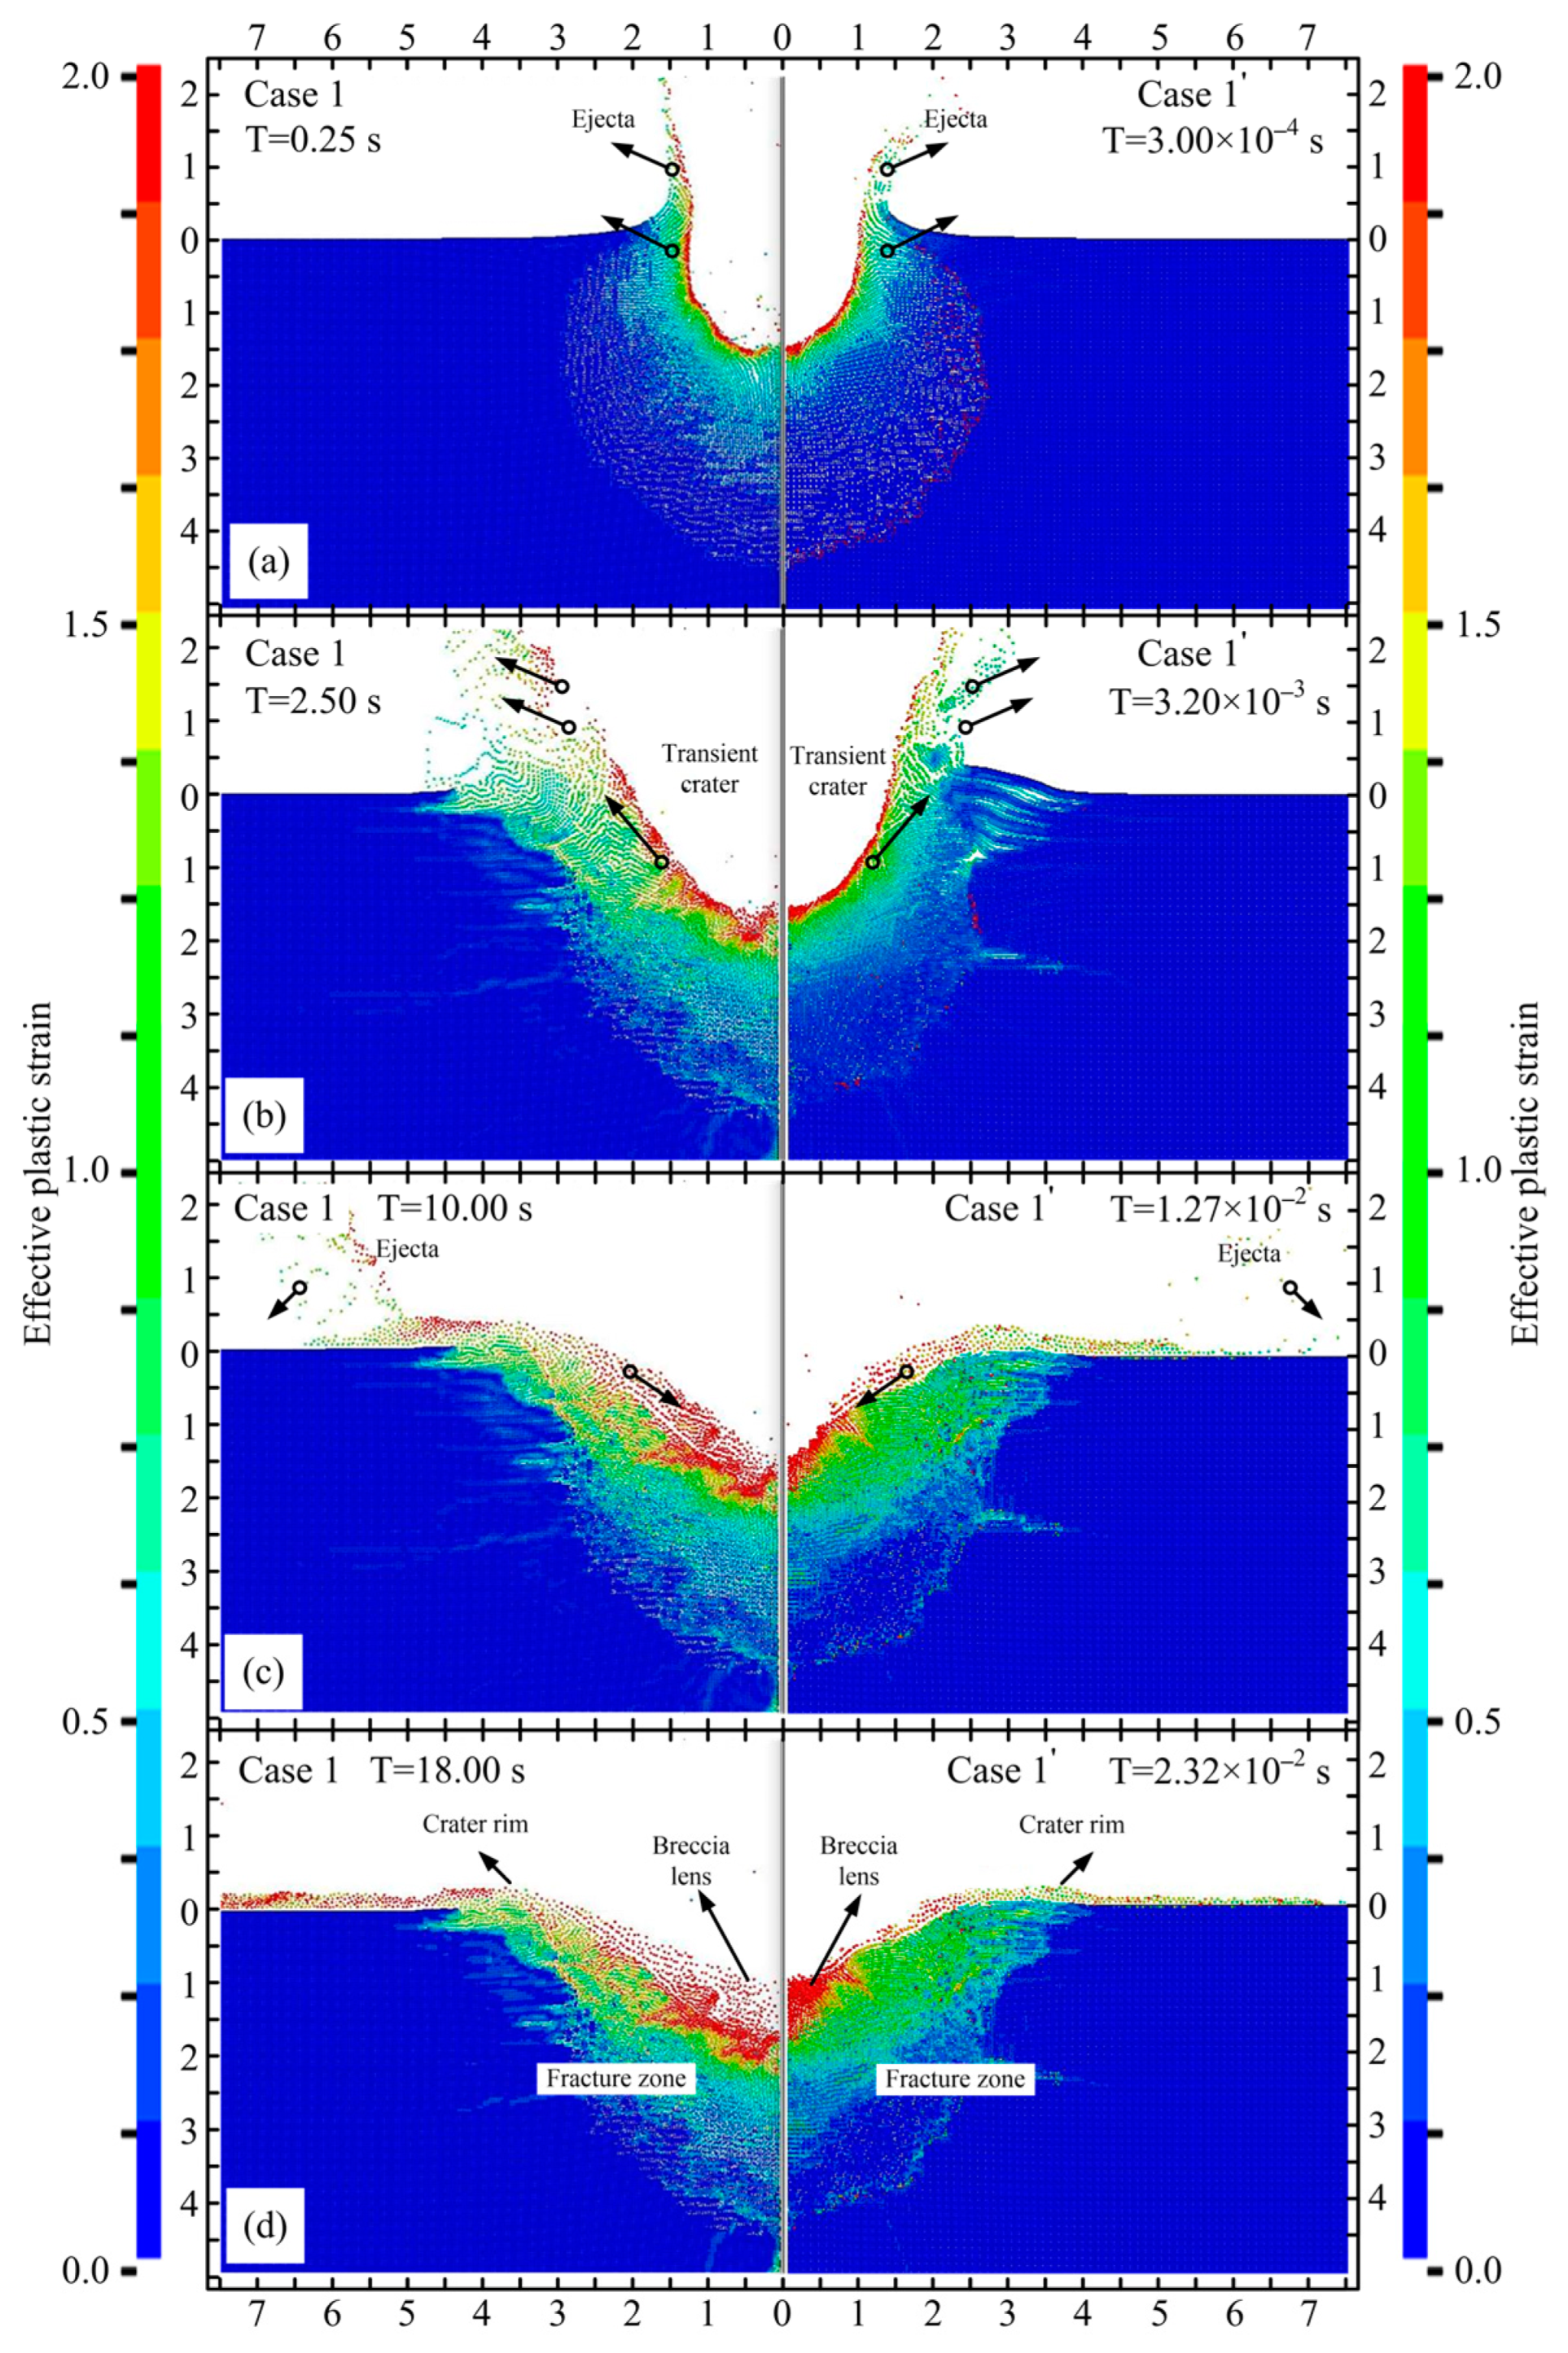
To enable cross-comparison of crater dimensions, the dimensionless distance (L/dc) is normalized by the actual distance (L) and the crater’s final apparent depth (dc), facilitating depth–diameter ratio comparisons between scale model tests and prototype tests. Illustrative of simple crater morphology, cases 1 and 1′ yield smooth bowl-shaped cavities, as depicted in Figure 6. The results of case 1 are a direct replication of data presented in reference [20], which is used to confirm the design reliability of scale model tests through numerical comparisons. The impact point is denoted as (0,0). In case 1, the crater’s apparent depth (dc1) measures 101.26 m, and the crater’s apparent depth dc1′ in case 1′ is 0.0201 m.
Figure 6a–d illustrate pivotal stages in the formation of a simple crater. Figure 6a depicts the moment of maximum crater depth, while Figure 6b represents the stage of maximum crater volume. Figure 6c illustrates the intermediary stage characterized by gradual inward collapse of the crater rim, and Figure 6d portrays the final stage where the crater’s shape stabilizes. Notably, Figure 6 indicates that the scale model test (case 1′) faithfully reproduces the results of the prototype test (case 1), showcasing consistent morphological evolution and damage distribution of the impact crater. Case 1′ exhibits a significantly shorter cratering time of 2.32 × 10⁻² s compared to the 18.00 s duration of case 1. Additionally, the depth–diameter ratio (dc/Dc) of craters in cases 1 and 1′ are 0.143 and 0.142, respectively, as illustrated in Figure 6d.
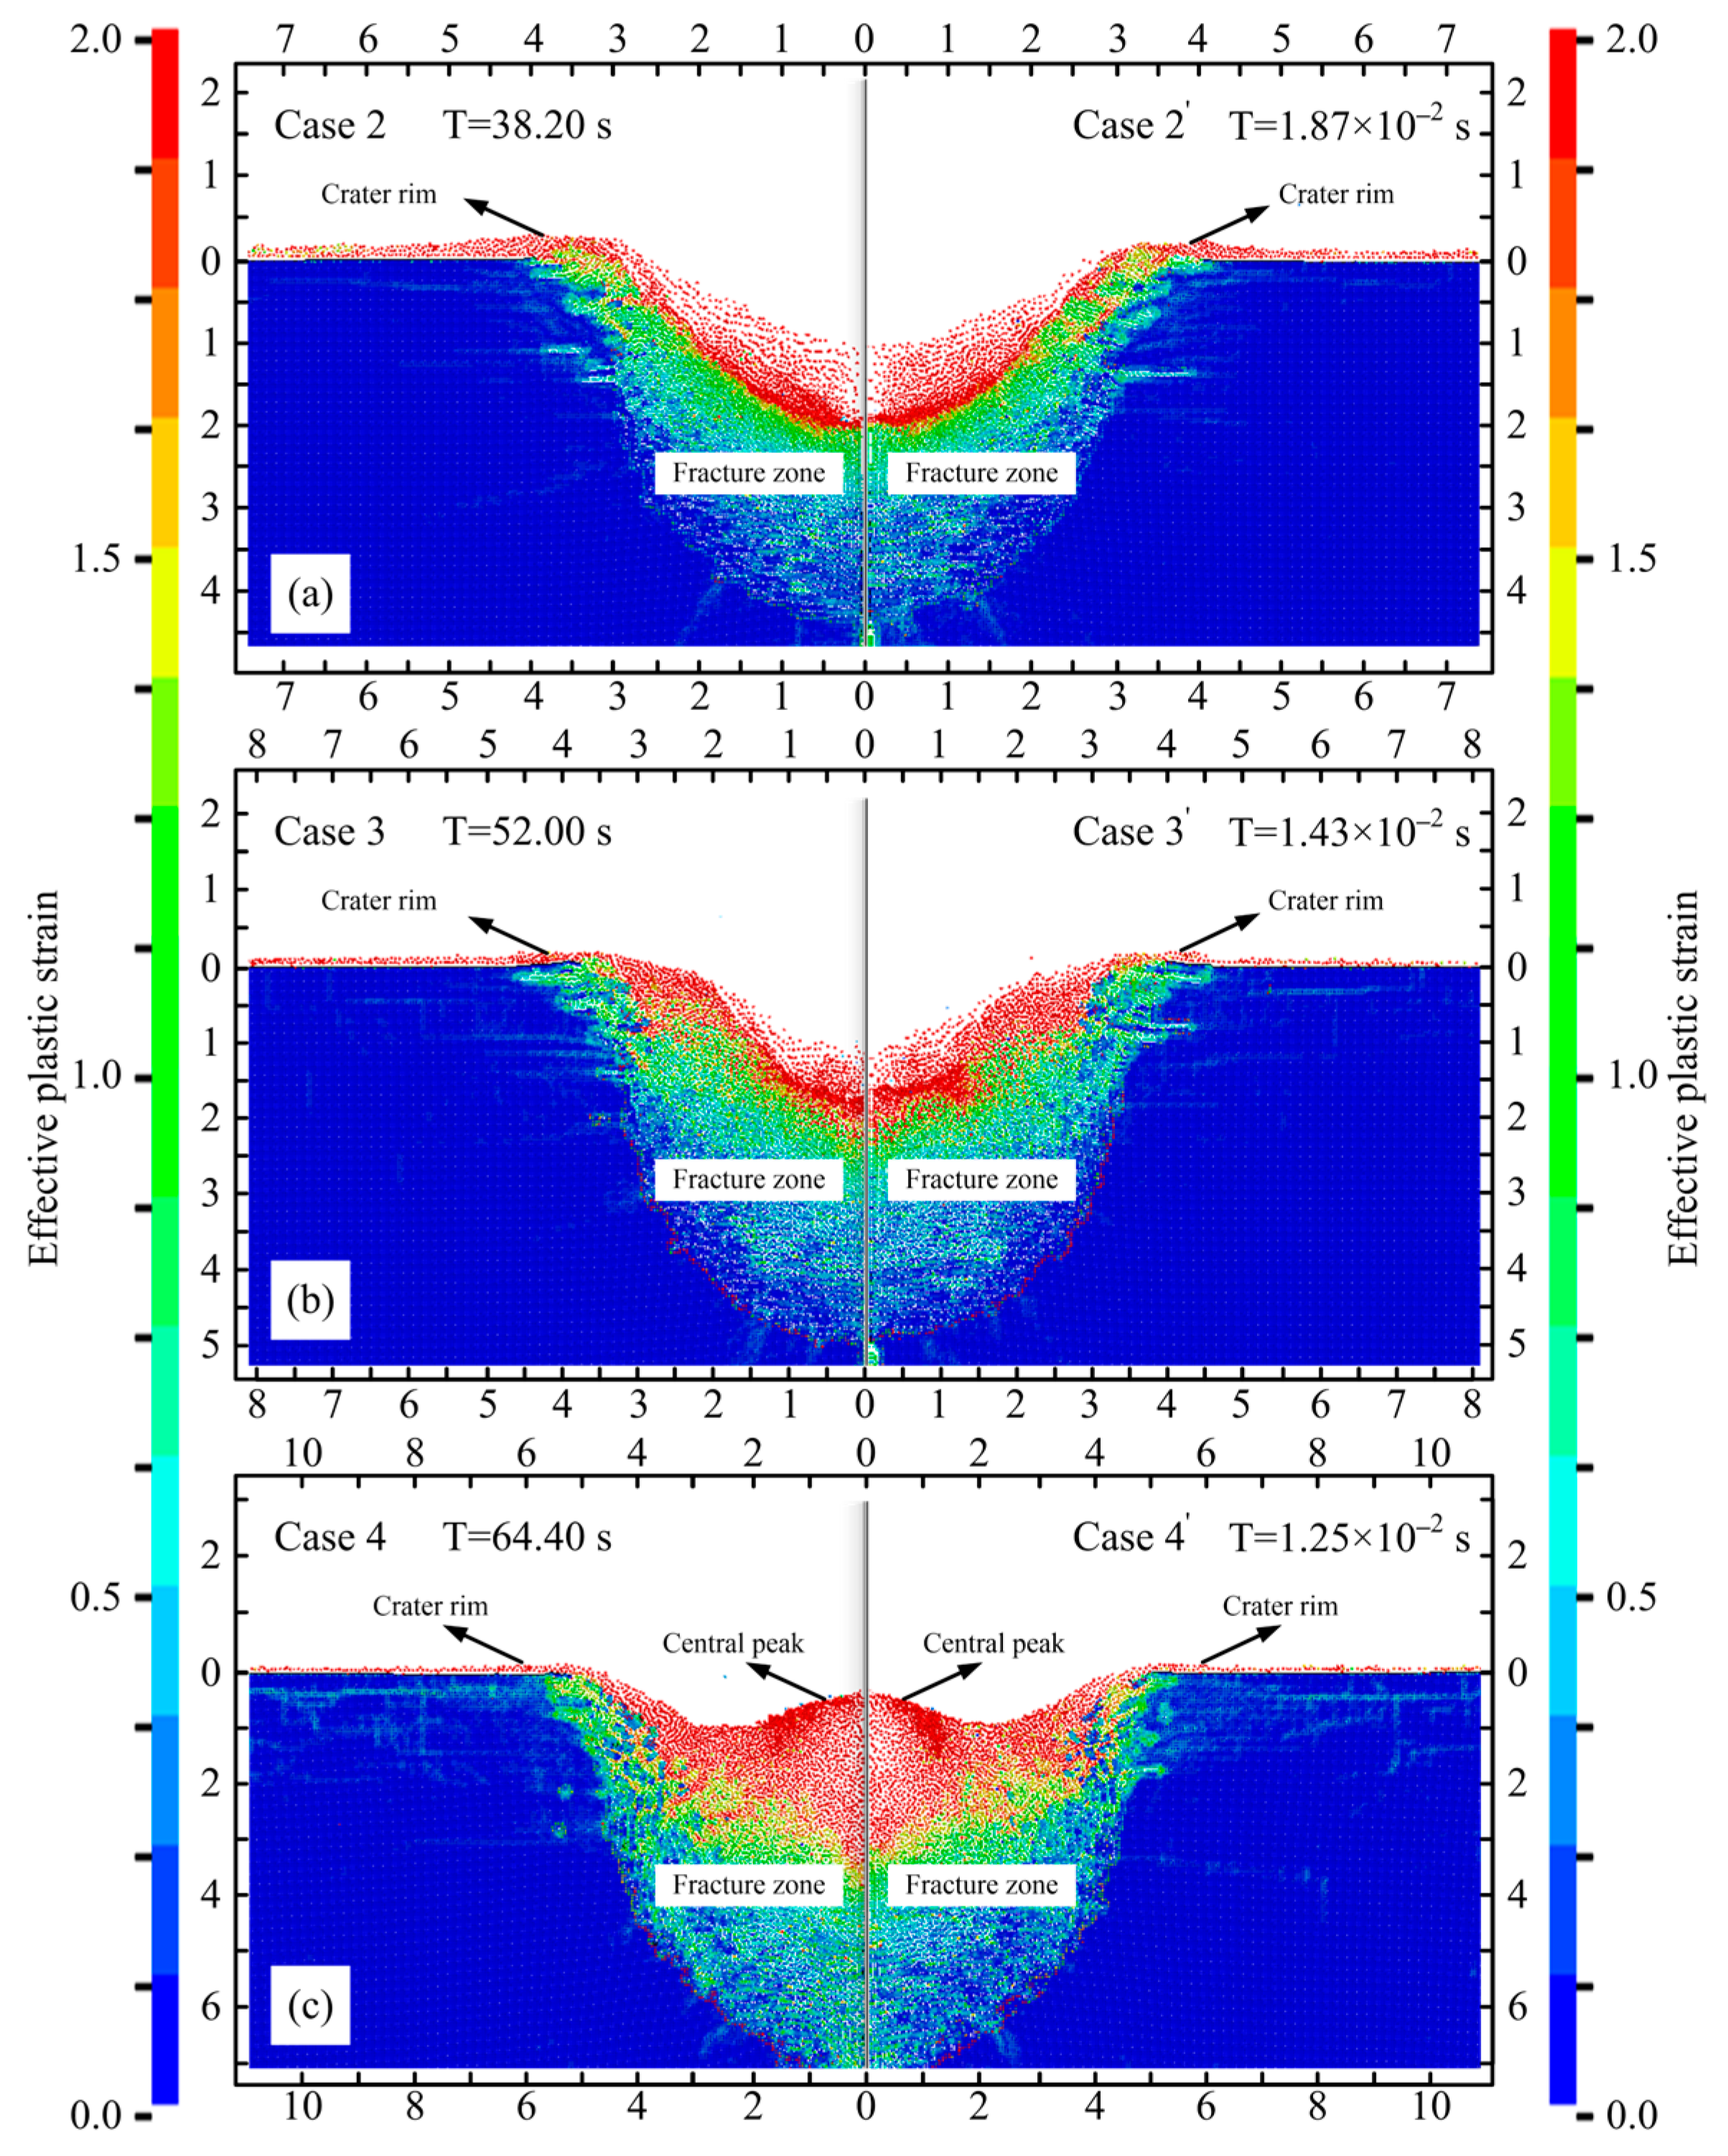
Similarly, Figure 7 presents comparative analyses of prototype tests (cases 2, 3, and 4) with their corresponding scale model tests (cases 2′, 3′, and 4′). In Figure 7a, the crater apparent depth (dc2) in case 2 is 267.63 m, while in case 2′, the crater apparent depth (dc2′) is 0.0178 m. Notably, the crater formation time for cases 2 and 2′ is 38.20 s and 1.87 × 10⁻² s, respectively. The damage zone of cases 2 and 2′ is basically the same under dimensionless length, and the depth–diameter ratio dc/Dc of craters in cases 2 and 2′ is 0.132 and 0.130, respectively.
In Figure 7b, the crater apparent depth dc3 in case 3 is 457.83 m, and crater apparent depth dc3′ in case 3′ is 0.0129 m. The crater formation time of case 3 and 3′ is 52.0 s and 1.43 × 10⁻² s, respectively. Once again, under dimensionless length considerations, the damage zones and depth–diameter ratios (dc/Dc) remain consistent between cases 3 and 3′, and the depth–diameter ratio dc/Dc of craters in cases 3 and 3′ is 0.119 and 0.117, respectively.
In Figure 7c, the crater apparent depth dc4 in case 4 is 476.71 m, and crater apparent depth dc4′ in case 4′ is 0.0087 m. The crater formation time of case 4 and 4′ is 64.40 s and 1.25 × 10⁻² s, respectively. The damage zone of case 4 and 4′ is basically the same under dimensionless length, and the depth–diameter ratio dc/Dc of craters in cases 4 and 4′ is 0.119 and 0.117, respectively.
The depth–diameter ratio (dc/Dc) of craters, as depicted in Figure 7a–c, exhibits a successive decrease, signifying a gradual alteration in crater morphology. Notably, Figure 7a,c epitomize the distinctive attributes of simple and complex craters, respectively, prompting further scrutiny of the threshold for morphological transition in impact craters.
Typical manifestations of complex craters, featuring central uplift, are discernible in cases 5 and 5′. Thus, a comparative evaluation between the outcomes of the prototype test (case 5) and the scale model test (case 5′) is imperative to ascertain the design credibility of the complex crater scaling model, and the results of case 5 are a direct replication of data presented in reference [20], as illustrated in Figure 8. Figure 8a–d encapsulates pivotal moments during the formation of complex craters in cases 5 and 5′. Notably, the apparent depth of the impact crater (dc5) in case 5 measures 490.51 m, while in case 5′, the crater apparent depth (dc5′) is 0.0069 m.
The morphological progression of craters depicted in Figure 6a,b and Figure 8a,b exhibits similarity, whereas Figure 6c and Figure 8c unveil disparities attributed to variations in scale and gravity. Figure 8c distinctly showcases typical uplift, culminating in the final morphology of complex craters depicted in Figure 8d.
A meticulous comparison of the left and right sides of Figure 8 underscores a high degree of consistency in the morphological evolution and damage distribution of craters between the prototype test (case 5) and the scale model test (case 5′). The depth–diameter ratios (dc/Dc) of the final craters in cases 5 and 5′ stand at 0.070 and 0.068, respectively, as delineated in Figure 8d. The collective analysis presented in Figure 6, Figure 7 and Figure 8 implies that the cratering time is positively correlated with the projectile diameter and negatively correlated with gravity.

5. Discussion

5.1. The Transition Threshold of Crater Morphology

The transition from simple to complex craters is a pivotal phenomenon in planetary cratering impacts [25], marked notably by the emergence of central uplifts, which in turn influence the depth–diameter ratio of the craters. This ratio serves as a reliable indicator of this morphological transition. As illustrated in both Table 1 and Table 2, key parameters such as π2, S′, and dc/Dc exhibit consistent values across prototype and scale model tests.
The complexity of crater morphology is profoundly influenced by factors such as gravity and material strength, dictating the transition threshold. Consequently, the critical transition value, Scrit, varies with gravity. Furthermore, due to the effects of material strength, disparate regions within the same celestial body exhibit different transition thresholds. Notably, material properties akin to those of non-porous sandstone (quartzite) have often been employed to characterize target material responses of solid bodies [21]. Detailed analysis, as presented in Table 1 and Table 2, facilitates the examination of Scrit for craters, visually depicted in Figure 9. Noteworthy trends emerge, with the average depth–diameter ratio (dc/Dc) and S′ decreasing as π2 increases. Groups G2 and G4 represent distinct morphologies of simple and complex craters, respectively, which indicates that the transition threshold lies between these groups.
In Figure 9, the depth–diameter ratio (dc/Dc) variations with π2 across groups G1, G2, and G3 are determined through linear fitting methods, as depicted by black dots. Similarly, the variations within groups G3, G4, and G5 are delineated by a linear fitting line (black solid line). The point of intersection, Z, serves as a valuable tool for analyzing the morphological transition threshold. Moreover, the variation of S′ with π2 within each group is depicted through nonlinear fitting (solid red line), further elucidating the transition trend of crater morphology.
Based on the data from prototype tests, the critical transition threshold (Scrit = 5.71) for quartzite materials on Earth (g = 9.81 m/s2) can be identified at point Z, as depicted in Figure 9. This critical threshold Scrit serves as a qualitative criterion for analyzing the morphological transition of craters. When S′ > Scrit, the crater morphology presents simple craters with dc/Dc > 0.122. When S′ < Scrit, the crater morphology tends to be complex craters with dc/Dc < 0.122.

5.2. The Diameter of Crater Morphology Transition in Prototype Tests and the Gravity Threshold of Crater Morphology Transition in Scale Model Tests

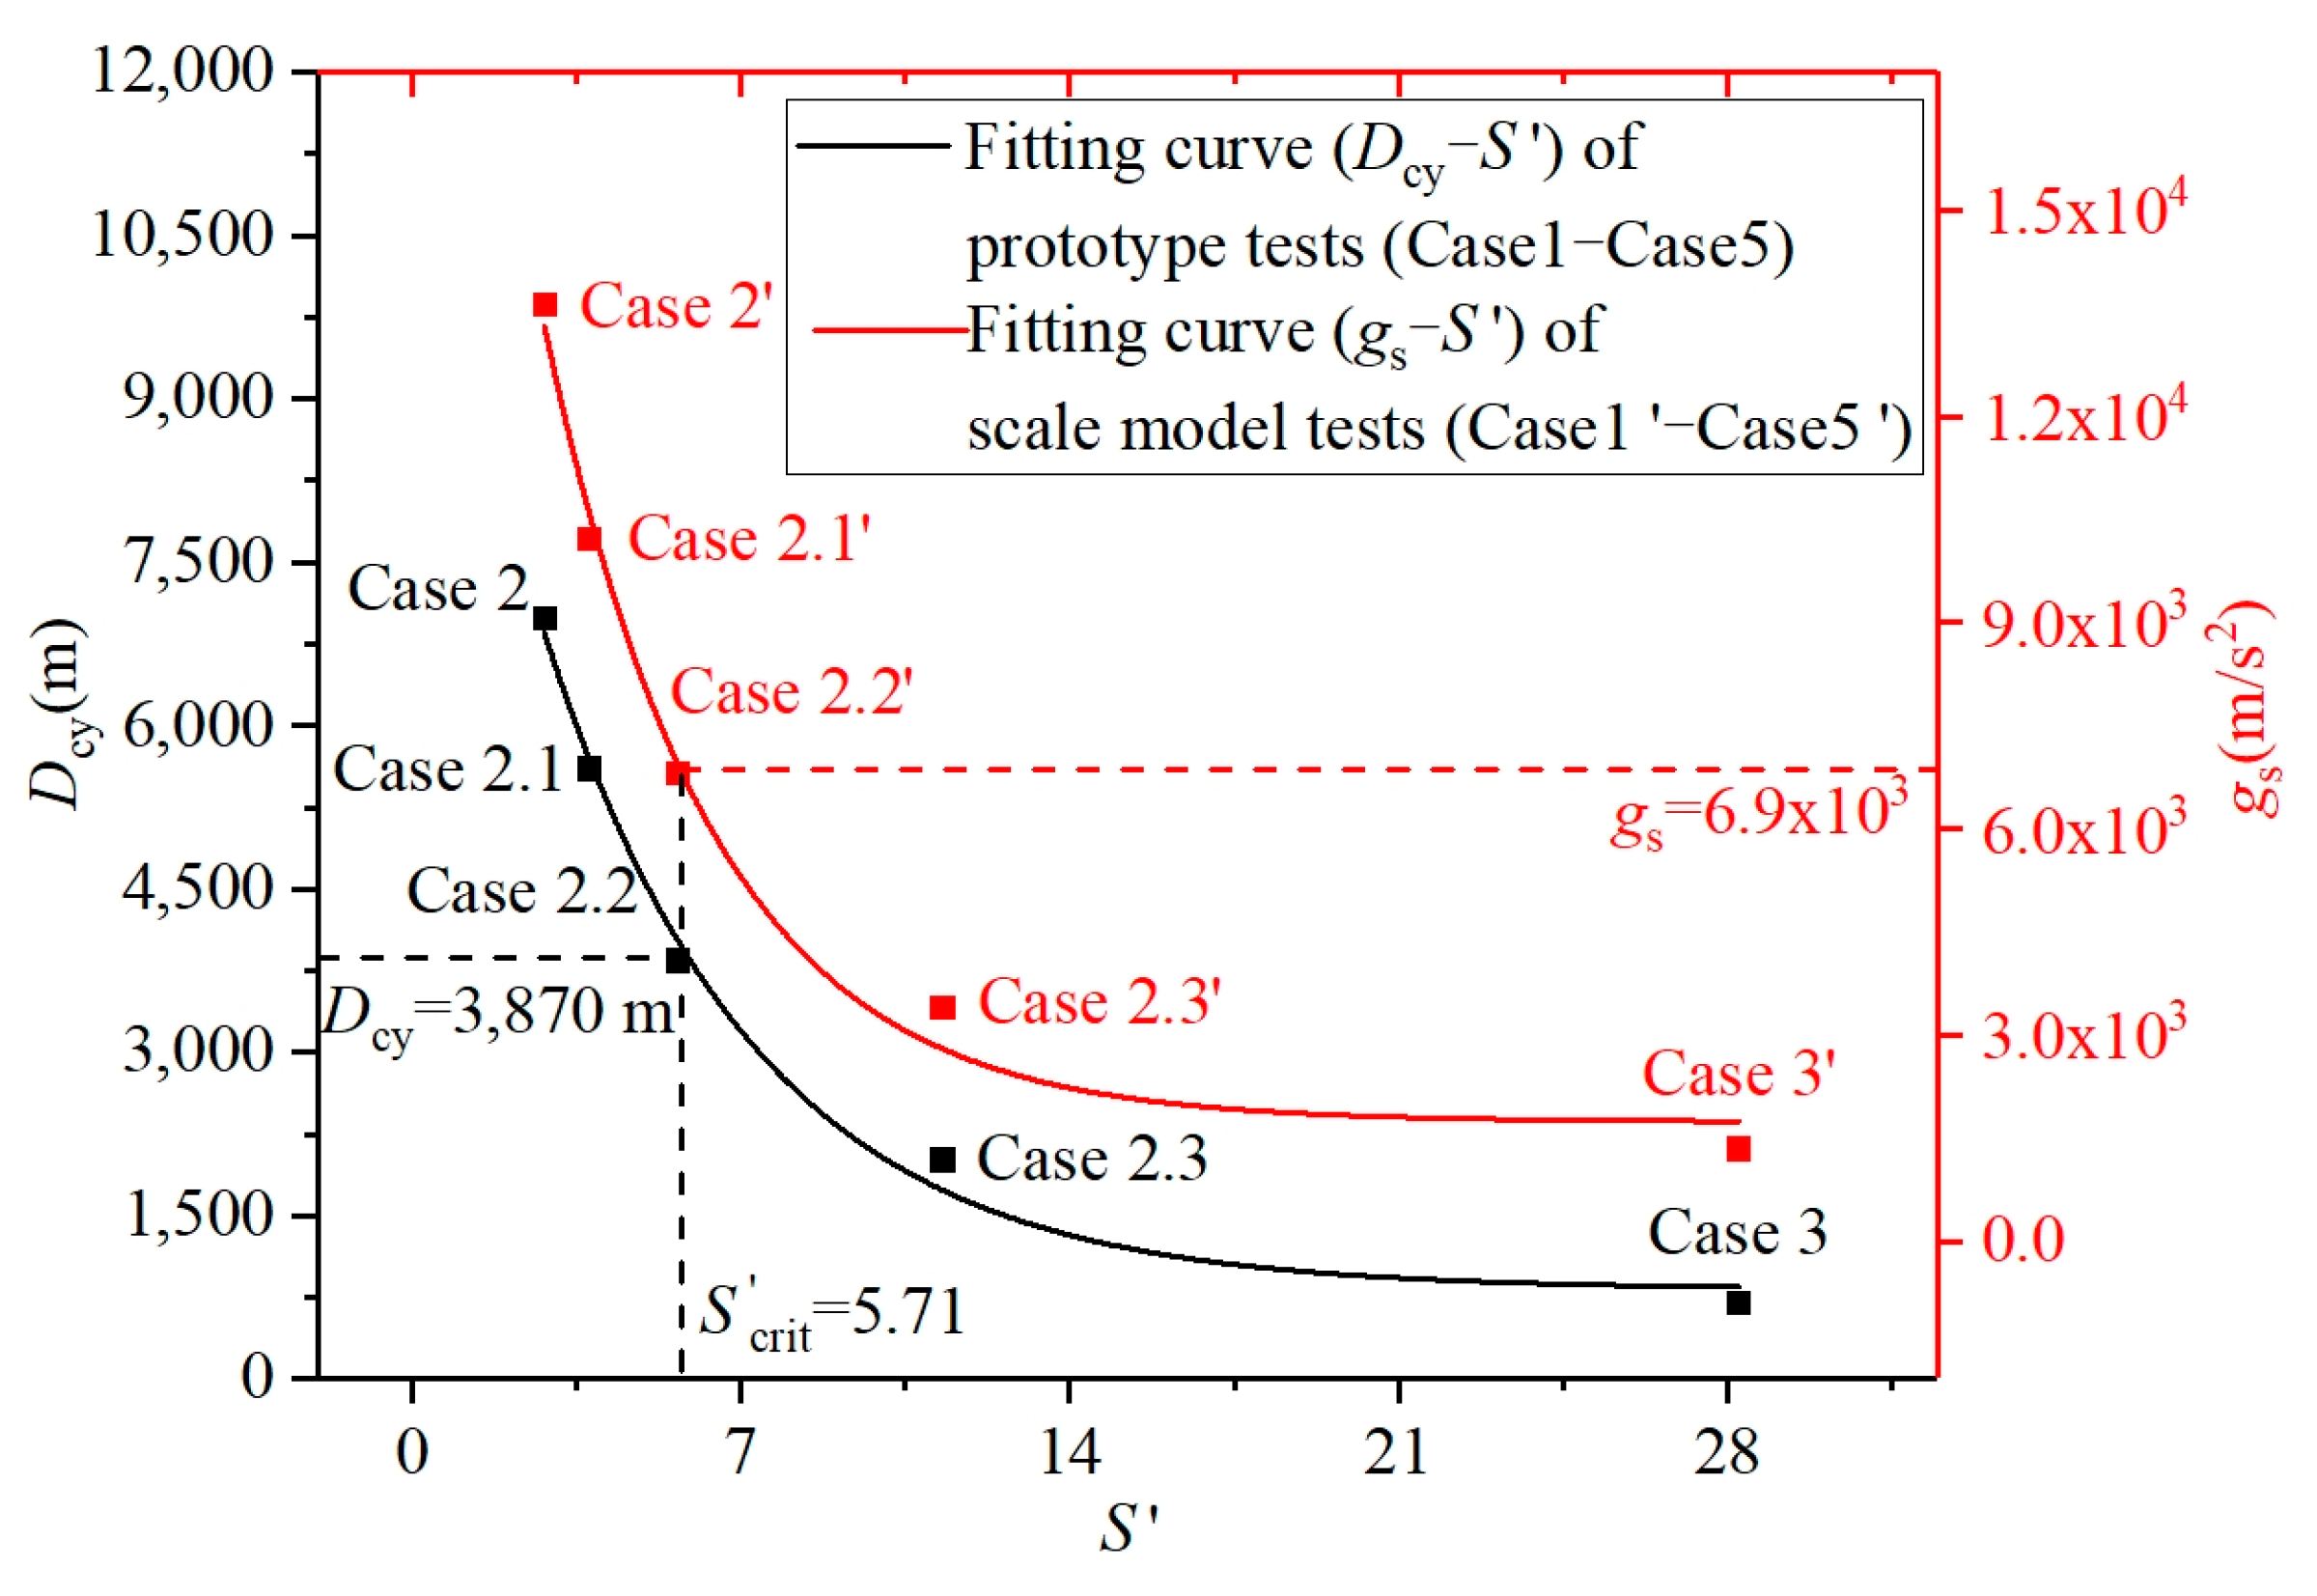
According to Table 1 and Table 2, the relationship between S′, the crater diameter of prototype tests (Dcy) and the gravity of scale model tests (gs) can be obtained by nonlinear fitting, as shown in Figure 10. According to Scrit = 5.71, the transition diameter (Dcy = 3870 m) of crater morphology in prototype tests and the transition gravity (gs = 6900 m/s2) of crater morphology in scale model tests can be obtained, as shown by the dashed line in Figure 10.
The transition morphology from simple to complex craters does not present the typical characteristics of simple or complex craters [9]. Table 2 and Figure 10 show that the predicted value of the crater transition diameter (3870 m) in prototype tests is close to that of case 3 (3847.12 m), and the predicted value of the crater transition gravity (6900 m/s2) in scale model tests is close to that of case 3′ (6812.50 m/s2). The S′ = 5.64 of group G3 is close to Scrit = 5.71, which indicates that case 3 and 3′ have a tendency for morphology transitions from simple to complex craters.
The derived transitional diameter (3870 m) shows remarkable consistency with the 2–4 km range [24], thereby validating both the rationality of the Scrit = 5.71 and the crater transition diameter (3870 m). Consequently, the method proposed herein holds significant merit for analyzing the transition diameter of planetary cratering impacts.

5.3. The Effect of Projectile Diameter and Gravity on the Depth–Diameter Ratio and Formation Time of Impact Craters

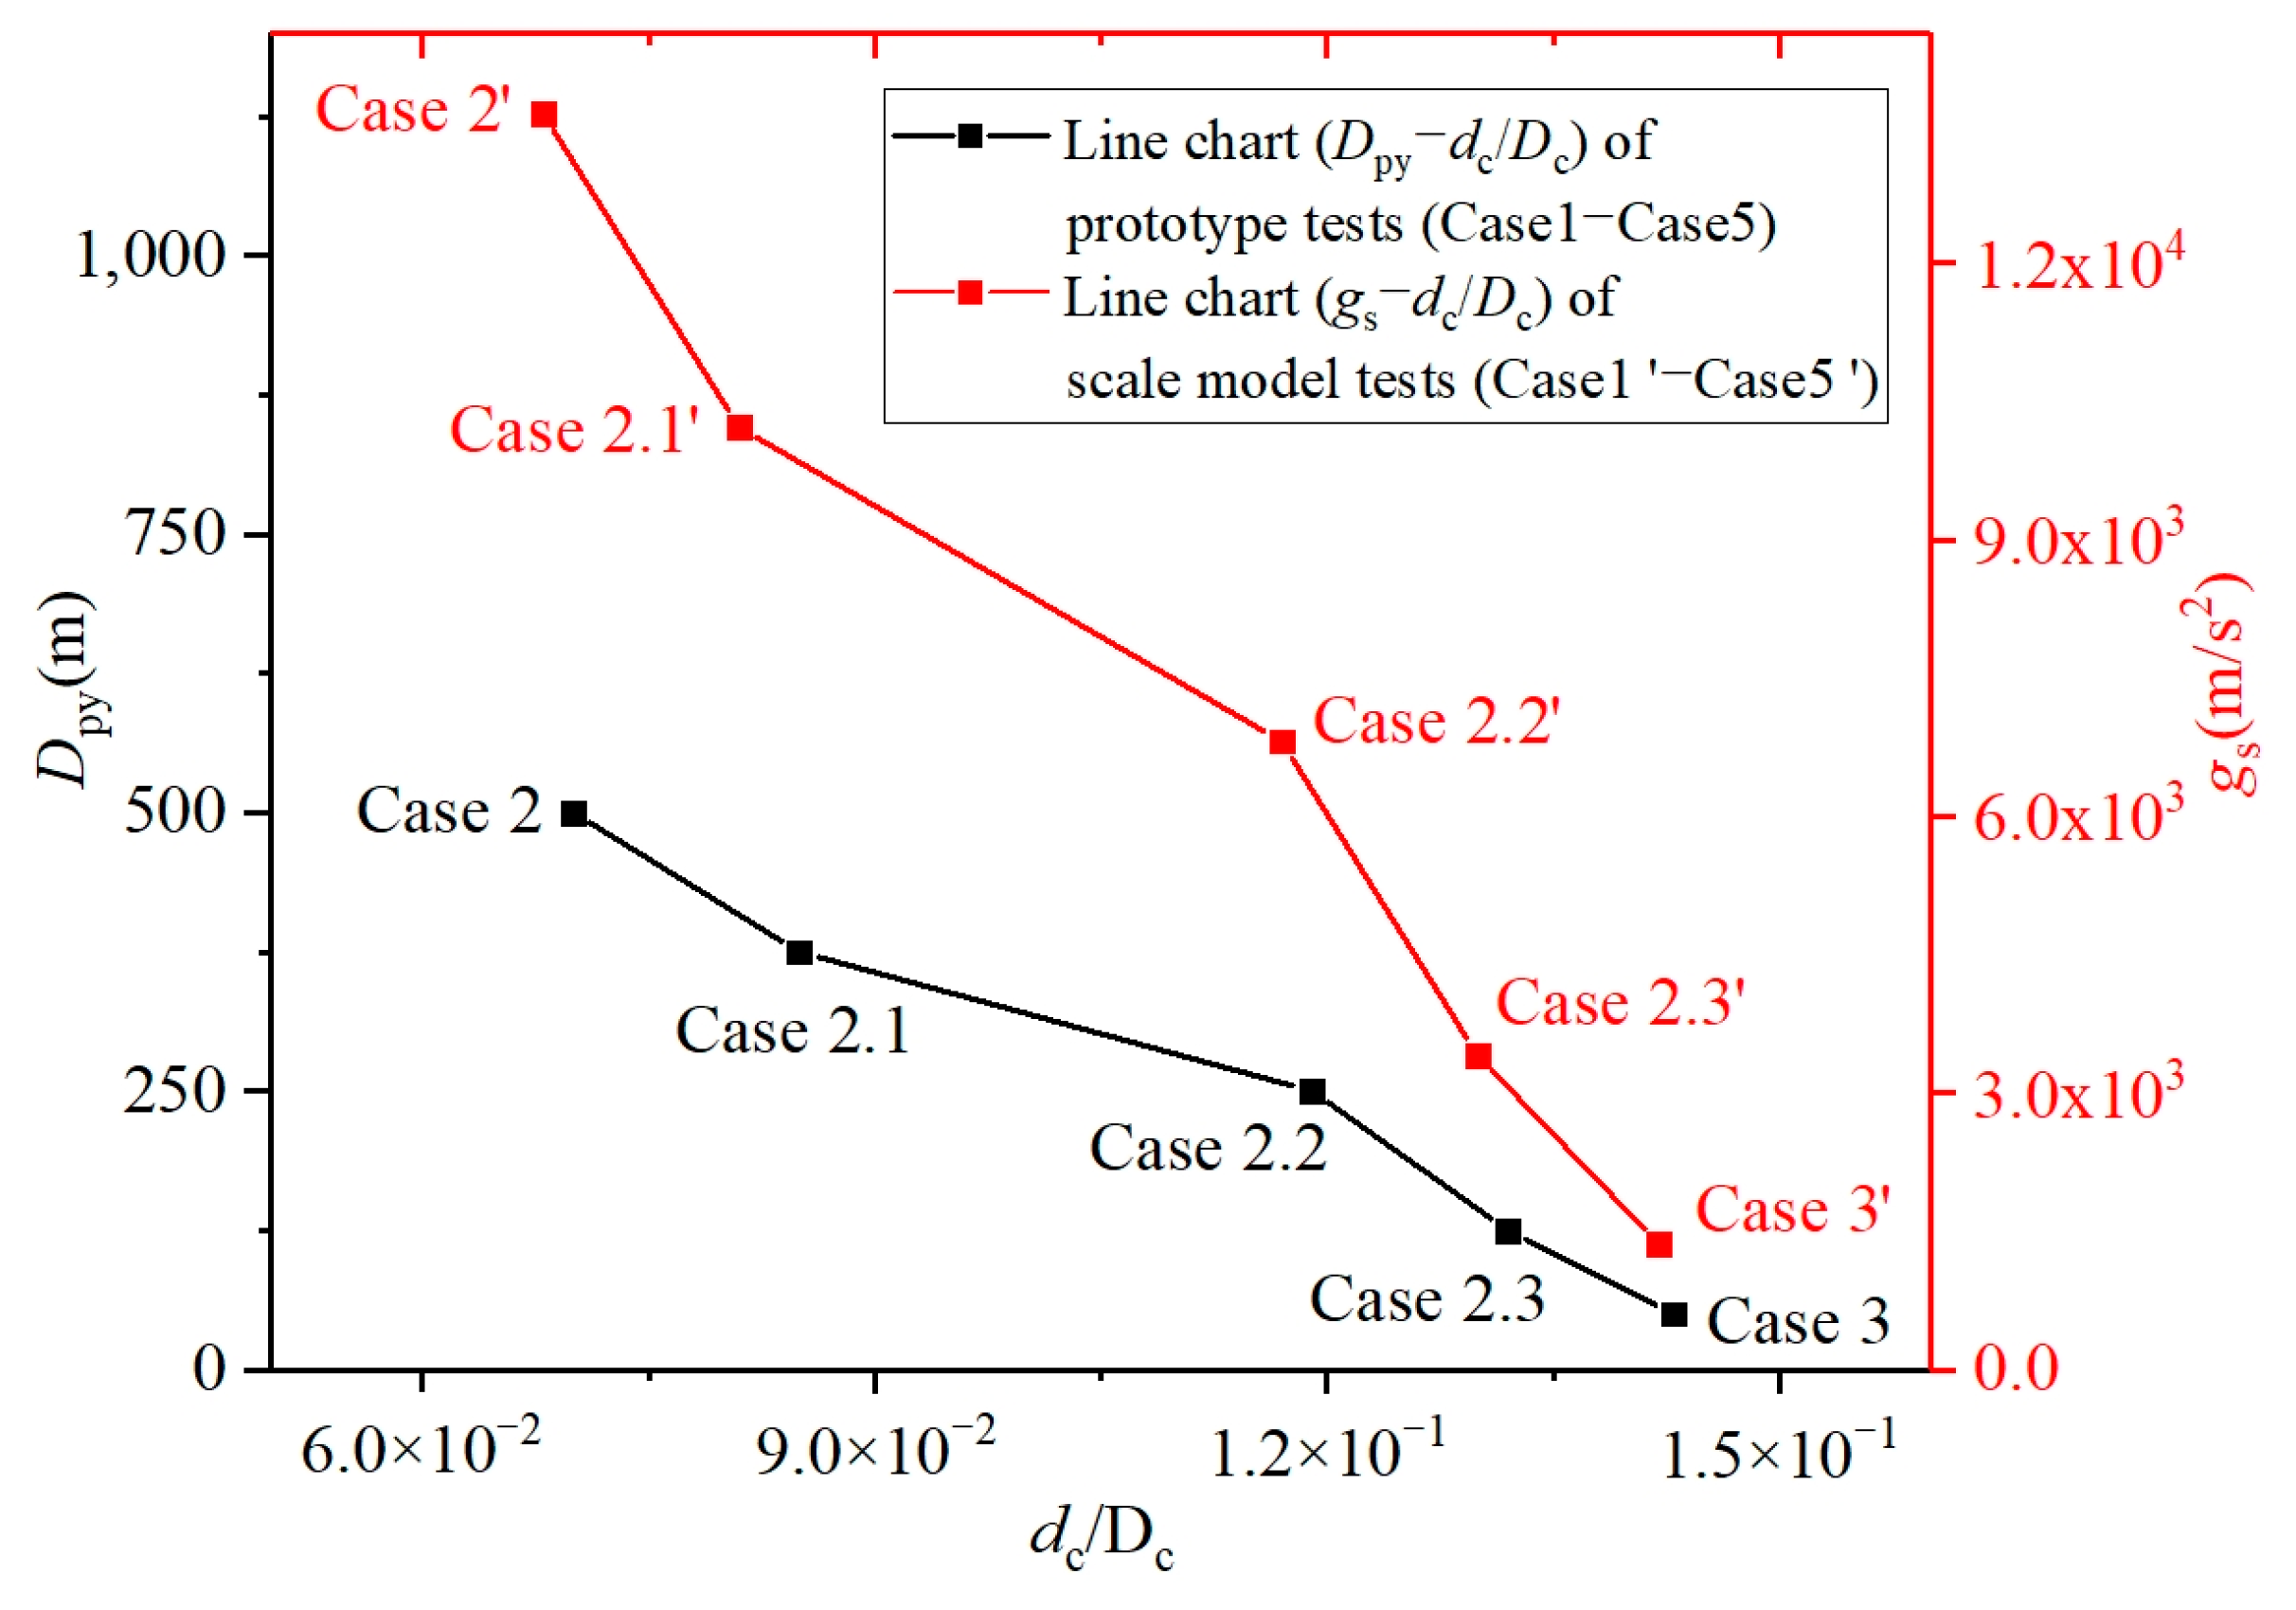
The relationship between crater depth–diameter ratio dc/Dc, the projectile diameter (Dpy) of prototype tests, and the gravity (gs) of scale model tests is shown in Figure 11, and our findings demonstrate a negative correlation between dc/Dc and both Dpy and gs.
Gravity plays a significant role in ejecta motion, wherein higher gravity inhibits the outward motion of ejecta, leading to a substantial reduction in their mass and volume outside the crater. Moreover, increased gravity restricts lateral expansion of the cavity, consequently decreasing the impact crater’s diameter. The elevated ground stress and confining pressure associated with higher gravity amplify stratum rebound and central uplift, resulting in a continuous reduction in impact crater depth. Consequently, both crater diameter and depth exhibit a decrease with increasing gravity, further establishing a negative correlation between crater volume (Vc) and gravity (g). For a given projectile mass (mp), the cratering efficiency (πV = ρtVc/mp) also demonstrates a negative correlation with gravity.
Projectile diameter and gravity exert significant influence on the duration of the cratering process. As indicated in Table 1 and Table 2, cratering time shows a positive correlation with projectile diameter, consistent with established theories of planetary cratering impacts [26]. Moreover, higher gravity impedes the outward motion of ejecta and cavity expansion while promoting the fall back and inward motion of ejecta, thereby hastening the stabilization of crater morphology. Table 1 and Table 2 further suggest a negative correlation between cratering time and gravity, and the aforementioned analysis aligns with numerical results. Those agreements between theoretical analysis and independent numerical modeling studies demonstrate the robustness of our methodology in characterizing crater morphological transitions.

5.4. The Cratering Time Relationship Between Prototype Tests and Scale Model Tests

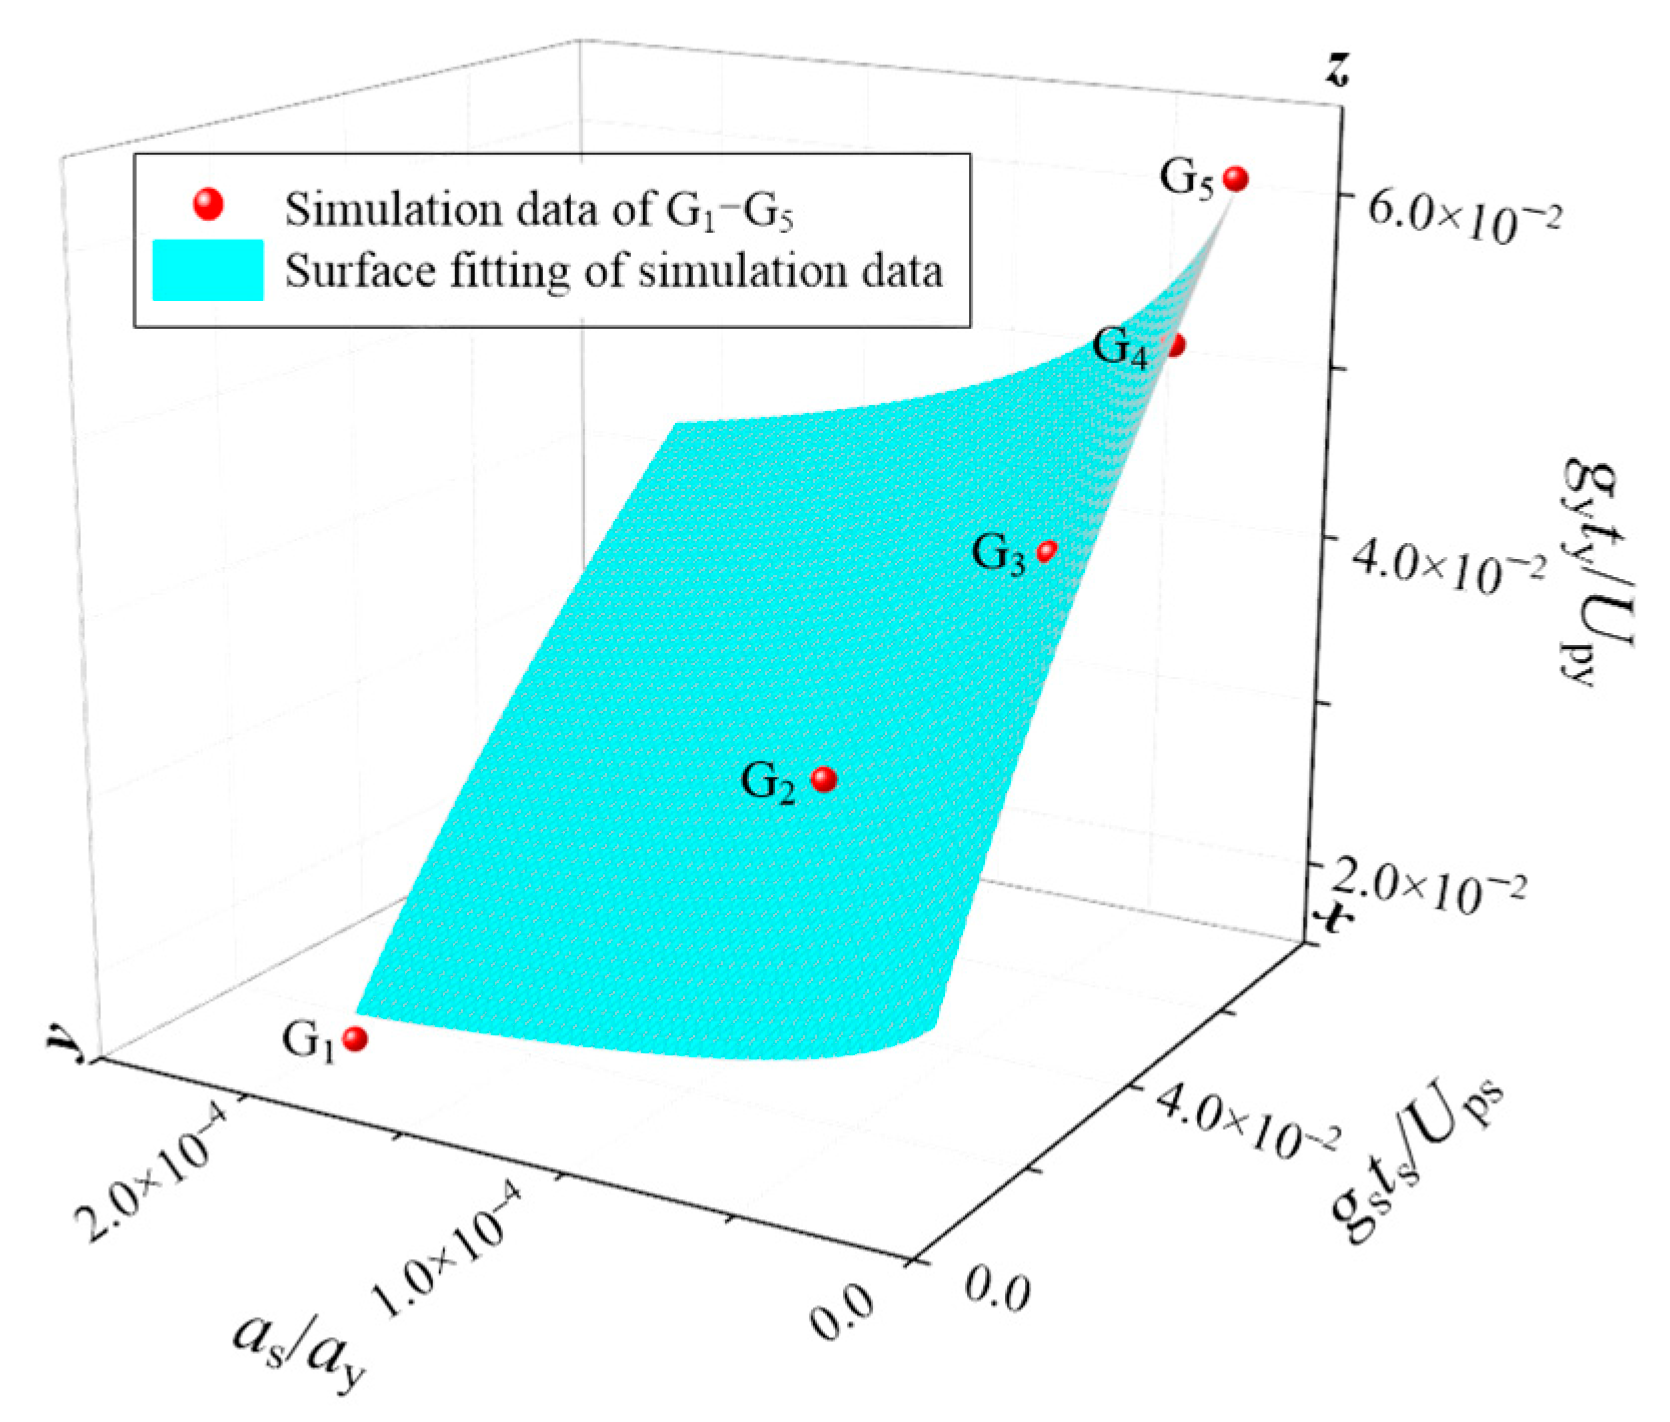
The Froude number (F) remains consistent between the scale model tests and corresponding prototype tests. To elucidate the concept of cratering time (t), we partition the Froude number (F = U p 2 /ga) into two distinct dimensionless parameters, denoted as (gt/Up) and (as/ay). Investigating the relationship between cratering time in prototype tests (ty) and scale model tests (ts), we employ dimensional analysis to derive the dimensionless parameter (gt/Up) for cratering time (t). Our analysis suggests that the cratering time (t) in prototype tests (ty) and scale model tests (ts) should adhere to the following equation:
g y t y U py = f ( g s t s U ps , ρ t y U p y 2 Y t y , ρ ts U ps 2 Y ts , a s a y )
Ca is constant in all simulation, and Equation (22) can be obtained by describing Equation (21) with undetermined coefficient (α, β, and γ):
g y t y U py = α 3 ( g s t s U ps ) β 3 ( a s a y ) γ 3
By substituting the data of Table 2 into Equation (22) for nonlinear surface fitting, Equation (23) can be obtained, written as follows:
g y t y U py = 6.57 × 10 2 ( g s t s U ps ) 0.64 ( a s a y ) 0.15
The adjusted determination coefficient (adjusted R-square) for Equation (23) is 0.9937, indicating a robust fit. The cratering time relationship between prototype tests and scale model tests is established through fitting results, as illustrated in Figure 12.
Furthermore, transient crater size serves as a metric for analyzing the impact energy and momentum of impact events. Holsapple introduced the coupling parameter method to unify the effects of impact energy and momentum on crater formation, positing that impact events with identical coupling parameters should yield comparable transient craters [15]. Silber et al. corroborated this notion, suggesting that impact events sharing the same coupling parameter exhibit similar transient crater characteristics [9]. We established the scaling model without introducing coupling parameter and instead focused on the depth–diameter ratio (dc/Dc) of the final crater. Consequently, further investigation is warranted to explore the scaling analysis of transient craters.

6. Conclusions

The morphological evolution of a crater is primarily influenced by material strength and gravity. Leveraging geotechnical centrifuge technology in engineering applications, we conducted scale model tests based on rigorous scaling analyses of prototype tests. Our study validates the reliability of these scale model tests in accurately reproducing the outcomes of the prototype tests, thereby enhancing confidence in their design. This study presents a systematic analytical approach for determining morphological transition thresholds of impact craters on terrestrial planetary surfaces. It should be noted that the analytical approach proposed in this study is specifically applicable to impact crater morphology studies on solid, rocky planetary surfaces.
Real planetary surfaces exhibit pronounced heterogeneity, where variations in material strength substantially influence crater morphology. For instance, differences in rock strength lead to distinct morphological transition thresholds—approximately 2 km for sedimentary rocks and 4 km for crystalline rocks on Earth [24]. This phenomenon will constitute a primary focus of subsequent research.
Key findings include the following:
(1)
The scaling analysis effectively replicates prototype tests, with the transition threshold (Scrit) and transition diameter (Dcy) of craters on Earth determined to be 5.71 and 3870 m, respectively. These values align closely with geological analyses, further validating our approach.
(2)
Controlling for projectile diameter, we observed a negative correlation between the depth–diameter ratio (dc/Dc) of craters and projectile diameter, alongside a positive correlation with cratering time.
(3)
Similarly, controlling for gravity, we noted a negative correlation between the depth–diameter ratio (dc/Dc) of craters and gravity, coupled with a negative correlation with cratering time.
Significant innovations arising from this research include the following:
(i) A scaling law analysis model has been established to bridge the large-scale hypervelocity impacts of planetary cratering (prototype tests) and low-speed scale model tests. This model provides significant guidance for the design of scale model tests. (ii) A novel analytical method for determining the transition diameter and gravity threshold in cratering morphological transitions has been proposed, offering valuable insights for studying morphological transitions in planetary cratering on other terrestrial planets. (iii) A scaling law analysis model for cratering time across various impact scales has been developed, facilitating the prediction of cratering times for large-scale impacts by analyzing scale model tests.

Author Contributions

Conceptualization, H.L., Q.H. and X.C.; Methodology, H.L.; Software, Q.H.; Validation, Q.H.; Formal analysis, H.L.; Investigation, H.L., Q.H. and X.C.; Writing—original draft, H.L.; Writing—review & editing, X.C.; Visualization, H.L. and Q.H.; Supervision, X.C.; Project administration, X.C.; Funding acquisition, X.C. All authors have read and agreed to the published version of the manuscript.

Funding

This work was supported by the National Natural Science Foundation of China (12372346).

Data Availability Statement

The original contributions presented in this study are included in the article. Further inquiries can be directed to the corresponding author.

Conflicts of Interest

The authors declare no conflict of interest.

References

  1. Kenkmann, T.; Wulf, G. Impact cratering. In Planetary Geology; Springer Praxis Books: Berlin/Heidelberg, Germany, 2018; pp. 123–145. [Google Scholar]
  2. Turtle, E.P.; Pierazzo, E.; Collins, G.S.; Osinski, G.R.; Melosh, H.J.; Morgan, J.V.; Reimold, W.U.; Kenkmann, T.; Hörz, F.; Deutsch, A. Impact structures: What does crater diameter mean? In Large Meteorite Impacts III; Geological Society of America: Annapolis, MD, USA, 2005; Volume 384. [Google Scholar]
  3. Güldemeister, N.; Wünnemann, K.; Poelchau, M.H.; Osinski, G.R.; Kring, D.A. Scaling impact crater dimensions in cohesive rock by numerical modeling and laboratory experiments. In Large Meteorite Impacts and Planetary Evolution V; Geological Society of America: Annapolis, Maryland, USA, 2015; Volume 518. [Google Scholar]
  4. Suárez-Cortés, Á.D.; Flandes, A.; Durand-Manterola, H.J. Planetary impact craters study through low-speed laboratory experiments. Int. J. Impact Eng. 2021, 156, 103954. [Google Scholar] [CrossRef]
  5. Ormö, J.; Raducan, S.D.; Housen, K.R.; Wünnemann, K.; Collins, G.S.; Rossi, A.P.; Melero-Asensio, I. Effect of target layering in gravity-dominated cratering in nature, experiments, and numerical simulations. J. Geophys. Res. Planets 2024, 129, e2023JE008110. [Google Scholar] [CrossRef]
  6. Housen, K.R.; Holsapple, K.A. Scale effects in strength-dominated collisions of rocky asteroids. Icarus 1999, 142, 21–33. [Google Scholar] [CrossRef]
  7. Prieur, N.C.; Rolf, T.; Luther, R.; Wünnemann, K.; Xiao, Z.; Werner, S.C. The effect of target properties on transient crater scaling for simple craters. J. Geophys. Res. Planets 2017, 122, 1704–1726. [Google Scholar] [CrossRef]
  8. Housen, K.R.; Sweet, W.J.; Holsapple, K.A. Impacts into porous asteroids. Icarus 2018, 300, 72–96. [Google Scholar] [CrossRef]
  9. Silber, E.A.; Osinski, G.R.; Johnson, B.C.; Grieve, R.A.F. Effect of impact velocity and acoustic fluidization on the simple-to-complex transition of lunar craters. J. Geophys. Res. Planets 2017, 122, 800–821. [Google Scholar] [CrossRef]
  10. Schmidt, R.M.; Holsapple, K.A. Estimates of crater size for large-body impact: Gravity-scaling results. Spec. Pap. Geol. Soc. Am. 1982, 190, 93–102. [Google Scholar] [CrossRef]
  11. Croft, S.K. The scaling of complex craters. J. Geophys. Res. Solid Earth 1985, 90, C828–C842. [Google Scholar] [CrossRef]
  12. Tsujido, S.; Arakawa, M.; Suzuki, A.I.; Yasui, M. Ejecta velocity distribution of impact craters formed on quartz sand: Effect of projectile density on crater scaling law. Icarus 2015, 262, 79–92. [Google Scholar] [CrossRef]
  13. Housen, K.R.; Holsapple, K.A. Ejecta from impact craters. Icarus 2011, 211, 856–875. [Google Scholar] [CrossRef]
  14. Holsapple, K.A.; Schmidt, R.M. Point source solutions and coupling parameters in cratering mechanics. J. Geophys. Res. Solid Earth 2012, 92, 6350–6376. [Google Scholar] [CrossRef]
  15. Holsapple, K.A. The scaling of impact phenomena. Int. J. Impact Eng. 1987, 5, 343–355. [Google Scholar] [CrossRef]
  16. Holsapple, K.A. The Scaling of Impact Processes in Planetary Sciences. Annu. Rev. Earth Planet. Sci. 1993, 21, 333–373. [Google Scholar] [CrossRef]
  17. Takizawa, S.; Katsuragi, H. Scaling laws for the oblique impact cratering on an inclined granular surface. Icarus 2020, 335, 113409. [Google Scholar] [CrossRef]
  18. Liu, W.; Zang, Q.; Ma, X. A review of the models of near-Earth object impact cratering on Earth. Explos. Shock Waves 2021, 41, 16. [Google Scholar] [CrossRef]
  19. Lv, H.; He, Q.; Chen, X. Experimental and Numerical Advances in Planetary Cratering Impacts. Mech. Solids 2024, 59, 2322–2365. [Google Scholar] [CrossRef]
  20. Lv, H.; He, Q.; Chen, X.; Han, P. Numerical simulation of impact crater formation and distribution of high-pressure polymorphs. Acta Astronaut. 2023, 203, 169–186. [Google Scholar] [CrossRef]
  21. Collins, G.S.; Melosh, H.J.; Osinski, G.R. The impact-cratering process. Elements 2012, 8, 25–30. [Google Scholar] [CrossRef]
  22. He, Q.-G.; Chen, X.; Chen, J.-F. Finite element-smoothed particle hydrodynamics adaptive method in simulating debris cloud. Acta Astronaut. 2020, 175, 99–117. [Google Scholar] [CrossRef]
  23. Wünnemann, K.; Collins, G.; Osinski, G. Numerical modelling of impact melt production in porous rocks. Earth Planet. Sci. Lett. 2008, 269, 530–539. [Google Scholar] [CrossRef]
  24. Wünnemann, K.; Ivanov, B.A. Numerical modelling of the impact crater depth–diameter dependence in an acoustically fluidized target. Planet. Space Sci. 2003, 51, 831–845. [Google Scholar] [CrossRef]
  25. Krüger, T.; Hergarten, S.; Kenkmann, T. Deriving morphometric parameters and the simple-to-complex transition diameter from a high-resolution, global database of fresh lunar impact craters (D≥~ 3 km). J. Geophys. Res. Planets 2018, 123, 2667–2690. [Google Scholar] [CrossRef]
  26. Osinski, G.R.; Pierazzo, E. Impact Cratering: Processes and Products. In Impact Cratering; John Wiley & Sons: Hoboken, NJ, USA, 2012; pp. 1–20. [Google Scholar]
Figure 1. The morphology and cross-section of simple crater (a) and complex crater (b) [1,2].
Aerospace 12 00333 g001
Figure 2. Boeing 600 G geotechnical centrifuge, Boeing Company in Arlington, USA [8]. (a) the configuration for normal half-space experiments. (b) the quarter-space fixture used to visualize crater formation in cross section.
Aerospace 12 00333 g002
Figure 3. The analysis principle of FE-SPH adaptive method [20]. (a) instant contact between projectile and target. (b) slight deformation of the projectile and target. (c) a limited number of elements undergo failure and fragmentation, subsequently transitioning into SPH particles. (d) more SPH particles are activated.
Aerospace 12 00333 g003
Figure 4. Geometry model of scale model test.
Aerospace 12 00333 g004
Figure 5. Effect of different boundary conditions on target damage in the case 1′ (left: fixed boundary; right: non-reflecting boundary).
Aerospace 12 00333 g005
Figure 6. Comparison of numerical results between case 1 and 1′ (Left: case 1, g = 9.81 m/s2, quartzite projectile of 50 m diameter impacts quartzite target at 12 km/s [20]; right: case 1′, g = 1362.5 m/s2, projectile of 0.01 m diameter impacts thick target at 2 km/s). (a) a comparative analysis of effective plastic strain between case 1 at T = 0.25 s and case 1′ at T = 3.00 × 10⁻⁴. (b) a comparative analysis of effective plastic strain between case 1 at T = 2.50 s and case 1′ at T = 3.20 × 10⁻³. (c) a comparative analysis of effective plastic strain between case 1 at T = 10.00 s and case 1′ at T = 1.27 × 10⁻². (d) a comparative analysis of effective plastic strain between case 1 at T = 18.00 s and case 1′ at T = 2.32 × 10⁻².
Aerospace 12 00333 g006
Figure 7. The comparison results of prototype tests (cases 2, 3, and 4) with the corresponding scale model tests (cases 2′, 3′, and 4′). Case 2, g = 9.81 m/s2, quartzite projectile of 125 m diameter impacts quartzite target at 12 km/s; case 2′, g = 3406.25 m/s2, projectile of 0.01 m diameter impacts target at 2 km/s; case 3, g = 9.81 m/s2, quartzite projectile of 250 m diameter impacts quartzite target at 12 km/s; case 3′, g = 6812.50 m/s2, projectile of 0.01 m diameter impacts target at 2 km/s; case 4, g = 9.81 m/s2, quartzite projectile of 375 m diameter impacts quartzite target at 12 km/s; case 4′, g = 10,218.75 m/s2, projectile of 0.01 m diameter impacts target at 2 km/s. (a) a comparative analysis of effective plastic strain between case 2 at T = 38.20 s and case 2′ at T = 1.87 × 10⁻². (b) a comparative analysis of effective plastic strain between case 3 at T = 52.00 s and case 3′ at T = 1.43 × 10⁻². (c) a comparative analysis of effective plastic strain between case 4 at T = 64.40 s and case 4′ at T = 1.25 × 10⁻².
Aerospace 12 00333 g007
Figure 8. The comparison results of prototype tests (left, case 5) with the corresponding scale model tests (right, case 5′). Case 5, g = 9.81 m/s2, quartzite projectile of 500 m diameter impacts quartzite target at 12 km/s [20]; case 5′, g = 13,625 m/s2, projectile of 0.01 m diameter impacts target at 2 km/s. (a) a comparative analysis of effective plastic strain between case 5 at T = 1.50 s and case 5′ at T = 2.00 × 10⁻⁴. (b) a comparative analysis of effective plastic strain between case 5 at 15.00 s and case 5′ at T = 2.10 × 10⁻³. (c) a comparative analysis of effective plastic strain between case 5 at 38.00 s and case 5′ at T = 5.30 × 10⁻³. (d) a comparative analysis of effective plastic strain between case 5 at 75.00 s and case 5′ at T = 1.05 × 10⁻².
Aerospace 12 00333 g008
Figure 9. The relationship between π2(ga/ U p 2 ), average of depth–diameter ratio dc/Dc, and transition threshold of crater morphology S′.
Aerospace 12 00333 g009
Figure 10. The relationship between S′, the crater diameter of prototype tests (Dcy) and the gravity of scale model tests (gs).
Aerospace 12 00333 g010
Figure 11. The relationship between crater depth–diameter ratio dc/Dc, the projectile diameter (Dpy) of prototype tests and the gravity (gs) of scale model tests.
Aerospace 12 00333 g011
Figure 12. The cratering time relationship between prototype tests and scale model tests.
Aerospace 12 00333 g012
Table 1. The parameters of test design.
GroupTest
Type
CaseDp (m)Up (km/s)g
(m/s2)
ρ (kg/m3)Yt (MPa)π2CaS
G1Prototype150.0012.09.812600181.70 × 10−62.08 × 10428.23
Scale model1′0.012.01362.5018000.346
G2Prototype2125.0012.09.812600184.26 × 10−611.29
Scale model2′0.012.03406.2518000.346
G3Prototype3250.0012.09.812600188.52 × 10−65.64
Scale model3′0.012.06812.5018000.346
G4Prototype4375.0012.09.812600181.28 × 10−53.76
Scale model4′0.012.010,218.7518000.346
G5Prototype5500.0012.09.812600181.70 × 10−52.83
Scale model5′0.012.013,625.0018000.346
Table 2. Crater test data.
GroupCasedc (m)Dc (m)t (s)dc/DcThe Average of dc/Dc in Each GroupThe Relative Error of dc/Dc in Each Group (%)as/aygt/Up
G11101.26706.2118.0014.3 × 10−214.25 × 10⁻²−0.702.00 × 10−41.47 × 10⁻²
1′0.02010.1422.32 × 10−214.2 × 10−21.58 × 10−2
G22267.632019.8838.2013.2 × 10−213.10 × 10⁻²−1.528.00 × 10−53.12 × 10⁻²
2′0.01780.1371.87 × 10−213.0 × 10−23.18 × 10−2
G33457.833847.1252.0011.9 × 10−211.80 × 10⁻²−1.684.00 × 10−54.25 × 10⁻²
3′0.01290.1101.43 × 10−211.7 × 10−24.87 × 10−2
G44476.715608.3764.408.5 × 10−28.30 × 10⁻²−4.712.67 × 10−55.26 × 10⁻²
4′0.00870.1071.25 × 10−28.1 × 10−26.39 × 10−2
G55490.516987.3275.007.0 × 10−26.90 × 10⁻²−2.862.00 × 10−56.13 × 10⁻²
5′0.00690.1011.05 × 10−26.8 × 10−27.15 × 10−2
Disclaimer/Publisher’s Note: The statements, opinions and data contained in all publications are solely those of the individual author(s) and contributor(s) and not of MDPI and/or the editor(s). MDPI and/or the editor(s) disclaim responsibility for any injury to people or property resulting from any ideas, methods, instructions or products referred to in the content.