
Design of Lattice-Based Energy-Absorbing Structure for Enhancing the Crashworthiness of Advanced Air Mobility


Abstract
1. Introduction
2. Methodology
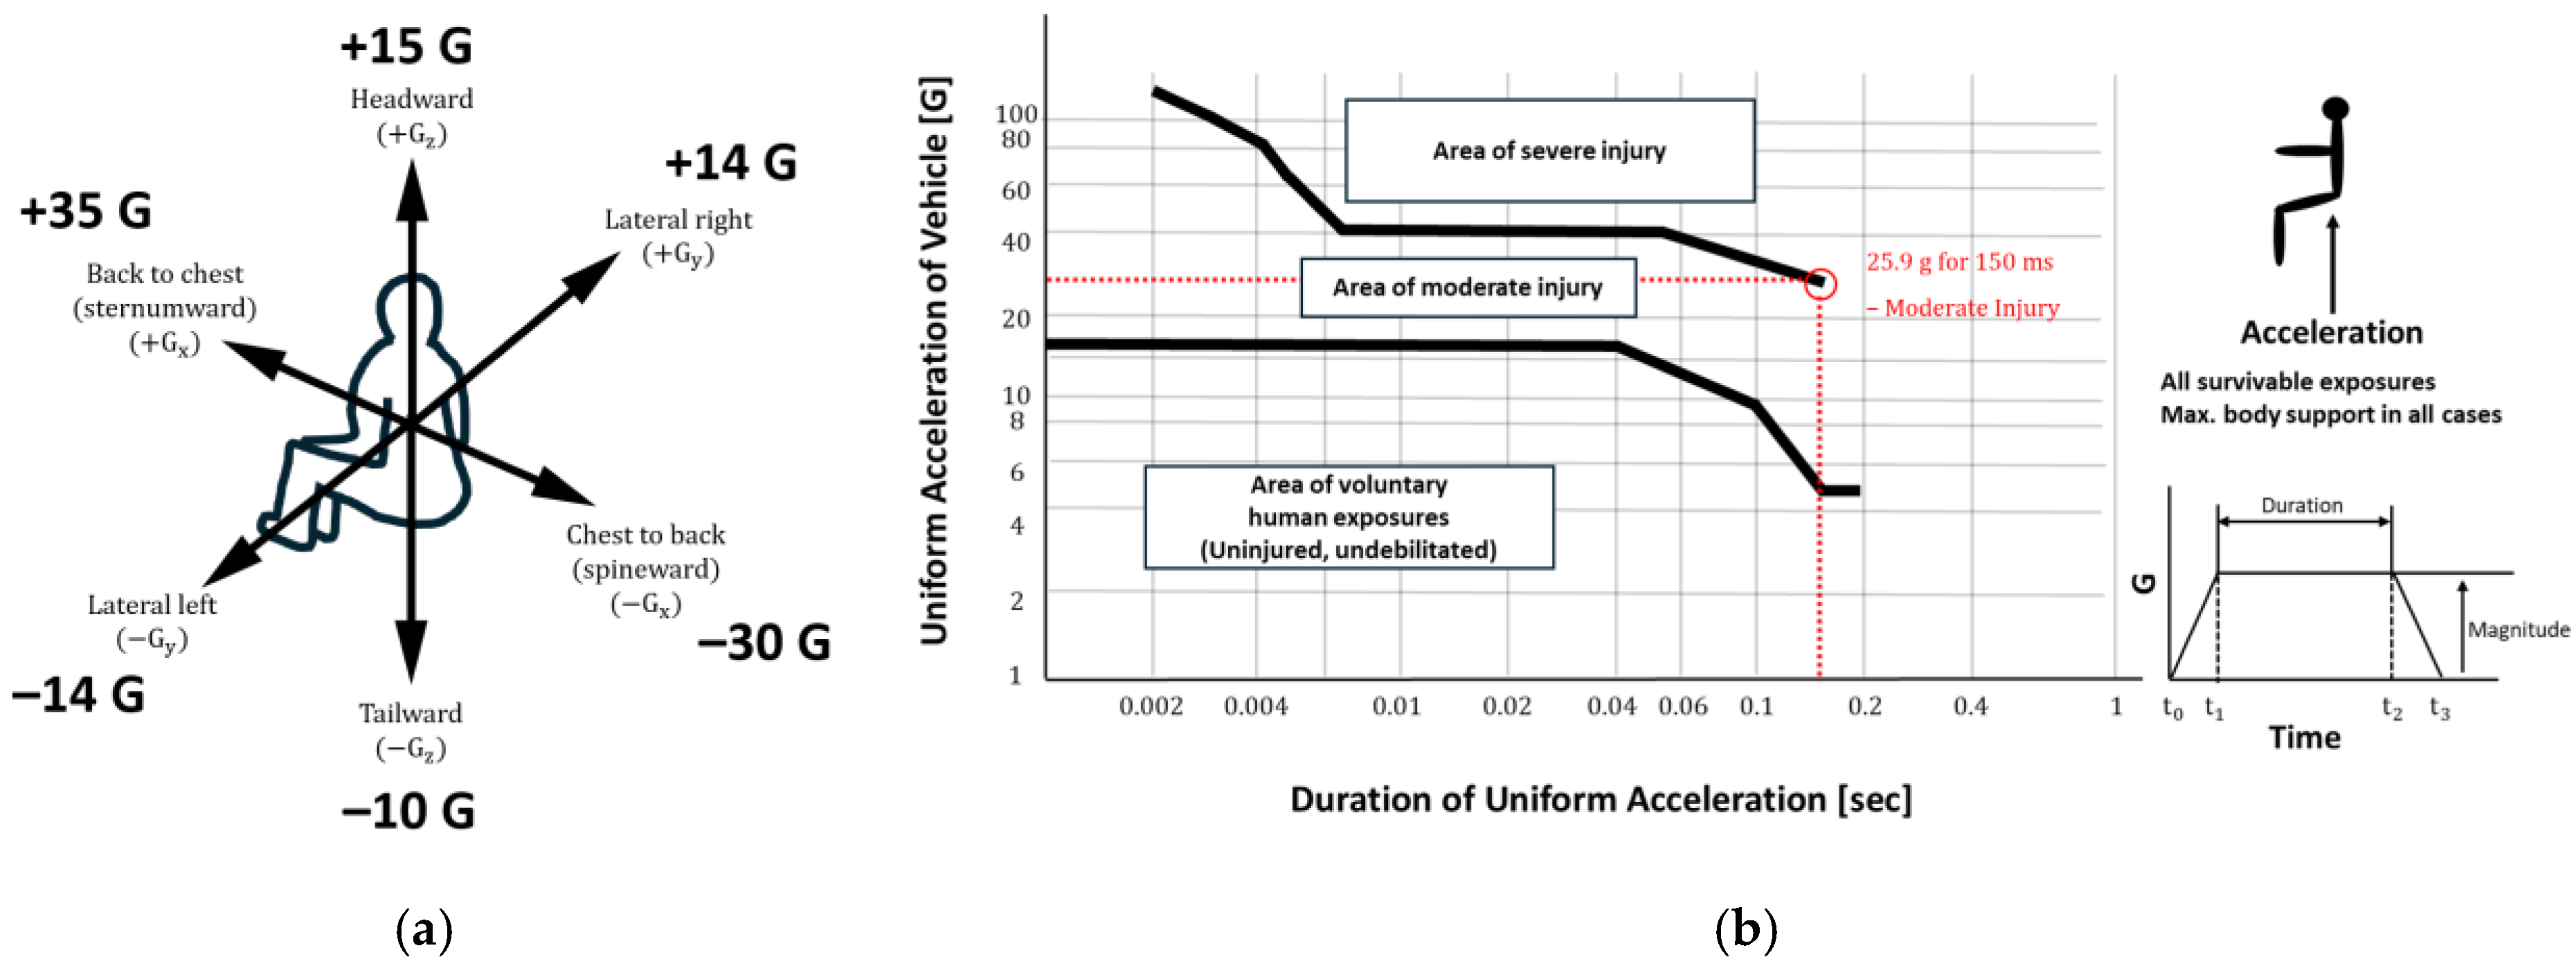
2.1. Crashworthiness of Advanced Air Mobility
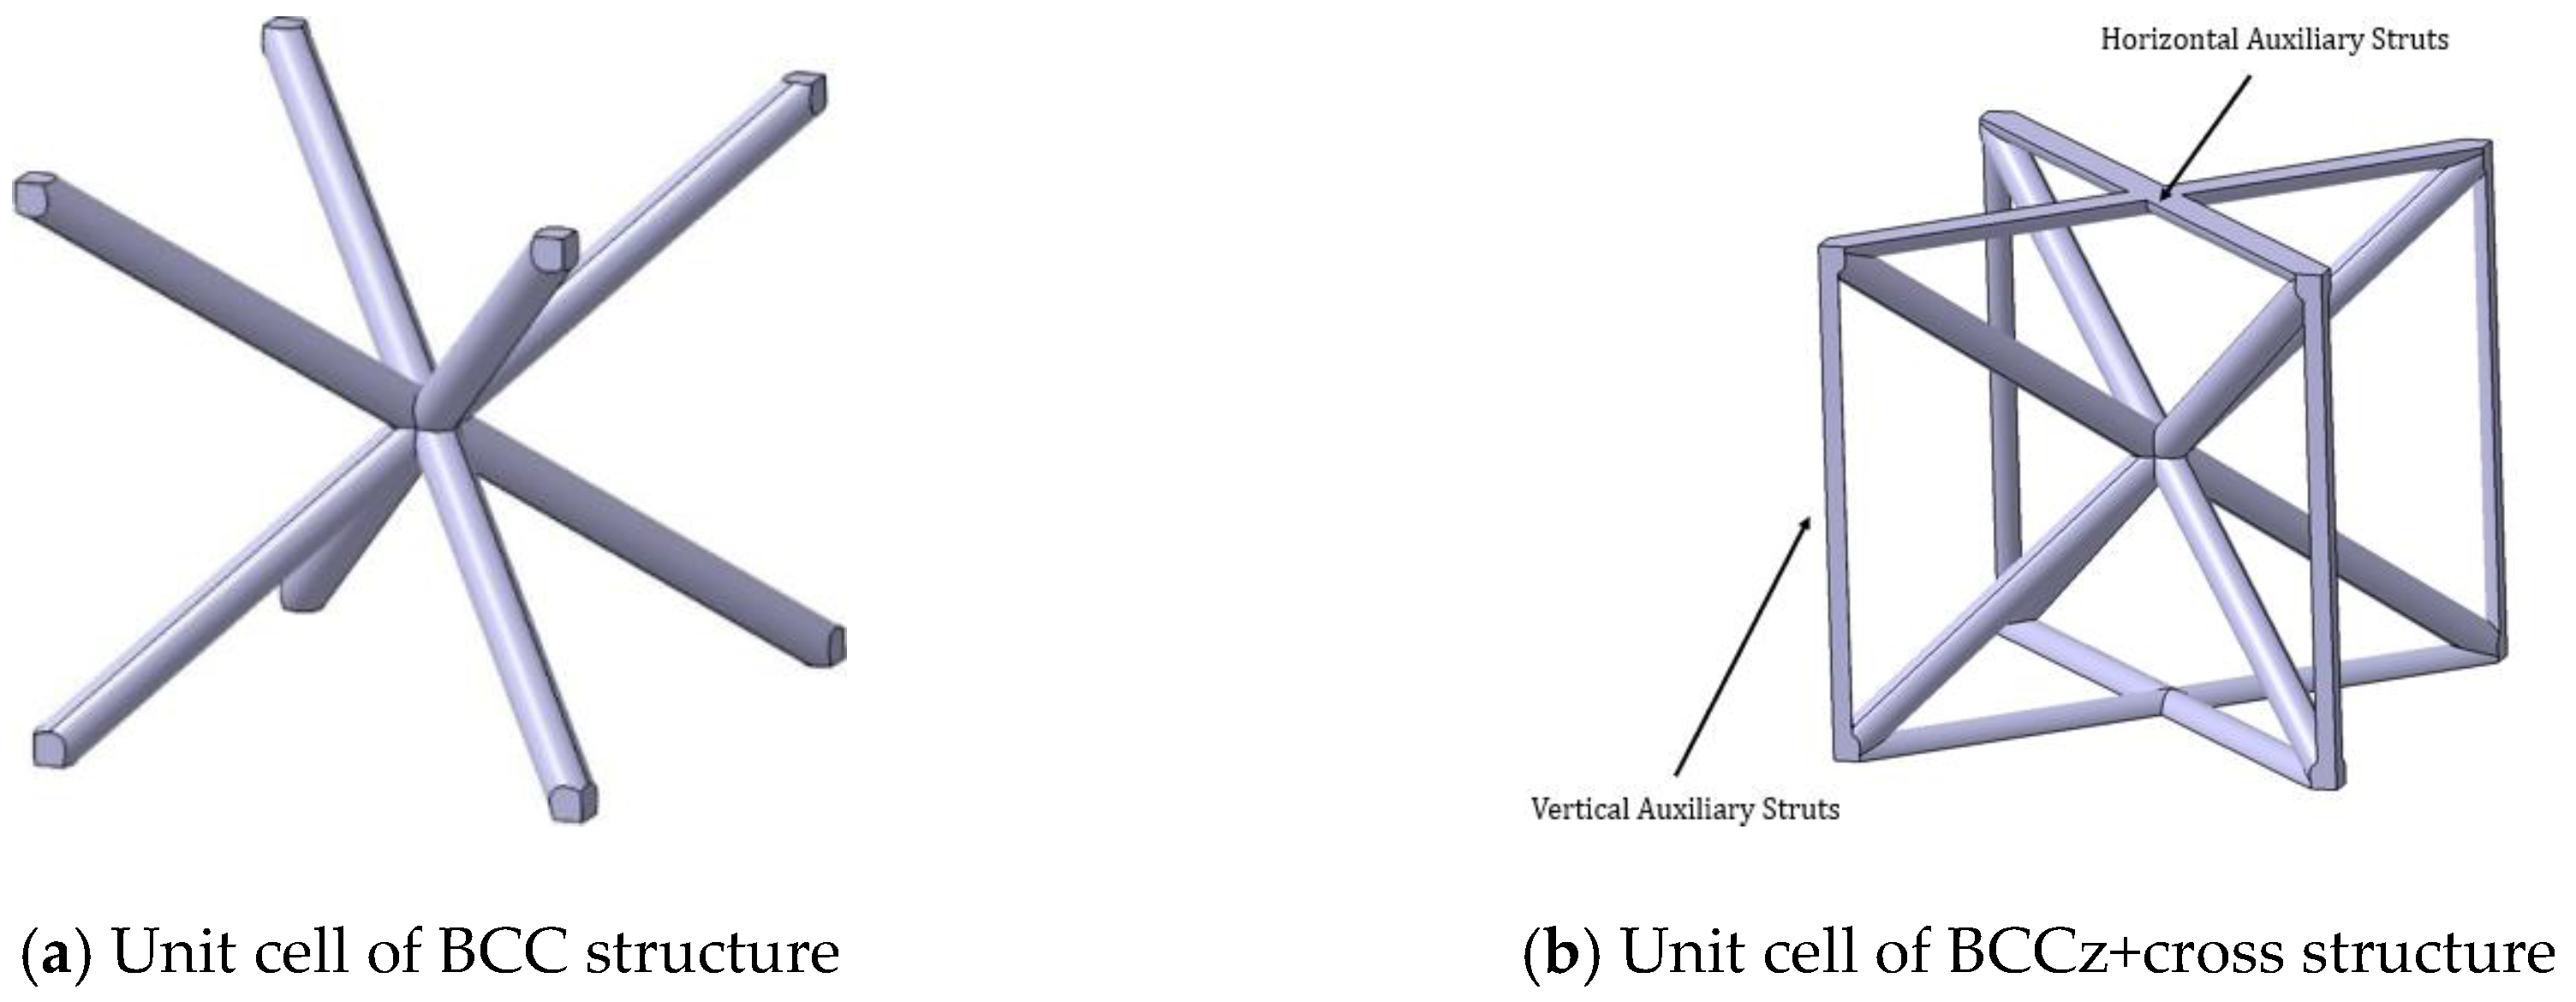
2.2. Energy-Absorbing Structure
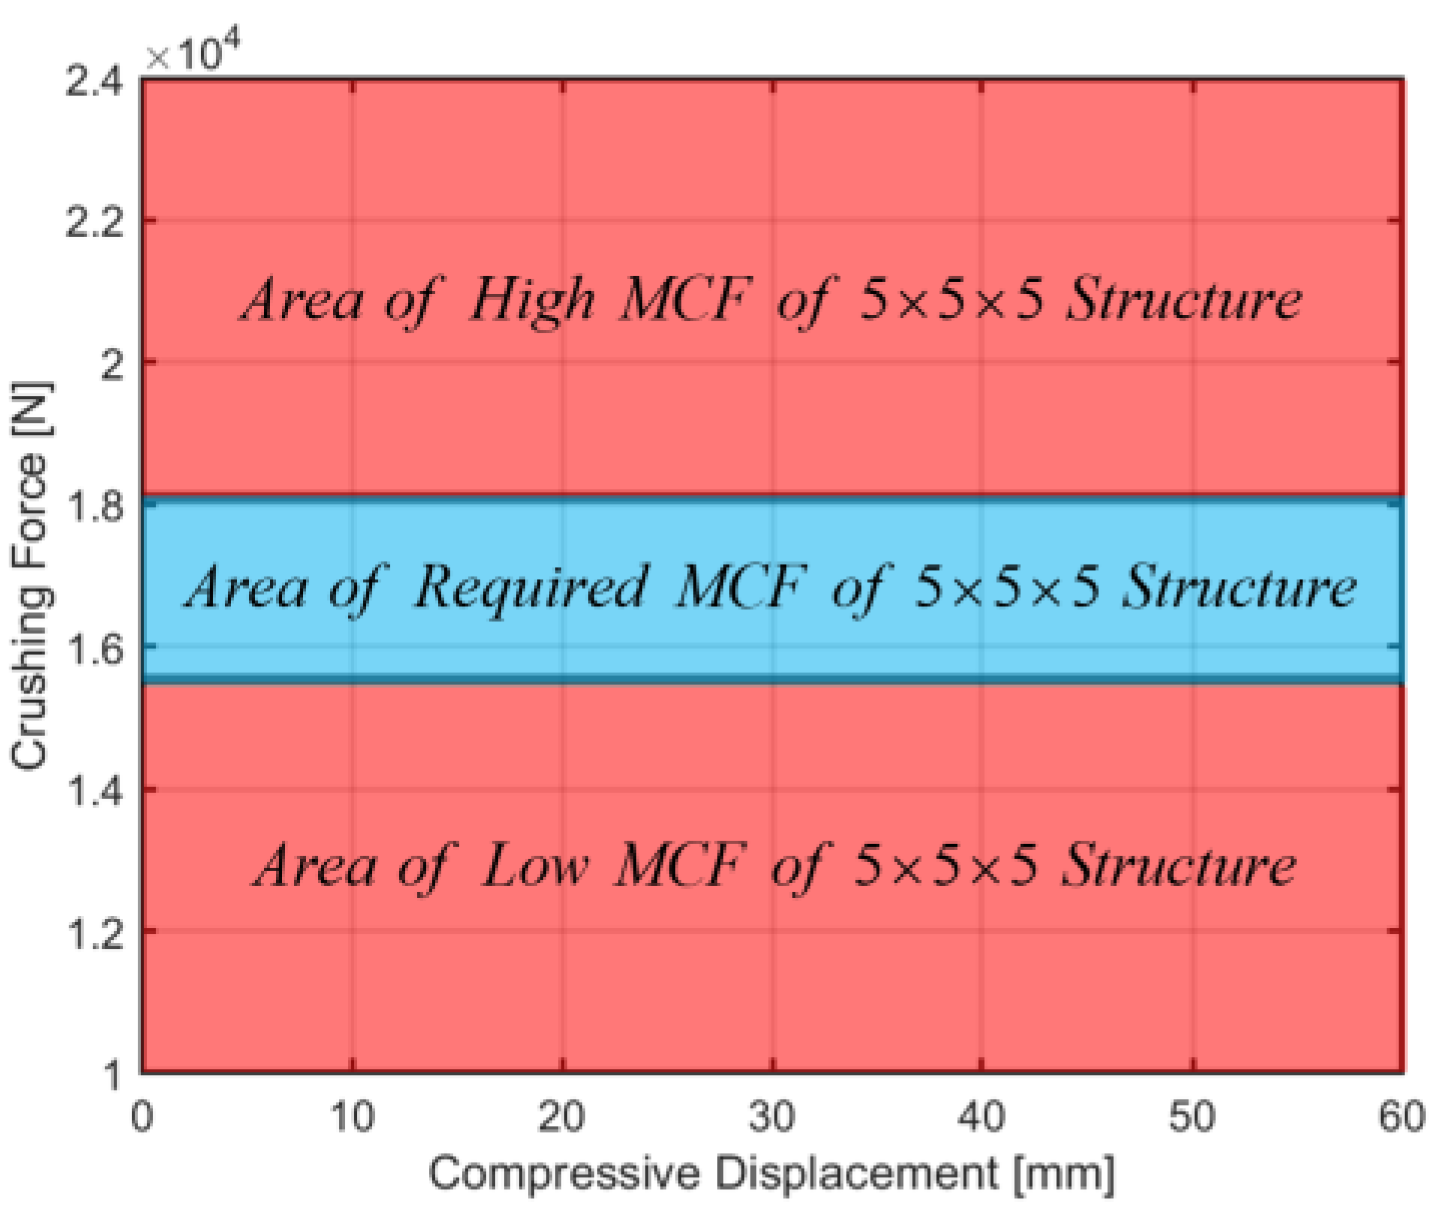
2.3. Requirements for Energy Absorber
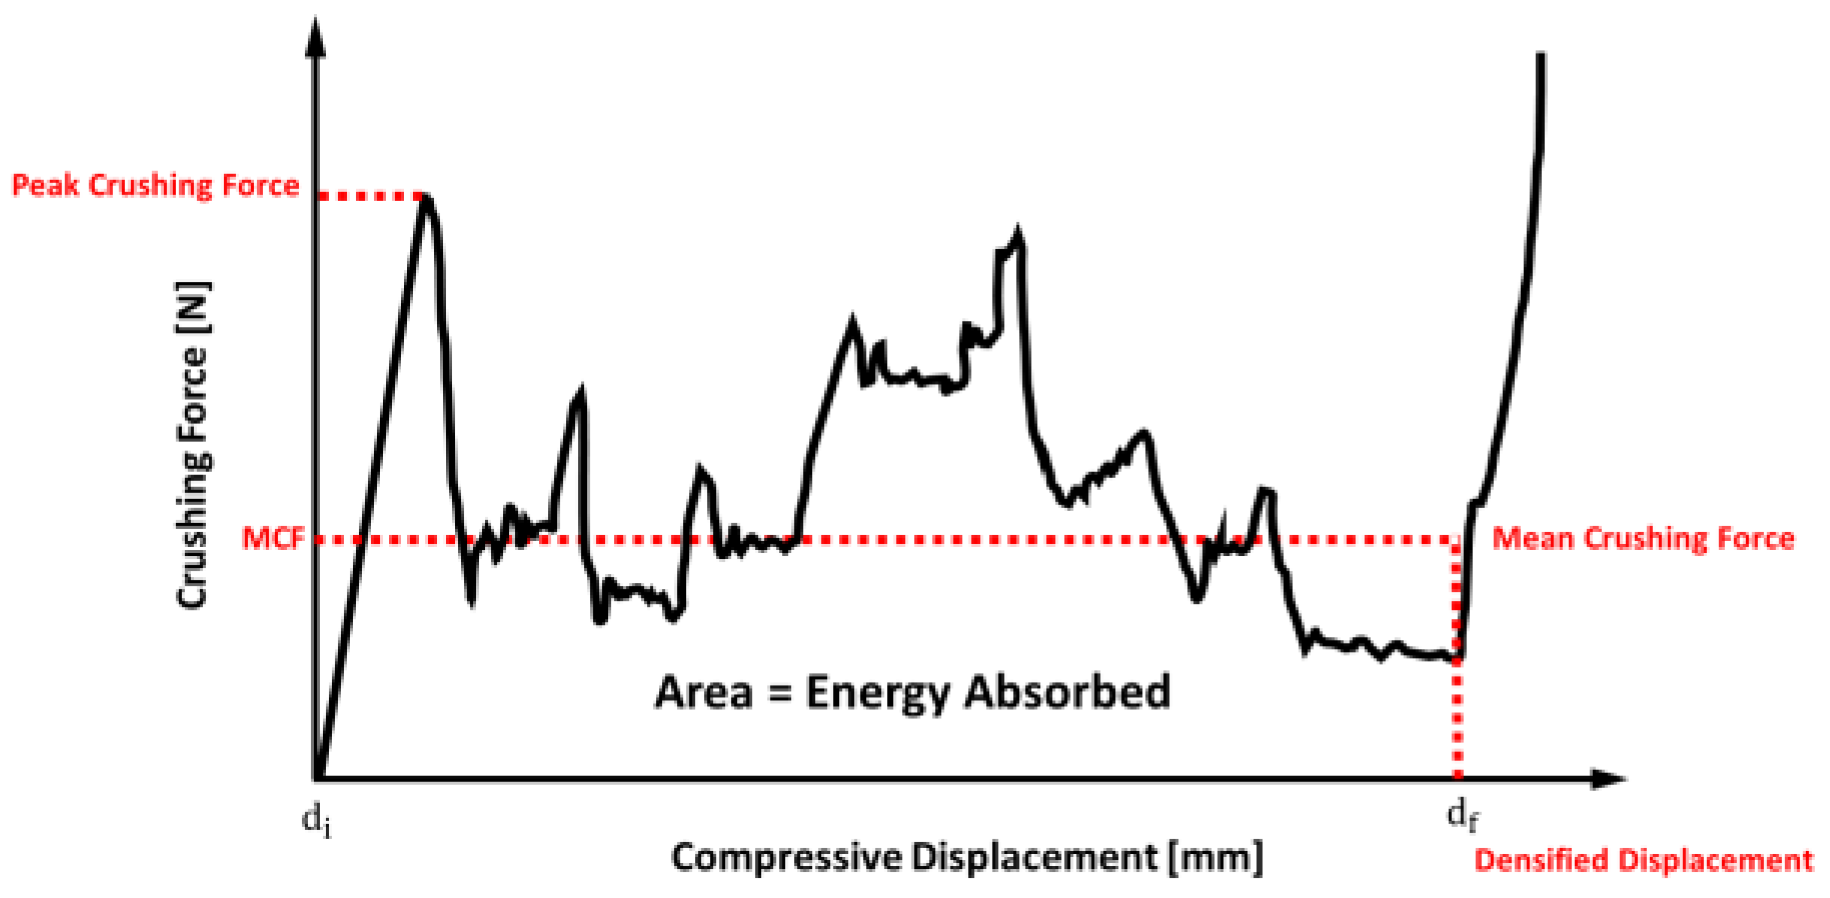
2.3.1. Energy Absorption,
2.3.2. Mean Crushing Force,
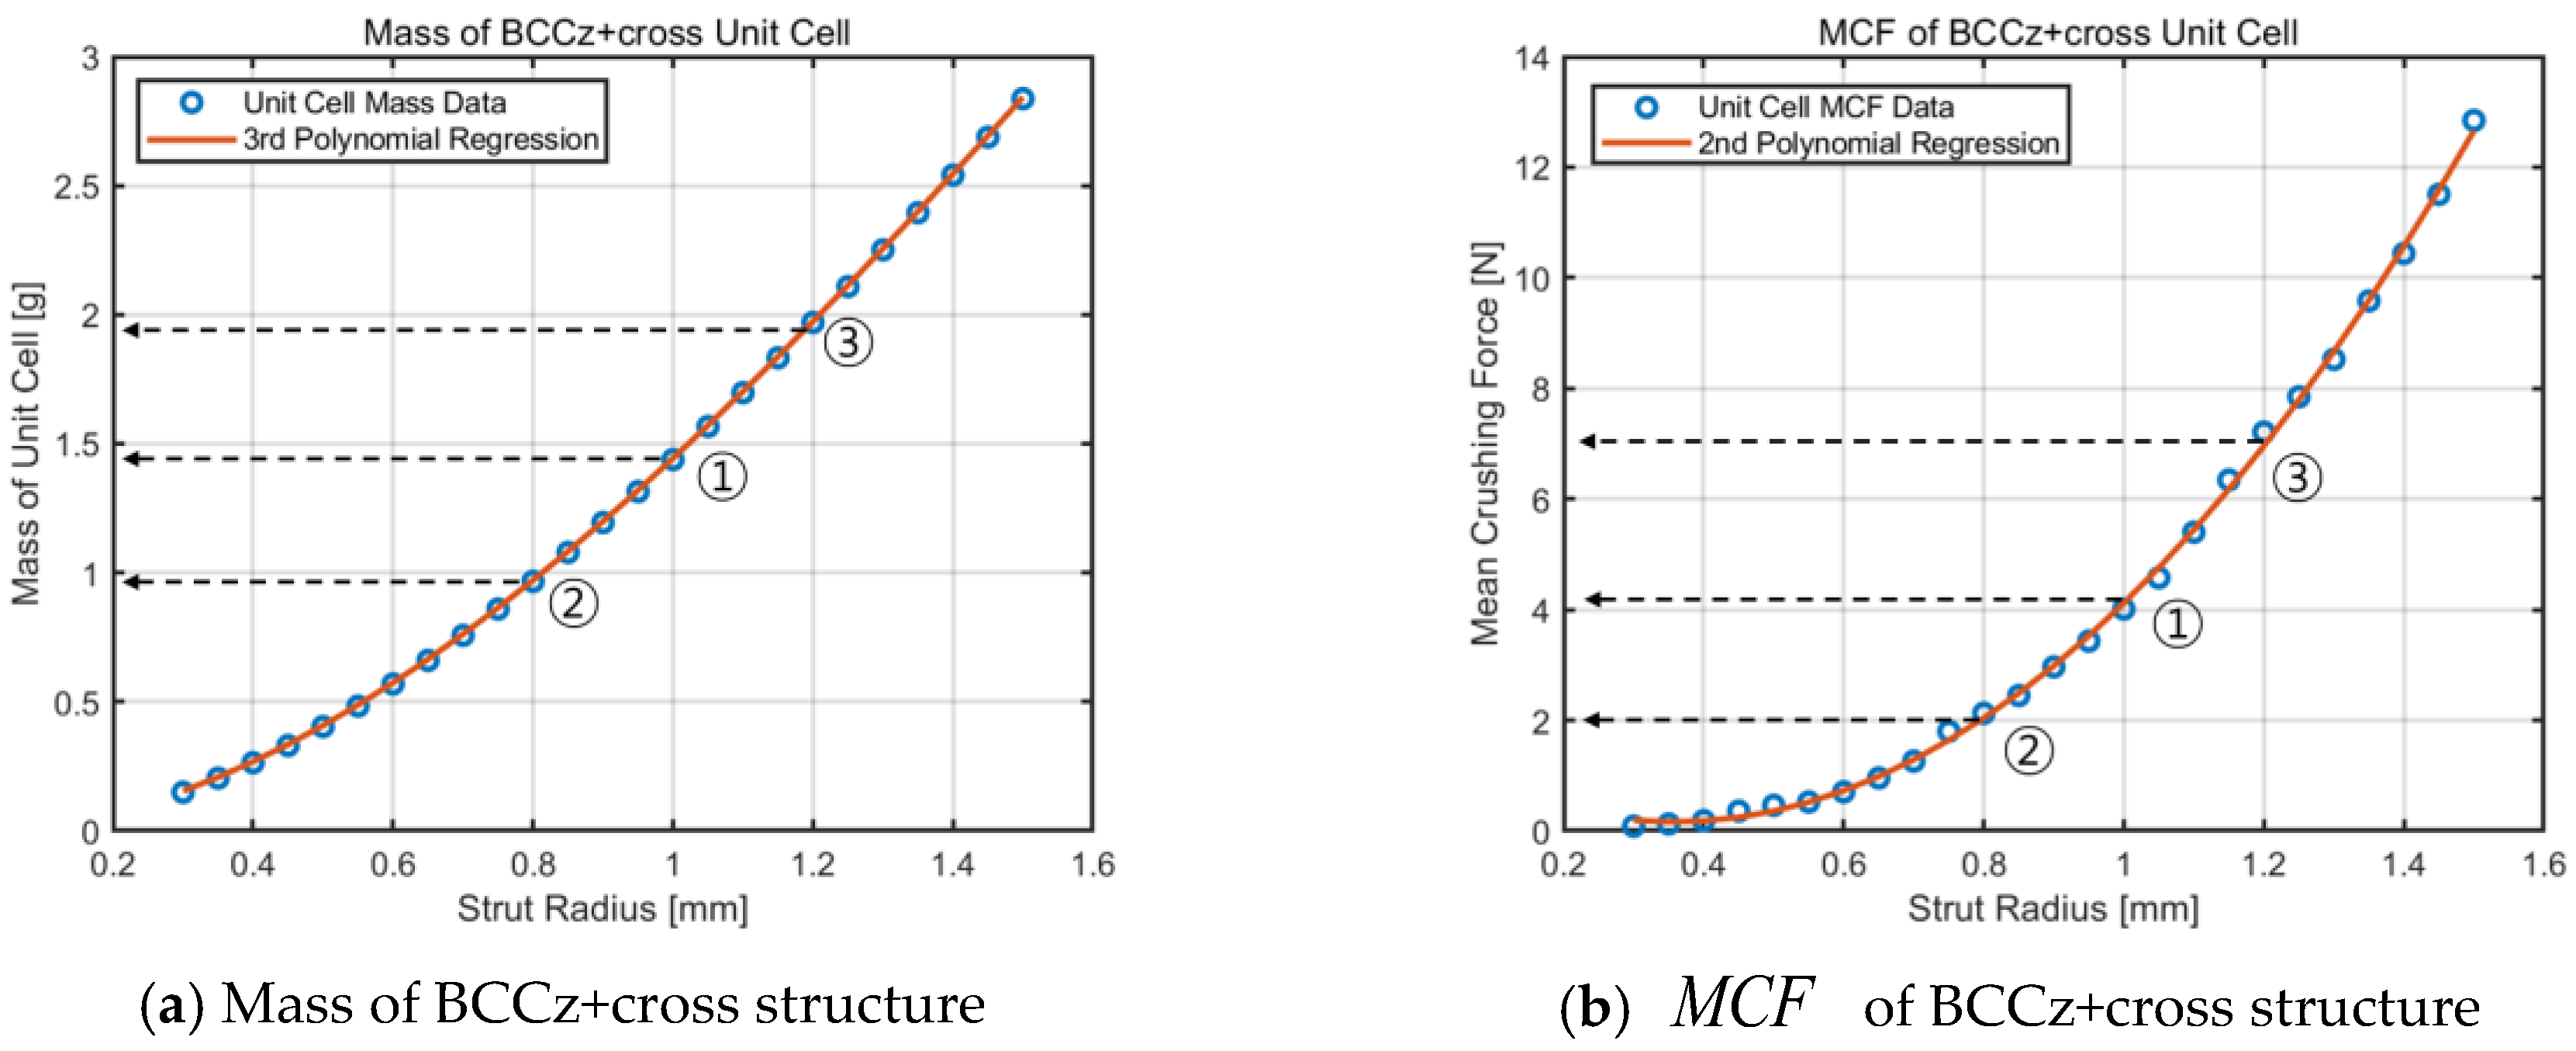
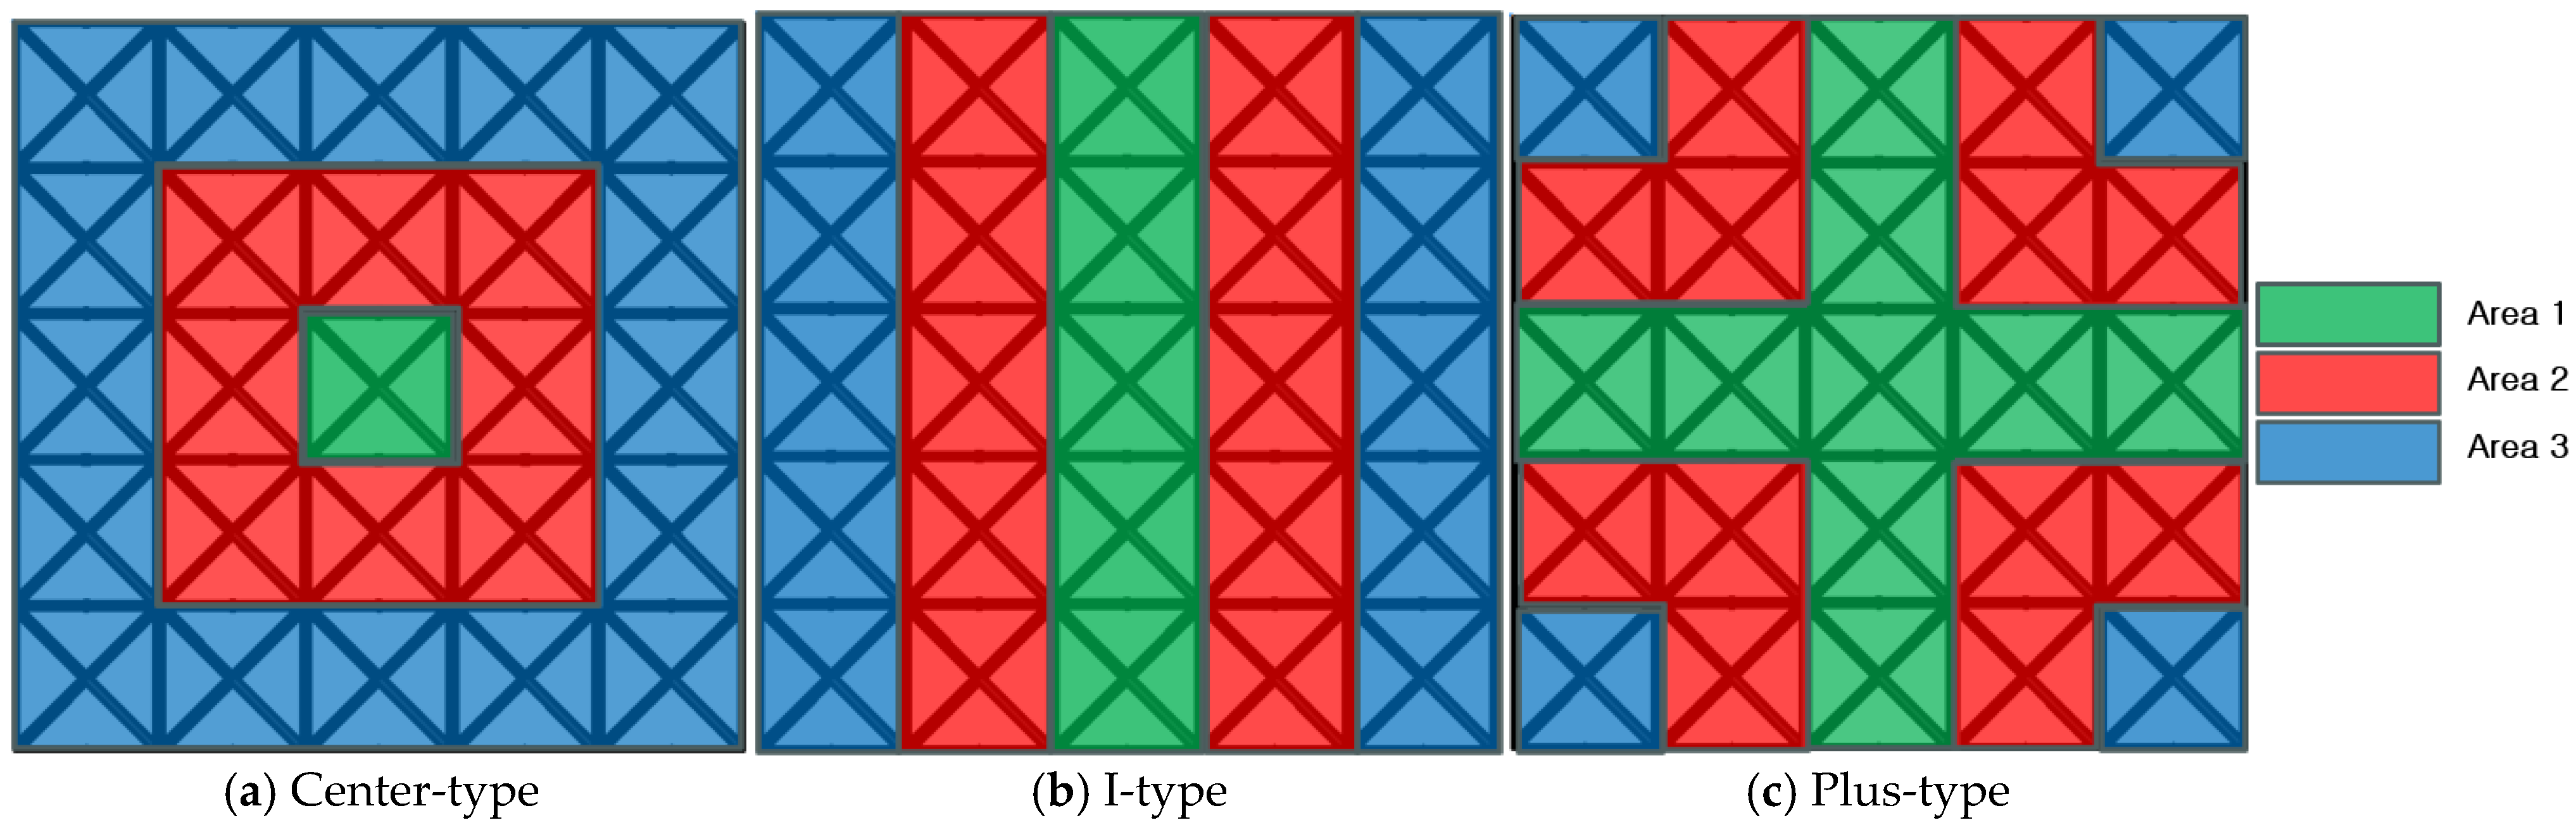
2.4. Design of Energy-Absorbing Structure
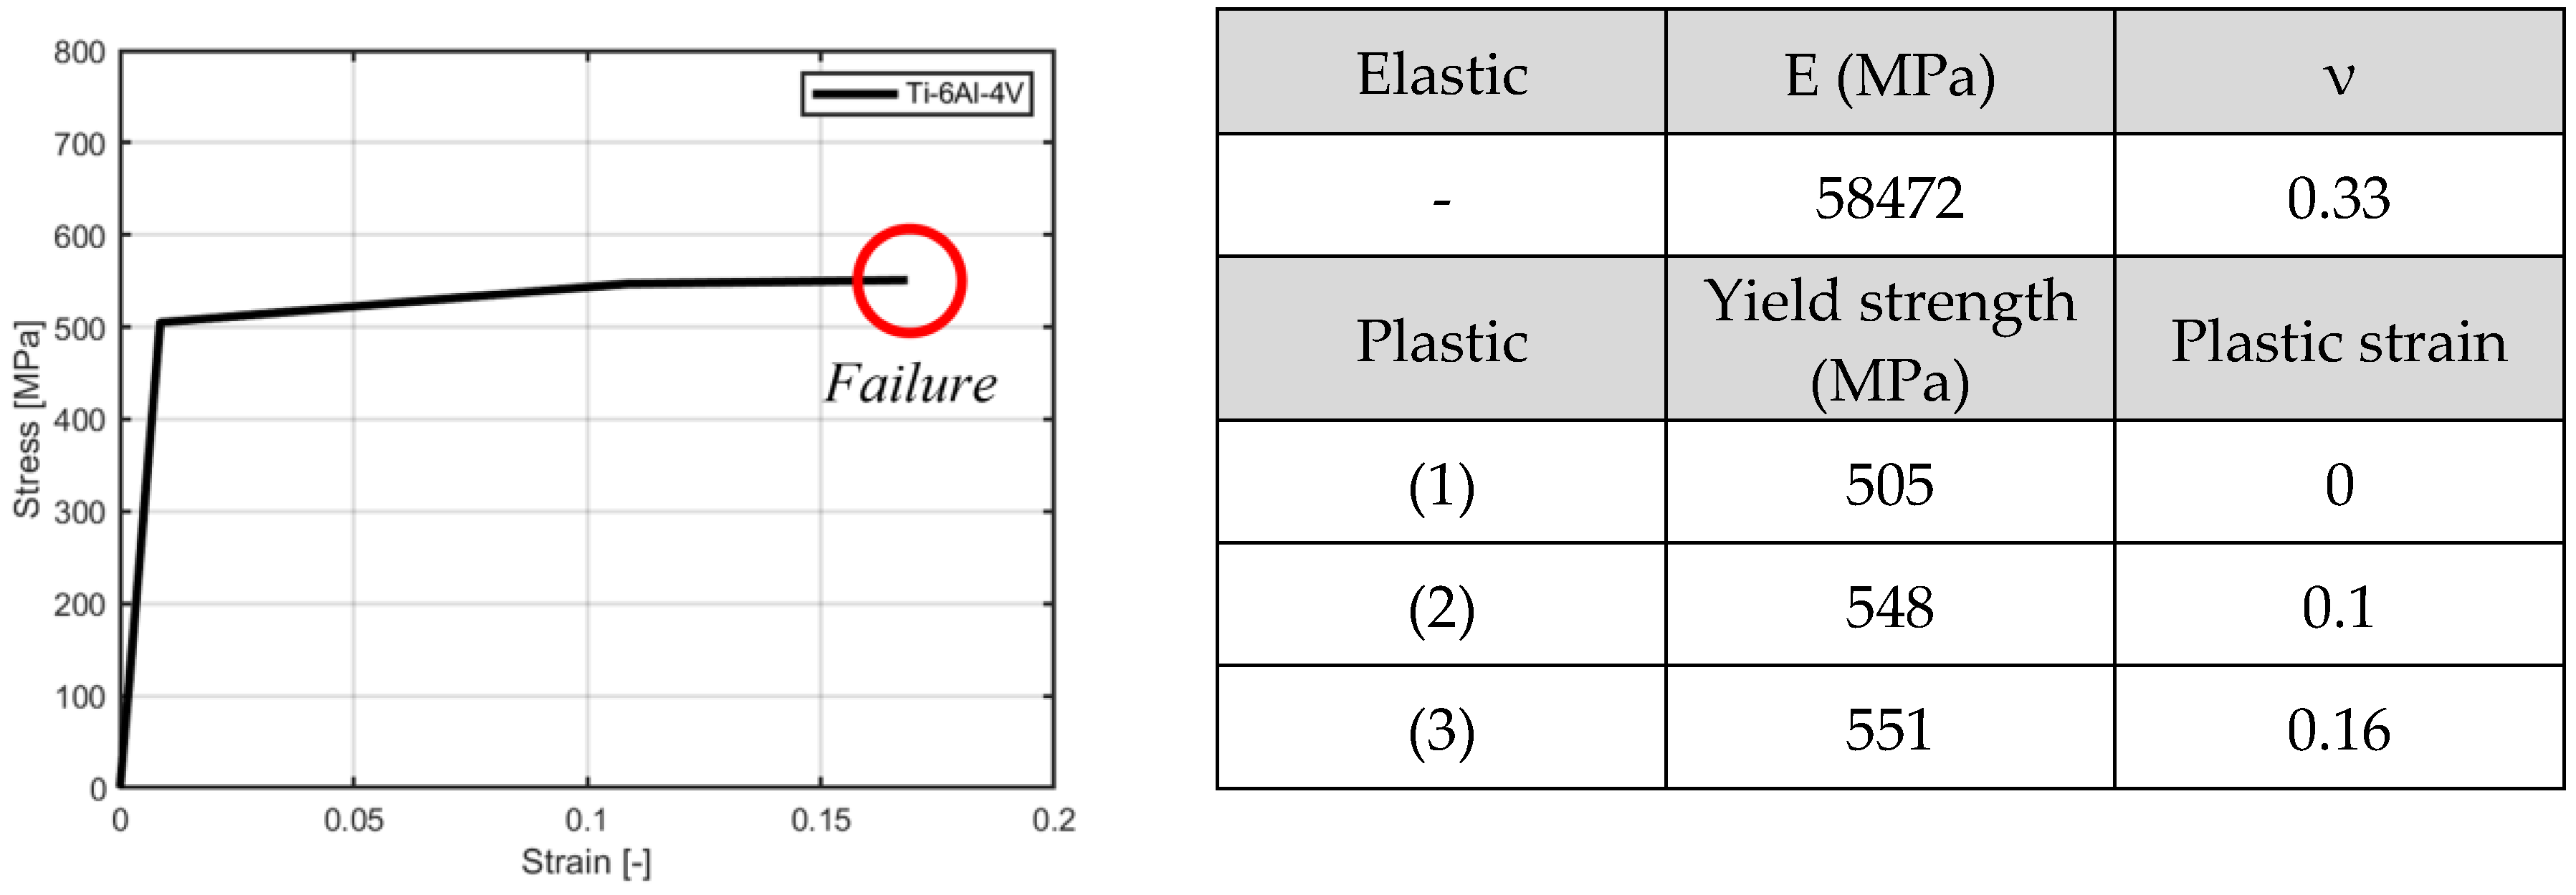
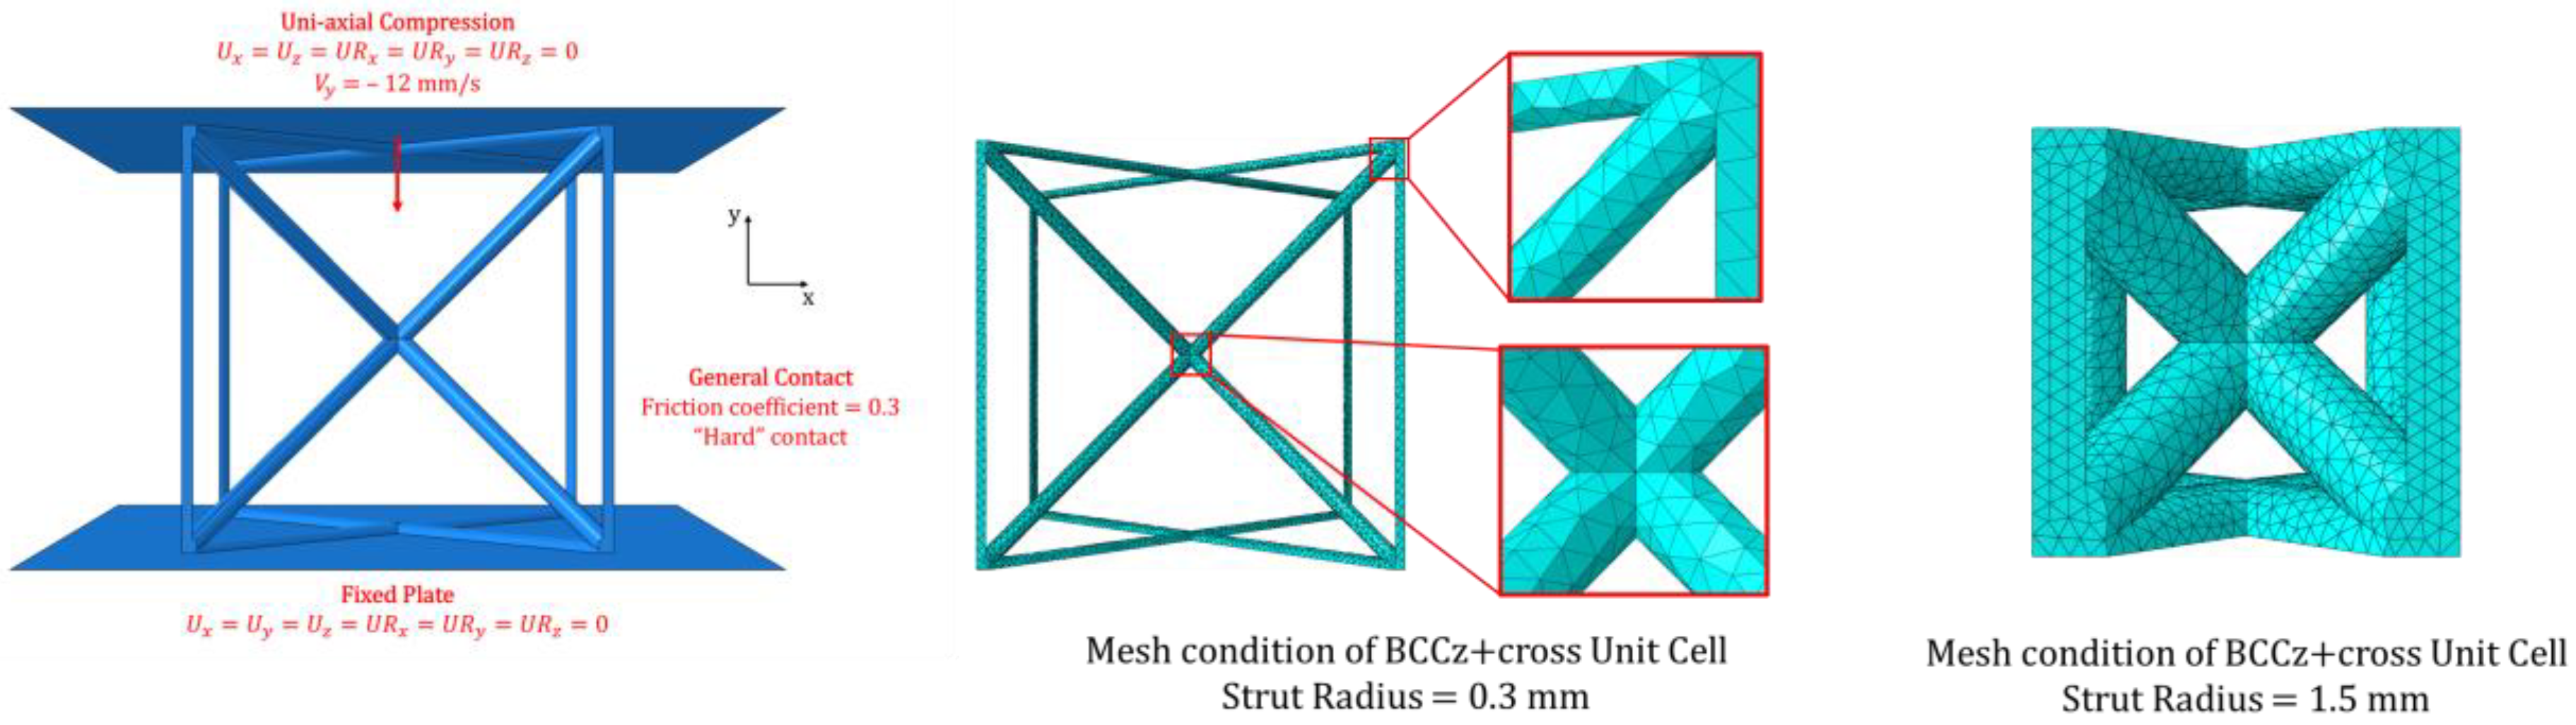
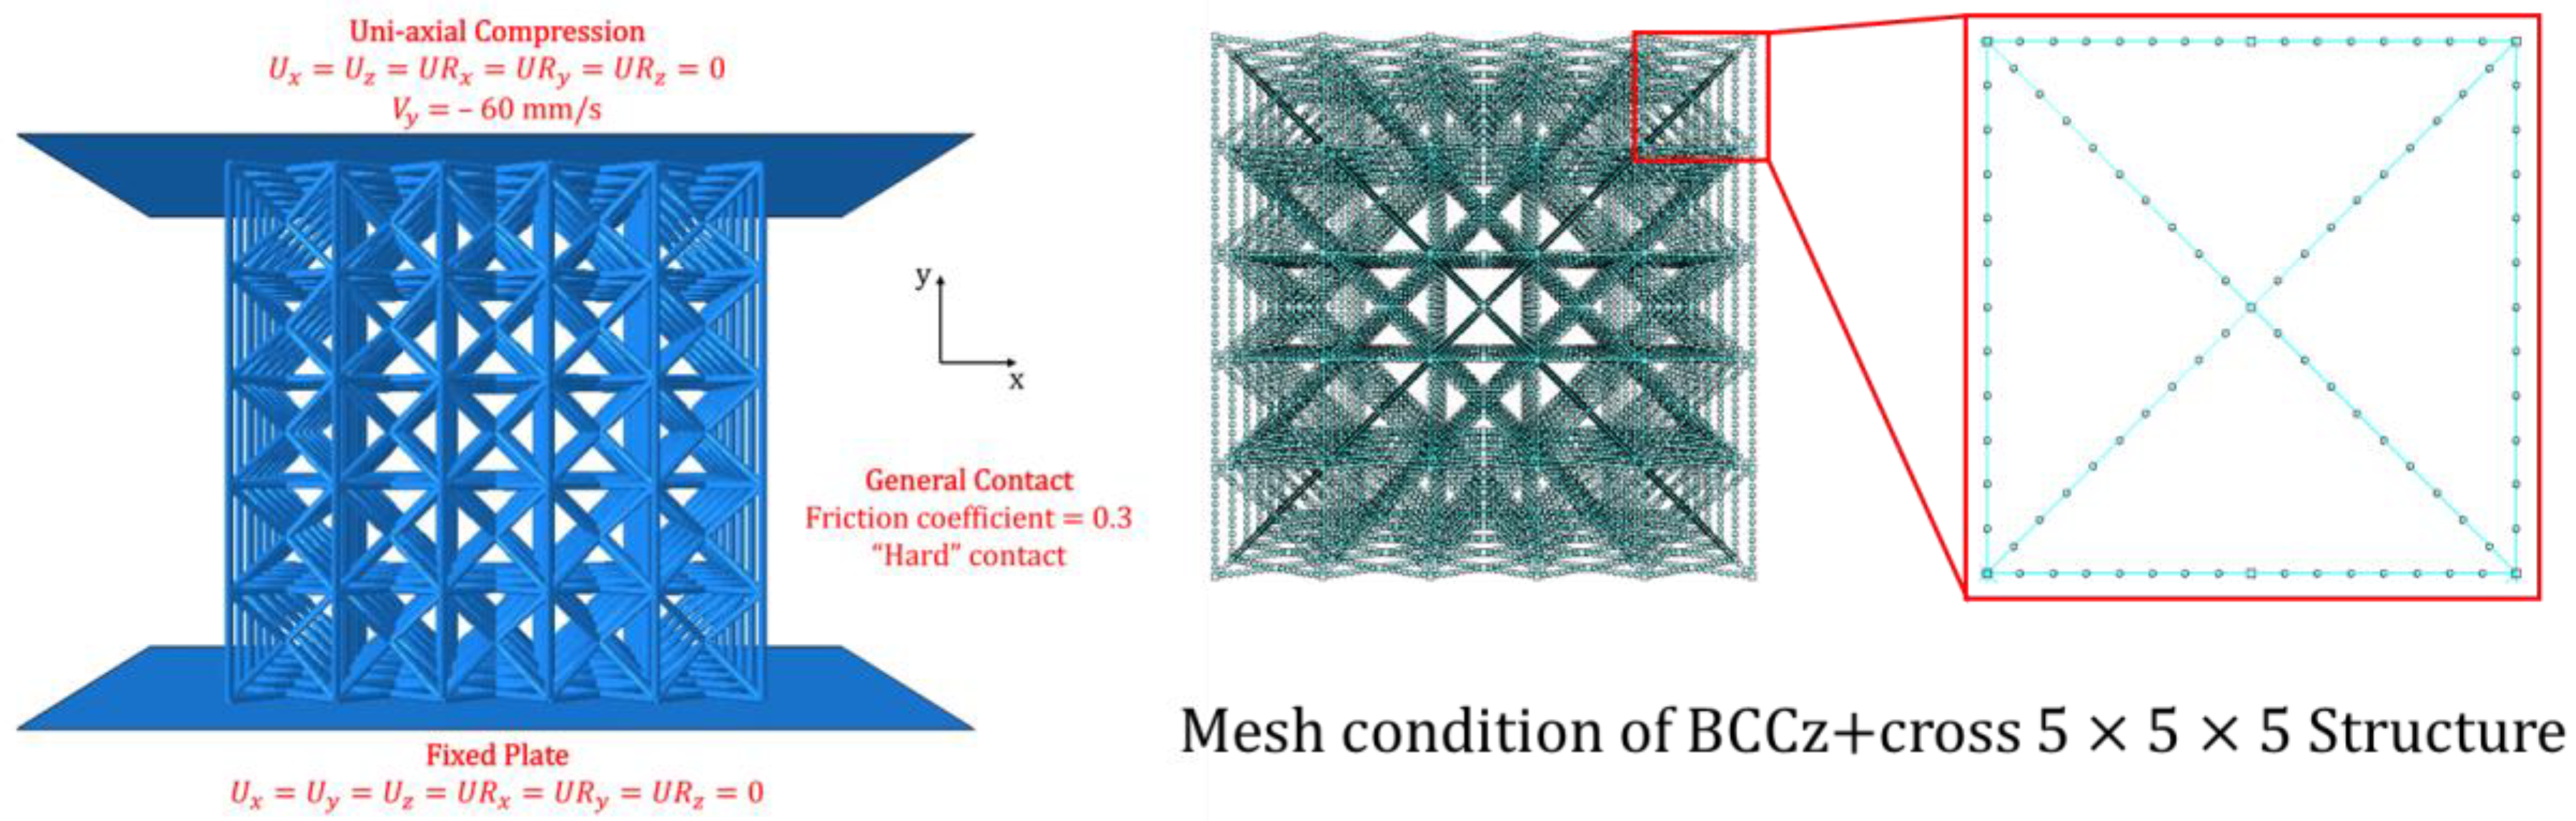
2.5. Finite Element Analysis
2.6. Design of Experiments
2.6.1. Creation of Surrogate Model
2.6.2. Compensated Latin Hypercube Sampling Method
2.6.3. Universal Kriging Interpolation
3. Experiments
3.1. Metal Additive Manufacturing Method
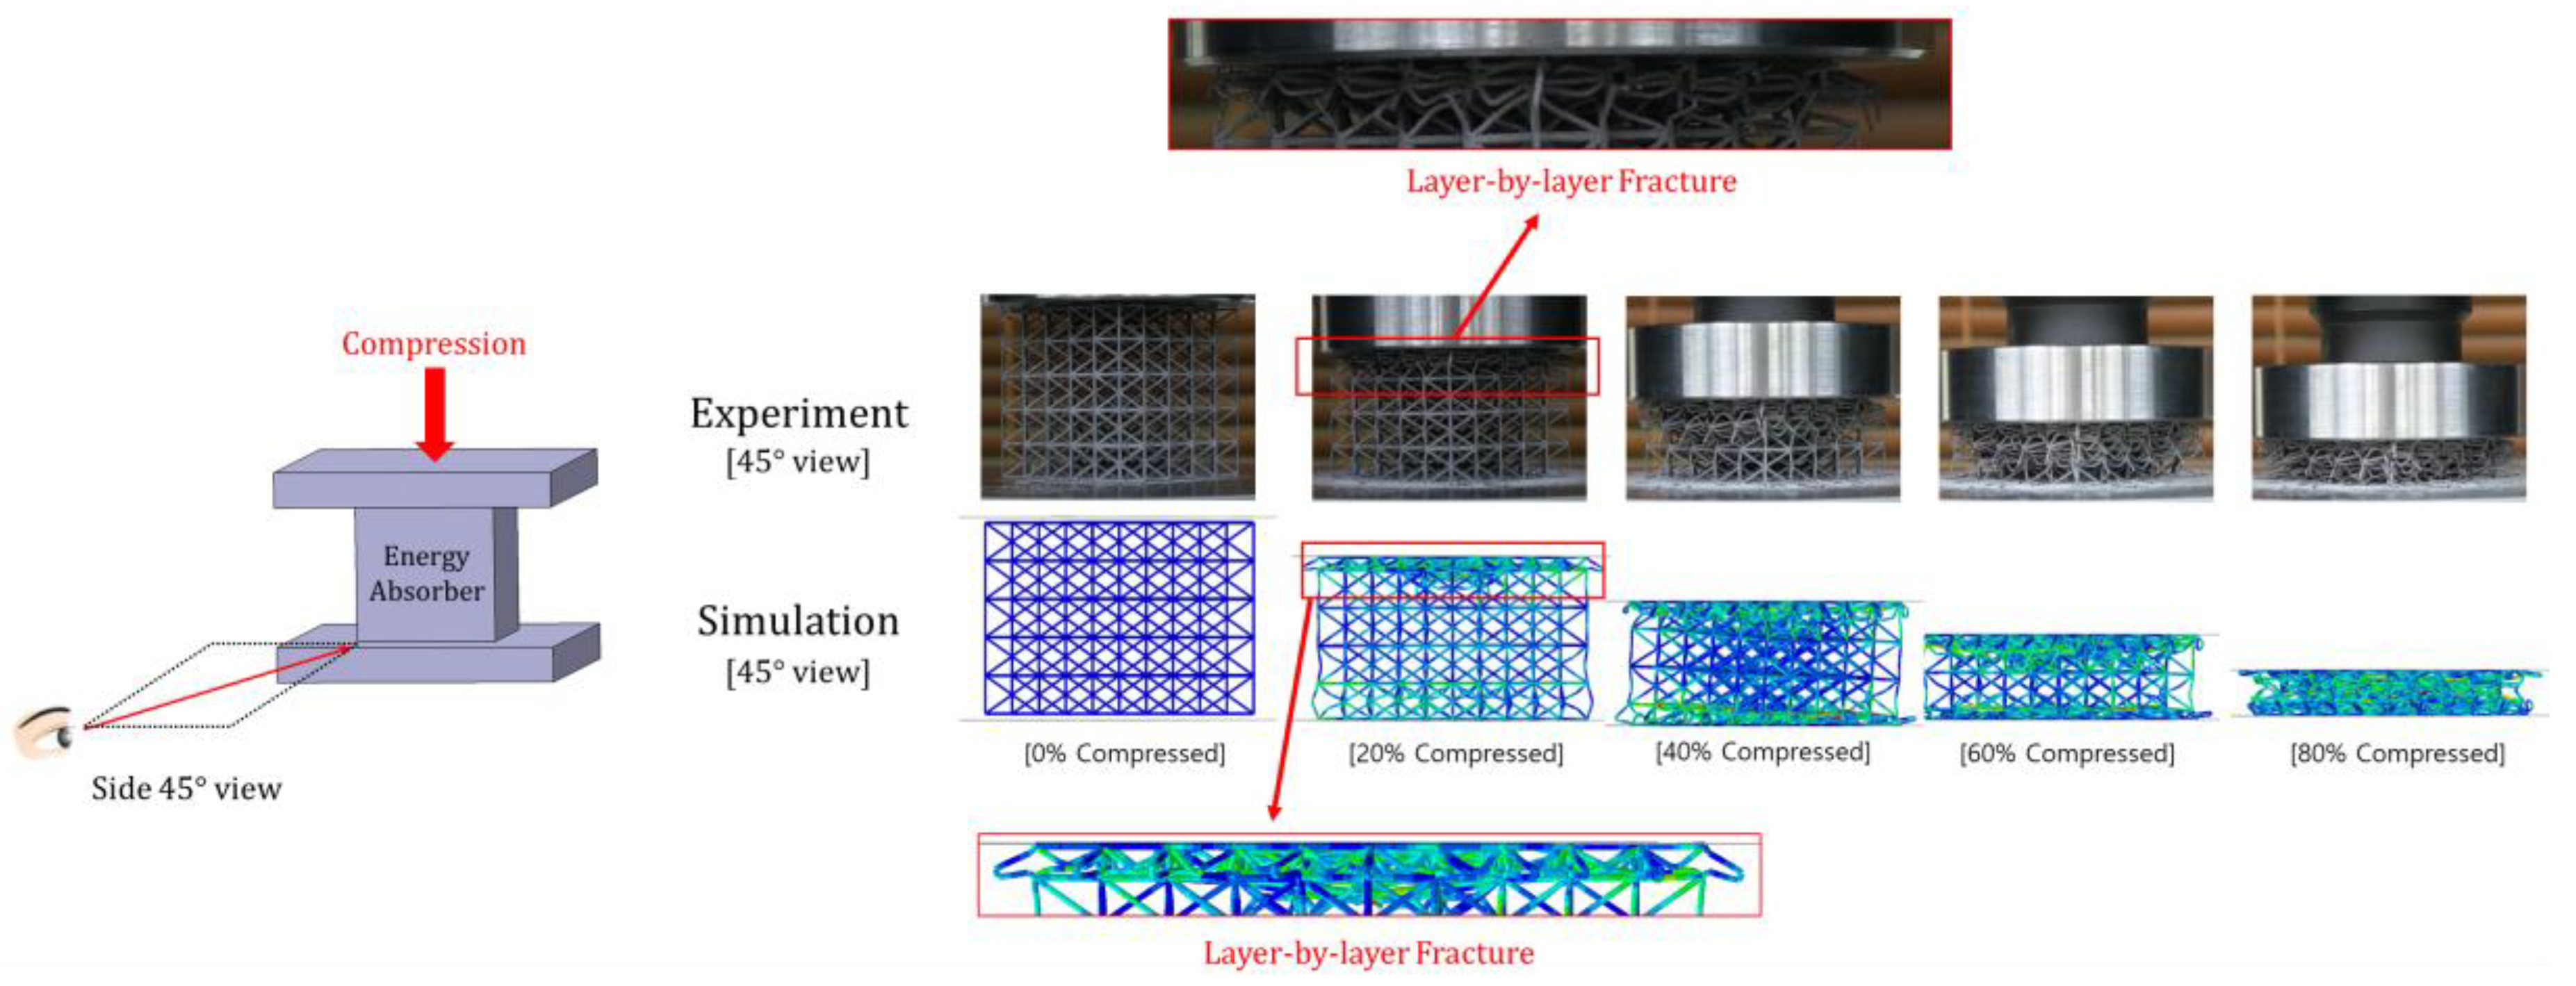
3.2. Quasi-Static Compression Test
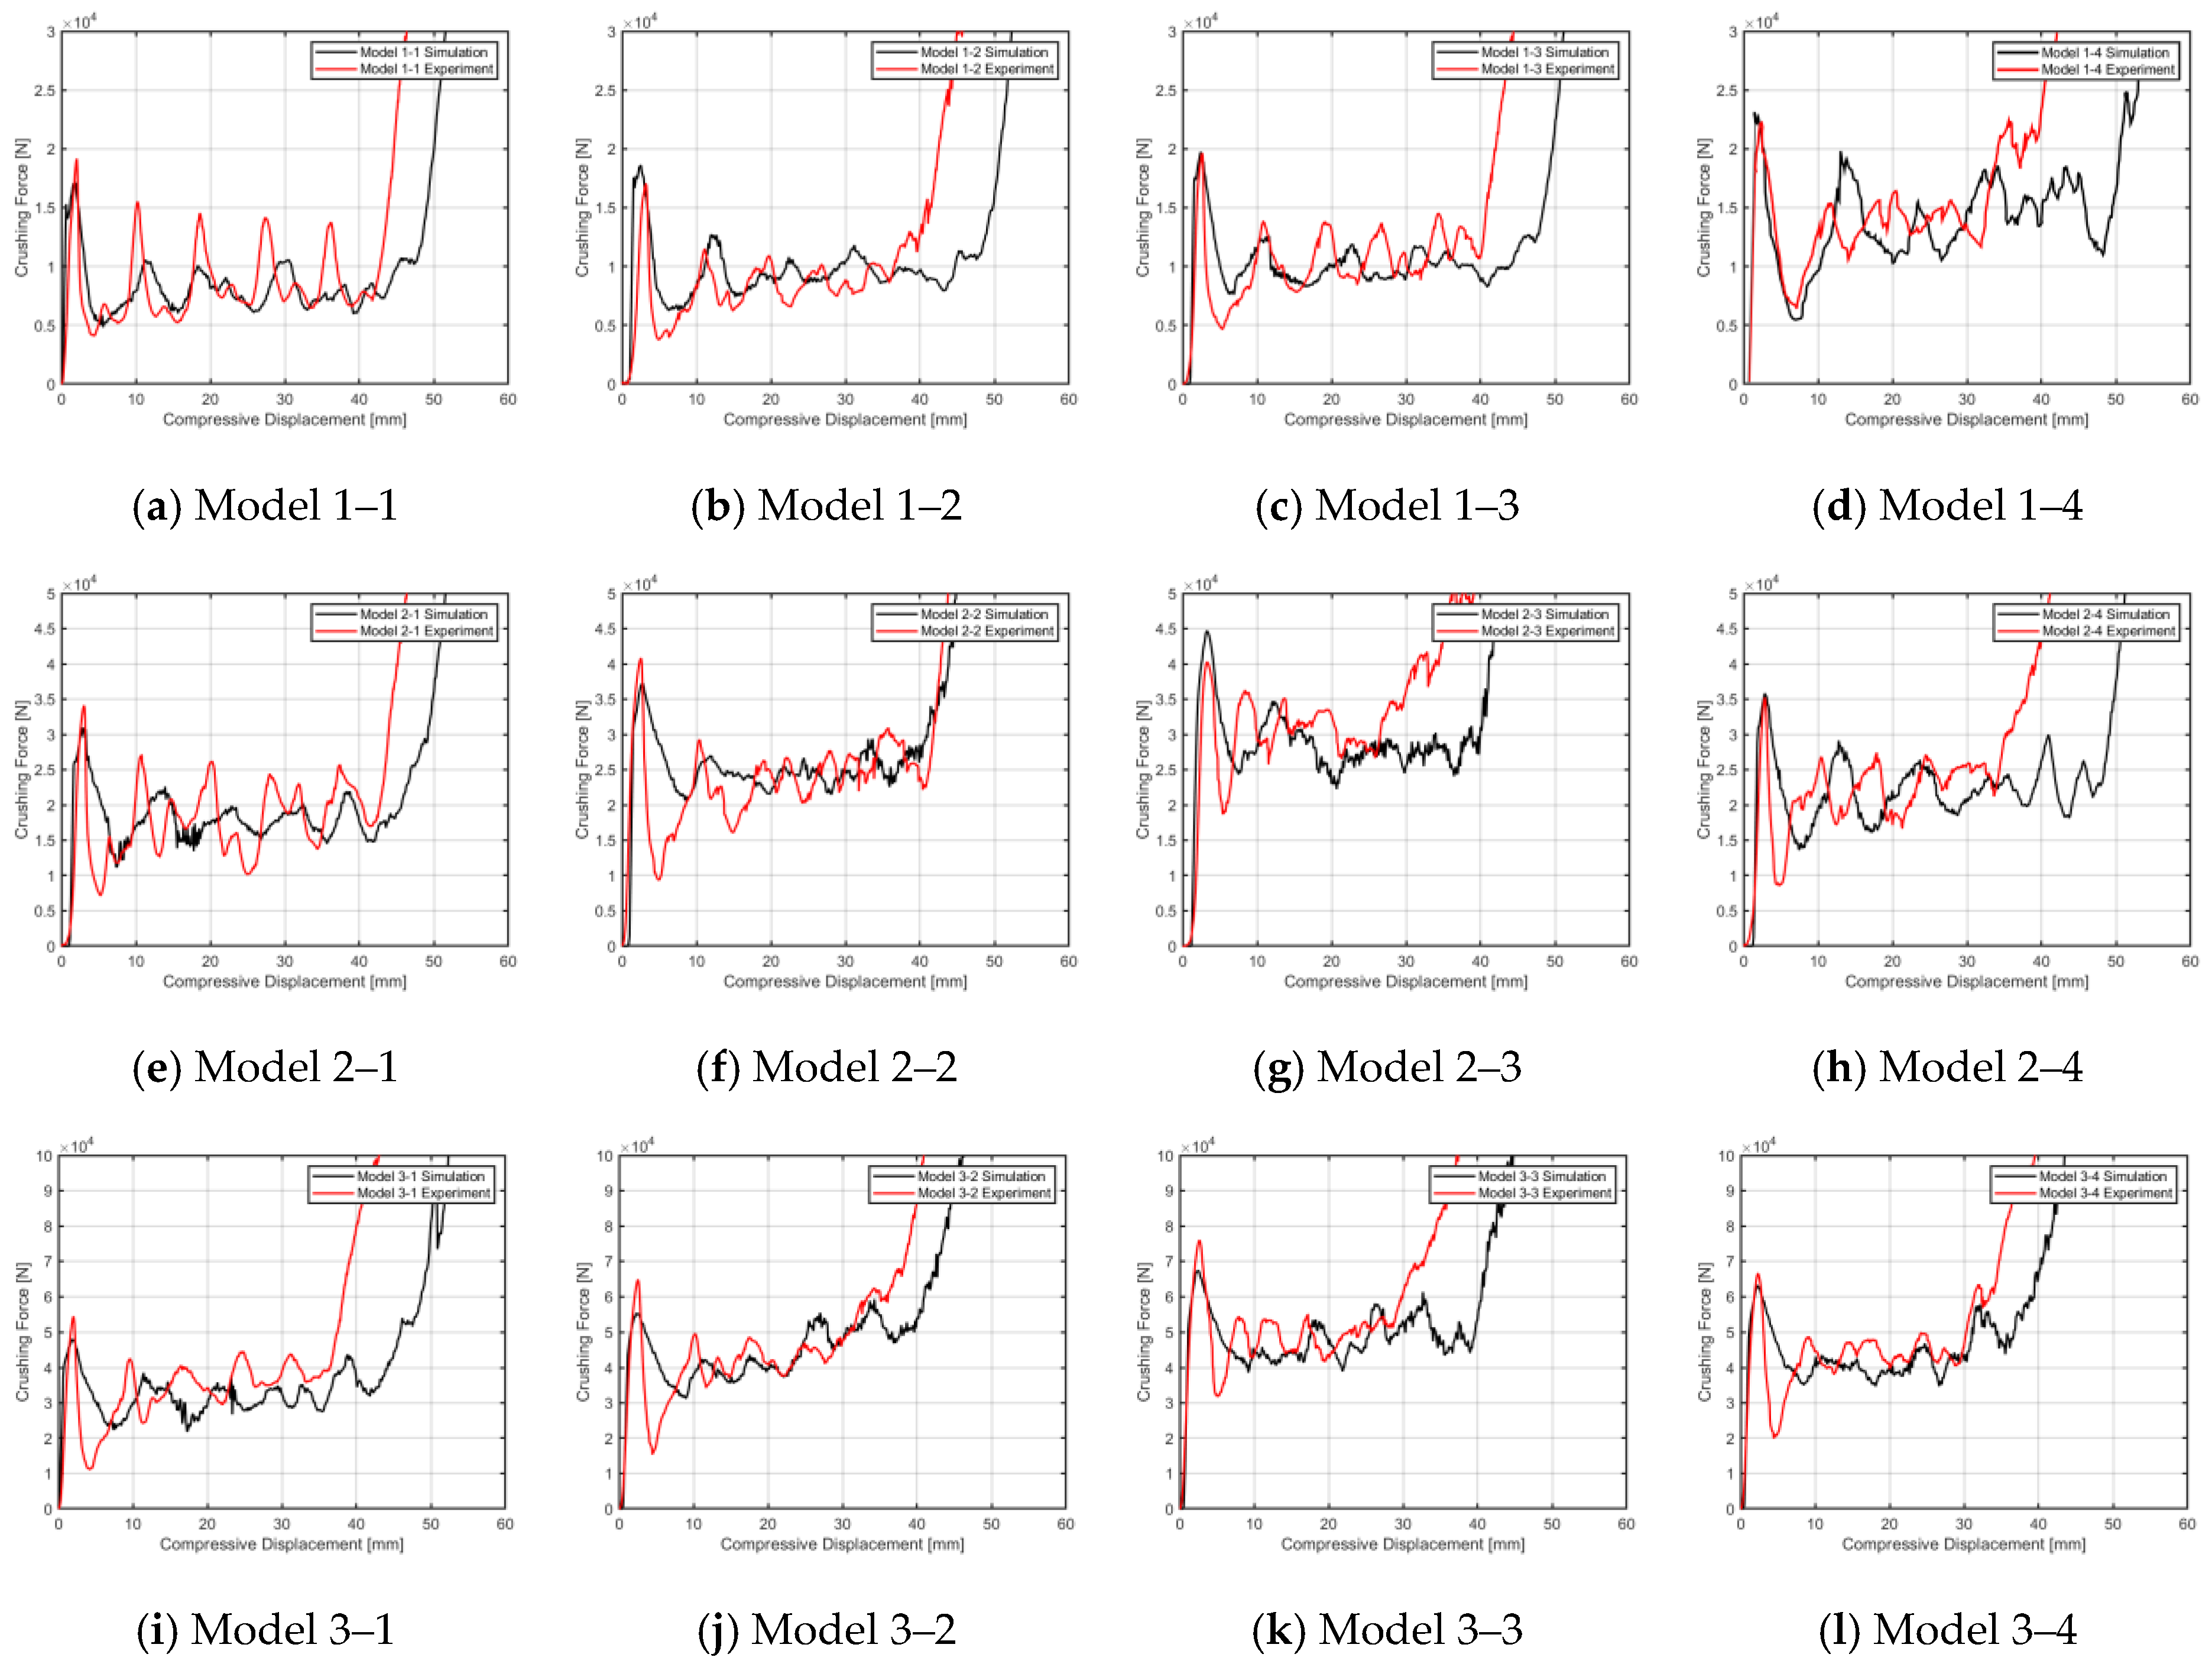
3.3. Results and Discussion
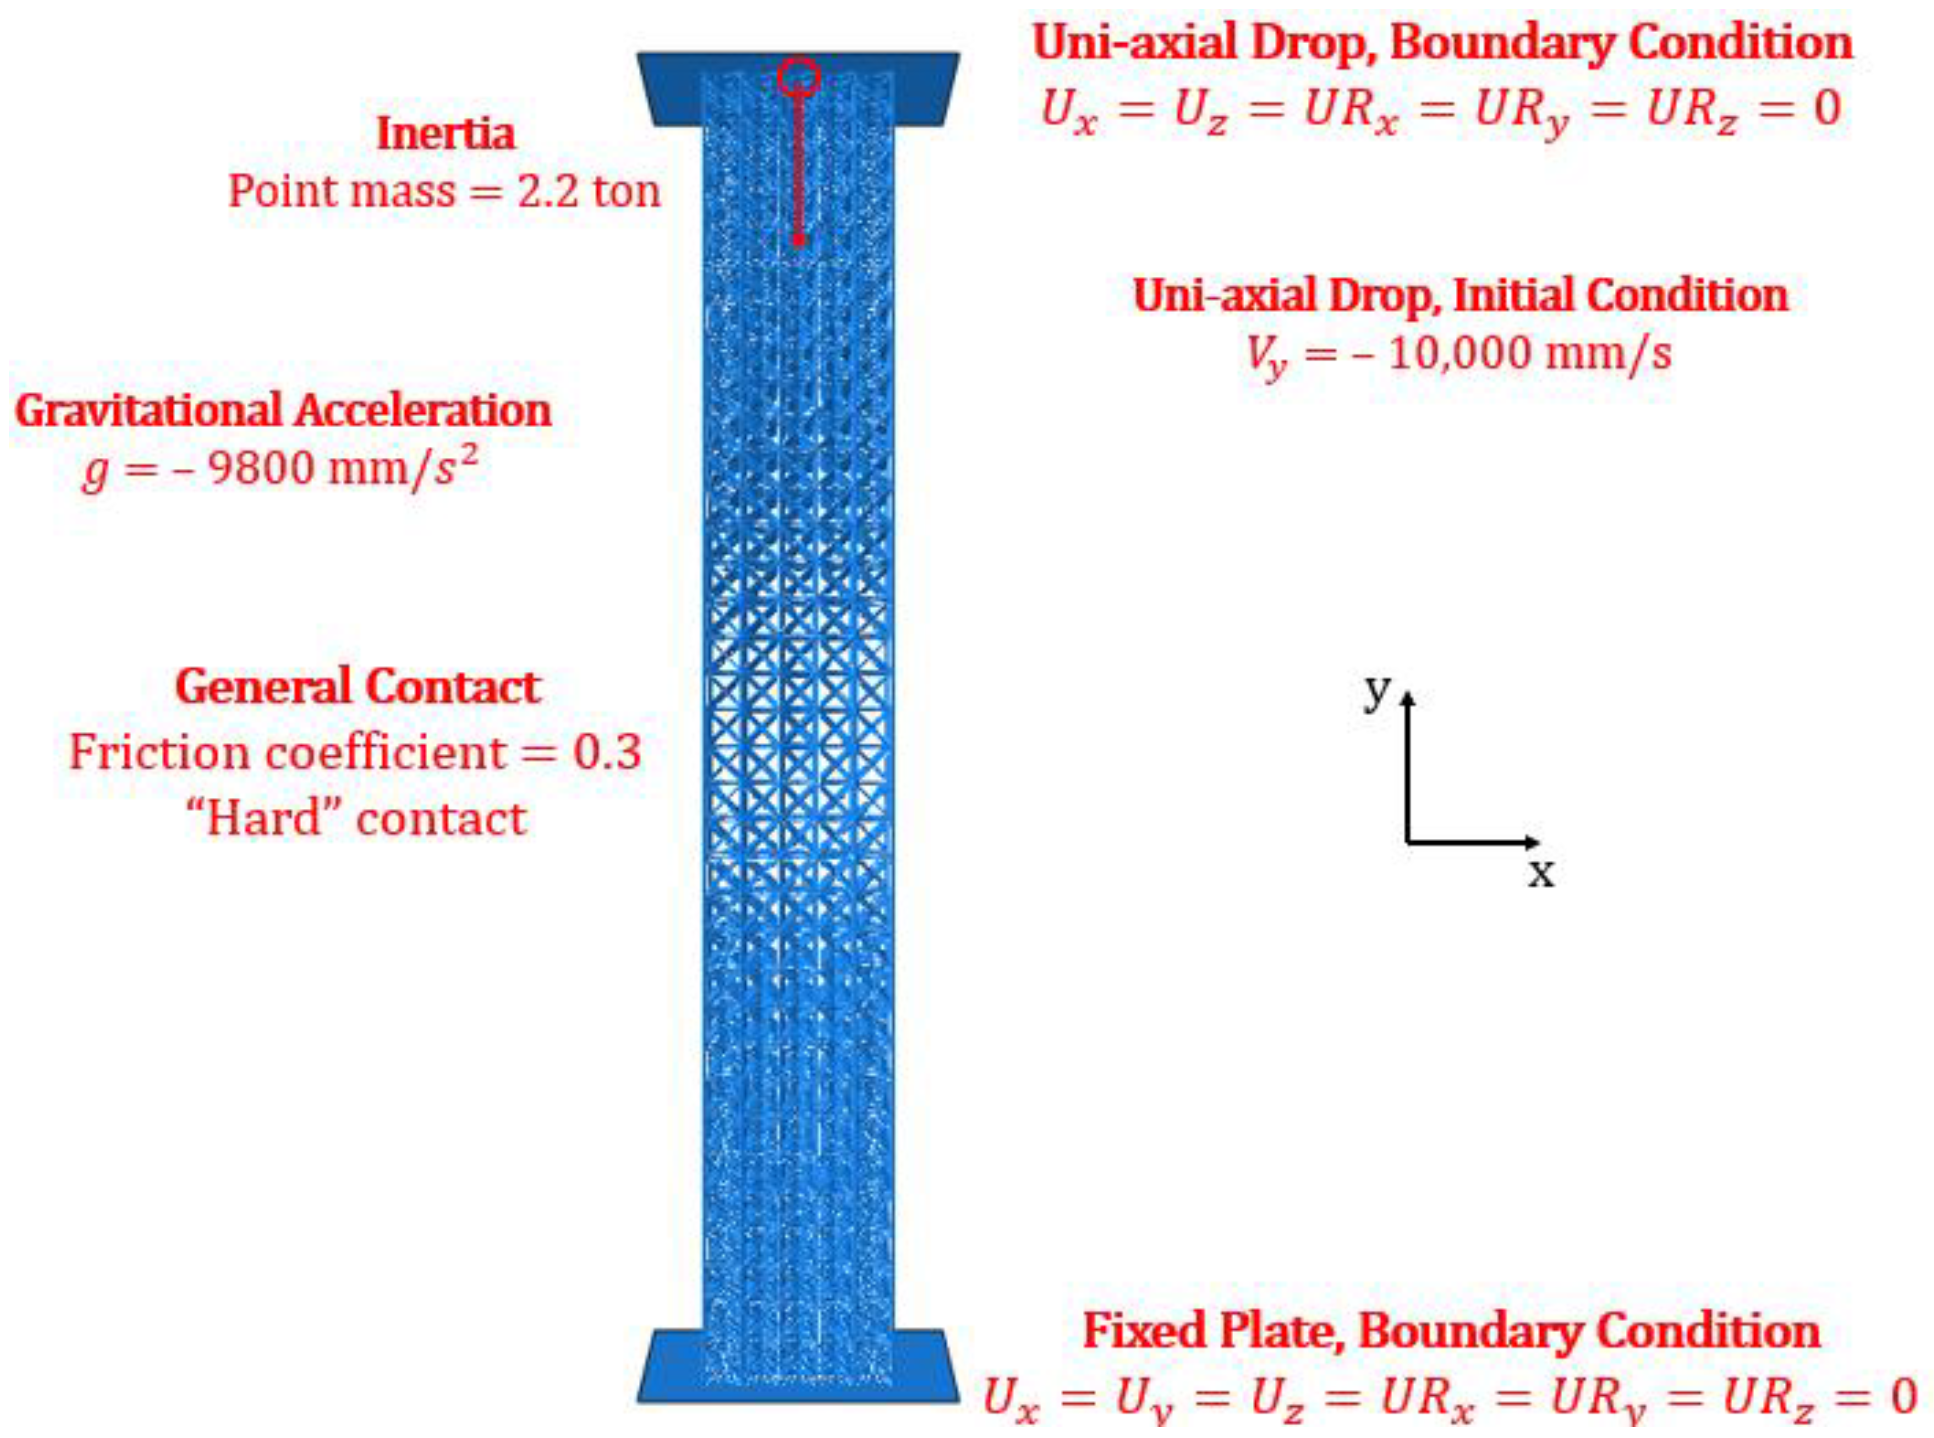
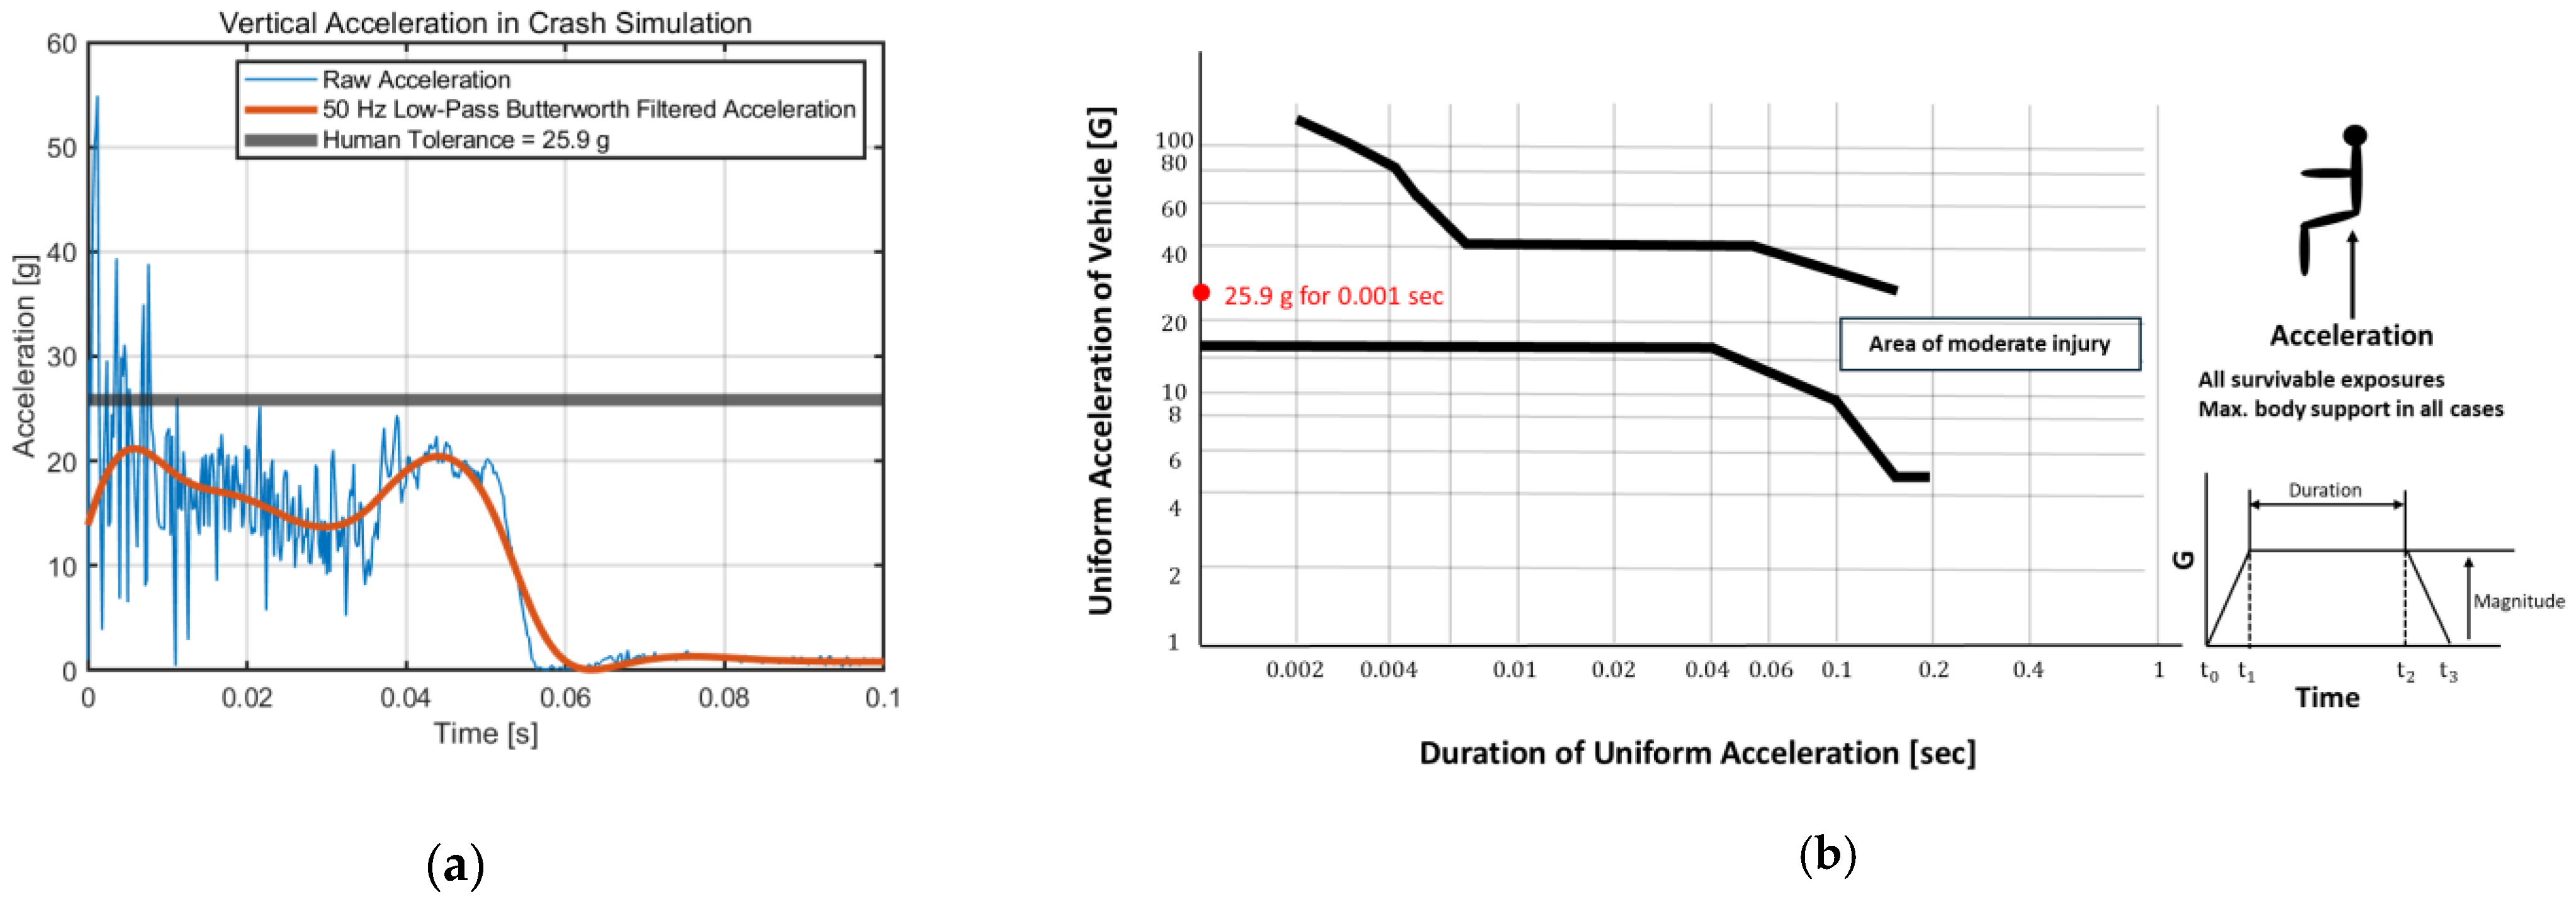
4. Vertical Drop Collision Simulation
5. Conclusions
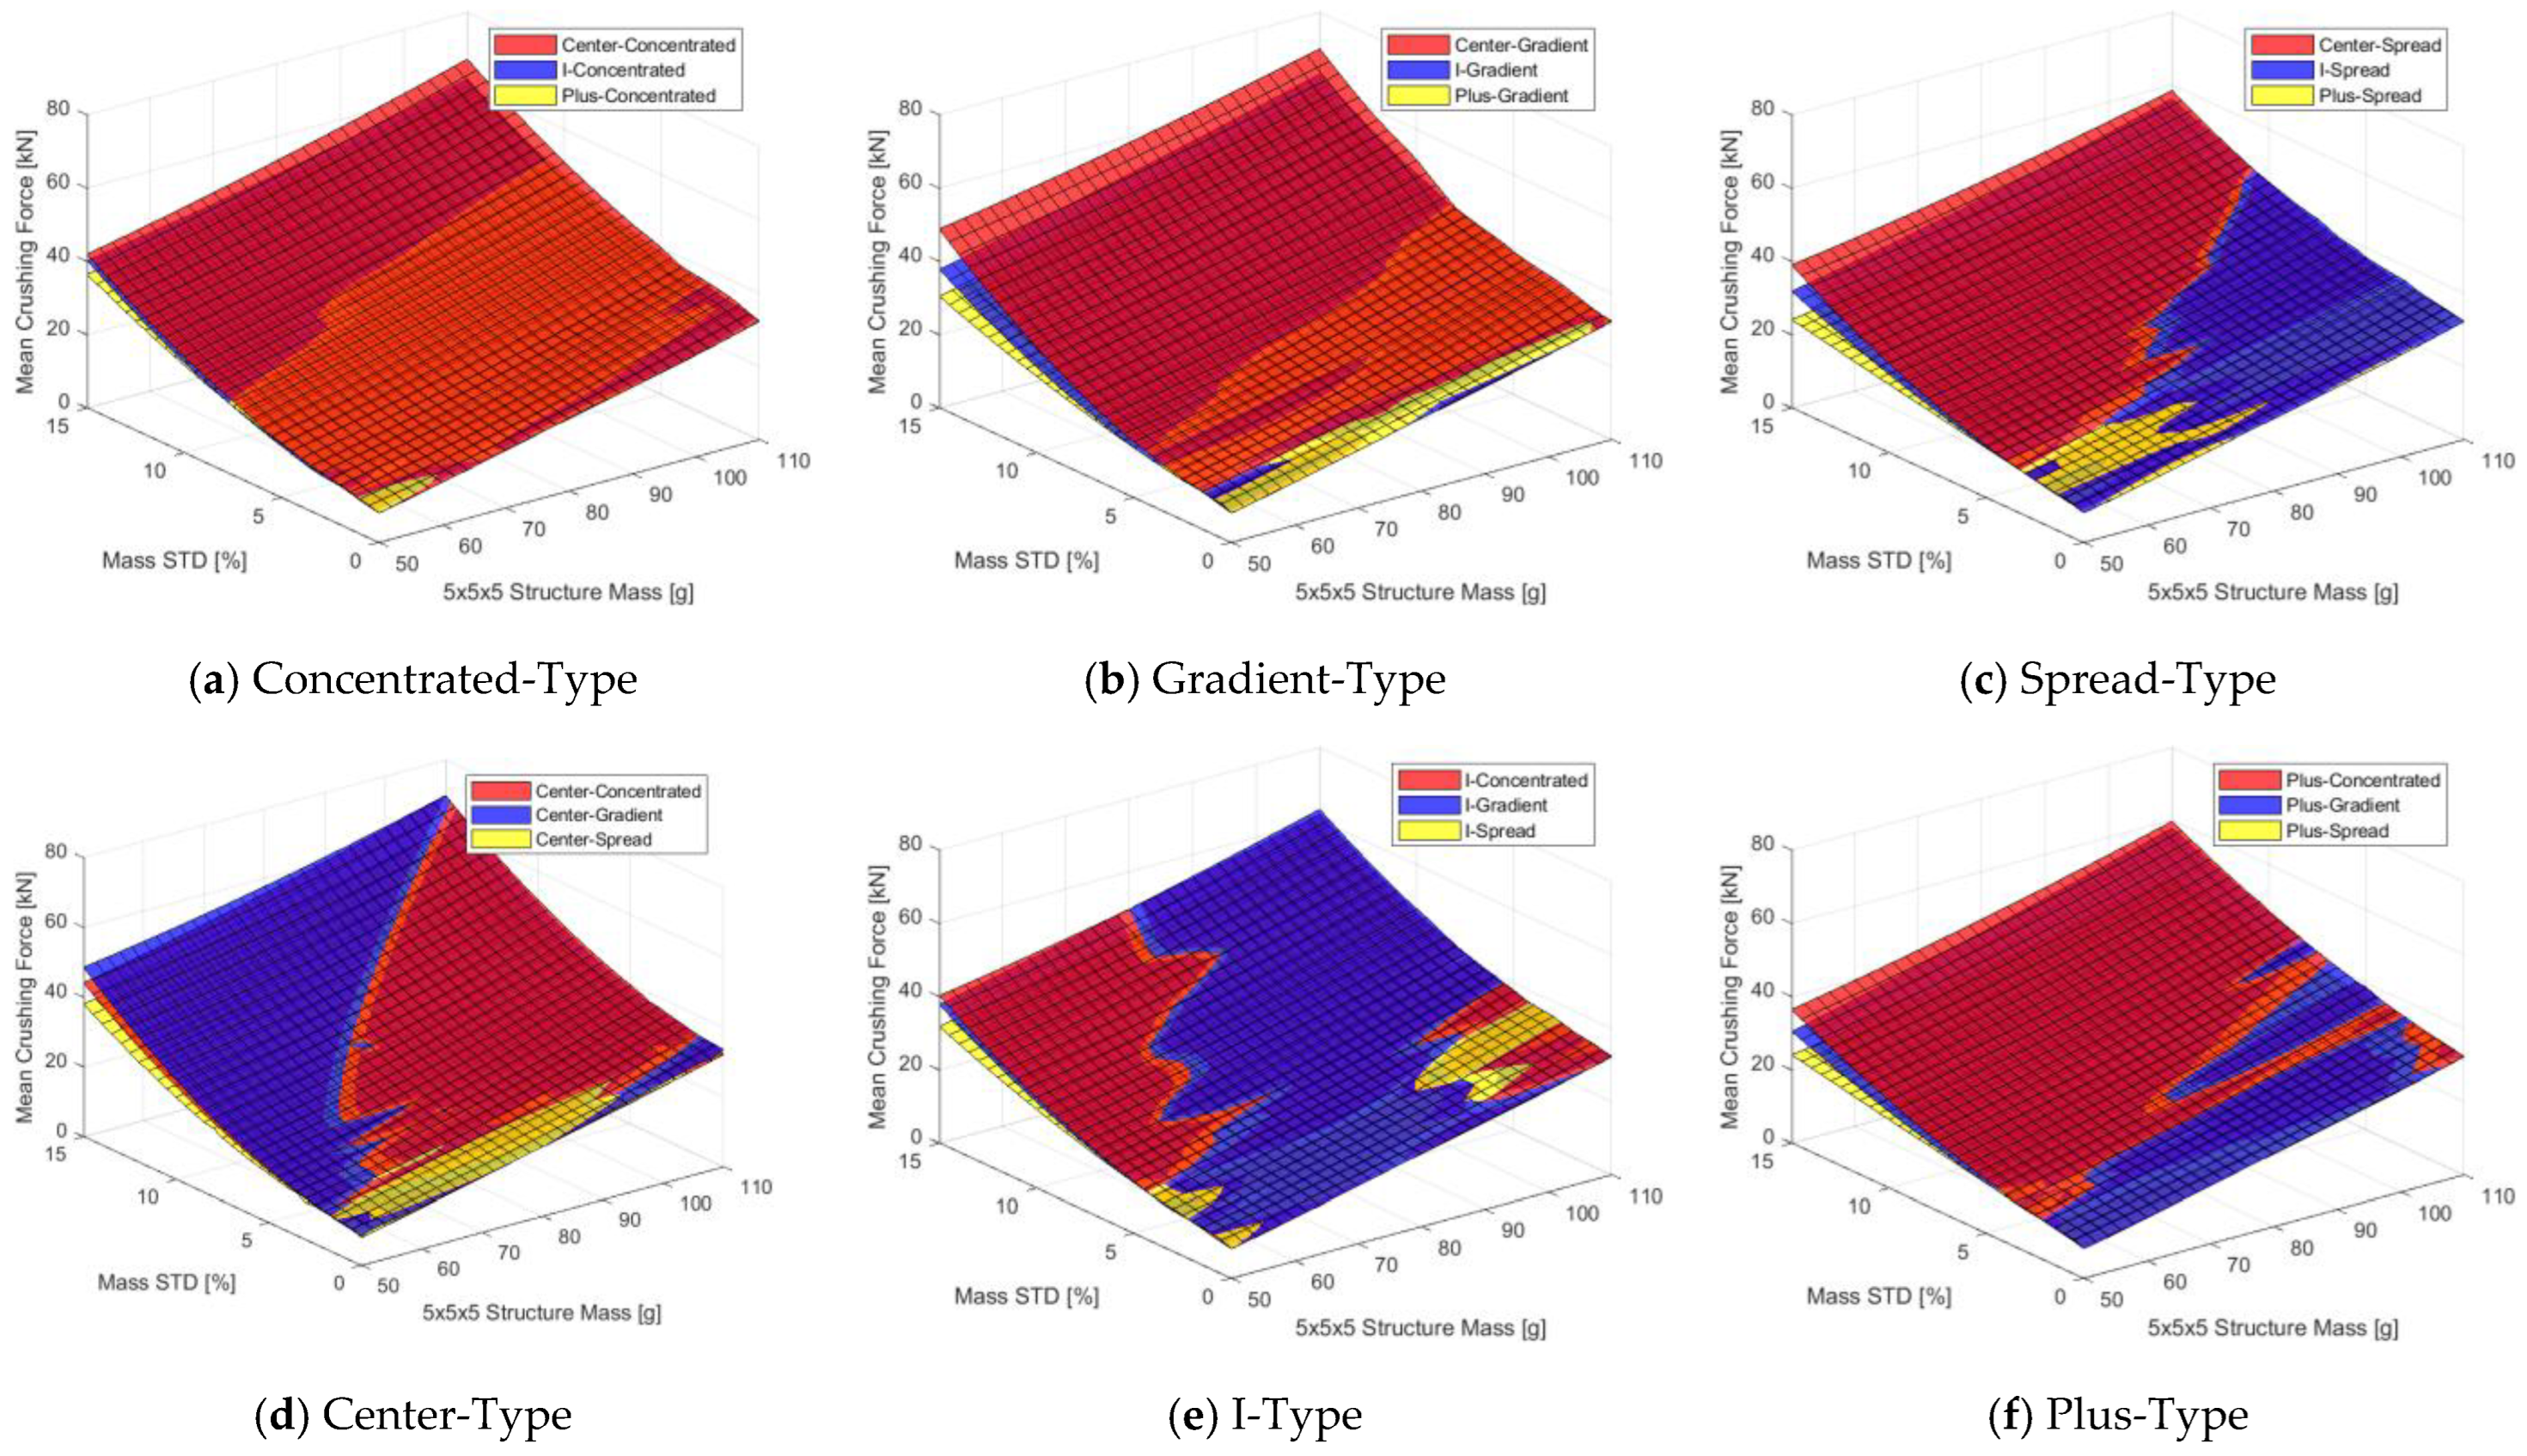
- Structures with adjusted internal density show improved performance of energy absorption compared to structures with uniform strut thickness.
- Regardless of the internal density-adjusted type, increasing the standard deviation of the mass ratio by concentrating the strut thickness in specific areas led to improved .
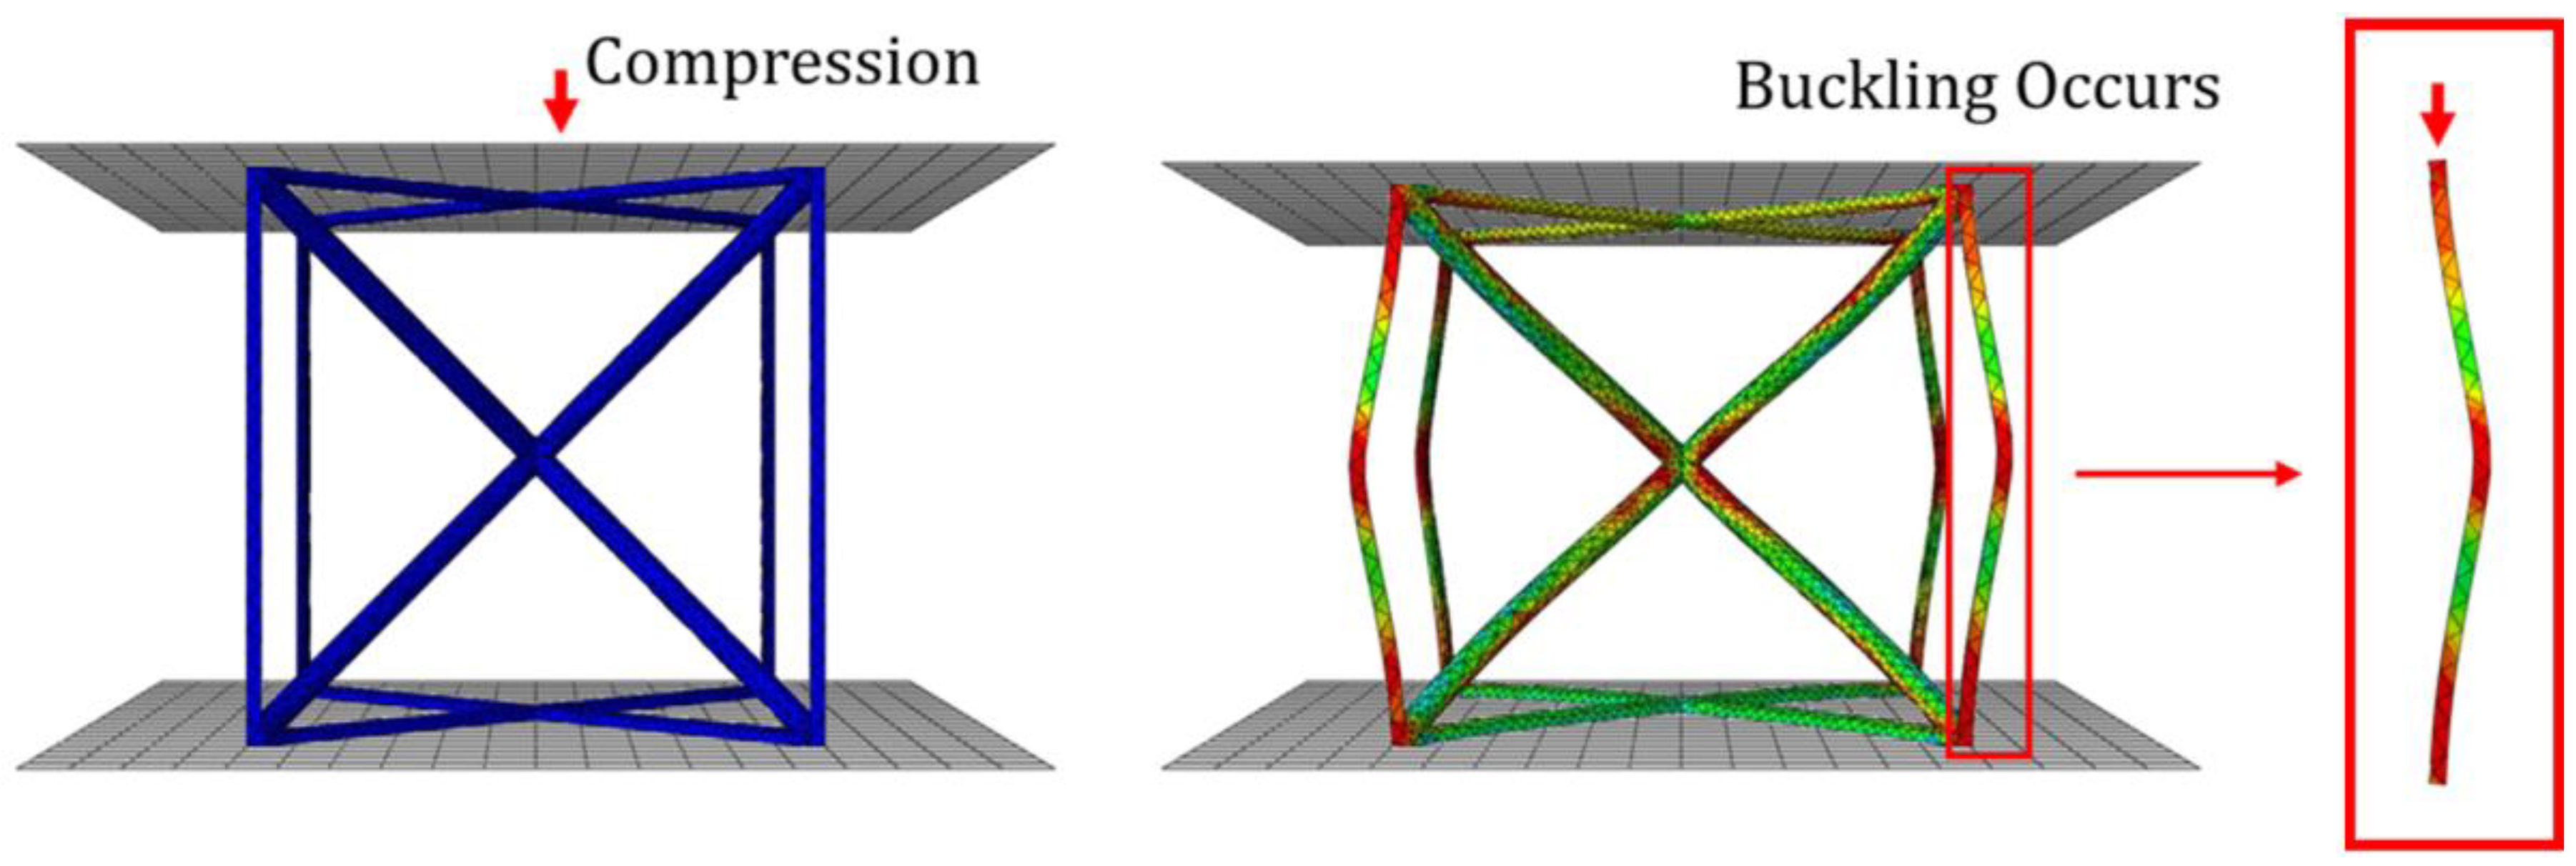
- The Concentrated- and Gradient-Types, which excessively concentrate on specific areas, exhibited similar performance, while the Spread method showed slightly lower improvements in energy absorption performance. Compared to the Concentrated-Type, the Gradient-Type is expected to allow more stable energy absorption as it distributes the strut radius more widely, reducing the likelihood of global buckling during compression.
Author Contributions
Funding
Institutional Review Board Statement
Data Availability Statement
Conflicts of Interest
Abbreviations
| AAM | Advanced Air Mobility |
| BCC | Body-Centered Cubic |
| BCCz+cross | BCC with vertical and X-shaped cross-linked horizontal auxiliary struts |
| C-Con. | Center-Concentrated Type |
| C-Gra. | Center-Gradient Type |
| CAD | Computer-Aided Design |
| DoE | Design of Experiment |
| EA | Energy Absorption |
| EBM | Electron Beam Melting |
| E.MCF | MCF calculated by the data extracted from the quasi-compression test |
| eVTOL | electric Vertical Take-Off Landing |
| FEA | Finite Element Analysis |
| FEM | Finite Element Method |
| FAA | Federal Aviation Administration |
| FFD | Full-Factorial Design |
| IDW | Inverse Distance Weighted |
| ICAO | International Civil Aviation Organization |
| LHS | Latin-Hypercube Sampling |
| MCF | Mean Crushing Force |
| M.STD | Standard Deviation of Mass Ratio |
| NASA | National Aeronautics and Space Administration |
| SLS | Selective Laser Sintering |
| STD | Standard Deviation |
| S.MCF | MCF calculated by FEA |
| Uni. | Uniform Type |
| UTM | Universal Test Machine |
References
- Guo, J.; Chen, L.; Li, L.; Na, X.; Vlacic, L.; Wang, F.-Y. Advanced Air Mobility: An Innovation for Future Diversified Transportation and Society. IEEE Trans. Intell. Veh. 2024, 9, 3106–3110. [Google Scholar] [CrossRef]
- Bridgelall, R. Aircraft Innovation Trends Enabling Advanced Air Mobility. Inventions 2024, 9, 84. [Google Scholar] [CrossRef]
- Ellis, K.; Koelling, J.; Davies, M.; Krois, P. In-Time System-Wide Safety Assurance (ISSA) Concept of Operations and Design Considerations for Urban Air Mobility (UAM); NASA Technical Report; NASA Langley Research Center: Hampton, VA, USA, 2020. [Google Scholar]
- Laarmann, L.; Thoma, A.; Misch, P.; Koppel, T.; Schumann, H.; Hornung, M. Automotive Safety Approach for Future eVTOL Vehicles. CEAS Aeronaut. J. 2023, 14, 369–379. [Google Scholar] [CrossRef]
- U.S. Army Research and Technology Laboratories (AVRADCOM). Aircraft Crash Survival Design Guide; Report No. USARTL-TR-79-22A; U.S. Army Research and Technology Laboratories: Fort Eustis, VA, USA, 1979. [Google Scholar]
- U.S. Army Research and Technology Laboratories (AVRADCOM). Aircraft Crash Survival Design Guide; Report No. USARTL-TR-79-22B; U.S. Army Research and Technology Laboratories: Fort Eustis, VA, USA, 1979. [Google Scholar]
- U.S. Department of Defense. Military Standard: Aircraft Crash Survival Design Guide; MIL-STD-1290A; U.S. Department of Defense: Washington, DC, USA, 1989.
- Federal Aviation Administration. Federal Aviation Regulations: Emergency Landing Dynamic Conditions; FAR Part 23.562; Federal Aviation Administration: Washington, DC, USA, 2011.
- Federal Aviation Administration. Federal Aviation Regulations: Emergency Landing Dynamic Conditions; FAR Part 27.562; Federal Aviation Administration: Washington, DC, USA, 2024.
- Bai, Y.; Xiong, J.; Jin, L.; Tian, Q. Sandwich Structures for Energy Absorption Applications: A Review. Materials 2021, 14, 4731. [Google Scholar] [CrossRef]
- Yin, X.; Jiang, Y.; Huang, Z.; Guo, X.; Zhao, Y.; Feng, Y. Research on a Honeycomb Structure for Pyroshock Isolation at the Spacecraft–Rocket Interface. Aerospace 2024, 11, 756. [Google Scholar] [CrossRef]
- Schaedler, T.A.; Jacobsen, A.J.; Torrents, A.; Sorensen, A.E.; Lian, J.; Greer, J.R.; Valdevit, L.; Carter, W.B. Ultralight Metallic Microlattices. Science 2023, 334, 123–135. [Google Scholar] [CrossRef]
- Cho, J.; Kim, E.; Kim, J.H.; Lee, C.-Y.; Cho, J.Y. Enhancement of Energy Absorption Capability of 3D Printed Ti-6Al-4V BCC Lattice Structures by Adding Auxiliary Struts. Materials 2025, 18, 732. [Google Scholar] [CrossRef]
- Maskery, I.; Hussey, A.; Panesar, A.; Aremu, A.; Tuck, C.; Ashcroft, I.; Hague, R. An Investigation into Reinforced and Functionally Graded Lattice Structures. J. Cell. Plast. 2017, 53, 151–165. [Google Scholar] [CrossRef]
- Mostafa, K.; Momesso, G.; Li, X.; Nobes, D.; Qureshi, A.J. Dual Graded Lattice Structures: Generation Framework and Mechanical Properties Characterization. Polymers 2021, 13, 2204. [Google Scholar] [CrossRef]
- Sanchaniya, J.V.; Lasenko, I.; Gobins, V.; Kobeissi, A.; Goljandin, D. A Finite Element Method for Determining the Mechanical Properties of Electrospun Nanofibrous Mats. Polymers 2024, 16, 852. [Google Scholar] [CrossRef]
- Duddeck, F.; Zimmer, H. Metamodel-Based Design Optimization–A Multidisciplinary Approach for Automotive Structures. In Proceedings of the FISITA 2012 World Automotive Congress, Beijing, China, 27–30 November 2012; Springer: Berlin/Heidelberg, Germany, 2013; pp. 1225–1237. [Google Scholar]
- Box, G.E.P.; Wilson, K.B. On the Experimental Attainment of Optimum Conditions. J. R. Stat. Soc. Ser. B 1951, 13, 1–38. [Google Scholar] [CrossRef]
- Czado, C.; Schepsmeier, U.; Lichtenstern, A. Kriging Methods in Spatial Statistics; Technical University of Munich: Munich, Germany, 2013. [Google Scholar]
- Zhang, L.C.; Liu, Y.; Li, S.; Hao, Y. Additive Manufacturing of Titanium Alloys by Electron Beam Melting: A Review. Adv. Eng. Mater. 2018, 20, 1700842. [Google Scholar] [CrossRef]
- Gibson, L.J.; Ashby, M.F. Cellular Solids: Structure and Properties; Cambridge University Press: Cambridge, UK, 1997. [Google Scholar]
- Society of Automotive Engineers. Performance Standard for Seats in Civil Rotorcraft, Transport Aircraft, and General Aviation Aircraft; SAE AS8049 Rev B; SAE International: Warrendale, PA, USA, 2005. [Google Scholar]
- Littell, J.; Putnam, J.; Annett, M.; Bark, L.; Jackson, K.; Fasanella, E. A Summary of Test Results from a NASA Lift + Cruise eVTOL Crash Test; NASA Technical Memorandum; NASA Langley Research Center: Hampton, VA, USA, 2023. [Google Scholar]
- Eiband, A.M. Human Tolerance to Rapidly Applied Accelerations: A Summary of the Literature; NASA Memorandum 5-19-59E; National Aeronautics and Space Administration: Washington, DC, USA, 1959. [Google Scholar]
- Kokil-Shah, S.; Sur, A.; Darvekar, S.; Shah, M. Recent Advancements of Micro-Lattice Structures: Applications, Manufacturing Methods, Mechanical Properties, Topologies and Challenges. Arab. J. Sci. Eng. 2021, 46, 204–220. [Google Scholar] [CrossRef]
- Kamaraj, L.; Sudhan, P.H.S.; Bright, R.; Kannan, S.; Khalkar, V.; Sundaraiah, N. Quasi-static Compression Behavior and Crashworthiness of GLARE Laminate Conical Frustum with Progressive Circular and Square Cut-outs. Polym. Compos. 2023, 44, 3685–3697. [Google Scholar] [CrossRef]
- Tao, C.; Wang, Z.; Liu, Z.; Wang, Y.; Zhou, X.; Liang, X.; Li, H. Crashworthiness of Additively Manufactured Lattice Reinforced Thin-Walled Tube Hybrid Structures. Aerospace 2023, 10, 524. [Google Scholar] [CrossRef]
- Jerath, S. Structural Stability Theory and Practice: Buckling of Columns, Beams, Plates, and Shells; Wiley: Hoboken, NJ, USA, 2020. [Google Scholar]
- Xu, Y. Research on Interpolation and Data Fitting: Basis and Applications. arXiv 2022, arXiv:2208.11825. [Google Scholar]
- Alwattar, T.; Mian, A. Development of an Elastic Material Model for BCC Lattice Cell Structures Using Finite Element Analysis and Neural Networks Approaches. J. Compos. Sci. 2019, 3, 33. [Google Scholar] [CrossRef]
- Ghoddousi, S.; Mohammadnejad, M.; Safarabadi, M.; Haghighi-Yazdi, M. Compression Response of Nature-Inspired Metamaterials Based on Fibonacci Spiral. Int. J. Mech. Sci. 2025, 285, 109853. [Google Scholar] [CrossRef]
- Airy, G.B. On the Algebraical and Numerical Theory of Errors of Observations and the Combination of Observations; Macmillan and Co.: London, UK, 1861. [Google Scholar]
- Lei, H.; Li, C.; Meng, J.; Zhou, H.; Liu, Y.; Zhang, X.; Wang, P.; Fang, D. Evaluation of compressive properties of SLM-fabricated multi-layer lattice structures by experimental test and μ-CT-based finite element analysis. Mater. Des. 2019, 169, 107685. [Google Scholar] [CrossRef]
- Tang, B. Orthogonal Array-Based Latin Hypercubes. J. Am. Stat. Assoc. 1993, 88, 1392–1397. [Google Scholar] [CrossRef]
- Sagar, B.S.D.; Cheng, Q.; Agterberg, F. (Eds.) Handbook of Mathematical Geosciences: Fifty Years of IAMG; Springer: Cham, Switzerland, 2018; ISBN 978-3-319-78999-6. [Google Scholar]
- Navi, N.U.; Tenenbaum, J.; Sabatani, E.; Kimmel, G.; David, R.B.; Rosen, B.A.; Barkay, Z.; Ezersky, V.; Tiferet, E.; Ganor, Y.I.; et al. Hydrogen effects on electrochemically charged additive manufactured by electron beam melting (EBM) and wrought Ti–6Al–4V alloys. Int. J. Hydrog. Energy 2020, 45, 25523–25540. [Google Scholar] [CrossRef]
- Zhang, H.; Lu, D.; Pei, Y.; Chen, T.; Zou, T.; Wang, T.; Wang, X.; Liu, Y.; Wang, Q. Tensile behavior, microstructural evolution, and deformation mechanisms of a high Nb-TiAl alloy additively manufactured by electron beam melting. Mater. Des. 2022, 225, 111503. [Google Scholar] [CrossRef]
- Camacho-García, A.; Llinares, R.; Lucas-Cuevas, A.G.; Pérez-Soriano, P. Influence of Accelerometer Signal Filtering on Automatic Detection of Gait Impact Parameters. Int. J. Adv. Digit. Signal Process. 2016, 3, 19–22. [Google Scholar]
- Fasanella, E.L.; Jackson, K.E. Best Practices for Crash Modeling and Simulation; NASA/TM—2002-211944; National Aeronautics and Space Administration: Washington, DC, USA, 2002. [Google Scholar]
- Selesnick, I.W.; Burrus, C.S. Generalized Digital Butterworth Filter Design. IEEE Trans. Signal Process. 1998, 46, 1688–1694. [Google Scholar] [CrossRef]


| Dynamic Test Conditions for Cockpit Seats | |
|---|---|
| Minimum Velocity [m/s] | 9.14 |
| Maximum [s] | 0.031 |
| [G] | 30 |
| Horizontal–Vertical Drop Test Condition | Part 23.562 -Utility Airplane | Part 27.562 -Normal Rotorcraft | NASA eVTOL Crash Test |
|---|---|---|---|
| Test velocity [ft/s] | 31 | 30 | 31.4 |
| Seat Pitch Angle [°] | 60 | 60 | . |
| Seat Yaw Angle [°] | 0 | 0 | . |
| Minimum Acceleration [G] | 19/15 | 30 | . |
| Time to Peak [s] | 0.05/0.06 | 0.031 | . |
| Floor Deformation [°] | None | 10 Pitch/10 Roll | . |
| Type | Strut Radius |
|---|---|
| Concentrated | Area 1 > Area 2 = Area 3 |
| Gradient | Area 1 > Area 2 > Area 3 |
| Spread | Area 1 = Area 2 > Area 3 |
| No. | Radius [mm] | Mass [g] | Mass Ratio STD [%] | Manufacturability |
|---|---|---|---|---|
| 1 | 0.625/0.625/0.625 | 76.59 | 0 | Acceptable |
| 2 | 0.4/0.8604/1.3208 | 76.59 | 6.78 | Acceptable |
| 3 | 0.34/0.8996/1.4592 | 76.59 | 8.23 | Acceptable |
| 4 | 0.25/0.9440/1.6380 | 76.59 | 10.06 | Unacceptable |
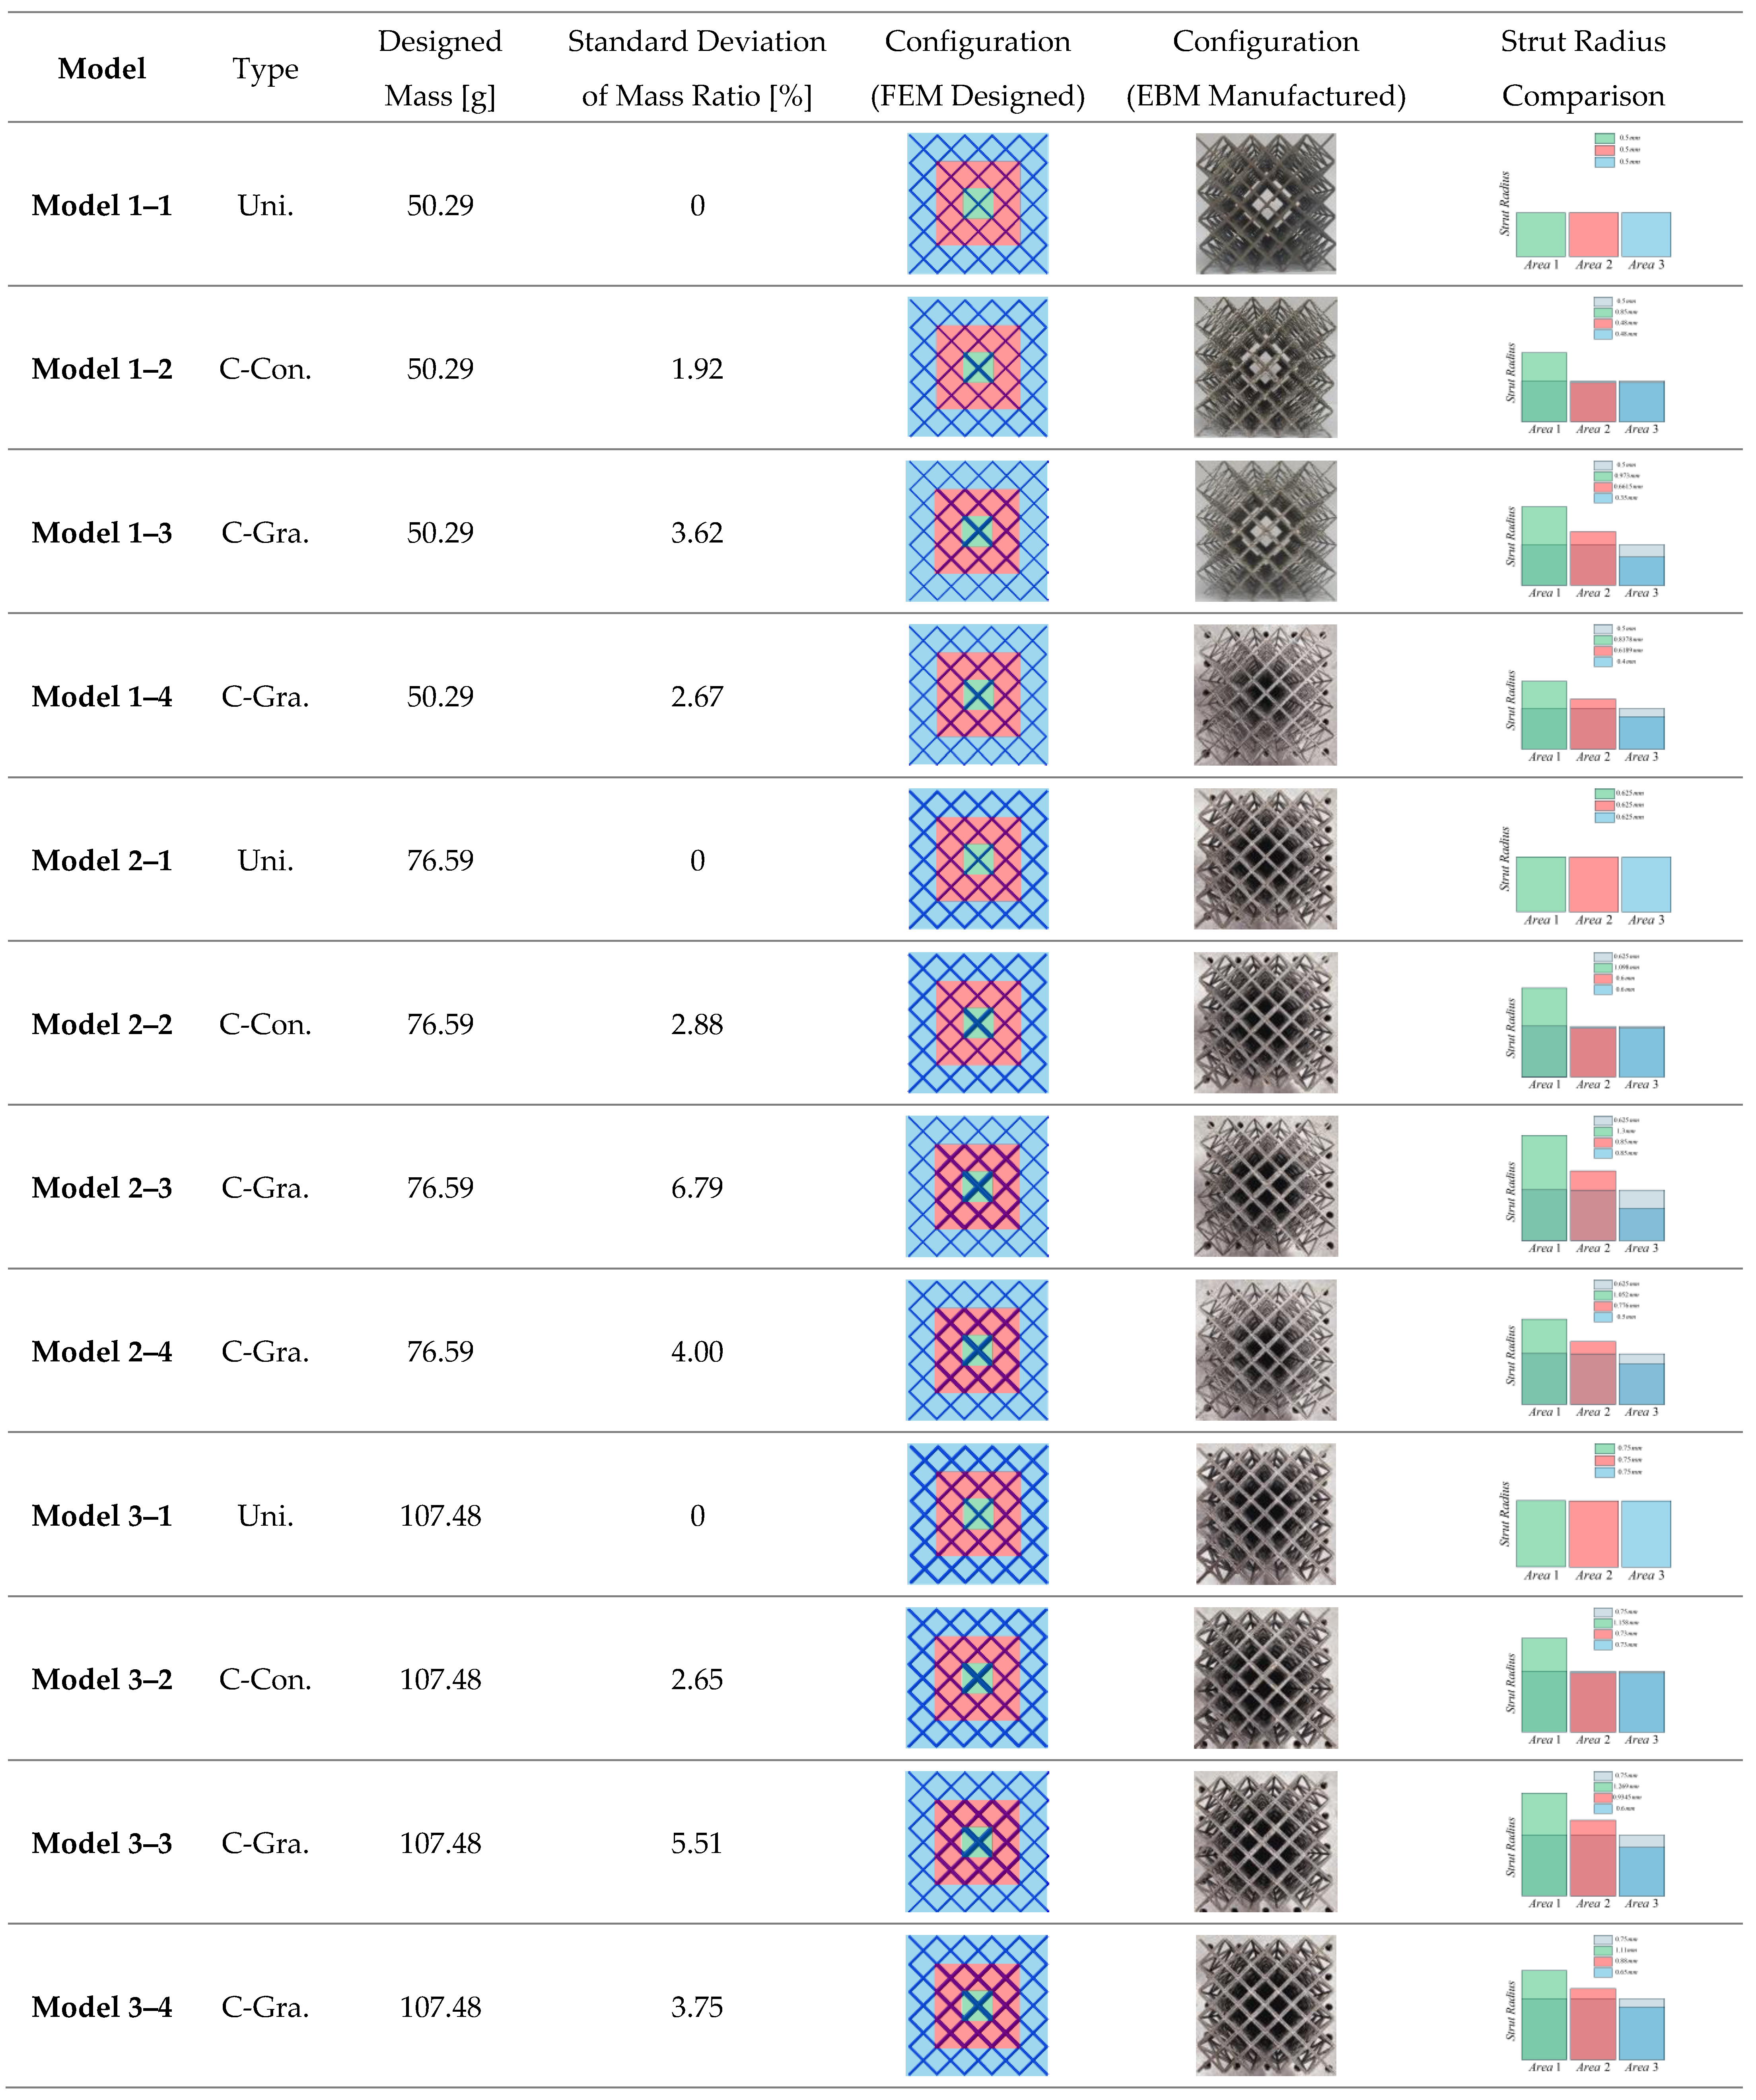
| Model | Model 1–1 | Model 1–2 | Model 1–3 | Model 1–4 |
|---|---|---|---|---|
| Type | Uni. | C-Con | C-Gra. | C-Gra. |
| M.STD [%] | 0 | 1.92 | 3.62 | 2.67 |
| S.MCF [N] | 8.17 × 10³ | 9.51 × 10³ | 1.20 × 10⁴ | 1.04 × 10⁴ |
| E.MCF [N] | 8.27 × 10³ | 8.44 × 10³ | 1.30 × 10⁴ | 1.01 × 10⁴ |
| Error [%] | 1.2 | −11.2 | 8.3 | −2.9 |
| Model | Model 2–1 | Model 2–2 | Model 2–3 | Model 2–4 |
|---|---|---|---|---|
| Type | Uni. | C-Con. | C-Gra. | C-Gra. |
| M.STD [%] | 0 | 2.88 | 6.79 | 4.00 |
| S.MCF [N] | 1.85 × 10⁴ | 2.52 × 10⁴ | 2.87 × 10⁴ | 2.20 × 10⁴ |
| E.MCF [N] | 1.75 × 10⁴ | 2.31 × 10⁴ | 3.03 × 10⁴ | 2.15 × 10⁴ |
| Error [%] | −5.4 | −7.9 | 5.5 | −2.3 |
| Model | Model 3–1 | Model 3–2 | Model 3–3 | Model 3–4 |
|---|---|---|---|---|
| Type | Uni. | C-Con | C-Gra. | C-Gra. |
| M.STD [%] | 0 | 2.65 | 5.51 | 3.75 |
| S.MCF [N] | 3.10 × 10⁴ | 4.38 × 10⁴ | 4.78 × 10⁴ | 4.40 × 10⁴ |
| E.MCF [N] | 3.33 × 10⁴ | 4.26 × 10⁴ | 5.01 × 10⁴ | 4.32 × 10⁴ |
| Error [%] | 7.4 | −2.7 | 4.8 | −1.8 |
Disclaimer/Publisher’s Note: The statements, opinions and data contained in all publications are solely those of the individual author(s) and contributor(s) and not of MDPI and/or the editor(s). MDPI and/or the editor(s) disclaim responsibility for any injury to people or property resulting from any ideas, methods, instructions or products referred to in the content. |
© 2025 by the authors. Licensee MDPI, Basel, Switzerland. This article is an open access article distributed under the terms and conditions of the Creative Commons Attribution (CC BY) license (https://creativecommons.org/licenses/by/4.0/).
Share and Cite
Cho, J.; Lee, E.S.; Kim, J.H.; Lee, C.-Y.; Cho, J.Y. Design of Lattice-Based Energy-Absorbing Structure for Enhancing the Crashworthiness of Advanced Air Mobility. Aerospace 2025, 12, 332. https://doi.org/10.3390/aerospace12040332
Cho J, Lee ES, Kim JH, Lee C-Y, Cho JY. Design of Lattice-Based Energy-Absorbing Structure for Enhancing the Crashworthiness of Advanced Air Mobility. Aerospace. 2025; 12(4):332. https://doi.org/10.3390/aerospace12040332
Chicago/Turabian StyleCho, Jaryong, Eun Suk Lee, Jeong Ho Kim, Chang-Yull Lee, and Jin Yeon Cho. 2025. "Design of Lattice-Based Energy-Absorbing Structure for Enhancing the Crashworthiness of Advanced Air Mobility" Aerospace 12, no. 4: 332. https://doi.org/10.3390/aerospace12040332
APA StyleCho, J., Lee, E. S., Kim, J. H., Lee, C.-Y., & Cho, J. Y. (2025). Design of Lattice-Based Energy-Absorbing Structure for Enhancing the Crashworthiness of Advanced Air Mobility. Aerospace, 12(4), 332. https://doi.org/10.3390/aerospace12040332