Article

Numerical Analysis of the Effect of S-Shaped Duct Key Geometry Parameters on the Inlet Distortion of Distributed Ducted Fans

by
Wei Jia
1,*,
Guanghui Li
1,
Tao Liu
2,
Qingguo Kong
2 and
Shuiting Ding
1
1
College of Safety Science and Engineering, Civil Aviation University of China, Tianjin 300300, China
2
Sino-European Institute of Aviation Engineering, Civil Aviation University of China, Tianjin 300300, China
*
Author to whom correspondence should be addressed.
Aerospace 2025, 12(4), 316; https://doi.org/10.3390/aerospace12040316
Submission received: 17 February 2025 / Revised: 17 March 2025 / Accepted: 2 April 2025 / Published: 7 April 2025
(This article belongs to the Section Aeronautics)

Abstract

:
Distributed propulsion systems are strategically placed along the aircraft wingspan to ingest the fuselage boundary layer, thereby enhancing propulsion efficiency. However, the aerodynamic effects of S-shaped duct geometry on a distributed propulsion system are not fully understood. The impact of the S-shaped duct inlet aspect ratio and centerline offset on the inlet distortion of ducted fans was numerically investigated using a method based on the circumferential body force model. The results show that the most severe inlet distortion occurs when a large centerline offset is combined with a small aspect ratio. For an S-shaped duct with a substantial centerline offset, increasing the aspect ratio mitigates the distortion level in the edge fans. Specifically, increasing the aspect ratio from 6 to 10 reduces the total pressure and swirl distortion index in the edge fan by up to 80.1% and 84.2%, respectively. In an S-shaped duct with a small aspect ratio, decreasing the centerline offset from 1.75 times to 0.75 times the ducted fan diameter lowers the total pressure and swirl distortion index in the edge fan by up to 75.2% and 87.5%, respectively. These insights provide valuable information for the integrated design and optimization of the S-shaped duct in distributed propulsion systems.

1. Introduction

With the continuous improvement in environmental protection requirements for modern civil aircraft, it is difficult for the traditional tube-and-wing layout of aircraft to satisfy future requirements. Research projects explored various unconventional designs for civil aircraft, including the blended wing body (BWB) configurations [1,2,3,4]. In the BWB layout, the wings and fuselage are highly integrated and the aircraft has a full-lift surface profile [5]. The frictional resistance of a BWB aircraft is decreased by reducing the wetted area of the aircraft [6,7]. Compared with the conventional configuration, the cruising efficiency of the BWB layout aircraft is increased by 15–20%, which has potential advantages in noise, emission, and structural weight reduction [8,9]. Therefore, the blended wing body configuration represents a significant avenue for future development in subsonic civil aviation.
A BWB aircraft can be compatible with different configurations of propulsion systems, such as podded and embedded propulsion systems. The National Aeronautics and Space Administration (NASA) introduced a conceptual aircraft design known as “N3-X” [10], which seamlessly combines the BWB configuration with a distributed electric propulsion (DEP) system. This innovative approach demonstrates a high level of integration between these two advanced technologies. One key feature of the DEP system is the separation of the power generation and thrust generation components. This configuration allows for a more flexible arrangement and an increased number of propulsion units to be positioned along the wing. As a result, the aircraft can achieve an improved lift and higher propulsive efficiency. The study findings indicate that an aircraft employing the N3-X configuration was expected to use 70% less fuel than a traditional aircraft performing the same mission. Additionally, the N3-X aircraft was estimated to emit 85% less NOX during takeoff and landing operations when measured against the Tier 6-CAEP/6 benchmark [11,12]. Furthermore, the increase in redundancy brought by multiple propulsors can reduce the severity of a single-fan failure [13]. However, this tightly integrated design introduces new challenges, such as the interaction between neighboring propulsors, which adversely affects the propulsion system aerodynamic performance. Moreover, the continuous ingestion of the boundary layer directly leads to ducted fan inlet distortion, causing a decrease in the aerodynamic performance [14]. Therefore, significant efforts have been directed towards understanding the aerodynamics of distributed propulsion systems.
Extensive studies have been conducted to investigate complex aero-propulsive interactions. A low-speed experiment was performed by Perry et al. [15] using a representative NACA airfoil. This airfoil was equipped with a series of five ducted fans integrated on the upper surface of the wing close to the trailing edge. The experimental results reveal nonlinear trends in the variation in the stream-normal and streamwise forces, as well as pitching moment polars, in relation to the throttle setting and angle of attack. Additionally, the researchers discovered that a windmill fan positioned at the edge had a more pronounced adverse effect on the performance than that situated within the ducted fan array. However, no specific reasons were provided for this finding. Using numerical and experimental methods, Wang et al. [16] examined the interactions between multiple propulsors in a distributed propulsion system. Their research found that the performance of the ducted fan was influenced by the inlet velocity distortion, with the failure of the edge fan causing a more severe impact on aerodynamics than the middle fan failure. However, the actuator disk approach, which replaces blade rows with discontinuous surfaces that alter the flow, is not appropriate for modeling the internal flow of a ducted fan. This limitation arises because of the simplification of the actuator disk model for complex flow within the fan. Research conducted by Li et al. [17] examined the influence of the spacing and quantity of ducted fans on propulsive efficiency. Their findings reveal that the configuration of distributed ducted fans had an impact of roughly 3% to 5% on propulsion performance. In a separate study, Zhang et al. [18] explored aero-propulsive interactions within an aircraft equipped with a DEP system. Their investigation revealed that the distributed electric fans not only generated a considerable increase in lift, but also contributed to a reduction in drag. Other researchers [19,20] also conducted low-speed wind tunnel experiments focusing on the aero-propulsive interactions. Considering the high cost of experiments, numerical simulation is another feasible method for investigating the aero-propulsive interactions. Kerho [21] simulated the aero-propulsive interaction of boundary layer ingesting fans with the grid size of 63 million. However, a full three-dimensional simulation of distributed ducted fans generally requires numerous computational resources [22]. Therefore, an efficient numerical method is required to simulate the complex aero-propulsive interactions. The body force model proposed by Gong was adapted to analyze the aerodynamics of an N3-X aircraft equipped with distributed ducted fans [23]. The findings demonstrate the effectiveness of the body force model (BFM) in simulating ducted fan aerodynamics. Additionally, a body force model utilizing the lift and drag coefficients of an individual airfoil has been developed [24]. This model was subsequently applied to the numerical simulation of a boundary layer ingesting fan.
The S-shaped duct is essential for integrating ducted fans and aircraft fuselage and has a substantial impact on the aerodynamic efficiency of aircraft and distributed propulsion systems. Lucas [25] conducted experimental studies to investigate how inlet distortion induced by boundary layer ingestion (BLI) affects turbofan engine performance. Additionally, Rein [26] experimentally examined the total pressure distortion at the aerodynamic interface plane (AIP) under various incoming flow Mach numbers. The results indicate that higher Mach numbers led to decreased intake aerodynamic performance. Experimental tests were performed on a wake-ingesting serpentine inlet at different mass flow rates in an embedded engine wind tunnel [27]. The research concluded that static pressure gradient was the primary factor affecting the flow development in serpentine inlets. The flow area influenced the average “global” static pressure across the flow plane, while wall curvature affected the “local” static pressure. A separate experimental study examined four S-shaped duct configurations with significant boundary layer ingestion under representative conditions [28]. The findings show that as the Mach number increased, the inlet distortion level increased and the inlet pressure recovery rate decreased. Research demonstrated that the length-to-offset ratio (the ratio of the length to offset of the S-shaped duct) and area ratio (the ratio of the outlet to inlet area of the S-shaped duct) are two key elements that influence the complex flow in an S-shaped duct [29,30,31]. Additionally, Li et al. [32] identified a new parameter, the height-to-radius ratio (HRR), that had a considerable impact on the flow within an S-shaped duct. Their findings reveal that the flow separation within an S-shaped duct was highly sensitive to HRR variations, but not to changes in the inlet relative height. They also found that an S-shaped diffuser with a lower HRR could substantially reduce the flow separation, leading to an enhanced total pressure recovery and a decreased distortion coefficient.
In general, a wide range of numerical and experimental studies has been conducted on the aerodynamics of distributed propulsion systems. However, few studies focused on the impact of the key geometric parameters of the S-shaped duct on ducted fan inlet distortion. In this study, a circumferential body force model was developed and validated to achieve efficient simulation of distributed ducted fans. The effects of the inlet aspect ratio and centerline offset of an S-shaped duct on the inlet distortion of distributed ducted fans were explored and analyzed.

2. Numerical Method Based on BFM

To achieve an efficient simulation of a distributed propulsion system, a circumferential body force model (BFM) was established and validated.

2.1. Development of BFM Model

The circumferential body force model was developed based on the model proposed by Hall [33] and the effect of compressibility was considered [34]. The governing equations including the body force source terms can be expressed as follows:
( b ρ ) t + ( b ρ V ) = 0
( b ρ V ) t + ( b ρ V V ) = ( b p ) + ρ b f
( b ρ e ) t + ( b ρ e V ) = ( b p V ) + ρ b r Ω f θ
where b denotes the blockage factor, ρ denotes the air density, t denotes the time, V denotes the vector of absolute velocity, p denotes the static pressure, e denotes the total energy per unit mass, r denotes the radius, and Ω denotes the angular velocity. f denotes the body force per unit mass, and fθ denotes the circumferential component of corresponding body force. Furthermore, the body force can be decomposed into two components:
f = f p + f n
The force fp is parallel but opposite to the relative flow direction, which simulates the frictional drag and loss term due to the blade thickness. The force fn is perpendicular to the relative flow direction, which simulates the load exerted by the actual blade on the airflow to achieve deflection of the airflow, as well as the work conducted on the airflow. The expressions are as follows:
f n = K M a c h ( 2 π δ ) ( 0.5 W 2 / n θ ) s b
f p = 0.5 W 2 s b n θ 2 C f + 2 π ( δ δ 0 ) 2
in which
K M a c h = min ( 1 1 M r e l 2 , 3 ) ,          M r e l < 1 min ( 4 2 π M r e l 2 1 , 3 ) ,      M r e l > 1
s = 2 π r B
C f = 0.0592 Re x 0.2
Re x = ρ W c x μ
where δ denotes the local deviation angle, W denotes the vector of relative velocity, nθ denotes the unit normal vector of blade local surface, s denotes the blade pitch, Cf denotes the local friction coefficient, Mrel denotes the relative Mach number, B denotes the blade number, Rex denotes the Reynolds number based on local relative velocity and axial chord, cx denotes the blade axial chord length, and μ denotes the air dynamic viscosity. The reference local deviation angle δ0 is defined as follows:
δ 0 = β β m
where β denotes the relative flow angle, and βm denotes the blade metal angle. A simplified geometric relationship is illustrated in Figure 1. The reference local deviation angle δ0 is related to the rotation speed, and it is necessary to extract δ0 at different rotation speeds separately to obtain accurate numerical results.

2.2. Validation of BFM Model

To validate the BFM, the fan of DGEN 380 engine owned by the Civil Aviation University of China (Tianjin, China) was chosen [35]. It is a high-bypass-ratio turbofan engine with dual shafts and a separated exhaust system. The design cruising altitude is 10,000 ft (3048 m), and the Mach number is 0.35. It can generate a thrust up to approximately 250 daN. The high-pressure turbine drives the compressor and can reach a speed of approximately 50,000 revolutions per minute (RPM). The bypass ratio is as high as 7.6 and the turbine inlet temperature is 1100 K. Figure 2 illustrates the structures of the engine and fan. The key design parameters of the fan are listed in Table 1.
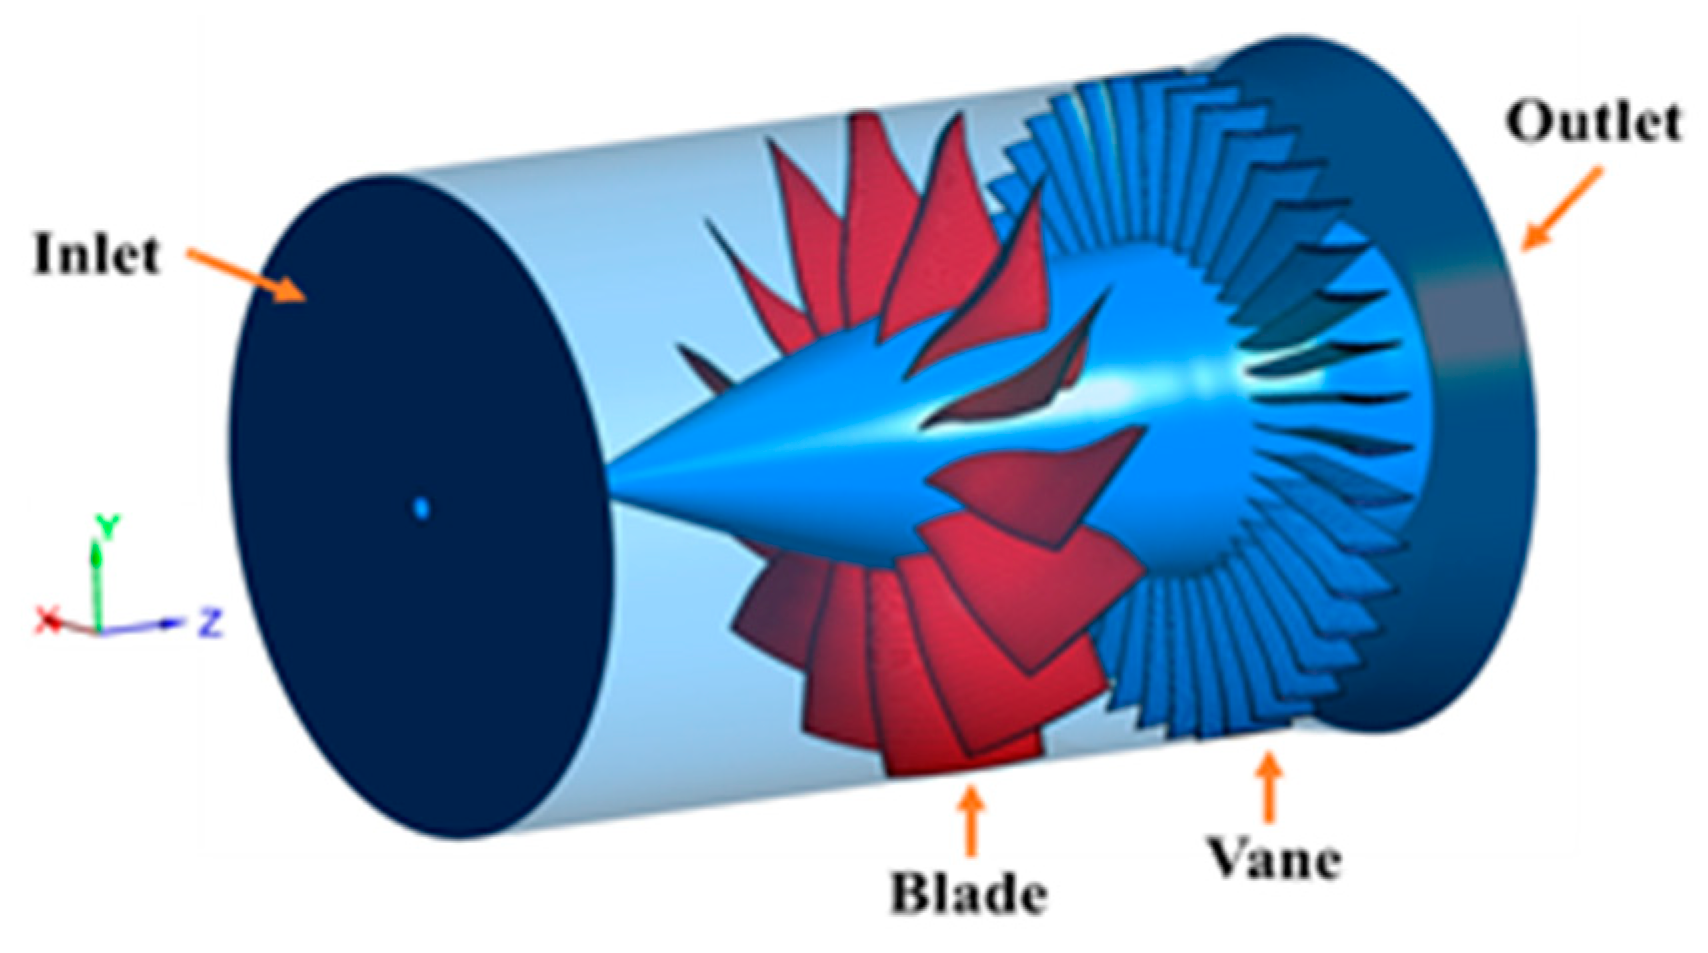
Figure 3 illustrates the computational domain and meridional mesh based on the BFM solution. The user-defined function (UDF) in the commercial software Fluent 2022 R2 was used to implement the body force source terms in the red (blade) and blue (vane) regions. A circumferential averaged force field was employed to replicate the forces applied by the blades to the airflow. The k-ω SST turbulence model was used to solve the three-dimensional steady Reynolds-averaged Navier–Stokes (RANS) equations in the remaining regions. The grid in the blade and vane regions consisted of 40 radial and 30 axial points, with 90 points in the circumferential direction. The total grid size was 0.69 million. Each case reached convergence in approximately 40 min using two 64-core AMD EPYC 7H12 processors and 256GB DRAM memory.
To validate the accuracy of the BFM results, a full three-dimensional simulation was performed to solve the three-dimensional steady RANS equations. Figure 4 illustrates the full-annulus computational domain of the fan stage. The total grid size was approximately 27.7 million. Total temperature and total pressure were imposed at the inlet, and average static pressure was imposed at the outlet. The rotor–stator interface was set as a mixing plane. The solid walls were set as no-slip and adiabatic. The convergence time of a single case using the RANS method under the same computational conditions was approximately 12 h. The convergence was evaluated by monitoring the residuals of the mass, momentum, energy, and turbulence model equations. The target root mean square (RMS) residual order of accuracy was set to less than 10−6.
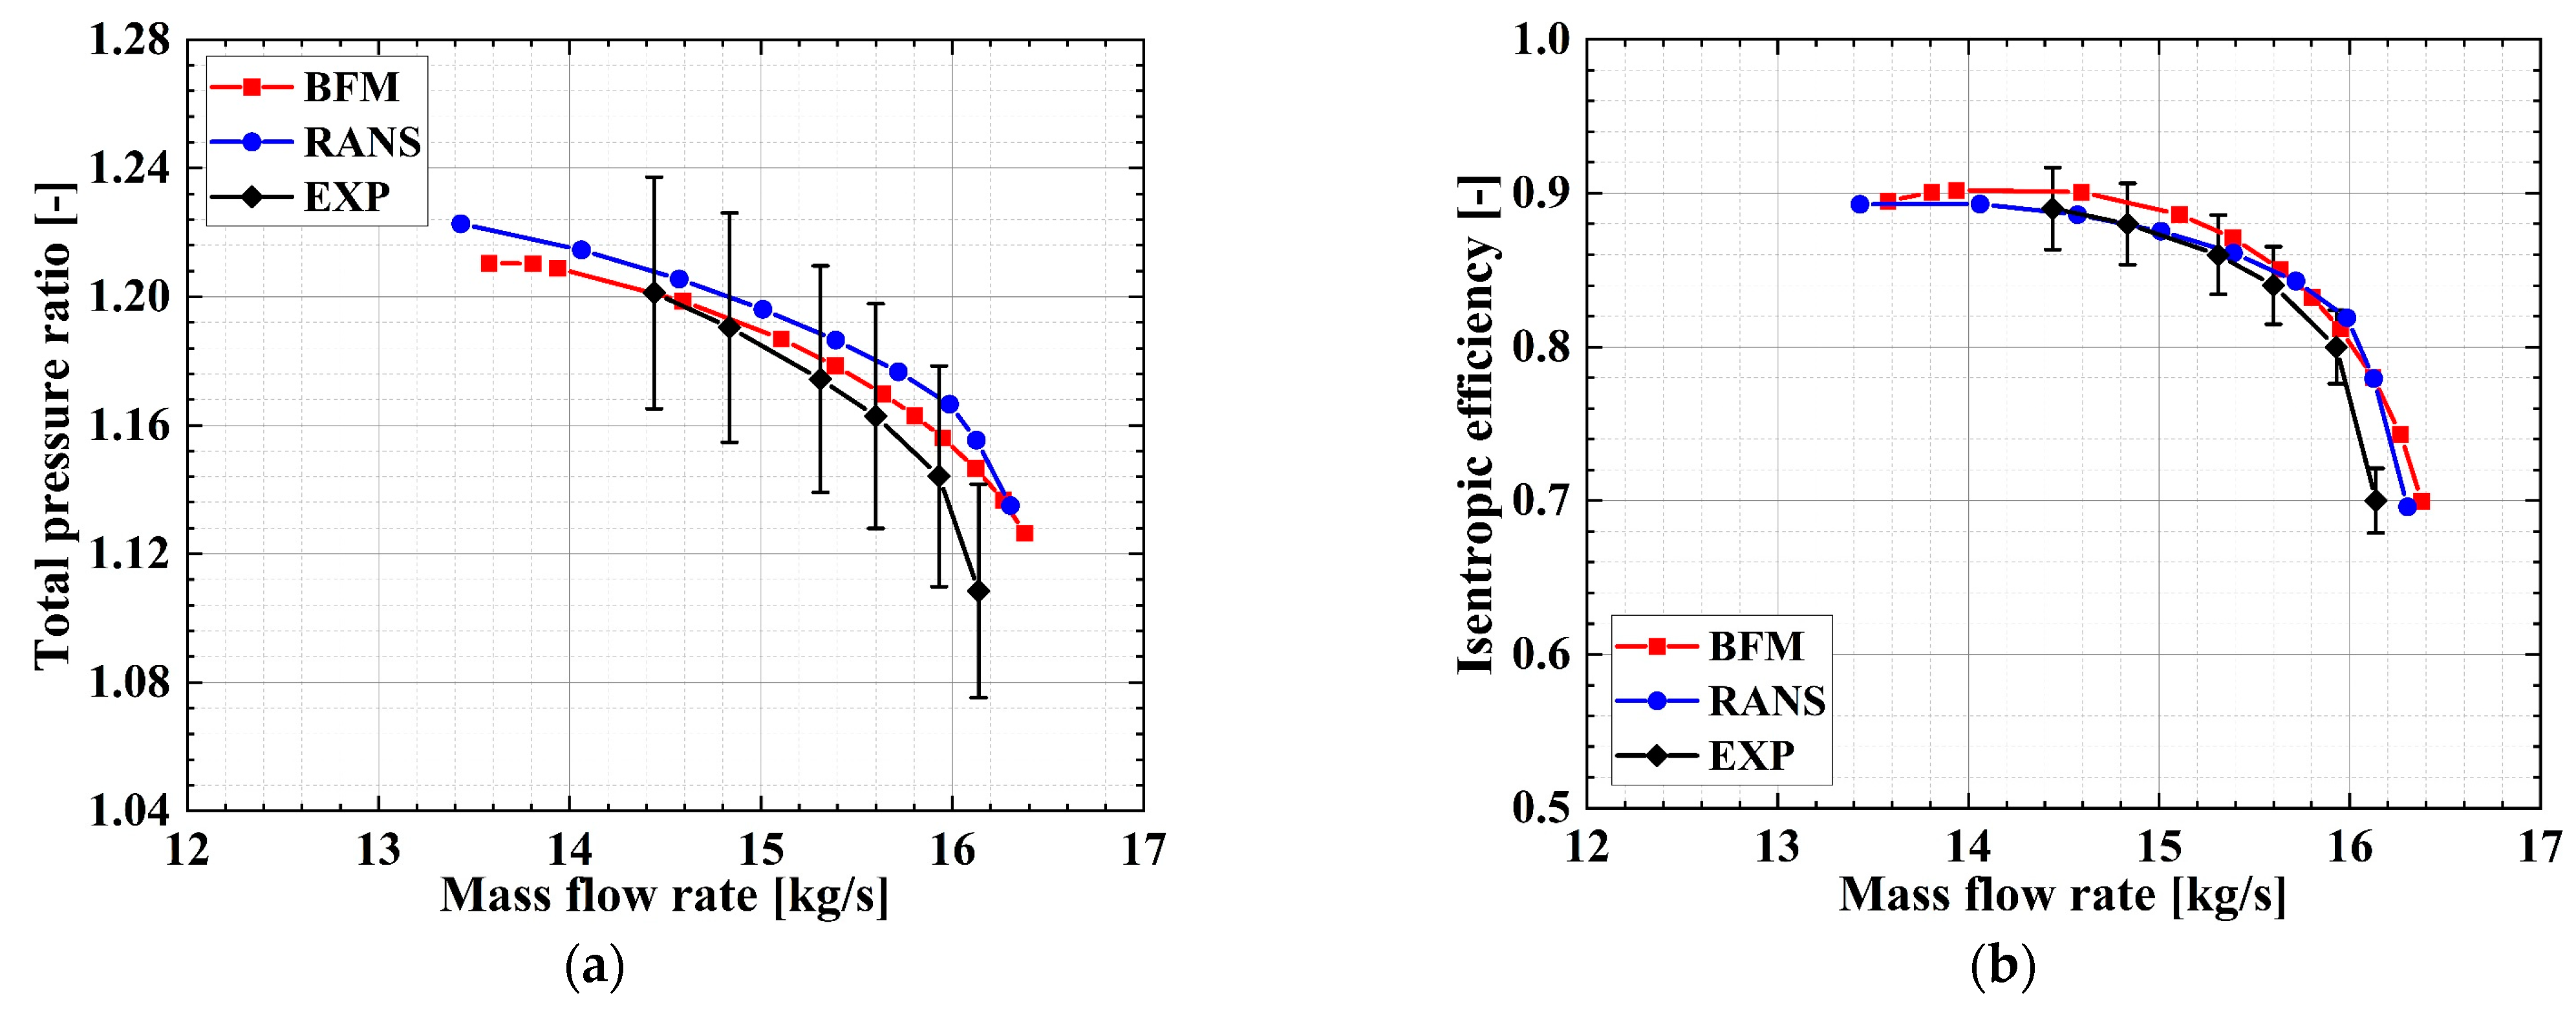
Figure 5 shows the aerodynamic characteristics of the fan stage at the design rotation speed (100% RPM). The BFM results closely match the RANS model and experimental results (EXP). The isentropic efficiency obtained using the BFM method was marginally higher than that of RANS, with the largest discrepancy not exceeding two percentage points. This minor discrepancy can be explained by the fact that only the work and deflection of the blade acting on the airflow were considered, while three-dimensional flow losses, such as secondary flow and tip leakage flow near the end walls, were disregarded. Near the choke point, both the numerical simulation methods (BFM and RANS) produced slightly higher mass flow rates compared with the experimental results. This difference likely stems from the blockage effects of downstream components, including the centrifugal compressor, combustion chamber, and turbine, which reduced the mass flow rate. Consequently, the mass flow rate at the near-choke point obtained by the experiment was lower than that obtained by the numerical simulation.
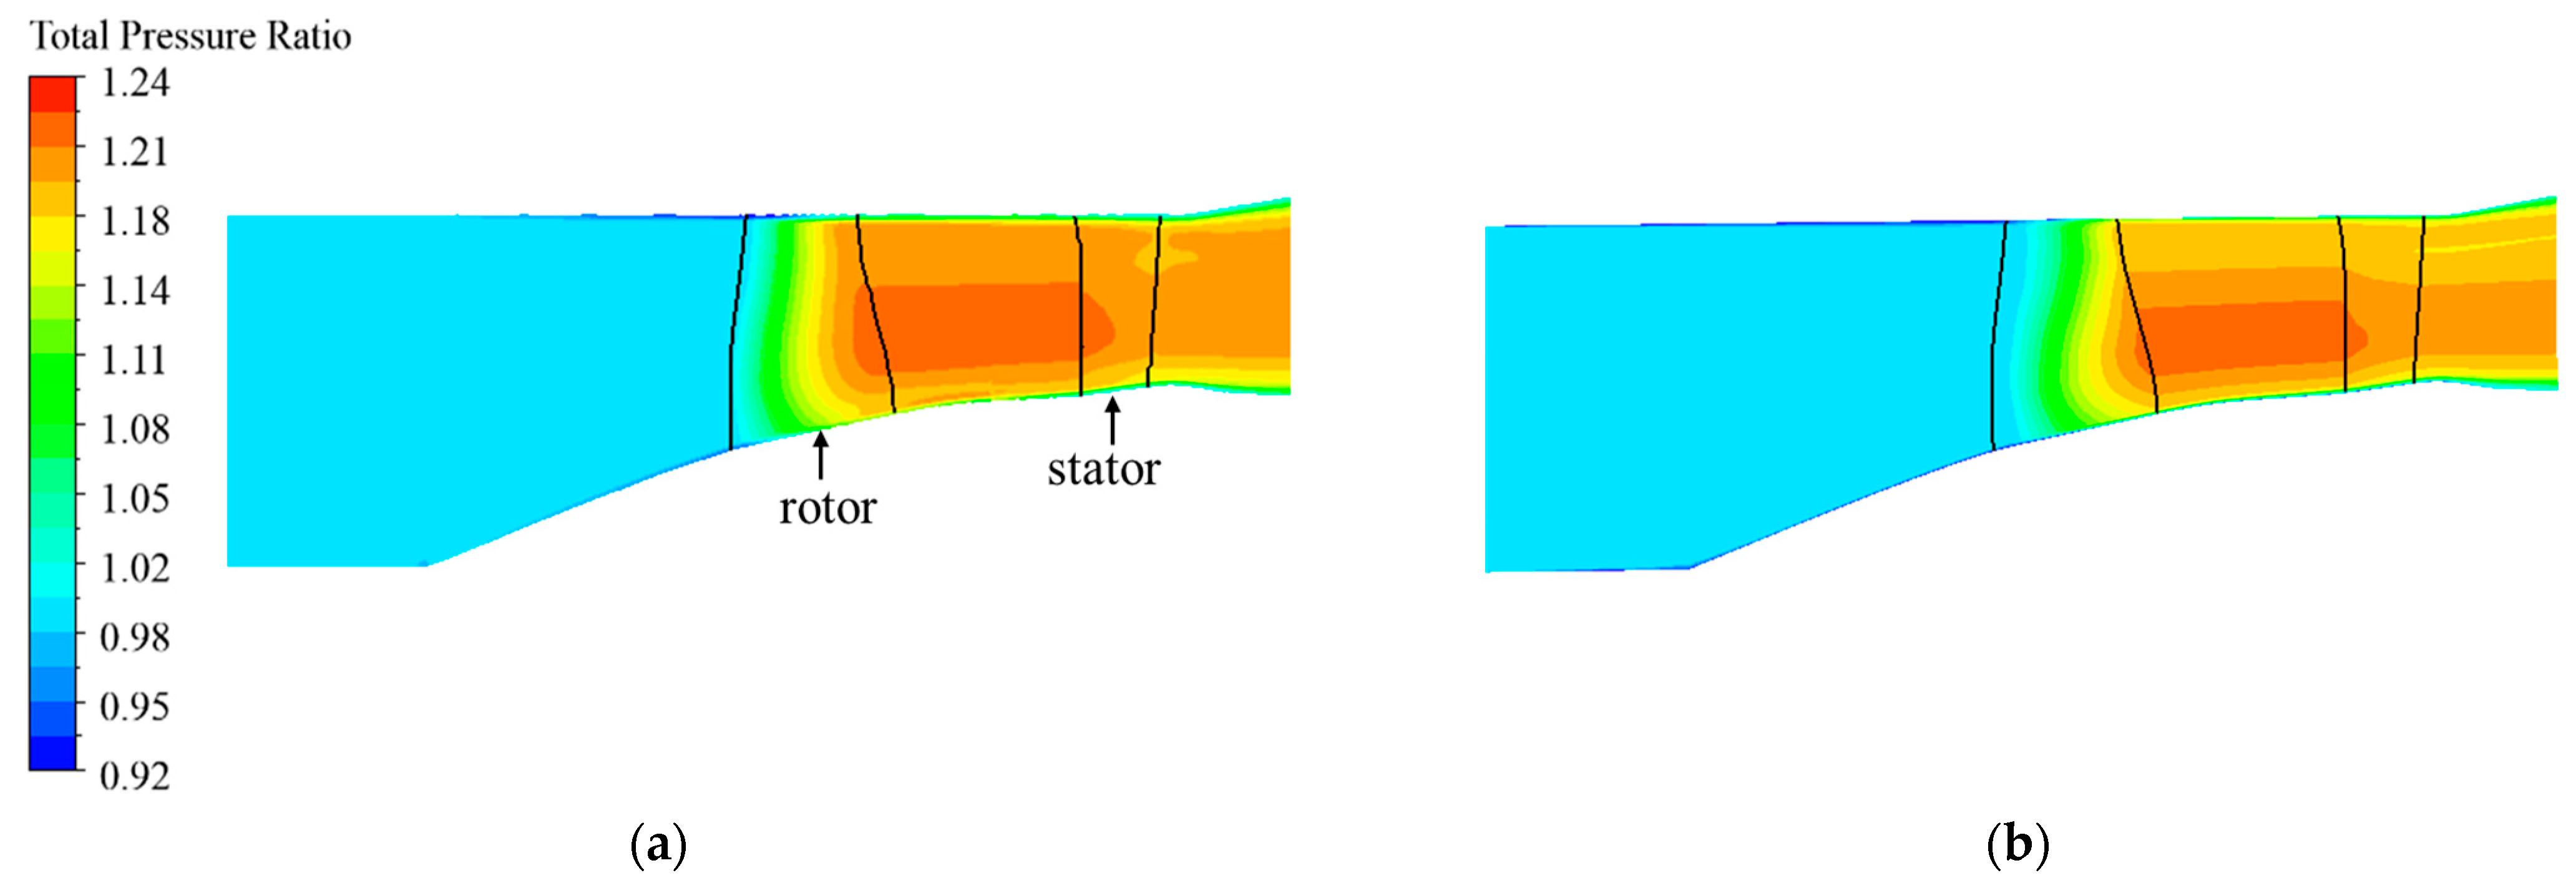
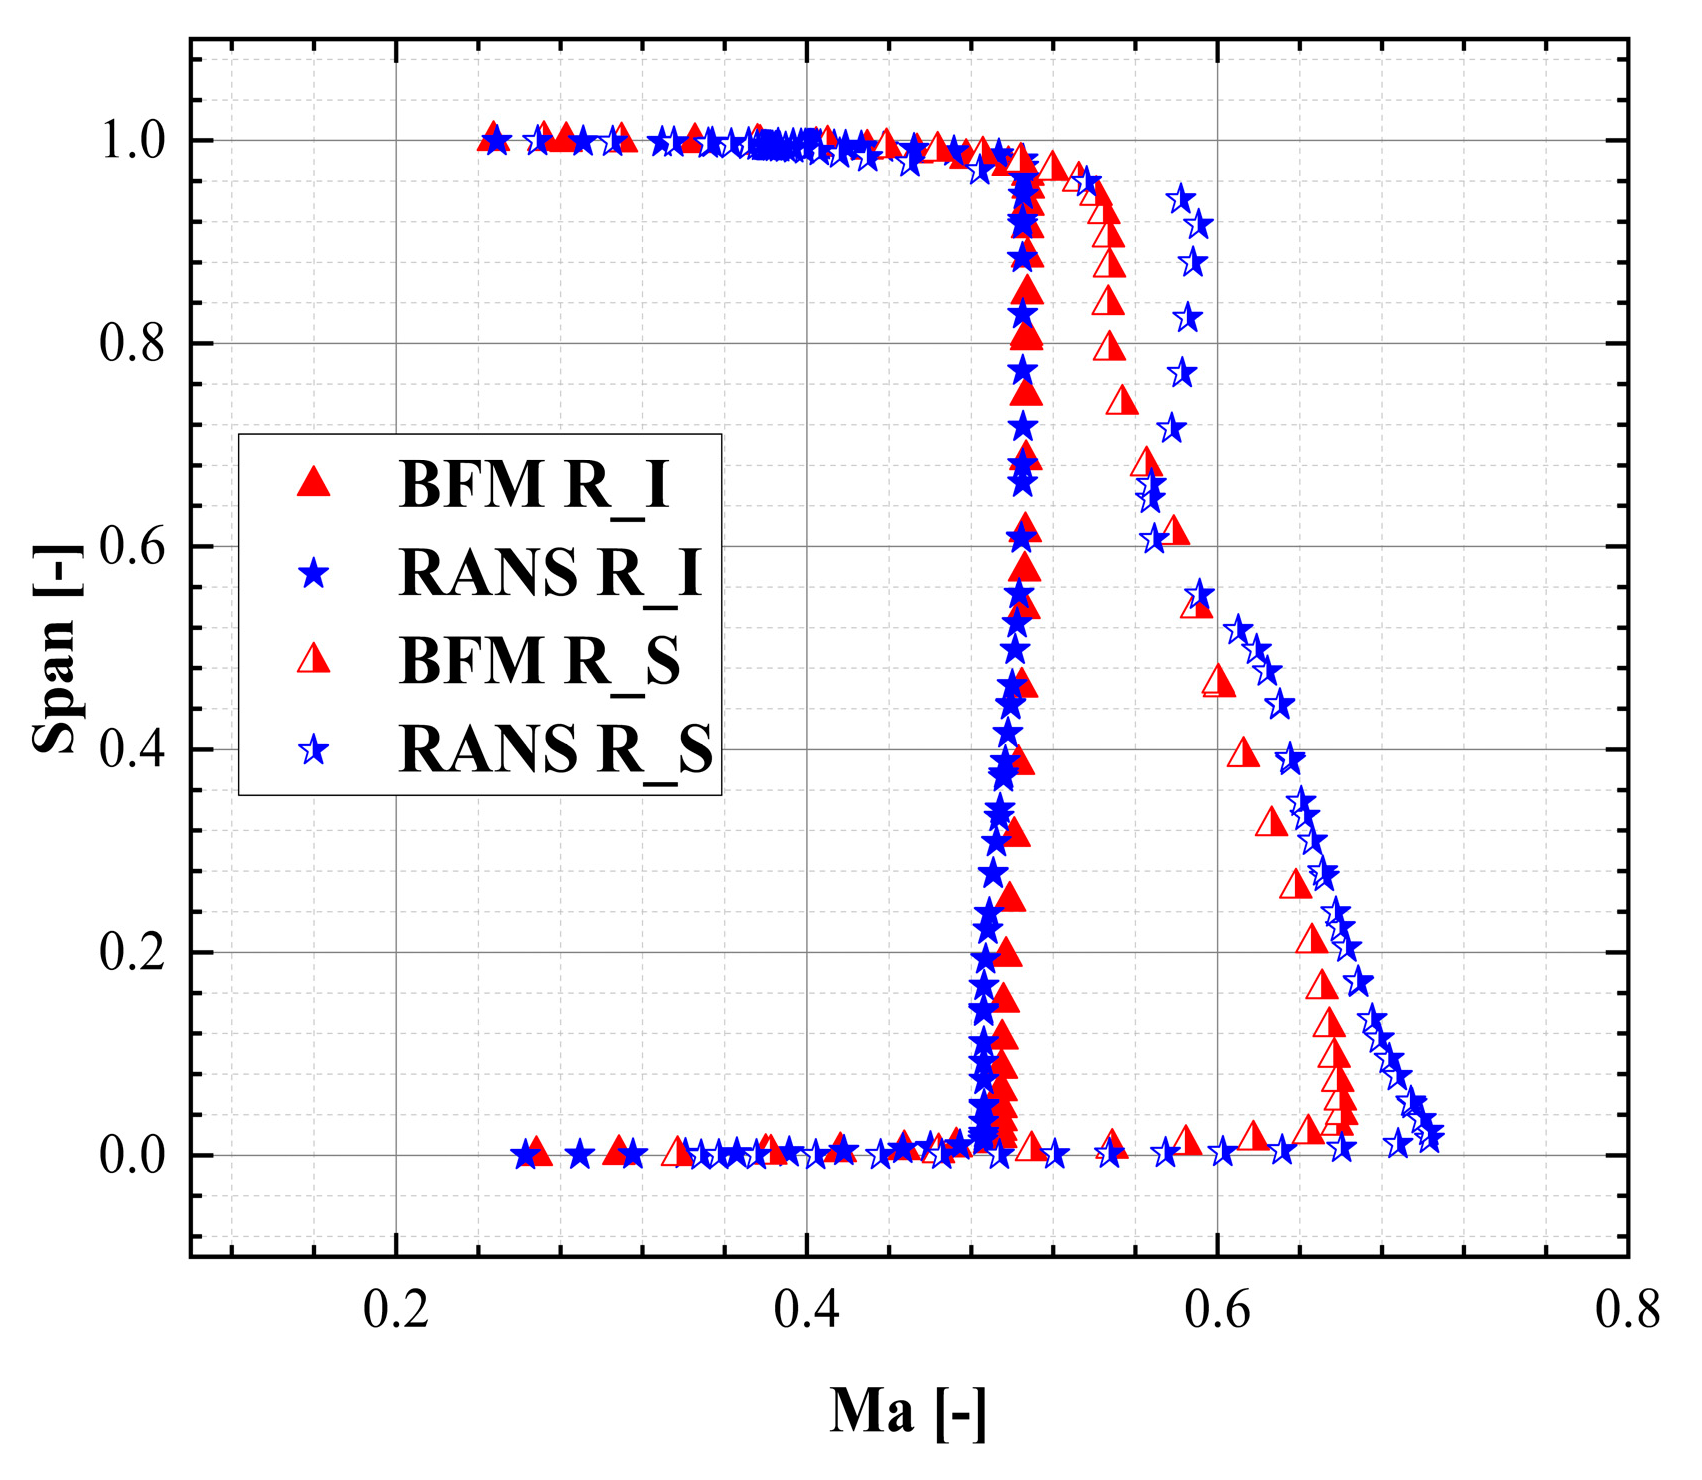
Figure 6 illustrates the total pressure contours in a meridional plane. Overall, the BFM results are in good agreement with the RANS results. The BFM method successfully captured the pressure rise across the fan stage and the total pressure reduction in the boundary layers. In the region below 60% span, the total pressure obtained using the BFM method closely matched the RANS result. However, it was slightly lower than the RANS result above 60% span. Figure 7 presents the spanwise distributions of Mach number near the leading edge (section R_I in Figure 3b) and trailing edge (section R_S in Figure 3b) of the fan blade. The BFM results roughly match the RANS results. At the fan stage inlet, the results of BFM and RANS almost coincide. A minor discrepancy was observed between the BFM and RANS results at the fan blade exit. The greatest difference was noted near the blade tip and hub, with a maximum deviation of less than 8%. This variation can be attributed to the lack of consideration for secondary flow effects, such as tip leakage vortex and hub passage vortex in the BFM method.
Overall, the BFM results demonstrate considerable consistency with the RANS and experimental results while exhibiting a notable improvement in computational efficiency. This suggests that the BFM method can be successfully employed to simulate the force applied by the blades to the airflow.

3. Design of an S-Shaped Duct

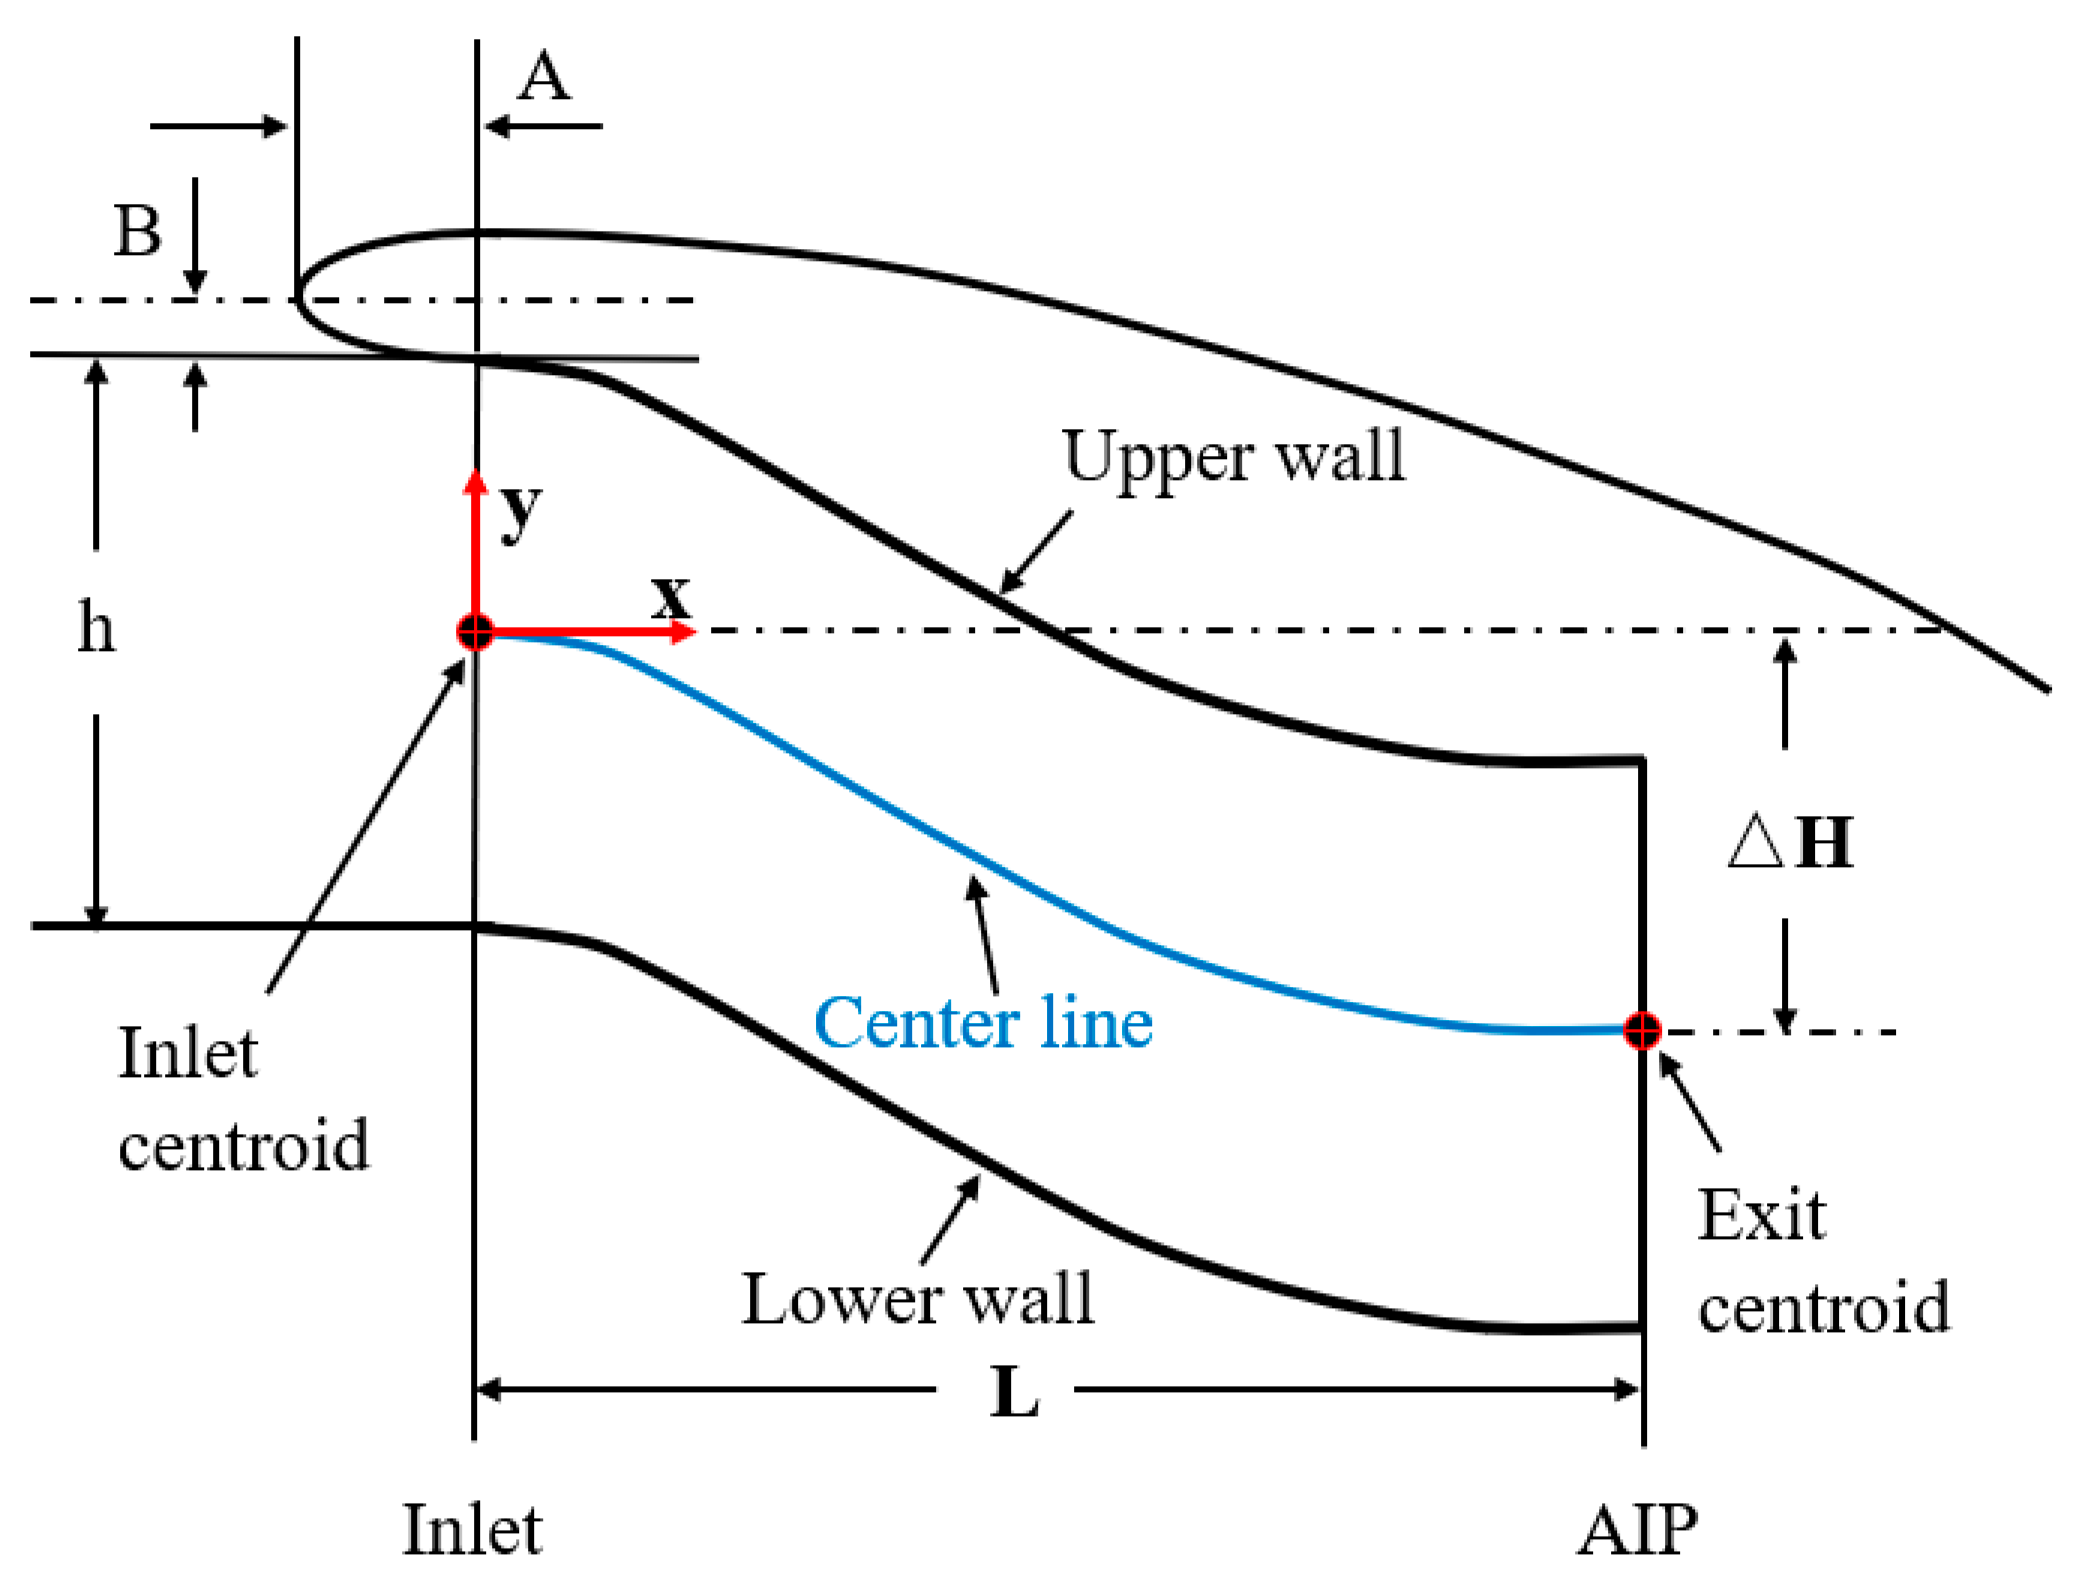
Figure 8 illustrates a schematic representation of an S-shaped duct. The centerline of the duct is defined by horizontal coordinate x and vertical coordinate y, respectively. L is the axial length of the duct, h is the inlet height of the duct, and ΔH is the centerline offset of the duct. The duct features an elliptical lip, with semi-major axis A being twice the length of semi-minor axis B.
Given the strong resistance to separation in the airflow of the initial bend and the tendency for separation in the subsequent bend of the S-shaped duct [36], the centerline was chosen as follows:
y o x = y Δ H = 6 × x L 2 8 × x L 3 + 3 × x L 4 .
The expansion ratio and adverse pressure gradient of a duct are generally influenced by variations in the cross-sectional area along the flow direction. To promote the consistent expansion of the airflow within the duct, thereby mitigating or preventing flow separation [37], the variation in the cross-sectional area throughout the duct was determined as follows:
S o x = S S 1 S 2 S 1 = 3 × x L 2 2 × x L 3
where S1 and S2 denote the duct entrance and exit areas, respectively. The variable S denotes the area of any cross-section within the duct.
The ratio of entrance and exit areas directly affects the pressure rise in the duct. The entrance area can be expressed by the equivalent expansion angle as follows [38]:
tan τ = 2 S 2 S 1 π L
where τ denotes the equivalent expansion angle. To prevent flow separation near the duct end walls, the equivalent expansion angle was generally less than 5° [38]. Thus, the ratio of entrance and exit areas was determined as S2/S1 = 1.072.
The hyperelliptic equation was chosen to determine the cross-sectional shape and area of the duct as follows [36,39]:
z a n + y b n = 1
S = 4 a b Γ 1 + 1 n 2 Γ 1 + 2 n
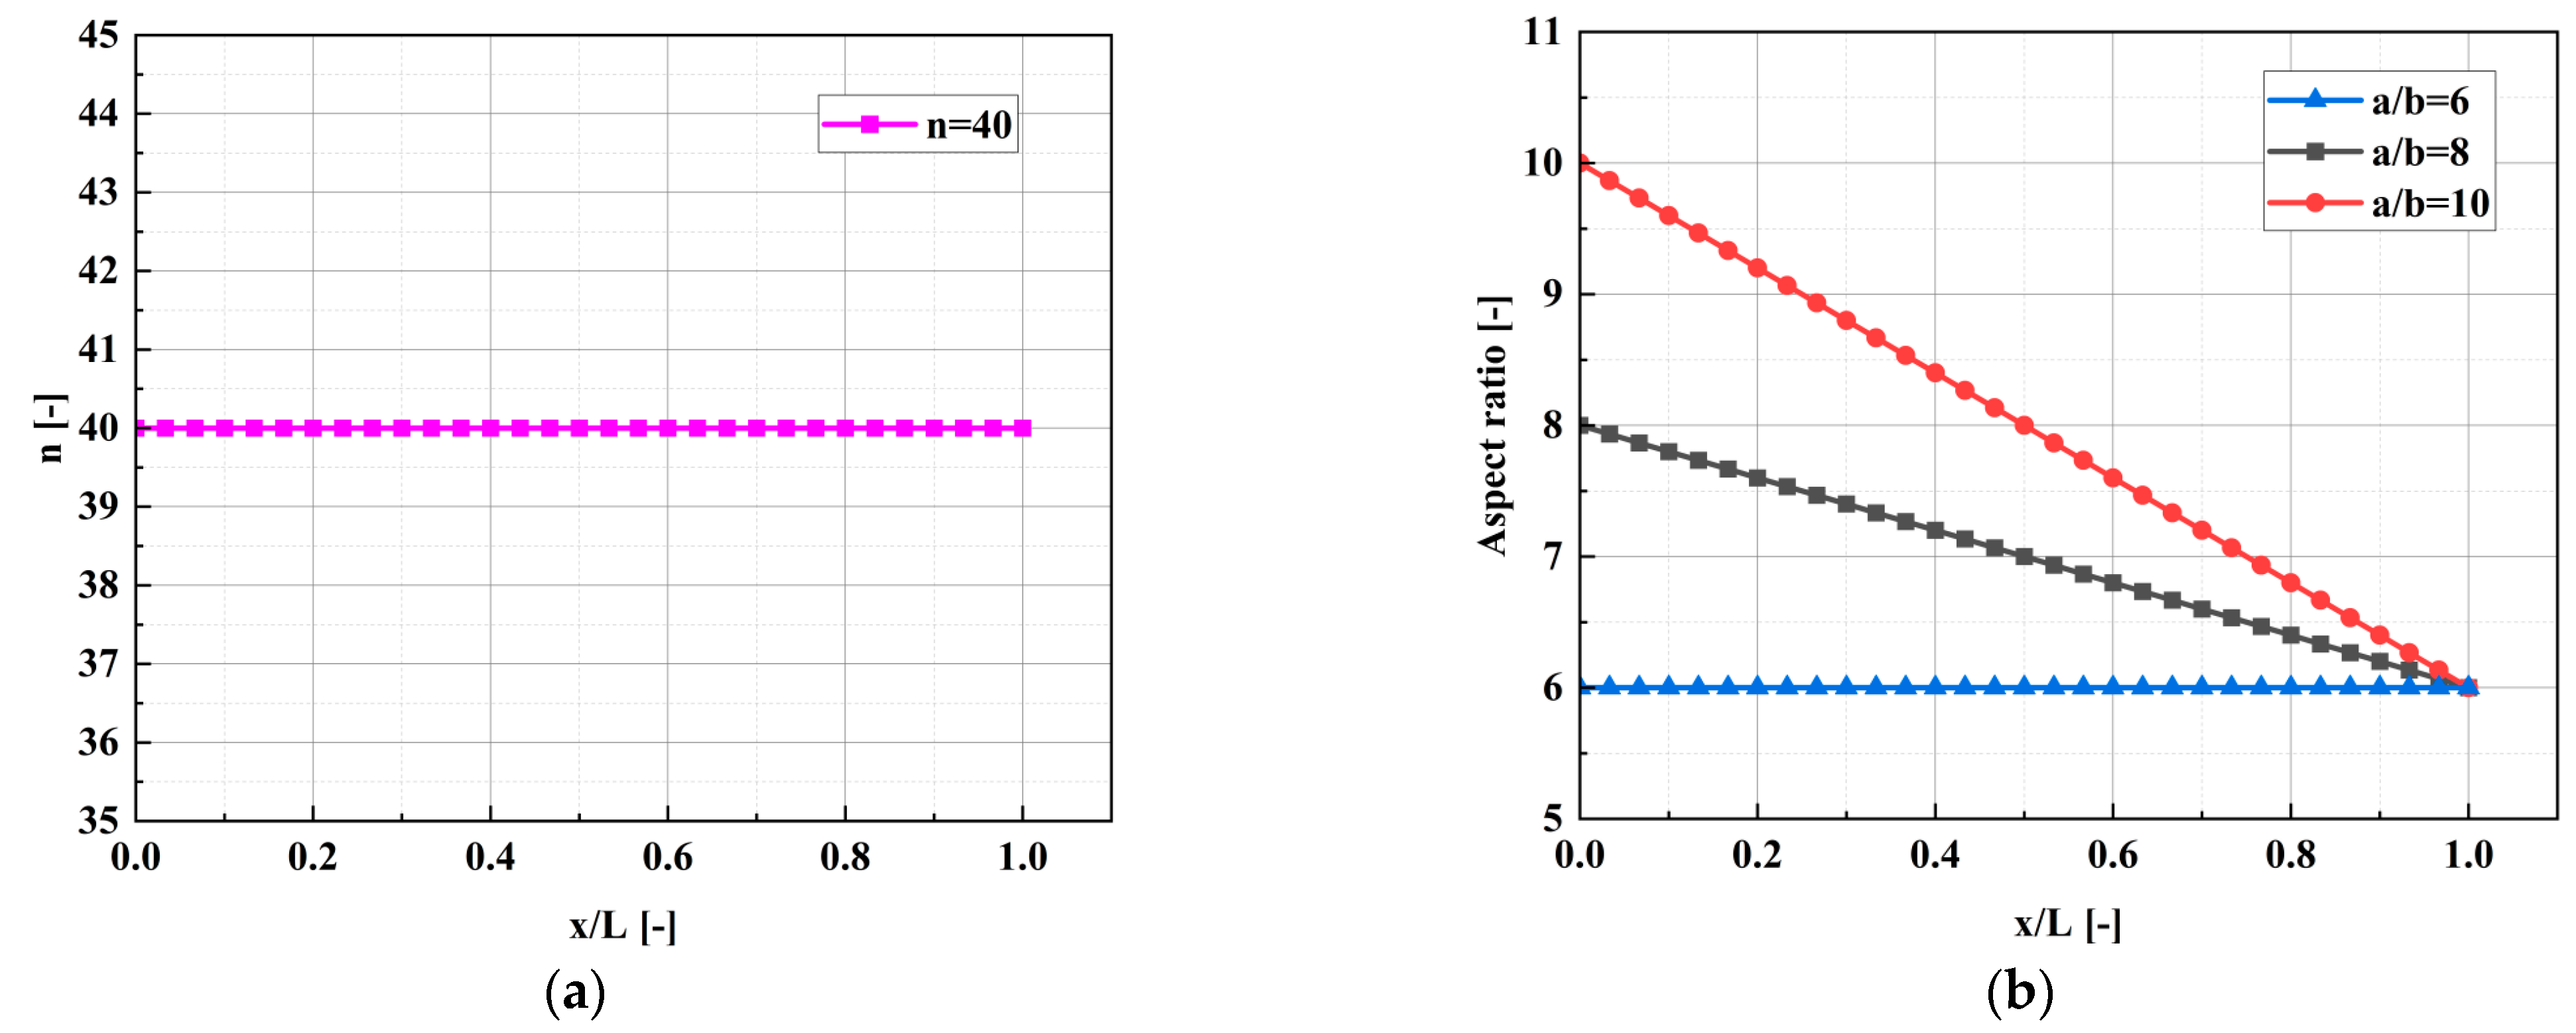
where a and b denote the lengths of the semi-major and semi-minor axes of the hyperellipse, respectively, and n denotes the hyperellipse index. Figure 9 presents the variations in the hyperellipse index and a/b. Three different values of a/b, namely a/b = 6, 8, and 10, were considered. A linear change in a/b was applied from the entrance to the exit of the duct. Figure 10 illustrates the configuration of the S-shaped duct.

4. Computational Methods

4.1. Distributed Ducted Fans with S-Shaped Duct

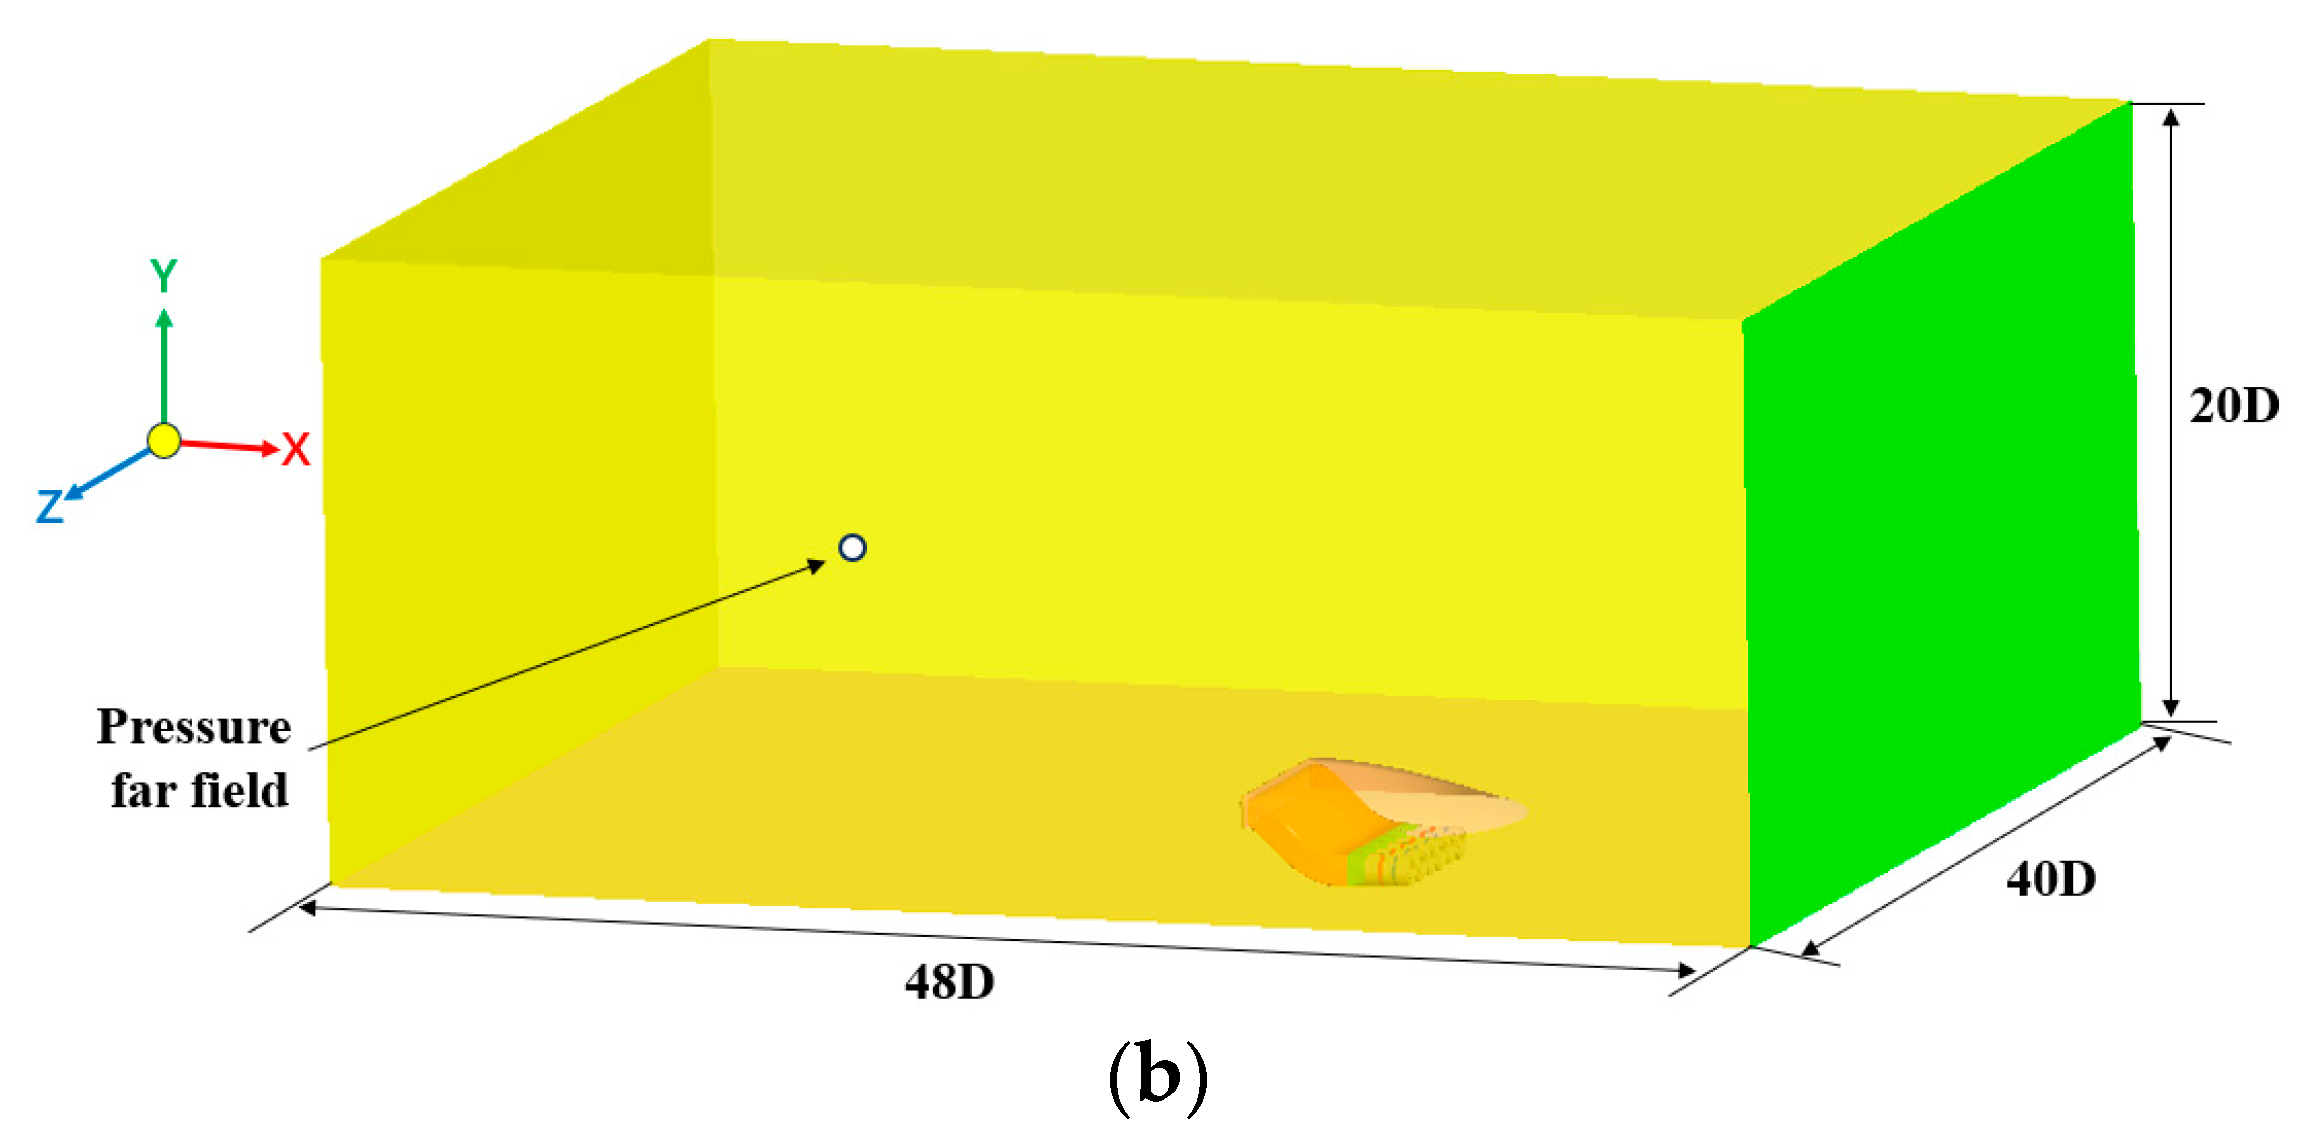
A square-to-round transition section was designed to connect the S-shaped duct and distributed ducted fans, as illustrated in Figure 11. Multi-arc sections with continuous curvature were used and several control sections enclosed by multi-arc curves were added between the S-shaped duct outlet and ducted fan inlet. The square-to-round transition shape can be generated by sweeping the profiles of each control section. The ratio of axial length to outlet diameter of the transition section was set as 16:15 [40]. The spacing between ducted fans was set to 8 mm. The inlet section of the ducted fan was located 2.8 times the chord length from the blade leading edge. The rectangular entrance of the duct was s = 2a in width and h = 2b in height. A rectangular computational domain with 20D × 40D × 48D is illustrated in Figure 12. The front face was positioned 26D from the entrance of the duct, while the back face was 22D from the same position.

4.2. Numerical Method and Boundary Condition

All simulations were performed using FLUENT software. The body force sources were implemented in the red (blade) and blue (vane) regions using the user-defined function (UDF) in FLUENT. No blades were presented in either of the regions. Instead, the BFM method was employed to simulate the force exerted by the blades on the airflow. For each iteration, the body force source was updated accordingly. The k-ω SST turbulence model was employed to solve the three-dimensional steady RANS equations in other regions. A finite volume method with time marching was used. The total pressure ratio was obtained by adjusting the static pressure at the exit of the ducted fans. The upper, front, and side surfaces of the rectangular domain were set as the far-field boundary, where the static pressure was 101,325 Pa and the static temperature was 288.15 K. The lower surface of the domain was set as a no-slip adiabatic wall. The convergence was evaluated by monitoring the residuals of the mass, momentum, energy, and turbulence model equations. The target root mean square (RMS) residual order of accuracy was set to less than 10−6.

4.3. Computational Mesh

The computational mesh was constructed using FLUENT MESHING 2022 R2 and POINTWISE V18.6 R2 software. As illustrated in Figure 13, a structured grid was generated in the square-to-round duct and ducted fans, whereas an unstructured grid was generated in the far field and S-shaped duct. The grid height adjacent to the wall was set to 0.01 mm to maintain y+ ≈ 1 with a grid expansion ratio of 1.2. Figure 14 presents the variations in the total pressure ratio and isentropic efficiency of fan #3 for five different grid sizes. When the total grid size reached 9 million, the fluctuations in both the total pressure ratio and isentropic efficiency became minimal, with changes less than 0.01%. Therefore, a total grid size of 9 million was chosen. The grid size for each ducted fan was 0.55 million, and the grid size for a single square-to-round duct was 0.2 million.

5. Results and Discussion

5.1. Key Geometry Parameters and Boundary Layer Thickness

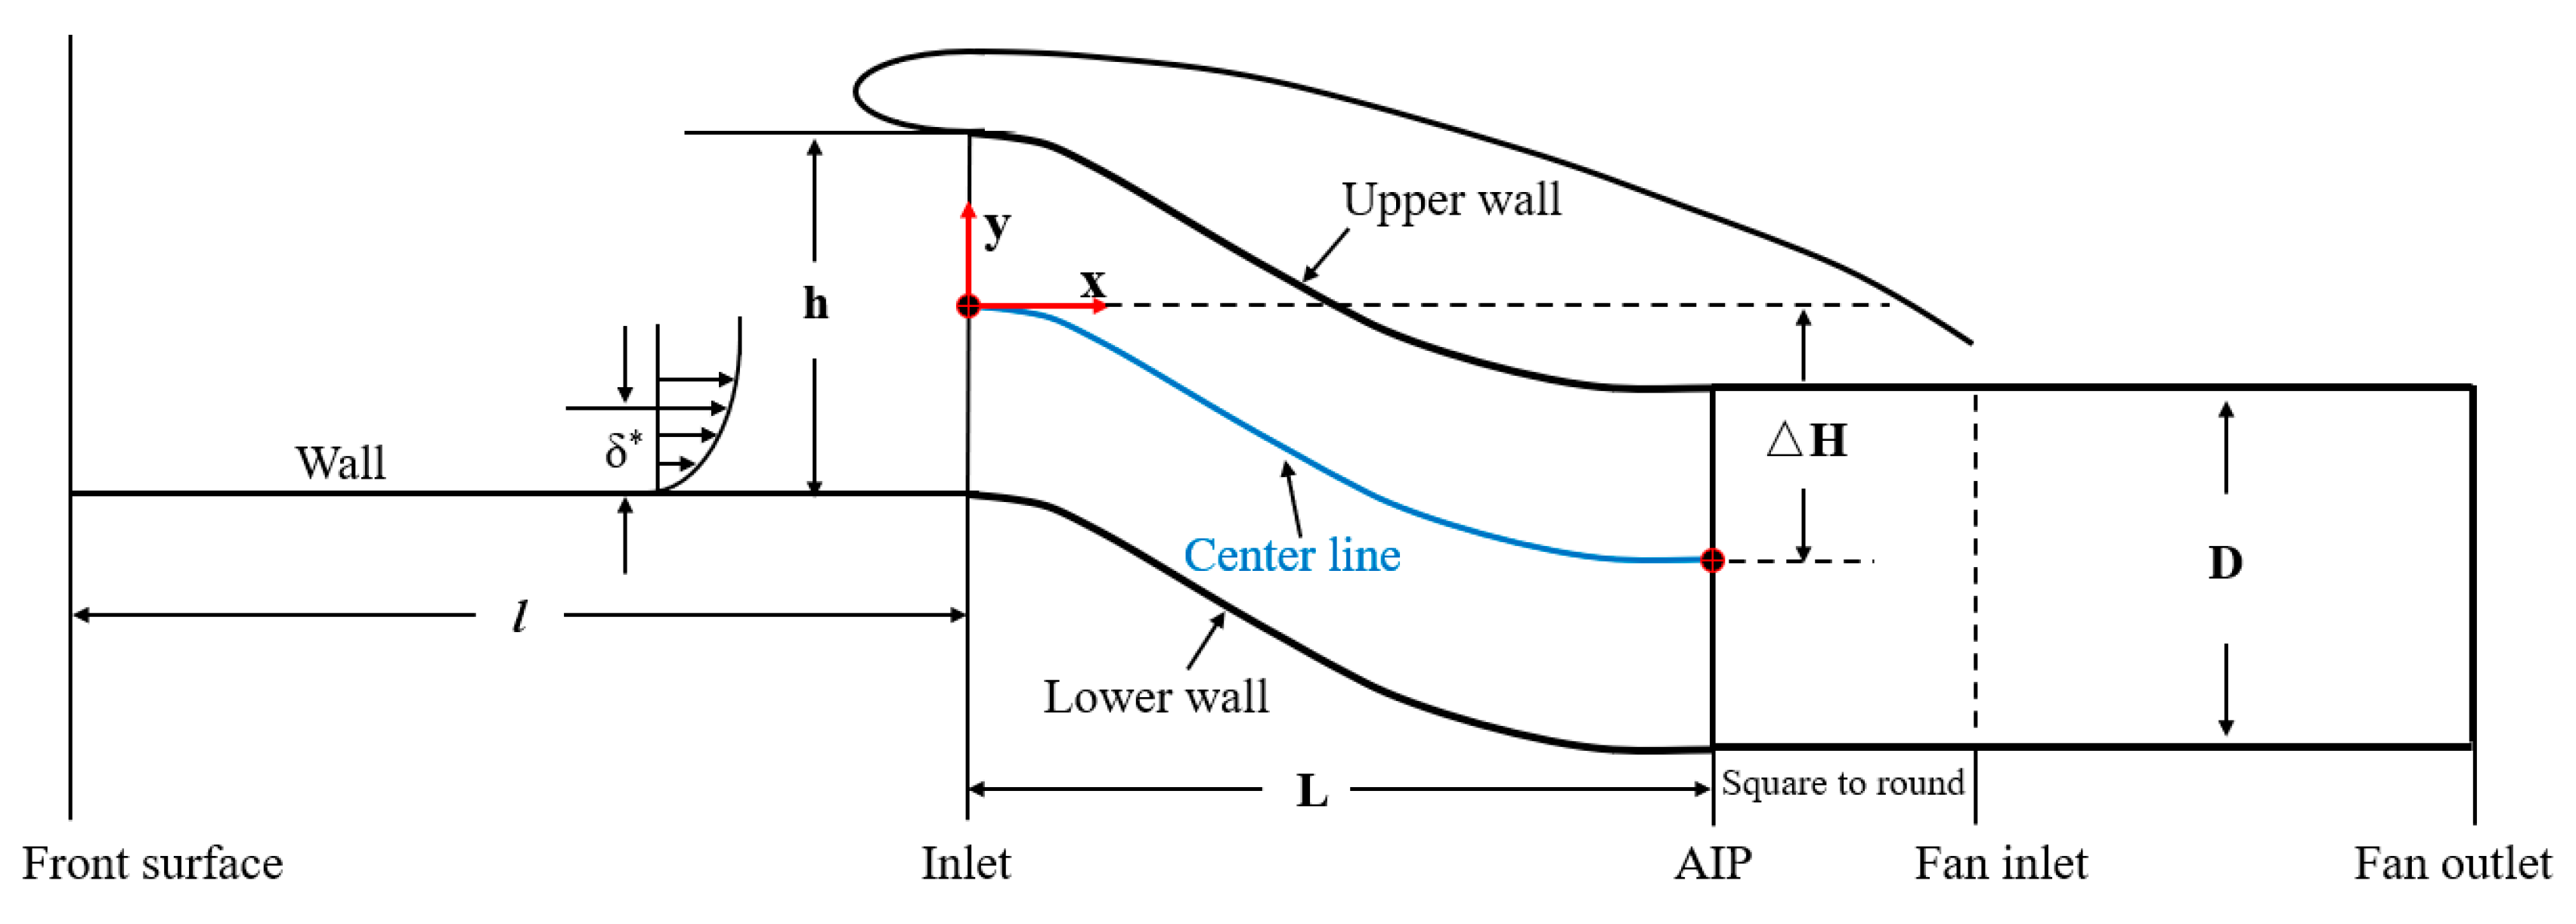
This section examined the effects of inlet aspect ratio AR and centerline offset ΔH on the inlet distortions of ducted fans. As illustrated in Figure 11, the inlet aspect ratio was defined as AR = s/h. Three different aspect ratios (AR = 6, 8, and 10) were considered when the inlet area remained constant [41]. Three different centerline offsets (ΔH = 0.75D, 1.25D, and 1.75D) were considered when the axial length remained constant, where D denotes the ducted fan diameter. The axial length was set as L = 3.142D.
Typically, the boundary layer thickness ahead of an S-shaped duct can reach 30% inlet height during flight [42]. According to the reference [43], boundary layer thickness can be expressed as follows:
δ * = 0.37 l 0.8 Re u 0.2
Re u = ρ u μ .
As illustrated in Figure 15, δ* represents the boundary layer thickness, l is the distance from the front surface to the duct entrance, and subscript ∞ indicates the free stream. The incoming flow had a Mach number of Min = 0.3. The boundary layer thickness at the entrance of the duct was maintained at δ*/h = 0.3 by adjusting the distance between the front surface and the entrance of the duct.

5.2. Effects of Inlet Aspect Ratio

To quantitatively evaluate the inlet total pressure distortion of the distributed ducted fans, the total pressure distortion index DC60 was employed. This index is characterized by the following definition [44]:
D C 60 = P t o t ¯ P t o t , min ( 60 ) ¯ q ¯
where P t o t ¯ represents the average total pressure, P t o t , min ( 60 ) ¯ represents the minimum average total pressure within the 60° sector, and q ¯ represents the dynamic pressure.
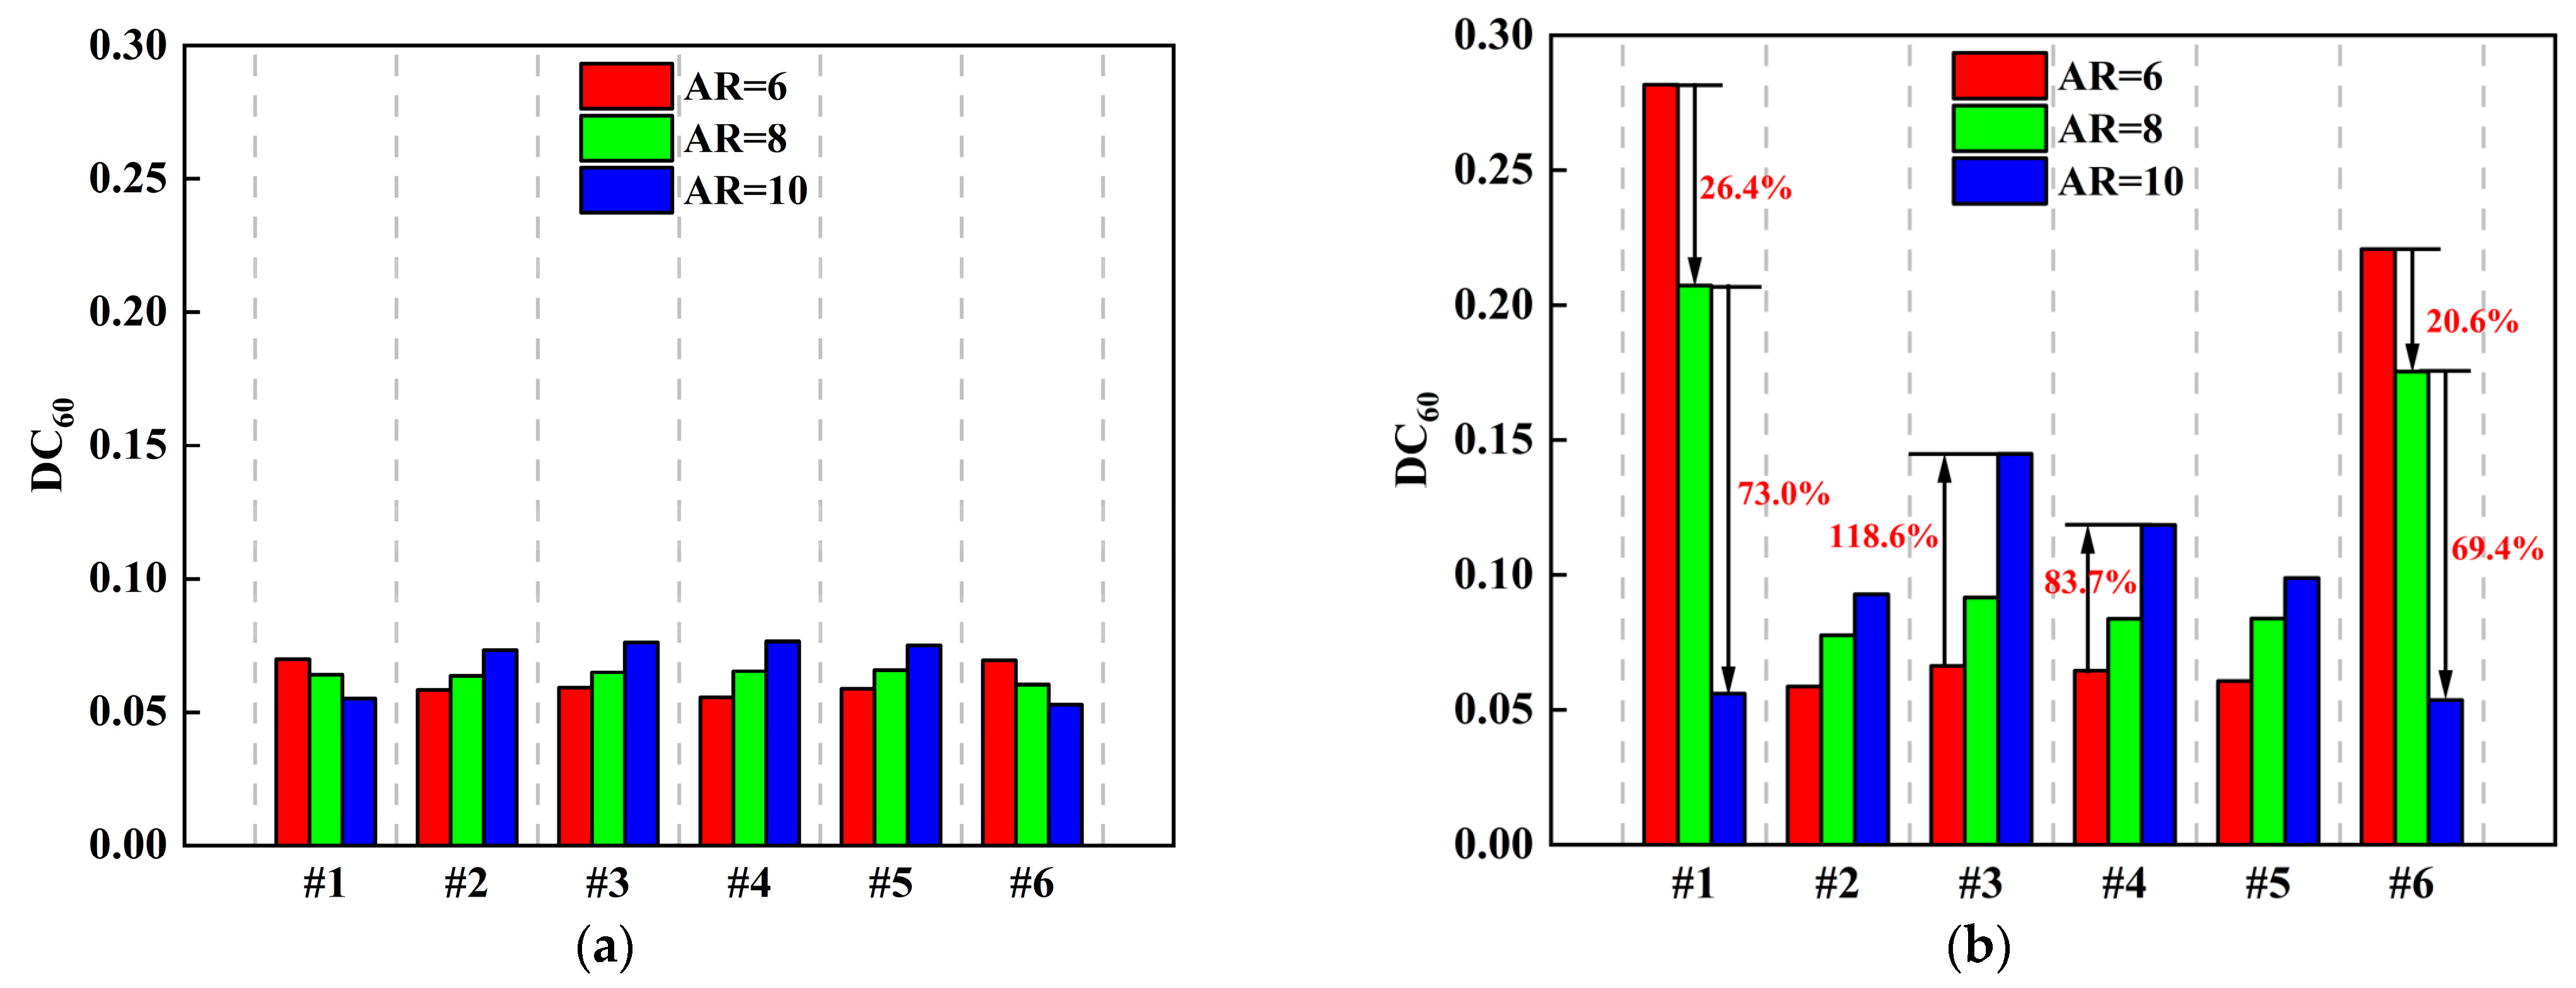
Figure 16 presents the total pressure distortion index DC60 of each ducted fan for different aspect ratios. It reveals that as the aspect ratio increased, the DC60 was decreased for the edge fans (#1 and #6). Conversely, the DC60 was increased with an increase in the aspect ratio for the intermediate fans (#2–#5). An increase in the centerline offset significantly amplified the impact of the aspect ratio on the total pressure distortion level. For a large centerline offset, the DC60 was decreased by 26.4% and 20.6% for fans #1 and #6, respectively, when the aspect ratio increased from 6 to 8, whereas the DC60 was decreased by 73.0% and 69.4% for fans #1 and #6, respectively, when the aspect ratio increased from 8 to 10. However, the DC60 was increased by 118.6% and 83.7% for fans #3 and #4, respectively, when the aspect ratio increased from 6 to 10. Increasing the aspect ratio of the duct increased the airflow velocity near the side walls, thereby alleviating the inlet distortion of the edge fans. Consequently, as the aspect ratio increased, the edge fan experienced a decrease in the level of total pressure distortion, whereas the intermediate fans experienced an increase. Notably, there were slight differences in the total pressure distortion variations between the two edge fans despite their geometric symmetry.
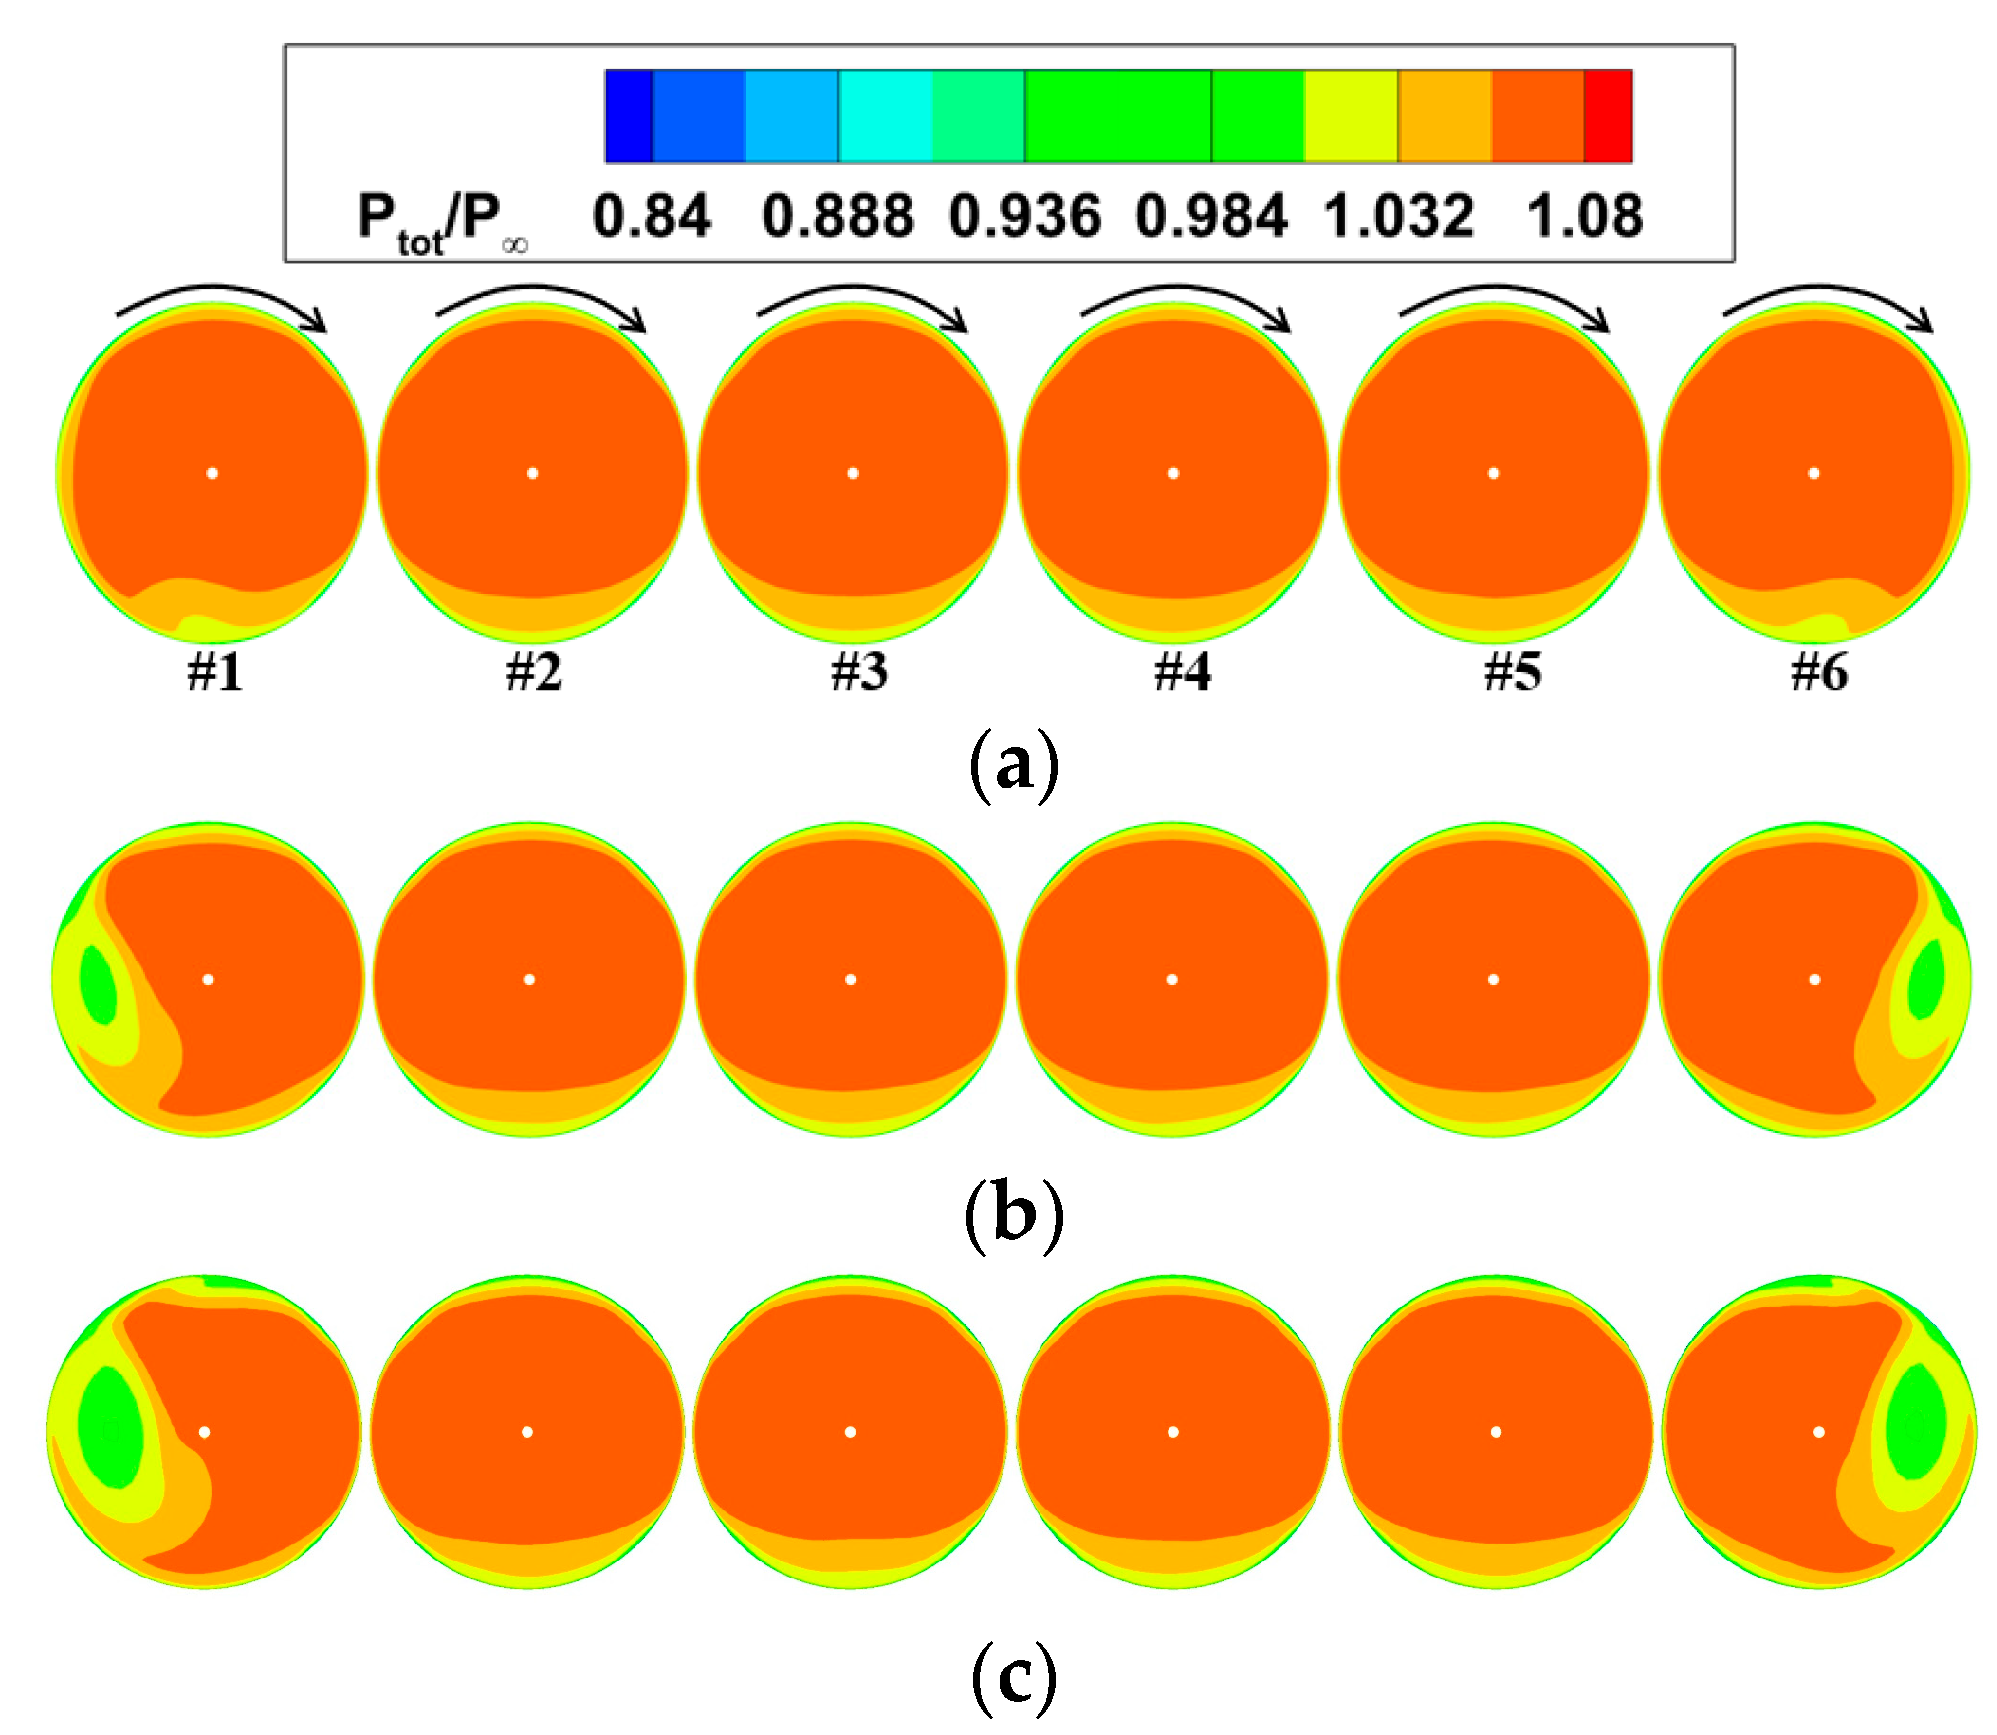
Figure 17 illustrates the total pressure coefficient contours at the entrance of the ducted fans when ΔH = 1.75D. The total pressure coefficient Ptot/P was defined as the ratio of local total pressure to free-stream total pressure. In ducted fans with low and moderate aspect ratios, regions with low total pressure were observed in the outer sections of the edge fans (#1 and #6). These low-pressure regions vanished completely when the aspect ratio reached 10. The intermediate fans (#2~#5) exhibited low-pressure regions in their lower portions. Additionally, the thickness of these low-pressure regions increased proportionally with the aspect ratio. It can also be observed from Figure 17 that the low-pressure regions were asymmetrical. The low-pressure region of fan #1 was slightly larger than that of fan #6. This is related to the rotational direction of the vortex at the entrances of fans #1 and #6.
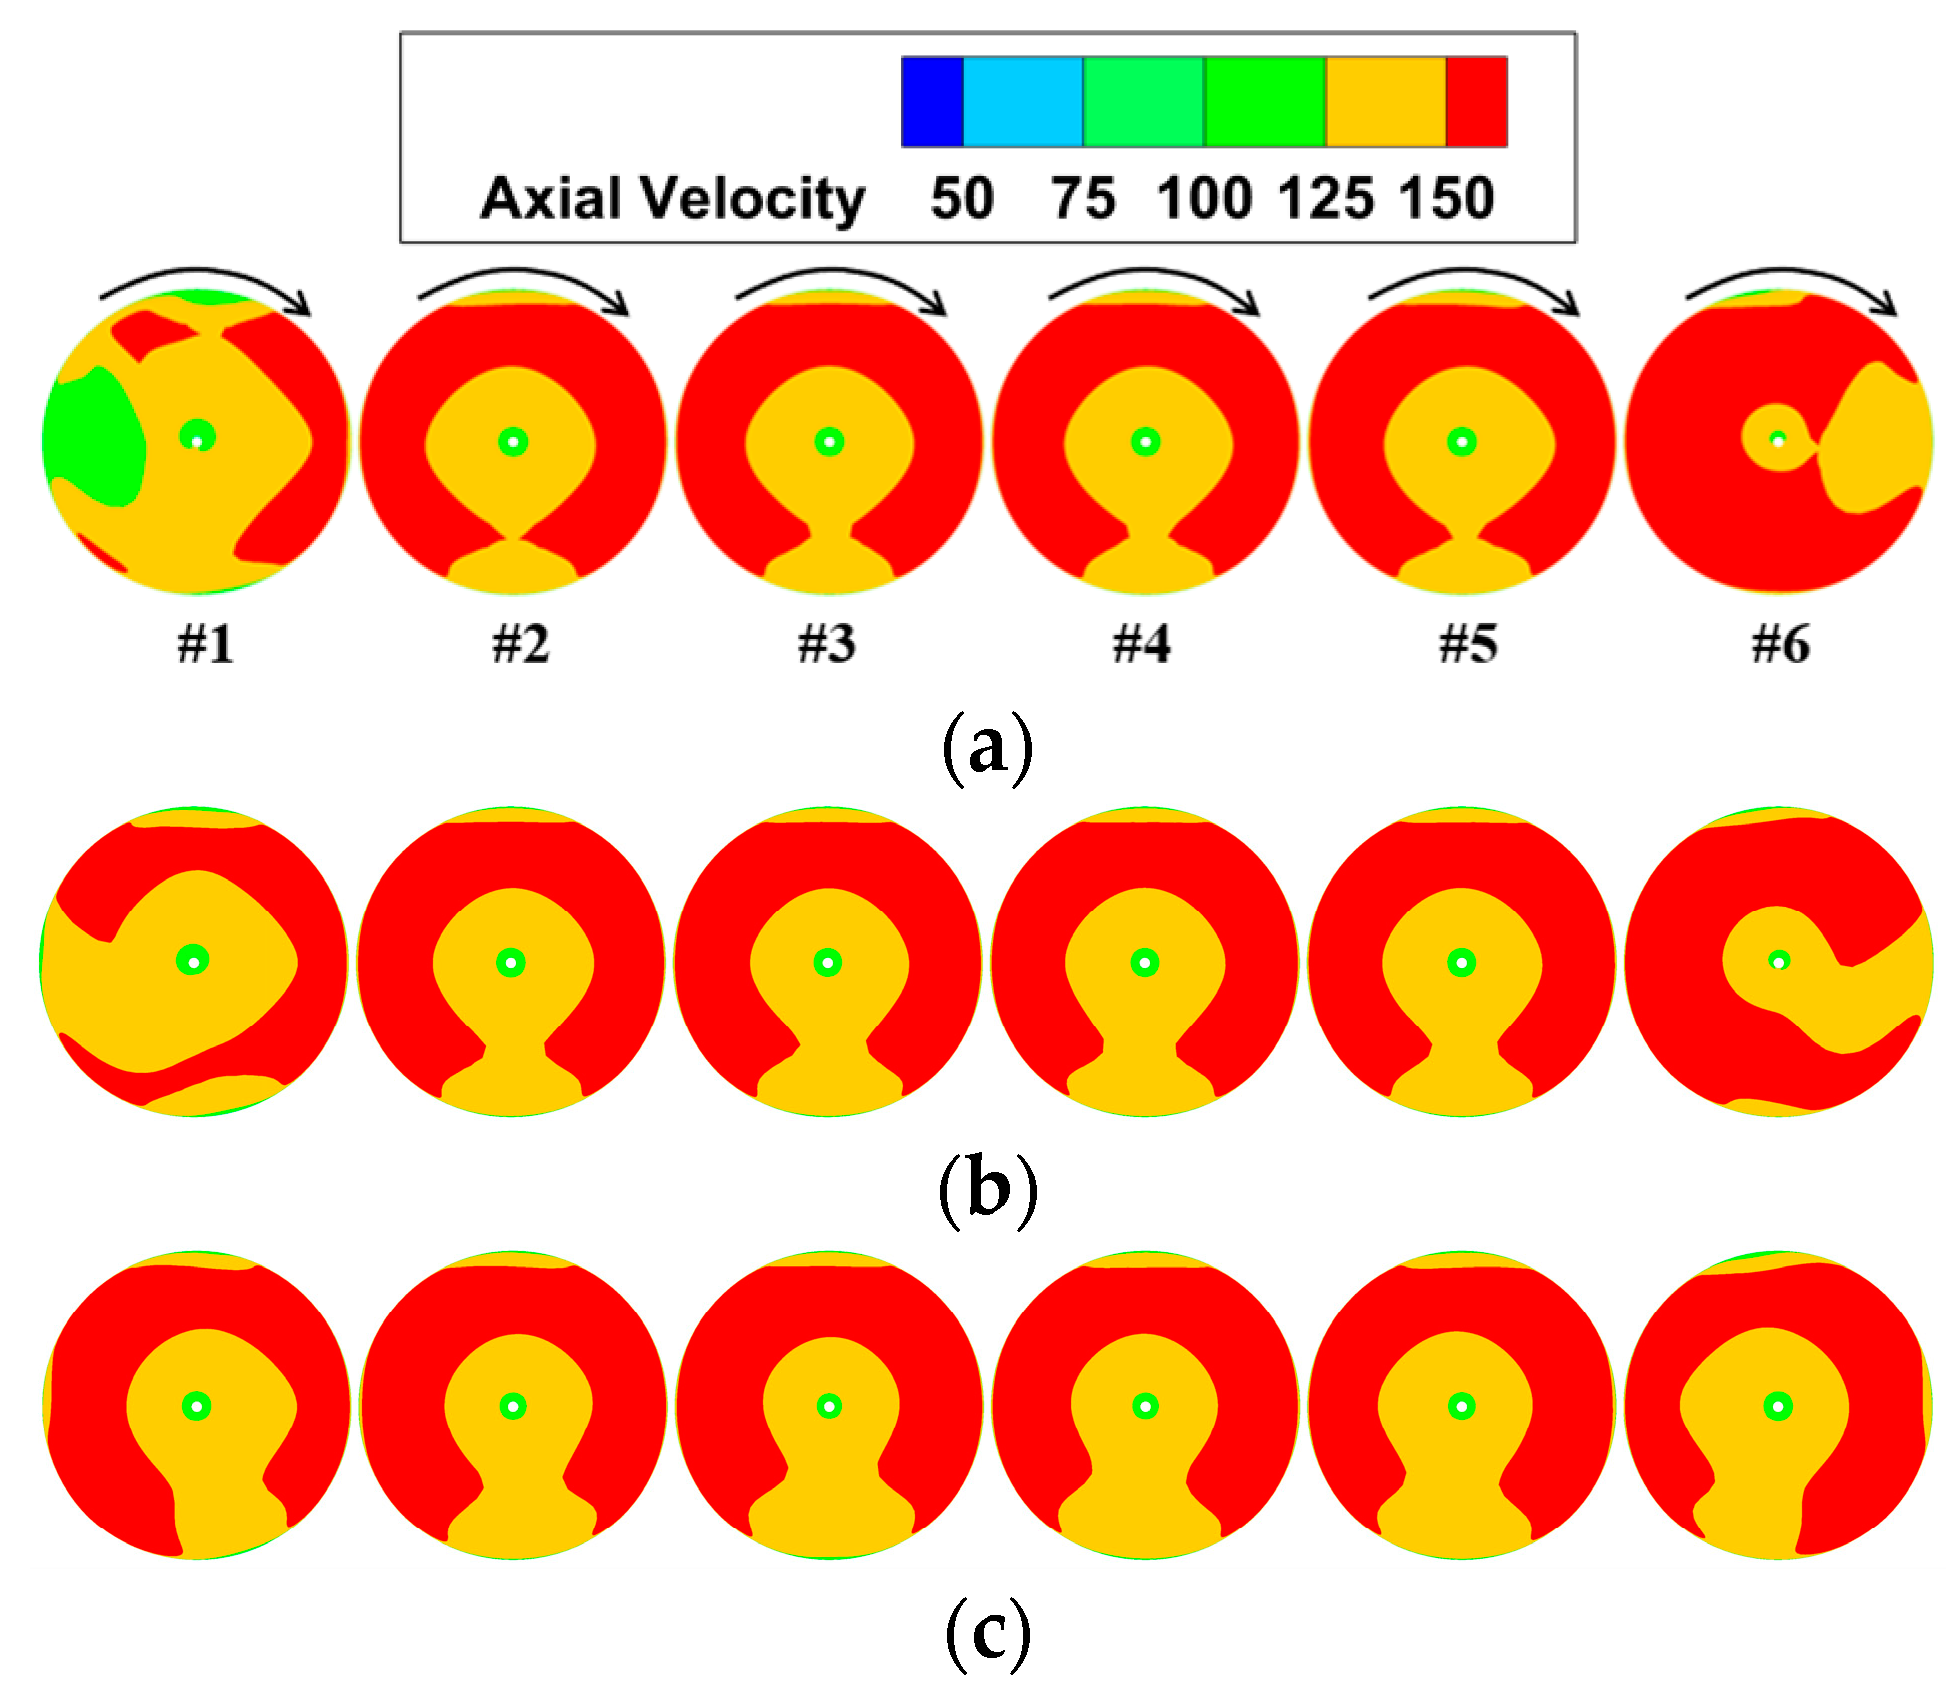
Figure 18 illustrates the axial velocity contours at the entrance of the ducted fans when ΔH = 1.75D. The axial velocity observed at the entrance of fan #1 was evidently lower than that of fan #6. This difference in behavior can be attributed to the contrasting effects of the swirl angles on the two edge fans. Fan #1 experienced a decrease in performance due to the positive swirl angle, whereas fan #6 benefited from the negative swirl angle. Generally, the suction capacity of a ducted fan is affected by the swirl angle at its entrance. When the swirl angle is positive, it diminishes the suction capacity of the fan, causing a decrease in the axial velocity. In contrast, a negative swirl angle at the entrance of the ducted fan improves the suction capacity, resulting in an increase in the axial velocity. This variation in the swirl angle direction is considered the primary factor contributing to the asymmetric distribution of the low-pressure region. Consequently, this asymmetry leads to varying levels of total pressure distortion at the entrances of the edge fans.
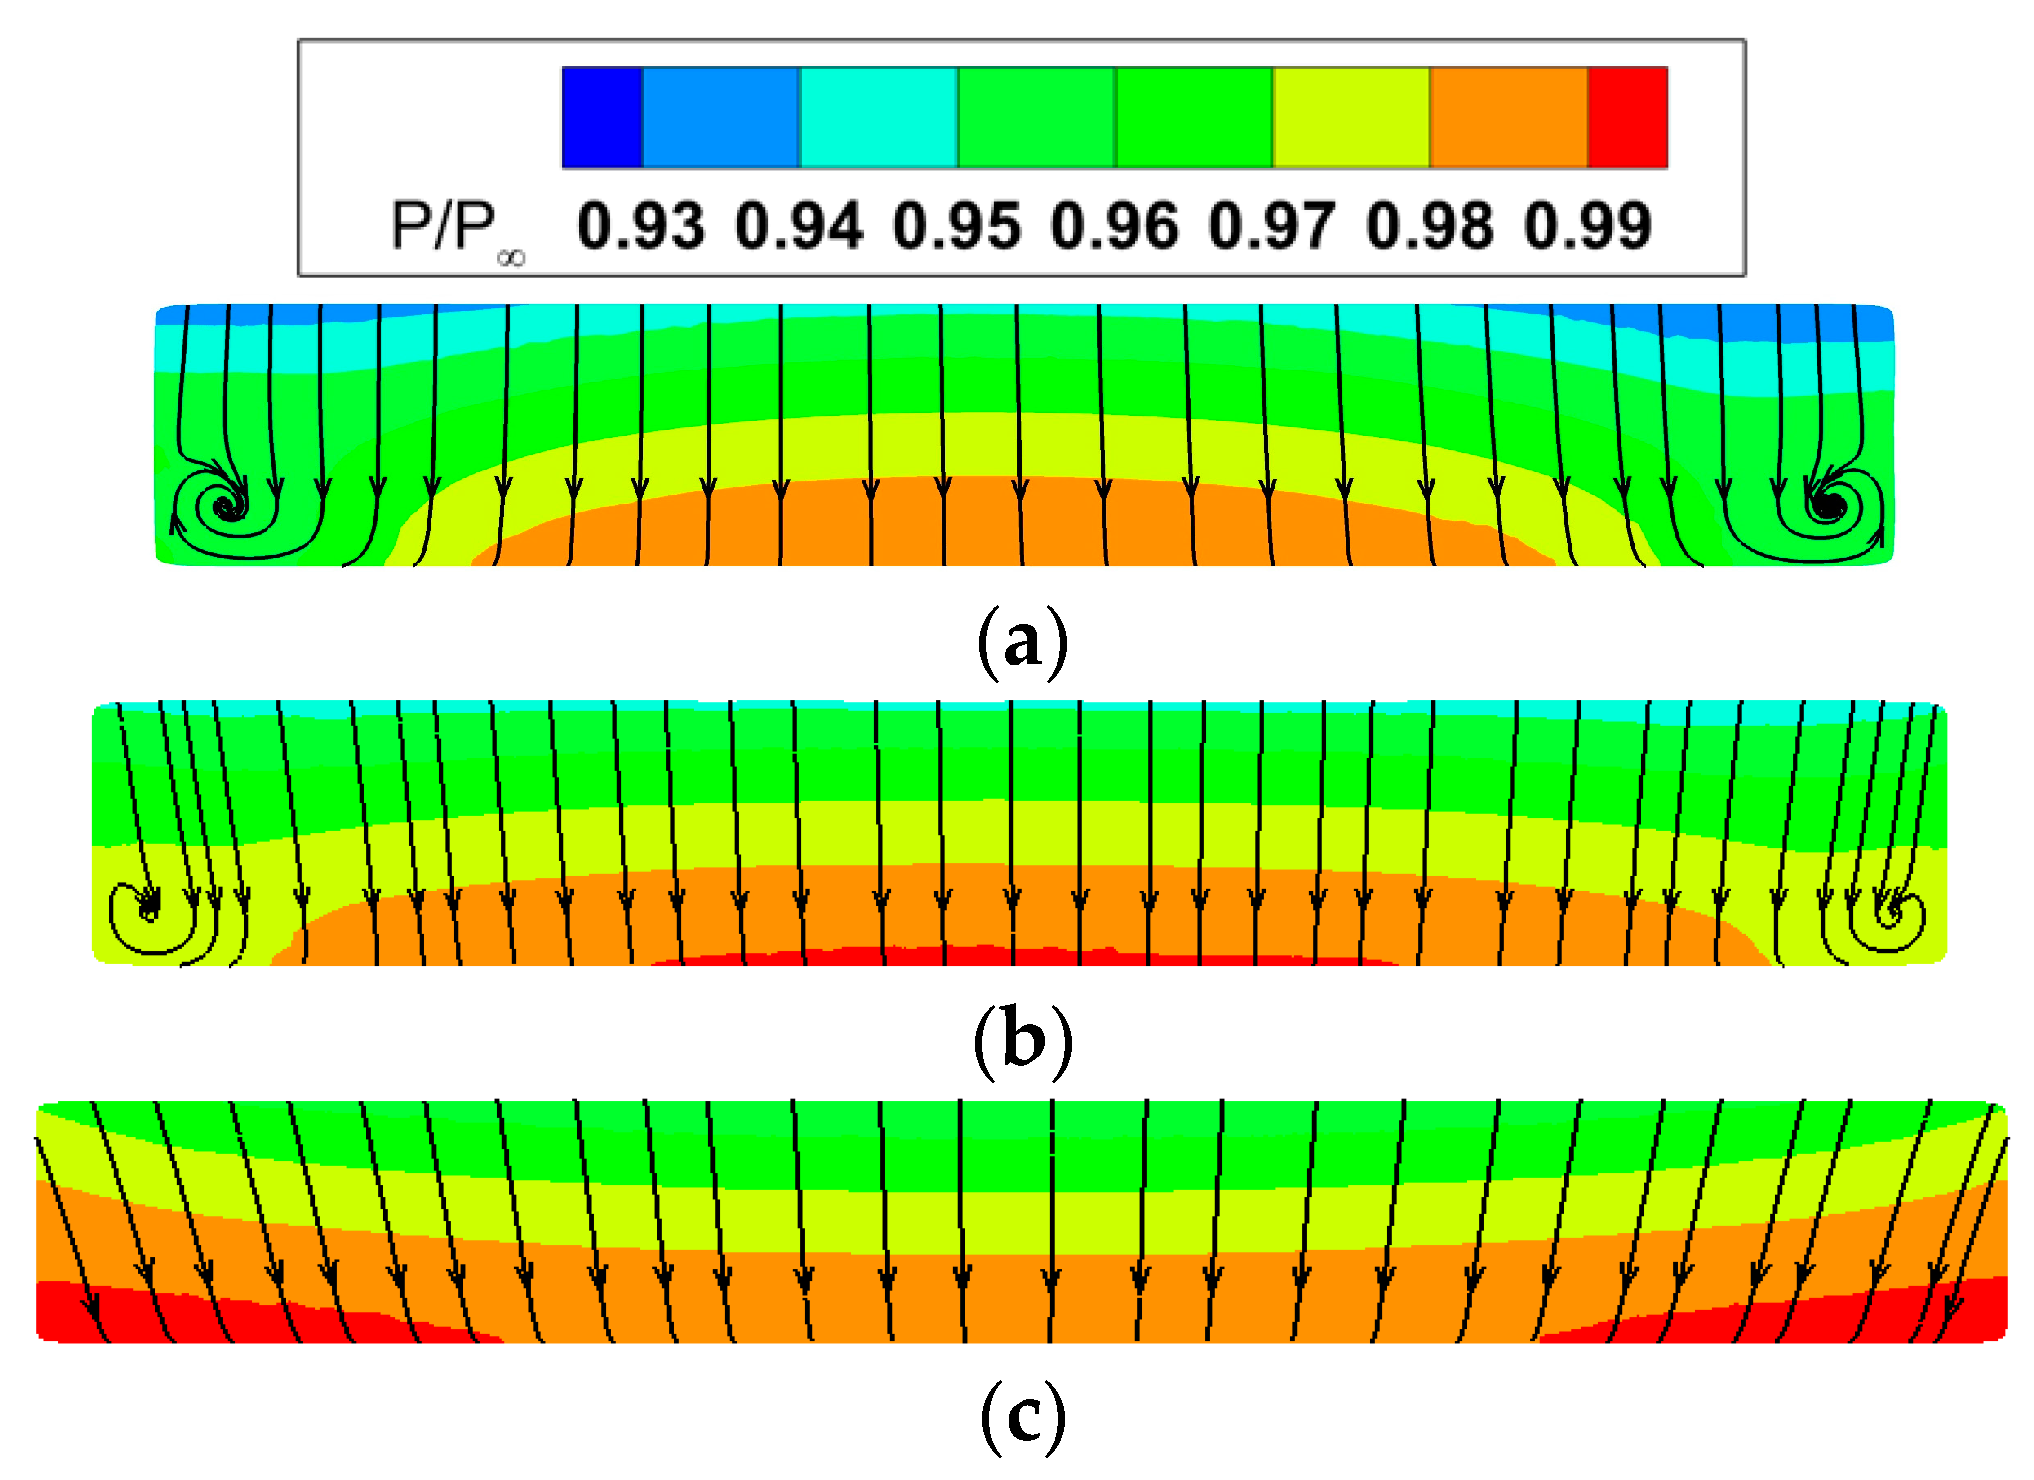
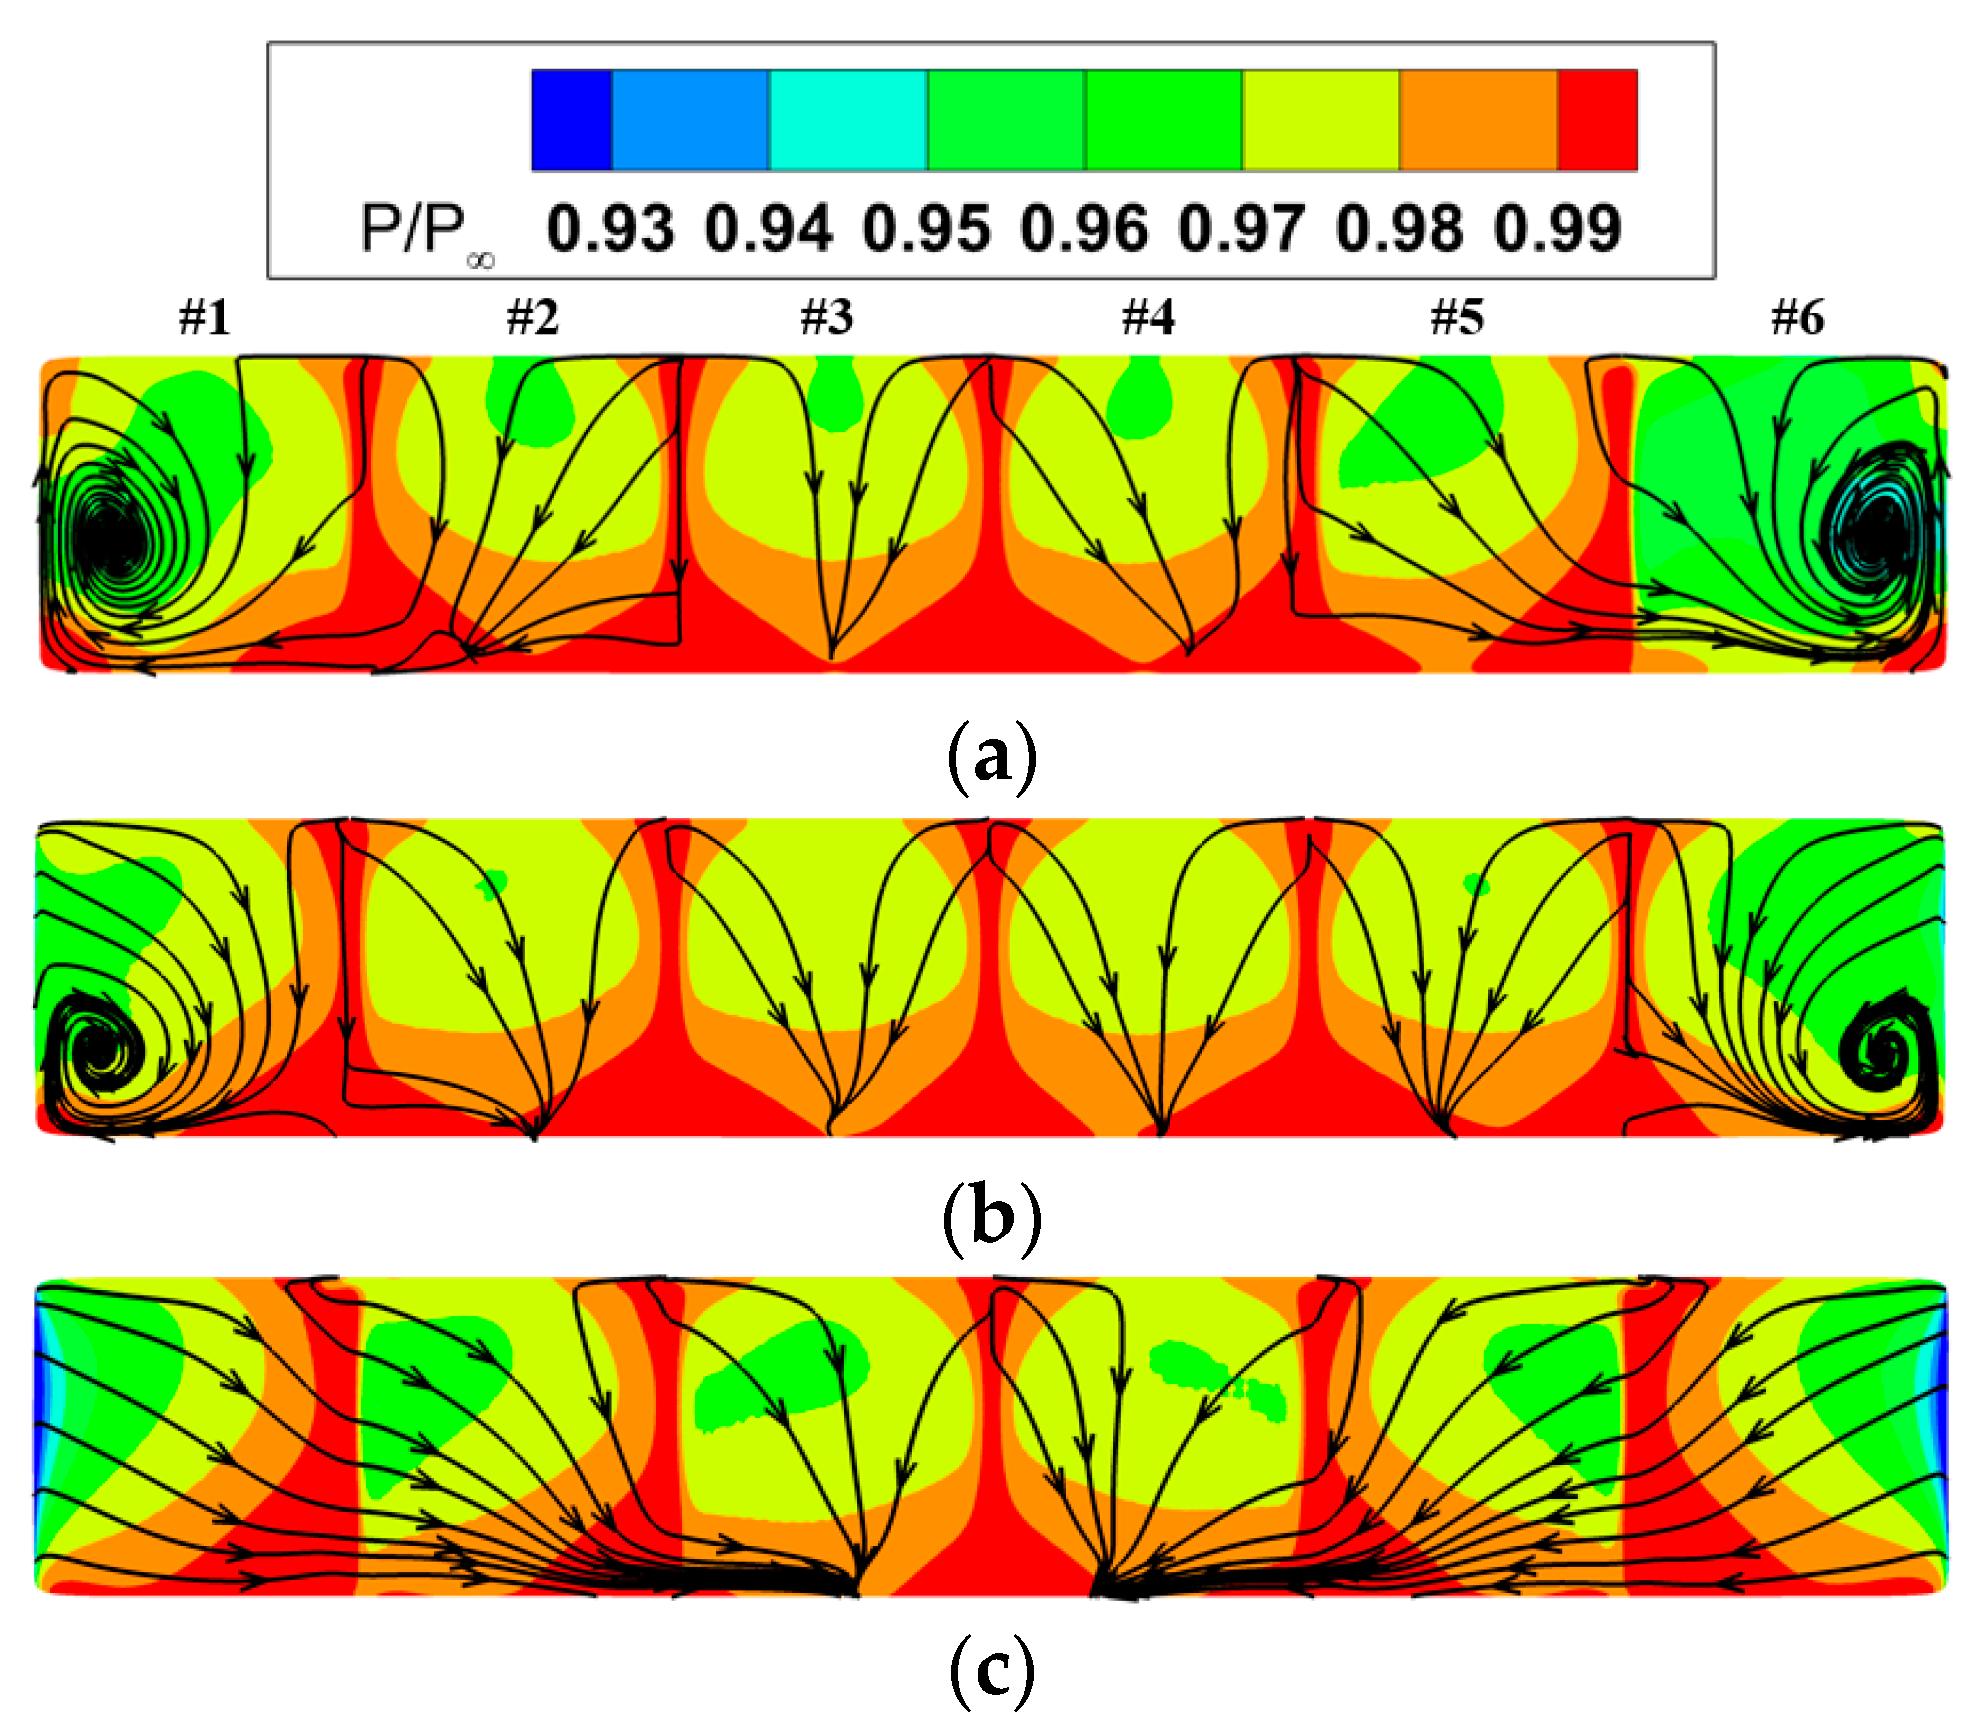
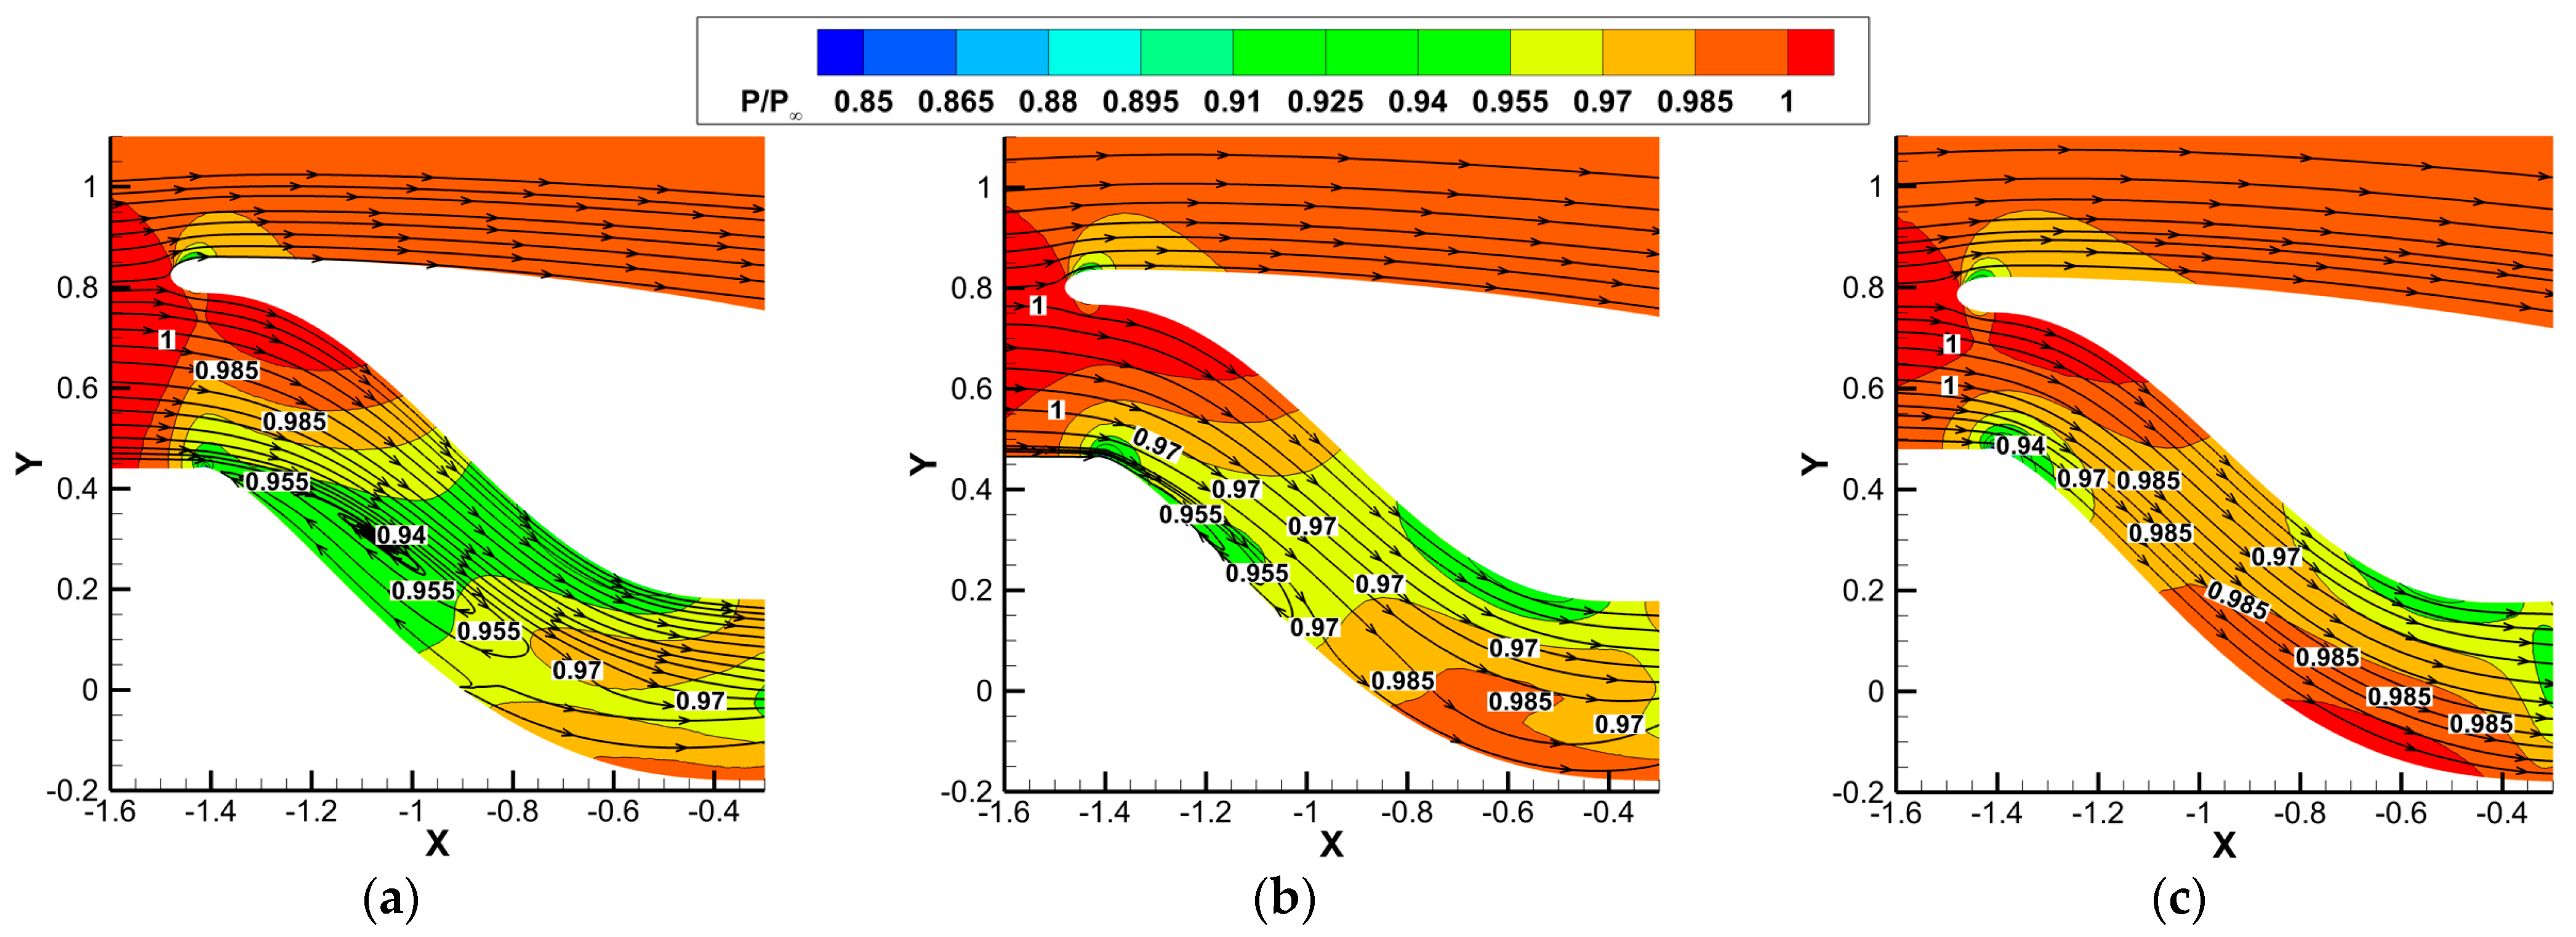
To further examine the reasons for the different swirl angle directions at the entrances of the edge fans, Figure 19 illustrates the interface (called the middle section) between the initial and subsequent bends of the S-shaped duct. Figure 20 and Figure 21 illustrate the static pressure coefficient contours and two-dimensional streamlines in the middle and AIP sections when ΔH = 1.75D, respectively (viewed from entrance to exit). The static pressure coefficient was defined as the ratio of local static pressure to free-stream static pressure.
The variation in the aspect ratio substantially influences the static pressure and vortex formation in the S-shaped duct. After the airflow passed through the initial bend, a transverse static pressure gradient emerged in the middle section. When AR = 6, the middle exhibited a higher static pressure than the side walls, with a distinct pair of counter-rotating vortices forming at the junctions of the side wall and lower end wall. The transverse static pressure gradient diminished and the vortex size decreased when AR = 8. As the aspect ratio reached 10, the direction of the static pressure gradient changed, resulting in a higher static pressure near the side walls than in the middle and the disappearance of vortices near the side walls. This can be attributed to the significant impact of the side wall curvature on the localized flow behavior. The streamwise contraction of the S-shaped duct is beneficial for suppressing the development of corner separation.
In the AIP section, the counter-rotating vortices expanded further, encompassing nearly half of the edge fan inlet section after the airflow passed through the second bend. Meanwhile, the airflow at the AIP section of fans #2 and #5 experienced deflection due to the low-energy flow in front of these fans being influenced by the vortices near the side walls. When AR = 8, the vortices near the side walls diminished in size, and low-energy fluid was predominantly ingested by the four central ducted fans. Furthermore, the vortex center shifted closer to the lower wall. When AR = 10, the low-energy fluid accumulated towards the AIP section of the intermediate fans, whereas the vortices near the side walls disappeared. Thus, the total pressure loss in the AIP section of the edge fans was the smallest, whereas that in the AIP section of the intermediate fans was the largest when AR = 10. These observations suggest that increasing the aspect ratio mitigates the negative impacts of the offset on the airflow within an S-shaped duct to some extent.
Figure 22 illustrates the static pressure contours in the meridional section (shown in Figure 19) of the S-shaped duct for different aspect ratios when ΔH = 1.75D. A large recirculation zone was observed near the lower end wall of the duct when AR = 6. This recirculation zone occupied approximately 60% of the duct axial length and 40% of the duct height. When AR = 8, the backflow still existed, but the scale was significantly reduced. The separation zone occupied approximately 36% of the duct axial length and 13% of the duct height. When the aspect ratio increased to 10, the recirculation zone almost disappeared. Increasing the aspect ratio can accelerate the velocity of the low-energy fluid, thus mitigating the unfavorable pressure gradient along the S-shaped duct.
To quantitatively evaluate the inlet swirl distortion of the distributed ducted fans, the swirl distortion index SC60 was employed. This index is characterized by the following definition [44]:
S C 60 = V 2 , max ( 60 ) ¯ V 2 , min ( 60 ) ¯ V ¯
where V 2 , max 60 ¯ and V 2 , min 60 ¯ denote the maximum and minimum average secondary flow velocity in the 60° sector, respectively, and V ¯ denotes the average velocity.
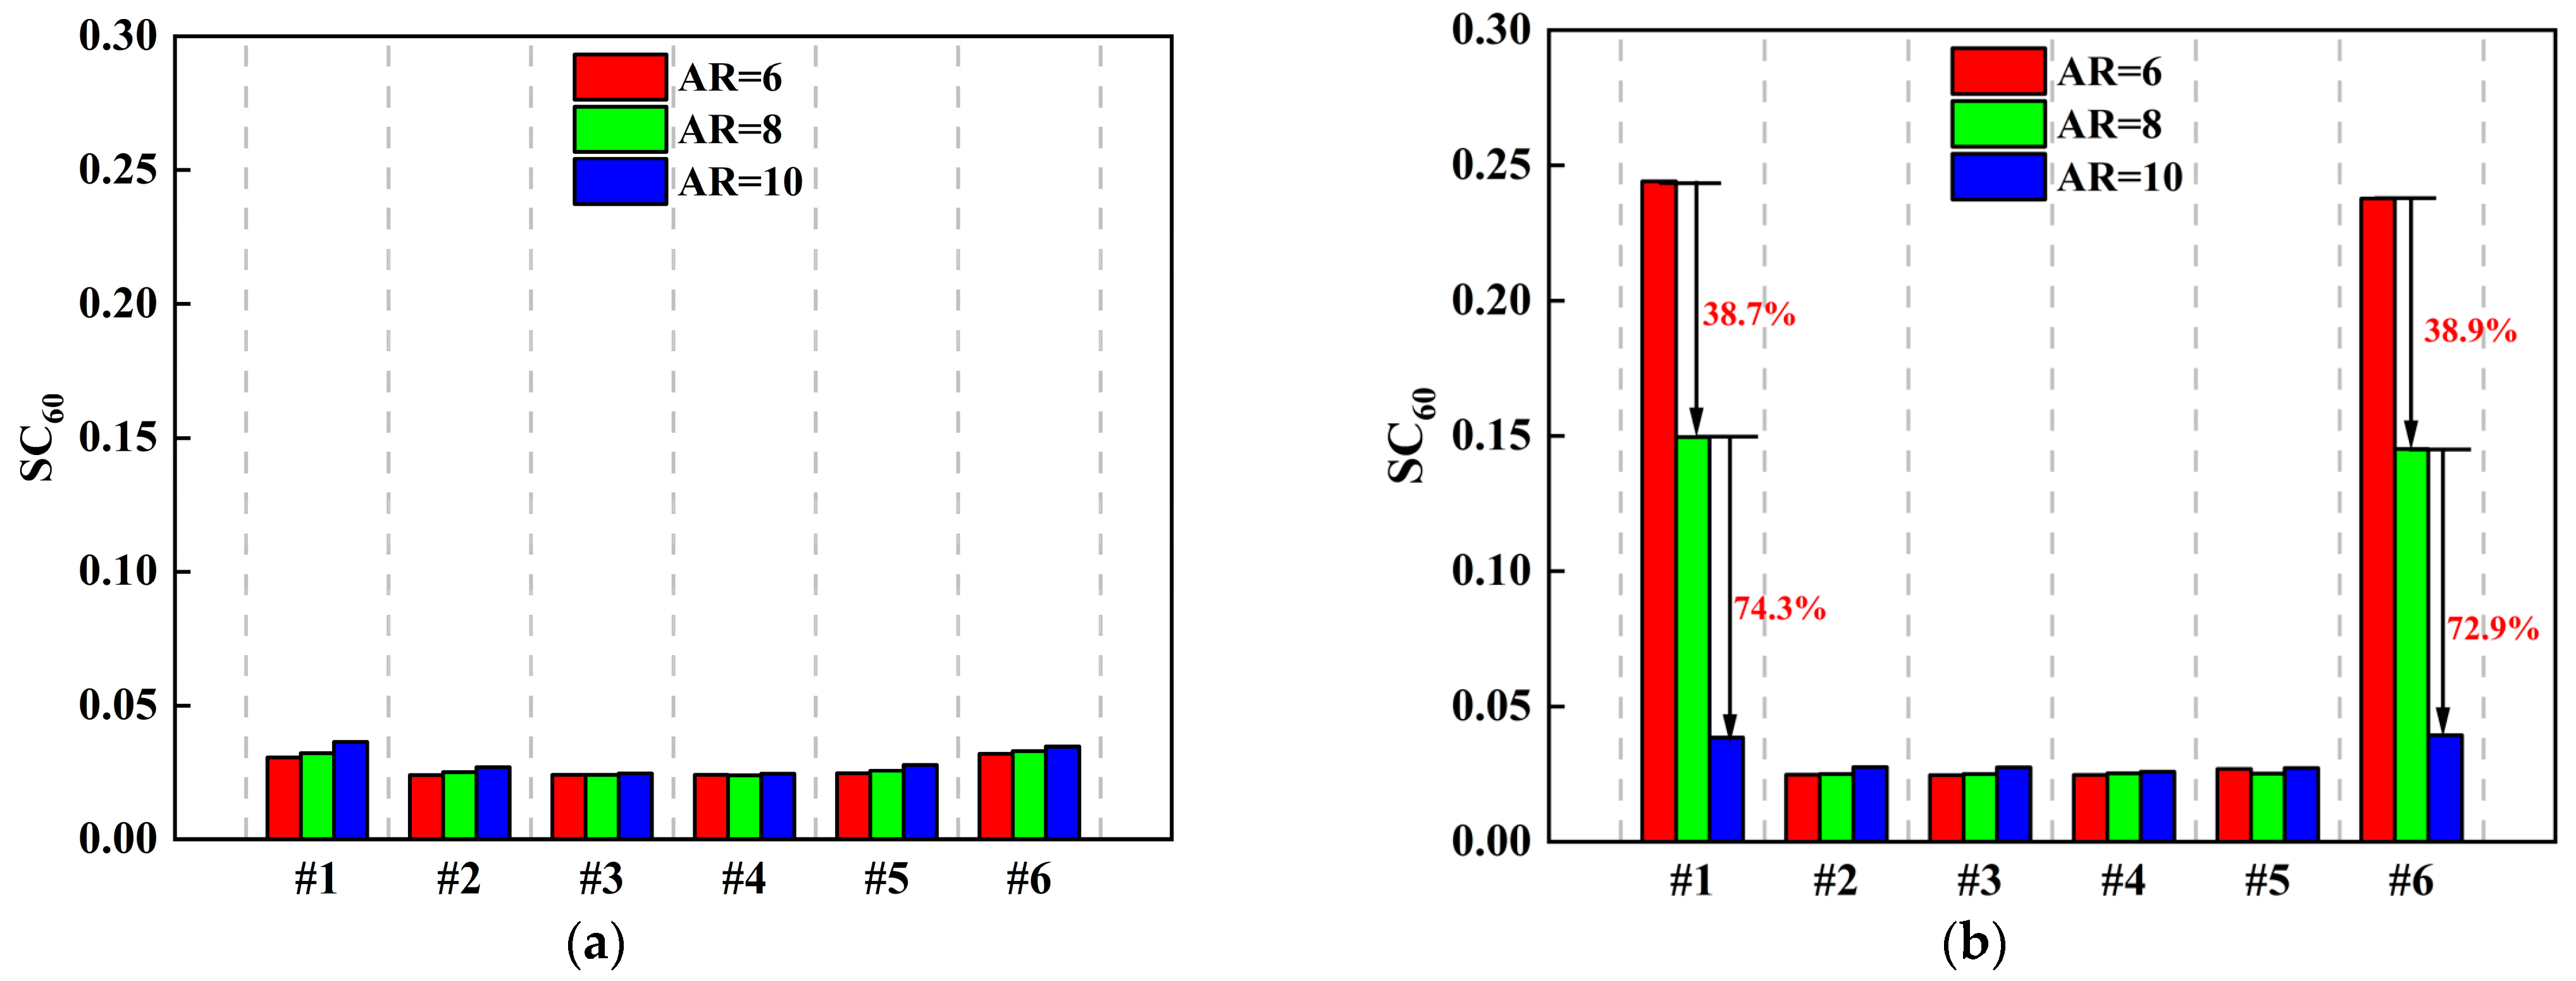
Figure 23 presents the swirl distortion index SC60 of each ducted fan for different aspect ratios. It can be found that the swirl distortion of the edge fans was slightly higher than that of the intermediate fans. The swirl distortion level barely changed with the aspect ratio for a small centerline offset. However, the swirl distortion level of the edge fans changed significantly with respect to the aspect ratio for a large centerline offset. The SC60 was decreased by 38.7% and 38.9% for fans #1 and #6, respectively, when the aspect ratio increased from 6 to 8, whereas the SC60 was decreased by 74.3% and 72.9% for fans #1 and #6, respectively, when the aspect ratio increased from 8 to 10. Additionally, the impact of the aspect ratio on the inlet swirl distortion was nearly symmetrical for the distributed ducted fans.
For further analysis of swirl distortion, swirl angle α was introduced and defined as follows [45]:
α = arctan V θ V x
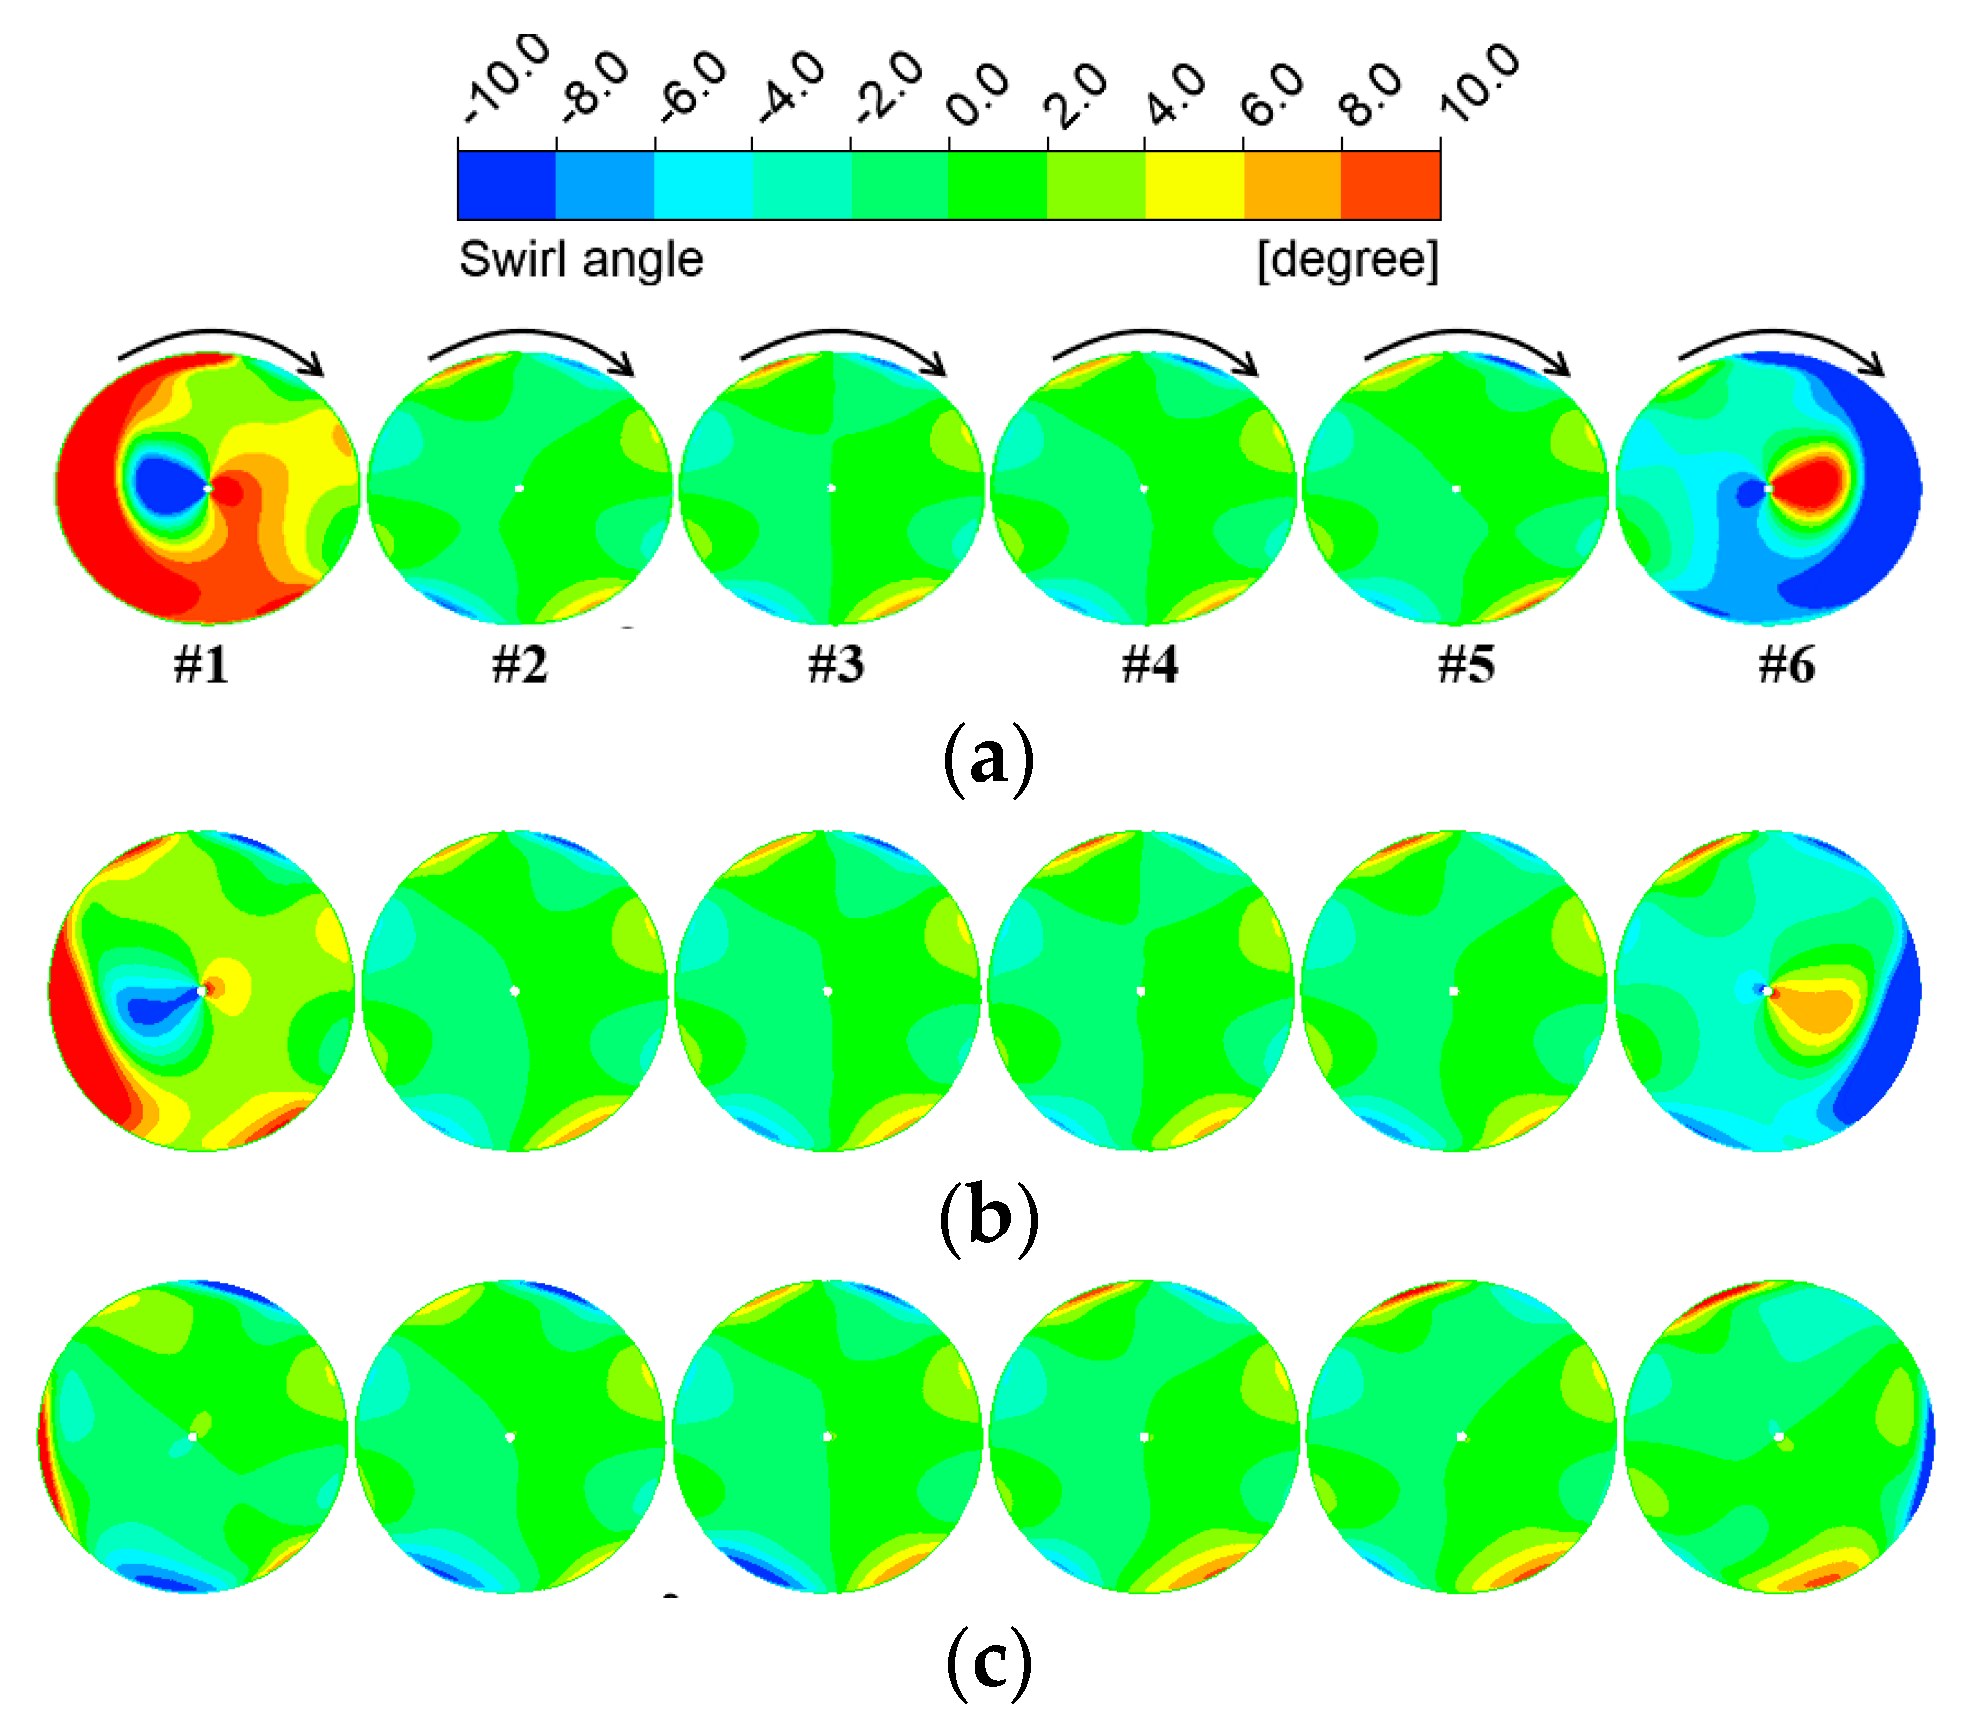
where Vθ and Vx denote the circumferential and axial velocities at the entrance of the ducted fan, respectively. When the swirl angle is positive, it aligns with the direction of fan rotation. Conversely, a negative swirl angle indicates a rotation in the direction opposite to that of the fan. Figure 24 illustrates the swirl angle contours at the entrance of the ducted fan when ΔH = 1.75D. The observations reveal that fans #1 and #6 had swirl angles in the opposite directions. Furthermore, the swirl distortion at the entrance of the edge fan was stronger when the aspect ratio was small. As the aspect ratio increased, the extent of the swirl distortion was remarkably reduced. When the inlet aspect ratio was increased to 10, there was no evident swirl distortion zone in the edge fans. However, the swirl distortion near the bottom portion of the AIP section exhibited a minor increase. Moreover, the contrasting swirl angles of fans #1 and #6 resulted in diminished suction for fan #1 and enhanced suction for fan #6. This directly causes an asymmetric distribution of the total pressure distortion levels between two edge fans.

5.3. Effects of Centerline Offset

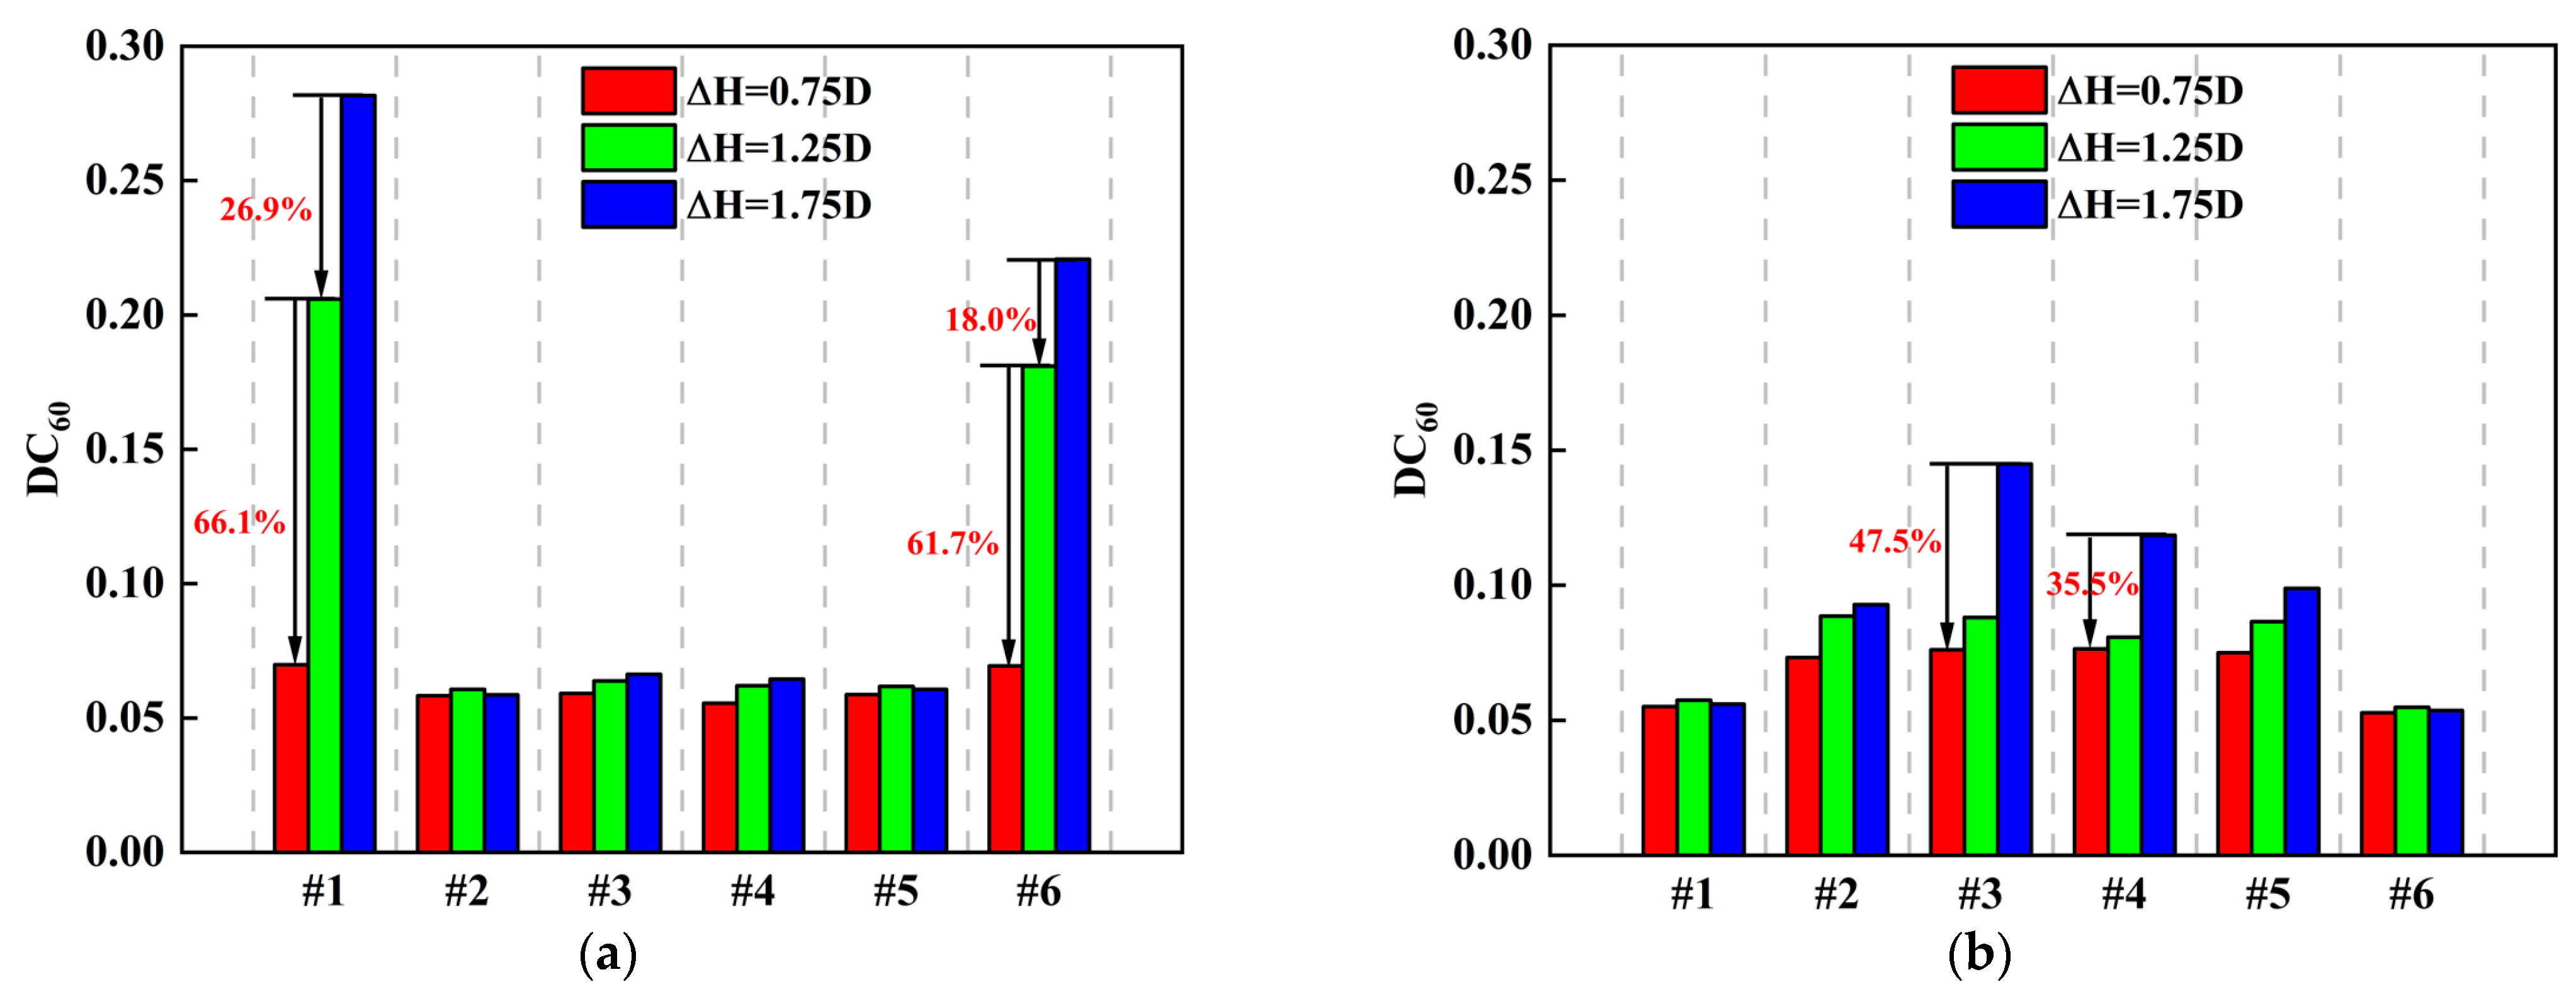
Figure 25 illustrates the total pressure distortion index for each ducted fan at various centerline offsets. The data reveal that as the centerline offset increased, the total pressure distortion index increased. For a duct with a small aspect ratio, the centerline offset exhibited a more pronounced effect on the total pressure distortion level of the edge fans. The DC60 was decreased by 26.9% and 18.0% for fans #1 and #6, respectively, when the centerline offset decreased from 1.75D to 1.25D, while the DC60 was decreased by 66.1% and 61.7% for fans #1 and #6, respectively, when the centerline offset decreased from 1.25D to 0.75D. The decrease in the total pressure distortion of other ducted fans was relatively small. For a duct with a large aspect ratio, the centerline offset exhibited a more pronounced effect on the total pressure distortion of intermediate fans. The DC60 was decreased by 47.5% and 35.5% for fans #3 and #4, respectively, when the centerline offset decreased from 1.75D to 0.75D. This is because an increase in the centerline offset increased the centrifugal force exerted on the airflow passing through the bend in the S-shaped duct. When the aspect ratio is small, an increase in the centerline offset leads to an increase in centrifugal force within the duct. This makes airflow separation more probable, leading to an increase in the total pressure distortion. Conversely, for a large aspect ratio, changes in the side wall curvature cause the low-energy fluid to accelerate, mitigating the increase in the total pressure distortion that would otherwise occur due to the increased centerline offset.
Figure 26 and Figure 27 illustrate the total pressure coefficient contours at the entrance of the ducted fan when AR = 6 and AR = 10, respectively. In the case of a small aspect ratio, the edge fans experienced expansion of the low-pressure region as the centerline offset increased. A substantial total pressure loss became evident at the entrance of the edge fans when the centerline offset reached 1.25D. However, the low-pressure region in the lower half of the intermediate fans exhibited minimal changes. In the case of a large aspect ratio, a low-pressure region was observed in the lower half of each edge fan. As the centerline offset increased, the thickness of the low-pressure region at the entrance of the intermediate fans increased.
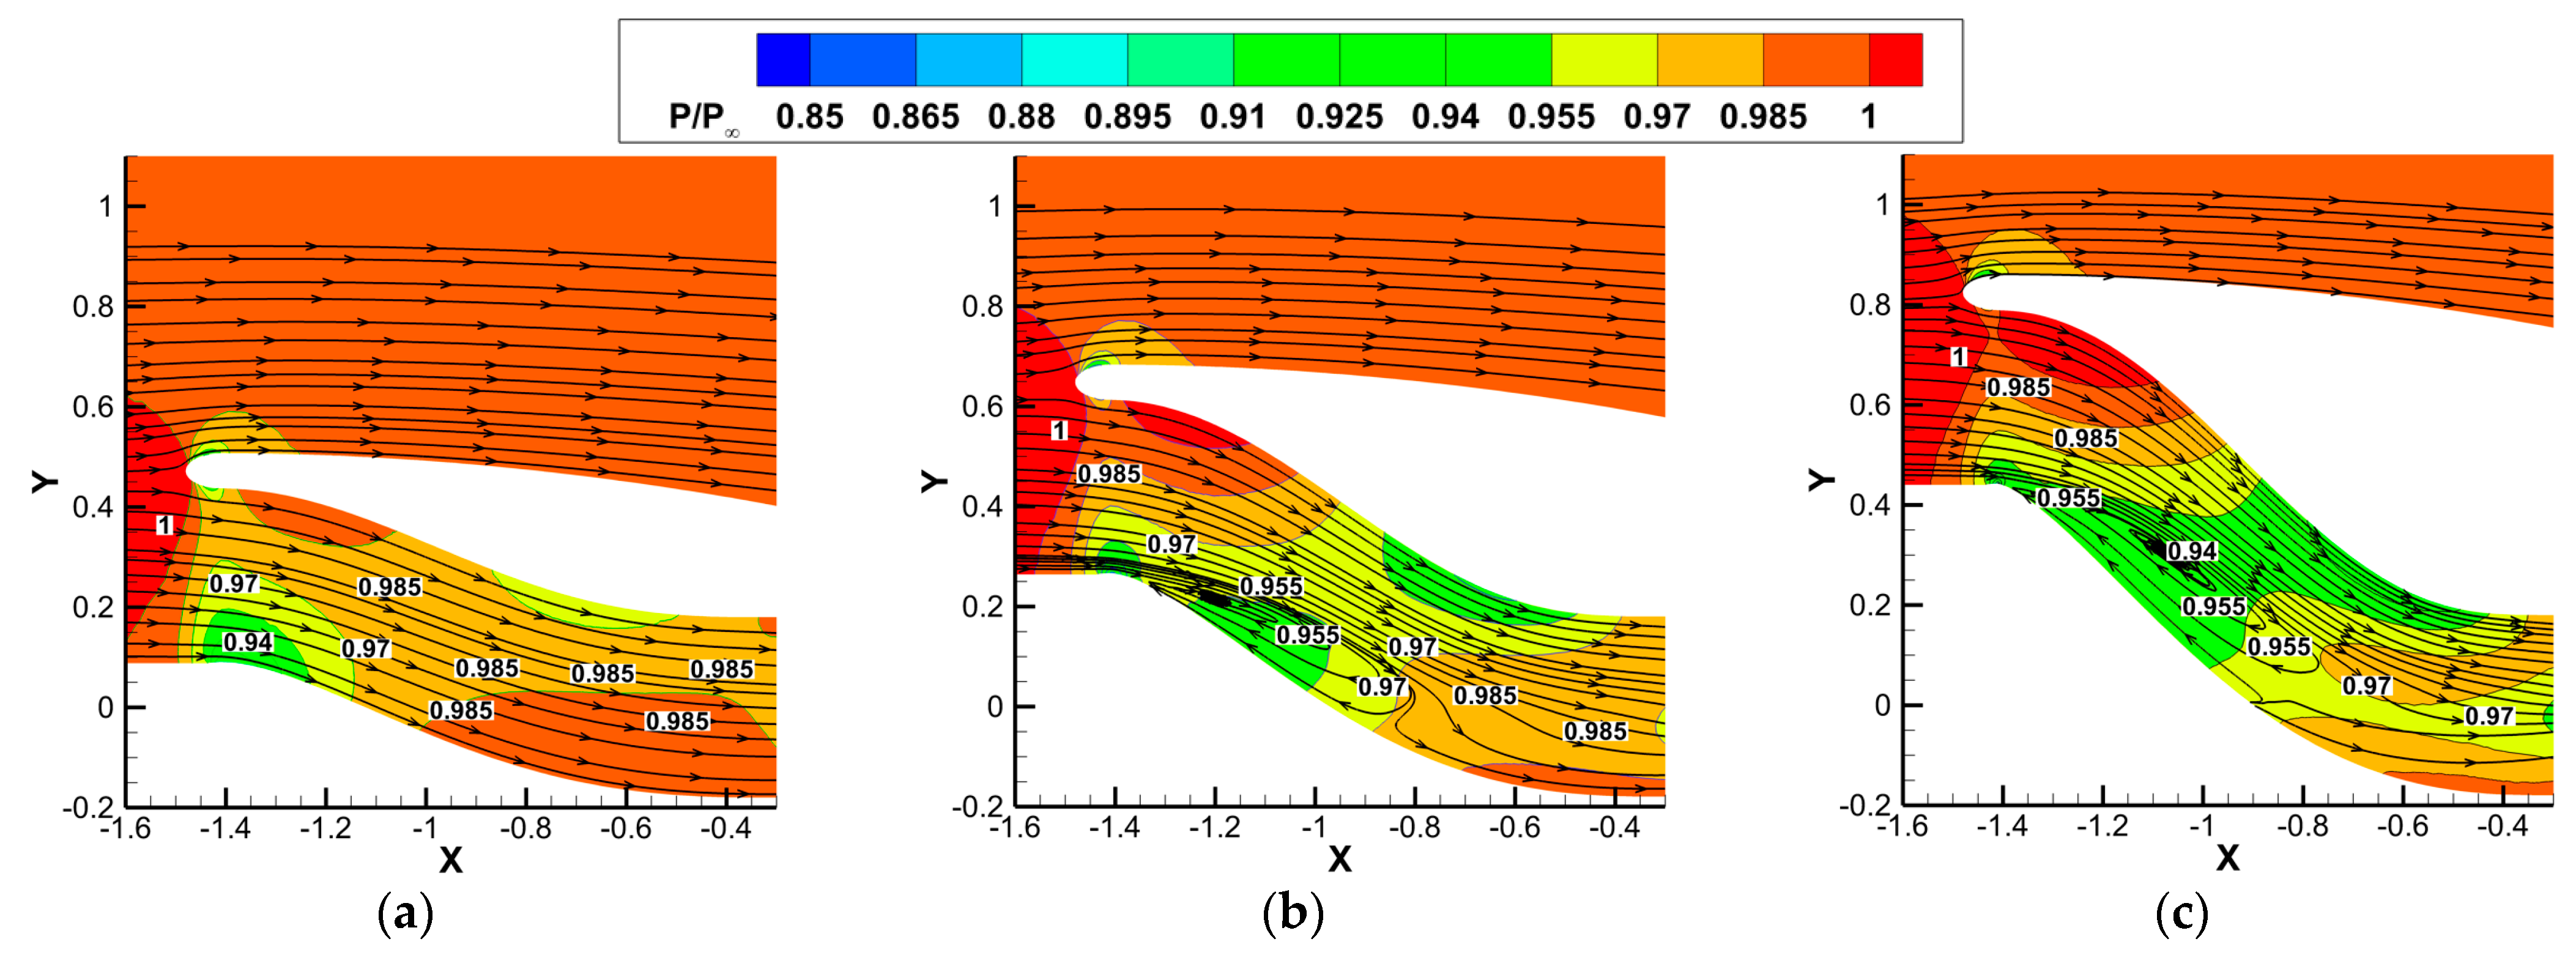
Figure 28 illustrates the static pressure contours in the meridional section (shown in Figure 19) of the S-shaped duct at various centerline offsets when AR = 6. A substantial recirculation zone was observed near the lower end wall when ΔH = 1.75D. Although the backflow persisted for ΔH = 1.25D, its extent was notably diminished, with the recirculation zone occupying approximately 45% of the duct axial length and 25% of the duct height. The recirculation zone completely disappeared when the centerline offset decreased to ΔH = 0.75D. This indicates that lowering the centerline offset can mitigate the adverse pressure gradient along the duct and inhibit the vortex formation near the side walls. It can be explained by the fact that a decrease in the centerline offset can reduce the effect of the centrifugal force exerted on the airflow and suppress the flow separation.
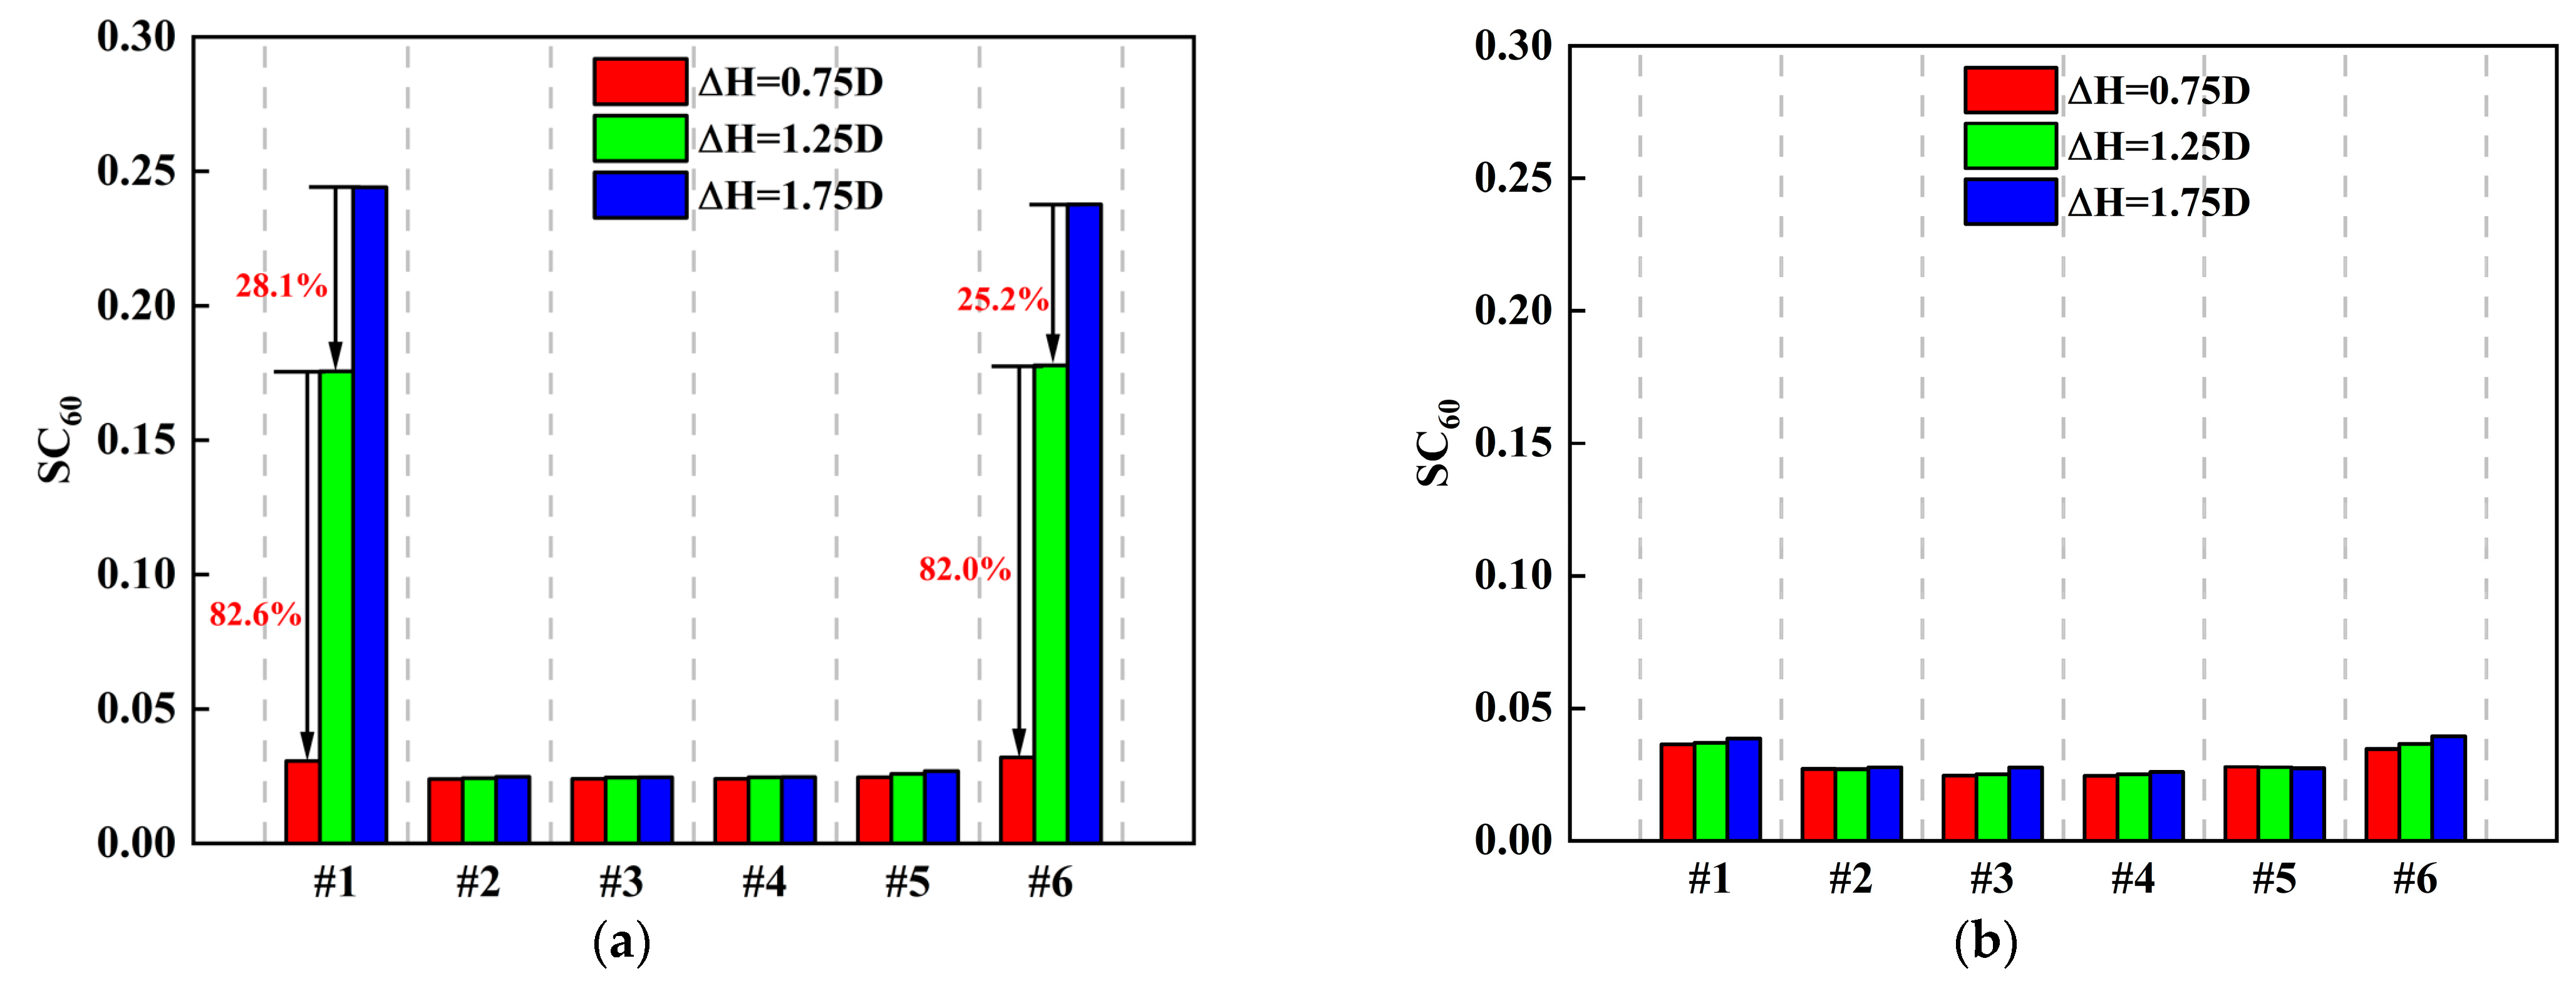
Figure 29 illustrates the swirl distortion index for each ducted fan at various centerline offsets. For edge fans, a notable reduction in the swirl distortion level was observed as the centerline offset decreased, particularly for the duct with a small aspect ratio. In contrast, the intermediate fans exhibited minimal changes in swirl distortion levels. The SC60 was decreased by 28.1% and 25.2% for fans #1 and #6, respectively, when the centerline offset decreased from 1.75D to 1.25D, while the SC60 was decreased by 82.6% and 82.0% for fans #1 and #6, respectively, when the centerline offset decreased from 1.25D to 0.75D. Additionally, the impact of the centerline offset on the inlet swirl distortion was nearly symmetrical. However, the reduction in the swirl distortion level was comparatively minor for large aspect ratios.
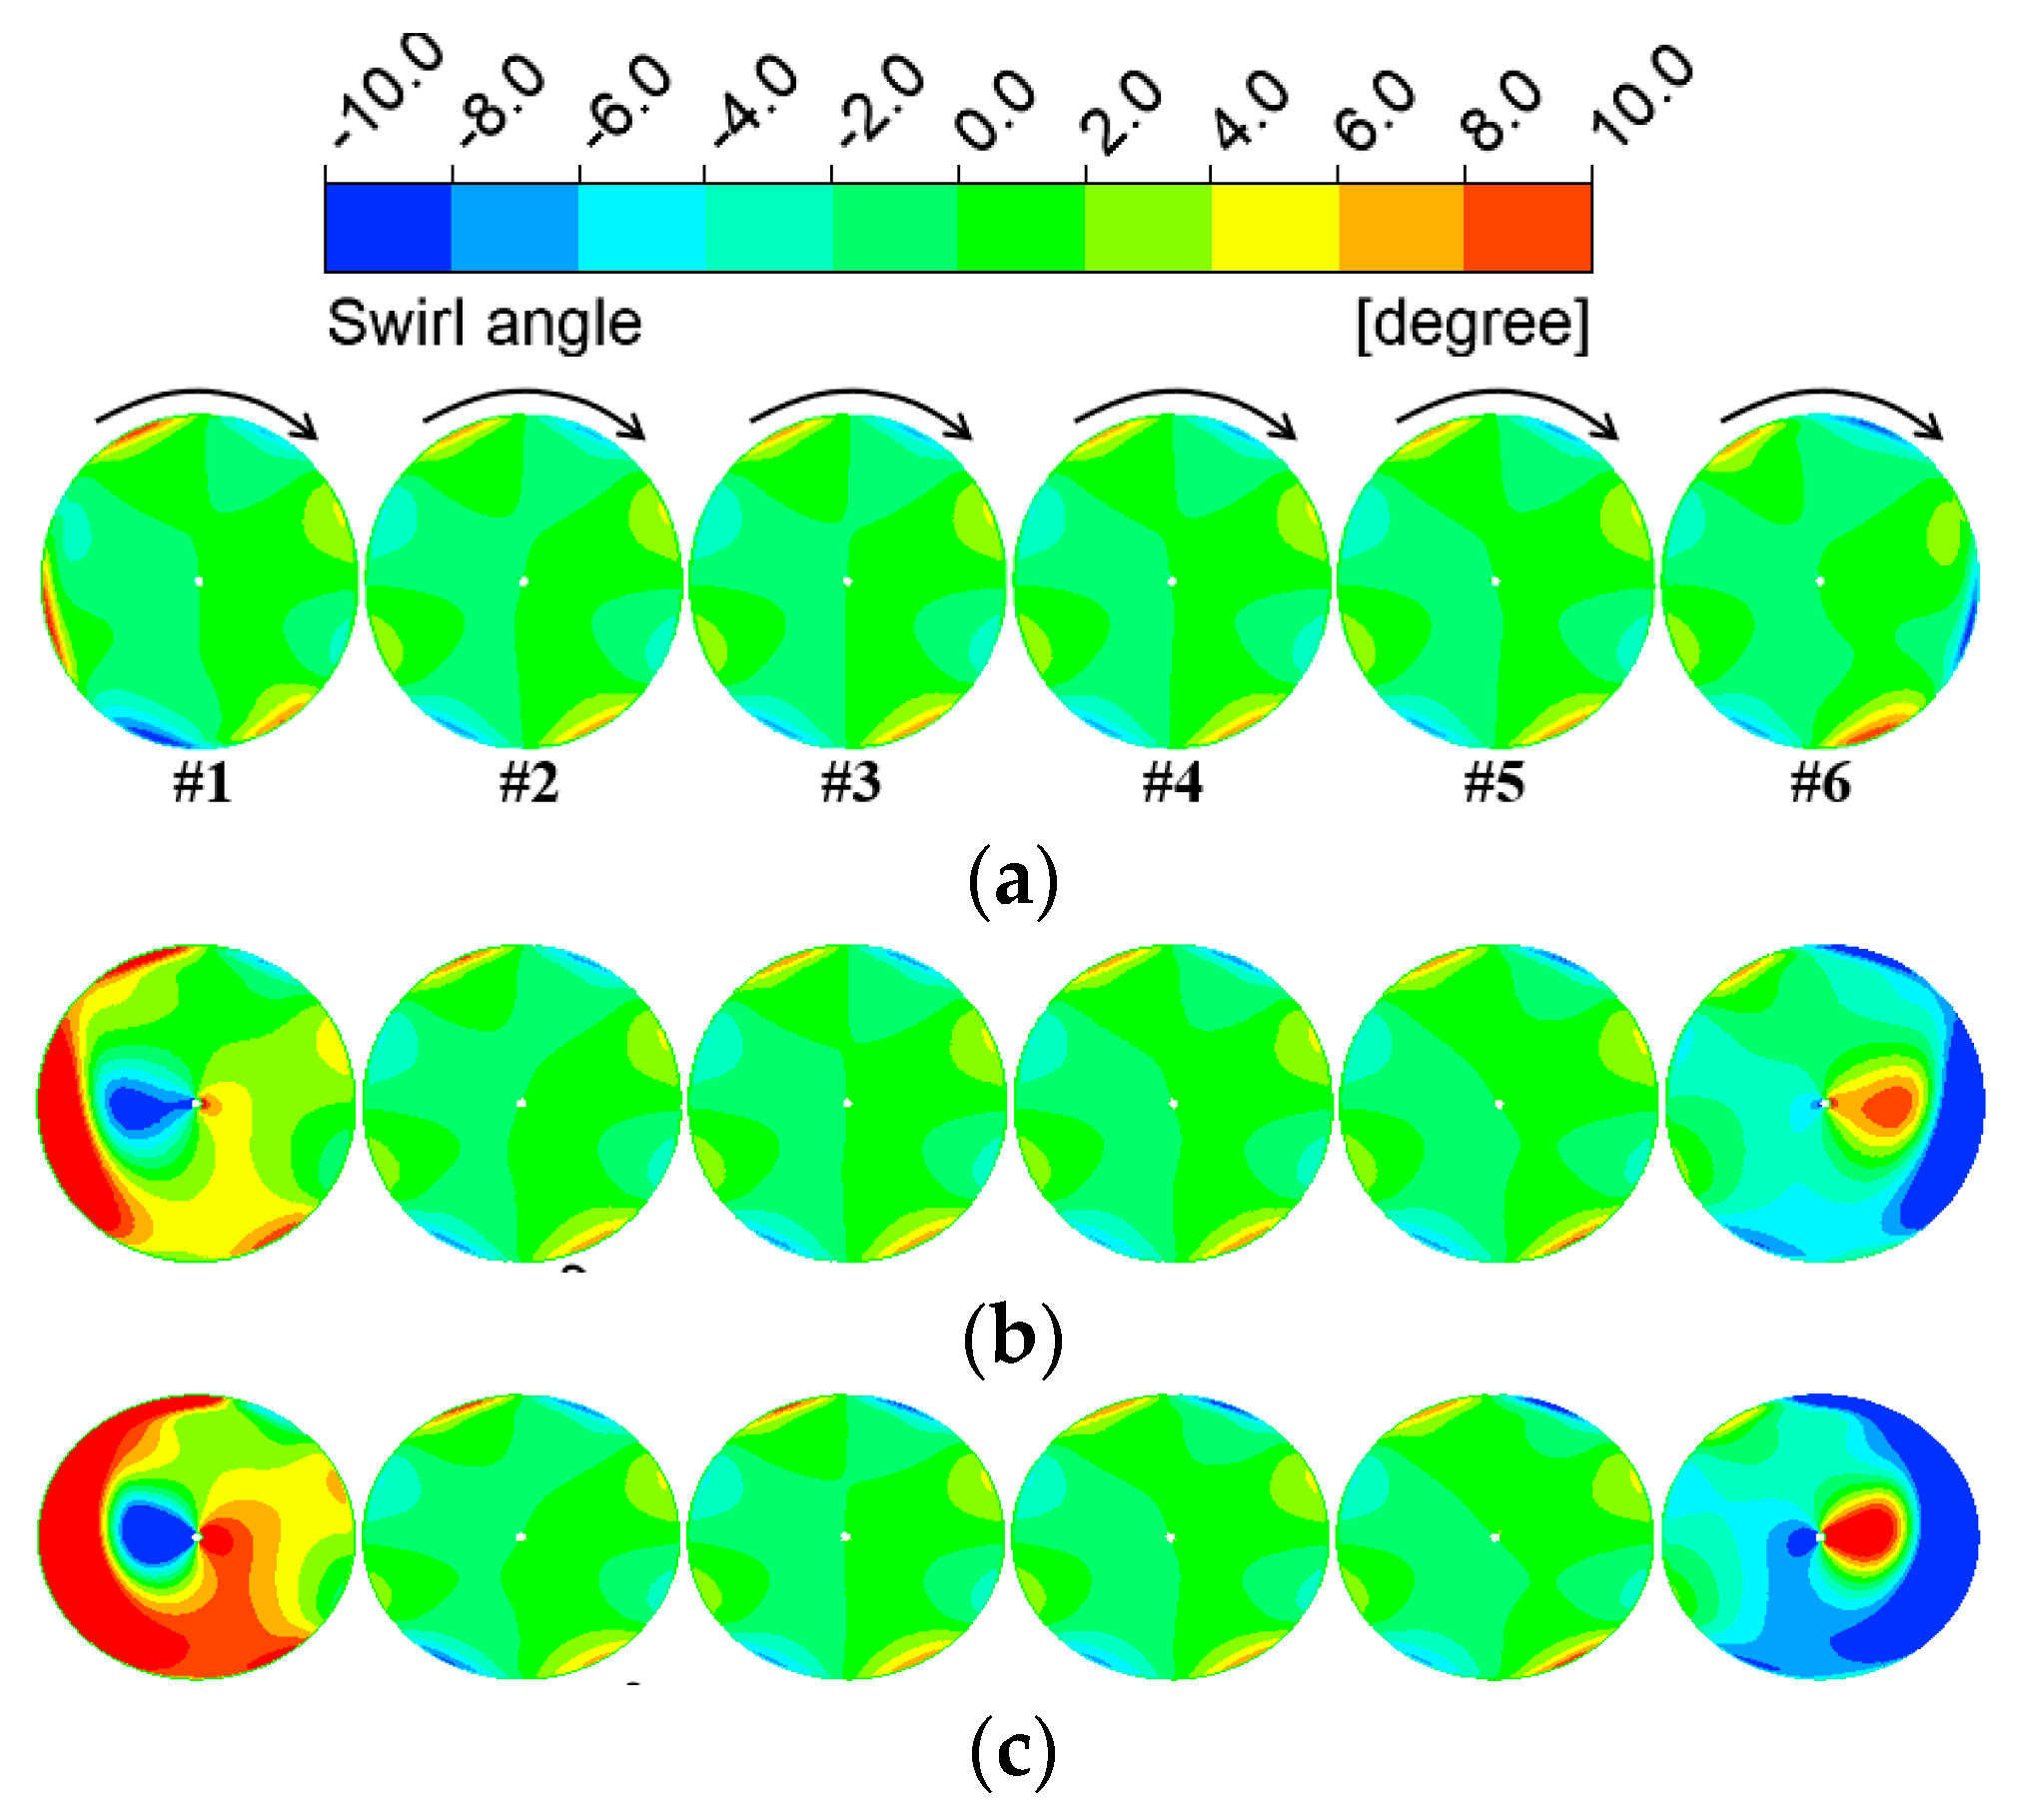
Figure 30 illustrates the swirl angle contours at the entrance of the ducted fan when AR = 6. The distribution of the swirl angle was notably influenced by the centerline offset. Minimal changes in the swirl angle were observed at the entrance of each ducted fan when the centerline offset was small. As the centerline offset increased, fan #1 exhibited predominantly positive swirl angles, whereas fan #6 exhibited mostly negative swirl angles. Further enlargement of the centerline offset resulted in more pronounced swirl angle changes for the edge fans, with little impact on the intermediate fans. Consequently, it appears that the most significant inlet distortion in ducted fans occurs when a small aspect ratio is combined with a large centerline offset.
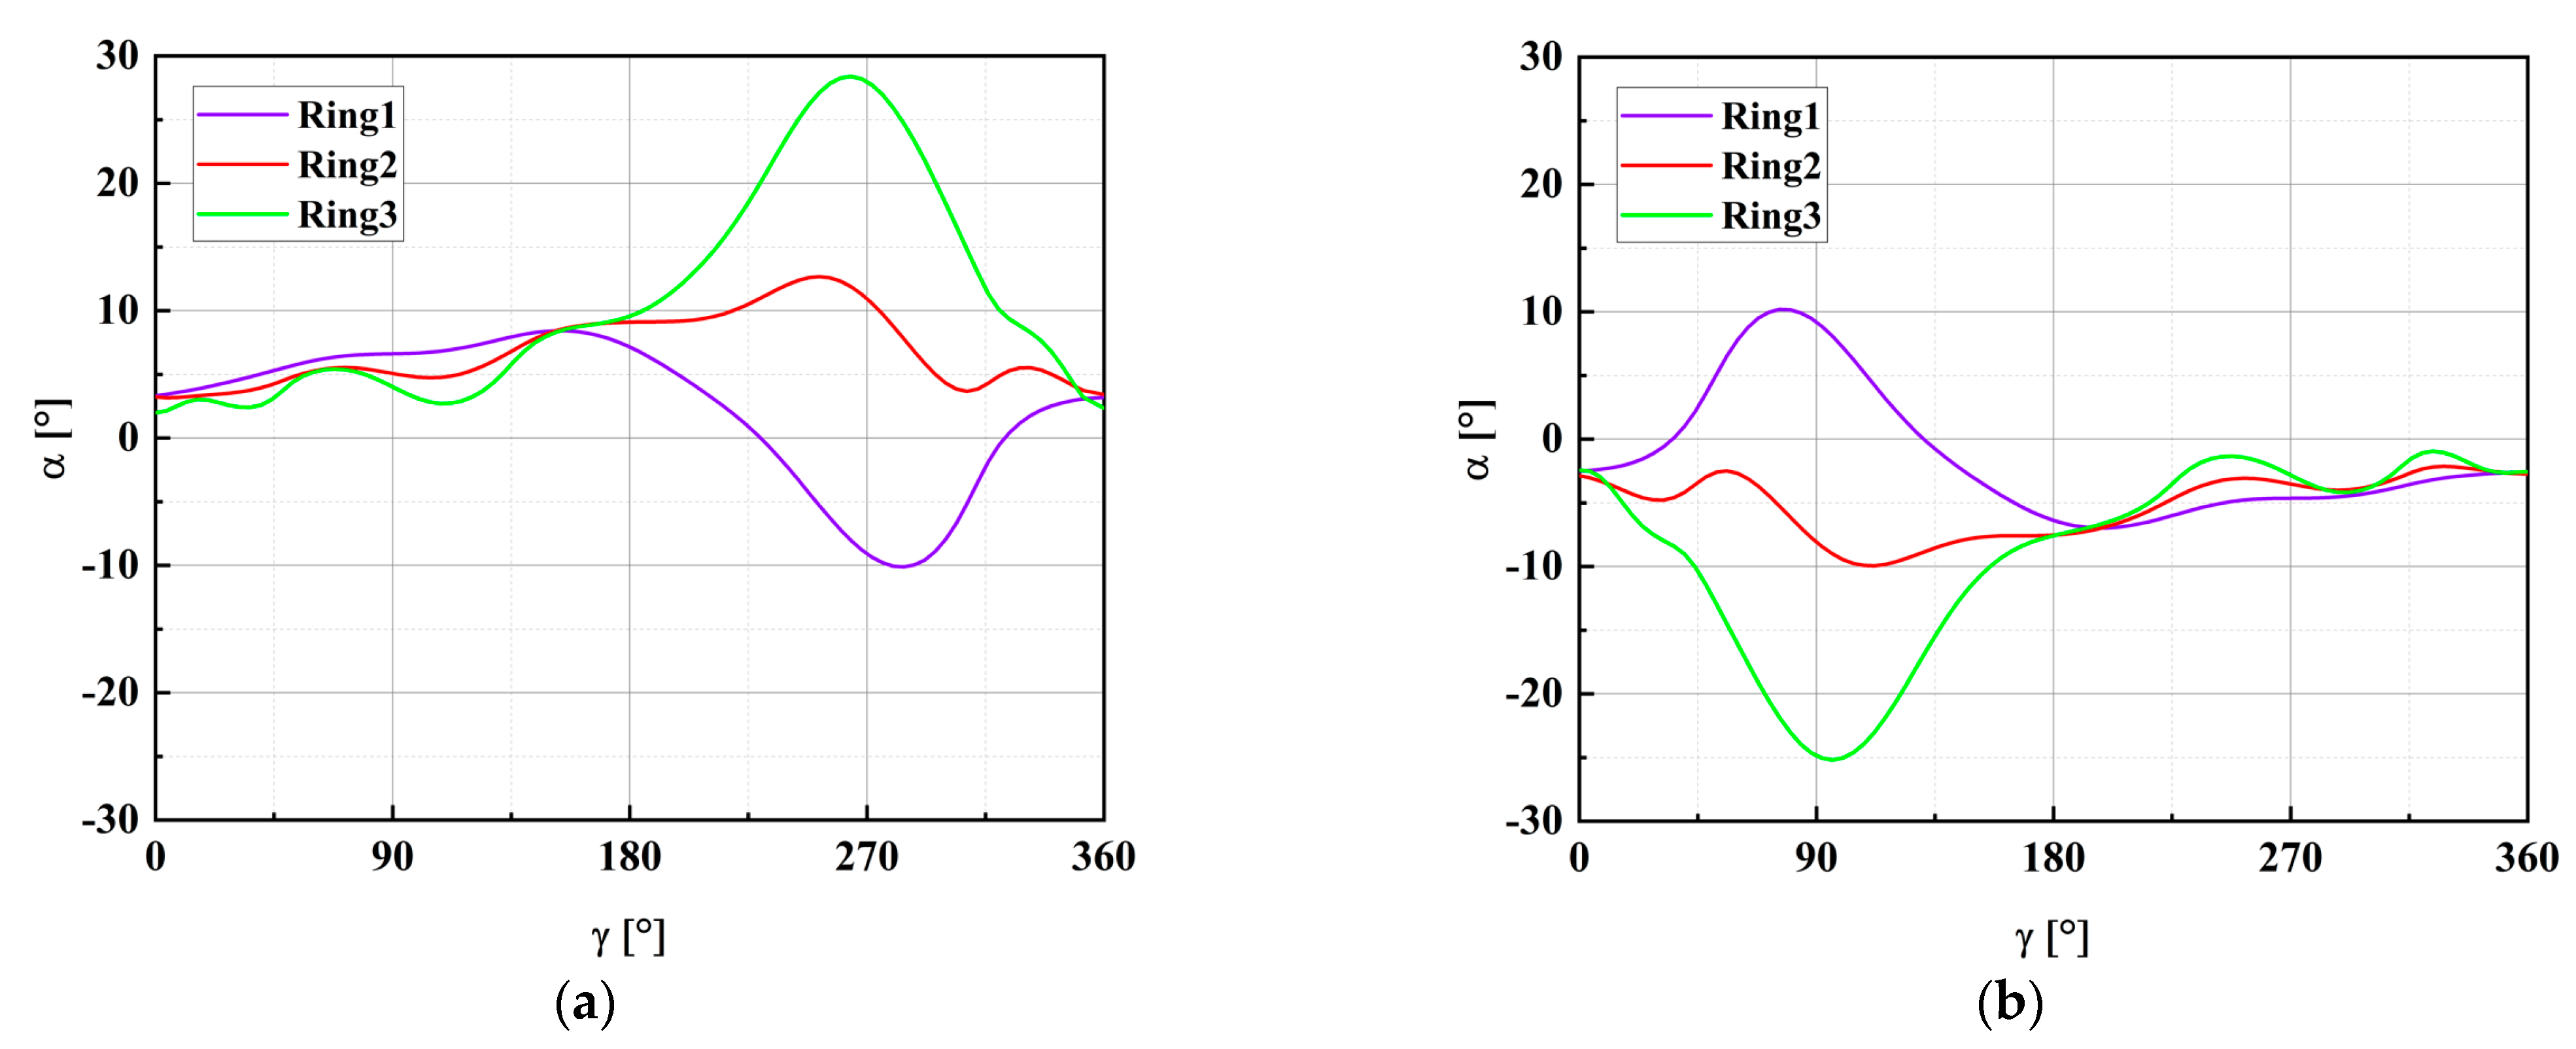
Three measurement rings were selected at the entrance of the ducted fan to conduct a more detailed quantitative analysis of swirl distortion at the ducted fan inlet. Figure 31 illustrates a schematic of the measurement ring. The position direction of the Y-axis was designated as the starting point, with clockwise rotation defined as the positive direction. The three measurement rings were positioned at radii of 80 mm, 110 mm, and 140 mm, corresponding to 45%, 63%, and 80% of the blade height, respectively.
Figure 32 presents the swirl angle distributions along the circumference of the measurement rings of the edge fans when AR = 6 and ΔH = 1.75D. For fan #1, the maximum positive swirl angle was observed at a radius of 140 mm, reaching 28.4° at a circumferential position of 264°. Simultaneously, the maximum negative swirl angle was found at the 80 mm radius ring, measuring 10.1°at a circumferential position of 284°. However, fan #6 exhibited an inverse pattern. Its maximum positive swirl angle occurred at the 80 mm radius ring, measuring 10.2° at a circumferential position of 76°, whereas the maximum negative swirl angle was detected at a radius of 140 mm, reaching 25.2° at a circumferential position of 96°. This indicates that the swirl angle was positive near the casing of fan #1 and negative near the casing of fan #6. Additionally, the locations corresponding to the extreme values of the swirl angle were geometrically symmetrical. The inlet swirl angle variation in the edge fan influenced the total pressure ratio of the ducted fan. For fan #1, the positive swirl angle leads to a reduction in the total pressure ratio and suction capacity, resulting in a reduced axial velocity and increased total pressure loss. In contrast, the negative swirl angle at the entrance of fan #6 enhanced its total pressure ratio and suction capacity, leading to an increased axial velocity and reduced total pressure loss.

6. Conclusions

In this study, a circumferential body force model utilizing the local flow parameters was developed and validated. A distributed propulsion configuration with an S-shaped duct and six distributed ducted fans was constructed. The effects of the inlet aspect ratio and centerline offset of the S-shaped duct on the ducted fan inlet distortion were numerically investigated for the same normalized boundary layer thickness. The main conclusions are as follows:
(1)
As the inlet aspect ratio increases, edge fans experience a reduction in the total pressure distortion, whereas intermediate fans experience an increase. In an S-shaped duct with a large centerline offset, the total pressure distortion index DC60 for fans #1 and #6 is decreased by 80.1% and 75.7%, respectively, when the aspect ratio changes from 6 to 10. Conversely, the DC60 for fan #3 is increased by 118.6% under the same conditions.
(2)
In an S-shaped duct with a substantial centerline offset, changes in the aspect ratio significantly affect the swirl distortion of edge fans. When the aspect ratio increases from 6 to 10, the swirl distortion index SC60 is decreased by 84.2% and 83.4% for fans #1 and #6, respectively. Conversely, in an S-shaped duct with a small centerline offset, changes in the aspect ratio have a negligible impact on the swirl distortion of the ducted fans.
(3)
When the aspect ratio is small, changes in the centerline offset have a more significant impact on the total pressure distortion of the edge fans. Reducing the centerline offset from 1.75D to 0.75D results in a 75.2% decrease in DC60 for fan #1 and a 68.6% decrease for fan #6. In contrast, for a large aspect ratio, the centerline offset has a more pronounced effect on the total pressure distortion of the intermediate fans. Decreasing the centerline offset from 1.75D to 0.75D leads to a 47.5% reduction in DC60 for fan #3 and a 35.5% reduction for fan #4.
(4)
In an S-shaped duct with a small aspect ratio, the centerline offset primarily affects the swirl distortion of edge fans. A reduction in centerline offset from 1.75D to 0.75D results in a significant decrease in the swirl distortion index SC60 for fan #1 and fan #6, with reductions of 87.5% and 86.5%, respectively. However, for an S-shaped duct with a large inlet aspect ratio, changes in the centerline offset have a minimal impact on the swirl distortion of the ducted fans.
(5)
The edge fans experience similar levels of swirl distortion, but their total pressure distortion varies slightly due to differences in the swirl angle directions at the fan inlet. Among all the configurations examined in this study, the most severe inlet distortion occurs when a large centerline offset is combined with a small aspect ratio. Therefore, it is crucial to consider both the centerline offset and aspect ratio when designing an S-shaped duct for distributed ducted fans.

Author Contributions

Conceptualization, W.J.; methodology, Q.K.; software, W.J. and G.L.; validation, T.L.; formal analysis, W.J.; investigation, W.J. and G.L.; resources, W.J.; data curation, G.L.; writing—original draft preparation, W.J.; writing—review and editing, W.J.; visualization, G.L.; supervision, W.J.; project administration, W.J.; funding acquisition, S.D. All authors have read and agreed to the published version of the manuscript.

Funding

This research was funded by the National Key R&D Program of China (2022YFB4301000).

Data Availability Statement

The original contributions presented in this study are included in the article. Further inquiries can be directed to the corresponding author.

Conflicts of Interest

The authors declare no conflict of interest.

Abbreviations

The following abbreviations are used in this paper:
Alength of semi-major axis of elliptical lip (m)
alength of semi-major axis of hyperellipse (m)
ARinlet aspect ratio of S-shaped duct
Blength of semi-minor axis of elliptical lip (m)
bblade blockage factor or length of semi-minor axis of hyperellipse (m)
cchord (m)
Cflocal friction coefficient
Dfan diameter (m)
DC60total pressure distortion index
etotal energy per unit mass (J/kg)
fbody force per unit mass (N/kg)
fninviscid body force (N/kg)
fpviscid body force (N/kg)
hinlet height of S-shaped duct (m)
KMachcompressibility coefficient
Laxial length of S-shaped duct (m)
ldistance between front surface and inlet of S-shaped duct (m)
MinMach number of the incoming flow
Mrelrelative Mach number
Nnumber of blades
nrotation speed (r/min) or hyperellipse index
nθunit normal vector in circumferential direction
Pstatic pressure (Pa)
Ptottotal pressure (Pa)
P t o t ¯ average total pressure (Pa)
qdynamic pressure (Pa)
RexReynolds number
rradius (m)
Sarea (m2)
sblade pitch (m) or inlet width of S-shaped duct (m)
SC60swirl distortion index
Ttemperature (K)
ttime (s)
uvelocity in free-stream (m/s)
Vabsolute velocity vector (m/s)
V ¯ average velocity (m/s)
Wrelative velocity vector (m/s)
X, Y, Zx-, y-, z-coordinate axis
x, y, zx-, y-, z-coordinate (m)
ΔHcenterline offset (m)
Subscripts
inincoming flow
maxmaximum
minminimum
ooriginal
refreference
tottotal
xaxial direction
θcircumferential direction
free stream
Greek symbols
αswirl angle (°)
βrelative flow angle (°)
βmblade metal angle (°)
γcircumferential angle (°)
Γgamma function
δlocal deviation angle (°)
δ*boundary layer thickness (m)
δ0reference local deviation angle (°)
θcircumferential coordinate (°)
μdynamic viscosity (kg/m·s)
ρdensity (kg/m3)
τequivalent expansion angle (°)
Acronyms
AIPaerodynamic interface plane
BFMbody force model
BLIboundary layer ingestion
BWBblended wing body
CAEPCommittee on Aviation Environment Protection
DEPdistributed electric propulsion
EXPexperimental
HRRheight-to-radius ratio
NACANational Advisory Committee for Aeronautics
NASANational Aeronautics and Space Administration
RANSReynolds-averaged Navier–Stokes
RMSroot mean square
RPMrevolutions per minute
UDFuser-defined function

References

  1. Lee, C.M. NASA project develops next generation low-emissions combustor technologies. In Proceedings of the 51st AIAA Aerospace Sciences Meeting including the New Horizons Forum and Aerospace Exposition, Grapevine, TX, USA, 7–10 January 2013. [Google Scholar] [CrossRef]
  2. Van Zante, D.E.; Suder, K.L. Environmentally responsible aviation: Propulsion research to enable fuel burn, noise and emissions reduction. In Proceedings of the 22nd International Symposium on Air Breathing Engines, Phoenix, AZ, USA, 25–30 October 2015; Available online: https://ntrs.nasa.gov/citations/20150023471 (accessed on 1 January 2025).
  3. Brouckaert, J.F.; Mirville, F.; Phuah, K.; Taferner, P. Clean Sky research and demonstration programmes for next-generation aircraft engines. Aeronaut. J. 2018, 122, 1163–1175. [Google Scholar] [CrossRef]
  4. Gelhausen, M.C.; Grimme, W.; Junior, A. Clean Sky 2 Technology Evaluator—Results of the first air transport system level assessments. Aerospace 2022, 9, 204. [Google Scholar] [CrossRef]
  5. Handa, S.; Srinivas, G. Recent developments of blended wing body aircraft: Experimental, numerical and theoretical approaches. Aerosp. Syst. 2022, 5, 171–183. [Google Scholar] [CrossRef]
  6. Wang, L.X.; Zhang, N.; Liu, H.L. Stability characteristics and airworthiness requirements of blended wing body aircraft with podded engines. Chin. J. Aeronaut. 2022, 35, 77–86. [Google Scholar] [CrossRef]
  7. Mahamuni, P.; Kulkarni, A.; Parikh, Y. Aerodynamic study of blended wing body. Int. J. Appl. Eng. Res. 2014, 9, 29247–29255. [Google Scholar]
  8. Ammar, S.; Legros, C.; Trépanier, J.Y. Conceptual design, performance and stability analysis of a 200 passengers blended wing body aircraft. Aerosp. Sci. Technol. 2017, 71, 325–336. [Google Scholar] [CrossRef]
  9. Karpuk, S.; Ma, Y.; Elham, A. Design Investigation of Potential Long-Range Hydrogen Combustion Blended Wing Body Aircraft with Future Technologies. Aerospace 2023, 10, 566. [Google Scholar] [CrossRef]
  10. Kim, H.D.; Felder, J.L.; Tong, M. Revolutionary aeropropulsion concept for sustainable aviation: Turboelectric distributed propulsion. In Proceedings of the 2013 International Society for Air Breathing Engines, Busan, Republic of Korea, 9–13 September 2013; Available online: https://ntrs.nasa.gov/citations/20140002510 (accessed on 1 January 2025).
  11. Hyun, D.K.; Felder, J.L.; Tong, M.T.; Haller, J.J.B.J. Turboelectric distributed propulsion benefits on the N3-X vehicle. Aircr. Eng. Aerosp. Technol. 2014, 86, 558–561. [Google Scholar] [CrossRef]
  12. Goldberg, C.; Nalianda, D.; Pilidis, P.; Singh, R. Economic viability assessment of NASA’s blended wing body N3-X aircraft. In Proceedings of the 53rd AIAA/SAE/ASEE Joint Propulsion Conference, Atlanta, GA, USA, 10–12 July 2017. [Google Scholar] [CrossRef]
  13. Gohardani, A.S.; Doulgeris, G.; Singh, R. Challenges of future aircraft propulsion: A review of distributed propulsion technology and its potential application for the all electric commercial aircraft. Prog. Aerosp. Sci. 2011, 47, 369–391. [Google Scholar] [CrossRef]
  14. Seddon, J.; Goldsmith, E.L. Intake Aerodynamics, 2nd ed.; AIAA: Reston, VA, USA, 1999; pp. 169, 278–285. [Google Scholar]
  15. Perry, A.T.; Ansell, P.J.; Kerho, M.F. Aero-propulsive and propulsor cross-coupling effects on a distributed propulsion system. J. Aircr. 2018, 55, 2414–2426. [Google Scholar] [CrossRef]
  16. Zhou, F.; Wang, Y.G.; Wang, S.W.; Chen, Y.J.; Qiu, Y.S. Experimental and numerical study on coupling effect of ducted fan in distributed electric propulsion system. J. Propuls. Technol. 2024, 45, 154–164. [Google Scholar] [CrossRef]
  17. Li, Z.Y.; Yang, X.D.; Sun, K.; Xiong, J.H.; Shi, S. Aerodynamic configuration of distributed ducted fan with complex strong interference effect and performance influence. Acta Aeronaut. Astronaut. Sin. 2025, 46, 130805. Available online: https://link.cnki.net/urlid/11.1929.v.20241015.1437.002 (accessed on 1 January 2025).
  18. Zhang, X.; Zhang, W.; Li, W.L.; Zhang, X.B.; Lei, T. Experimental research on aero-propulsion coupling characteristics of a distributed electric propulsion aircraft. Chin. J. Aeronaut. 2023, 36, 201–212. [Google Scholar] [CrossRef]
  19. Gong, T.Y.; Yuan, W. Mechanism of internal/external flow coupling effects on the performance of distributed ducted fan. J. Aerosp. Power 2021, 36, 592–605. [Google Scholar] [CrossRef]
  20. Liu, H.R.; Zhao, X.Y.; Zhou, F.; Feng, Y.Y. Aero-propulsion analysis of distributed ducted-fan propulsion based on lifting-line driven body-force model. Chin. J. Aeronaut. 2025, 38, 103126. [Google Scholar] [CrossRef]
  21. Kerho, M.F. Aero-propulsive coupling of an embedded, distributed propulsion system. In Proceedings of the 33rd AIAA Applied Aerodynamics Conference, Dallas, TX, USA, 22–26 June 2015. [Google Scholar] [CrossRef]
  22. Zhang, T.; Barakos, G.N. High-fidelity numerical analysis and optimization of ducted propeller aerodynamics and acoustics. Aerosp. Sci. Technol. 2021, 113, 106708. [Google Scholar] [CrossRef]
  23. Kim, H.; Liou, M.S. Flow simulation and optimal shape design of N3-X hybrid wing body configuration using a body force method. Aerosp. Sci. Technol. 2017, 71, 661–674. [Google Scholar] [CrossRef]
  24. Hall, D.K. Analysis of Civil Aircraft Propulsors with Boundary Layer Ingestion; Massachusetts Institute of Technology: Cambridge, MA, USA, 2015; Available online: https://dspace.mit.edu/handle/1721.1/97353 (accessed on 1 January 2025).
  25. Lucas, J.R.; O’Brien, W.F.; Ferrar, A.M. Effect of BLI–type inlet distortion on turbofan engine performance. In Proceedings of the ASME Turbo Expo 2014: Turbine Technical Conference and Exposition, Dusseldorf, Germany, 16–20 June 2014. [Google Scholar] [CrossRef]
  26. Rein, M.; Koch, S. Experimental study of boundary-layer ingestion into a diverterless S-duct intake. AIAA J. 2015, 53, 3487–3492. [Google Scholar] [CrossRef]
  27. Ferrar, A.; O’Brien, W. Flow in boundary layer ingesting serpentine inlets. In Proceedings of the 47th AIAA/ASME/SAE/ASEE Joint Propulsion Conference & Exhibit, San Diego, CA, USA, 31 July–3 August 2011. [Google Scholar] [CrossRef]
  28. Berrier, B.L.; Morehouse, M.B. Evaluation of flush-mounted, s-duct inlets with large amounts of boundary layer ingestion. In Proceedings of the Symposium on Vehicle Propulsion Integration, Warsaw, Poland, 6–9 October 2003; Available online: https://ntrs.nasa.gov/citations/20030068030 (accessed on 1 January 2025).
  29. Couey, P.T.; McKeever, C.W.; Malak, M.F.; Balamurugan, S.; Raju Veeraraghava, H.; Dhinagaran, R. Computational study of geometric parameter influence on aggressive inter-turbine duct performance. In Proceedings of the ASME Turbo Expo 2010: Power for Land, Sea, and Air, Glasgow, UK, 14–18 June 2010. [Google Scholar] [CrossRef]
  30. Lee, J.; Cho, J. Effect of aspect ratio of elliptical inlet shape on performance of subsonic diffusing S-duct. J. Mech. Sci. Technol. 2018, 32, 1153–1160. [Google Scholar] [CrossRef]
  31. Asghar, A.; Stowe, R.A.; Allan, W.D.E.; Alexander, D. Entrance aspect ratio effect on S-Duct inlet performance at high-subsonic flow. J. Eng. Gas Turbines Power 2017, 139, 052602. [Google Scholar] [CrossRef]
  32. Li, Z.P.; Lu, Y.J.; Pan, T.Y.; Zhang, Y.F. Numerical investigation on the effect of height-to-radius ratio on flow separation features in S-shaped diffuser with boundary layer ingestion. Aerospace 2023, 10, 551. [Google Scholar] [CrossRef]
  33. Hall, D.K.; Greitzer, E.M.; Tan, C.S. Analysis of fan stage conceptual design attributes for boundary layer ingestion. J. Turbomach. 2017, 139, 071012. [Google Scholar] [CrossRef]
  34. Thollet, W. Body-Force Modeling of Fan-Airframe Interactions; ISAE-SUPAERO: Toulouse, France, 2017. [Google Scholar]
  35. Kong, Q.; Jia, W. A three-dimensional body force modeling of fans in windmilling condition and its application. Aerospace 2023, 10, 724. [Google Scholar] [CrossRef]
  36. Liu, L. Investigation of S-Shaped Inlet Distortion Control and Its Impact on the Flow Field of the Rear Transonic Fan-Stage; Harbin Institute of Technology: Harbin, China, 2015; Available online: https://d.wanfangdata.com.cn/thesis/D751741 (accessed on 1 January 2025). (In Chinese)
  37. Lee, C.; Boedicker, C. Subsonic diffuser design and performance for advanced fighter aircraft. In Proceedings of the AIAA/AHS/ASEE Aircraft Design Systems and Operation Meeting, Colorado Springs, CO, USA, 14–16 October 1985. [Google Scholar] [CrossRef]
  38. Ma, G. Design and Aerodynamic Performance Study of an S-Shaped Inlet of the UAV; Nanjing University of Aeronautics and Astronautics: Nanjing, China, 2007; Available online: https://d.wanfangdata.com.cn/thesis/D038129 (accessed on 1 January 2025). (In Chinese)
  39. Berrier, B.L.; Carter, M.B.; Allan, B.G. High Reynolds Number Investigation of a Flush-Mounted, S-Duct Inlet with Large Amounts of Boundary Layer Ingestion; NASA Langley Research Center: Hampton, VA, USA, 1 September 2005. Available online: https://ntrs.nasa.gov/citations/20050229940 (accessed on 1 January 2025).
  40. Wang, K.; Zhou, Z.; Guo, J.; Li, M. Propulsive/aerodynamic coupled characteristics of distributed-propulsion-wing during forward flight. Acta Aeronaut. Astronaut. Sin. 2024, 45, 137–155. Available online: https://d.wanfangdata.com.cn/periodical/hkxb202402010 (accessed on 1 January 2025).
  41. Wang, K.; Huang, H.; Tan, H.; Lin, Z.; Tang, X.; Cheng, T. Impact of shape factors on flow dynamics and performance in boundary layer ingesting inlet. Aerosp. Sci. Technol. 2025, 157, 109829. [Google Scholar] [CrossRef]
  42. Owens, L.R.; Allan, B.G.; Gorton, S.A. Boundary-layer-ingesting inlet flow control. J. Aircr. 2008, 45, 1431–1440. [Google Scholar] [CrossRef]
  43. Deng, W.; Wang, Z.; Zhou, L.; Zhao, H. Flow losses characteristics of BLI inlet. J. Aerosp. Power 2023, 38, 698–708. Available online: https://apps.wanfangdata.com.cn/perios/article:hkdlxb202303019 (accessed on 1 January 2025).
  44. Chen, J. Investigation of Active Flow Control in a Boundary Layer Ingesting Offset Inlet; Harbin Institute of Technology: Harbin, China, 2009; Available online: https://d.wanfangdata.com.cn/thesis/D258611 (accessed on 1 January 2025).
  45. Martensson, H. Harmonic Forcing from Distortion in a Boundary Layer Ingesting Fan. Aerospace 2021, 8, 58. [Google Scholar] [CrossRef]
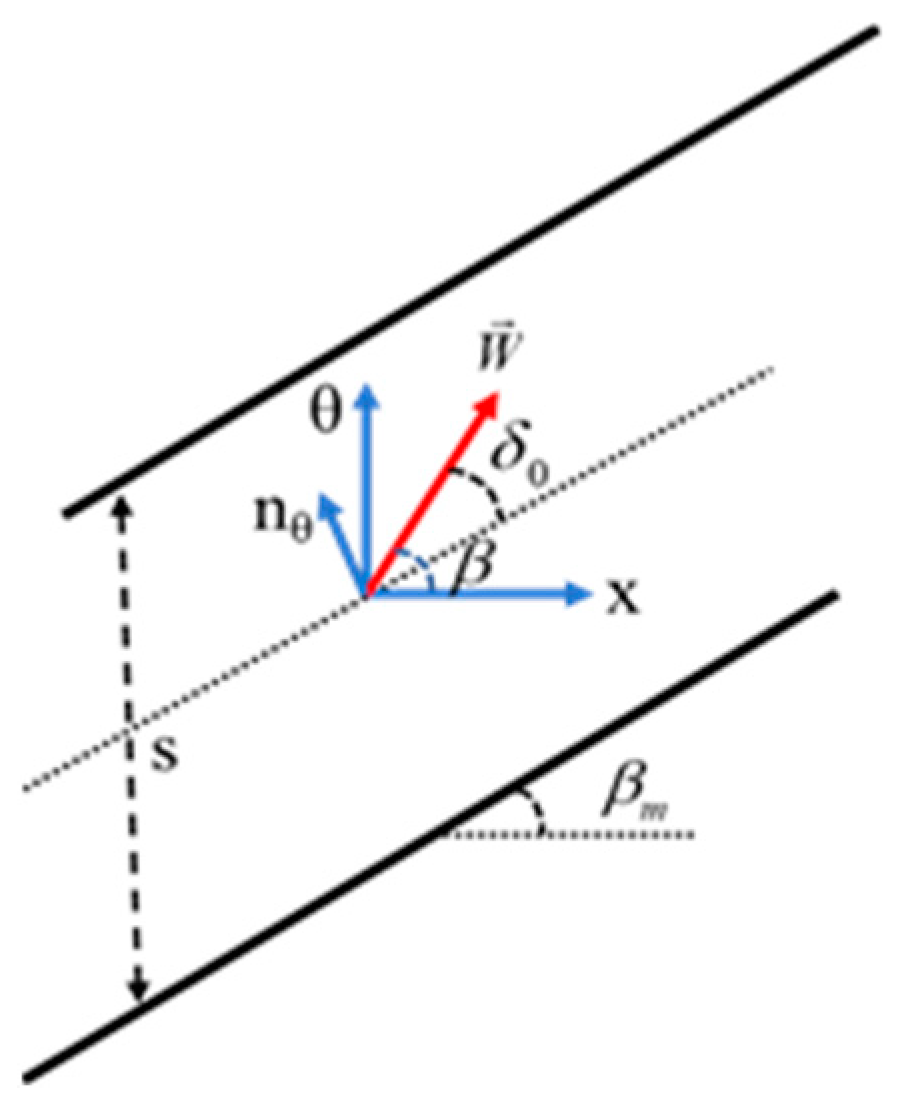
Figure 1. Schematic diagram of blade metal angle and relative velocity.
Aerospace 12 00316 g001
Figure 2. Structural diagram of DGEN 380 engine. (a) DGEN 380 engine. (b) Fan.
Aerospace 12 00316 g002
Figure 3. Computational domain and meridional mesh for BFM solution. (a) Computational domain. (b) Meridional mesh.
Aerospace 12 00316 g003
Figure 4. Full-annulus computational domain for fan.
Aerospace 12 00316 g004
Figure 5. Fan stage performance characteristic at design rotation speed. (a) Total pressure ratio. (b) Isentropic efficiency.
Aerospace 12 00316 g005
Figure 6. Contours of total pressure in meridional plane. (a) RANS result. (b) BFM result.
Aerospace 12 00316 g006
Figure 7. Spanwise distribution of Mach number.
Aerospace 12 00316 g007
Figure 8. Schematic diagram of an S-shaped duct.
Aerospace 12 00316 g008
Figure 9. Key parameters of cross-section. (a) Hyperelliptic index. (b) a/b.
Aerospace 12 00316 g009
Figure 10. S-shaped duct configuration. (a) Side view. (b) Oblique view.
Aerospace 12 00316 g010
Figure 11. Integrated model of six ducted fans with an S-shaped duct (a) Side view. (b) Oblique view.
Aerospace 12 00316 g011
Figure 12. Computational domain of the integrated model. (a) Side view. (b) Oblique view.
Aerospace 12 00316 g012aAerospace 12 00316 g012b
Figure 13. Computational mesh of the integrated model. (a) Square-to-round duct and ducted fans. (b) S-shaped duct and far field.
Aerospace 12 00316 g013
Figure 14. Grid independence results. (a) Total pressure ratio. (b) Isentropic efficiency.
Aerospace 12 00316 g014
Figure 15. Schematic diagram of computational model.
Aerospace 12 00316 g015
Figure 16. Total pressure distortion index DC60 for different aspect ratios. (a) ΔH = 0.75D. (b) ΔH = 1.75D.
Aerospace 12 00316 g016
Figure 17. Contours of total pressure coefficients at the ducted fan inlet when ΔH = 1.75D. (a) AR = 6. (b) AR = 8. (c) AR = 10.
Aerospace 12 00316 g017
Figure 18. Contours of axial velocity at the ducted fan inlet when ΔH = 1.75D. (a) AR = 6. (b) AR = 8. (c) AR = 10.
Aerospace 12 00316 g018
Figure 19. Schematic diagram of middle section, AIP section, and meridional section in the duct.
Aerospace 12 00316 g019
Figure 20. Contours of static pressure coefficient and two-dimensional streamlines in the middle section when ΔH = 1.75D. (a) AR = 6. (b) AR = 8. (c) AR = 10.
Aerospace 12 00316 g020
Figure 21. Contours of static pressure coefficient and two-dimensional streamlines in the AIP section when ΔH = 1.75D. (a) AR = 6. (b) AR = 8. (c) AR = 10.
Aerospace 12 00316 g021
Figure 22. Contours of static pressure in the meridional section of the S-shaped duct when ΔH = 1.75D. (a) AR = 6. (b) AR = 8. (c) AR = 10.
Aerospace 12 00316 g022
Figure 23. Swirl distortion index SC60 for different aspect ratios. (a) ΔH = 0.75D. (b) ΔH = 1.75D.
Aerospace 12 00316 g023
Figure 24. Contours of swirl angle at the ducted fan inlet when ΔH = 1.75D. (a) AR = 6. (b) AR = 8. (c) AR = 10.
Aerospace 12 00316 g024
Figure 25. Total pressure distortion index DC60 for different centerline offsets. (a) AR = 6. (b) AR = 10.
Aerospace 12 00316 g025
Figure 26. Contours of total pressure coefficients at the ducted fan inlet when AR = 6. (a) ΔH = 0.75D. (b) ΔH = 1.25D. (c) ΔH = 1.75D.
Aerospace 12 00316 g026
Figure 27. Contours of total pressure coefficients at the ducted fan inlet when AR = 10. (a) ΔH = 0.75D. (b) ΔH = 1.25D. (c) ΔH = 1.75D.
Aerospace 12 00316 g027
Figure 28. Contours of static pressure in the meridional section of the S-shaped duct when AR = 6. (a) ΔH = 0.75D. (b) ΔH = 1.25D. (c) ΔH = 1.75D.
Aerospace 12 00316 g028
Figure 29. Swirl distortion index SC60 for different centerline offsets. (a) AR = 6. (b) AR = 10.
Aerospace 12 00316 g029
Figure 30. Contours of swirl angle at the ducted fan inlet when AR = 6. (a) ΔH = 0.75D. (b) ΔH = 1.25D. (c) ΔH = 1.75D.
Aerospace 12 00316 g030
Figure 31. Schematic diagram of measurement rings.
Aerospace 12 00316 g031
Figure 32. The circumferential distributions of a swirl angle when AR = 6 and ΔH = 1.75D. (a) Fan #1. (b) Fan #6.
Aerospace 12 00316 g032
Table 1. Key design parameters of DGEN 380 engine fan.
ParametersValue
Number of blades14
Number of vanes40
Rotation speed13,150 RPM
Inlet total temperature288.15 K
Inlet total pressure101,325 Pa
Total pressure ratio1.17
Equivalent flow rate14.635 kg∙s−1
Isentropic efficiency0.87
Disclaimer/Publisher’s Note: The statements, opinions and data contained in all publications are solely those of the individual author(s) and contributor(s) and not of MDPI and/or the editor(s). MDPI and/or the editor(s) disclaim responsibility for any injury to people or property resulting from any ideas, methods, instructions or products referred to in the content.