You are currently viewing a new version of our website. To view the old version click .
Aerospace
  • Article
  • Open Access

9 April 2025

Increased Safety Goes Hand in Hand with Higher Cost Efficiency: Single-Controller Operation Showcasing Its Advantages

,
,
,
,
,
,
and
1
Controller Assistance Department, Institute of Flight Guidance, German Aerospace Center, 38108 Braunschweig, Germany
2
ATM Simulation Department, Institute of Flight Guidance, German Aerospace Center, 38108 Braunschweig, Germany
3
Human Factors Department, Institute of Flight Guidance, German Aerospace Center, 38108 Braunschweig, Germany
*
Author to whom correspondence should be addressed.
This article belongs to the Special Issue Future Airspace and Air Traffic Management Design

Abstract

While traffic levels are predicted to rise, nearly all European air navigation service providers suffer from staff shortages. In most cases, two air traffic controllers are deployed to control one airspace sector. Enabling the deployment of one controller per sector could be a solution to staff shortage problems. For this Single-Controller Operation (SCO) concept, a demonstrator with integrated support tools based on advanced information technology was developed. These partially automate some controller tasks to allow one controller to work off the same traffic amount as a controller team. The system was tested in a human-in-the-loop real-time simulation under varying traffic loads using a 2 × 2 within-subjects design. The variables assessed include separation minima infringements, exit flight level deviations, instantaneous self-assessment, voice communication, flight distance, and fuel burn. The results show no negative influence on safety, workload, situational awareness, operational efficiency, and environment, with 80% of maximum allowed declared capacity. Thus, SCO has the potential to mitigate staff shortages and raise cost efficiency by 40%. These results showcase the feasibility of the SCO concept under nominal conditions. Assessments with different traffic levels, non-nominal conditions, and an interdependent multi-sector SCO layout are recommended for further investigations.

1. Introduction

As air traffic grows, it is predicted that an increased capacity is required to ensure safe, orderly, and efficient operations [1]. Meanwhile, current traffic demands already partially exceed the available capacities. One main reason is a lack of air traffic controllers [2]. In current en route operations in Europe and the United States, two air traffic controllers (ATCOs) are typically deployed per sector [3]. These two ATCOs work in the roles of radar controller (also called executive controller) and planner controller (also called coordinator controller). The radar controller is in contact with the pilots issuing instructions, whereas the planner controller is responsible for coordination with adjacent sectors. Reducing staffing to one ATCO per sector, while maintaining or improving safety and efficiency, could offer a viable solution to address current staff shortages. This concept is called Single-Controller Operation (SCO). The operational feasibility of SCO requires further investigation. For this purpose, we developed a demonstrator system including six controller support tools. Furthermore, to enable SCO, the ability to enact Controller–Pilot Data Link Communication (CPDLC) with basic instructions was assumed and simulated for all aircraft with response times similar to voice communication. The system was assessed in a validation using a human-in-the-loop real-time-simulation in autumn 2023. The assessment was based on a comparison of a layout with two ATCOs to the SCO layout in two different traffic conditions. Measuring parameters for safety, ATCO situational awareness and workload, operational performance, and environmental impact were assessed to derive concept feasibility.
The validation conducted addressed two main aspects of SCO feasibility:
  • Objective measurable benefits and drawbacks compared to current operations;
  • Subjective acceptance from an ATCO point of view.
Influencing factors of the latter are analysed, for example, in [4]. The results from the validation at hand regarding the subjective acceptance are described in [5]. This paper focuses on the objective results of the validation. The main and the derived research questions are as follows:
Is a Single Controller able to control the same amount of traffic as an ATCO pair without negative impact on operational and human performance, safety, and environment?
(a)
Is safety impaired using SCO?
(b)
Does SCO lead to an increase in average flight distance?
(c)
Does SCO have an environmental impact?
(d)
Does the SC’s workload remain the same when using the implemented support tools?
(e)
Is the SC’s situational awareness comparable to that of an ATCO in an ATCO team?
(f)
Is the SC’s trust in the system comparable to that of an ATCO in an ATCO team?
Questions a–c are addressed in this paper, whereas questions d–f are assessed in [5], considering subjective measures only. This paper is the first to analyse the objective measurements obtained from the first human-in-the-loop simulation to validate the novel SCO concept on a demonstrator system to address these questions. In particular, this includes the evaluation of separation infringements and operational performance. Based on the results regarding the overall operational usability, a theoretical analysis of the possible cost efficiency increases caused by SCO was carried out for the first time.
This paper is structured as follows: Section 2 summarises previous and related works. This includes differentiating the terms used from those of neighbouring and similar concepts adhering to the status quo. Furthermore, metrics used in the literature to address the research questions are summarised. The validation setting and process are described in Section 3. The structure of the validation is described, including the sample description, the scenarios, and the technical system, as well as the process and the measurement methods, which are compared to those used in the literature regarding safety, situational awareness, workload, operational efficiency, and environmental impact. Section 4 presents the results, including unrelated discussions. The validation as a whole is discussed in Section 5 with regard to its strengths, weaknesses, and transferability. Finally, Section 6 presents our conclusions and next steps.

3. Validation

The validation at hand was intended to be a proof of concept. As foreseen in the concept, a demonstrator system including potential new ATCO support tools was used [21,22]. These tools are envisaged for an operational implementation step with distributed (peripheral) system support for a single controller. This chapter will repeat key elements of the validation as already described in [5]. Additionally, details about the measurement of objective criteria are given. The validation refers to current traffic levels.

3.1. Experimental Design

A total of seven male ATCOs from Germany and Austria participated in the validation, six in pairs of two and one with an additional domain expert. The participants were on average 30.86 years old and had an average of 8.57 years of experience as an ATCO. Airspace and traffic were simulated using the NLR ATC Research Simulator (NARSIM) [62] in the DLR Institute of Flight Guidance’s Air Traffic Validation Center in Braunschweig in autumn 2023. The air traffic situation was presented to the ATCOs using a state-of-the-art look-and-feel air traffic control system simulator based on the operational system used in the German upper airspace. Upper (en route) airspace was the focus of the validation at hand and was defined as reaching Flight Level 245 and above. A sector from Maastricht Upper Area Control located over north-west Germany was chosen for validation. The baseline scenarios were conducted with two ATCOs in the roles of radar and planner controllers. In contrast, in most ATC real-time simulations involving ATCOs, only the radar controller role is considered [12]. The results of the baseline are used as reference for the solution scenarios. The solution scenarios were conducted by one ATCO and additional support tools added to the baseline system. A summary of the tools is given in Table 2, and a graphical visualisation is given in Figure 2 [5]. A summary of the scenarios is given in Table 3.
Table 2. Tools used in solution scenarios [5].
Table 3. Scenario overview.
A 2 (traffic load) × 2 (baseline vs. solution) within-subjects design was chosen. Both scenario types were conducted with two traffic loads: 40% and 80% of the declared capacity of the sector used in the validation. This allows a comparison between the baseline and solution scenarios with the same traffic, but also between the baseline scenario with 80% and solution scenario with 40%, as both show a theoretically equal traffic amount per ATCO. In detail, 80% was used based on the assumption that, in combination with the ATCOs working on an unknown sector (and baseline system), this will result in a situation with 100% traffic and the sector and system being known by the ATCO. Scenarios with the same traffic amount differed only in the callsigns of the flights with identical initial flight plans (IFPs). Both traffic conditions were executed post validation, without any intervention from an ATCO, as additional reference for some investigated parameters. In these uncontrolled scenarios, flights followed their IFP, leading to unresolved conflicts and the non-execution of required FL changes. The analysed length of the scenarios is 47 min, taken from a 1 h run, excluding fade-in and fade-out time. The validation was supported by pseudo pilots and pseudo air traffic controllers for neighbouring sectors. They implemented several scripted events across all scenarios to add more realism to the simulation and enable an accurate assessment of the concept [5] as follows:
  • Radio communication failure or intentional wrong readback (baseline)/failure of Controller–Pilot Data Link Communication (CPDLC) (solution);
  • Pilot requests a different flight level (FL);
  • Sick passenger on board;
  • Neighbouring sector requests to handle an aircraft prior to the transfer of control (release request);
  • Incoming coordination from neighbouring sector(s);
  • Intentional rate deviation;
  • Aircraft diversion (new aircraft).
Other events were set up with the initial flight plan (IFP):
  • Dissimilar entry FL (NFL) and exit FL (XFL);
  • Planned conflicts (in case of no intervention by ATCO).
These events were often allocated to a specific short time frame with multiple options, rather than to a specific aircraft, to avoid recognition effects. Furthermore, it enabled an adaptation of the pseudo pilots to unpredictable ATCO actions. For example, it cannot be foreseen if an ATCO instructs a rate to the pilot or requests an aircraft already on a lower level to ensure that the aircraft will reach the XFL of the sector. However, sick passenger events were allocated to specific aircraft. The time frame was identical, but the concrete aircraft (and thus the IFP and requested diversion airport) varied between all scenarios. Thus, the handling of these events was not analysed. A key assumption for the solution scenario was 100% CPDLC coverage for a few main instructions (level, rate, heading, turn, direct, speed, and frequency change) [5].
The validations were conducted per ATCO pair, as shown in Table 4 [5]. The first day was used for the introduction of the purpose and agenda of the validation and theory explanation of the baseline and solution system, including training runs for both. On the following two days, the ATCOs conducted the scenarios. Solution scenarios were always conducted sequentially on the same day. The second ATCO was separated to avoid influences. The order of scenarios was changed between participant pairs. The baseline high scenario was executed twice with the roles of the ATCOs being swapped.
Table 4. Validation process per ATCO pair [5] reproduced with permission from SNCSC from Engineering Psychology and Cognitive Ergonomics, Robert Hunger, Springer Cham, 2024.

3.2. Data Gathering and Processing

Next to the data assessed in [5] during the validation runs, the following data were collected:
  • Number of aircraft within the validated sector at each time;
  • ISA values;
  • Reaction time to ISA;
  • Trajectory of each aircraft passing through the sector (latitude, longitude, speed, and flight level at any time);
  • Coordinations;
  • Number of radio contacts;
  • Duration of each radio contact.
Furthermore, from the IFP, the aircraft types and XFL can be extracted. The length of each validation run was one hour, including thirteen minutes to start the scenario, set up the display, and build up the initial traffic picture for the ATCOs as well as to smoothly exit the run. Therefore, the analysed period was 47 min [5].
The following subsections describe the metrics used in the validation to measure safety, situational awareness, workload, operational performance, and environmental impact. Finally, Section 3.2.7 compares the metrics used with those from the literature review in Section 2.1.

3.2.1. Safety

Any separation infringement during the simulation is analysed to determine the impact of SCO on safety. To assess possible separation violations, a pairwise lateral and vertical comparison for each aircraft pair for each applicable time step is performed. With this procedure, it is assured that any possible infringement is detected. The separation minima used for this analysis are shown in Table 5 and visualised in Figure 3.
Table 5. Separation minima [5].
Figure 3. Separation minima (Sector A: sector in focus; Sector B: any adjacent sector).
The separation ‘to sector boundaries’ describes the minimum allowed distance to any boundary with sectors that are not foreseen in the flight path (see top view in Figure 3). Additionally, any handover condition, e.g., a specific FL, must reach the same distance before the aircraft passes the sector boundary to the next sector in sequence (see vertical view in Figure 3). For the evaluation, infringements with a vertical separation of less than 800 ft were taken into account. Aircraft legally adhere to their assigned FL, even with a radar-indicated deviation of 200 ft [63], as long as the pilot (based on aircraft measured FL) reports to be at the assigned FL. This takes into account technical inaccuracies, which is the reason behind the required vertical minimum. The analysis also took into account the separation infringements outside the sector boundaries of the validated sector, provided that the responsibility for this can be attributed to the participant(s) in the validated sector. This is the case if both aircraft involved had previously flown through the validated sector and there is not sufficient time for the ATCO of the sector to resolve the conflict where the infringement becomes active. An example is shown in Figure 4.
Figure 4. Separation infringement outside validated sector (Sector A: sector in focus; Sector B: any adjacent sector).
The analysis of separation infringements reviews the duration, minimal lateral and vertical distance (not necessarily at the same time), and individual recorded trajectories to understand the emergence of each infringement.

3.2.2. Situational Awareness

As an indicator of situational awareness, deviations from the coordinated flight level during handovers to a neighbouring sector were analysed. For this, the altitude when flying over the sector boundaries was considered. Operationally, the coordinated altitude must generally reach 2.5 NM before the sector boundary (see Table 5). If no XFL was coordinated, the ones noted in the IFP were referenced. Again, all deviations of up to 200 ft are regarded as compliant with the handover condition. Furthermore, deviations of aircraft that have left the sector correctly at FL 245 and downwards, but have received a lower coordinated level and for which a deviation of more than 200 ft is initially calculated as a result, are not considered. In addition, aircraft for which one of the following events was performed were also excluded:
  • Sick passenger;
  • Diverted aircraft;
  • Release request.

3.2.3. Workload

Workload metrics are often divided into objective and subjective measurements. Subjective measurements take personal experience and individual influences into account, while objective measurements rely on quantifiable data like task completion times or error rates, offering a standardised view unbiased by the participants personal view. For the current validation, ISA [52] was used as a workload metric. ISA is a tool for the discrete recording of the perceived workload during tasks by the participants and is therefore a subjective metric. Additionally, the response time to ISA queries was utilised as an objective workload measurement. Since answering the queries is a none-operative ATCO task, such a secondary task will be dropped or postponed first in high-workload phases. During the simulation runs, the ISA query appeared automatically on the ATCO HMI every three minutes and the participants were asked to rate their current workload on a scale of 1 (underutilised) to 5 (excessive). Unanswered queries were excluded from analysis.
Furthermore, voice communication data are analysed, as this typically has a large share of the task- and workload of ATCOs [64,65]. As discussed in [66], ATCOs execute tasks in parallel. This applies in particular to system inputs corresponding to instructions given by voice. However, reducing or replacing the requirement for double input (system input and speech input) for each instruction is expected to reduce the task- and workload of ATCOs.
Each transmission is recorded. From the recordings, the average number of transmissions per run and the average transmission length can be extracted. Referring to the total run time of 47 min, the average utilisation of the radio channel can be calculated. As reference to these metrics, the number of aircraft at a time within the validated sector is recorded as well. In general, higher traffic values will correspond to higher workload values.

3.2.4. Operational Performance

The comparison between baseline and solution scenarios with the same traffic amount was enabled by using the same scenario with identical flight paths for each aircraft. The callsigns were changed for scenarios with identical IFPs to reduce recognition effects. In this setup, operational performance was measured by comparing the lateral distance flown by each aircraft in the ATCO’s sector. Aircraft outside the ATCO’s sector are not measured, nor are flight paths that include an emergency involving a sick passenger. The measured values of the executive ATCO in the baseline run are compared to the values of the same ATCO in the solution, as the executive ATCO has more influence on the flight paths. The whole flight paths of the respective aircraft are compared. By this, influences of flight path changes that shorten the distance within the validated sector but enlarge the overall distance are precluded. This prevents incorrect conclusions resulting from changes to flight routes that only shorten them within the sector but lengthen the overall routes.
Figure 5 shows a schematic example for the flight path calculation and comparison of a flight from e.g., Berlin to Paris passing through the validated sector, shown with green dashed lines. The red solid path would shorten the flight path within the sector compared to the blue dotted flight path. However, at the same time, it would increase the overall distance flown by the aircraft, as depicted with the exemplary numbers. As the validation run lasts only 47 min, the flight paths were post processed using a circle from the sector boundary to the destination airport, as also implied in Figure 5. Flights that did not reach the airspace boundaries within the run time were extended to the boundary for the calculation based on their flight plan or their last instructed track; doing so prevented the results of the operational performance being influence due to a limited view of one sector. The calculation and comparison were completed per aircraft (per ATCO and per traffic load) first and summed up thereafter.
Figure 5. Schematic representation flight path comparison (validated sector highlighted with green dashed lines).

3.2.5. Environmental Impact

The environmental impact of a flight is determined by its fuel consumption. The fuel consumption itself is affected by various aspects such as the type of aircraft and engine, flight distance, altitude, speed, and aircraft mass. To measure the environmental impact of the tools used in the solution runs, a comparison with the baseline runs without the tool support is necessary. The fuel estimation is based on the BADA 3.16 performance model, which is also used by NARSIM to calculate the aircraft performance behaviour. As general assumptions, the medium mass level and standard cruise speed of the aircraft type are used to estimate fuel flow. The fuel is calculated for the same trajectory that has been used for the operational performance analysis. The estimated fuel consumption of all aircraft is summed up, so that each scenario with similar traffic can be compared. A comparison between different traffic levels is possible using the percentage of fuel used in the solution runs compared to the baseline runs. In the calculation, only aircraft flying through the sector operated by the ATCO are used. Flights including an emergency of a sick passenger are also excluded from the calculation.

3.2.6. Cost Efficiency

Cost efficiency benefits are a foreseen major advantage of the SCO concept. If the above-mentioned aspects show the feasibility of SCO, cost efficiency benefits are inevitable, given the reduction in ATCOs per sector. The results, as derived from the other investigated aspects, will be discussed in Section 4.

3.2.7. Comparison of Metrics and Validation Limitations

As can been seen from Table 6, due the to validation constraints in time, effort, and focus, not all researched metrics were applied. The variables addressed (safety, situational awareness, workload, operational efficiency, environmental impact, and cost efficiency) by these metrics all serve to prove the feasibility of the new SCO concept. Thus, the research excludes investigations of correlations or relationships between two or more variables that might be observable from the results. A basis for such an investigation would be an analytic model, like TOPAZ [39,40] used for safety assessment, which is not part of the analysis at hand. Furthermore, the analysis of environmental impact is restricted to influence from lateral flight path differences. Cost efficiency is automatically predetermined by the concept if the other variables are acceptable and the concept is feasible. The assessment of cost efficiency excludes the impact of additional technology costs, as this would be too early for an justified estimate. Rather, part of the validation, as presented in [5], aims to identify improvements in the technical support tools.
Table 6. Comparison of metrics.

4. Results

This chapter will summarise the results analysed in this paper of the current validation following the collection and processing of data described in Section 3.

4.1. Safety

Table 7 shows the results of the separation infringements. Each participant conducted the solution scenario as a SC and the baseline high scenario as a radar controller. The baseline low scenario was performed only once by the participating ATCO pairs and once by the participant supported by the ATM expert. The number of infringements is averaged over the number of runs per scenario. The infringement duration is measured between the first and last time (second) that the separation minima are undercut. The duration as well as the minimum lateral and vertical distance are averaged across the detected infringements. For example, the minimum vertical distances of separation infringements in the baseline high scenario vary between 0 and 733 ft.
Table 7. Separation infringements.
A total of seven separation infringements occurred across all scenarios. As depicted in Section 3.2.1, infringements with a minimal vertical distance of 800 ft are not considered. Following this, two potential infringements of baseline high, two of solution high, and three of solution low scenarios are excluded. All excluded infringements show a minimum vertical distance of at least 988 ft, whereas all considered infringements show 733 ft or less. The number of runs performed must be taken into account when interpreting the results. It is not significant but remarkable that none of the solution scenarios included a separation infringement. The only infringement for a baseline low-traffic scenario occurred in connection with an aircraft with a sick passenger event. The separation infringement itself took place outside of the validated sector, but both aircraft were known to the participant in the validated sector (see Figure 4). All other separation infringements occurred within the baseline high-traffic scenarios. Based on the current validation, the SCO concept in terms of the validated system leads to an increase in safety. It can be assumed that the Attention Guidance Tool in particular, with the (repeated) highlighting of conflicts, was able to prevent separation infringements. Another factor may have been the increase in capacity among the controllers through the increased (possibilities to make) use of CPDLC. However, as depicted in [32,46,47], the influence on situational awareness and workload only allows comprehensive conclusions to be drawn about safety.

4.2. Workload and Situational Awareness

The analyses of ISA queries, voice communication, and XFL errors are described in the following.
In total, 308 ISA responses were considered for analysis. Due to unmatched scenario pairs, independent t-tests were performed to compare the ISA response times between traffic scenarios as well as solution and baseline scenarios. The response times did not significantly differ between the low-traffic (M = 7.30, SD = 5.35) and high-traffic (M = 7.34, SD = 5.89) runs, t = 0.057, p = 0.955. However, the response times were significantly longer in the baseline runs (M = 8.32, SD = 6.73) compared to the solution runs (M = 6.58, SD = 4.58), t = 2.56, p = 0.011. This could lead to the conclusion that the workload in solution runs was lower.
Further, Mann-Whitney-U tests were calculated to assess ISA responses across scenarios. Between baseline and solution scenarios, no significant differences were found, U = 12.48, p = 0.250. However, the high-traffic scenarios were rated significantly higher on the ISA than the low-traffic ones, U = 14.89, p < 0.001. This trend is also observed on the NASA-TLX in [5], which showed higher reported workload during the high-traffic scenarios. It may be that the higher workload during the higher-traffic scenarios is not reflected in the response times as the workload levels were too low to negatively affect the response times. Moreover, participants may take longer to respond to ISA queries during the baseline runs because they are engaged in conversation with the planning controller and are less focused on the screen. With a mean of 2.39 and a standard deviation of 0.85, the workload was generally from rated “relaxed” to “comfortable” across all conditions.
To objectively assess workload, ref. [53,54] used a variety of physiological measures that were not applied for the validation at hand. However, ref. [55] showed the correlation of those measures to the radio communication parameter, as analysed in the following. Figure 6, Figure 7 and Figure 8 visualise the average number of radio–telephony contacts (transmissions), their average overall duration, and the average utilisation in relation to the simulation time over all simulation runs. Figure 6 shows on average around 91 transmissions in the baseline low scenarios. The number clearly increases to 133 in the baseline high scenarios due to the higher amount of managed aircraft, which leads to more radio–telephony contacts. For the solution scenarios, on the other hand, there is only a minor difference in the number of transmissions between the low and high scenarios, which shows that the higher amount of aircraft did not require significantly more verbal communication in scenarios where CPDLC was the preferred way of providing clearances.
Figure 6. Number of transmissions averaged over all runs per scenario.
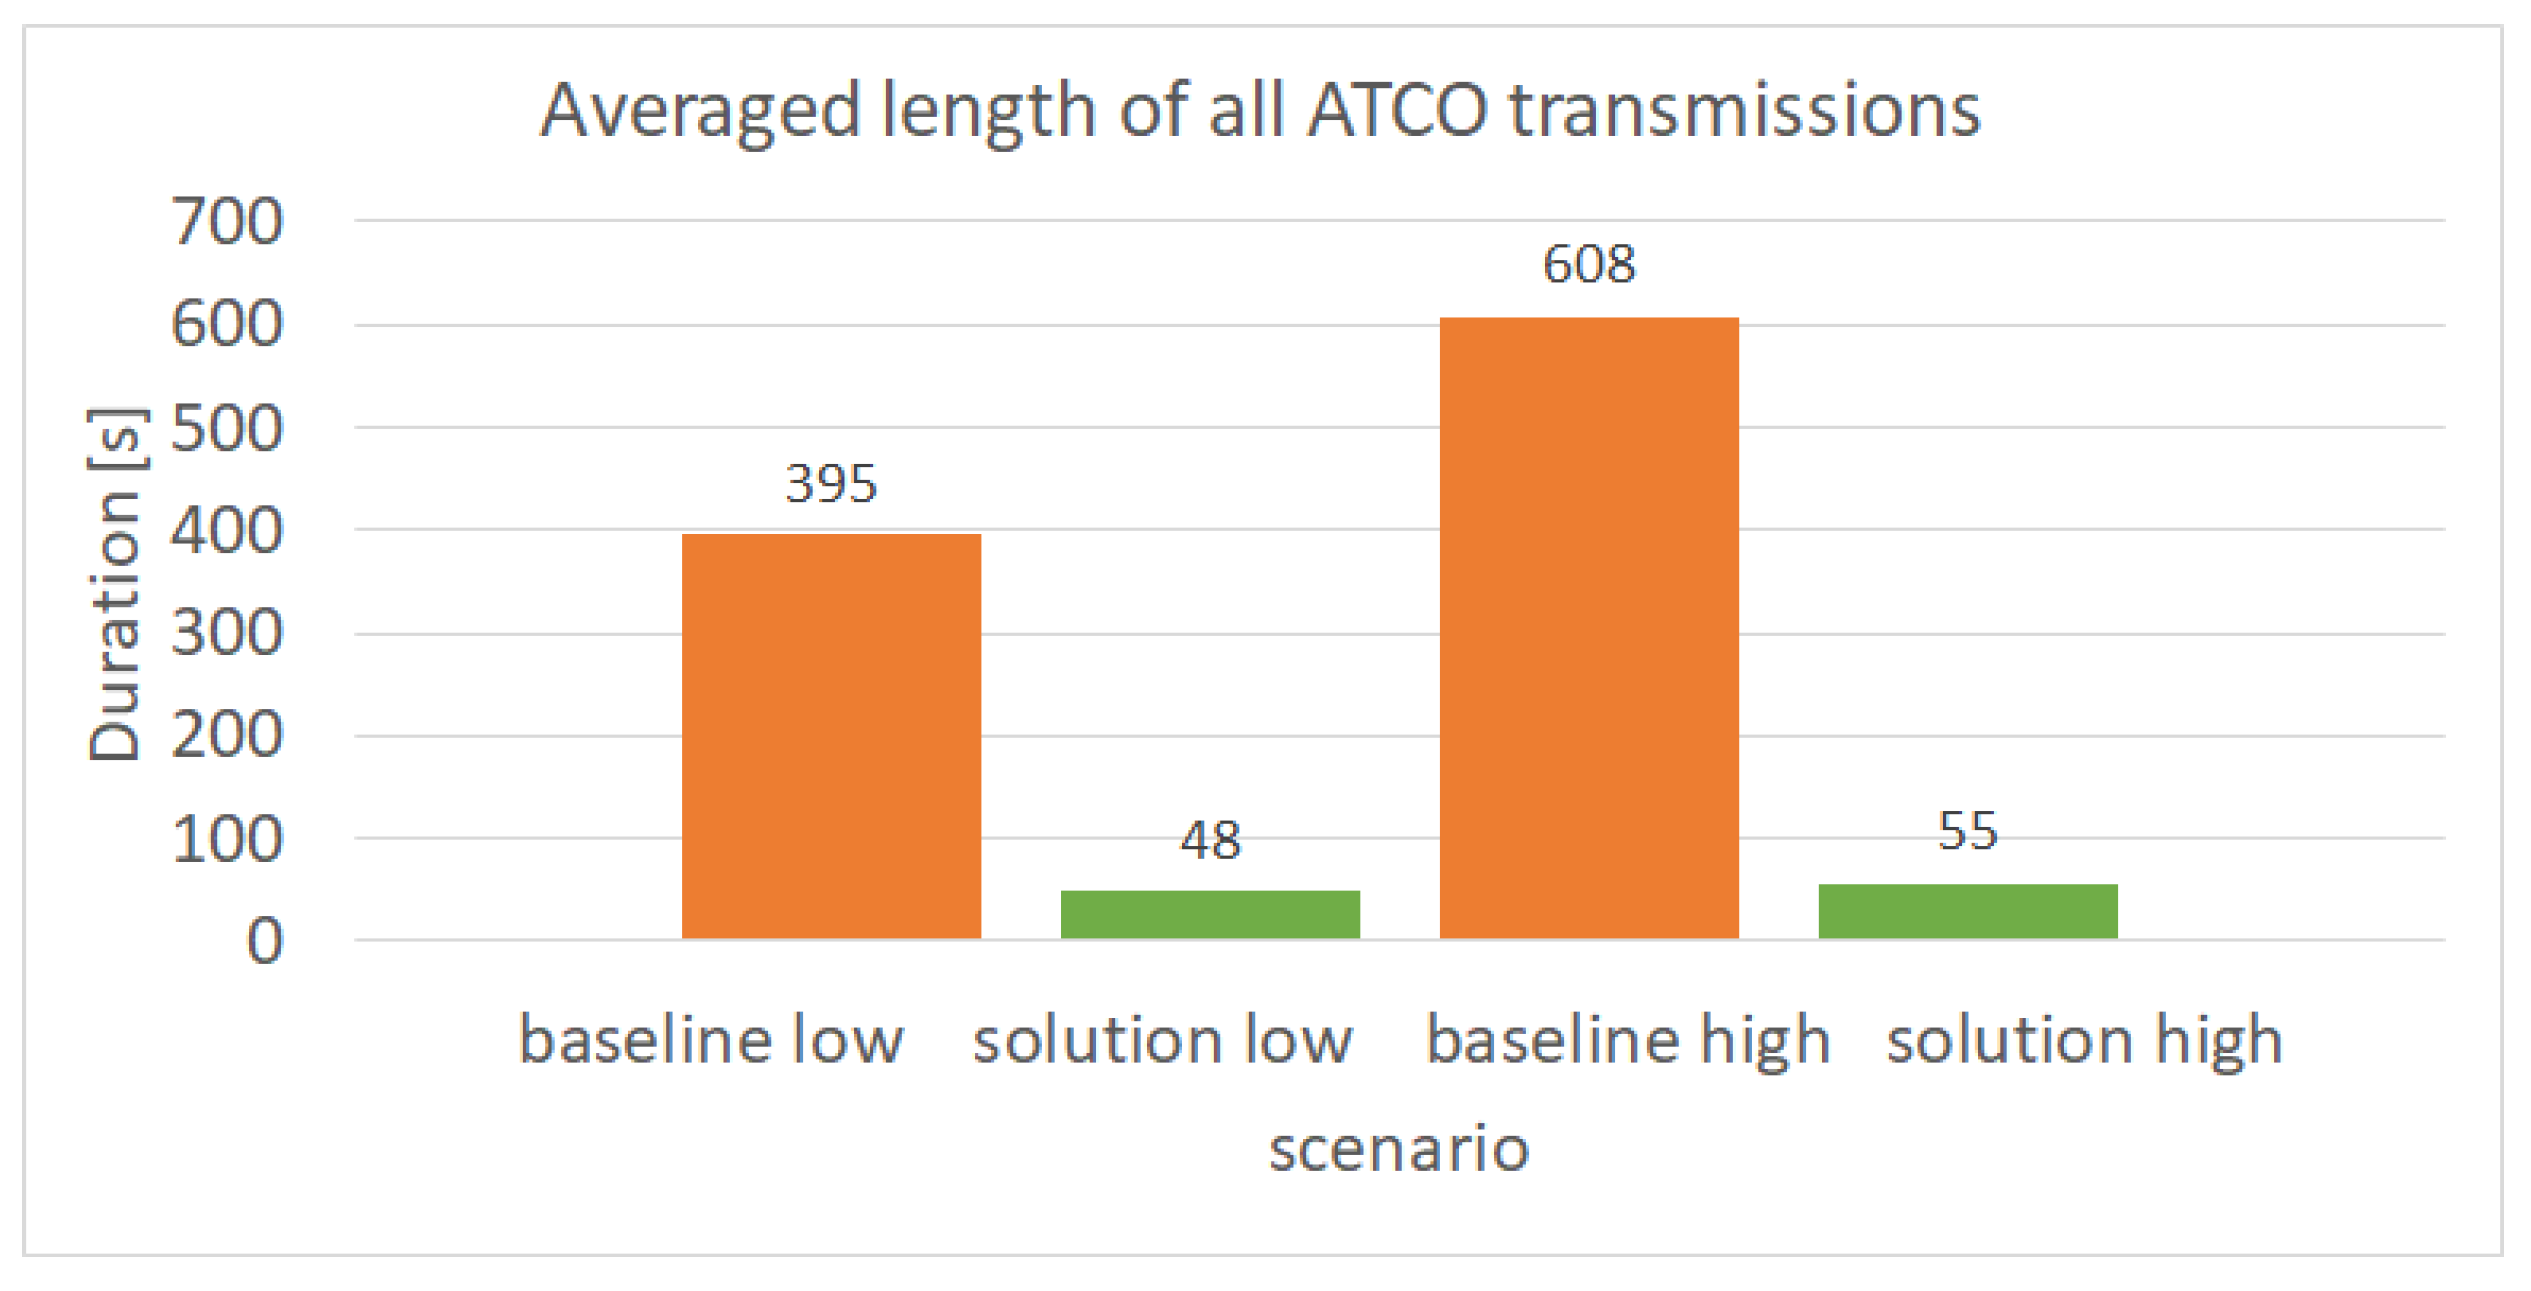
Figure 7 shows the amount of time the ATCO needed to communicate all required clearances to the pilots. For baseline low scenarios, the duration of ATCO speech during simulation runs was on average 6.6 min (395 s) and 10.1 min (608 s) for baseline high scenarios. The solution scenarios again show only a minor difference between the low (48 s) and high (55 s) scenarios.
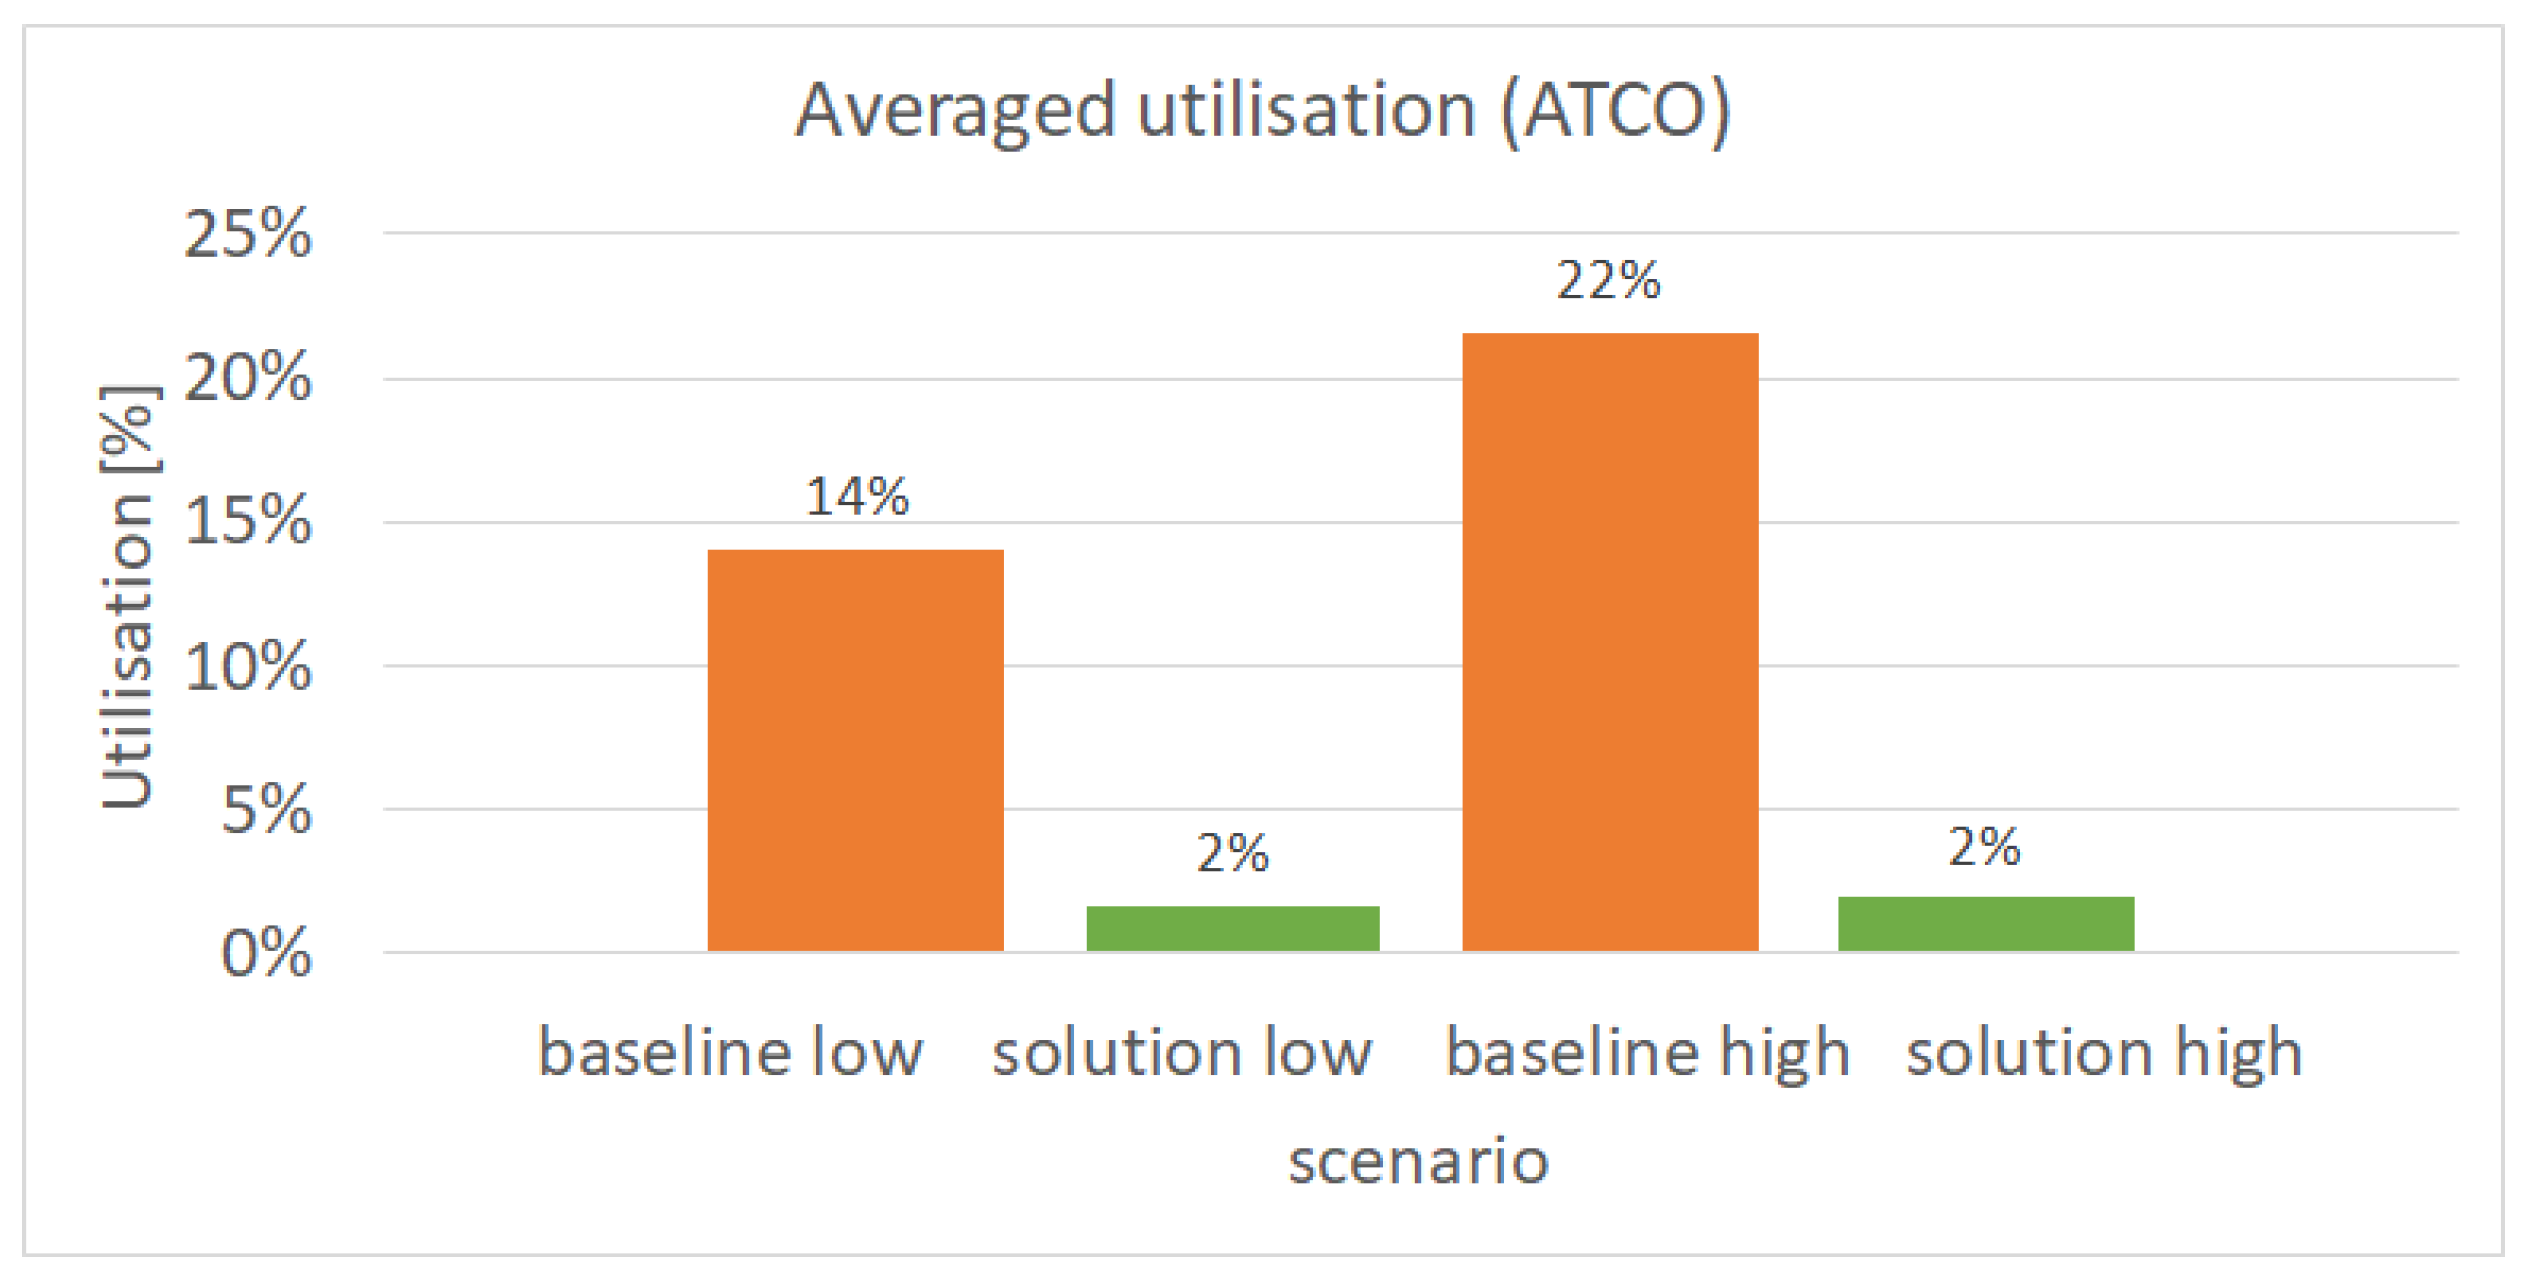
Figure 8 sets the ATCO communication time from Figure 7 in relation to the total simulation time of a simulation run. This shows that in baseline low scenarios, the ATCO required 14% of the time in a simulation run to issue all verbal clearances. This increased to 22% in the baseline high scenarios. For the solution runs, the time needed for verbal communication from the ATCO site made up only 2% of the simulation run duration.
Figure 7. Length of all transmissions in seconds averaged over all runs per scenario.
Figure 8. Percentage of run duration used for radiotelephony (sending) averaged of all runs per scenario.
All parameters reflect the same relationship: the possibility of using CPDLC with all aircraft reduces the number of necessary radio transmissions and thus the average total duration of all radio transmissions and the utilisation, i.e., the proportion of time spent on (controller) voice radio in the total time. Although 100% CPDLC equipment of the aircraft was assumed, only a few, frequently used, instructions were available for CPDLC. It was also possible, and sometimes necessary, to give instructions by radio in the solution scenarios. This takes into account the current operational limitations of CPDLC: First, the wide range of possible ATCO instructions is not fully covered. Second, time critical instructions require instant responses from pilots or a clear indication possibility from the ATCO that the pilot did not react. With readback, this indication possibility is realised faster than with the current usual CPDLC response time of 2 min [67]. To obtain comparable scenarios, readback errors and missing readback events in baseline scenarios were replaced by simulated CPDLC failures, including an indication in the aircraft label in the solution scenarios, leading to roughly the same increase in workload being brought on by these events in all scenarios. However, the response times of the pseudo pilots for speech and CPDLC were not defined, resulting in similar times.
It is also evident in the comparison of both solution scenarios that there are nearly no extra transmissions despite the doubling of traffic (see Figure 6). This could be expected as voice communication is only used for complex instructions and/or such events not covered by CPDLC, i.e., aircraft with sick passengers and CPDLC failures. However, there is a similar effect for the baseline scenarios: a doubling of the traffic volume is covered with 1.5 times the number of transmissions. This is a good example to show that an increase in the traffic amount does not necessarily lead to the same increase in complexity and/or in communication. A larger proportion of the additional aircraft compared to the low scenario is passing through the sector without the need of additional instructions. Nevertheless, even these aircraft add workload to ATCOs as they need to and will be considered for other potentially conflicting traffic.
Voice communication is only one part of the ATCO’s task load and workload. However, the above-mentioned significant reduction when using CPDLC for very few basic instructions would contribute to a lower ATCO workload and enable an SC to maintain the workload level of an ATCO in an ATCO team. The usage of CPDLC reduces readback to the same extent and is not taken into account in the data, despite creating additional capacity for the ATCO. As described above, this contradicts the subjective assessment in [5], which needs further analysis.
In the analysis of XFL deviations, some aircraft were excluded as no electronic coordination was possible due to coordination system outtakes during part of the validation runs. In these cases, the controllers were instructed to consider their own coordination as accepted. Thus, the number of runs in Table 7 is higher than that in Table 8. Table 8 shows the distribution of the remaining deviations across the scenarios and the average number of deviations per scenario. The deviations are also divided into four categories:
  • Minor: ≤400 ft;
  • Medium: >400 ft and ≤1000 ft;
  • Large: >1000 ft;
  • Lateral excursion: missed to pass F L 245 or below within own lateral sector boundaries.
For minor deviations, it can be assumed that they cease in the following seconds and were therefore not coordinated by the ATCOs. The effort is greater than the benefit if the controller is assumed to be aware of all surrounding traffic. All medium deviations are closer or as close to another assignable FL as to the coordinated FL, whereas large deviations correspond to an occupation of a wrong i.e., not coordinated, FL. Lateral excursions can be regarded as particularly critical, as the lateral sector may not even be aware of the aircraft and cannot include it in the preliminary planning. In addition, a separate categorisation was made for forgotten aircraft that have an identical actual entry and exit FL but a different coordinated XFL. In this case, it can be assumed that these aircraft were completely overlooked. In other cases, aircraft may have been instructed to fly to the coordinated FL, but did not reach the corresponding FL or were not coordinated in time. Although XFL deviations are used in the literature [51] to assess situational awareness, a deviation to severity levels, as used in this analysis, is not performed. The result of an “uncontrolled” scenario is given as an additional reference value. In this case, no controller intervened, and all aircraft followed their flight plan. Even in the uncontrolled scenario, the number of deviations is too low to perform t-tests. Nevertheless, from an operational perspective, the amount of XFL deviations is high. The reason for this is the intended explicit non-intervention of the pseudo pilots and, in particular, the pseudo controller. In operational mode, pilots would ask for higher or lower FLs as soon as it seemed necessary or operationally sensible from their point of view. Neighbouring sectors would call and make enquiries, act proactively, and coordinate or complain. In addition, events such as not adhering to a rate that was correctly read back actively favoured deviations. These measures were initially taken to simulate a more realistic environment (e.g., where there are also pilots mistakes) and, secondly, to ensure as far as possible the occurrence of XFL deviations to enable a comparison. This comparison contains a key message: The SCO concept and system can perform comparably well. Analysing only the low scenarios, nearly all XFL deviation categories show higher average values in the low-traffic solution runs. However, the number of considered runs was higher and the difference was not significant. Still, it is remarkable that these deviations occur in relaxed traffic conditions, as shown by ISA values. One reason could be the missing Attention Guidance for XFLs. There was no coloured indication in the label. In the baseline scenario, this could have been caught by the planner controller as it is their primary task to coordinate handover conditions with adjacent sectors. The comparison of high scenarios show the opposite: nearly all deviation categories show lower values for the solution scenario. Again, the differences are not significant. Based on this and the response time to ISA queries, it can be concluded that the level of situational awareness is hardly impaired by SCO.
Table 8. XFL deviations.
ScenarioBaseline LowSolution LowUncontrolled LowBaseline HighSolution HighUncontrolled High
runs351771
average number4.35.816109.327
average minor0.10.400.60.10
average medium0.70.211.712
average large3.34.61366.620
average lateral excursion00.621.71.65
average forgotten0.70.8not applicable1.31not applicable

4.3. Operational Performance

The results of the operational performance based on flight distance are shown in Table 9. While not specifically mentioned, it can be assumed that ref. [56] measure the influence on flight distance only within the sector(s) in focus, whereas, in this analysis, the influence on the complete downstream flight path is considered in a simplified manner. In addition to the summed up and averaged comparison of the total flight distance, the results are also given in reference to three other parameters: Firstly, they are compared to the total flight distance of all flights in the baseline scenarios. This shows the impact of the SCO concept introduced in one single sector as a percentage. Secondly, they are shown in reference to the the total flight distance within the validated sector of all flights in the baseline scenario. This can serve as an approximation of the impact of the SCO concept introduced in all sectors. Finally, the number of flights is referred to, indicating how many miles an aircraft saves or spends extra on on average (under the assumption that SCO is only introduced in this one sector).
Table 9. Flight Distance Comparison.
For the high-traffic scenario, the use of the given tools in the solution run resulted in a better operational performance, by an average total of 21 NM. In the low-traffic scenario, the use of the tools had almost no benefit, with an average distance increase of 2 NM. This may prove the SCO concept and tools to be beneficial during high traffic because they support the ATCO in high-workload situations, but may not add any benefits when traffic is low and the ATCOs can manage everything easily themselves. However, there is a potential positive impact from SCO.

4.4. Environmental Impact

To determine the environmental impact, the flight duration and distance of each aircraft was recorded. Using the operational performance data, the scenario distance, duration comparison, and the aircraft type, it is possible to calculate the fuel burned by each aircraft. The data used for the calculation are taken from the NARSIM BADA v3.16 simulation environment. Excluding the aircraft affected by the sick passenger event and combining the data for each scenario, it is possible to obtain a comparison of the baseline and solution scenario runs.
For the high-traffic scenario, a total reduction of 4010 kg of fuel is calculated. By using the tools, a fuel consumption of 98.8% of the baseline is achieved (Table 10), leading to an average fuel difference of 98 kg and saving close to 310 kg of CO2 per flight. For the low-traffic scenario, the opposite is the case, with an additional consumption of 3225 kg of fuel and an increased consumption of 102.2% compared to the baseline.
Table 10. Fuel consumption comparison.
The increase between the baseline and solution for low scenarios could be due to the influence of individual performance, as the baseline low scenario was conducted four times, whereas the solution low scenario was conducted seven times. Furthermore, the analysis is based on the lateral difference between corresponding flights of baseline and solution scenarios considering BADA [58]. Vertical differences (e.g., descending an aircraft unnecessary early) are not analysed in the study.

4.5. Cost Efficiency and Capacity

The validation at hand was not intended to identify the optimal or maximum capacity suitable for SCO. Instead, it aimed to show the ability of an SC to safely and efficiently manage 80% of the traffic of a controller team. The aim of the recordings for capacity were to evidence that potential cost efficiency, safety, and operational efficiency benefits were not caused by less traffic being handled, by the non-acceptance of individual flights, or by delays to flatten traffic peaks.
Realistic cost efficiency calculations require comparable safety, operational efficiency, and environmental impact to baseline scenarios. SCO cost efficiency gains stem from single SC deployments handling at least half the traffic of a two-person ATCO team. For simplification, this study used the declared capacity of an existing sector as a reference, which represents the maximum number of aircraft allowed in a specified sector in a specified time period. This value is typically not required continuously. The two validated conditions for traffic load (40% and 80%) are able to show that SCO is at least equally as cost-efficient as a controller team. The 40% solution scenario performs better than the 80% baseline scenario in terms of safety, workload, and situational awareness according to the applied objective measures in the validation. This also indicates a potential higher cost efficiency, as the 80% solution scenario is just as good, with some exceptions regarding the corresponding baseline scenario. The same applies for both 40% scenarios. The use of a maximum of 80% of the declared capacity was selected to take the situation of an unknown system and sector for the participants into account. However, the findings cannot be extrapolated to 100% declared capacity. Nevertheless, even a potential use of an SC working 80% instead of two ATCOs working 100% equals a theoretical increase of 60% capacity per ATCO. This can be understood through an example of two ATCOs being able to handle 60 aircraft per hour (30 per ATCO per hour) and the SC being able to handle 48 according to the results. As discussed in Section 2.1.6, the cost efficiency measure, as used in [61], shows a higher cost efficiency in terms of ATCO hours per flights but a lower overall capacity at the same time. Assuming that 100% of traffic needs to be controlled, SCO brings a potential 40% cost efficiency increase. It has to be admitted that this is a purely theoretical calculation, since, in a controller team, both ATCOs will handle all aircraft as they have different tasks and responsibilities. It is not possible to allocate half the amount to each ATCO as it cannot be assumed that two ATCOs can handle double the amount of traffic of one ATCO. For example, [13] assumed 60% more capacity if a second ATCO is joining. This would imply that a single ATCO could handle 62.5% without additional means. Furthermore, the required cost for implementation would reduce cost efficiency at least during the introduction phase, as considered in [61]. In addition, the stated benefit ignores other possible countermeasures of an air navigation service provider (ANSP), e.g., the collapsing of sectors. However, a collapsed sector consisting of two sectors will always have a lower declared capacity than the cumulative declared capacity. On the other hand, it will most likely have a higher declared capacity than any of the single sectors. Whether SCO or collapsing sectors is more beneficial depends on the concrete values of the declared capacity, the maximum traffic load for an SC, and the dependency or relative overlap of flights between the single sectors. Still, SCO has an advantage over collapsing in terms of reducing safety-critical handover times between ATCOs.

5. Discussion

This chapter will summarise the limitations and restrictions of the results of the validation at hand. Subsequently, the results will be discussed from a general perspective while also referring to the limitations.
The validation took place in an en route sector of upper airspace (here: FL > 245). Accordingly, the results may not be directly applicable to other air traffic control sectors or environments. Furthermore, the system, sector, and participating ATCOs were not harmonised. This introduces effects that will probably result in worse performance despite the briefing and training conducted for sector and system familiarisation. Independent of this, it is more reasonable to transfer results to any combination of system, sector, and ATCO origin than it would be from a harmonised validation. The operational realism was limited by the highly restrictive implementation of the planner ATCO tasks. Only a tool for electronic coordination with a limited selection of coordination options was available for this purpose. Furthermore, events were deliberately implemented to add realism to the validation (e.g., readback errors) while also highlighting ATCO mistakes to highlight the potential risks and benefits of the concept and supporting tools. However, this led to pseudo pilots and pseudo controllers leaving mistakes uncorrected. In turn, higher numbers of separation infringements and exit condition deviations (from 4.3 on average per run in baseline low up to 10 on average per run in baseline high) were measured than would be expected from real-life operations. The environmental analysis can also only be used for relative comparisons within the various test conditions. The assumptions of the calculation model cannot be transferred to real operational conditions. Again, these limitations prevent absolute values to be compared to operative data. However, they are meaningful in comparison to each other.
The influence of training effects was minimised as far as possible by varying the order of the test runs (conditions) between the participants, hence precluding sequence bias [5]. Other cross-effects or influencing factors from the validation set up are excluded from the analysis as much as possible. For example, flights with a sick passenger event are excluded for comparisons of operational performance and runs with coordination bugs are excluded for analyses of deviations of exit conditions, resulting in differences in the number of data points. In contrast, the objective measurement of the subjective-by-nature metrics workload and situational awareness is a challenge and can only serve as an indication rather than a proof. Analyses were configured from an operational perspective in order to avoid erroneous conclusions during the transfer from the inevitably limited validation (e.g., consideration of the total distance after the sector in the operational performance and reference to various reference values). Last, it has to be admitted that due to the number of participants, statistical significance could not always be ensured. As the validation was designed as a proof-of-concept with the focus on how to improve the concept and identify system refinements, results need to be confirmed in follow-up studies regardless.
(a)
Is safety impaired using SCO?
Regarding the first research question included above, it can be summarised that safety is hardly impaired by SCO, given no separation infringement was detected in solution (SCO) scenarios. This is also supported by the comparable situational awareness reported in [5] and confirmed with the, on average, 10 against 9.3 XFL deviations between the baseline high and solution high scenario, as this closely links to safety [32,46,47]. The reason can be found either in the used support tools or in the lower workload. Workload reduction itself might originate from support tools or from the CPDLC assumption. This is represented by the constant radiotelephony utilisation of 2% against 14% and 22% in the high and low baseline scenarios, respectively, which was found by [55] to be a reasonable measure. For example, ATCOs took longer to respond to ISA prompts during the baseline runs, indicating a higher workload. It may be that the support tools introduced in the solution scenarios helped to reduce the workload beyond the counteracting workload increases associated with SCO. Likewise, communication between the two ATCOs and between the executive ATCOs and pilots in the baseline runs could have added to their workload, whereas the solution runs were performed by each ATCO alone using mainly CPDLC. Taking into consideration the findings from the subjective measurements from [5], CPDLC is the main driver here. At the same time, the results presented there concluded that the subjective workload was higher in the solution runs.
(b)
Does SCO lead to an increase in average flight distance?
(c)
Does SCO have an environmental impacts?
The operational performance and environmental impact addressed in the above research questions are closely linked due to their simplified analysis. However, there is a potential positive impact from SCO, with an average flight distance reduction of 0.04 % resulting in a saving of 310 k g C O 2 under 80% traffic conditions, which might again originate from the lower workload. Nevertheless, all findings are dependent on and thus restricted to the validated traffic loads.
Is a Single Controller able to control the same amount of traffic as an ATCO pair without negative impact on operational and human performance, safety, and environmental?
However, from the discussion above, the main research question, included above, can be confirmed for traffic loads of at least up to 80% declared capacity: An SC will be able to control up to 80% of the declared capacity with neutral or positive impact on operational and human performance, safety, and environmental impact in comparison to an ATCO pair, provided that they are supported by tailored tools and the possibility of using CPDLC for basic instructions for the majority of aircraft.

6. Conclusions and Outlook

In the validation, scenarios with two different traffic volumes were compared between a reference with two ATCOs in the roles of an executive and a planning controller and a solution with one SC. The analysis considered objective data for safety, situational awareness, workload, operational performance, and environmental impact. The comparisons focused on the relative assessment, excluding data without counterparts, and were brought to a broader context if deemed useful, like extending the flown distance inside the validated sector to the destination airport using great circle for all scenarios. Other validation limitations were discussed in their influence of the found results. Finally, the analysis of the subjective measurements reported in [5] were compared to the current findings where applicable. The results show a counterintuitive dependency on amount of traffic: In low-traffic conditions (here, 40% of declared capacity), the SCO concept shows a tendency to have a negative impact on the operational efficiency, including its environmental impact, with an average increase of 0.01 % of the total flight distance. The same tendency can be observed with ATCO errors, i.e., deviations from XFL conditions, representing a negative impact on the ATCO situational awareness and workload. However, ISA values and response times did not confirm the latter. On the contrary, in high-traffic conditions (here, 80% of declared capacity), SCO shows a tendency to have a a positive impact on the mentioned aspects. On average, all aircraft save 0.04 % of their total flight distance. Situational awareness, as derived from XFL deviations and ISA response times, is hardly impaired by SCO as the differences between scenarios are not significant. Safety is not impaired by SCO in both traffic conditions. None of the solution scenarios included a separation infringement, which is remarkable given that it was designed to test the concept. Regarding the feasibility of the aforementioned results in high-traffic conditions, SCO can potentially provide a 40 % cost efficiency increase.
The SCO concept is a promising approach to solving staffing problems for ANSPs across Europe. The validation at hand showed potential benefits for safety, operational performance, and environmental impact based on objective data in high-traffic conditions. Although the subjective data analysed in [5] identified a slight workload increase, this should not prevent further research on or implementations of SCO. CPDLC was found to be the main enabler for the SCO concept in both analyses and the main driver of the benefits in terms of workload, situational awareness, and safety as it frees up capacity for controllers to take care of more important tasks and problems. Wide coverage of all aircraft types with CPDLC would be beneficial in the current operational layout of two ATCOs. However, this alone will not help overcome staffing shortages. Introducing the SCO concept through a limited but widespread application of CPDLC would do so. However, SCO requires a wide coverage of aircraft with CPDLC equipment to allow for the response times to ATCO instructions to be comparable to voice communication.
As depicted above, some results of objective measures presented herein and the subjective results presented in [5] contradict each other. This should be investigated further. Additional measures for safety, like the number of tactical conflicts [42,44], or situational awareness, like withheld information [50], would be beneficial. A further validation was planned to be carried out with more ATCOs and adaptations based on the presented results. This includes a validation of higher traffic amounts. However, there was no need to change the concept itself. In general, more practice runs/training on a new system, such as an SCO demonstrator, is needed. Furthermore, a validation under matching conditions in terms of the sector, ATCO, and system should be conducted. Some unresolved issues include the interaction of various SCs, the influence of military aircraft/areas, weather, wind, and the failure of support systems. As CPDLC was found to be the main enabler, a comparison of different implementation stages under SCO could provide benefits in current or near future mixed-traffic conditions. In any of the proposed research directions, the influence on the environment should be investigated as realistically as possible.

Author Contributions

Conceptualization, R.H.; methodology, R.H., T.M. and L.T.; software, T.M. and A.P.; formal analysis, R.H., J.B., L.J.M. and L.C.; investigation, R.H., M.K. and T.M.; resources, R.H., M.K. and T.M.; data curation, T.M.; writing—original draft preparation, R.H., J.B., L.J.M. and L.C.; writing—review and editing, M.K., A.P., T.M., L.T. and L.J.M.; visualization, R.H.; supervision, R.H. All authors have read and agreed to the published version of the manuscript.

Funding

This research received no external funding.

Institutional Review Board Statement

The study was conducted in accordance with the Declaration of Helsinki and approved by DLR ethics board of German Aerospace Center (14/23, 24 August 2023).

Data Availability Statement

The raw data supporting the conclusions of this article will be made available by the authors on request.

Acknowledgments

We would like to express our gratitude to the following individuals for their invaluable support in completing this research. Firstly, we express our deepest appreciation to Mohsan Jameel for implementing essential parts of the described SCO system. We are also grateful to Nils Ahrenhold, Stephanie Hobein, and André Tews for setting up the validation environment and scenarios. Many thanks to Maik Friedrich for taking care of ISA responses (and more). Furthermore, we also appreciate the irreplaceable assistance of all pseudo pilots during the trials. In addition, special thanks go to Kerstin Ruta and Kerstin Diederich for their organisational support prior to, during, and after the trials. We sincerely thank Joachim Keck (Keccon), who supported us with his extensive operational knowledge in the concept development, preparation, and realisation of the validation. We are also extremely grateful to Oliver Ohneiser for his useful (and enjoyable) comments and for editing an earlier draft of this article. Last but not least, we would like to express gratitude to the participating air traffic controllers, enabling the gathering of the analysed data in the first place.

Conflicts of Interest

The authors declare no conflicts of interest. The funders had no role in the design of the study; in the collection, analyses, or interpretation of data; in the writing of the manuscript; or in the decision to publish the results.

Abbreviations

The following abbreviations are used in this manuscript:
AIArtificial intelligence
AIMAccident Incident Model
ANSPAir Navigation Service Provider
ATCAir Traffic Control
ATCOAir Traffic Controller (Officer)
ATMAir Traffic Management
BADABase of Aircraft Data (aircraft performance model data)
CPDLCController–Pilot Data Link Communication
CWPController Working Position
DACDynamic Airspace Configuration
DLRDeutsches Zentrum für Luft- und Raumfahrt (German Aerospace Center)
EEGElectroencephalography
E-OCVMEuropean Operational Concept Validation Methodology
FCAFlight-centric ATC
FLFlight Level
HAIKUHuman AI teaming Knowledge and Understanding (project)
IFPInitial Flight Plan
ISAInstantaneous Self Assessment
MAC-ENRMid-Air Collision En Route
MDPIMultidisciplinary Digital Publishing Institute
NARSIMNLR Air Traffic Control Research Simulator
NASA-TLXNational Aeronautics and Space Administration—Task Load Index
NFLEntry Flight Level
NLRNederlands Lucht- en Ruimtevaartcentrum (Netherlands Aerospace Center)
SAMESafety Assessment Made Easier
SCSingle Controller
SCOSingle-Controller Operation
SESARSingle European Sky ATM Research
SHAPESolutions for Human Automation Partnerships in European ATM
SPOSingle-Person Operation
TOPAZTraffic Organization and Perturbation AnalyZer
VFRVisual Flight Rules
XFLExit Flight Level

References

  1. EUROCONTROL Forecast Update 2024–2030. Available online: https://www.eurocontrol.int/publication/eurocontrol-forecast-2024-2030 (accessed on 19 September 2024).
  2. IFATCA Staff Shortage Survey–EUR Region. Available online: https://ifatca.org/staff-shortage-survey-eur-region/ (accessed on 19 September 2024).
  3. Transportation Research Board. Air Traffic Controller Staffing in the en Route Domain: A Review of the Federal Aviation Administration’s Task Load Model; Vol. 301, Transportation Research Board Special Report; Transportation Research Board: Washington, DC, USA, 2010; pp. 17–19. [Google Scholar]
  4. Schon, J. Analyse von Akzeptanzfaktoren für Künstliche Intelligenz in der Flugsicherung. Master’s Thesis, Universität Duisburg-Essen, Essen, Germany, 2024. [Google Scholar]
  5. Hunger, R.; Christoffels, L.; Friedrich, M.; Jameel, M.; Pick, A.; Gerdes, I.; von der Nahmer, P.M.; Sobotzki, F. Lesson Learned: Design and Perception of Single Controller Operations Support Tools. In Engineering Psychology and Cognitive Ergonomics; Harris, D., Li, W.C., Eds.; Springer Nature Switzerland and Imprint Springer: Cham, Switzerland, 2024; pp. 15–33. [Google Scholar] [CrossRef]
  6. Dehn, D.M.; Drozdowski, S.; Teutsch, J.; Lorenz, B. Downlink of TCAS Resolution Advisories: A Means for Closing the Gap Between Pilot and Controller? Int. J. Aviat. Psychol. 2010, 20, 325–346. [Google Scholar] [CrossRef]
  7. Ilginis, A. Vienanarės Skrydžių Vadovų Pamainos (Teikiant Aerodromo bei Prieigų Skrydžių Valdymo Paslaugas) Tyrimas. Master’s Thesis, Vilniaus Gedimino Technikos Universitetas, Vilnius, Lithuania, 2014. [Google Scholar]
  8. Matessa, M.; Strybel, T.; Vu, K.; Battiste, V.; Schnell, T. Concept of Operations for RCO SPO. Available online: https://ntrs.nasa.gov/citations/20170007262 (accessed on 19 September 2024).
  9. Herrera, I.; Smoker, A.; Pinska-Chauvin, E.; Feuerberg, B.; Schwarz, M.; Laursen, T.; Josefsson, B. Resilience Engineering (RE) in Design: Initial Application of a new re assessment method to the multiple remote tower concept. In Proceedings of the 6th REA Symposium Managing Resilience, Lisbon, Portugal, 22–25 June 2015. [Google Scholar]
  10. Stryk, R.; Dorda, M. Modeling ATC Clearance Delivery Operation as a Queueing System with Deterministic and Stochastic Service Times. In Proceedings of the New Trends in Civil Aviation (NTCA), Prague, Czech Republic, 25–26 April 2024; pp. 225–231. [Google Scholar] [CrossRef]
  11. Single Person Operations in ATC. Available online: https://ifatca.wiki/kb/wp-2001-159/ (accessed on 19 September 2024).
  12. Šišlák, D.; Volf, P.; Pěchouček, M.; Cannon, C.; Nguyen, D.; Regli, W. Multi-Agent Simulation of En-Route Human Air-Traffic Controller. In Proceedings of the 26th AAAI Conference on Artificial Intelligence, Toronto, ON, Canada, 22–26 July 2012; pp. 2323–2328. [Google Scholar] [CrossRef]
  13. Tien, S.L.; Hoffman, R. Optimizing airspace sectors for varying demand patterns using multi-controller staffing. In Proceedings of the 8th USA/Europe Air Traffic Management Research and Development Seminar, Napa, CA, USA, 29 June–2 July 2009. [Google Scholar]
  14. Haugg, E.; Buxbaum, J.; Läntzsch, E.; Lübberstedt, A.; Stanke, L.; Strobl, S.; Tontsch, E.; Trautvetter, F.; Trull-Olitzscher, K.; Wagner, J.C. Zukunftsszenario Flugsicherung: Wie werden Fluglotsen im Jahr 2035 (wahrscheinlich) arbeiten? In Innovationen im Fokus 1; DFS Deutsche Flugsicherung GmbH: Langen, Germany, 2023. [Google Scholar]
  15. Pavlović, G.; Jovanović, R.; Stanojević, M. Rostering of air traffic controllers–current practices in Europe, key performance trade-offs and future opportunities. J. Air Transp. Manag. 2023, 113, 102472. [Google Scholar] [CrossRef]
  16. Finke, M.; Hunger, R.; Tyburzy, L.; Meier, J.; Jameel, M. Using tool support to enable a more flexible deployment of Air Traffic Controllers to Sectors. In Proceedings of the Deutscher Luft- und Raumfahrt Kongress, Hamburg, Germany, 30 September–2 October 2024. [Google Scholar] [CrossRef]
  17. Hind, H.; Omri, A.E.; Abghour, N.; Moussaid, K.; Rida, M. Dynamic airspace configuration: Review and open research issues. In Proceedings of the GOL, Le Havre, France, 10–12 April 2018; pp. 1–7. [Google Scholar] [CrossRef]
  18. Gil, P.; Vidaller, A.; Cano, M.; Gómez, D.; López, J.; Cenal, N.; Chaves, J.; Ruiz-Artaza, F. Feasibility and Benefits of Implementing Flight Centric ATC in the Spanish upper airspace. In Proceedings of the 13th SESAR Innovation Days (SID), Seville, Spain, 27–30 November 2023. [Google Scholar]
  19. Williams, A.; Rodgers, M.D.; Mondoloni, S.; Liang, D. Improving atc efficiency through an implementation of a multi sector planner position. In Proceedings of the 7th USA/Europe Air Traffic Management Research and Development Seminar, Barcelona, Spain, 2–5 July 2007. [Google Scholar]
  20. McGee, J.P.; Parasuraman, R.; Mavor, A.S.; Wickens, C.D. The Future of Air Traffic Control, 1st ed.; National Academies Press: Washington, DC, USA, 1998; pp. 11–47. [Google Scholar]
  21. Gerdes, I.; Jameel, M.; Hunger, R.; Christoffels, L.; Gürlük, H. The automation evolves: Concept for a highly automated controller working position. In Proceedings of the 33nd Congress of the International Council of the Aeronautical Sciences, Stockholm, Sweden, 4–9 September 2022. [Google Scholar]
  22. Jameel, M.; Tyburzy, L.; Gerdes, I.; Pick, A.; Hunger, R.; Christoffels, L. Enabling Digital Air Traffic Controller Assistant through Human-Autonomy Teaming Design. In Proceedings of the DASC 2023 Conference Proceedings, Piscataway, NJ, USA, 1–5 October 2023; pp. 1–9. [Google Scholar] [CrossRef]
  23. Arrigoni, V.; Cavagnetto, N.; Josefsson, B.; Boonsong, S.; Meyer, L. The Human Role in Future Aviation. Available online: https://haikuproject.eu/wp-content/uploads/2024/06/d8.1-the-human-role-in-future-aviation.pdf (accessed on 30 November 2024).
  24. SESAR Joint Undertaking. A Proposal for the Future Architecture of the European Airspace. 2019. Available online: https://www.sesarju.eu/sites/default/files/2019-05/AAS_FINAL_0.pdf (accessed on 30 November 2024).
  25. Strauch, B. Ironies of Automation: Still Unresolved After All These Years. IEEE Trans. Hum.-Mach. Syst. 2018, 48, 419–433. [Google Scholar] [CrossRef]
  26. Endsley, M.R.; Kaber, D.B. Level of automation effects on performance, situation awareness and workload in a dynamic control task. Ergonomics 1999, 42, 462–492. [Google Scholar] [CrossRef] [PubMed]
  27. BFU. Investigation Report Überlingen/Lake Constance: AX001-1-2/02 May 2004; Bundestelle für Flugunfalluntersuchung: Braunschweig, Germany, 2004. [Google Scholar]
  28. Abdellaoui, R.; Stasicka, I.; Finke, M.; Pick, A.; Ahrenhold, N. Supporting Air Traffic Controllers in handling sector specific tasks, enabled by the use of the Boundary Arrival Task Manager. In Proceedings of the DASC 2023 Conference Proceedings, Piscataway, NJ, USA, 1–5 October 2023; pp. 1–10. [Google Scholar] [CrossRef]
  29. Bergner, J.; Hassa, O. Air Traffic Control. In Information Ergonomics; Stein, M., Sandl, P., Eds.; Springer: Berlin/Heidelberg, Germany, 2012; pp. 197–225. [Google Scholar] [CrossRef]
  30. ICAO. Annex 11–Air Traffic Services; ICAO: Montreal, QC, Canada, 2018. [Google Scholar]
  31. Pasquini, A.; Pozzi, S. Evaluation of air traffic management procedures—Safety assessment in an experimental environment. Reliab. Eng. Syst. Saf. 2005, 89, 105–117. [Google Scholar] [CrossRef]
  32. Geisinger, K.; Edwards, C.; Gosling, G.; Muir, A.; Schneemann, G.; Weitzman, D. Guide to Methods & Tools for Safety Analysis in Air Traffic Management. 2003. Available online: https://flightsafety.org/files/methods_tools_safety_analysis.pdf (accessed on 3 March 2025).
  33. International Air Transport Association. IATA Annual Safety Report-2024 Executive Summary and Safety Overview. 2025. Available online: https://www.iata.org/contentassets/a8e49941e8824a058fee3f5ae0c005d9/safety-report-executive-summary-and-safety-overview-2024_final.pdf (accessed on 3 March 2025).
  34. ICAO. Doc 9859–Safety Management Manual (SMM); ICAO: Montreal, QC, Canada, 2009. [Google Scholar]
  35. Moek, G.; ten Have, J.M.; Harrison, D.; Cox, M.E. European Studies to Investigate the Feasibility of using 1000 ft Vertical Separation Minima above FL290 Part III Further Results and Overall Conclusions. J. Navig. 1993, 46, 245–261. [Google Scholar] [CrossRef]
  36. Flavio Vismari, L.; Camargo Junior, J.B. A safety assessment methodology applied to CNS/ATM-based air traffic control system. Reliab. Eng. Syst. Saf. 2011, 96, 727–738. [Google Scholar] [CrossRef]
  37. Baxley, B.T.; Wilson, S.R.; Swieringa, K.A.; Johnson, W.C.; Roper, R.D.; Hubbs, C.E.; Goess, P.A.; Shay, R.F. Human-in-the-Loop Assessment of Alternative Clearances in Interval Management Arrival Operations; National Aeronautics and Space Administration: Hampton, VA, USA, 2016.
  38. EUROCONTROL. European Operational Concept Validation Methodology Version 3; EUROCONTROL: Brussels, Belgium, 2010. [Google Scholar]
  39. Blom, H.A.P.; Daams, J.; Nijhuis, H.B. Human Cognition Modelling in Air Traffic Management Safety Assessment. In Air Transportation Systems Engineering; Donohue, G.L., Ed.; American Institute of Aeronautics and Astronautics: Reston, VA, USA, 2001; pp. 481–511. [Google Scholar] [CrossRef]
  40. Blom, H.A.P.; Stroeve, S.H.; de Jong, H.H. Safety Risk Assessment by Monte Carlo Simulation of Complex Safety Critical Operations. In Developments in Risk-Based Approaches to Safety; Redmill, F., Anderson, T., Eds.; Springer-Verlag London Limited: London, UK, 2006; pp. 47–67. [Google Scholar] [CrossRef]
  41. Rabiller, B.; Fota, N.; Carbo, L. SESAR Safety Reference Material; EUROCONTROL: Brussels, Belgium, 2018. [Google Scholar]
  42. Rabiller, B.; Fota, N.; Carbo, L. Guidance to Apply SESAR Safety Reference Material; EUROCONTROL: Brussels, Belgium, 2018. [Google Scholar]
  43. Eurocontrol Safety Regulation Commission. Eurocontrol Safety Regulatory Requirement 4-Risk Assessment and Mitigation in ATM; EUROCONTROL: Brussels, Belgium, 2001. [Google Scholar]
  44. Capiot, K.; Martins, A.P.G.; Weber, M. Performance Review of Non-Nominal Scenarios in a Validation Exercise of the Flight Centric Air Traffic Control Concept. In Proceedings of the 12th SESAR Innovation Days (SID), Budapest, Hungary, 5–8 December 2022. [Google Scholar]
  45. Martins, A.P.G.; Kluenker, C.S.; Edinger, C.; Tittel, S.; Weber, M. Evaluation of the Impact on Air Traffic Controllers of Air-Ground Datalink Technologies (LDACS and Current CPDLC) in Flight Centric ATC. In Proceedings of the 2024 AIAA DATC/IEEE 43rd Digital Avionics Systems Conference (DASC), San Diego, CA, USA, 29 September–3 October 2024; pp. 1–9. [Google Scholar] [CrossRef]
  46. Birkmeier, B.; Martin, D.J.; Straube, K.; Biella, M. Preliminary safety assessment for a sectorless ATM concept. In Proceedings of the 2013 IEEE/AIAA 32nd Digital Avionics Systems Conference (DASC), East Syracuse, NY, USA, 5–10 October 2013; pp. 1–46. [Google Scholar] [CrossRef]
  47. Stanton, N.A.; Chambers, P.R.; Piggott, J. Situational awareness and safety. Saf. Sci. 2001, 39, 189–204. [Google Scholar] [CrossRef]
  48. Endsley, M.R. Design and Evaluation for Situation Awareness Enhancement. Proc. Hum. Factors Soc. Annu. Meet. 1988, 32, 97–101. [Google Scholar] [CrossRef]
  49. Dehn, D.M. Assessing the impact of automation on the air traffic controller: The SHAPE questionnaires. Air Traffic Control. Q. 2008, 16, 127–146. [Google Scholar] [CrossRef]
  50. Endsley, M.R. Measurement of Situation Awareness in Dynamic Systems. Hum. Factors 1995, 37, 65–84. [Google Scholar] [CrossRef]
  51. Rantanen, E.M.; Butler, J.S. Measurement of Air Traffic Controllers’ Situation Awareness and Performance During Simulator Training. In Experimental Analysis and Measurement of Situation Awareness; Garland, D.J., Endsley, M.R., Eds.; Embry-Riddle Aeronautical University Press: Daytona Beach, FL, USA, 1995; pp. 203–209. [Google Scholar]
  52. Tattersall, A.J.; Foord, P.S. An experimental evaluation of instantaneous self-assessment as a measure of workload. Ergonomics 1996, 39, 740–748. [Google Scholar] [CrossRef]
  53. Ahlstrom, U.; Friedman-Berg, F.J. Using eye movement activity as a correlate of cognitive workload. Int. J. Ind. Ergon. 2006, 36, 623–636. [Google Scholar] [CrossRef]
  54. Brookings, J.B.; Wilson, G.F.; Swain, C.R. Psychophysiological responses to changes in workload during simulated air traffic control. Biol. Psychol. 1996, 42, 361–377. [Google Scholar] [CrossRef] [PubMed]
  55. Fürstenau, N.; Radüntz, T. Power law model for subjective mental workload and validation through air traffic control human-in-the-loop simulation. Cogn. Technol. Work. 2022, 24, 291–315. [Google Scholar] [CrossRef]
  56. Ástþórsdóttir, H. Performance Metrics in Air Traffic Management Systems. Master’s Thesis, Reykjavik University, Reykjavik, Iceland, 2013. [Google Scholar]
  57. Shiau, J.K.; Ma, D.M.; Chiu, C.W.; Shie, J.R. Optimal Sizing and Cruise Speed Determination for a Solar-Powered Airplane. J. Aircr. 2010, 47, 622–629. [Google Scholar] [CrossRef]
  58. Poles, D.; Nuic, A.; Mouillet, V. Advanced aircraft performance modeling for ATM: Analysis of BADA model capabilities. In Proceedings of the 29th Digital Avionics Systems Conference, Salt Lake City, UT, USA, 3–7 October 2010; pp. 1.D.1-1–1.D.1-14. [Google Scholar] [CrossRef]
  59. Jardine, C.N. Calculating the Carbon Dioxide Emissions of Flights. 2009. Available online: https://citeseerx.ist.psu.edu/document?repid=rep1&type=pdf&doi=2a9fba810293fe675d61b48c2be10db0179b6130 (accessed on 3 March 2025).
  60. Mage, P.; Nikolić, K.K. Modeling the Effect of One Engine Inoperative for Bada Flight Performance Model. In Proceedings of the 45th Jubilee International Convention on Information, Communication and Electronic Technology (MIPRO), Opatija, Croatia, 23–27 May 2022; pp. 1526–1531. [Google Scholar] [CrossRef]
  61. PJ19.04: Performance Framework (2019). Available online: https://www.sesarju.eu/sites/default/files/documents/awards2021/SESAR%20Performance%20Framework%20ed_%2001_00_01%20-%202019.pdf (accessed on 10 March 2025).
  62. ten Have, J. The development of the NLR ATC Research Simulator (Narsim): Design philosophy and potential for ATM research. Simul. Pract. Theory 1993, 1, 31–39. [Google Scholar] [CrossRef]
  63. ICAO. Doc 4444–Procedures for Air Navigation Services: Air Traffic Management; ICAO: Montreal, QC, Canada, 2016. [Google Scholar]
  64. Meinecke, M.; Luchkova, T.; Schultz, M. Entwicklung und Evaluation von Lotsenarbeitsbelastungsmodellen in einer Schnellzeitsimulationsumgebung. In Proceedings of the 65th Deutscher Luft- und Raumfahrtkongress, Braunschweig, Germany, 13–15 September 2016. [Google Scholar]
  65. Gerdes, I.; Temme, A.; Schultz, M. Dynamic Airspace Sectorization for flight-centric operations. Transp. Res. Part C Emerg. Technol. 2018, 95, 460–480. [Google Scholar] [CrossRef]
  66. Helmke, H.; Kleinert, M.; Ahrenhold, N.; Ehr, H.; Mühlhausen, T.; Ohneiser, O.; Klamert, L.; Motlicek, P.; Prasad, A.; Zuluaga-Gomez, J.; et al. Automatic Speech Recognition and Understanding for Radar Label Maintenance Support Increases Safety and Reduces Air Traffic Controllers’ Workload. In Proceedings of the Fifteenth USA/Europe Air Traffic Management Research and Development Seminar (ATM2023), Savannah, GA, USA, 5–9 June 2023. [Google Scholar] [CrossRef]
  67. CPDLC General Safety Considerations. Available online: https://skybrary.aero/articles/cpdlc-general-safety-considerations (accessed on 19 November 2024).
Disclaimer/Publisher’s Note: The statements, opinions and data contained in all publications are solely those of the individual author(s) and contributor(s) and not of MDPI and/or the editor(s). MDPI and/or the editor(s) disclaim responsibility for any injury to people or property resulting from any ideas, methods, instructions or products referred to in the content.

Article Metrics

Citations

Article Access Statistics

Multiple requests from the same IP address are counted as one view.