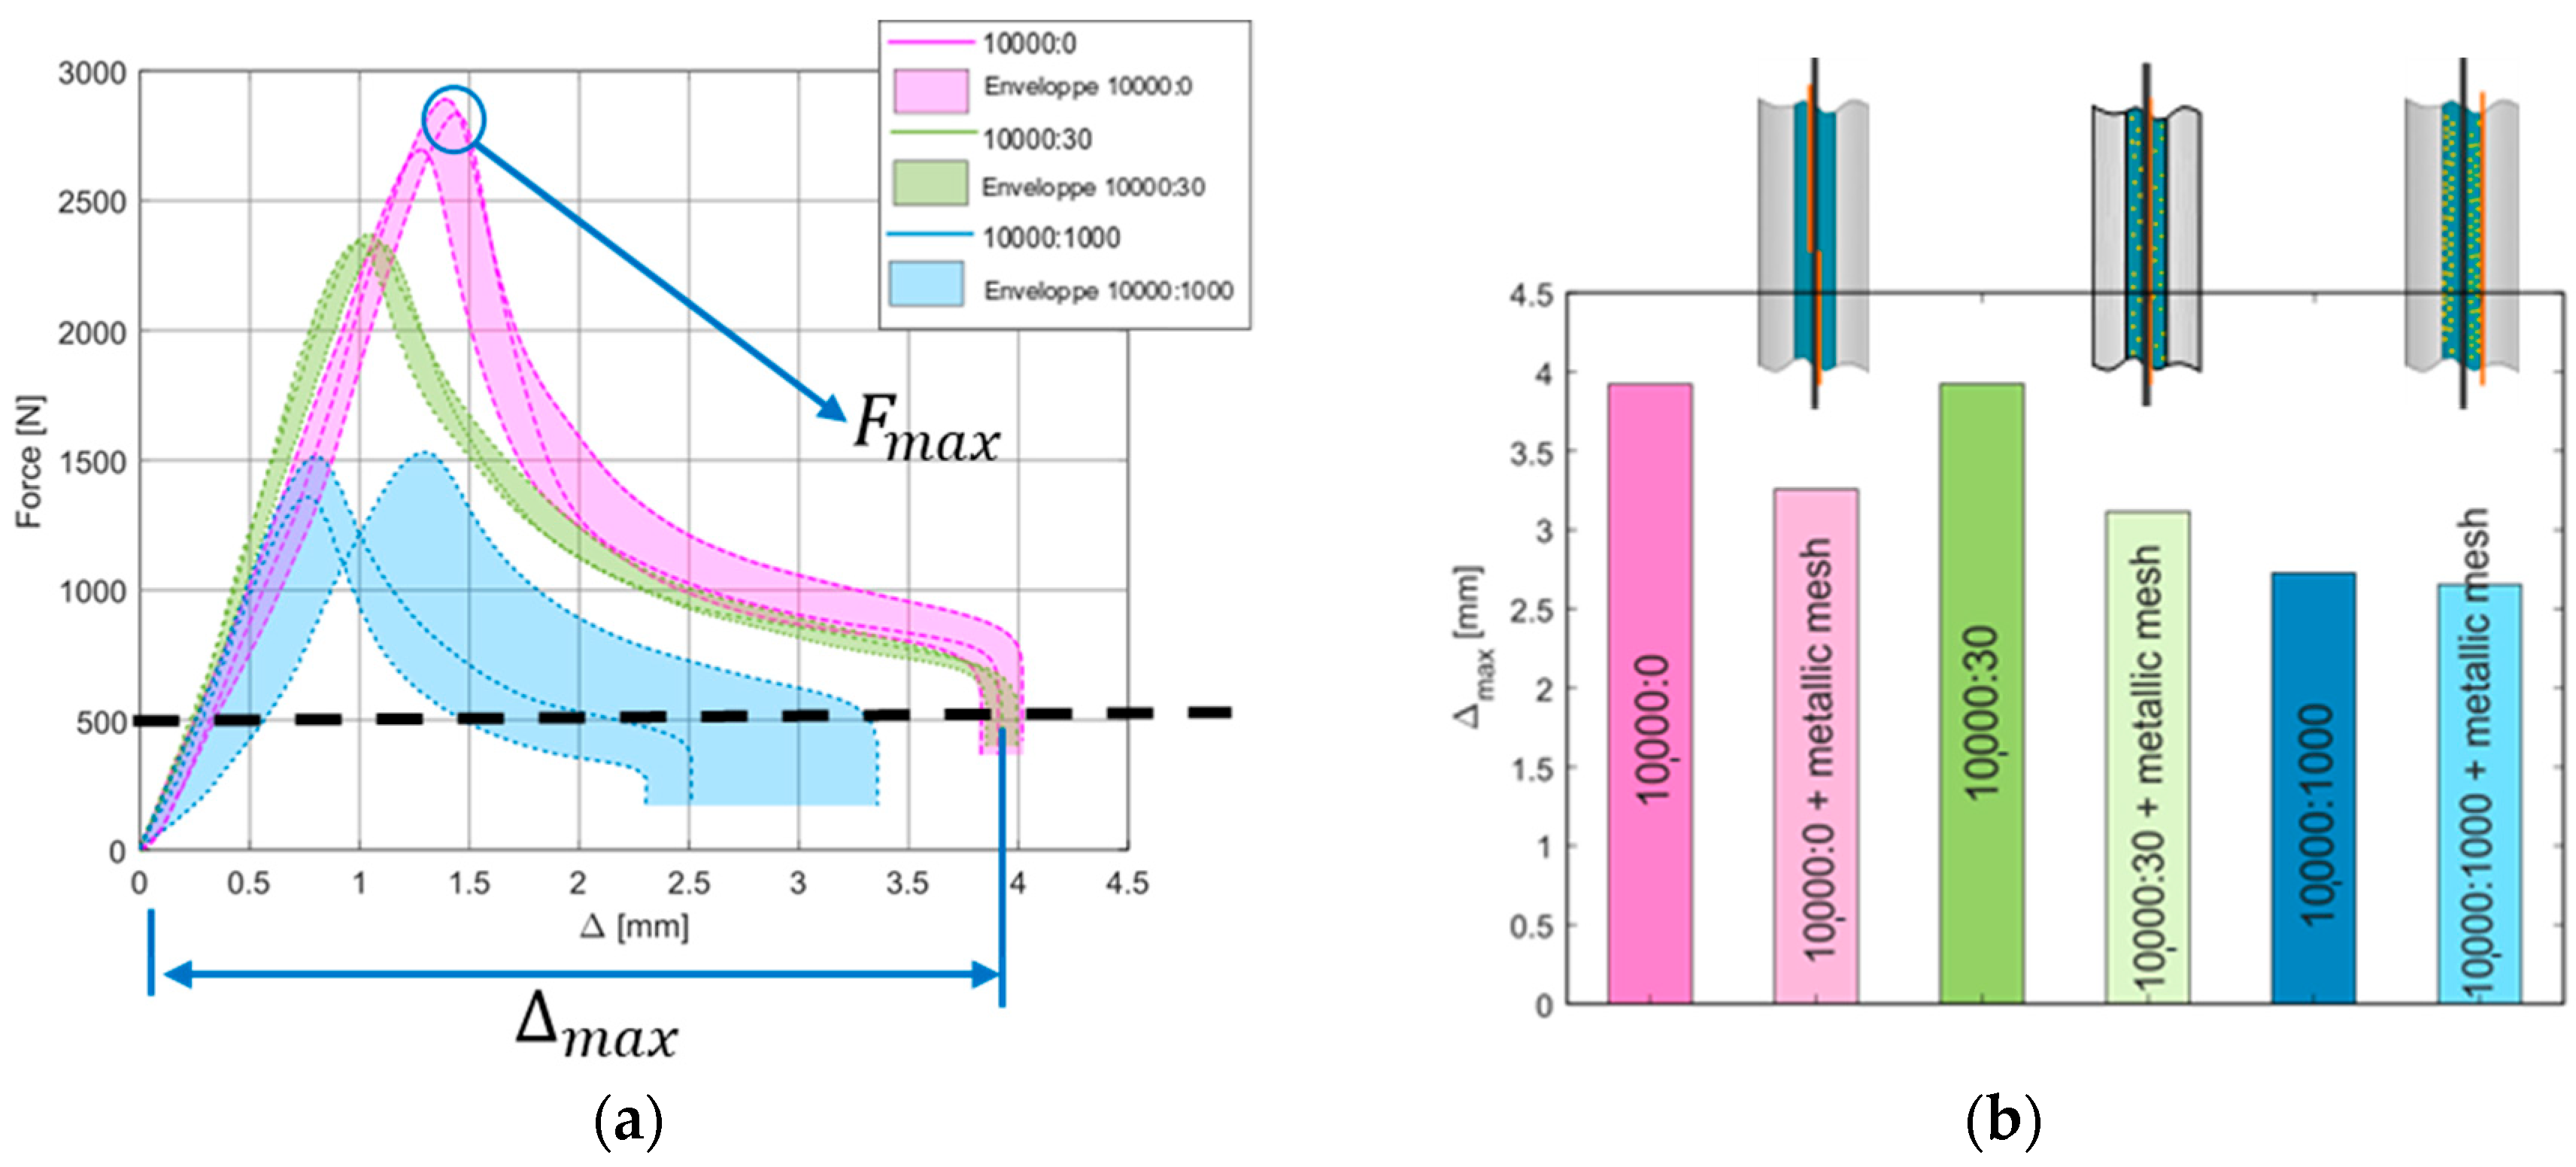
Since the main objective is to propose a method to control disassembly whatever the materials and dimensions of the substrates composing the assembled structures, the presented work is organized around three major steps: assembly conditions and effect of TEPs on impregnability of complex structures; influence of TEPs on load-bearing capability of massive materials; influence of the TEPs and their trigger on the load-bearing capability of the assembled structures. The particles used in this paper were provided courtesy of the company Nouryon (Specialty Chemicals B.V., Amsterdam, The Netherlands) under reference Expancel 031 DU 40. Their activation temperature is 80 °C.
2.1. Materials Mixing and Joint Assembly Processes
The EC2216 liquid epoxy adhesive and the desired amount of TEP volume are mixed by hand in a cleaned and neutral mixing container. The quantity of each ingredient depends on the final volume of adhesive that is desired and on the chosen volume proportion. For example, 10,000 volumes of adhesive for 15 volumes of TEPS written 10,000:15 in the paper. Then the mixture is poured into a surgical syringe for deposition and spreading analysis (
Figure 4). Volume indications on the
Figure 4 are not representative of the mixture proportions nor quantities. The syringe is inclined during filling to prevent air entrapment. The level of adhesive is measured to make sure the deposited volume in the final joint is 5 mL for the compression and spreading tests. A series of 3 to 5 samples was fabricated for each configuration of test.
Following the works of Spangenberg et al. [
17], a special device was developed to observe the adhesive spreading and simultaneously measure the resistant compression force when two substrates are brought together to create a welded joined structure.
Figure 5 below presents two cases. In the first case, a metallic mesh is simply placed above the bottom substrate and maintained at each end by tape (left picture). The adhesive is deposited onto the metallic mesh and then squeezed by the upper plate fixed to the mobile crossbar. This case aims at verifying the permeability of the mesh and its impregnation capacity. In the second case, the adhesive is deposited onto a Plexiglass-bottom plate, and a NOMEX honeycomb maintained in contact with the upper Plexiglas plate through tape at its extremities moves down to the desired thickness of the joint, squeezing the deposited adhesive.
The bottom plexiglass plate on which the adhesive is deposited is 100 mm × 150 mm. The upper plate that moves down at a prescribed velocity “V” (green arrow on
Figure 6) to squeeze the adhesive is 30 mm × 150 mm. Because the upper plate is smaller in width, the adhesive flows outside its lateral boundaries when squeezed. The shape of the outer flow depends on the viscosity of the adhesive and on the contact forces with the plexiglass. The evolution of the shape is registered as a function of time, as shown in
Figure 6.
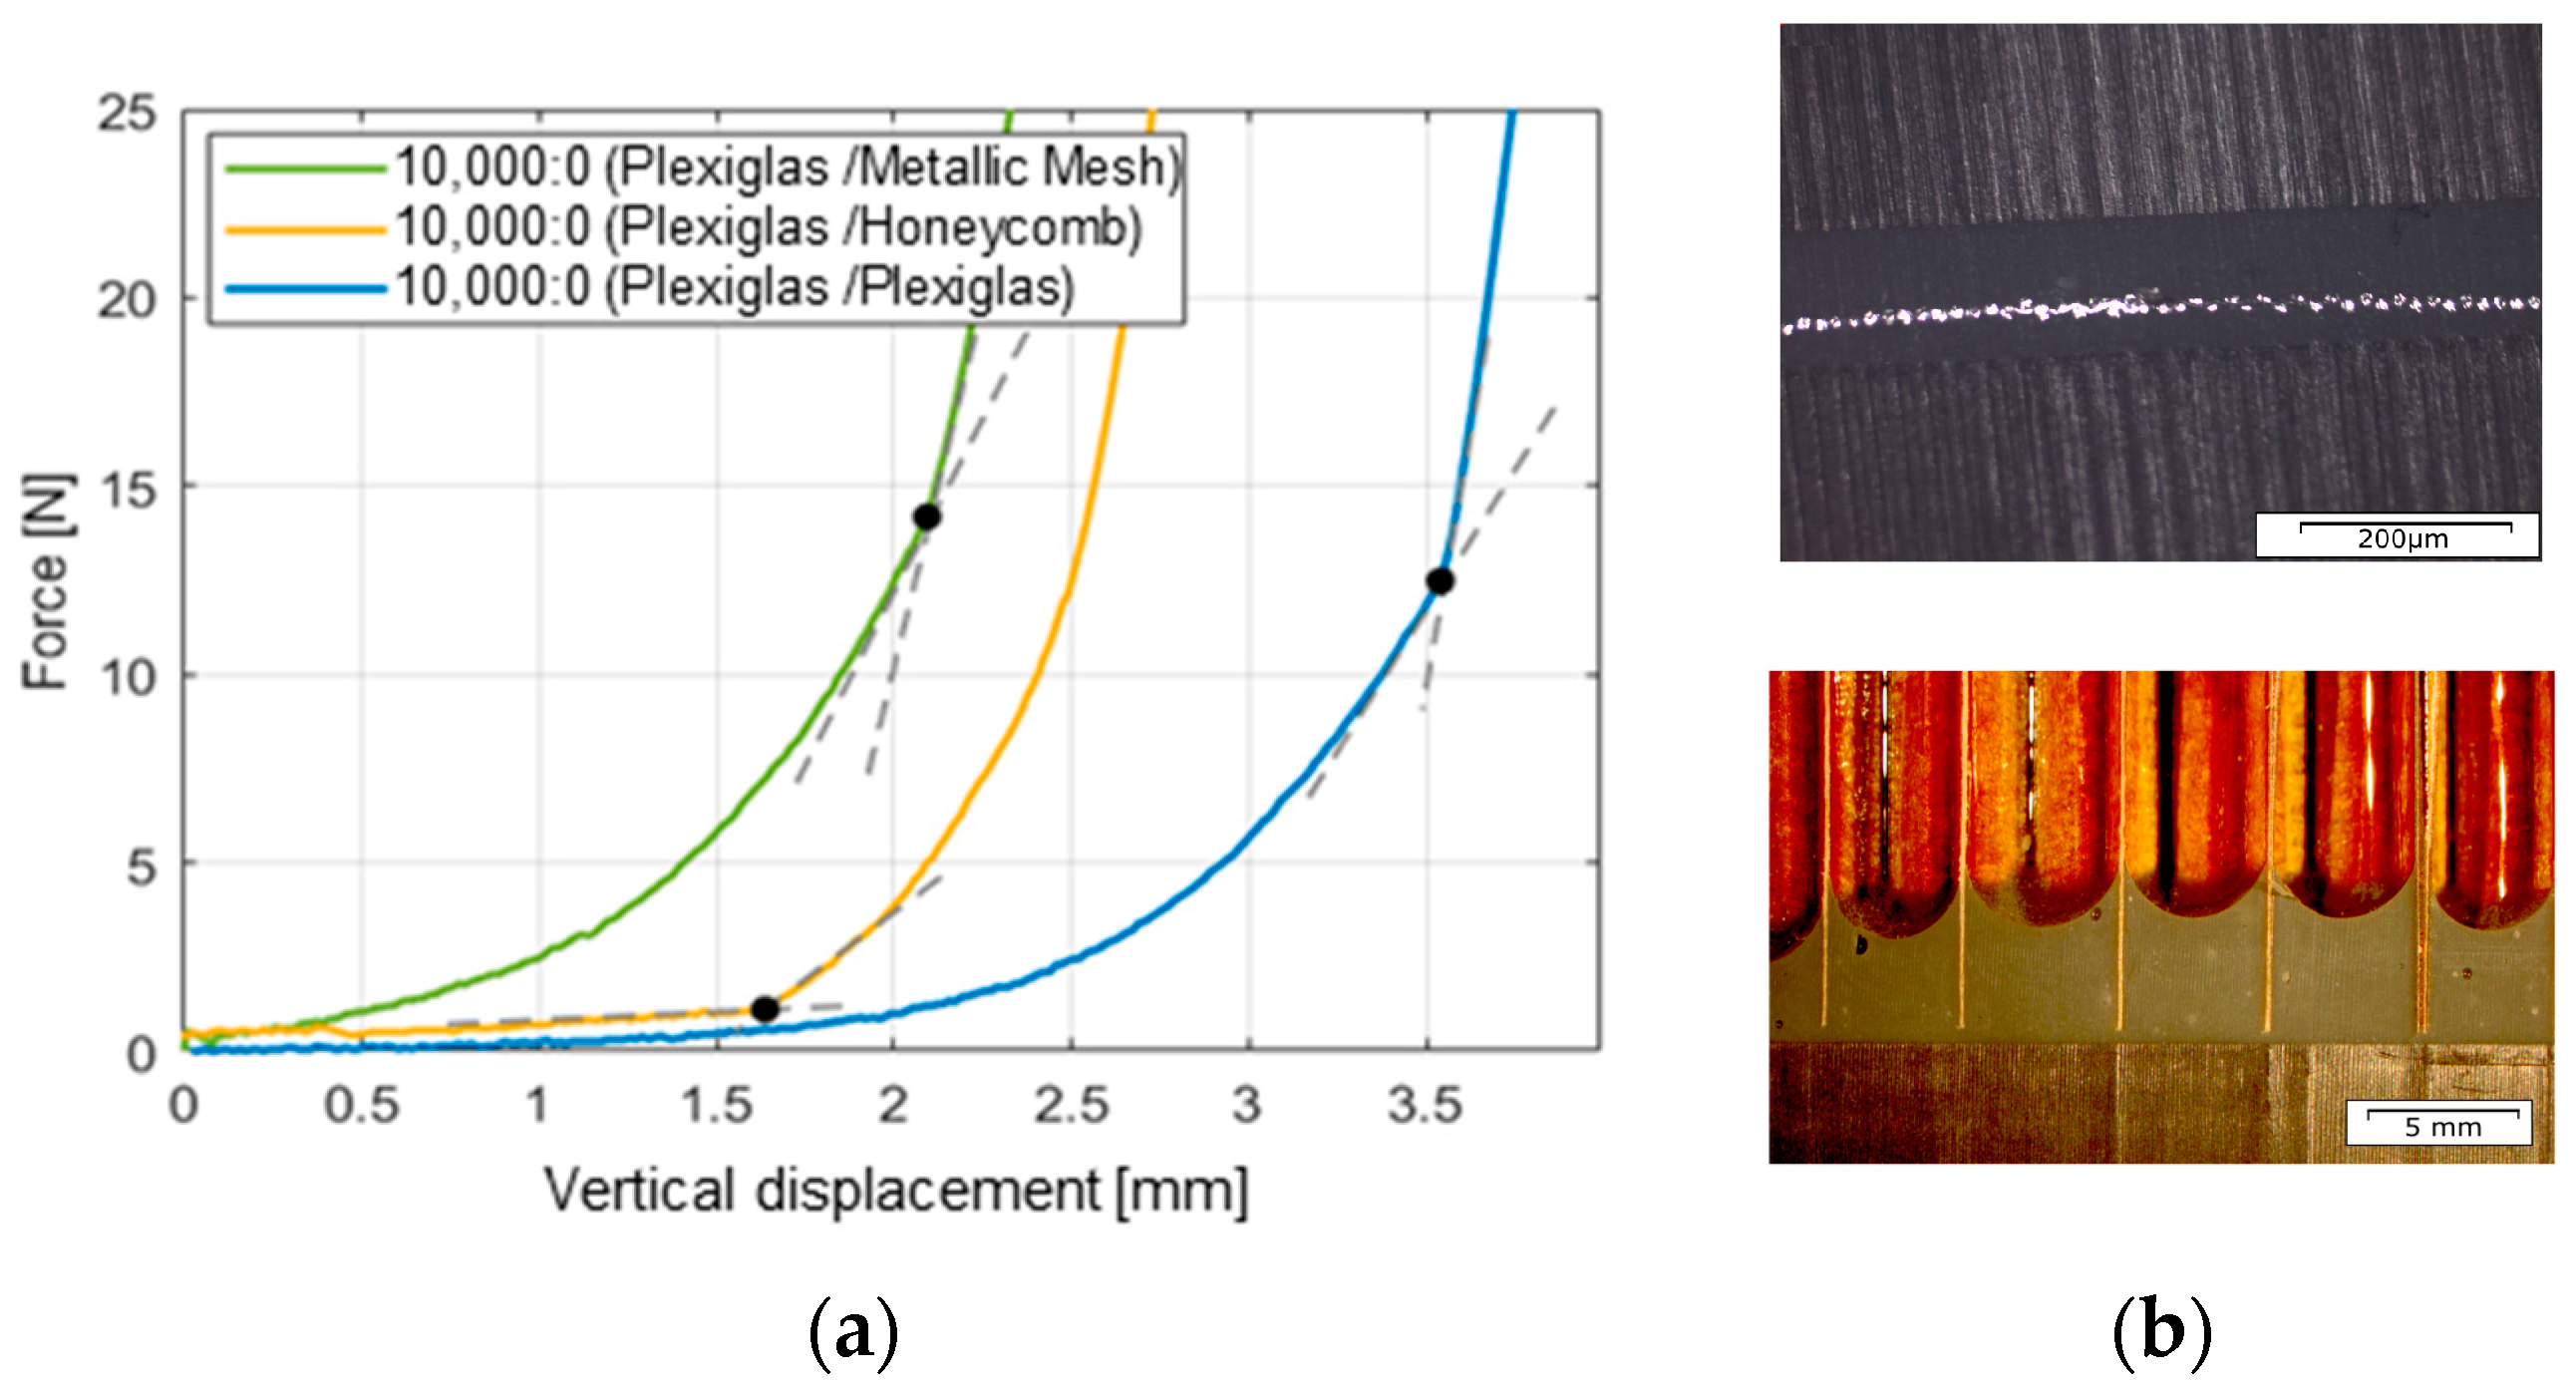
The resistance force plotted on ordinate axis of
Figure 6 is registered using a 10 kN force cell mounted on the mobile crossbar of the INSTRON 5969 device from Instron France S.A.S. Elancourt France, Élancourt, France (Red circle on
Figure 6 show the location of the cell force). Two 100 µm-thick aluminum shims are placed at the extremities of the bottom plexiglass plate to set the final thickness of the joint. When the upper plate touches the shims, the force suddenly increases and represents the aluminum compression resistance. The maximum force of adhesive joint setting is measured at the slope change on the force–displacement curve. The displacement is measured from the initial position of the upper plate above the adhesive joint just after the adhesive deposition to limit the adhesive flow due to gravity. The maximum displacement is different from one experiment to another, depending on the height of the adhesive when the upper plexiglass plate touches the adhesive, creating zero force. Since the volume is controlled to always be 5 mL, the height evolves differently depending on the ability of the adhesive to flow with gravity without adding any compression force. The maximum force and maximum displacement are determined by the abscissa and ordinate of the intersection point where there is a sudden slope change due to contact with the shims (big black dots on
Figure 6).
2.2. TEP-Enriched Samples for Load Bearing Capability
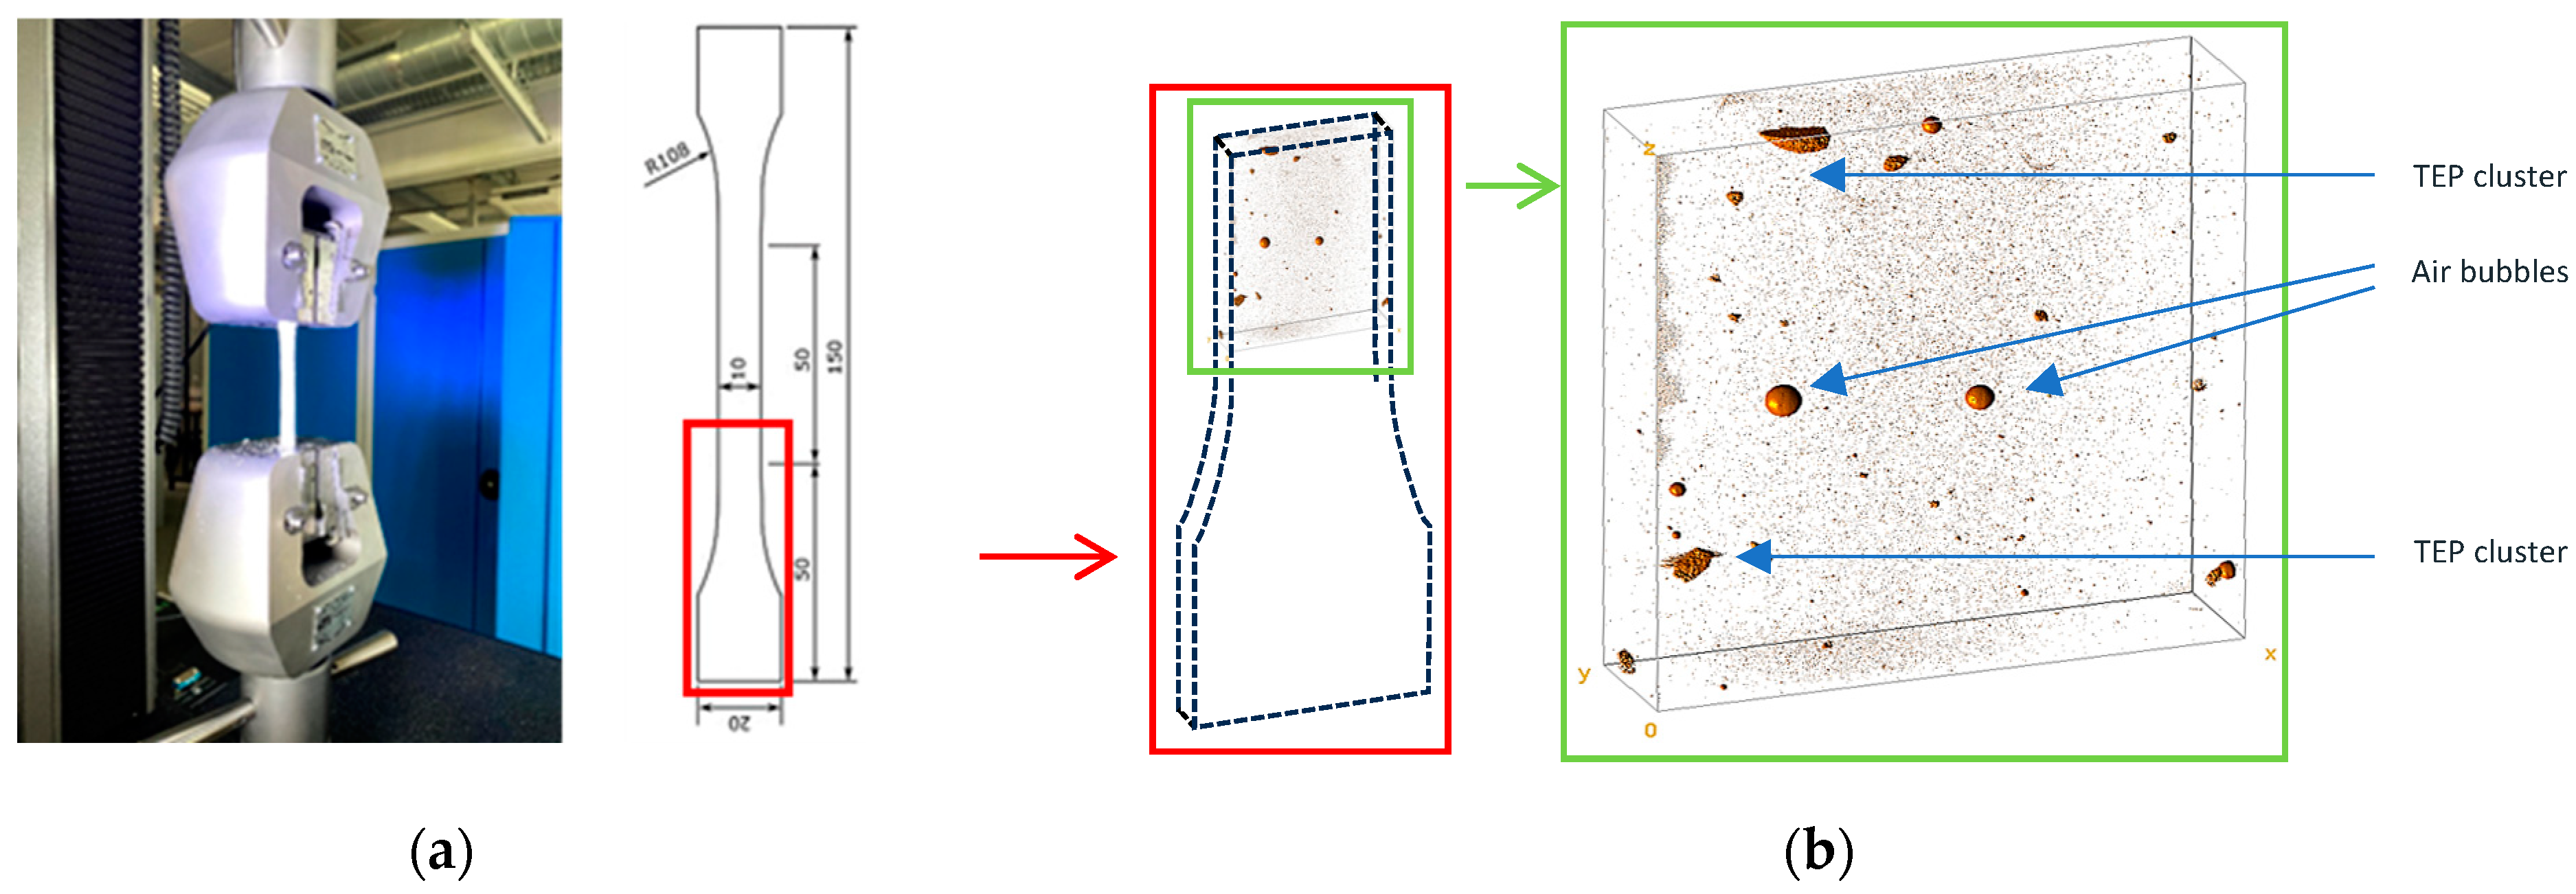
Series of 20 to 30 tensile test samples was fabricated with each of the ratios of 0%/0.15%/0.3% of TEPs to evaluate the influence of the presence of TEPs on the load-bearing capability. The tensile samples’ dimensions and experimental setup are described in
Figure 7. This high number of samples was chosen for sensitivity analysis. Indeed, it is well known that the EC2216 epoxy adhesive’s mechanical properties depend on ambient test conditions. Furthermore, the mixing procedure created a non-uniform distribution of TEPs in the volume, and even some air bubbles, as can be observed in
Figure 7b. Both are considered critical defaults capable of initiating the rupture and/or propagating it.
The ultimate tensile strength for each percentage of TEPs is reported as a function of axial strain in
Figure 8a, and the envelope helps with obtaining the probability density of the Weibull distribution, as shown in
Figure 8b.
In order to control the disassembly, the use of clusters of TEPs and a trigger system to initiate the crack, only if desired, is evaluated in the next paragraph.
2.3. Adhesive Joint Samples and Set-Up Preparation for Dissasembly on Demand Testing
To achieve the dual functions for the adhesive joint of load-bearing capability during life and controlled disassembly at the end of life, it is first necessary to evaluate the load-bearing capability of the joint in absence of TEPs or disassembly trigger or both. Three types of tests were performed: tensile opening mode I tests to characterize the joint behavior, tensile opening mode I tests to set and verify disassembly control and shear mode II tests to verify the possibility of using different adhesives with the TEPs and their trigger.
The trigger that was chosen was a metallic mesh so that it was not necessary to use the substrates to heat the TEPs, as can be found in the literature. In our work, substrates can then be metallic, composite, or honeycombs, etc. In these proof-of-concept tests, metallic substrates are used for tensile mode I openings, and both metallic and composite substrates are used for shear mode II ones. The metallic mesh of Gantois Industries Cie based in Saint-Dié-des-Vosges in France under reference n° 437.43 used to trigger the TEPs is made of woven inox 304 L wires of 0.025 mm diameter. The porosity is 37%, and the lateral size of the square aperture is 0.038 mm, allowing good impregnation of the adhesive even with TEPs, as described previously. This mesh was chosen in the Gantois catalogue because it has some characteristics we were seeking, among them being Joule heating capabilities, low thickness, and permeability leading to good impregnability. Analytical computations were performed to estimate the current that should be injected into the mesh to reach the ignition temperature in the TEP-charged liquid adhesive around the metallic mesh without destroying the adhesive surrounding the TEPs. Impregnation tests were conducted, and the samples’ moldings were designed to ensure the position of the metallic mesh in the middle of the adhesive’s joint thickness all over the joint surface. This allows for uniform heating from the center of the joint thickness to have a cohesive rupture and to avoid thermal damage to the substrates. It was not possible to measure the temperature reached inside the DCB or the SLJ samples. The temperature distribution is supposed to be uniform in the metallic mesh inside the joint because of precautions that have been taken in the deposition in the mold to ensure uniform and flat geometry.
2.3.1. DCB Mode I Samples and Test Set-Up
Tensile opening tests were conducted using the same INSTRON 5969 machine equipped with a 10 kN load cell as described earlier to pull apart classical double cantilever beam (DCB) specimens.
Sample dimensions are specified in
Figure 9a. These specimens are commonly used for testing crack propagation and were prepared with precise geometry to ensure consistency across all experiments. The joint interface between the two steel rigid substrates does not cover their full length to create a pre-crack of 50 mm and simulate carack initiation. The effective joint length for crack propagation is 140 mm. The specimen is composed of the joint and the two assembled substrates. The substrates are sanded and degreased, and finally an additional coat of primer is applied before the adhesive is set, to ensure a cohesive rupture of the joint. The same process was then carried out for all the tests to eliminate this factor of influence from the experimental plan. The final thickness of the joint is ensured through 2 mm-thick shims. Specimens were cured at 2 bars and 66 °C for 140 min, with an added step for raising the temperature from ambient to 66 °C for 25 min and a second step for another 25 min to come back from 66 °C to ambient, following the 3M™ Scotch-Weld™ Epoxy Adhesive EC-2216 B/A Technical Datasheet.
The fixture consists of two U-shaped supports, which are rigidly attached to the lower fixed part and the movable crosshead of the machine. The specimens are connected to the supports via pins that pass through their width. The fixture is mounted on the machine frame using cylindrical grips. The testing system is hyperstatic, requiring loosening of one of the grips to install the specimen. To ensure proper alignment of at least one part, the upper section of the fixture remains permanently mounted on the machine. The specimen is installed first on the upper pin and then on the lower one. To prevent rotation around the pins, small screws (labeled A and B) pass through the thickness of the specimens and are screwed into the support pins.
Figure 9b provides a lateral view of the experimental setup, where A and B indicate the positions of the screws responsible for securing the specimen to each pin. These screws are tightened onto the flat surfaces of the pins.
To verify that the velocity of charge does not significantly affect the results and gives as few variabilities as possible, 5 velocities were used to test the mobile crossarm: 0.01 mm/min, 0.1 mm/min, 1 mm/min, 10 mm/min, and 100 mm/min. Because of those rates, the test duration varied between 0.04 min and 400 min to reach the desired maximum displacement. The influence of the velocity was evaluated only for the adhesive in absence of TEPs and trigger. No change in the fracture surface pattern nor in the slope of the force–displacement curve was observed. For that reason, the maximal velocity of 10 mm/min was kept for the rest of the tests. The tests were performed at an observed ambient room temperature of 24 °C ± 0.2.
2.3.2. DCB Mode I Samples for Dissassembly Tests
The proposed controlled disassembly method is based on two principles: the presence of TEPs and the addition of a conductive element used as a trigger through Joule effect. In our case, the trigger is a stainless-steel wire mesh, which was described earlier. This concept is the subject of a patent registered under the reference WO2023222900.
The adhesive was tested in various configurations: with the adhesive alone, with a high mass percentage of TEPs, with TEPs sprinkled on the metal fabric, and with metal fabric alone. Situations of TEPs and TEP cluster distribution are illustrated in
Figure 10. The different TEP cluster distributions were obtained through uniform mixing for the “distributed” situation or no mixing for the “localized” one.
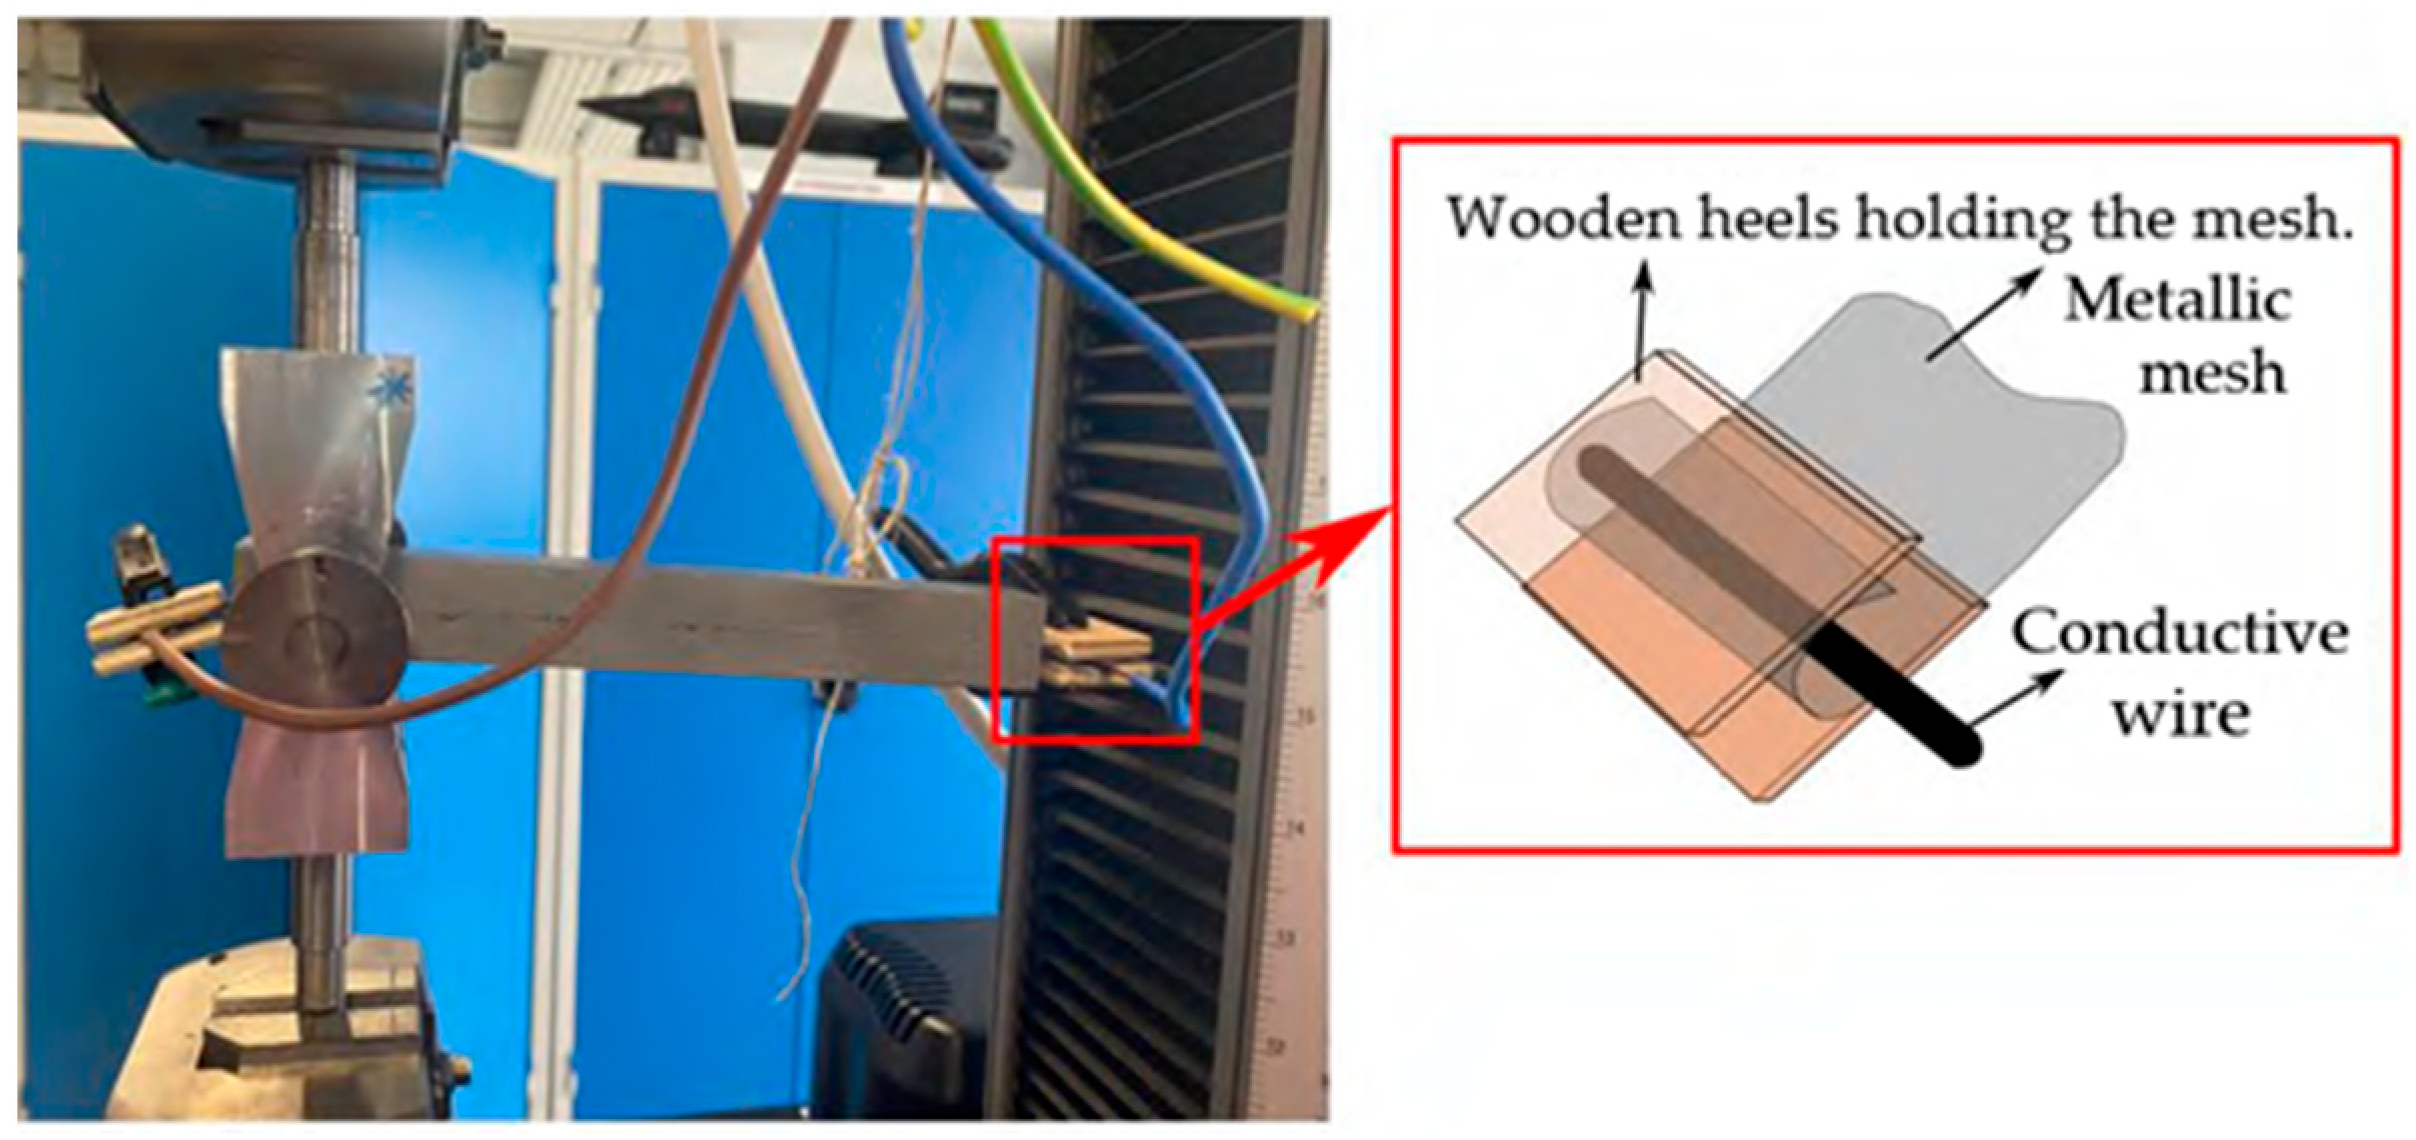
Samples are fabricated following the protocol described in the previous paragraph. When used, the metallic trigger is placed over the adhesive before closing the specimen with the second substrate covering it. The metallic mesh is connected at each extremity to a current generator. The full system is illustrated in
Figure 11.
The tests begin by applying a tension at 10 mm/min until reaching a tensile load of 500 N, which is far below the strength of the DCB specimens containing neither TEPs nor trigger. Then, electrical current is injected into the metallic mesh using conductive wires that are wrapped around it, and the time to rupture is measured using a stopwatch. The maximum force and displacements at rupture are also registered.
2.3.3. SLJ Mode II Samples Preparation
The SLJ-type specimens were used for the application and demonstration of the disassembly protocol controlled by the Joule effect for three different adhesives: 3M™ EC2216 Scotch-Weld™ Epoxy Adhesive, Saint Paul, MN, USA (liquid two-component same as previously described), Redux® 609 (film from Hexcel Composites SASU, Blagnac, France), and FM300 (film from Syensqo, Pessac, France). The main difference in the protocol is the application method of the adhesive. For EC2216, the paste adhesive was applied to the substrates using a spatula, as in all previous tests. For the others, patches of adhesive, cut to the size of the bonded area, were applied to the substrates. To be able to use the TEPs and the trigger, three strategies of TEP distribution were tested: no TEPs, TEPs distributed in the whole adhesive (EC2216 liquid only), and TEPs localized in a thin layer of adhesive around the trigger. This last configuration is called “localized”. Wood or silicone shims were fabricated to ensure the desired thicknesses and were placed so that it was possible to assemble all the layers and consider the thickness of the metallic mesh. After assembly, samples were placed in vacuum bags and cured in an oven to polymerize the adhesives. As for DCB samples, the EC2216 followed a cycle of polymerization at 66 °C for 140 min, while the cycle was at 120 °C for 60 min for the Redux®609 and 175 °C for 60 min for the FM®300.
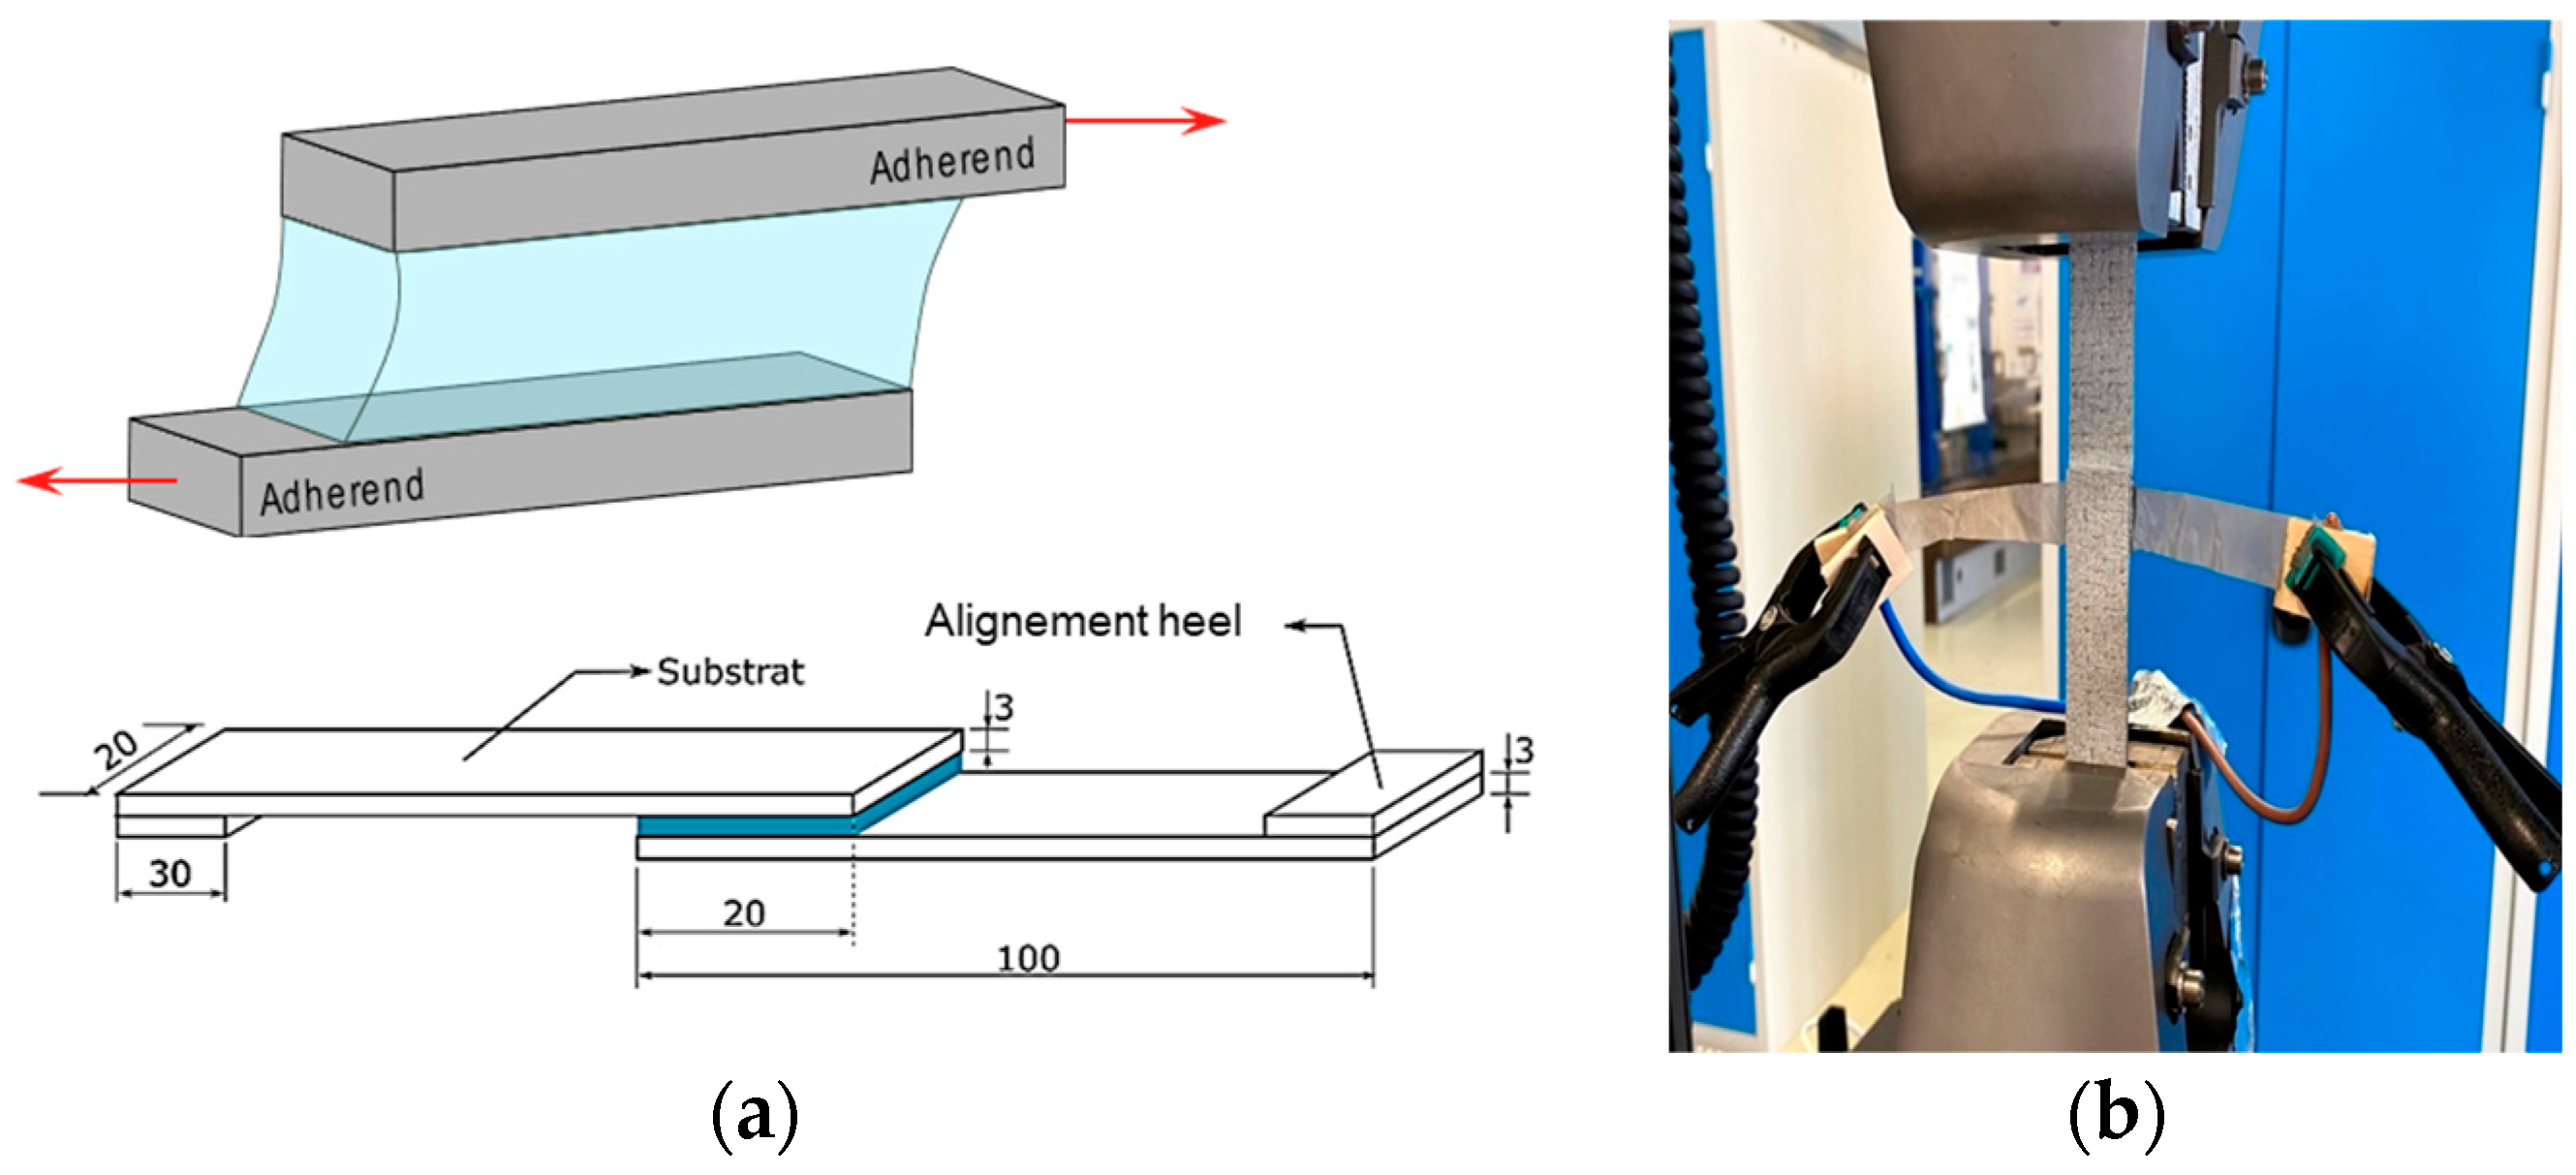
As for the DCB configurations, tests with no TEPs and no metallic mesh were performed to determine the ultimate strength of the “bare” specimens. The geometry of the specimens used can be seen in
Figure 12a, and the experimental setup is shown in
Figure 12b. The two substrates, as well as the two alignment blocks, were made from carbon fiber composite and epoxy resin, using woven composite plates available in the laboratory from other applications, with their stacking configuration confidential.
To demonstrate the disassembly control of shear samples, a constant force of 500 N was first applied, and the time until failure was measured after beginning injection of the 6A current, following the same procedure as for the DCB disassembly tests.


