Abstract
Clean Sky 2 (CS2) was established to reduce the environmental impact of air transport by the introduction of new advanced aeronautical technologies, to improve mobility and to demonstrate reduction potentials for CO2, NOx, and noise emissions of from 20% to 30% as compared to state-of-the-art aircraft in 2014. A wide range of new technologies has been integrated into vehicle performance models for a set of concept aircraft, and the Clean Sky 2 Technology Evaluator (TE) has performed assessments with three major pillars: Vehicle- or mission-level reference aircraft, reflecting 2014 technologies, are compared with new Clean Sky 2 concept aircraft with a focus on CO2 and NOx emission and noise reduction potentials. At the airport level, environmental impact assessments for different traffic and fleet mixes are carried out, namely, noise on the ground and population impacted by certain noise levels and emissions (CO2 and NOx). At the level of the global air transport system (ATS), those new concept aircraft are embedded in fleet projections until 2050 and compared to a projection without new Clean Sky 2 aircraft to understand the emission reduction potentials of future global fleets and the long-term aviation footprint. This paper gives a conceptual overview of the work carried out in Clean Sky 2.
1. Introduction
The Clean Sky program is the largest European aeronautics research initiative of its kind. Its objective is to develop innovative technology to reduce CO2, as well as other gas emissions and noise levels produced by aircraft. It is funded through the European Union’s (EU) Horizon 2020 program. Clean Sky provides a strong contribution to the strengthening of the European aero-industry collaboration and competitiveness through the delivery of innovative solutions for the aviation sector.
The Clean Sky 2 Joint Undertaking was established by Council Regulation (EU) No 558/2014 of 6 May 2014 to develop cleaner air transport technologies for the earliest possible deployment with a particular focus on the integration, demonstration and validation of technologies in order to achieve the following:
- Increase aircraft fuel efficiency, thus reducing CO2 emissions by from 20% to 30% compared to “state-of-the-art” aircraft entering service from 2014.
- Reduce aircraft NOx and noise emissions by from 20 to 30% compared to “state-of-the-art” aircraft entering service from 2014 [1].
From the very beginning, it was recognized that successfully monitoring progress towards the European environmental goals within aeronautics set by the Advisory Council for Aeronautics Research in Europe and its strategic research agendas as well as by the Clean Sky program itself would require a transversal evaluation platform in the Clean Sky Program.
The Technology Evaluator was born from this need, and its composition reflects the need to bring know-how and simulation/modeling capabilities that exist among industry, research establishments and academia together. This paper describes the general framework of the Technology Evaluator to perform the environmental assessments in the Clean Sky 2 program in terms of evaluation levels and metrics used. Some results are presented to further illustrate the framework in more detail. For more details on the results of the Technology Evaluator, the reader is referred to the full report of the Clean Sky 2 Technology Evaluator [1,2] or, for the results of the Air Transport Level (ATS), to [3].
Apart from Clean Sky 2, there are further important initiatives aiming for sustainable and greener aviation until 2050:
- The five aviation normative scenarios from ATAG, which were part of the “Waypoint 2050” study, represent global outlooks of emission reductions in aviation under different assumptions [4].
- The global “Net Zero Carbon 2050 Resolution” from IATA is also a normative scenario study, which includes market-based measures for emissions reduction [5].
- The “Long-term Global Aspirational Goal (LTAG)” for international aviation of net-zero carbon emissions by 2050, set by ICAO, which, however, does not attribute specific obligations or commitments in the form of emissions reduction goals to individual states [6].
- The “ACARE Vision” for net-zero CO2 emissions for all intra-EU flights and those departing the EU [7].
- “Flightpath 2050” is a vision for a leading European aviation industry that is clean, competitive, sustainable, safe and secure [8].
Also, the EASA “European Aviation Environmental Report” series is an important initiative, which started in 2016 and was then updated in publications in the years 2019 and 2020 and from 2022 to 2025 [9]. It covers all aspects of cleaner aviation, including technology, air traffic management, operations, sustainable alternative fuels and market-based measures.
2. Methods: Structure and Methodology of the Technology Evaluator Within the Clean Sky 2 Program
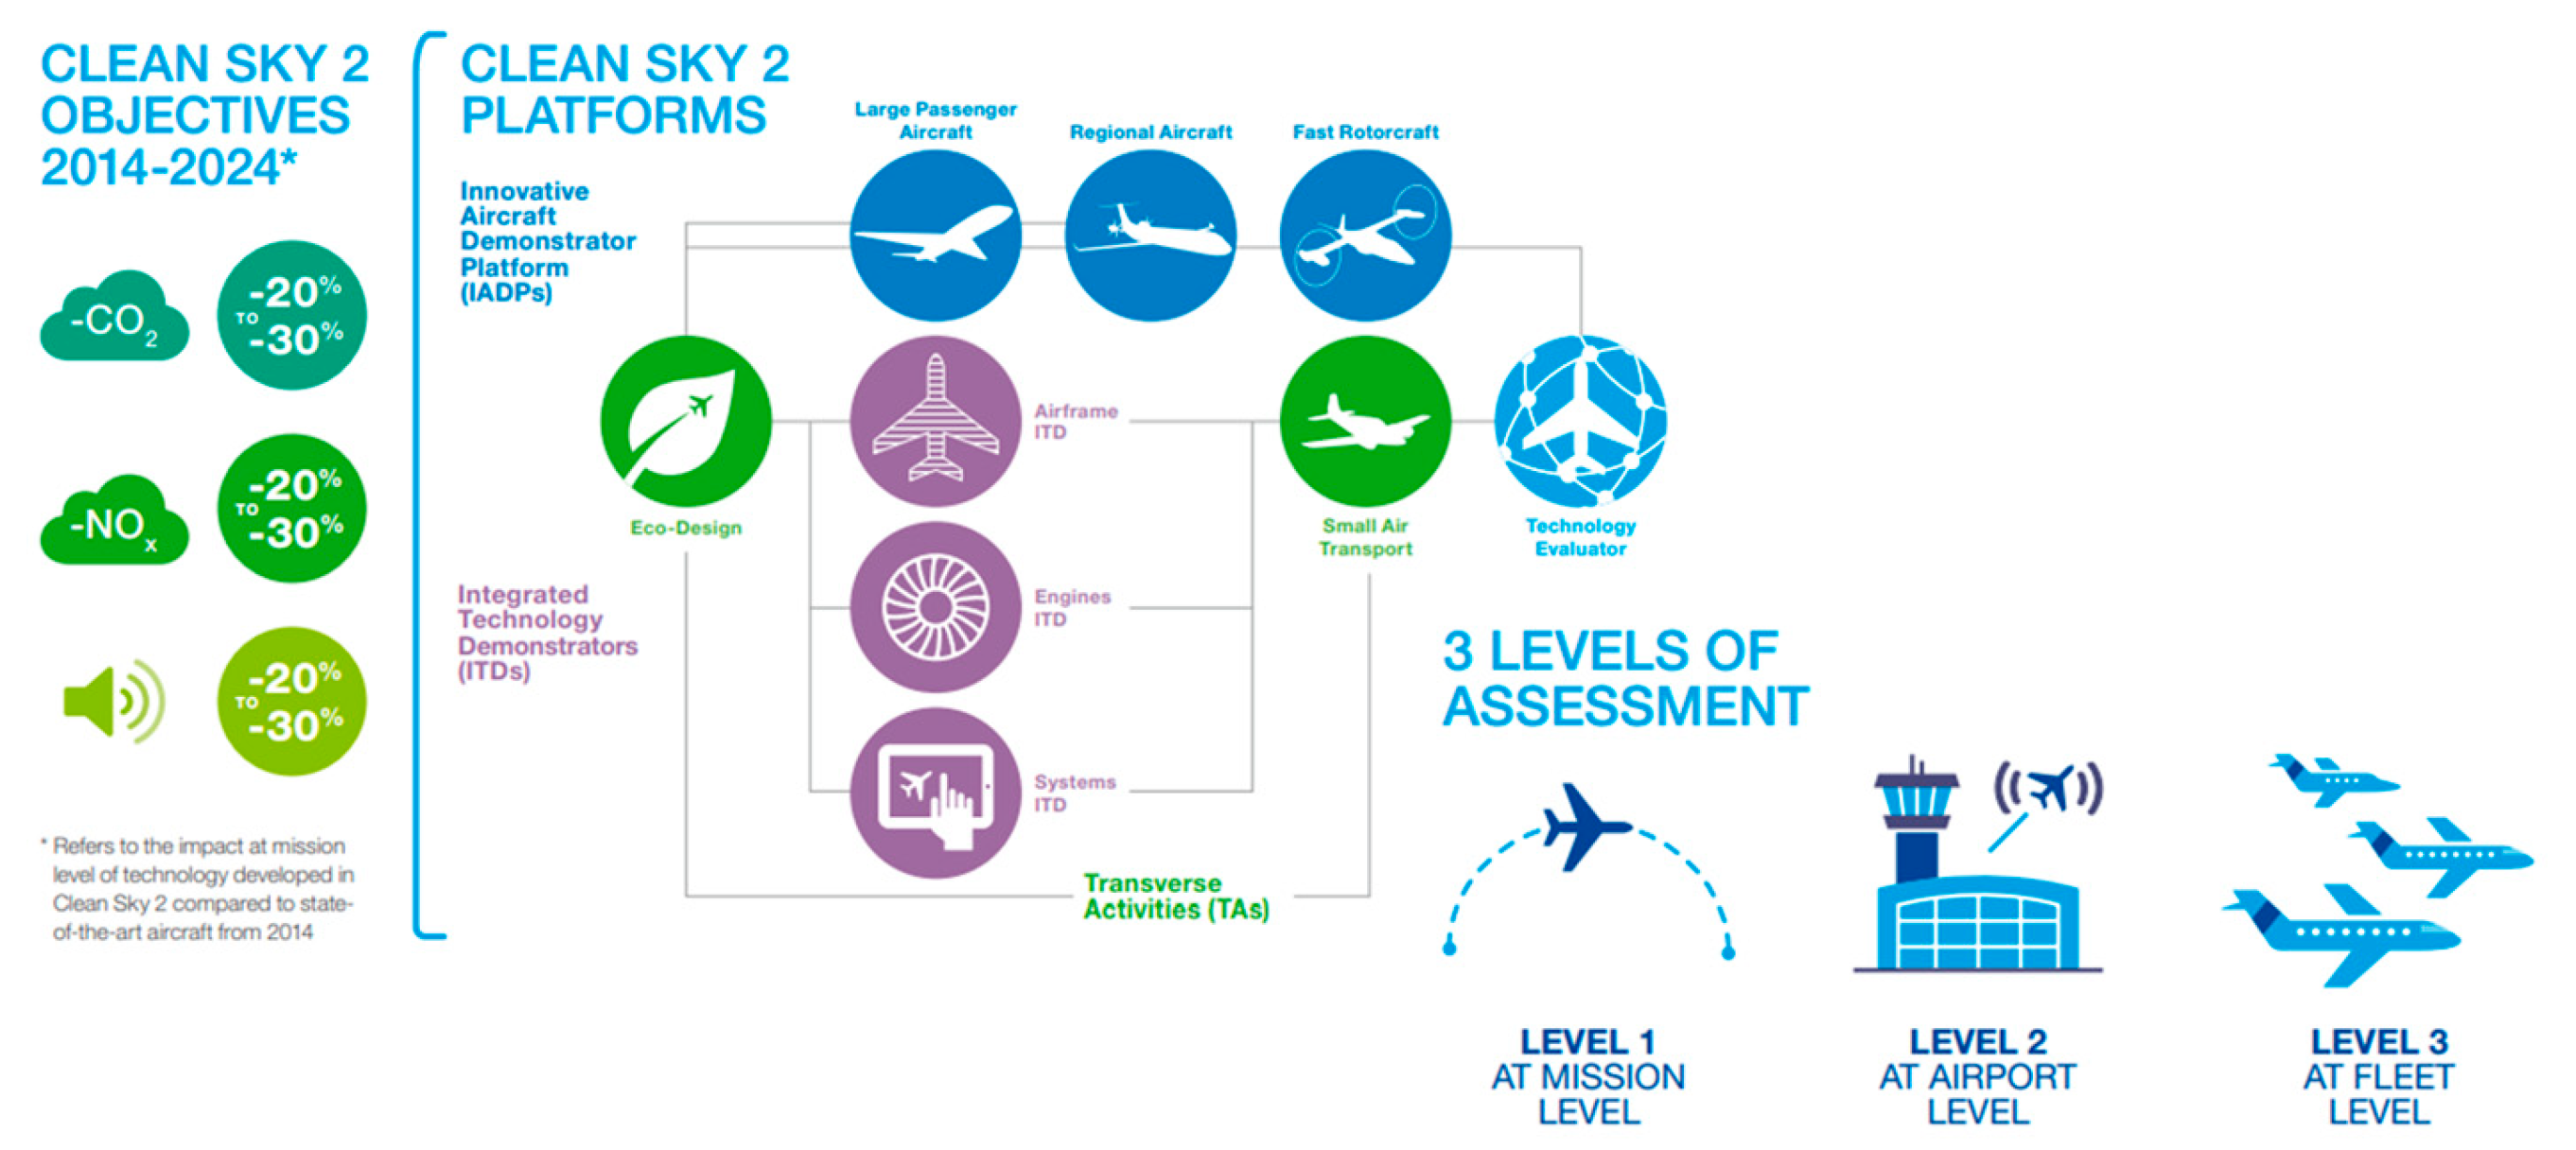
Figure 1 shows the general structure of the targets and the scope of activities of the Clean Sky 2 program including the tasks of the Technology Evaluator as a so-called “transversal activity”. The left side of the figure shows the environmental objectives of Clean Sky 2. These objectives refer to the mission-level impact of new technologies developed in an integrated concept aircraft compared to its reference state-of-the-art 2014 technology counterpart. For CO2 and NOx emissions, the reduction objective was set within a band of from 20% to 30%. The same holds for noise emissions.
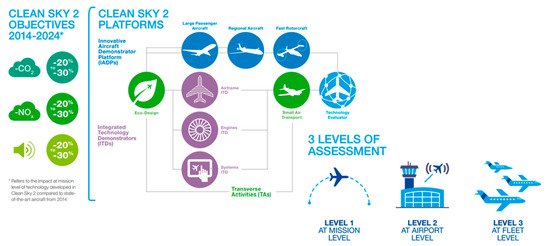
Figure 1.
Scope and targets of the Clean Sky 2 program and activities of the Technology Evaluator.
The structure of the Clean Sky 2 program is illustrated in the middle of Figure 1. The Clean Sky 2 program consists of so-called “Innovative Aircraft Demonstrator Platforms (IADP)”, “Integrated Technology Demonstrators (ITD)” and “Transverse Activities (TA)”. The Technology Evaluator is one of the Transverse Activities, i.e., it acts as an integrator for the inputs coming from the IADPs and ITDs in the form of integrated concept aircraft models to be applied for fleet scenario assessments at the airport and air transport system level.
The IADPs encompass three large platforms:
- Large passenger aircraft: within this platform, an advanced short–medium-range (SMR) aircraft shows the potential of ultra-high bypass ratio engines (UHBRs), complemented by an ultra-advanced SMR dealing mainly with open fan engines and additionally an advanced long-range aircraft covering the potential of ultra-fan engines.
- Regional aircraft: this platform covers a 70-seat multi-mission turboprop aircraft and a 90-seat and 130-seat turboprop passenger aircraft.
- Fast Rotorcraft: this platform includes two fast rotorcraft configurations, the Next Generation Civil Tilt Rotor (NGCTR) and a compound configuration (Rapid and Cost-Effective Rotorcraft, RACER).
The three Integrated Technology Demonstrators (ITDs) represent developments of technologies from small to large component levels for airframe, engine and aircraft systems that are fed into the large IADP platforms. The transversal activity (TA) Eco-Design covers the life cycle aspects of aircraft production and materials, and the Small Air Transport (SAT) TA covers the development of up to 19-seat aircraft with hybrid propulsion. Finally, the TA Technology Evaluator (TE) has the role of performing overall assessments at three evaluation levels, i.e., the mission, airport and air transport system (ATS) levels (see the right part of Figure 1).
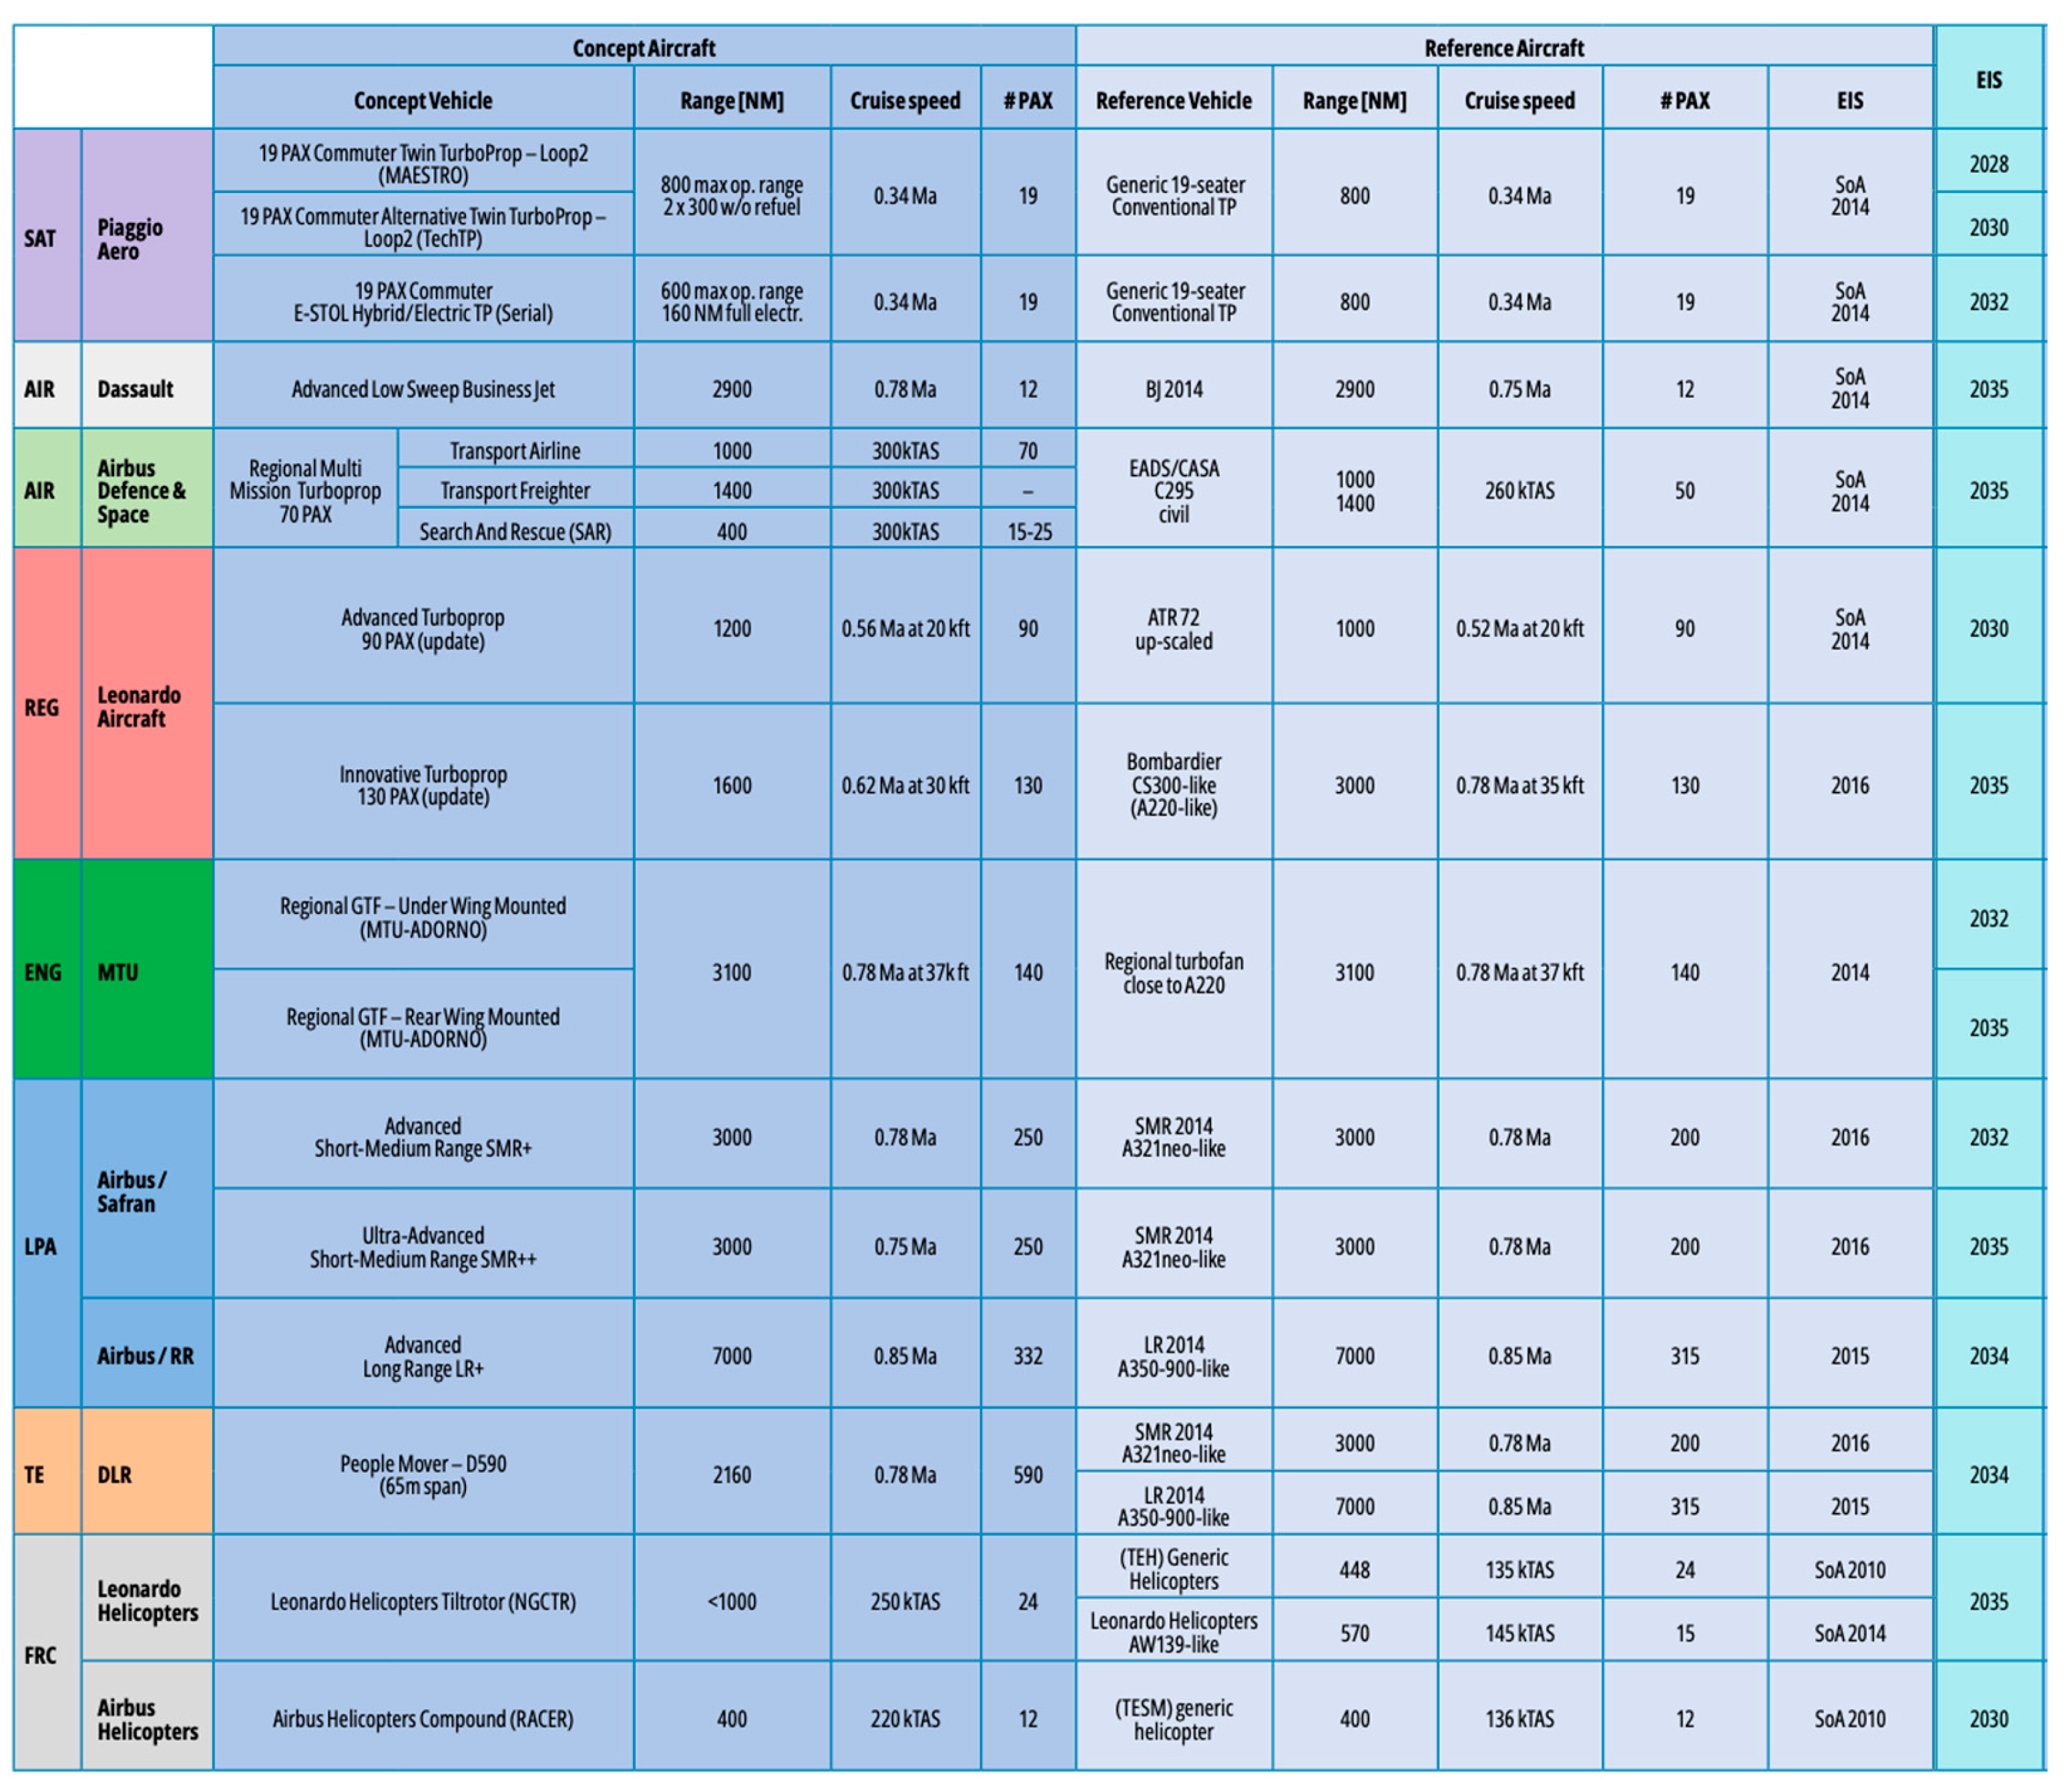
The mission-level assessments themselves are performed by the IADPs and ITDs and are assembled through the TE in the overall assessment report [1,2]. At the mission level, the concept aircraft developed within the IADP/ITD platforms, i.e., integrating all advanced technologies at aircraft system, airframe and engine level, are compared on relevant and representative missions with their 2014 state-of-the-art counterparts in order to determine the environmental reduction potentials for emissions (CO2 and NOx) and noise on the ground and to evaluate the level of success versus the Clean Sky 2 objectives. A list of all concept aircraft at the mission level can be found in Figure 2 [1,2].
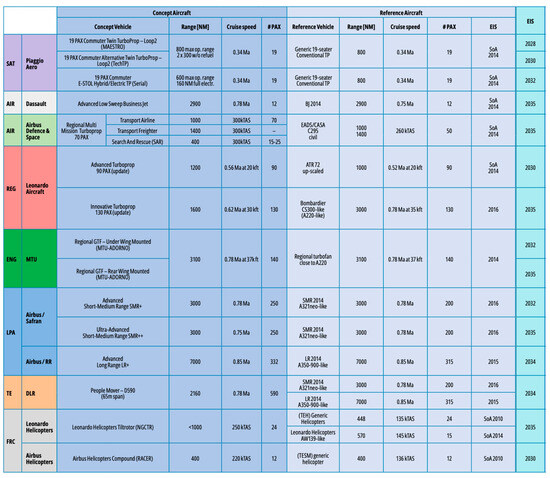
Figure 2.
Overview of Clean Sky 2 concept aircraft and reference aircraft (#: number; dark blue: concept aircraft; light blue: corresponding reference aircraft; green: EIS of concept aircraft) [1,2].
This figure shows that Clean Sky 2 covers the whole range of aircraft vehicles, starting from the small commuter and business aircraft, from the regional, short–medium-range and long-range aircraft up to fast rotorcrafts. An additional aircraft shown in the table is the TE People Mover.
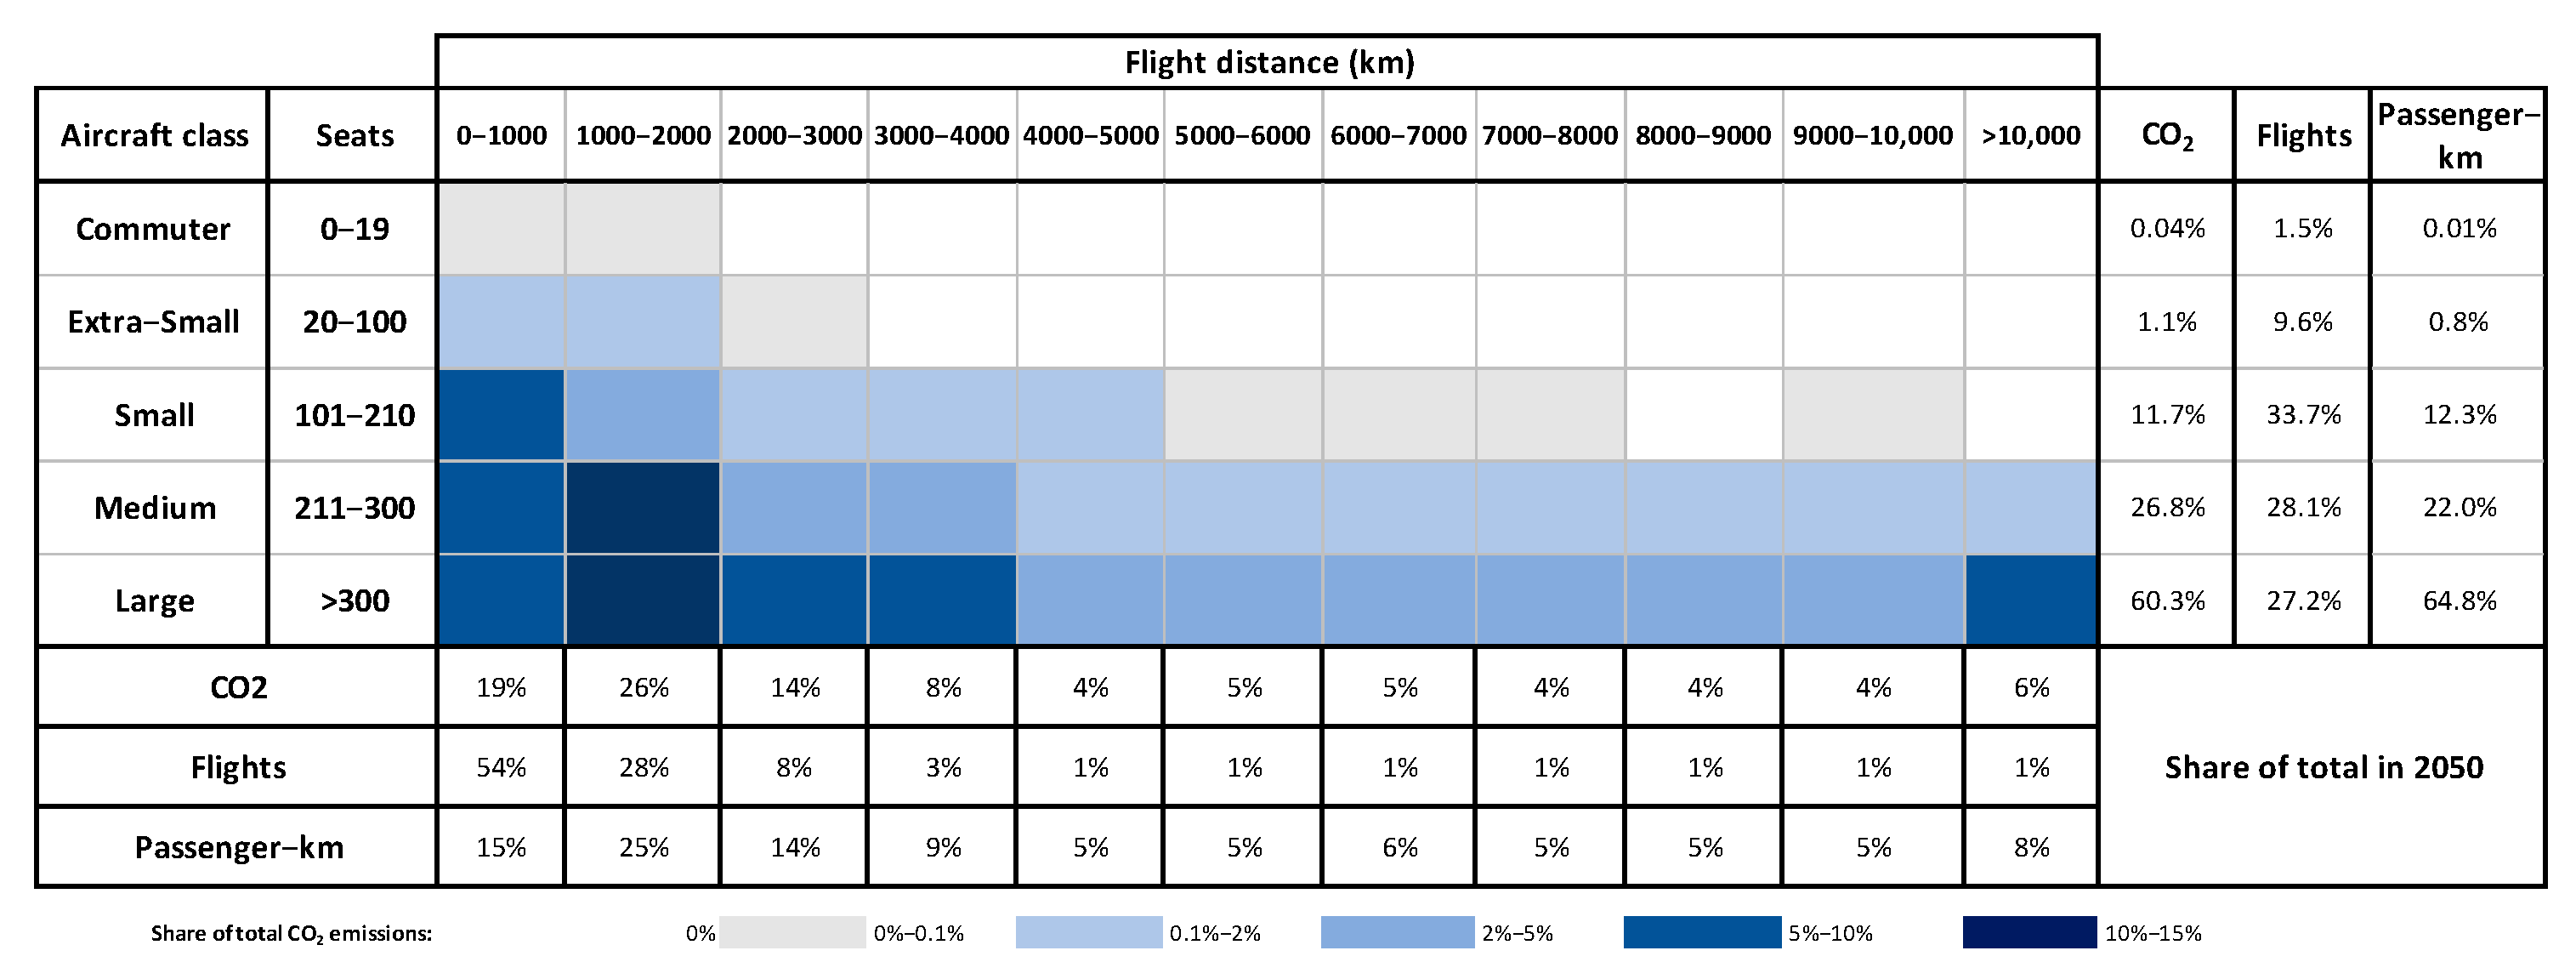
This concept aircraft was specifically developed within the TE as previous analysis of results in the first overall assessment at the ATS level in 2021 showed that, in 2050, more than 55% of CO2 emissions will come from medium and large aircraft on short to medium range flights (<4000 km) (see Figure 3), providing a substantial emission reduction potential for a large aircraft designed for short- to medium-range missions. Further details and results for the mission level can be found in [1,2].

Figure 3.
Distribution of CO2 emissions in relation to aircraft size and flight distance in 2050 as a market opportunity for the People Mover (aircraft class: large, flight distance: 0–4000 km) [10,11].
At the mission level, the main technologies to reduce CO2 and NOx emissions focus on the significant improvement of the engine performance. Additionally, large contributions to emission reductions are the result of several aerodynamics technologies (laminarity, riblets, wing and tail designs, innovative movables and flaperons), airframe technologies (metallic/composite trade-offs) and systems technologies [1,2].
The concept and reference aircraft models were typically delivered by the industrial partners in the project. DLR provided the model for the so-called People Mover, a widebody aircraft inspired by an Airbus A350, which was designed for short- to medium-haul missions up to 4000 km in range [12]. The aircraft models include all the following modules:
- An aircraft performance module that calculates the trajectory of a given mission for the aircraft.
- An emissions module that calculates the Emissions (CO2 and NOx) along the trajectory of a given mission for the aircraft.
- A noise module that calculates the noise on the ground through noise hemispheres at the take-off and landing phases of the aircraft.
The focus at the mission level was the technological improvement of aircraft in all relevant fleet segments (from commuter to long-range). Future areas of improvement to be considered will be trajectory optimization for the departure, cruise and arrival segments of the flight.
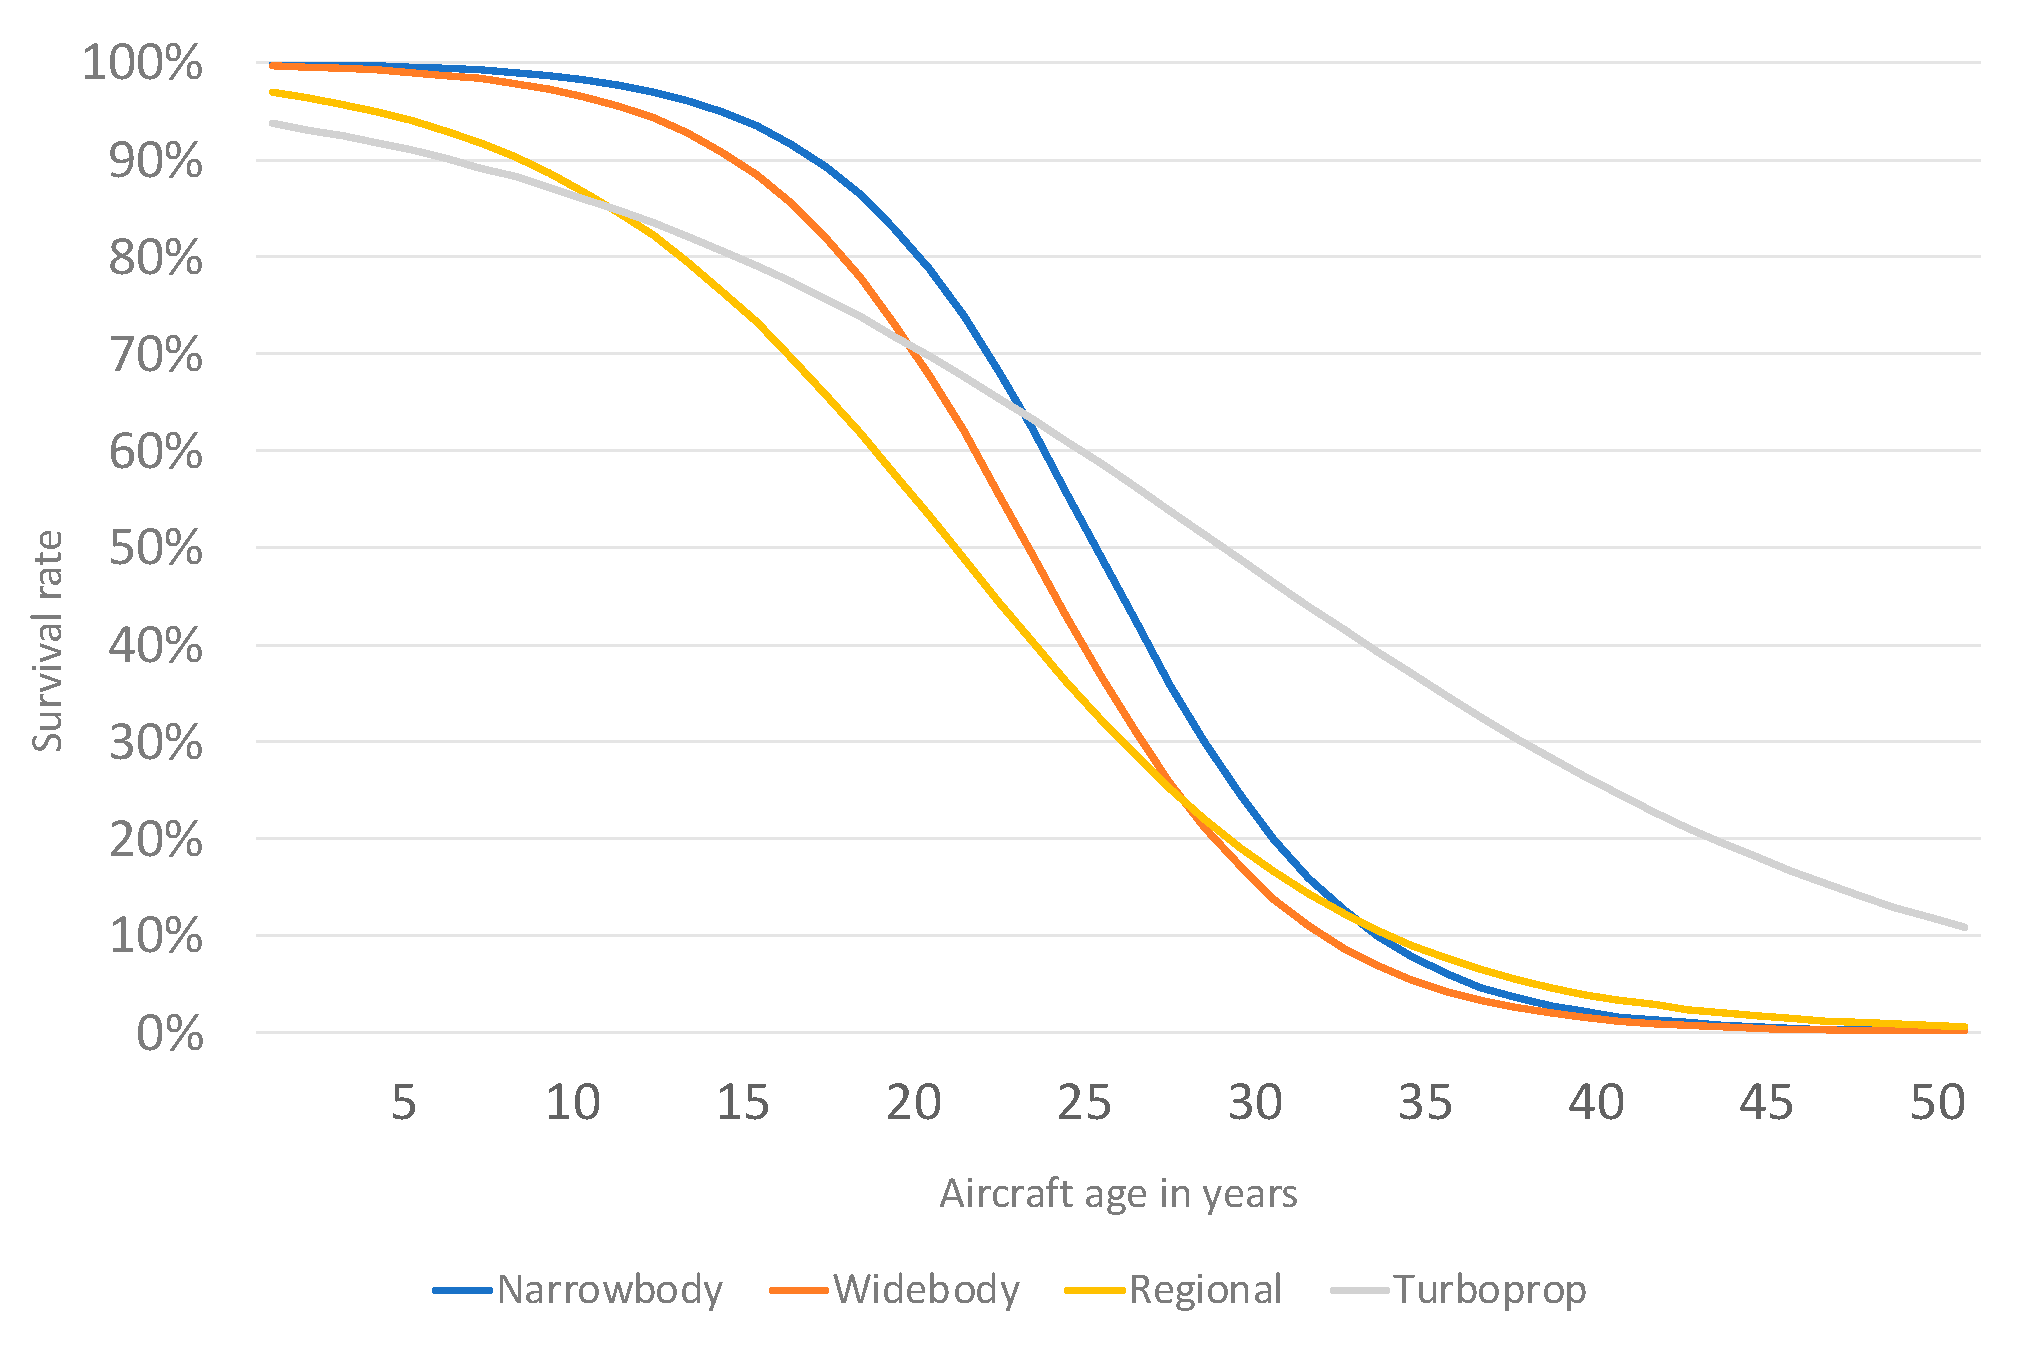
On the airport level, an airport fleet for the years from 2035 to 2050 with the Clean Sky 2 concept aircraft at representative airports in Europe for a typical traffic day is compared with their counterpart fleets consisting of the 2014 reference technology aircraft. The forecast fleet for the different airports is based on the DLR forecast model [3,13,14] and, specifically, the aircraft retirement modeling, providing a realistic situation of retirement of the old aircraft and replacement with the new Clean Sky 2 concept aircraft for future fleets [3,10] (see Figure 4).
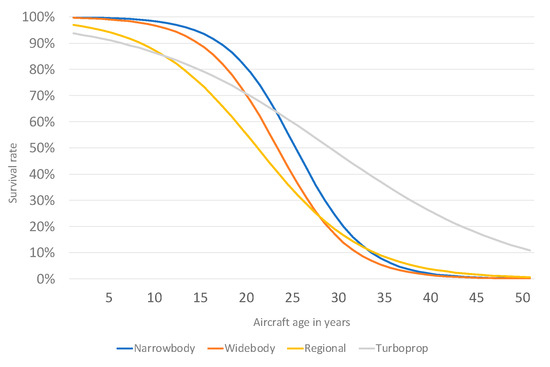
Figure 4.
Survival probabilities of aircraft in relation to aircraft category and age [3].
Airport assessments are carried out for the following airports: Amsterdam Airport Schiphol, Rome (Leonardo da Vinci) Fiumicino Airport, Stockholm Arlanda Airport, Hamburg Airport and Toulouse Blagnac Airport, as well as for the generic airport CAEPport. The environmental impacts of noise and emissions are evaluated. Further details and results for the airport level can be found in [1,2].
The airport models use fast-time airport and airspace simulation and perform the following modeling steps:
- Airport simulation: This comprises specific data on airport and airspace layout (infrastructure and the various airspace control areas) for each airport; airport and airspace operations, e.g., flight procedures and rules, including the way aircraft are handled at the ground and in the air by the airport and air-traffic control. It also takes into account the maximum number of aircraft movements that an airport can handle as opposed to an unconstrained forecast.
- Noise calculation: Based on aircraft performance characteristics from the mission level aircraft models and specific airport traffic scenarios coming from the ATS level, Lden and Lnight noise contours and noise expressed in terms of the SEL (Sound Exposure Level) are calculated.
- Emission calculation: Based on aircraft performance characteristics from the mission level aircraft models and specific airport traffic scenarios coming from the ATS level, the amount of CO2 and NOX in kg emitted during a flight below 3000 ft by aircraft is calculated.
Airport noise assessments are based on the European Environmental Noise Directive 2002/49/EC, which is the EU legislative instrument for the assessment and management of environmental noise at and around airports. The metrics used are as follows:
- Lden: Cumulative noise level (in dB(A)) over an entire year for multiple events, with a penalty for aircraft operations during evening- and night-time
- Lnight: Cumulative noise level (in dB(A)) over an entire year for aircraft operations during night-time.
Airport emission assessments are based on the ICAO document Doc 9889, “Airport Air Quality Manual”, which provides advice and practical information to assess (amongst others) CO2 and NOx emissions at and around airports. The metric used is “total amount emitted up to 3000 ft”.
The specific airport and airspace operations, which relate to flight procedures and rules, are applied for all airports assessed. This includes also the airport-specific “Standard Instrument Departures” (SIDs) and “Standard Terminal Arrival Routes” (STARs). Uncertainties arise because, especially for future airport traffic scenarios, historical deviations from the SIDs and STARs procedures are not considered.
At the airport level, two kinds of studies have been carried out. The so-called “Microscopic level” addresses environmental-impact assessments through aircraft traffic at the detailed level of individual aircraft movements and flight procedures for a representative set of European airports, i.e., Amsterdam Airport Schiphol, Rome (Leonardo da Vinci) Fiumicino Airport, Stockholm Arlanda Airport, Hamburg Airport and Toulouse Blagnac Airport. At the so-called “Macroscopic level”, environmental impacts for all major European airports (about 60 airports covered in EUROCONTROL’s tool IMPACT [15]) are assessed at a higher aggregation by addressing aircraft traffic in terms of groups of similar aircraft movements.
The more detailed “microscopic” approach could be extended in the future to more airports than those covered in the TE. It must be noted that the microscopic analysis needs substantially more effort than the “macroscopic” one.
At the ATS level, future fleets for the years up to 2050 containing Clean Sky 2 concept aircraft are compared with their counterpart fleets, including their corresponding reference 2014 technology aircraft. The environmental impact in terms of CO2 and NOx emissions is evaluated, taking for each assessment the results of a whole year. The output can then be assessed in terms of the distribution of seat classes versus range classes for a given year, e.g., 2050 (see Figure 3 for an example).
The emissions output for a given future fleet is based on the DLR passenger and fleet forecast model (see Figure 4). Further results and details for the ATS level can be found in [1,2,3]. In the ATS assessments, several different fleet scenarios and passenger demand forecasts have been defined:
- A “Constrained Scenario”, which considers future capacity constraints at the airports globally.
- An “Unconstrained Scenario”, which does not include future capacity constraints at airports and is comparable to established forecasts like those of Airbus, Boeing, ICAO and IATA.
- A “SAF Scenario”, which considers the introduction of sustainable aviation fuels in future fleets according to ReFuel EU on a global level.
- A “Constrained People Mover Scenario”, where, additionally to the inclusion of the Clean Sky 2 concept aircraft from the industrial partners, the People Mover is introduced from 2034 into the fleet. The People Mover is a large 580-seat aircraft that has been designed for short- to medium-haul missions up to 4000 km.
In applying these scenarios, the ATS models perform the following steps:
- Forecast of passenger and flight demand the scenarios up to 2050.
- Determination of the fleet mix of future fleets up to 2050 including the Entry into Service of future concept aircraft coming from the mission-level aircraft models leading to a flight plan of the whole fleet with all airport pairs globally.
- Emission inventory calculation for the global fleet for all airport pairs.
At the global ATS level, the trajectories considered are based on great circle distances. Future improvement could address air traffic management improvements, e.g., in terms of trajectory optimization in the cruise phase of the flight, which would be relevant for long-range aircraft.
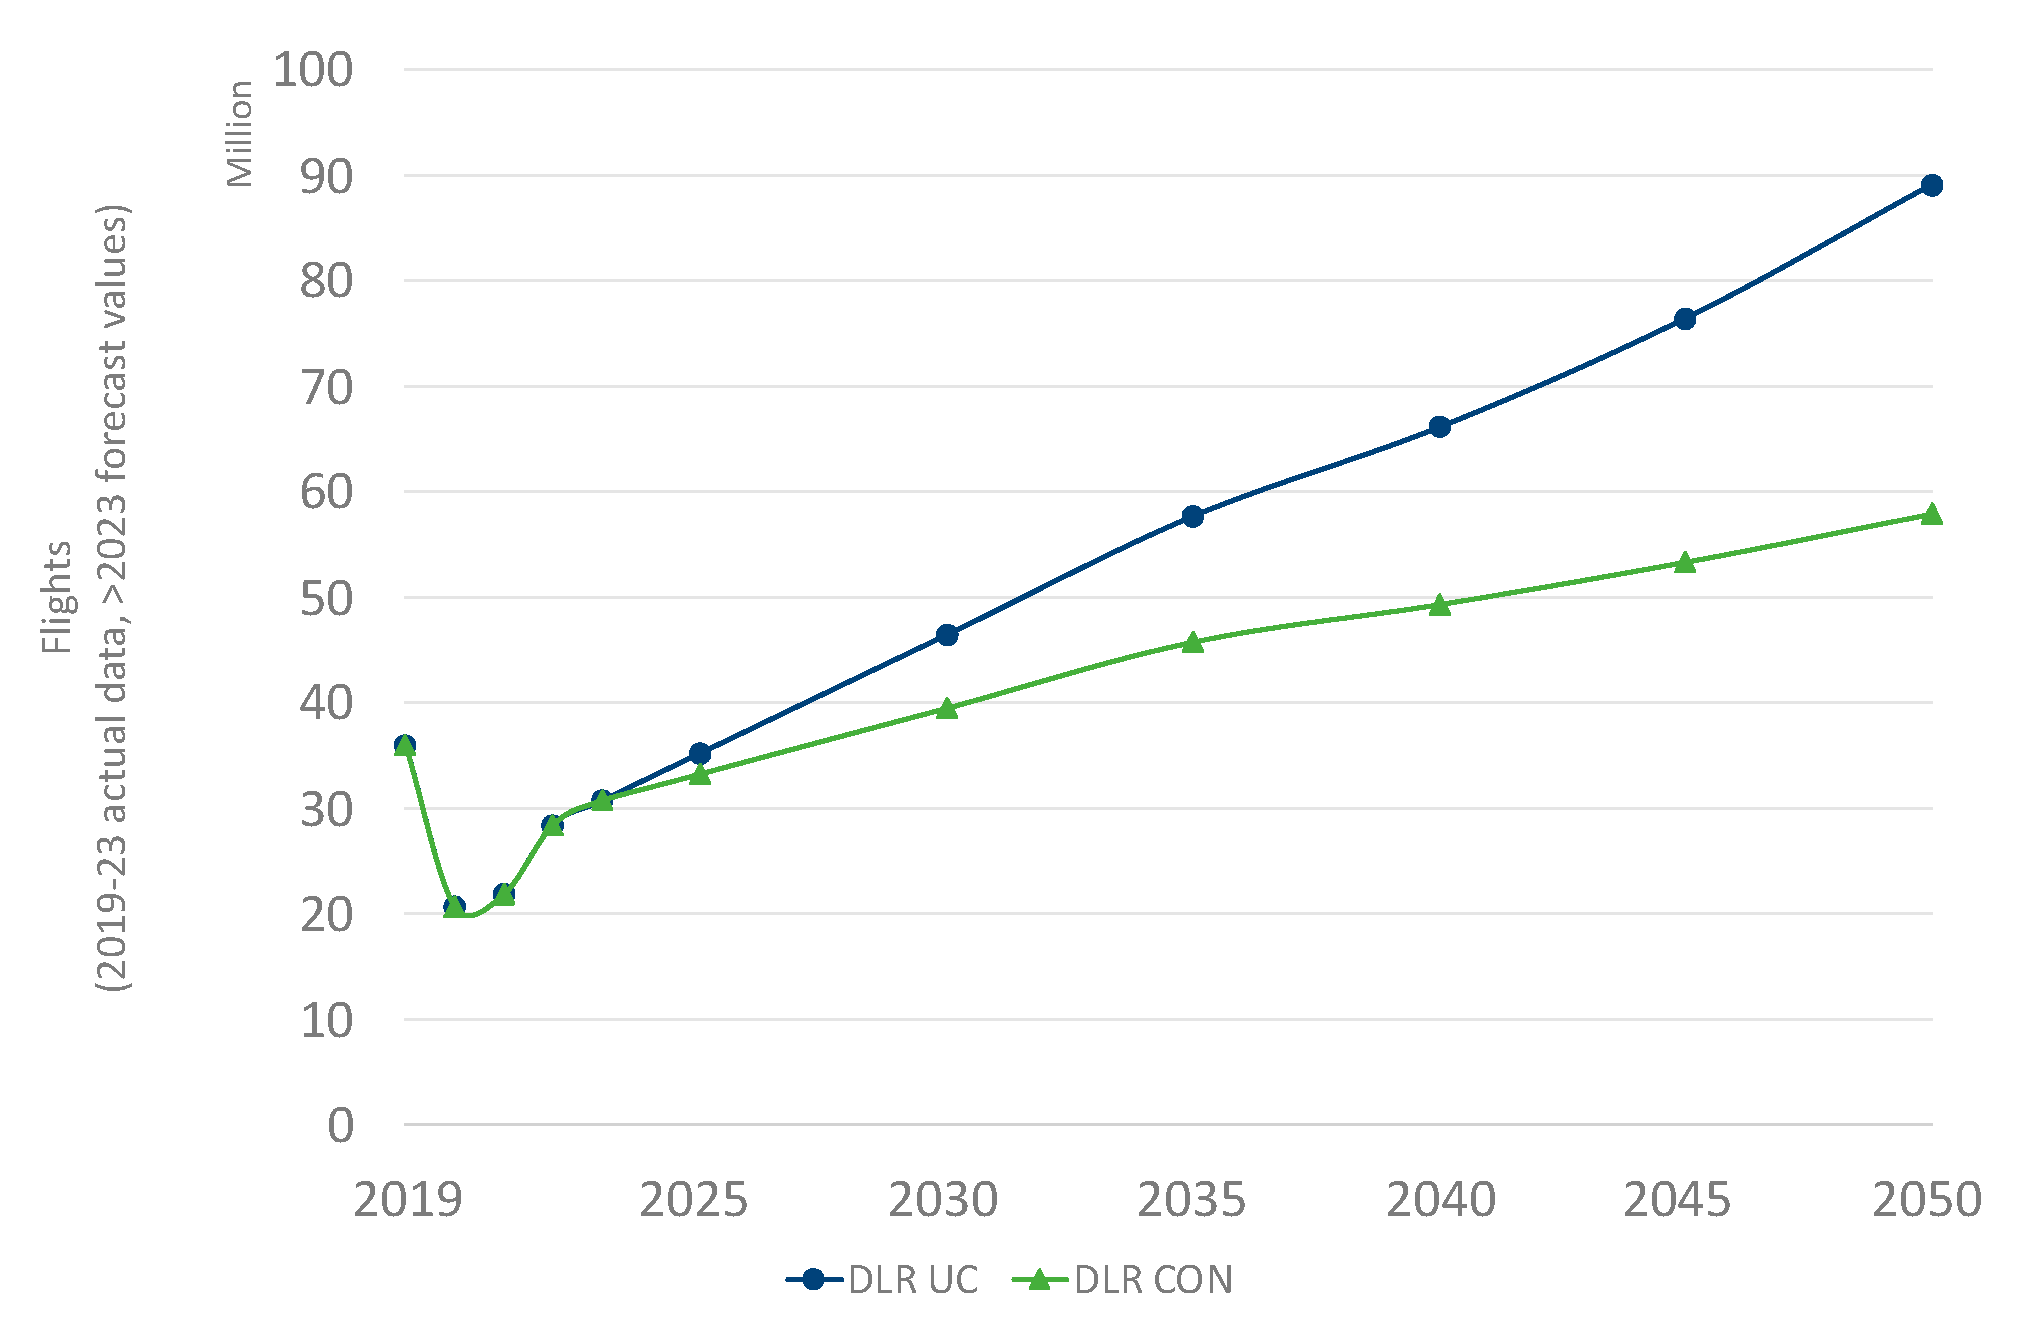
Figure 5 shows the growth of global flight volume from 2019 to 2050. In 2019, there were 36 million flights globally. Until 2050, flight volume is forecast to rise to 58.0 million in DLR CON and even to 89.1 million in DLR UC. This equals an average annual growth of 1.5% and 3.0%, respectively. In the SAF scenarios, flight volume is about 3 million flights less in DLR CON and around 8 million flights less in DLR UC [2]. The focus in Clean Sky 2 is on the DLR CON forecast with innovations on the mission and airport level. The DLR UC forecast serves as a bridge to the established forecasts, while the SAF forecasts are side scenarios. More details on passenger and RPK volume development can be found in [1,2,3].
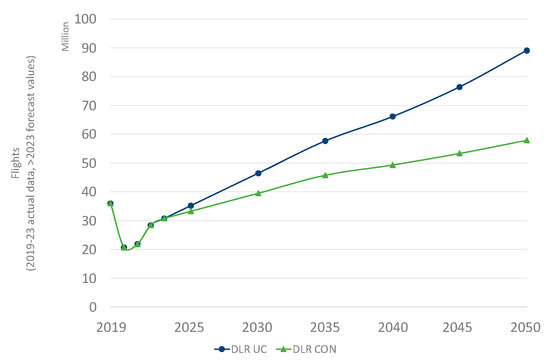
Figure 5.
Results of the DLR forecasts: global flight volume until 2050 [3].
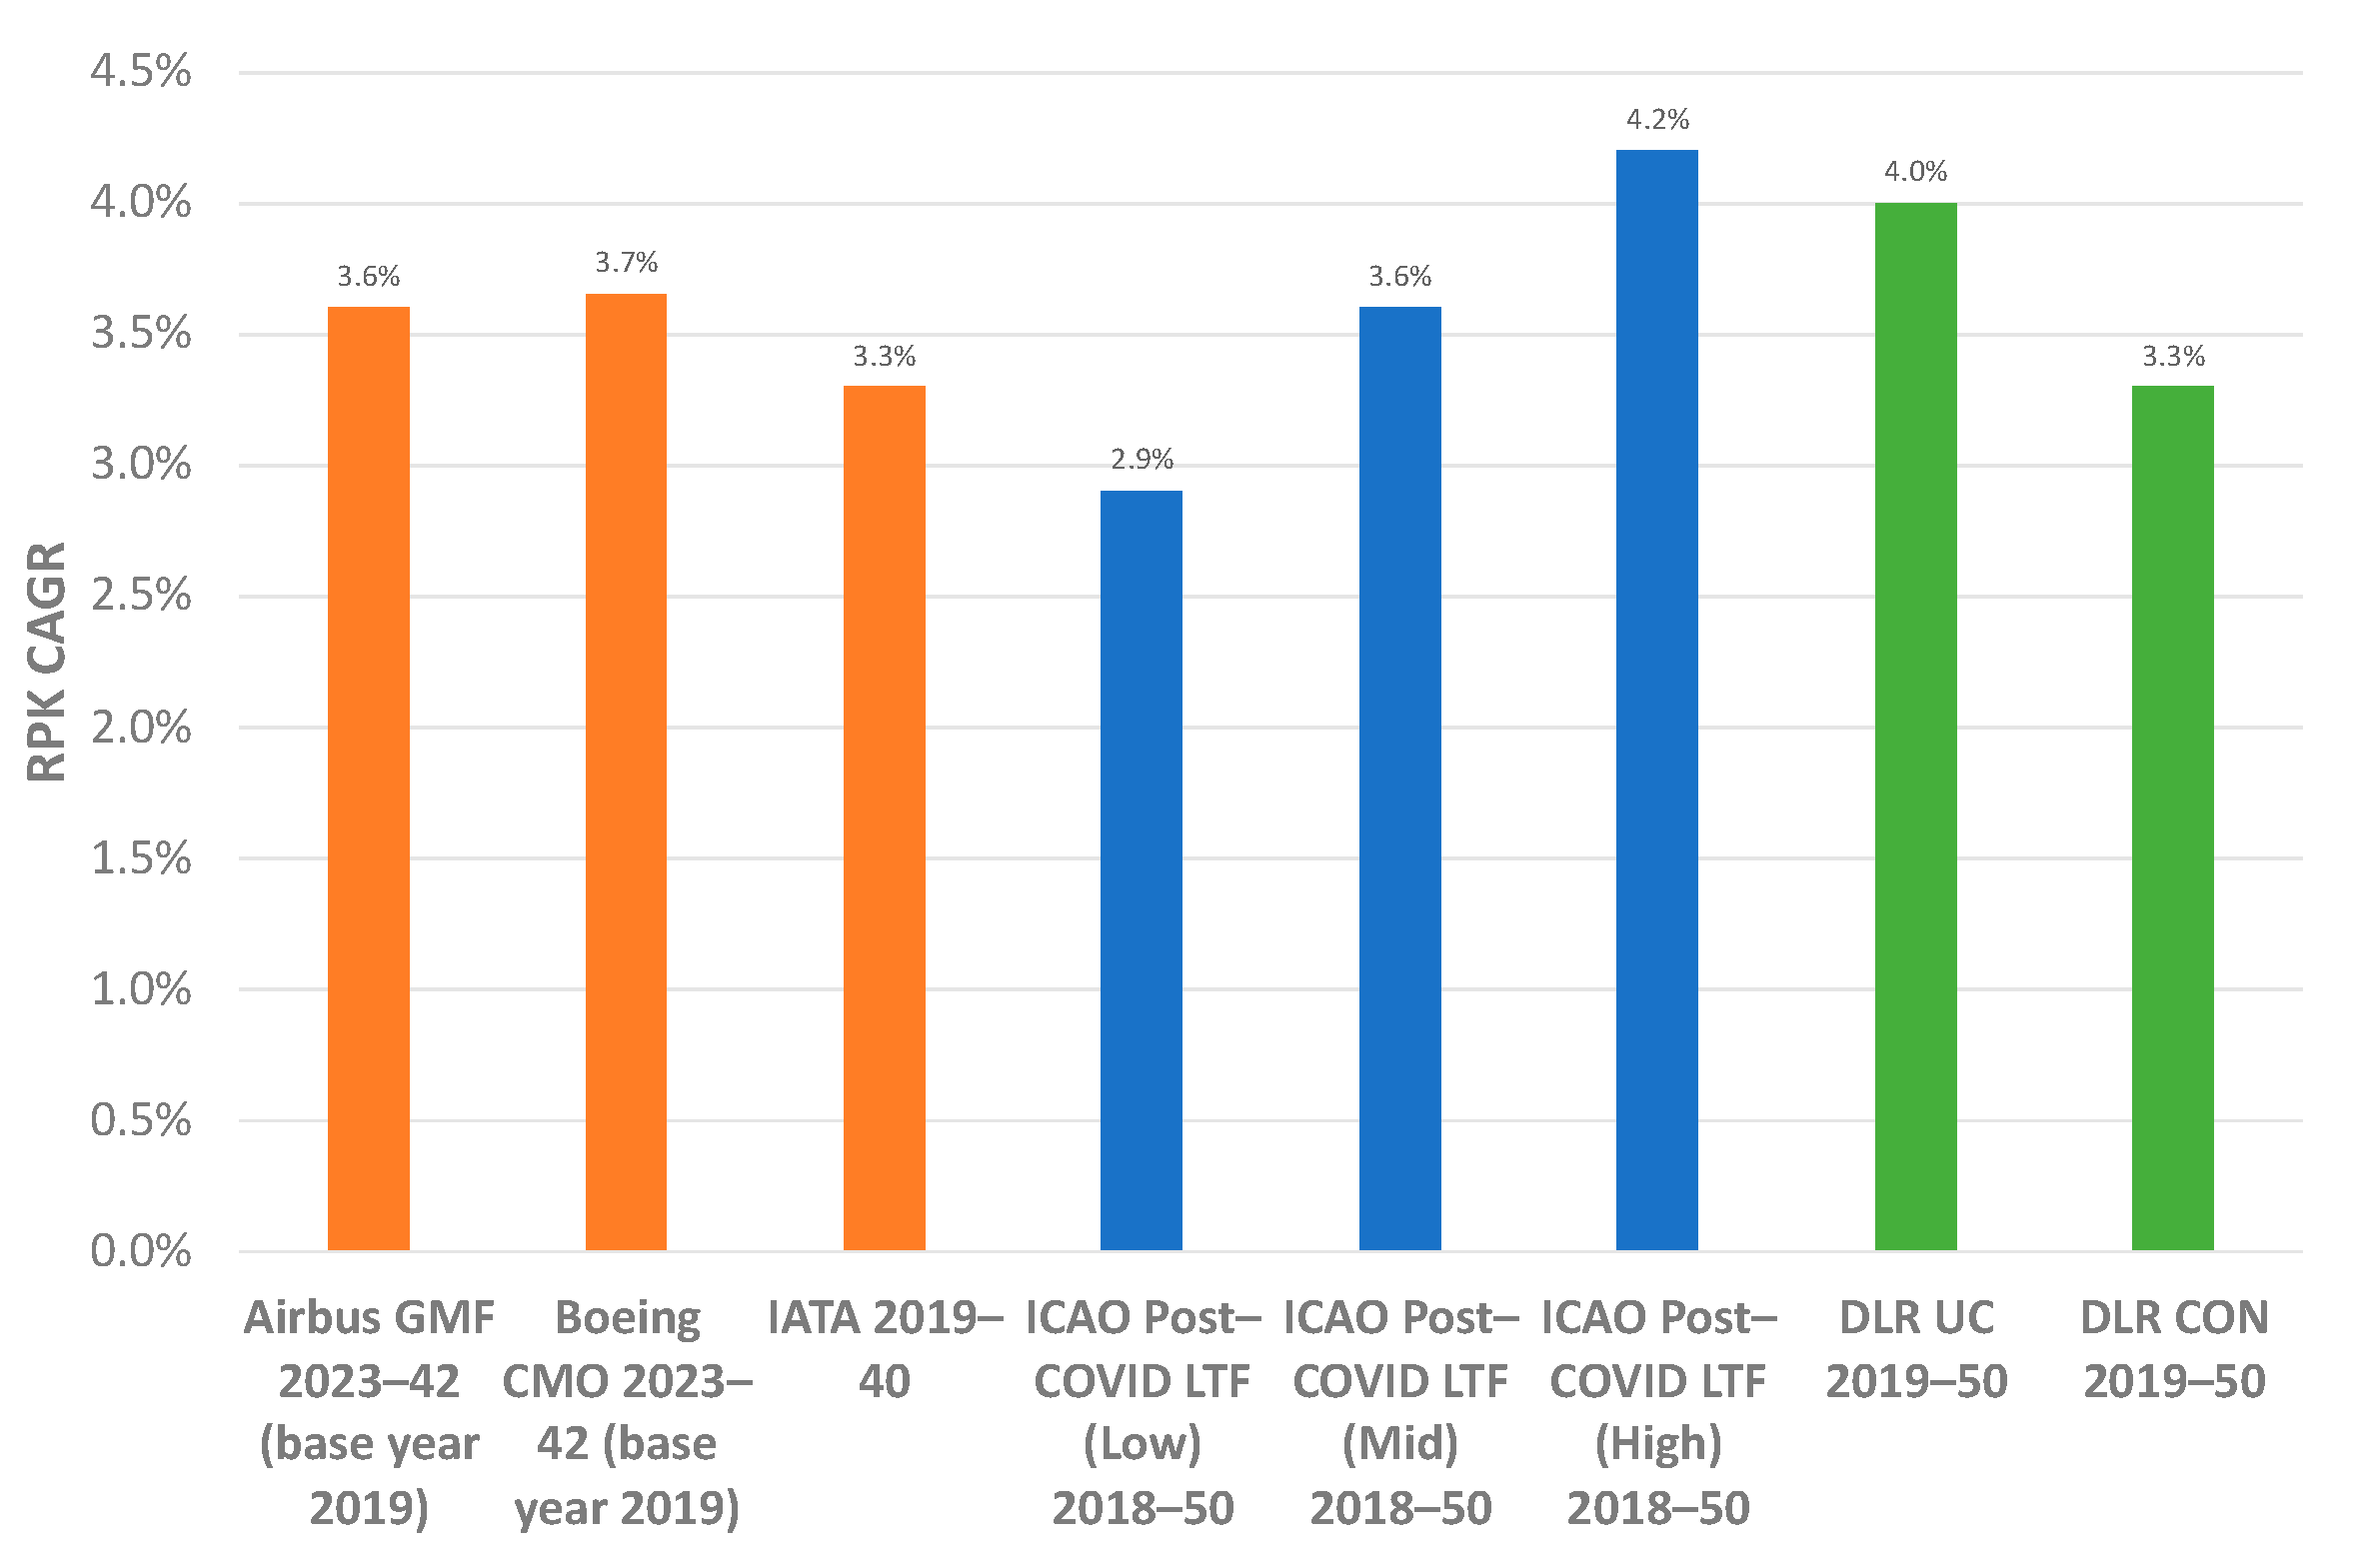
The various sub-models of the DLR model have been assessed theoretically in terms of statistical measures, like R2, etc., in [13]. To further verify the results of the DLR model from a more practical and holistic perspective, a comparison with established forecasts has been carried out. Figure 6 displays the revenue passenger kilometers (RPKs) and compound annual growth rates (CAGRs) of the established forecasts of Airbus [16], Boeing [17], ICAO [18] and IATA [19], as well as the DLR UC (unconstrained) and DLR CON (constrained) forecasts [3]. The DLR UC is comparable to the established forecasts, as it does not consider future airport capacity constraints. This forecast fits well with the other forecasts in terms of future RPK growth. However, exact assumptions and inputs of the established forecasts are difficult to obtain for a more detailed analysis. However, as the DLR UC forecast is quite close, it suggests that the forecast assumptions, e.g., GDP, population and airfare development, are rather similar. The DLR UC helps to put the DLR CON into perspective and verifies it. The difference between those two forecasts is a result of future limited airport capacity, which affects the future development of passenger, flight and RPK volume, as well as the fleet structure.

Figure 6.
Comparison of the DLR CON and DLR UC global RPK forecasts with the global forecasts of Airbus, Boeing, IATA and ICAO (CAGR: compound annual growth rate) [3].
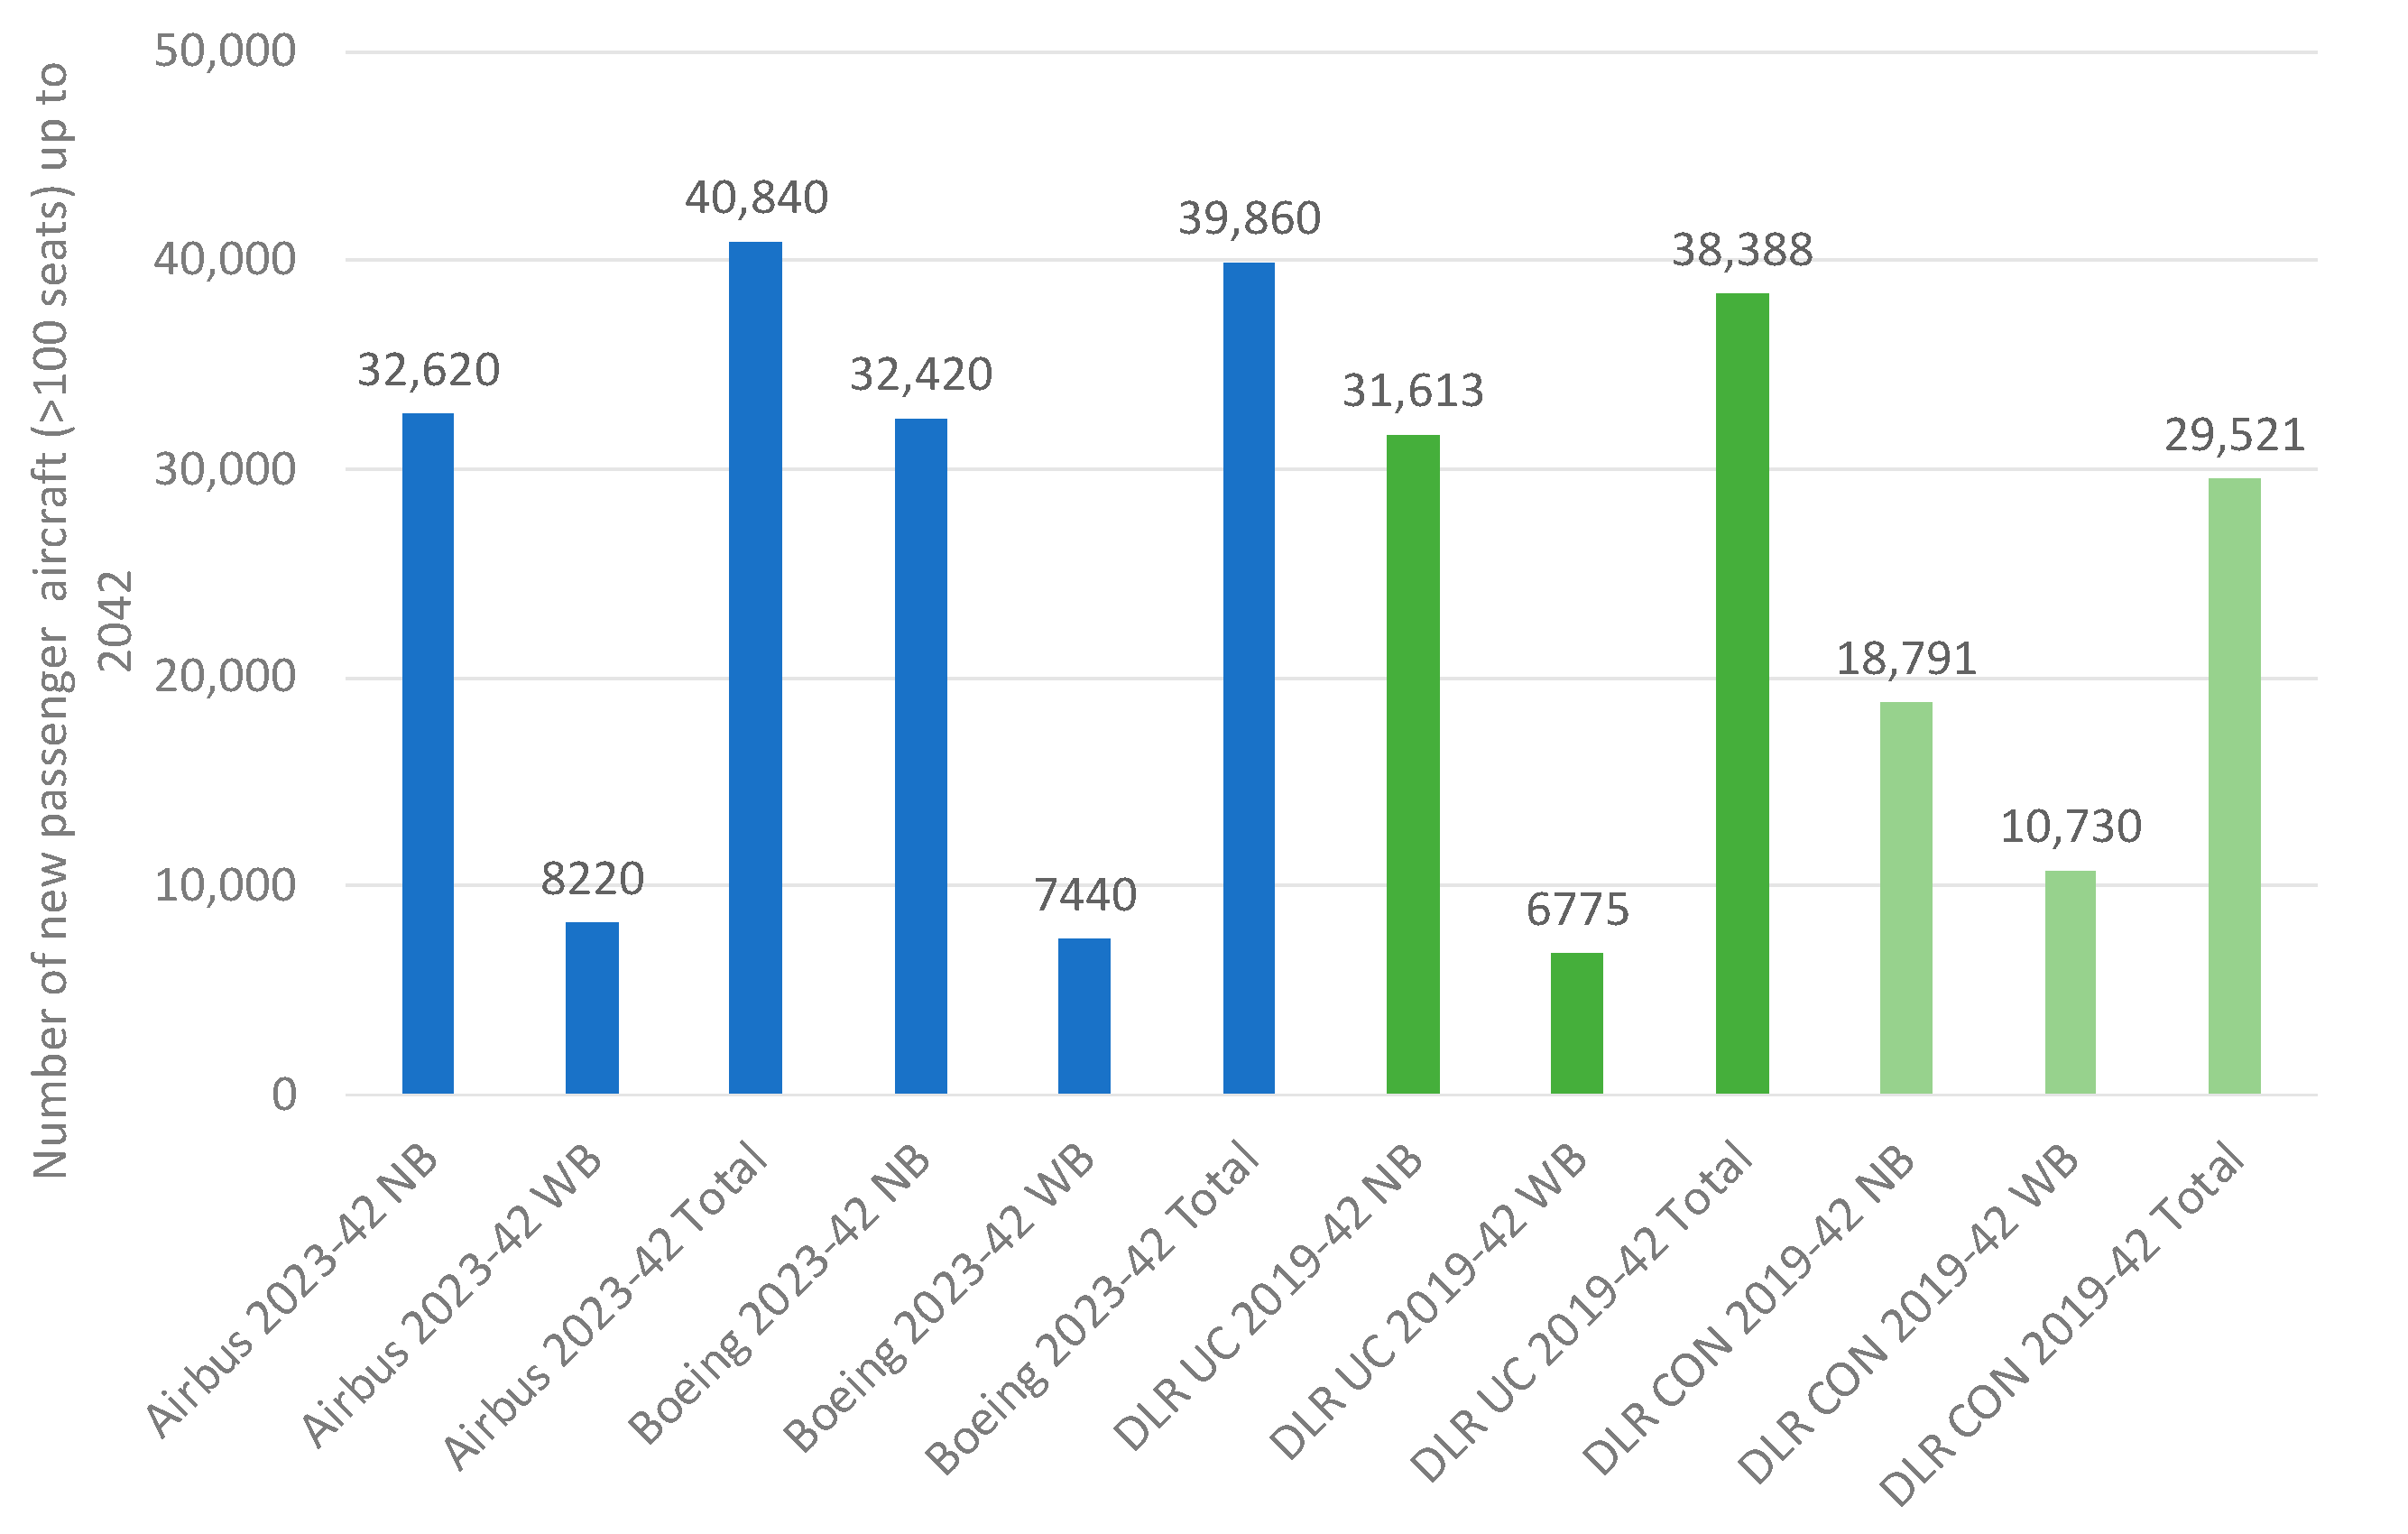
Figure 7 displays the aircraft delivery forecasts of Airbus [16], Boeing [17] and DLR for aircraft of over 100 seats up to 2042 [3]. The aircraft delivery forecasts illustrate the total number of aircraft (Total), as well as the split into narrowbody (NB) and widebody (WB) aircraft. The DLR UC forecast is very close to the aircraft delivery forecasts of Airbus and Boeing, both in terms of the total number of aircraft deliveries as well as the widebody/narrowbody split. The DLR CON forecast is shifted more towards fewer aircraft being delivered, and the split shifts more towards widebody aircraft because of limited airport capacity: passengers are carried by larger aircraft, i.e., more passengers per flight, and the passenger number, RPK and flight volume are lower compared to the DLR UC forecast. As a result, fewer aircraft are needed, and the aircraft tend to be larger.
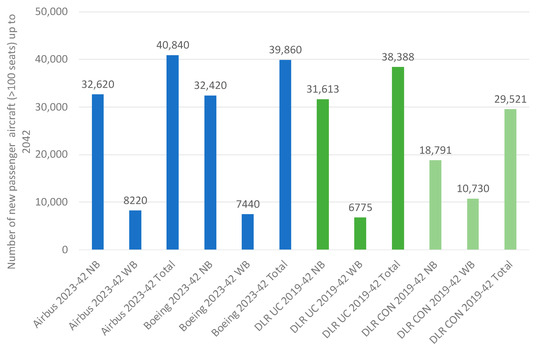
Figure 7.
Comparison of aircraft delivery forecasts of Airbus, Boeing (both blue) and DLR (dark green: unconstrained; light green: constrained) in different scenarios up to 2042 for aircraft of >100 seats (NB: narrowbody aircraft, WB: widebody aircraft) [3].
Figure 5 and Figure 6 show that the DLR model is appropriate compared to established forecasts by verifying the results for the unconstrained forecast scenario. Especially the comparison of the aircraft delivery forecasts, which asserts a high degree of conformity on the DLR model with the other forecasts because the aircraft deliveries are typically at the very end of a forecast, and the passenger and fleet forecast, as well as numerous inputs and assumptions, have to fit to make this happen. While we do not know each detailed assumption and input of these established forecasts, the results suggest a high degree of conformity. The DLR CON forecast adds limited airport capacity, which shifts the results in a consistent manner.
3. Results: Technology Evaluator Assessment Framework and Metrics
Figure 8 shows the overall framework and metrics of the Technology Evaluator assessments. A first overall assessment was performed in 2021 [11,20], followed by a second assessment in 2024 [1,2]. Figure 7 shows the assessment levels and associated topics. The assessment levels (mission, airport and ATS) are shown on the left. The vertical columns show the topics and associated metrics. Environmental impacts as well as socio-economic impacts have been evaluated, i.e., mobility, connectivity and macro-economic relating to aircraft fleet development. The metrics in yellow were not addressed in the Technology Evaluator during Clean Sky 2 and are possible candidates for further assessments in future projects.
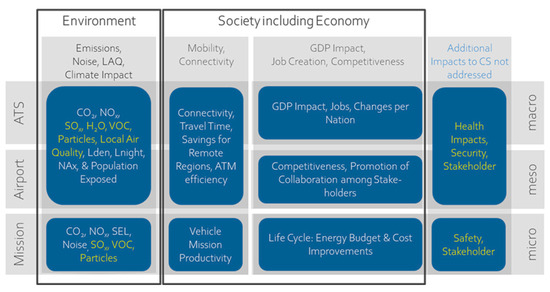
Figure 8.
Technology Evaluator assessment framework and metrics (yellow metrics and blue topics are not yet addressed) [2].
At the mission level, the emissions metrics are expressed in kg per mission and normalized to kg per seat-kilometer, identical to the fuel burn metrics. At the ATS level, this is equivalent to revenue passenger kilometers (RPKs).
The results at the mission level show a CO2 reduction, e.g., for long-range aircraft of about 18% and about 45% for NOx. The ATS level results show a CO2 reduction of 14.5% and 29% for NOx [1,2].
At the airport level, the most relevant noise metric is the Lden, i.e., the cumulative noise level (in dB(A)) for multiple events during a complete day (day, evening and night), with a penalty for aircraft operations during evening and night.
The airport results provided for the airports consider a surface area reduction of Lden contours for 60–65 dB(A) noise levels in a range of from 8% to 17% [1,2].
Concerning the economic impact, the metrics used are the gross domestic product (GDP) development impact and the number of jobs in the overall aeronautics sector related to the number of flights in the forecast fleets up to 2050. This analysis is conducted at the country level.
The economic results show that the technological innovation in the future fleet and its associated traffic increase will lead to a strong growth in aviation-related employment in Europe and the world as well as a significant increase in gross value added created by aviation. For example, aviation-related employment in the EU27 plus the UK will amount to an estimated 7 million direct, indirect and induced jobs in 2050, compared to 5.2 million jobs in 2019 [1,2].
Time savings on origin–destination connections are employed as metrics for connectivity. This was of particular interest for fast rotorcrafts employed in remote regions of Europe. Fast rotorcraft led to a significant increase in the connectivity of those regions by reducing travel time.
4. Discussion and Conclusions
The Technology Evaluator assessments were carried out as part of the Clean Sky 2 program. The innovations of the Technology Evaluator are the numerous interfaces between ITDs and IADPs which provide Clean Sky 2 a systematic approach to evaluate technology impact at aircraft concept level, which was not the case in previous European and national programs.
Furthermore, the capability to assess the effects of Clean Sky 2 concept aircraft at fleet levels, i.e., airport and air transport systems, was innovative, especially because of the combination of forecasts and scenarios for future fleets with realistic fleet replacement through concept aircraft with integrated Clean Sky 2 technologies.
The inclusion of socio-economic impacts in the assessments provided new opportunities, e.g., for fast rotorcraft as a new means of passenger transport in future fleets for regular passenger transport, but also in the specific case of workers to be transported to oil platforms.
Continuation of the three-level assessment method has already been initiated in the Impact Monitor project with more specific emphasis on an integrated and automated simulation framework.
One of the main assumptions in the TE assessment method was the inclusion of airport capacity constraints on the future development of airports globally, especially hubs. This has not been considered in other established forecasts. Scarce airport capacity leads to a lower passenger and flight volume as well as a different fleet compared to an unconstrained forecast. Furthermore, this affects emissions and noise as well as economic impact. While there is certainly room for improvement, like focusing on improvements in the air traffic management system, more realistic flight routes or the inclusion of new propulsion techniques like liquid hydrogen or e-aircraft, the inclusion of limited airport capacity and moving to an airport-based instead of region-based forecast provides a major step forward. This results in more realistic flight volumes for the airport-level assessment. Furthermore, an airport-based approach is more suited to include new propulsion types because of the maximum flight range restrictions of such aircraft and the availability of new fuel types at airports.
Author Contributions
Conceptualization, A.J., A.L. and M.C.G.; methodology, A.J., A.L. and M.C.G.; software, A.J., A.L. and M.C.G.; validation, A.J., A.L. and M.C.G.; formal analysis, A.J., A.L. and M.C.G.; investigation, A.J., A.L. and M.C.G.; resources, A.J. and A.L.; data curation, A.J., A.L. and M.C.G.; writing—original draft preparation, A.J. and A.L.; writing—review and editing, M.C.G.; visualization, A.J. and A.L.; supervision, A.J. and A.L.; project administration, A.J. and A.L.; funding acquisition, A.J. and A.L. All authors have read and agreed to the published version of the manuscript.
Funding
This research was funded by the Horizon 2020 Framework Programme, grant number 945529. The APC was funded by the German Aerospace Center (DLR).
Data Availability Statement
Data are contained within this article.
Conflicts of Interest
The authors declare no conflicts of interest.
Abbreviations
| ACARE | Advisory Council for Aeronautics Research in Europe |
| AIR | Clean Sky 2 Airframe ITD |
| ATAG | Air Transport Action Group |
| ATS | Air transport system |
| EASA | European Aviation Safety Agency |
| IADP | Innovative Aircraft Demonstrator Platforms |
| ITD | Integrated Technology Demonstrators |
| IATA | International Air Transport Association |
| ICAO | International Civil Aviation Organization |
| CAGR | Compound annual growth rate |
| CO2 | Carbon dioxide |
| CS2 | Clean Sky 2 |
| dB(A) | Decibels on the A scale |
| DLR | Deutsches Zentrum für Luft- und Raumfahrt e.V. (German Aerospace Center) |
| DLR CON | DLR constrained forecast |
| DLR UC | DLR unconstrained forecast |
| ENG | Clean Sky 2 Engine ITD |
| E-STOL | Electrical/hybrid short take-off and landing aircraft concept |
| EU | European Union |
| FRC | Clean Sky 2 Fast RotorCraft IADP |
| GDP | Gross domestic product |
| GTF | Geared turbofan |
| ft | Feet |
| kft | Kilo-feet |
| kTAS | Knots true air speed |
| LAQ | Local air quality |
| Lden | Cumulative noise level (in dB(A)) over an entire year for multiple events, with a penalty for aircraft operations during evening- and night-time |
| Lnight | Cumulative noise level (in dB(A)) over an entire year for aircraft operations during night-time. |
| LPA | Clean Sky 2 Large Passenger Aircraft IADP |
| LTAG | Long-term Global Aspirational Goal |
| Ma | Mach number |
| NB | Narrowbody |
| NGCTR | Next Generation Civil Tilt Rotor |
| NOx | Nitrogen oxides |
| RACER | Rapid and Cost-Effective Rotorcraft |
| REG | Clean Sky 2 Regional IADP |
| RPK | Revenue passenger kilometres |
| SAF | Sustainable aviation fuel |
| SAT | Small Air Transport |
| SEL | Sound exposure level |
| SID | Standard Instrument Departures |
| SMR | Short-medium-range |
| SoA | State-of-art |
| STAR | Standard Terminal Arrival Routes |
| TA | Transverse Activities |
| TE | Technology Evaluator |
| TP | Turboprop |
| UHBR | Ultra-high bypass ratio |
| UK | United Kingdom |
| WB | Widebody |
| # | Number |
References
- Clean Aviation. Clean Sky 2 Final Report—Second Global Assessment 2024; Clean Aviation: Brussels, Belgium, 2024; pp. 1–45. Available online: https://www.clean-aviation.eu/sites/default/files/2024-11/CS2_TE_25.11.2024_FINAL.pdf (accessed on 1 March 2025).
- Clean Aviation. Clean Sky 2 Final Report—Second Global Assessment 2024, Technical Annex; Clean Aviation: Brussels, Belgium, 2024; pp. 1–242. Available online: https://www.clean-aviation.eu/sites/default/files/2024-11/CS2_TE_25.11.2024_TechAnnex.pdf (accessed on 1 March 2025).
- Gelhausen, M.C.; Junior, A.; Leipold, A.; Berster, P.; Lois, C.; Baier, F. Results from the ATS-Level Assessment of the Clean Sky 2 technology Evaluator. Aerospace 2025, 12, 185. [Google Scholar] [CrossRef]
- ATAG. Air Transport Action Group. Waypoint 2050; ATAG: Geneva, Switzerland, 2021; pp. 1–106. Available online: https://aviationbenefits.org/media/167417/w2050_v2021_27sept_full.pdf (accessed on 1 March 2025).
- IATA. International Air Transport Association. Net Zero Carbon 2050 Resolution; IATA: Montreal, QC, Canada, 2021; Available online: https://www.iata.org/en/iata-repository/pressroom/fact-sheets/fact-sheet-iata-net-zero-resolution/ (accessed on 1 March 2025).
- ICAO. International Civil Aviation Organization. Long Term Global Aspirational Goal (LTAG) for International Aviation. Available online: https://www.icao.int/environmental-protection/Pages/LTAG.aspx (accessed on 1 March 2025).
- ACARE. Advisory Council for Aeronautics Research in Europe. ACARE Vision. Available online: https://www.acare4europe.org/acare-vision/ (accessed on 1 March 2025).
- European Commission: Directorate—General for Mobility and Transport and Directorate-General for Research and Innovation. Flightpath 2050—Europe’s Vision for Aviation—Maintaining Global Leadership and Serving Society’s Needs; European Commission: Brussels, Belgium, 2012; Available online: https://data.europa.eu/doi/10.2777/15458 (accessed on 1 March 2025).
- EASA. European Aviation Safety Agency. European Aviation Environmental Report 2025; EASA: Cologne, Germany, 2025; pp. 1–198. Available online: https://www.easa.europa.eu/sites/default/files/eaer-downloads/EASA_EAER_2025_Book_v5.pdf (accessed on 1 March 2025).
- Gelhausen, M.C.; Grimme, W.; Junior, A.; Lois, C.; Berster, P. Clean Sky 2 Technology Evaluator—Results of the First Air Transport System Level Assessments. Aerospace 2022, 9, 204. [Google Scholar] [CrossRef]
- Clean Aviation. Clean Sky 2 Final Report—First Global Assessment 2020, Technical Annex; Clean Aviation: Brussels, Belgium, 2021; pp. 1–124. Available online: https://www.clean-aviation.eu/sites/default/files/2021-10/TE-FGA-TR_en.pdf (accessed on 1 March 2025).
- Wöhler, S.; Walther, J.-N.; Grimme, W. Design of a People-Mover Aircraft under Airport Constraints and Comparison to Single-Aisle Aircraft Efficiency. In Proceedings of the 12th EASN International Conference on “Innovation in Aviation & Space for Opening New Horizons”, Barcelona, Spain, 10–21 October 2022. [Google Scholar]
- Gelhausen, M.C.; Berster, P.; Wilken, D. Airport Capacity Constraints and Strategies for Mitigation: A Global Perspective; Elsevier: New York, NY, USA, 2019; pp. 1–327. [Google Scholar]
- Gelhausen, M.C.; Berster, P.; Wilken, D. Post-COVID-19 Scenarios of Global Airline Traffic until 2040. Aerospace 2021, 8, 300. [Google Scholar] [CrossRef]
- Eurocontrol. Integrated Aircraft Noise and Emissions Modelling Platform (IMPACT); Eurocontrol: Brussels, Belgium, 2025; Available online: https://www.eurocontrol.int/platform/integrated-aircraft-noise-and-emissions-modelling-platform (accessed on 1 March 2025).
- Airbus. Global Market Forecast 2023–2042; Airbus: Blagnac, France, 2023. [Google Scholar]
- Boeing. Commercial Market Outlook 2023–2042; Boeing: Seattle, WA, USA, 2023. [Google Scholar]
- International Civil Aviation Organization (ICAO). ICAO Post-COVID-19 Forecasts Scenarios. Available online: https://www.icao.int/sustainability/Pages/Post-Covid-Forecasts-Scenarios.aspx (accessed on 5 January 2025).
- International Air Transport Association (IATA). 20 Year Passenger Forecast; IATA: Montreal, QC, Canada, 2019. [Google Scholar]
- Clean Aviation. Clean Sky 2 Final Report—First Global Assessment 2020 Synopsis; Clean Aviation: Brussels, Belgium, 2021; pp. 1–17. Available online: https://www.clean-aviation.eu/sites/default/files/2024-12/20210308%20Clean%20Sky%202%20TE%20Short%20Synopsis_forGBapproval.pdf (accessed on 1 March 2025).

Disclaimer/Publisher’s Note: The statements, opinions and data contained in all publications are solely those of the individual author(s) and contributor(s) and not of MDPI and/or the editor(s). MDPI and/or the editor(s) disclaim responsibility for any injury to people or property resulting from any ideas, methods, instructions or products referred to in the content. |
© 2025 by the authors. Licensee MDPI, Basel, Switzerland. This article is an open access article distributed under the terms and conditions of the Creative Commons Attribution (CC BY) license (https://creativecommons.org/licenses/by/4.0/).