Abstract
It is well established that increasing vehicle efficiency enables the achievement of N + 3 sustainable air travel goals. To this end, the integration of a slotted natural-laminar-flow airfoil with a transonic, truss-based commercial wing configuration is projected to significantly decrease fuel consumption demand. The slotted natural-laminar-flow airfoil is designed with two elements to extend favorable pressure gradients further aft than single-element airfoils. This two-element design increases the extent of laminar flow to approximately 90% of the airfoil surface, thus decreasing streamwise instabilities, which in turn reduces the wing profile drag. The slotted natural-laminar-flow airfoil also exhibits the dumping-velocity effect and achieves an off-surface pressure recovery, both critical to achieving laminar flow and overcoming single-element airfoil limitations. Given the potential of this novel concept, the objective of this literature review is to discuss the history of slotted natural-laminar-flow airfoils, recent research to mature the design, and future work needed for the implementation of this airfoil on a commercial aircraft.
1. Introduction
In 2023, the United States commercial aircraft industry alone consumed over 23 billion gallons of fuel [1], and the aerospace industry’s demand is projected to continually increase (Figure 1), exemplifying the unprecedented urgency for disruptive fuel efficiency technology. To address this need, the National Aeronautics and Space Administration (NASA) created N + 3 (far term) goals for reduction in fuel consumption relative to a 2005 best-in-class transport aircraft [2]. This challenge encompasses many conflicting requirements, including accommodating the continuous increase in passengers, while simultaneously protecting the environment and preparing for a diminishing supply of fuel and rising fuel costs. With this multitude of complexities, temporary fixes and incremental advancements will not adequately address long-term sustainability. Instead, the development of new operations and aircraft technologies is required.
One example of high-impact technology for fuel efficiency is the SUGAR High aircraft, an iteration of the Transonic, Truss-Braced Wing (TTBW) aircraft developed through a NASA-funded study conducted by Boeing [3] (Figure 2). If fully developed, this aircraft is projected to drastically decrease fuel consumption by 70% during cruise conditions. The SUGAR High aircraft is designed for a cruise Mach number (M) of 0.70 and a cruise Reynolds number (Re) of approximately 13 × 106 with a maximum span of 118 feet. The operating conditions and sizing were derived using the transonic, commercial Boeing 737 aircraft as the baseline. The design provides a high lift-to-drag (L/D) ratio, a high-bypass-ratio turbofan engine, and other advanced technologies such as riblets, natural laminar flow (NLF), and supercritical airfoil technology to improve engine performance. NLF is ranked as the 5th highest out of 24 technologies for the SUGAR High design, indicating its importance in contributing to improved aerodynamic performance and subsequent fuel/energy conservation. The projected fuel reduction achieved by implementing NLF alone is estimated at 2.54%, which would have saved 602 million gallons of fuel in 2023 or approximately USD 1.12 billion in fuel costs for the U.S. civil aircraft industry. Three additional studies cite NLF as a promising advanced technology that contributes towards the reduction in profile drag: the Massachusetts Institute of Technology (MIT) (a 180 passenger capacity aircraft) [4], Deutsches Zentrum für Luft- und Raumfahrt (DLR) (short and medium range transport aircraft) [5], and Technische Universität Braunschweig (a twin-fuselage aircraft) [6].
One NLF concept with demonstrated potential to improve aerodynamic performance is the slotted, natural-laminar-flow (SNLF) airfoil patented by Dan Somers of Airfoils Inc. [7]. This airfoil, consisting of a forward or fore element and a rear or an aft element, is under active maturation for integration on a TTBW aircraft intended to replace current 100–210-passenger-class aircraft configurations (i.e., the Boeing 737), which currently consume half of the commercial fleet fuel [8]. One of the SNLF airfoil shapes, the S207, can be adapted to the cruise conditions of the SUGAR High aircraft and has been evaluated both computationally and experimentally, as discussed in Section 3 and Section 4.
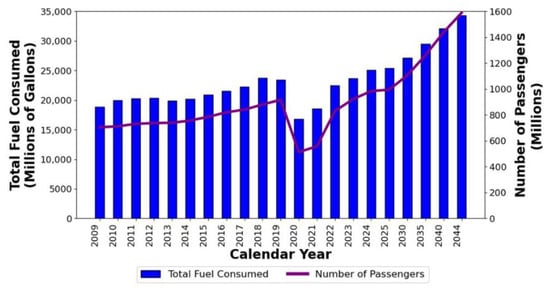
Figure 1.
Historical and projected: total domestic and international U.S. passenger traffic for U.S. commercial air carriers; jet fuel and aviation fuel consumption by U.S. civil aircraft [1,9,10,11,12,13].
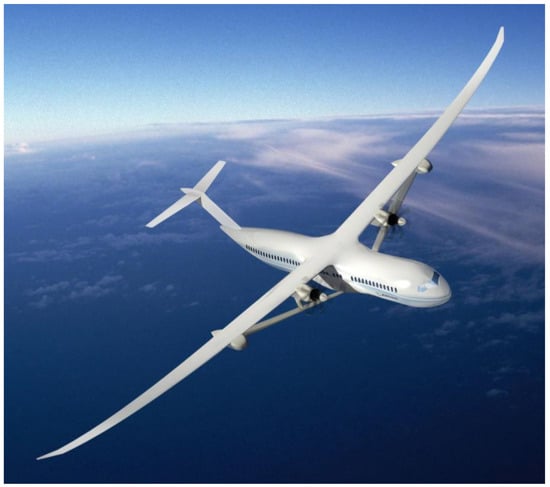
Figure 2.
Configuration of a Boeing Transonic, Truss-Braced Wing (image credit: NASA/The Boeing Company [14]).
The SNLF airfoil can be readily integrated alongside complementary advanced technologies to further increase aircraft efficiency. For example, implementing active flow control and high-lift systems on an SNLF airfoil would improve the wing’s L/D performance ratio. Moreover, the incorporation of hybrid electric propulsion could boost fuel burn reduction by 26–32% [3]. Additionally, a study conducted by Boeing demonstrates that adaptive structures and control systems could provide a 50% reduction in weight for complex high-lift systems, improving fuel efficiency as well as reducing noise and drag while enhancing laminar flow, therefore complementing the benefits of implementing an SNLF airfoil [3].
The two-element SNLF airfoil provides increased laminar flow, and thus more lift than a classical, single-element airfoil. Single-element NLF airfoils are limited because they produce a thick boundary layer across their surface, which cannot sustain large pressure gradients as efficiently as multi-element airfoils. Additionally, single-element airfoils do not take advantage of the dumping velocity effect or the off-surface pressure recovery effect. The slot in a two-element SNLF airfoil allows the wing to achieve NLF on the entirety of the lower surface of both elements and the upper surface of the fore element (Figure 3). The simultaneous reduction in profile drag enables the SNLF to achieve a higher L/D ratio [15]. To fully realize the potential of the SNLF airfoil, it is necessary to understand its development history, current design, and the future work required for its integration with a new aircraft configuration.
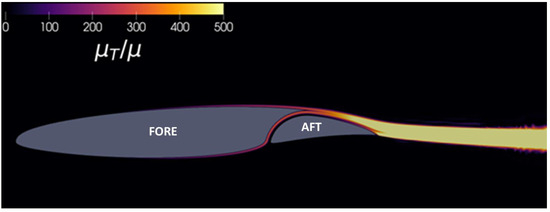
Figure 3.
Airflow over the S207 cross-section showing the extent of laminar flow (image provided courtesy of Dr. Doug Stefanski).
2. Laminar Flow for Fuel Efficiency
A core goal in aircraft design for improved fuel efficiency is the reduction in wing profile drag, responsible for a third of the total drag [16]. NLF has been identified as an enabling technology [3,4,5,6]; therefore, it is important to understand laminar flow and design challenges for NLF implementation.
2.1. Overview of Laminar Flow
In simple terms, air particles in laminar flow move in smooth layers allowing for uninterrupted flow, whereas turbulent flow is an unsteady, mixed flow that produces drag. The extent of laminar flow under the surface of an airplane wing primarily depends on the state of the boundary layer that is highly influenced by the pressure gradient, or the change in static pressure as the flow progresses. An extended gradient of decreasing pressure is favorable as it reduces streamwise instabilities on the boundary layer, allowing for increased amounts of laminar flow on the surface. This boundary layer stability greatly reduces the skin friction drag. However, an adverse pressure gradient can form and destabilize the laminar flow, causing a transition to turbulent flow. The onset of turbulent flow increases the instabilities, causing boundary layer separation and increasing the skin friction drag. In summary, increasing the favorable pressure gradient and the extent of laminar flow on the airfoil is essential to reducing the global drag coefficients (CD) of the wing surface and improving the overall aircraft performance.
2.2. Challenges in Achieving Laminar Flow
Maintaining laminar flow is challenging because the airfoil must simultaneously fulfill multiple requirements, such as high M, high Re, and maximized global coefficients of lift (CL) for the wing. When Re is high, the favorable pressure gradient must extend along the entire length of the airfoil to stabilize the flow and maintain the laminar boundary layer [17]. Additionally, accounting for the various range of instabilities is critical to prevent the boundary layer from transitioning from laminar to turbulent flow. For wings with relatively large sweep angles, the predominant instability is crossflow; however, lower swept wings primarily exhibit Görtler instabilities [18]. These conflicting relationships challenge design as reducing the wing sweep could lower crossflow instabilities. However, wing sweep influences the critical M, which is desirable for aircraft efficiency [19]. Therefore, researchers are investigating approaches to minimize CD and maximize CL by increasing the extent of NLF over airfoils.
An initial attempt to decrease wing profile drag through increased NLF was performed by Eastman Jacobs, a research engineer at the National Advisory Committee for Aeronautics (NACA) Langley Research Center (LaRC) in the late 1930s [20]. Jacobs performed the calculations to demonstrate how NLF single-element airfoils produce higher local lift coefficients (Cl). He inverted the airfoil analysis method to derive an airfoil shape that produced the desired pressure distribution. In doing so, Jacobs created a unique procedure for obtaining the optimal boundary-layer characteristics that continues in today’s airfoil design research. Thus, this newfound process of designing laminar-flow airfoils helped NACA in developing low-speed airfoils, i.e., the NACA 6-series airfoils, which showed lower drag characteristics and higher critical M than their predecessors [21].
A more recent example of a single-element NLF airfoil is the NASA Common Research Model (CRM), specifically the CRM.65 model [22]. Extensively researched and developed, this airfoil can reach higher NLF levels than standard airfoils, although analyses show a corresponding 25% increase in total profile drag due to an early transition to turbulent flow on the lower surface [15,23]. Thus, the benefits of NLF are counteracted by increased drag, and this design cannot sustain large extents of NLF while also preventing early transition. In general, single-element NLF airfoils exhibit performance limits that cannot be overcome through airfoil shape modifications alone. For example, the extent of laminar flow along the aft and leading-edge sweep of the airfoil is limited to around 70% chord, with the lower surface sustaining laminar flow until around 50% chord. Additionally, once the adverse pressure gradient reaches a certain point, trailing edge separation occurs [24]. This separation decreases the maximum Cl, subsequently reducing the L/D ratio of the aircraft.
2.3. Slotted Natural-Laminar-Flow Airfoil Solution
A two-element SNLF airfoil overcomes the limits of a single-element airfoil (Table 1) [25]. The slot is always open between the fore and aft elements; therefore, the favorable pressure gradient extends farther aft and along both surfaces of the fore element. Specifically, the fore element has a lower trailing edge pressure than the freestream, creating a higher velocity, thereby allowing the element to carry more load before separation, an effect known as dumping velocity [26]. The aft element interacts with the fore element to sustain the dumping velocity, enabling the airfoil to achieve increased lift as it recovers the pressure gradients [15,26]. The result is that the aft element produces higher lift as it recovers to the free-stream pressure. Additionally, the slot prevents the formation of a strong suction peak on the aft element. Generally, a fresh boundary layer is allowed to form at the aft element, and without a strong suction peak, the airfoil can operate at much higher angles of attack before stalling occurs.

Table 1.
Comparison of representative single- and two-element NLF airfoils.
Ref. [27] slotted airfoils are known to deliver higher maximum Cl as compared to unslotted airfoils. Examples include the slotted, supercritical airfoils [26,27] and the MDA 3-element high-lift airfoil [26]. The SNLF airfoil developed by Somers combines the low drag characteristics of NLF airfoils and the higher maximum Cl offered by a slotted design [7]. Because the design of the fore element does not need to meet the requirement of pressure recovery at the trailing edge, the minimum pressure is located near the trailing edge. Therefore, the entire fore element achieves a favorable pressure gradient (laminar flow). The aft element produces circulation and therefore aids in supporting the dumping velocity at the exit of the fore element. A fresh boundary layer develops at the aft element, and again, favorable pressure gradients can be maintained almost entirely along the aft element. For example, the S207 SNLF model for transport aircraft achieves 60% laminar flow on the upper surface of the aft element and 100% on the lower [28]. Therefore, the entire SNLF airfoil reaches around 90% laminar flow on its surface. Thus, the SNLF airfoil concept provides lower wing-profile drag and higher maximum Cl while preserving the conventional airfoil shape.
The NASA CRM.65 is used to compare the performance improvements of the SNLF airfoil to a single-element airfoil. The design conditions of the NASA CRM.65 were M = 0.85, Cl = 0.50, and Re = 30 × 106, similar to the suggested design conditions for the TTBW [29]. Therefore, the CRM is a reasonable benchmark against which the improvements provided by the SNLF can be measured. An aerodynamic figure of merit (FOM = ML/D) based on the Breguet range equation (an equation used to predict the range of an aircraft based on aerodynamic efficiency and fuel consumption) was calculated for 3 airfoils [15]. The airfoil specifics are: (1) The S207 SNLF airfoil with a Re and M equal to 13.2 × 10⁶ and 0.7–0.71, respectively, (2) the NASA CRM.65 with free transition (i.e., the transition location between laminar and turbulent flow is not specified), providing a direct comparison with an identical Re and M = 0.74, and (3) the NASA CRM.65 with the transition fixed (i.e., the transition location is predicted and set in the computational software) on the leading edge, fully turbulent, with an identical Re and M = 0.725. The S207 SNLF achieved a ML/D of 178–167 for the M range investigated. The NASA CRM.65 achieved a ML/D of 123 and 64 based on the free transition or fully turbulent model, respectively. Therefore, the S207 SNLF demonstrated an increased FOM of 44% relative to the free transition NASA CRM.65, and an increase of 178% relative to the fully turbulent model.
Figure 4 compares the single-element NASA CRM.65 airfoil with the two-element S207 SNLF airfoil at cruise conditions. The S207 airfoil’s aft element produces a considerable amount of lift during cruise while the trailing edge of the single-element airfoil displays little to no lift. The result of employing a two-element airfoil is that the aft element produces higher lift as it recovers the free-stream pressure.
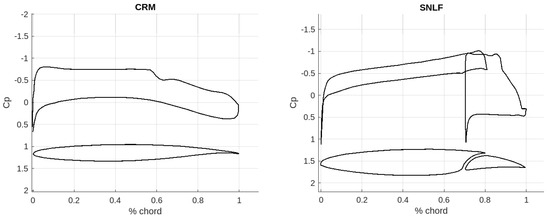
Figure 4.
Comparison of a single-element airfoil, NASA CRM.65 (left), to a slotted airfoil, S207 (right). Graphs depict the Cp of the two airfoils. (Graph reproduced from [29,30]).
3. SNLF Airfoil Development Progression
The six SNLF airfoil models to date (Figure 5) were developed following the timeline shown in Figure 6. Table 2 summarizes their designations and performance metrics. Each version is discussed below.
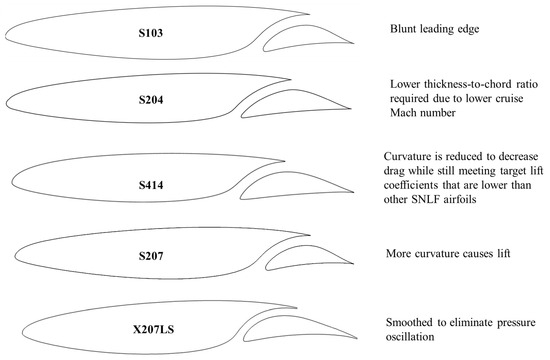
Figure 5.
SNLF airfoil shapes (cross-sections reproduced from [15,16,24,25,31,32]).
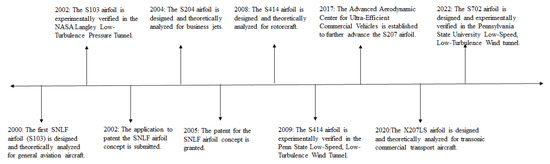
Figure 6.
SNLF airfoil development timeline (dates reflect when results were published).
Table 2.
Theoretical and experimental performance metrics of SNLF airfoil models.
3.1. S103
The first SNLF airfoil (S103) was developed for general aviation applications, specifically low-speed aircraft [24]. The primary design objectives were to reach a Cl ≥ 1.72 at Re = 3 × 10⁶ and to achieve a low-profile, local drag coefficient (Cd) in the operating range of Cl = 0.20 at Re = 9 × 10⁶ to climb Cl = 1.00 at Re = 6 × 10⁶. Design optimization was performed using a multi-element, Multidisciplinary Simulation Environment for Spacecraft (MSES) code [25,34]. This design methodology for multi-element airfoils divides the process into smaller optimization cycles, allowing the isolation of varying functions and exploration of flow field response to design changes. MSES is used to design all of the SNLF airfoils due to its ability to handle multi-element airfoils, unlike solvers such as XFOIL [35] and PROFIL [36], which are limited to single-element airfoils. However, one crucial limitation of MSES is that it cannot account for transitional effects in dynamic stall predictions or boundary-layer instabilities such as Görtler instabilities [37].
Wind tunnel tests were conducted in NASA LaRC’s Low-Turbulence Pressure Tunnel to evaluate the S103 performance in 2002 [24]. Figure 7 shows the pressure distribution at cruise relative to the cross-section at Re = 9 × 10⁶ and M = 0.10, and Figure 8a provides a comparison of the pressure distribution between theoretical and experimental results at Re = 3 × 10⁶, M = 0.10, and angle of attack (α) = −1.07° in the transition-free state (i.e., transition was not fixed to the leading edge of the fore element). A minimum pressure occurs near the trailing edge on both the upper and lower surfaces of the fore element, indicative of a favorable pressure gradient over the entire fore element. Pressure recovery occurs over the aft element. The wake of the fore element does not impinge on the aft element, and therefore the aft element also exhibits laminar flow over a large extent of the surface area. The theoretical results agree with the experimental data.
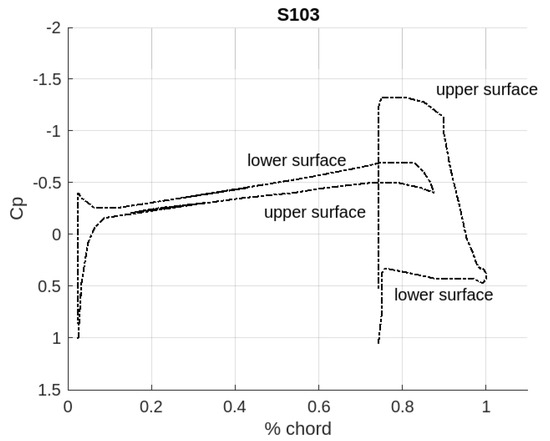
Figure 7.
Pressure distribution over the S103 airfoil at the design point (cruise). (Graph reproduced from [24]).
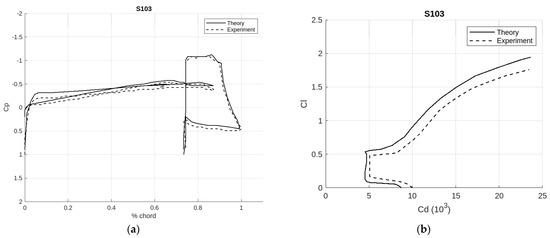
Figure 8.
Comparison of theoretical and experimental results for the S103 airfoil at Re = 3 × 10⁶, M = 0.10 in the transition-free state. (a) Pressure distributions along the cross-section for α = −1.07°. (b) Cl vs. Cd (Graph reproduced from [24]).
Figure 8b shows the section characteristics at Re = 3 × 10⁶ and M = 0.10. While the experimental data showed higher Cd and lower Cl values than the computational predictions, the test data demonstrated that the S103 exceeded the design target with a maximum Cl = 2.00. The S103 exhibited a rapid stall at α = 17° when the lift decreases rapidly. The stall exhibited a sharper decline in the experimental test than predicted by MSES. Thus, the S103 did not meet the airfoil’s goal of minimal and docile stall characteristics. The local pressure coefficient (Cp) magnitudes are overpredicted by the computational method, but the computational results showed improved agreement with pressure gradients across multiple α. The airfoil exhibited favorable pressure distributions and section characteristics. The S103 has a 12% higher maximum Cl and a 7% lower Cd when compared to the NLF(1)-0215F [38] at a flap deflection of 10°. It should be noted that the MSES code does not account for Görtler instabilities. These instabilities are expected to cause transition in the concave region of the lower surface of the fore element.
3.2. S204
The S204 airfoil succeeded the S103 and was conceptualized for business-jet applications [16]. The design objectives were to achieve (1) a maximum Cl = 1.55 at M = 0.10 and Re = 3 × 10⁶ (corresponding to the tip chord at a minimum velocity), (2) low profile-drag coefficients at Cl = 0.20, M = 0.65, and Re = 12 × 106 (corresponding to the root chord at cruise condition), and (3) a Cl = 0.40 at M = 0.30 and Re = 12 × 106 (the root chord at climb condition). A goal was to prevent the maximum Cl from decreasing with fixed transition near the leading edge, while also displaying docile stall characteristics. Concurrently, relative insensitivity to roughness was an additional goal. While the airfoil thickness was originally intended to equal 15% of the chord, the final design was 14% to account for the lower M at cruise for business jets.
While the S204 has not been experimentally evaluated to date, design and analysis was conducted using the single-element, Eppler Airfoil Design and Analysis Code [39] as well as the multi-element, MSES code. Figure 9 shows the theoretical pressure distribution at the cruise condition. Figure 10 provides the theory-based transition locations and section characteristics predicted at M = 0.1 and Re = 3 × 10⁶ (transition-free case). The theoretical results show that the laminar flow extends to the trailing edge on both surfaces of the fore element, 60% chord on the upper surface of the aft element, and the trailing edge on the lower surface of the aft element. As for the section characteristics, the lift-curve slope, minimum Cd, the width of the low-drag range, and magnitude increase in the pitching-moment coefficient all generally increase with M. The maximum Cl increases with Re, while the minimum Cd and width of the low drag decrease with increasing Re. A maximum Cl = 2.13 was predicted, exceeding the design objective. Additionally, there was an approximate 1% decrease in maximum Cl between the transition-free and transition fixed as well as the demonstration of roughness insensitivity at the leading edge.
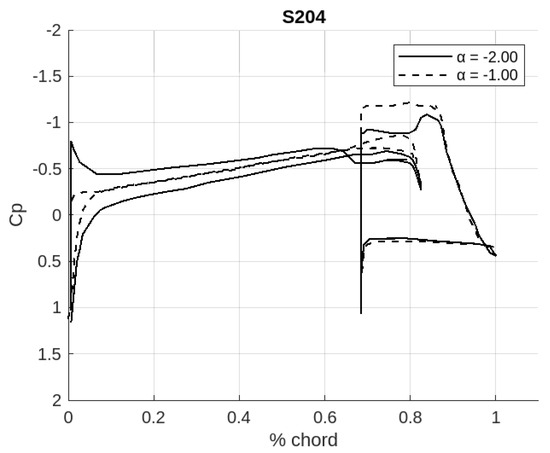
Figure 9.
Theoretical S204 pressure distribution at M = 0.65, Re = 12 × 106, and α = −1° and −2° (cruise). Graph reproduced from [16].
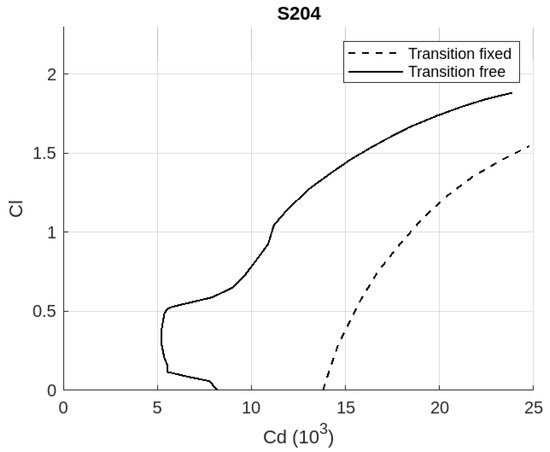
Figure 10.
Theoretical S204 transition locations and section characteristics at M = 0.1 and Re = 3 × 10⁶ (transition-free state). (Graph reproduced from [16]).
3.3. S414
Shortly after the SNLF airfoil patent was granted to Somers in 2005, he began designing the third SNLF airfoil model (S414) to reduce the blade profile drag for helicopters and rotorcraft [33]. The overall goal was to maximize the rotor L/D ratio by increasing the section maximum Cl to delay the stall-flutter on the retreating blade while simultaneously reducing the cruise section profile Cd to decrease drag on the advancing blade. The two primary design objectives were to achieve a maximum Cl = 1.25 at M = 0.3 and Re = 0.97 × 10⁶ and to obtain low profile-drag coefficients from a Cl = 0.10 at M = 0.70 and Re = 22.6 × 10⁶ to Cl = 0.65 at M = 0.45 and Re = 1.45 × 10⁶. The design specifications require that the airfoil should not exhibit strong stall characteristics, the thickness should equal approximately 14% of the chord, and the maximum Cl should not experience a significant decrease with transition fixed on the leading edge of both surfaces. The S414 was analyzed using the Eppler code for designing the initial fore and aft elements. The MSES code was later used to refine the fore element. While the lower limit of the low drag (at Cl = 0.1) was higher than the goal, the other characteristics aligned with the objectives and constraints.
In 2009, the S414 was experimentally tested through a series of wind tunnel tests in the Pennsylvania State University Low-Speed, Low-Turbulence Wind Tunnel (LSLTT) [25]. Additional computational fluid dynamics (CFD) analysis was performed using NASA’s OVERFLOW CFD solver [40] and the results were compared with the experimental data and MSES predictions. Figure 11 provides a comparison of performance predictions generated with MSES and OVERFLOW to the wind tunnel results at Re = 1.5 × 10⁶. MSES and OVERFLOW results are in general agreement, with the largest discrepancy observed on the Cl vs. Cd plot (Figure 11b). MSES is a flow solver that predicts the aerodynamic behavior of airfoils based on the Euler equations. OVERFLOW is a 3D Reynolds-averaged Navier–Stokes (RANS) solver that employs structured overset grids to predict fluid flow. While MSES and OVERFLOW are both uniquely able to analyze multi-element airfoils, MSES performed notably better than OVERFLOW, specifically for the drag polar predictions. OVERFLOW does not model laminar-turbulent transition and thus cannot capture the sharp corners on the drag polar, so it cannot provide well-defined drag limits or detect rapid changes in drag. Similarly, OVERFLOW significantly over-predicts the low-drag range coefficients [37]. Thus, the overall versatility of MSES proved better than OVERFLOW for the theoretical aerodynamic analysis of the S414 airfoil.
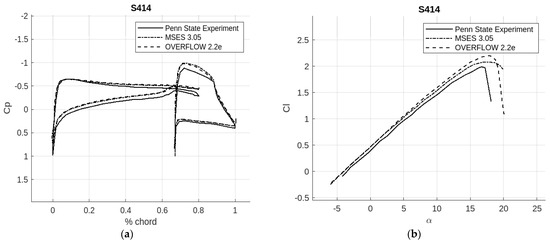
Figure 11.
(a) Comparison of theoretical and experimental pressure distributions at Cl = 0.518 and Re = 1.51 × 10⁶. (b) Comparison of predicted and measured section characteristics for Re = 1.51 × 10⁶. Reproduced with permission from Ref. [25], James G. Coder, Mark D. Maughmer, and Dan M. Somers.
There are significant differences between the computational and experimental pressure distributions on the aft element. The cause may be that both computational approaches were based on the average Cl of the fore and aft elements obtained from the experimental testing instead of accounting for the individual Cl of each element [37]. Additionally, the computational methods overpredict the maximum Cl and the lift-curve slope. Another major discrepancy to note is that neither MSES nor OVERFLOW predicted the appearance of a “horn” that consists of a significant drop in drag coefficient in the lower limit of the low-drag range. This horn is likely the result of an interaction between the wake off of the fore element and the laminar separation bubble that appears on the upper surface of the aft element [37].
For the section characteristics, the experimental results indicate that the lift-curve slope and maximum lift values are directly proportional to Re, whereas the extent of the low-drag range is inversely proportional to Re. However, unusual shapes were observed at lower Re. Specifically, a laminar-separation-bubble effect caused a higher drag than expected in the low-drag range. Additionally at the lower limit of the low-drag range, the Cd dropped significantly at Re = 0.7 × 10⁶, creating the “horn” shape previously discussed.
3.4. S207
The S207 is designed for a transonic, transport aircraft. The primary objectives of its initial design were to achieve a maximum Cl = 2.30 at M = 0.225 and Re = 16.0 × 10⁶, as well as to obtain low profile-drag coefficients over the range of Cl = 0.39 to 0.65 at M ≥ 0.660 and Re = 13.2 × 10⁶ [15]. The pressure distributions over the S207 airfoil predicted by MSES at M = 0.71 and Re = 13.2 × 10⁶ for Cl = 0.39, 0.65 and 0.78 are shown in Figure 12. Cl = 0.39 and 0.78 represent values close to the lower and upper limits of the low drag range. As Cl increases, the pressure gradient on the upper surface becomes less favorable and the pressure gradient on the lower surface becomes more favorable. Increasing Cl exhibits minimal effect on the pressure distribution over the aft element, consistent with observations for previous SNLF airfoils.
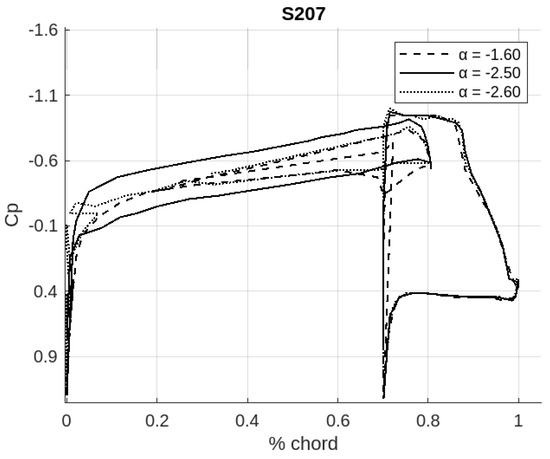
Figure 12.
S207 airfoil pressure distributions at M = 0.70 and Re = 13.2 × 10⁶ for α = −1.6°, −0.7°, and −0.6°. (Graph reproduced from [30]).
As for the boundary-layer transition within the low-drag range, the airfoil achieves complete laminar flow on both surfaces of the fore element, 60% laminar flow on the aft element’s upper surface, and laminar flow all the way to the trailing edge on the lower surface of the aft element. The results of the computational analysis indicate that for the design M = 0.7, significantly low levels of Cd (<0.003) are predicted in the low drag range. There is almost no wave drag for M = 0.66 and 0.7. Upon increasing M, however, drag divergence is apparent as wave drag becomes a significant portion of the total drag, even in the low drag range. An estimated impact of Görtler instabilities was determined by tripping the boundary layer at the entry of the slot on the lower surface of the fore element. While there is minimal variation in Cl, the Cd increases by around 17% in the low drag range. After accounting for the Görtler instabilities, the S207 airfoil met or exceeded the design objectives.
3.5. X207LS
The S207, designed for transonic conditions, produces significantly different pressure distributions and boundary layer characteristics when tested at low speeds [31]. Therefore, the X207LS airfoil was created as a low-speed surrogate of the S207 airfoil to enable testing in a low-speed wind tunnel. While CFD simulations and boundary layer analyses account for stationary crossflow instabilities within low intensities, the experimental test environment may prove too noisy to observe and verify boundary layer predictions. The X207LS shape was designed by mapping transonic pressure gradients to an equivalent low-speed airfoil. First, an inverse design method based on conformal mapping was utilized to develop a single-element airfoil for low speeds. This single-element airfoil was then modified to a slotted configuration. Designed to replicate the pressure distribution as produced by S207 at M = 0.7 and Re = 13.2 × 10⁶, the X207LS also required a reduced Cl = 0.45 (as compared to Cl = 0.65 for S207) to prevent wall separation issues.
The major differences from the S207 are that the leading radius of the X207LS is 0.958% chord (compared to the S207 radius of 1.068% chord) and the entire X207LS was smoothed to avoid a pressure oscillation. MSES predicts the maximum Cl ≥ 1.8 for the given Re range, with the pitching moment coefficient showing low sensitivity to the Re. The low-drag, Cl range, decreases with increasing Re. The pressure gradients are favorable along the entire upper surface of the fore element and up to the slot entrance for the lower surface of the fore element, resembling the S207 pressure gradients. Therefore, the X207LS is considered an acceptable surrogate model of the S207 that mimics similar behavior under low-speed, low M conditions.
3.6. S702
The S702, designed for a low-speed, fixed-wing aircraft, is the first of the SNLF airfoils to incorporate a simple flap onto the aft element [32]. The design goals include using the flap to shift the low-drag range to lower Cl with negative deflections, and higher Cl with positive deflections, as well as utilizing the flap as a control surface. The primary objective was to achieve a maximum Cl = 2.00 for Re = 0.29 × 10⁶ to 0.91 × 10⁶. The Eppler code was used to develop the initial shapes while the MSES code was used to refine the fore element shape and predict performance.
The S702 airfoil was experimentally tested in the LSLTT for four flap configurations with deflections = 0°, −2°, 5°, and 10°. As α increases from −7.13° and to 1.01°, the pressure gradient on the lower surface begins adversely but becomes neutral to the trailing edge of the fore element, demonstrating laminar flow. The pressure gradient of the upper surface of the fore element is initially favorable and becomes neutral around 65% chord. The adverse pressure gradient at the aft is unfavorable but not enough to cause boundary-layer transition. As α is further increased to 16.18°, trailing-edge separation occurs on the upper surface of the fore element around 50% chord and moves forward as α increases, but leading-edge stall does not occur. The S702 airfoil achieved the primary objectives of high maximum Cl and low-profile Cd, and although stall occurs, the characteristics are less abrupt than the previously designed SNLF airfoils, demonstrating improved performance.
4. S207 Advanced Research
Substantial research was performed through NASA’s University Leadership Initiative (ULI) Advanced Aerodynamic Design Center for Ultra-Efficient Commercial Vehicles to advance the S207 towards integration with a TTBW for implementation on a commercial aircraft [41]. This holistic research program included aerodynamics simulation, wind tunnel testing, structural analysis, acoustics evaluation, propulsion effects investigation, stability and control analysis, and exploration of advanced technology. A summary of the S207 advanced research topics and citations for additional information is provided in Appendix A.
4.1. Aerodynamics Simulation
Computational simulation was performed to evaluate the aerodynamic performance of a TTBW aircraft with an SNLF airfoil. Initial two-dimensional (2D) analysis of the S207 was performed using a Reynolds-Averaged Navier–Stokes solver (RANS) [42] with the flow solvers NSU2D (Navier–Stokes Unstructured 2D) and NSU3D (Navier–Stokes Unstructured 3D) [43,44]. The S207 was analyzed at free transition, and the drag counts were 31.8 at Cl = 0.658, which is lower than the upper Cl limit of the drag bucket. This free transition modeling aligned with design data and demonstrated that laminar flow is achieved on the fore element and through the slot. Transition occurs at 87% of the chord length on the upper surface of the aft element. Next, three-dimensional (3D) analysis of the S207 TTBW aircraft configuration was performed using both fully turbulent and free transition conditions at Re = 1.4 × 10⁶/ft and the wing’s mean aerodynamic chord (MAC) = 8.786 ft. Results simulated at M = 0.5 and M = 0.7 included the wing’s friction drag and drag polars. In the transitional runs, a low-drag bucket formed between α = 0° to 3°, whereas the turbulent runs exhibited relatively flat drag profiles. The favorable pressure gradient predicted by the 3D analysis is less than that predicted by the 2D results, especially for the inboard sections, indicating that inboard airfoil sections should be modified. While no shock was observed in the results, transition occurred further upstream than the initial design predictions. Therefore, the origin of the early transition requires further investigation.
To overcome the SNLF airfoil’s abrupt stall characteristics, a computational analysis was performed to investigate the potential of the aft element to act as a high-lift device [45]. Four configurations were investigated: a baseline S204 aft element, a deflected aft element or Fowler flap, a deflected micro-flap, and both a combination of Fowler flap and micro-flap. Computational simulation was performed with the structured, overset grid solver NASA OVERFLOW V.2.2n, a RANS-based approach, to determine the integrated lift forces. Figure 13a shows off-the-surface separation, where the off-surface wake from the fore element suddenly appears to thicken above the wake of the aft element. In Figure 13b, with the α increased to 16°, the flow is shown to be fully separated. Thus, at higher α values, additional work is needed to improve the subsequent drop in the maximum Cl. It was concluded that a constant slot width is optimal for maximum efficiency of microflap deflections. Additionally, deflecting the microflap downwards rather than upwards provides increased microflap lift. A Fowler flap resulted in a higher maximum lift at a lower α, and a simple flap also provided an improved Cl with potentially less abrupt stall characteristics. Thus, high-lift devices have the potential to increase the fuel efficiency of the SNLF airfoil.
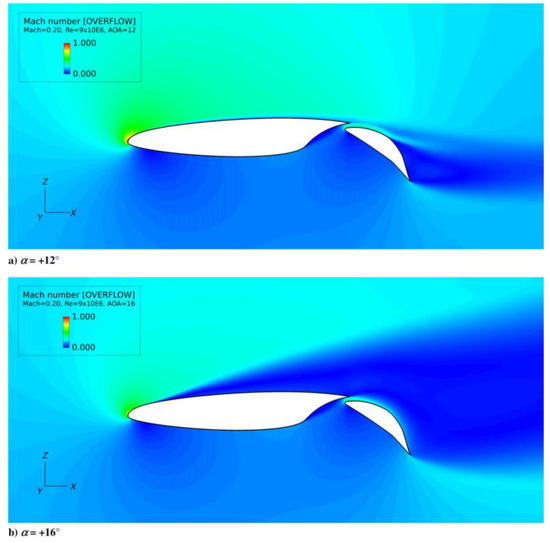
Figure 13.
Mach number contours with the Fowler flap deflected + 40° and microflap deflected + 10°. Reprinted with permission from Ref. [46], 2022, Hector D. Ortiz-Melendez and James G. Coder.
Investigation of high-lift systems with a leading-edge device was performed with the goal of alleviating abrupt stall characteristics [47]. The first of the two leading-edge devices evaluated are a morphing leading edge (MLE), which thickens the leading edge to increase the radius and reduce the undesired stall characteristics. An MLE presents a tradeoff because a larger radius could result in instability stemming from attachment-line contamination. The second option, a drooped leading edge (DLE), consists of a flap-like nose droop to prevent stall from occurring by maintaining the laminar flow. Five configurations were investigated: the S207 with a stowed aft element as the baseline, two airfoils with a deflected DLE (one located at 10% chord and the other at 20%), and two with a deflected MLE (one at 10% chord length and the other at 20%). Computational simulation was performed to evaluate the aerodynamics at different angles of incidence using a 2D RANS computational procedure in OVERFLOW and to predict S207 SNLF airfoil performance in different high-lift configurations. The best performance was observed with an MLE and Fowler flap deflection, where maximum Cl performance was higher, and the stall was more controlled and smoother. The change in Cl was +1.68 and the stall was delayed to an α up to 3°. When stall occurred, it remained sudden relative to the baseline, indicating future work is needed to improve the consequences of stall behavior. However, delaying the stall α is beneficial, by providing a larger range of operational α, improving the overall high-lift performance.
Additional aerodynamic analysis of the S207 airfoil was performed under varying load conditions at cruise conditions (Figure 14). Computational simulation using NSU2D predicted a cl = 0.6505 at M = 0.7, α = −1.3, and Re = 13.2 × 10⁶, consistent with design specifications and published results [15]. However, a Cd = 0.0032 was predicted that exceeded the low-drag profile target value of 0.0027. Several analyses were performed to evaluate the agreement between MSES and NSU2D. Run 1 was simulated at the same M, Re, α, and Ncrit = 19.2 (the value at which the maximum amplification ratio of an instability is reached). Run 2 was simulated with Ncrit = 9.0, and Run 3 contained Run 2 as an initial condition while maintaining the same flow conditions. Additional analysis of the transition behavior models established reasonable agreement between MSES and NSU2D [48], predicting similar Cl and Cd values, as well as relatively accurate transition locations. However, the transition location on Run 3 was predicted to be the entrance of the slot on the lower surface of the fore element, which is far from the designed location and indicates insufficient convergence of the solution.
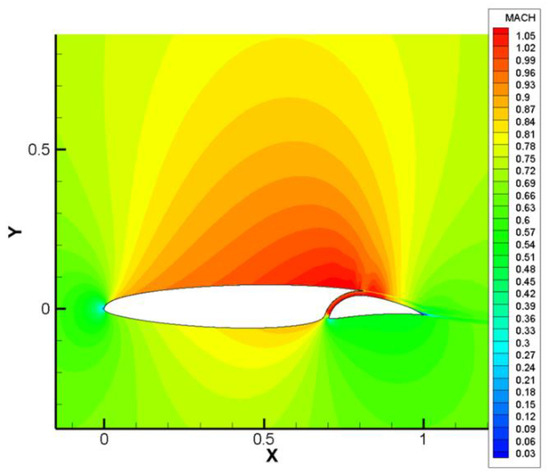
Figure 14.
Mach flow field of S207, SNLF airfoil (image provided courtesy of the Mavriplis CFD lab).
Furthermore, this study included 3D computational analysis of an integrated SNLF TTBW aircraft based on the Boeing SUGAR High aircraft [48]. The Two-Equation Amplification Transport (AFT2) model was used, because the single-equation Menter model is limited in its ability to analyze high Reynolds numbers. The simulation was run using the parameters of M = 0.7273, α ranging from −1.0 to −2.5, Re = 12.3 × 10⁶, and Ncrit = 8.4. The results indicate that when the wing is modeled as free transition rather than fully turbulent on the lower surface, representing leading-edge tripping, higher Cl and lower Cd values are predicted. Additionally, there is a greater amount of laminar flow on the upper and lower surfaces for lower α, aligning with expected behaviors. A wind tunnel simulation was conducted using NSU3D-AFT2-SA for M = 0.7, α = 0, and Re = 12 × 106 with the predicted Cl = 0.3611 and Cd = 0.0335. The predicted transition location was at 40% chord length, signifying more significant turbulent flow than demonstrated during the experimental wind tunnel tests at NASA Ames. While insight into the transition behavior for the SNLF airfoil and SNLF TTBW aircraft was gained, future work is necessary to improve the robustness of free transition RANS models for better alignment between computational predictions and experimental results.
Another simulation technique to evaluate and optimize SNLF airfoils is to identify and decompose the types of aircraft drag [49]. A method based on partial-pressure fields in compressible flow calculations was explored. The application of Euler (inviscid) and dissipative (viscous) partial-pressure fields in the compressible Navier–Stokes equation was found to increase solution robustness and accuracy. This solution method can lead to a greater understanding of the contributors of drag to minimize drag and provide resolved surface-pressure contours to enable future high-performance adjoint-based optimization.
4.2. Wind Tunnel Testing
Experimental testing of the S207 was performed in the NASA Ames Unitary Plan Wind Tunnel (UPWT) 11-ft transonic test section Figure 15 [50]. Primary objectives included S207 technology demonstration, airfoil viability evaluation, identification of the instabilities that cause laminar-turbulent transition, and compiling a database of physical test data for CFD validation. The S207 test article was a semi-span airfoil that was untwisted, constant-chord, and constant-sweep consisting of a steel fore element and an aluminum aft element. Early design considerations highlighted that the connection between the fore and aft elements was critical in maintaining the slot during cruise. A lower-surface bracket design was selected based on cost and ease of connection while concurrently attempting to limit the disturbance to the laminar flow through the slot. This connector design required spacers in the slot to prevent slot collapse.
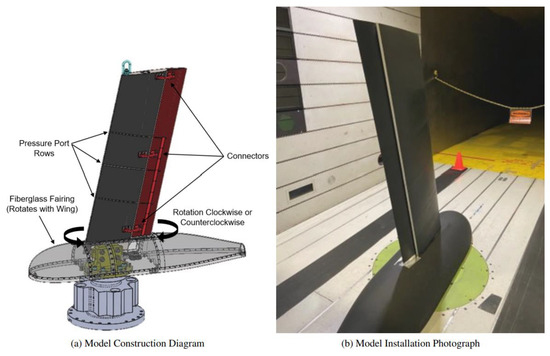
Figure 15.
(a) SNLF wind tunnel model, (b) installed for testing in the NASA Ames transonic wind tunnel. Reprinted with permission from Ref. [48], 2023, American Institute of Aeronautics and Astronautics.
There were two test configurations for the aft element: nominal position at cruise and a high-lift position with the aft translated and deflected as a Fowler flap. The cruise design conditions for the wind tunnel operating conditions were M = 0.70 and Re = 13 × 106, similar to the design cruise conditions of the Boeing SUGAR High TTBW aircraft design, a regional to medium class aircraft [3]. Due to load limits, the maximum α = 5°. Additionally, the 20° deflection the aft element during testing was much higher than the predicted maximum deflection. The justification was to prioritize the demonstration of high-lift while preventing excessive separation on the aft element. The rake was only able to measure total pressure with no reference static pressure. Therefore, the data could not be reduced to drag coefficients. One last challenge of the test campaign was ensuring a smooth, clean surface for the fore element, which was deteriorating as the test continued and due occasional debris strikes. An additional localized roughness was created (to remedy the deteriorating surface) which induced boundary-layer transition, a notable divergence from the predicted results.
Figure 16 shows the infrared (IR) thermography results visualizing the flow on the upper surface of the wing, Figure 16a captures the flow for M = 0.699, Re = 12.93 × 10⁶, and α = −0.002, and Figure 16b illustrates the flow for M = 0.701, Re = 12.95 × 10⁶, and α = −1.000 [48]. From the images, it is clear that distinct lines are visible in Figure 16b that are not seen in Figure 16a, indicating that the configuration and flow conditions of the wing in Figure 16a are conducive to the production of large regions of laminar flow on the upper surface, as designed. By observing the lift and drag force data collected from the experiment, there is both the expected trend of increased lift with increased M and the unexpected trend of increased drag coefficient with increased M. The study hypothesizes the cause for the latter observation could be that the fairing caused shockwaves at lower M. Overall, the experimental results confirmed the predicted performance: (1) there is a reduced amount of drag accompanying the laminar flow, (2) aft element deflections led to higher lift as demonstrated in the high-lift configuration, and (3) that abrupt stall occurs, although the stall is lessened at increased M.
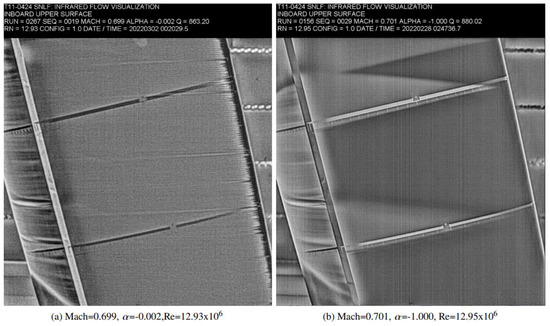
Figure 16.
Infrared flow visualization images of flow moving on the upper surface of SNLF wing near the fairing. Reprinted with permission from Ref. [48], 2023, American Institute of Aeronautics and Astronautics.
Additional experimental testing was conducted in the Klebanoff-Saric Wind Tunnel (KWST) at Texas A&M University on the X207LS [51]. Selected instability mechanisms were excited and observed. Computational analysis was performed by generating the laminar flow over the wing using pressure coefficients obtained from an inviscid code as input into a boundary-layer solver called Digits by Ethan, Koen, Alex and Fernando (DEKAF) [52]. A strong correlation between the simulated and measured streamwise vortices was observed, with concern of possible errors in assuming that the mean-flow-distortion’s α(0,0) = 0 in the simulation. Future work can further detail the amplitudes of the crossflow disturbances and OVERFLOW simulations may better quantify the flow.
4.3. Structural Analysis
While high-lift aft loaded surfaces are not novel, the slot between the fore element and the high-lift aft element introduced a new challenge in how to transfer the load from the high-lift aft element to the fore element while ensuring the slot does not collapse and the aerodynamic benefits are maintained. The slot creates a ‘floating’ aft element that is not connected to the fuselage and must be supported by the fore element’s rear spar. The desired shape, location, and number of slot connectors were investigated to transfer the high-lift aft element load to the fore element while minimizing the disturbance on the aerodynamic performance [53].
An initial analysis focused on the general shape and location. Structural analysis and CFD were employed to evaluate eight similar cross-section shapes and locations for stress, aft element deflection, and disturbance on the local laminar flow. It was concluded that a more streamlined shape located within the slot was preferred for both structural and aerodynamic performance. Figure 17 illustrates the separation of flow quantified by the coefficient of friction variation across the surface of the aft element. A smaller disturbance to the local laminar flow was observed with an internal slot connector. The general shape of the slot connectors was a symmetric shape based on the NASA CRM.65 Blunt, with mirrored upper surface and no camber, to reduce the impedance on the local laminar flow. The adjusted slot connectors allowed for a simplified structural design in both analysis and production aspects while providing symmetry of flow effects around the slot connectors. Further investigation of the slot connectors optimized placement within the slot in the middle-upper region, controlled by the yield limit and the deflection of the aft element (Figure 18).
Figure 17.
Top, separation of flow; bottom, Eddy viscosity ratio displaying the difference between sections with no connector, an external connector, and an internal connector. (Image provided courtesy of Dr. Doug Stefanski).
Figure 18.
Left, slot connectors placed in various regions of the slot for the SNLF airfoil; right, adjusted CRM.65 blunt with camber removed and mirrored upper surface [53].
An investigation was then performed to investigate the half-span flutter stability of the airfoil including the effects of the connectors on the modes [54]. It was concluded that nine connections were required to support the flutter stability between the fore and aft elements. Subsequent structural analyses were based on nine slot connectors of various sizes calculated by tributary load, fabricated with Ti-6Al-4V, and placed near the upper-middle region of the slot. As the slot connectors are transferring the high-lift load from the aft element, it was crucial to understand the optimal structural density in the aft element. A topology optimization within Abaqus CAE [55] was performed at the cruise condition. The outer mold line (OML) was held constant with a 0.15” perpendicular thickness to model the skin of the aft element. This thickness was selected as the minimum specified skin gauge for the Boeing SUGAR HIGH while allowing the topology optimization to inform where additional thickness was required [56].
The internal elements acted as the design space and were controlled by the object function and two constraints. The object function optimized the strain energy, and the constraints were a percentage of material density (<10%) and the general displacement of the aft element’s OML. Due to Abaqus CAE’s limitations only 500 nodes could be set to control the displacement constraint and several nodes at the mid-span between each slot connector were utilized to prevent displacement of the aft element ≥ 0.1 inch. The primary finding was that no spar formed in the design space. Because the aft element is ‘floating’, the high-lift load is required to transfer through the slot connectors alone. Thus, reinforced ribs are required underneath each of the nine slot connectors. Additionally, increased stiffness on the trailing edge was identified and could be optimized with thicker skin gauges or stringers through a weight study.
4.4. Acoustics Evaluation
Aero-elastic instability arises from the interactions of inertial, elastic and aerodynamic forces on the wing. These instabilities are characterized as either static or dynamic. Divergence is a static instability that occurs at high angles of attack, when the elastic twisting moment is no longer sufficient to counterbalance the aerodynamic pitching moment. The consequences include loss of aerodynamic efficiency and high risk of structural failure. Flutter is a dynamic, oscillatory instability that can be triggered by any external perturbation (e.g., gust, sudden change in angle of attack) on the wing and can cause structural failure. An investigation into the aero-elastic behavior of flutter mitigation of multi-element wings was performed, with a focus on the aero-elastic stability of the strut-braced SNLF wing.
A beam-rod aero-elastic framework in modal space was developed with static equilibrium calculation and time-marching solution capabilities [57]. The aerodynamics are based on Theodorsen’s theory for two aerodynamically independent flat plates. The two elements are structurally coupled with springs. The component mode synthesis method is employed to study the effects of varying connection stiffnesses and locations. The mode shapes are obtained by performing a frequency analysis of a three-dimensional finite element model of the SNLF wing using the commercial software ABAQUS V.6.19. The wing model was developed to include structural reinforcement while preserving the aerodynamic shape of the wing. The first four torsion, vertical bending, and chordwise modal behaviors were obtained for the wing. A key takeaway from the results of the flutter stability analysis is that the rate of increase in the vertical bending mode is larger when the wing is forced to balance the weight by producing the respective amount of lift. Therefore, coupled torsion and bending stability are more likely to occur at lower speeds. Future work includes improving the aerodynamic model to capture the fore-aft element interactions in the aero-elastic calculation tool.
4.5. Propulsion Effects
The engine location on the wing affects the interaction of propulsive and aerodynamic forces acting on the aircraft, more specifically known as propulsion airframe integration. This integration is vital because an undesirable interaction of forces can lead to an increase in interference drag, or the drag produced by the connection of the engine to the wing, hence decreasing the fuel efficiency of an aircraft. A high bypass ratio turbofan engine was chosen for evaluation due to the increased efficiency that stems from the increased thrust produced by the fan, which in turn means less fuel consumption [58]. The study utilized OVERFLOW to simulate the engine and analyze the mass flow in different parts of the engine, as well as to simulate the S204 and S207 SNLF airfoils in varying proximities of the turbofan engine. The results indicated that the optimal location for the investigated flight conditions was to attach the engine under the wing on the leading edge. However, when considering minimal interference drag, a location the trailing edge under the wing was preferable. Further propulsion airframe integration research is a clear path towards ensuring that the benefits of the SNLF airfoil are maximized for increased aircraft fuel efficiency.
4.6. Stability and Control
Morphing control surfaces can provide the aerodynamic benefits of slats and flaps without the surface discontinuities that result in undesired aerodynamic behavior and losses. Specifically, airfoil camber morphing can be achieved with surface bonded piezocomposite actuators without the need for deployable control surfaces. In this context, a study was performed on the capabilities of piezoelectric camber morphing of the SNLF airfoil and its viability as a replacement for traditional control surfaces [59]. After an initial model was conceptualized, evaluated and optimized, a protype was manufactured and tested to determine deformation characteristics. The results from the benchtop and wind tunnel testing demonstrated that while the lift was slightly lower than the theoretical flow solver estimate, there was agreement in the airfoil’s capacity to consistently modify lift throughout all α. Furthermore, the full-scale design was optimized using a commercially available induced-strain piezocomposite actuator. The intent of the optimization was to maximize Cl and minimize aerodynamically induced deformation. When testing the induced-strain actuator with the S207, tests showed that the substrates of the airfoils were thick enough to passively resist aerodynamically induced bending while maintaining lift-enhancing morphing capabilities, satisfying the objectives. Future work is needed to quantify the camber-morphing capability as a function of chord and to determine if the performance of the actuator sufficiently satisfies the design criteria.
Active flow control was also considered to recover the shortcomings of SNLF airfoil performance while also meeting the surface constraints for laminar flow [60]. Active flow control applied in the slot of a SNLF airfoil was analyzed using a modified version of OVERFLOW. A sensitivity analysis was performed on an S207 airfoil with a morphed leading edge to determine the effects of actuation ports based on the location, mode, and mass flow. Actuation ports, based on blowing and suction, were considered such that they are consistent with potential integration of flow control systems on future aircraft equipped with NLF wings. The results of the study indicated that blowing contributed significant improvement in L/D and minor improvement in Cl, whereas suction comparatively only exhibited a slight effect on the SNLF airfoil. Between the blowing actuation along the aft versus the fore element, there was a larger improvement in the maximum Cl and delay in stall for the blowing actuation along the fore element. The major limitation of this study is that the 2D simulations are restricted to a general prediction of the actuation performance, and further simulations and experimental testing on a representative SNLF wing will be required to better predict the improvements that actuation ports could provide to the SNLF airfoil.
4.7. Advanced Technologies
Blowing actuation was investigated and demonstrated significant improvements in the L/D along the range of α at each location considered with slight improvements in the Cl [60]. When positioned along the main element, implementation of blown actuation demonstrated larger improvements in the maximum Cl and slightly delayed stall. This behavior suggests that the boundary layer is being re-energized and active flow control is providing separation control. Suction actuation demonstrated little impact on the overall performance of the airfoil but is still important to quantify for integration in practical flow control layouts. The initial results are encouraging since an increase in L/D during take-off can lead to a shorter runway, longer range, and higher payload. Moreover, the takeoff and climb-out portions of the flight profile often determine the engine rating and thereby the engine core size. Therefore, applications that improve the L/D will enable a reduction in the engine core size, resulting in lower airplane weight and thus lower fuel consumption. Since 2D analysis only provides general guidance, implementation of these flow control systems on a representative SNLF wing will be required to establish more realistic objectives for an integrated flow control system.
A later study building off of the previous study’s findings analyzed unsteady blowing, which can match the natural instabilities in the boundary later to re-energize the boundary layer while offering improved actuation efficiency [61]. The three actuation techniques investigated through computational simulations are pulsed blowing, traverse actuation, and thermal actuation. The study consisted of 2D OVERFLOW simulations of an altered S207 airfoil with a blunted, drooped leading edge to model a future version of an integrated SNLF wing with advanced high-lift systems. It was shown that traverse actuation performed better than both steady and pulsed blowing at all mass flows up to 0.001. The traverse method consisted of a single jet traversing across the wing. However, in future studies, multiple traverse actuation methods should be studied to determine if the aerodynamic efficiency can be further improved. Additionally, the thermal actuation method was evaluated as a potential anti-ice system, and the results indicated a constant L/D under varying supply temperature ratios, which could replace the conventional source of hot air exhaust from the lower side of the leading edge. This replacement could ensure more efficient actuation while additionally rendering a smoother lower surface of the wing allowing for greater extents of laminar flow. While these results are promising, validating these actuation techniques in a wind tunnel test is critical to comprehensively understand the aerodynamic performance of an SNLF wing integrated with active flow control methods.
Excitation techniques such as plasma actuators and pulsed jets offer another option to improve the L/D by delaying separation and reattaching flow. A comprehensive review of research on flow separation control on lifting surfaces focused on two key parameters: momentum coefficient and excitation frequency [62]. The review examines how these factors influence shear layer and wake dynamics, with the goal of improving aerodynamic efficiency through enhanced lift, reduced drag, and optimized performance. The review highlights various unsteady excitation methods, such as pulsed jets, synthetic jets, plasma, and acoustic actuators, showing their potential to effectively control flow separation. Key findings suggest that increasing the momentum coefficient improves flow control, though benefits reach a saturation point, and excitation frequency plays a critical role in stabilizing flow reattachment. Additionally, high-frequency excitation delays flow separation by creating a favorable local pressure gradient, similar to the favorable pressure gradient created by the SNLF airfoil, indicating a reduction in air consumption while maintaining control benefits.
One example of such an excitation method is a vortex generator jet, which creates pulsations to stimulate additional vortices and increase flow mixing [63]. Applying this technology to a NASA SC(2)-0714 airfoil with a single-slotted flap, the key findings indicate a drag reduction ranging from 10.8% to 38% as well as a 53% increase in the suction peak of the flap. A similar study investigated the same airfoil, except with a slotted trailing-edge flap [64]. The study demonstrates that burst-modulated excitation combined with fast-switching solenoid valves significantly improves high-lift performance, resulting in a 12.6% increase in lift coefficient and a 19.8% decrease in drag coefficient. Vortex generator jets effectively prevent flow separation and enhance aerodynamic efficiency. The use of modulated pulsed jet excitation also reduces air consumption by half compared to simple pulsed jets, improving overall performance and energy efficiency.
Similar simulations on supercritical airfoils show that by providing actuated flow control over the airfoil, the separation is delayed and the suction pressure reduces along the trailing edge of the airfoil’s upper surface, resulting in increased lift [65]. The results show that low frequencies (F+ = 0.2, 1, and 1.2) enhance lift, while high frequencies (F+ = 12) reduce drag. The improvement in L/D was seen in all controlled cases, with the maximum increase being 28.62% at F+ = 1. Therefore, many positive enhancements could results from hybrid approaches to flow control and excitation techniques to further improve aerodynamic efficiency of an SNLF airfoil.
The potential of morphing airfoils was also investigated. One such study develops a double-slotted morphed flap for the NACA 4412 airfoil, which significantly enhances aerodynamic efficiency [66]. The flap design incorporates a morphable camber and two slots to reduce flow interference and improve performance. CFD simulations predict an 82.5% increase in maximum lift coefficient, a substantial reduction in drag, and a fivefold improvement in L/D compared to a traditional double-slotted flap. This morphed flap outperforms a conventional split flap with a 60° deflection, offering a 14% higher lift at a 30° deflection angle.
Another study investigated a morphing airfoil based on a NACA 0012 initial shape. Modeling and simulation was performed using an expanded Multi-Disciplinary Optimization (MDO) framework, including analysis of evolution of parameters throughout optimization iterations [67]. Simulations suggested the model-scale airfoil could control actuation authority while subject to large aerodynamic loads. Research continued with the theoretical examination of asymmetric full-scale airfoil sections. Initial simulations indicated morphing of full-scale airfoils with piezocomposites alone proved insufficient; however, morphing of individual sections of a slotted multi-element airfoil showed promising results [68]. Concurrently, the MDO framework was modified to include migration methods that improved convergence time by up to 90% relative to the previous framework. A prototype morphing aft element, was fabricated based on optimization results for maximizing Cl. This first prototype was testing through benchtop and wind tunnel configurations. Testing results were used to evaluate multi-element airfoils using the flow solver MSES [69]. Optimization results showed the overall effect of aft element camber-morphing on pressure distribution and critical polars [70]. The optimization framework was improved to include multi-objective optimization. A 178 mm chord second prototype airfoil was fabricated based on the optimization results for maximizing actuated coefficient of lift and minimizing the unactuated aerodynamic-induced deformations. Benchtop testing showed a strong agreement between the structural model and the experimental results for deformation. The prototype was wind tunnel tested at 40 and 50 m/s over a range of α and voltage values. Wind tunnel testing demonstrated lift modification by up to 10% of the nominal value with a high resilience to aerodynamic-induced deformation.
5. Future Goals and Conclusions
The SNLF airfoil provides reduced wing profile draft and optimized L/D and achieves nearly 90% laminar flow across its surfaces. Its implementation on commercial aircraft has the potential to contribute to NASA’s N + 3 goal to reduce fuel consumption by 70% during cruise conditions. While a promising technology, research and development is still needed to fully mature the SNLF airfoil for integration with a TTBW aircraft. The impedance caused by the structural components required to maintain the slotted design must be minimized through a coupled aerodynamics and structural analysis to optimize connector size, shape, and placement. Furthermore, integrating flow control systems with slot connectors could reduce overall complexity, streamline design, and improve ease of inspections. Recent advances in deep learning networks have proven effective in improving aerodynamic designs, including single-slotted airfoil flaps, morphing trailing edges, and rotor flaps, as well as identifying issues such as icing and overall aerodynamic response [71,72,73,74,75,76,77]. Future SNLF research should investigate the use of deep learning networks to more efficiently analyze how adjustments in slot dimensions, slot connectors, morphing leading edges, and other potential components would affect its overall aerodynamic capabilities. An extensive analysis on manufacturing tolerances and surface contamination and their reduction on the total percentage of laminar flow is vital to establish inspections, coatings, and cleaning schedules. Deep learning networks could substantially assist in these analyses. Moreover, a global sensitivity analysis of design parameters would benefit airfoil design by identifying those most influential on performance for detailed study and optimization.
There are some practical complications or drawbacks that could arise if the SNLF airfoil were to be fully integrated with commercial aircraft such as the Boeing TTBW aircraft or similar 150-passenger aircraft. The half-span of the SNLF airfoil is approximated to be 81 feet and 2.8 inches, which is longer than current commercial aircraft. Therefore, an aircraft with SNLF wings would have difficulty entering or exiting existing airport gates, or potentially not fit at all, and constructing new gates at airports could prove to be a massive logistical and financial undertaking. An alternative is to fold the wings at the strut location, further complicating the mechanics already required to support the technology. Furthermore, the increased complexity of the SNLF technology would require additional inspections to prevent deterioration of the aft element where loads from the high-lift aft element are transferred only through slot connectors. These complications are compounded by the cost associated with large-scale implementation, including reducing manufacturing tolerance, the necessary restructuring of existing manufacturing hubs, and the transition from older aircraft fleets. However, these older aircraft could be phased out slowly and sold to international airline companies to offset the overall transition cost.
Author Contributions
Conceptualization, S.K.; investigation, S.K. and C.A.; writing—original draft preparation, S.K., C.A. and S.T.; writing—review and editing, S.K., C.A. and S.T.; supervision, S.T. All authors have read and agreed to the published version of the manuscript.
Funding
This work was supported by the National Aeronautics and Space Administration (NASA) University Leadership Initiative (ULI) “Advanced Aerodynamic Design Center for Ultra-Efficient Commercial Vehicles” (Award NNX17AJ95A).
Data Availability Statement
Not applicable.
Acknowledgments
Conflicts of Interest
The authors declare no conflict of interest.
Appendix A
Table A1.
Summary of advanced research topics and citations for additional information.
Table A1.
Summary of advanced research topics and citations for additional information.
| Topic | Objective | Results | Citation |
|---|---|---|---|
| Computational Fluid Dynamics | 2D analysis of SNLF airfoil integrated with TTBW | Transition occurred earlier than predicted at 87% chord | [42] |
| High-lift systems with deflected aft element or flaps | Simple flap improves Cl without abrupt stall characteristics | [45] | |
| High-lift systems with MLEs and DLEs | Airfoil with MLE and Fowler flap had the best performance | [47] | |
| 2D and 3D analysis of S207 to predict transition behavior | Overall behavior captured, but convergence improvements needed for better agreement with experimental values | [48] | |
| Drag Decomposition | Derivation of solutions for partial pressure fields for minimizing drag | Theoretical framework and equations derived for partial pressures | [49] |
| Wind Tunnel Testing | Experimental validation of S207 | Less drag overall and high-lift configuration increases lift, but abrupt stall still occurs | [50] |
| Experimental validation of XS207 | Strong correlation between the simulated and measured streamwise vortices | [51] | |
| Structural Analysis | Structural analysis and CFD to investigate connector shapes, locations, and effect on laminar flow in slot | Connectors perform best with streamlined shape located within the slot and reinforced ribs underneath each of the nine slot connectors | [53] |
| Acoustics | Investigation into aero-elastic stability of the strut-braced SNLF wing | Coupled torsion and bending stability are more likely to occur at lower speeds | [57] |
| Propulsion | Propulsive airframe integration via selection of engine location | Most optimal location under given flight conditions is under the wing on leading edge | [58] |
| Stability and Control | Piezoelectric camber morphing to enhance lift | Airfoil passively resists aerodynamically induced bending while maintaining lift-enhancing morphing capabilities | [59] |
| Advanced Technologies | Steady blowing actuation | Blowing actuation enables a re-energized boundary layer and provides separation control | [60] |
| Unsteady blowing actuation | Traverse actuation performs better than both steady and pulsed blowing | [61] | |
| Review of various excitation techniques | Recent studies on flow separation control have demonstrated the effectiveness of various actuation techniques in improving aerodynamic performance | [62] | |
| Applying a vortex generator jet to a single-slotted, flapped airfoil | A drag reduction ranging from 10.8% to 38% as well as a 53% increase in the suction peak of the flap is observed | [63] | |
| Applying a vortex generator jet to a slotted, trailing-edge flapped airfoil | A 12.6% increase in lift coefficient and a 19.8% decrease in drag coefficient is observed | [64] | |
| Applying pulsed jet actuation on supercritical airfoils | Low frequencies (F+ = 0.2, 1, and 1.2) enhance lift, while high frequencies (F+ = 12) reduce drag | [65] | |
| Designing a double-slotted morphed flapped airfoil | CFD simulations show an 82.5% increase in maximum lift coefficient, | [66] | |
| Optimizing a prototype morphing aft element airfoil | Wind tunnel testing demonstrated lift increase of up to 10% with high resilience to aerodynamic-induced deformation | [68] |
References
- Federal Aviation Administration. FAA Aerospace Forecast Fiscal Years 2024–2044; US Department of Transportation: Washington, DC, USA, 2024. Available online: https://www.faa.gov/dataresearch/aviation/aerospaceforecasts/faa-aerospace-forecasts.pdf (accessed on 1 March 2025).
- NASA Aeronautics. Strategic Implementation Plan—2019 Update; NASA Aeronautics: Washington, DC, USA, 2019. Available online: https://www.nasa.gov/wp-content/uploads/2015/11/sip-2019-v7-web.pdf (accessed on 1 March 2025).
- Bradley, M.; Droney, C. Subsonic Ultra Green Aircraft Research: Phase I Final Report; NASA/CR–2011-216847; National Aeronautics and Space Administration: Washington, DC, USA, 2011. [Google Scholar]
- Greitzer, E.M.; Bonnefoy, P.A.; DelaRosaBlanco, E.; Dorbian, C.S.; Drela, M.; Hall, D.K.; Hansman, R.J.; Hileman, J.I.; Liebeck, R.H.; Levegren, J.; et al. N+ 3 Aircraft Concept Designs and Trade Studies, Final Report; NASA/CR-2010-216794/vol2; NASA Glenn Research Center: Cleveland, OH, USA, 2010. Available online: https://ntrs.nasa.gov/citations/20100042398 (accessed on 1 March 2025).
- Seitz, A.; Kruse, M.; Wunderlich, T.; Bold, J.; Heinrich, L. The DLR project LamAiR: Design of a NLF forward swept wing for short and medium range transport application. In Proceedings of the 29th AIAA Applied Aerodynamics Conference, Honolulu, HI, USA, 27–30 June 2011. [Google Scholar]
- Ma, Y.; Elham, A. Twin-fuselage configuration for improving fuel efficiency of passenger aircraft. Aerosp. Sci. Technol. 2021, 118, 107000. [Google Scholar] [CrossRef]
- Somers, D.M. Laminar-Flow Airfoil. Patent Number US 2004/0094659 A1, 14 June 2005. Available online: https://patents.google.com/patent/US20040094659A1/en (accessed on 1 March 2025).
- Madavan, N.K.; Del Rosario, R.; Jankovsky, A.L. Hybrid-electric and distributed propulsion technologies for large commercial transports: A NASA perspective. In Proceedings of the ISABE 2015, Phoenix, AZ, USA, 25–30 October 2015. [Google Scholar]
- Federal Aviation Administration. FAA Aerospace Forecast Fiscal Years 2020–2040; US Department of Transportation: Washington, DC, USA, 2020. Available online: https://www.faa.gov/sites/faa.gov/files/data_research/aviation/aerospace_forecasts/FY2020-40_FAA_Aerospace_Forecast.pdf (accessed on 1 March 2025).
- Federal Aviation Administration. FAA Aerospace Forecast Fiscal Years 2021–2041; US Department of Transportation: Washington, DC, USA, 2021. Available online: https://www.faa.gov/sites/faa.gov/files/data_research/aviation/aerospace_forecasts/FAA_Aerospace_Forecasts_FY_2021-2041.pdf (accessed on 1 March 2025).
- Federal Aviation Administration. FAA Aerospace Forecast Fiscal Years 2022–2042; US Department of Transportation: Washington, DC, USA, 2022. Available online: https://www.faa.gov/sites/faa.gov/files/2022-06/FY2022_42_FAA_Aerospace_Forecast.pdf (accessed on 1 March 2025).
- Federal Aviation Administration. FAA Aerospace Forecast Fiscal Years 2019–2039; US Department of Transportation: Washington, DC, USA, 2019. Available online: https://www.faa.gov/sites/faa.gov/files/data_research/aviation/aerospace_forecasts/FY2019-39_FAA_Aerospace_Forecast.pdf (accessed on 1 March 2025).
- Federal Aviation Administration. FAA Aerospace Forecast Fiscal Years 2023–2043; US Department of Transportation: Washington, DC, USA, 2023. Available online: https://www.faa.gov/sites/faa.gov/files/FY%202023-2043%20Full%20Forecast%20Document%20and%20Tables_0.pdf (accessed on 1 March 2025).
- Available online: https://www.nasa.gov/image-article/down-earth-future-aircraft/ (accessed on 1 March 2025).
- Coder, J.G.; Somers, D.M. Design of a slotted, natural-laminar-flow airfoil for commercial transport applications. Aerosp. Sci. Technol. 2020, 106, 106217. [Google Scholar] [CrossRef]
- Somers, D.M. Design of a Slotted, Natural-Laminar-Flow Airfoil for Business-Jet Applications; Langley Research Center: Hampton, VA, USA, 2012. [Google Scholar]
- Boundary Layer. Available online: https://www.grc.nasa.gov/WWW/BGH/boundlay.html (accessed on 1 March 2025).
- Reed, H.L.; Lin, R.-S. Stability of three-dimensional boundary layers. SAE Technical Paper 1987. In Proceedings of the he Aerospace Technology Conference and Exposition, Los Angeles, CA, USA, 14–17 September 1987. [Google Scholar]
- NASA. Wings and Configuration for High-Speed Flight, in Quest for Performance: The Evolution of Modern Aircraft; NASA History Division: Washington, DC, USA, 1985. [Google Scholar]
- Jacobs, E.N. Preliminary Report on Laminar-Flow Airfoils and New Methods Adopted for Airfoil and Boundary-Layer Investigations; National Aeronautics and Space Admin Langley Research Center: Hampton VA, USA, 1949. [Google Scholar]
- Abbott, I.H.; Von Doenhoff, A.E.; Stivers, L.S., Jr. Summary of Airfoil Data; Legacy CDMS: Orange County, CA, USA, 1945. [Google Scholar]
- Available online: https://commonresearchmodel.larc.nasa.gov/crm-65-airfoil-sections/ (accessed on 1 March 2025).
- Rivers, M.B.; Lynde, M.N.; Campbell, R.L.; Viken, S.A.; Chan, D.T.; Watkins, A.N.; Goodliff, S.L. Experimental investigation of the NASAcommon research model with a natural laminar flow wing in the NASA Langley national transonic facility. In Proceedings of the AIAA Scitech 2019 Forum, San Diego, CA, USA, 7–11 January 2019. [Google Scholar]
- Somers, D.M. An Exploratory Investigation of a Slotted, Natural-Laminar-Flow Airfoil; NF1676L-14322; National Aeronautics and Space Administration: Washington, DC, USA; Langley Research Center: Hampton, VA, USA, 2012. [Google Scholar]
- Coder, J.G.; Maughmer, M.D.; Somers, D.M. Theoretical and experimental results for the S414, slotted, natural-laminar-flow airfoil. J. Aircr. 2014, 51, 1883–1890. [Google Scholar] [CrossRef]
- Smith, A.M. High-lift aerodynamics. J. Aircr. 1975, 12, 501–530. [Google Scholar] [CrossRef]
- Whitcomb, R.T.; Clark, L.R. An Airfoil Shape for Efficient Flight at Supercritical Mach Numbers. No. L-4517.1965. Available online: https://ntrs.nasa.gov/api/citations/19720066117/downloads/19720066117.pdf (accessed on 1 March 2025).
- Maughmer, M.D.; Coder, J.G.; Somers, D.M. Exploration of a slotted, natural-laminar-flow airfoil concept. In Proceedings of the 2018 Applied Aerodynamics Conference, Atlanta, GA, USA, 25–29 June 2018. [Google Scholar]
- Lynde, M.N.; Campbell, R.L.; Rivers, M.B.; Viken, S.A.; Chan, D.T.; Watkins, A.N.; Goodliff, S.L. Preliminary results from an experimental assessment of a natural laminar flow design method. In Proceedings of the AIAA Scitech 2019 Forum, San Diego, CA, USA, 7–11 January 2019; p. 2298. [Google Scholar]
- Somers, D.M. Design of a Slotted, Natural-Laminar-Flow Airfoil for a Transport Aircraft; No. NASA-CR-2019-220403; NASA: Washington, DC, USA, 2019. Available online: https://ntrs.nasa.gov/citations/20190031816 (accessed on 1 March 2025).
- Coder, J.G. Design of a slotted, natural-laminar-flow airfoil for transition validation experiments. In Proceedings of the AIAA Scitech 2020 Forum, Orlando, FL, USA, 6–10 January 2020. [Google Scholar]
- Somers, D.M.; Maughmer, M.D. Design and Experimental Results for a Low-Speed, Flapped, Slotted, Natural-Laminar-Flow Airfoil; NASA/CR-20220014964; NASA: Washington, DC, USA, 2022. [Google Scholar]
- Somers, D.M.; Maughmer, M.D. Design and Experimental Results for the S414 Airfoil; US Army Aviation Research, Development and Engineering Command (RDECOM): Fort Eustis, VA, USA, 2010. [Google Scholar]
- Drela, M. A User’s Guide to MSES 2.95; Massachusetts Institute of Technology: Cambridge, MA, USA, 1996. [Google Scholar]
- Drela, M.; Youngren, H. XFOIL 6.94 User Guide; MIT Aero & Astro: Cambridge, MA, USA, 2001. [Google Scholar]
- Eppler, R. Airfoil Program System “PROFIL05”. User’s Guide. 2007. Available online: http://acversailles.free.fr/documentation/08~Documentation_Generale_M_Suire/Aerodynamique/Profils/Programmes/Airfoil_program_Profil-05_User-s_guide_Eppler.pdf (accessed on 1 March 2025).
- Coder, J.G.; Maughmer, M.D. Comparisons of theoretical methods for predicting airfoil aerodynamic characteristics. J. Aircr. 2014, 51, 183–191. [Google Scholar] [CrossRef]
- Somers, D.M. Design and Experimental Results for a Flapped Natural-Laminar-Flow Airfoil for General Aviation Applications; NASA-TP-1861; NASA: Washington, DC, USA, 1981. Available online: https://ntrs.nasa.gov/citations/19810015487 (accessed on 1 March 2025).
- Eppler, R. Airfoil Design and Data; Springer Science & Business Media: Berlin/Heidelberg, Germany, 2012. [Google Scholar]
- Available online: https://overflow.larc.nasa.gov/ (accessed on 1 March 2025).
- Available online: https://uli.arc.nasa.gov/projects/2/ (accessed on 1 March 2025).
- Perkins, C.L.; Yang, Z.; Topcuoglu, I.; Mavriplis, D.J.; Coder, J.G.; Hereth, E.; Axten, C.J. Coupled Analysis of a Slotted Natural-Laminar-Flow Transonic Truss-Braced Wing Aircraft Configuration. In Proceedings of the AIAA SCITECH 2022 Forum, San Diego, CA, USA, 3–7 January 2022. [Google Scholar]
- Valarezo, W.O.; Mavriplis, D.J. Navier-Stokes applications to high-lift airfoil analysis. J. Aircr. 1995, 32, 618–624. [Google Scholar] [CrossRef]
- Mavriplis, D.J.; Mani, K. Unstructured mesh solution techniques using the NSU3D solver. In Proceedings of the 52nd Aerospace Sciences Meeting, National Harbor, MD, USA, 13–17 January 2014. [Google Scholar]
- Ortiz-Melendez, H.D.; Coder, J.G.; Shmilovich, A. High-Lift Simulations of Slotted, Natural-Laminar-Flow Airfoils. In Proceedings of the AIAA Scitech 2019 Forum, San Diego, CA, USA, 7–11 January 2019. [Google Scholar]
- Ortiz-Melendez, H.D.; Coder, J.G.; Shmilovich, A. High-Lift Computational Strategy for Slotted, Natural-Laminar-Flow Airfoils. J. Aircr. 2022, 59, 821–835. [Google Scholar] [CrossRef]
- Ortiz-Melendez, H.D.; Long, E.; Colletti, C.R.; Toth, G.; Perkins, C.; Keely, K.; Ansell, P.J.; Coder, J.G. Design and Characterization of High-Lift Capabilities for Slotted, Natural-Laminar-Flow Airfoils. J. Aircr. 2023, 60, 1238–1256. [Google Scholar] [CrossRef]
- Perkins, C.L.; Yang, Z.; Mavriplis, D.J.; Coder, J.G.; Shoemake, L.; Axten, C.J. Effect of Transition Modeling for Analysis of a Slotted, Natural-Laminar-Flow Transonic Truss-Braced Wing Aircraft Configuration. In Proceedings of the AIAA SCITECH 2023 Forum, National Harbor, MD, USA, 23–27 January 2023. [Google Scholar]
- Schmitz, S. Drag Decomposition Using Partial-Pressure Fields in the Compressible Navier–Stokes Equations. AIAA J. 2019, 57, 2030–2038. [Google Scholar] [CrossRef]
- Coder, J.G. Transonic Wind-Tunnel Testing of a Slotted, Natural-Laminar-Flow Wing at Full-Scale Conditions. In Proceedings of the AIAA SCITECH 2023 Forum, National Harbor, MD, USA, 23–27 January 2023. [Google Scholar]
- Beyak, E.S.; Groot, K.J.; Riha, A.K.; Patel, J.M.; Coder, J.G.; Reed, H.L. Nonlinear Boundary-Layer Stability Analysis of a Swept, Natural-Laminar-Flow Airfoil. In Proceedings of the AIAA AVIATION 2022 Forum, Chicago, IL, USA, 27 June–1 July 2022. [Google Scholar]
- Miró, F.M.; Groot, K.; Beyak, E.S.; Moyes, A.J.; Pinna, F.; Reed, H.L. DEKAF: An Open-Source Spectral Boundary-Layer Solver. September 2020. Available online: https://www.researchgate.net/profile/Fernando-Miro-Miro-2/publication/375074330_DEKAF_an_Open-Source_Spectral_Boundary-Layer_Solver/links/653f7040f7d021785f21046f/DEKAF-an-Open-Source-Spectral-Boundary-Layer-Solver.pdf (accessed on 1 March 2025).
- Arndt, C.M. Investigation of Fore-Aft Element Connectors for an Ultra-Efficient Slotted, Natural-Laminar-Flow Aircraft Wing. Ph.D. Dissertation, University of Tennessee, Knoxville, TN, USA, 2022. [Google Scholar]
- Bottai, A.; Campbell, R.L.; Jonson, M.L. Vibrations of a High-Aspect-Ratio, Multi-Element Wing. In Proceedings of the AIAA SCITECH 2022 Forum, San Diego, CA, USA, 3–7 January 2022. [Google Scholar]
- Dassault Systèmes Simulia. Abaqus User Manual V6.14; Dassault Systèmes Simulia: Vélizy-Villacoublay, France, 2014; Available online: http://62.108.178.35:2080/v6.14/books/usi/default.htm (accessed on 1 March 2025).
- Bradley, M.K.; Droney, C.K. Subsonic Ultra Green Aircraft Research: Phase 2; NF1676L-21005; Langley Research Center: Hampton, VA, USA, 2015. [Google Scholar]
- Bottai, A.M.; Jonson, M.L.; Campbell, R.L. Investigation of the role of higher order torsion & bending modes in flutter stability for flexible slender wings. In Proceedings of the AIAA Aviation 2019 Forum, Dallas, TX, USA, 17–21 June 2019. [Google Scholar]
- Palumbo, O.; Palmer, D.E.; Wall, T.D.; Gulati, S.; Coder, J.G. Propulsion/Airframe Integration Study for Ultra High Bypass Ratio Turbofan and a Slotted, Natural-Laminar-Flow Wing. In Proceedings of the AIAA Scitech 2022 Forum, San Diego, CA, USA, 3–7 January 2022. [Google Scholar]
- Wright, C.; Bilgen, O. Induced-Strain Actuators for Morphing of Multi-Element Airfoils. J. Aircr. 2024, 1–15. [Google Scholar] [CrossRef]
- Colletti, C.; Shmilovich, A.; Khodadoust, A. Flow Control for Enhanced High-Lift Performance of Slotted Natural Laminar Flow Wings. In Proceedings of the AIAA Scitech 2021 Forum, Online, 11–15 & 19–21 January 2021. [Google Scholar]
- Colletti, C.; Shmilovich, A.; Khodadoust, A. Approaches for Improving High-Lift Performance of Slotted Natural Laminar Flow Airfoils. In Proceedings of the AIAA SCITECH 2022 Forum, San Diego, CA, USA, 3–7 January 2022. [Google Scholar]
- Abdolahipour, S. Review on flow separation control: Effects of excitation frequency and momentum coefficient. Front. Mech. Eng. 2024, 10, 1380675. [Google Scholar] [CrossRef]
- Abdolahipour, S.; Mani, M.; Taleghani, A.S. Pressure improvement on a supercritical high-lift wing using simple and modulated pulse jet vortex generator. Flow Turbul. Combust. 2022, 109, 65–100. [Google Scholar] [CrossRef]
- Abdolahipour, S.; Mani, M.; Taleghani, A.S. Experimental investigation of flow control on a high-lift wing using modulated pulse jet vortex generator. J. Aerosp. Eng. 2022, 35, 05022001. [Google Scholar] [CrossRef]
- Abdolahipour, S. Effects of low and high frequency actuation on aerodynamic performance of a supercritical airfoil. Front. Mech. Eng. 2023, 9, 1290074. [Google Scholar] [CrossRef]
- Shahrokhi, S.; Rahni, M.T.; Akbari, P. Aerodynamic design of a double slotted morphed flap airfoil–a numerical study. Front. Mech. Eng. 2024, 10, 1371479. [Google Scholar] [CrossRef]
- Wright, C.; Bilgen, O. A piezocomposite trailing-edge for subsonic aircraft. In Smart Materials, Adaptive Structures and Intelligent Systems; American Society of Mechanical Engineers: New York, NY, USA, 2018. [Google Scholar]
- Bilgen, O.; Friswell, M.I.; Taqiuddin, M. Coupled modeling and optimization of piezocomposite wings. In Smart Materials, Adaptive Structures and Intelligent Systems; American Society of Mechanical Engineers: New York, NY, USA, 2013. [Google Scholar]
- Wright, C.; Bilgen, O. Design Optimization of a Piezocomposite Morphing Multi-Element Airfoil. In Smart Materials, Adaptive Structures and Intelligent Systems; American Society of Mechanical Engineers: New York, NY, USA, 2020. [Google Scholar]
- Wright, C.; Bilgen, O. A variable camber piezocomposite trailing-edge for subsonic aircraft: Multidisciplinary design optimization. In Smart Materials, Adaptive Structures and Intelligent Systems; American Society of Mechanical Engineers: New York, NY, USA, 2019. [Google Scholar]
- Niu, Y.; Ji, H.; Tao, C.; Zhang, C.; Wu, Y.; Qiu, J. Design of trailing edge flap based on MFC and prediction of deformation and aerodynamic performance using BP neural network. J. Intell. Mater. Syst. Struct. 2025, 1045389X241305660. [Google Scholar] [CrossRef]
- Li, D. Deep-learning-based icing identification method for unmanned aerial vehicle. In Proceedings of the International Conference on Mechatronics and Intelligent Control (ICMIC 2024), Wuhan, China, 20–22 September 2024; SPIE: San Diego, CA, USA, 2025. [Google Scholar]
- Dai, J.; Liu, P.; Kong, C.; Pan, L.; Si, J. Adaptive control method for morphing trailing-edge wing based on deep supervision network and reinforcement learning. Aerosp. Sci. Technol. 2024, 153, 109424. [Google Scholar] [CrossRef]
- Dong, Y.; Tao, J.; Zhang, Y.; Lin, W.; Ai, J. Deep learning in aircraft design, dynamics, and control: Review and prospects. IEEE Trans. Aerosp. Electron. Syst. 2021, 57, 2346–2368. [Google Scholar] [CrossRef]
- Sabater, C.; Stuermer, P.; Bekemeyer, P. Fast Predictions of Aircraft Aerodynamics using Deep Learning Techniques. AIAA J. 2022, 60, 5249–5261. [Google Scholar] [CrossRef]
- Wang, Z.P.; Lin, R.J.; Zhao, Z.Y.; Chen, X.; Guo, P.M.; Yang, N.; Wang, Z.C.; Fan, D.X. Learn to flap: Foil non-parametric path planning via deep reinforcement learning. J. Fluid Mech. 2024, 984, A9. [Google Scholar] [CrossRef]
- Dai, J.; Liu, P.; Qu, Q.; Li, L.; Niu, T. Aerodynamic optimization of high-lift devices using a 2D-to-3D optimization method based on deep reinforcement learning and transfer learning. Aerosp. Sci. Technol. 2022, 121, 107348. [Google Scholar] [CrossRef]
Disclaimer/Publisher’s Note: The statements, opinions and data contained in all publications are solely those of the individual author(s) and contributor(s) and not of MDPI and/or the editor(s). MDPI and/or the editor(s) disclaim responsibility for any injury to people or property resulting from any ideas, methods, instructions or products referred to in the content. |
© 2025 by the authors. Licensee MDPI, Basel, Switzerland. This article is an open access article distributed under the terms and conditions of the Creative Commons Attribution (CC BY) license (https://creativecommons.org/licenses/by/4.0/).