Article

Preliminary Design of Regional Aircraft—Integration of a Fuel Cell-Electric Energy Network in SUAVE

by
Jakob Schlittenhardt
1,*,†,
Yannik Freund
2,†,
Jonas Mangold
1,†,
Richard Hanke-Rauschenbach
2 and
Andreas Strohmayer
1
1
Institute of Aircraft Design, University of Stuttgart, 70569 Stuttgart, Germany
2
Institute of Electric Power Systems, Leibniz University Hanover, 30167 Hanover, Germany
*
Author to whom correspondence should be addressed.
These authors contributed equally to this work.
Aerospace 2025, 12(3), 249; https://doi.org/10.3390/aerospace12030249
Submission received: 17 February 2025 / Revised: 6 March 2025 / Accepted: 7 March 2025 / Published: 17 March 2025

Abstract

:
To enable climate-neutral aviation, improving the energy efficiency of aircraft is essential. The research project Synergies of Highly Integrated Transport Aircraft investigates cross-disciplinary synergies in aircraft and propulsion technologies to achieve energy savings. This study examines a fuel cell electric powered configuration with distributed electric propulsion. For this, a reverse-engineered ATR 72-500 serves as a reference model for calibrating the methods and ensuring accurate performance modeling. A baseline configuration featuring a state-of-the-art turboprop engine with the same entry-into-service is also introduced for a meaningful performance comparison. The analysis uses an enhanced version of the Stanford University Aerospace Vehicle Environment (SUAVE), a Python-based aircraft design environment that allows for novel energy network architectures. This paper details the preliminary aircraft design process, including calibration, presents the resulting aircraft configurations, and examines the integration of a fuel cell-electric energy network. The results provide a foundation for higher fidelity studies and performance comparisons, offering insights into the trade-offs associated with hydrogen-based propulsion systems. All fundamental equations and methodologies are explicitly presented, ensuring transparency, clarity, and reproducibility. This comprehensive disclosure allows the broader scientific community to utilize and refine these findings, facilitating further progress in hydrogen-powered aviation technologies.

1. Introduction

The aviation industry faces a significant challenge in achieving climate neutrality, necessitating a substantial improvement in aircraft energy efficiency and emissions. Global temperatures have risen markedly since the onset of industrialization. Without effective mitigation measures, the Earth’s average temperature could increase by more than three degrees Celsius by the year 2100 [1]. In response, the Paris Climate Agreement set global targets to mitigate climate change, while the United Nations [2] emphasized climate protection as a cross-cutting priority in its 2030 Agenda for Sustainable Development [3]. Through its Sustainable Development Goals, this agenda highlights the interconnected need for economic, environmental, and social sustainability worldwide [4].
Air transportation, a fundamental pillar of international trade, travel, and global connectivity, plays a critical role in achieving these sustainability objectives. Climate-neutral aviation facilitates economic growth, strengthens global partnerships, and reduces inequalities by connecting people and businesses worldwide. The Paris Climate Agreement [2], the European Green Deal [5], and the Fly the Green Deal [6] set ambitious targets, including reducing aircraft energy use by 50% by 2035. Achieving this requires continuous advancements in aircraft and propulsion technologies alongside synergies by integrating propulsion systems into the aircraft architecture.
This is where the Synergies of Highly Integrated Transport Aircraft (SynTrac) [7] project gains significance. This research project investigates cross-disciplinary synergies to develop methods that enable configuration-independent, holistic research, ultimately addressing the challenges of climate-neutral aviation. A core focus is exploring innovative propulsion concepts, such as fuel cell (FC) electric propulsion and distributed electric propulsion (DEP).
FC electric aircraft concepts demonstrate that FCs can enable locally emission-free flight [8], ignoring water emissions. Compared to conventional aircraft, their heavier powertrain significantly limits performance [9,10]. Conversely, electrification opens up opportunities for new synergies, such as the application of DEP, which enables more efficient propulsion integration. By leveraging multiple smaller electric motors distributed along the airframe, the aerodynamic performance can be improved and thus compensate for some of the weight-related drawbacks of FC systems [11]. The paper focuses on these opportunities, addressing the challenges posed by hydrogen-based systems while investigating how DEP can enhance energy efficiency. By combining these innovations, the paper aims to unlock the full potential of FC electric systems, paving the way for climate-neutral aviation.

1.1. Research Focus and Aircraft Configuration

SynTrac examines four future aircraft configurations, two short-/medium range and two regional aircraft configurations. The regional configurations are analyzed in this paper to evaluate the proposed methodologies and explore potential energy savings. Designing an aircraft typically begins with examining reference aircraft of the same class and with a similar configuration, and comparable top-level aircraft requirements. The methodologies and, hence, the equations, often derived from empirical data, are typically calibrated on this basis. The ATR 72-500 is chosen as the reference model in this study. Although a newer version, the ATR 72-600, is available on the market, the ATR 72-500 is chosen because of the significantly better data availability. To enable a meaningful evaluation of the results, a baseline for comparison is essential. Therefore, in addition to the reference configuration a baseline configuration, an ATR 72-500-like aircraft equipped with a state-of-the-art turboprop with an entry-into-service in 2040, the same as the lead configuration is designed. As this study focuses on investigating the synergies of highly integrated propulsion systems, technological advances beyond propulsion are not considered in both models. This approach avoids the risk of distorting the results and ensures a clear comparison of the propulsion systems studied.
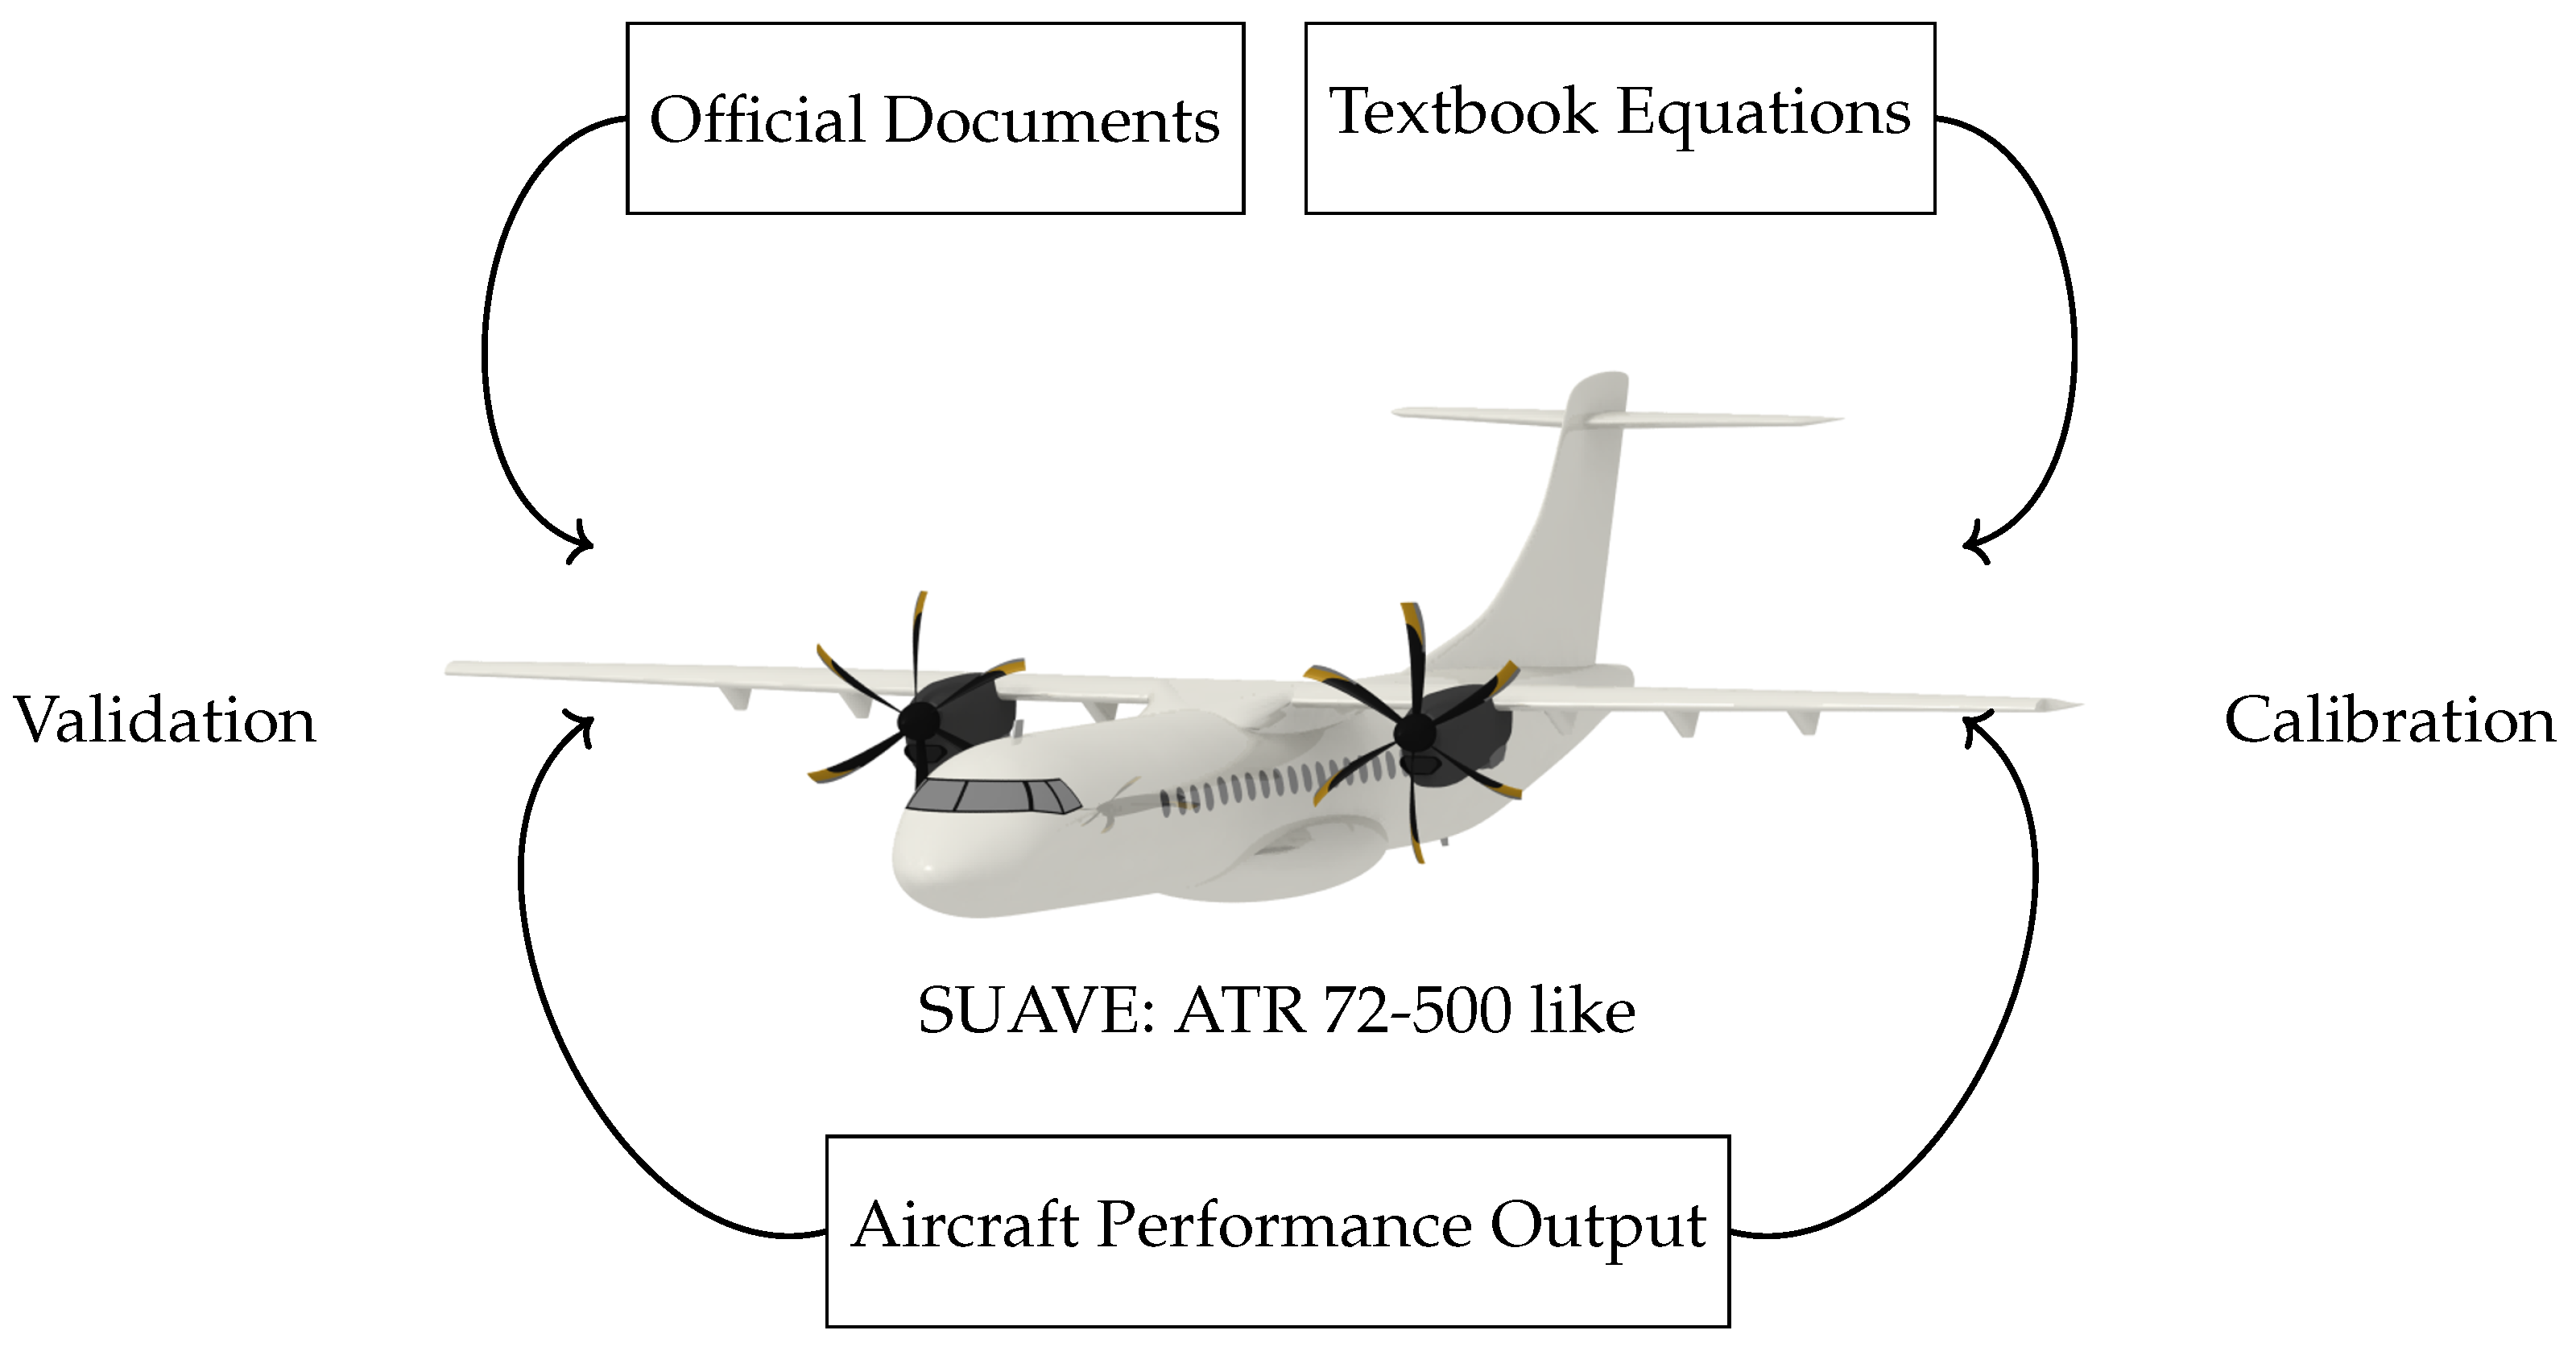
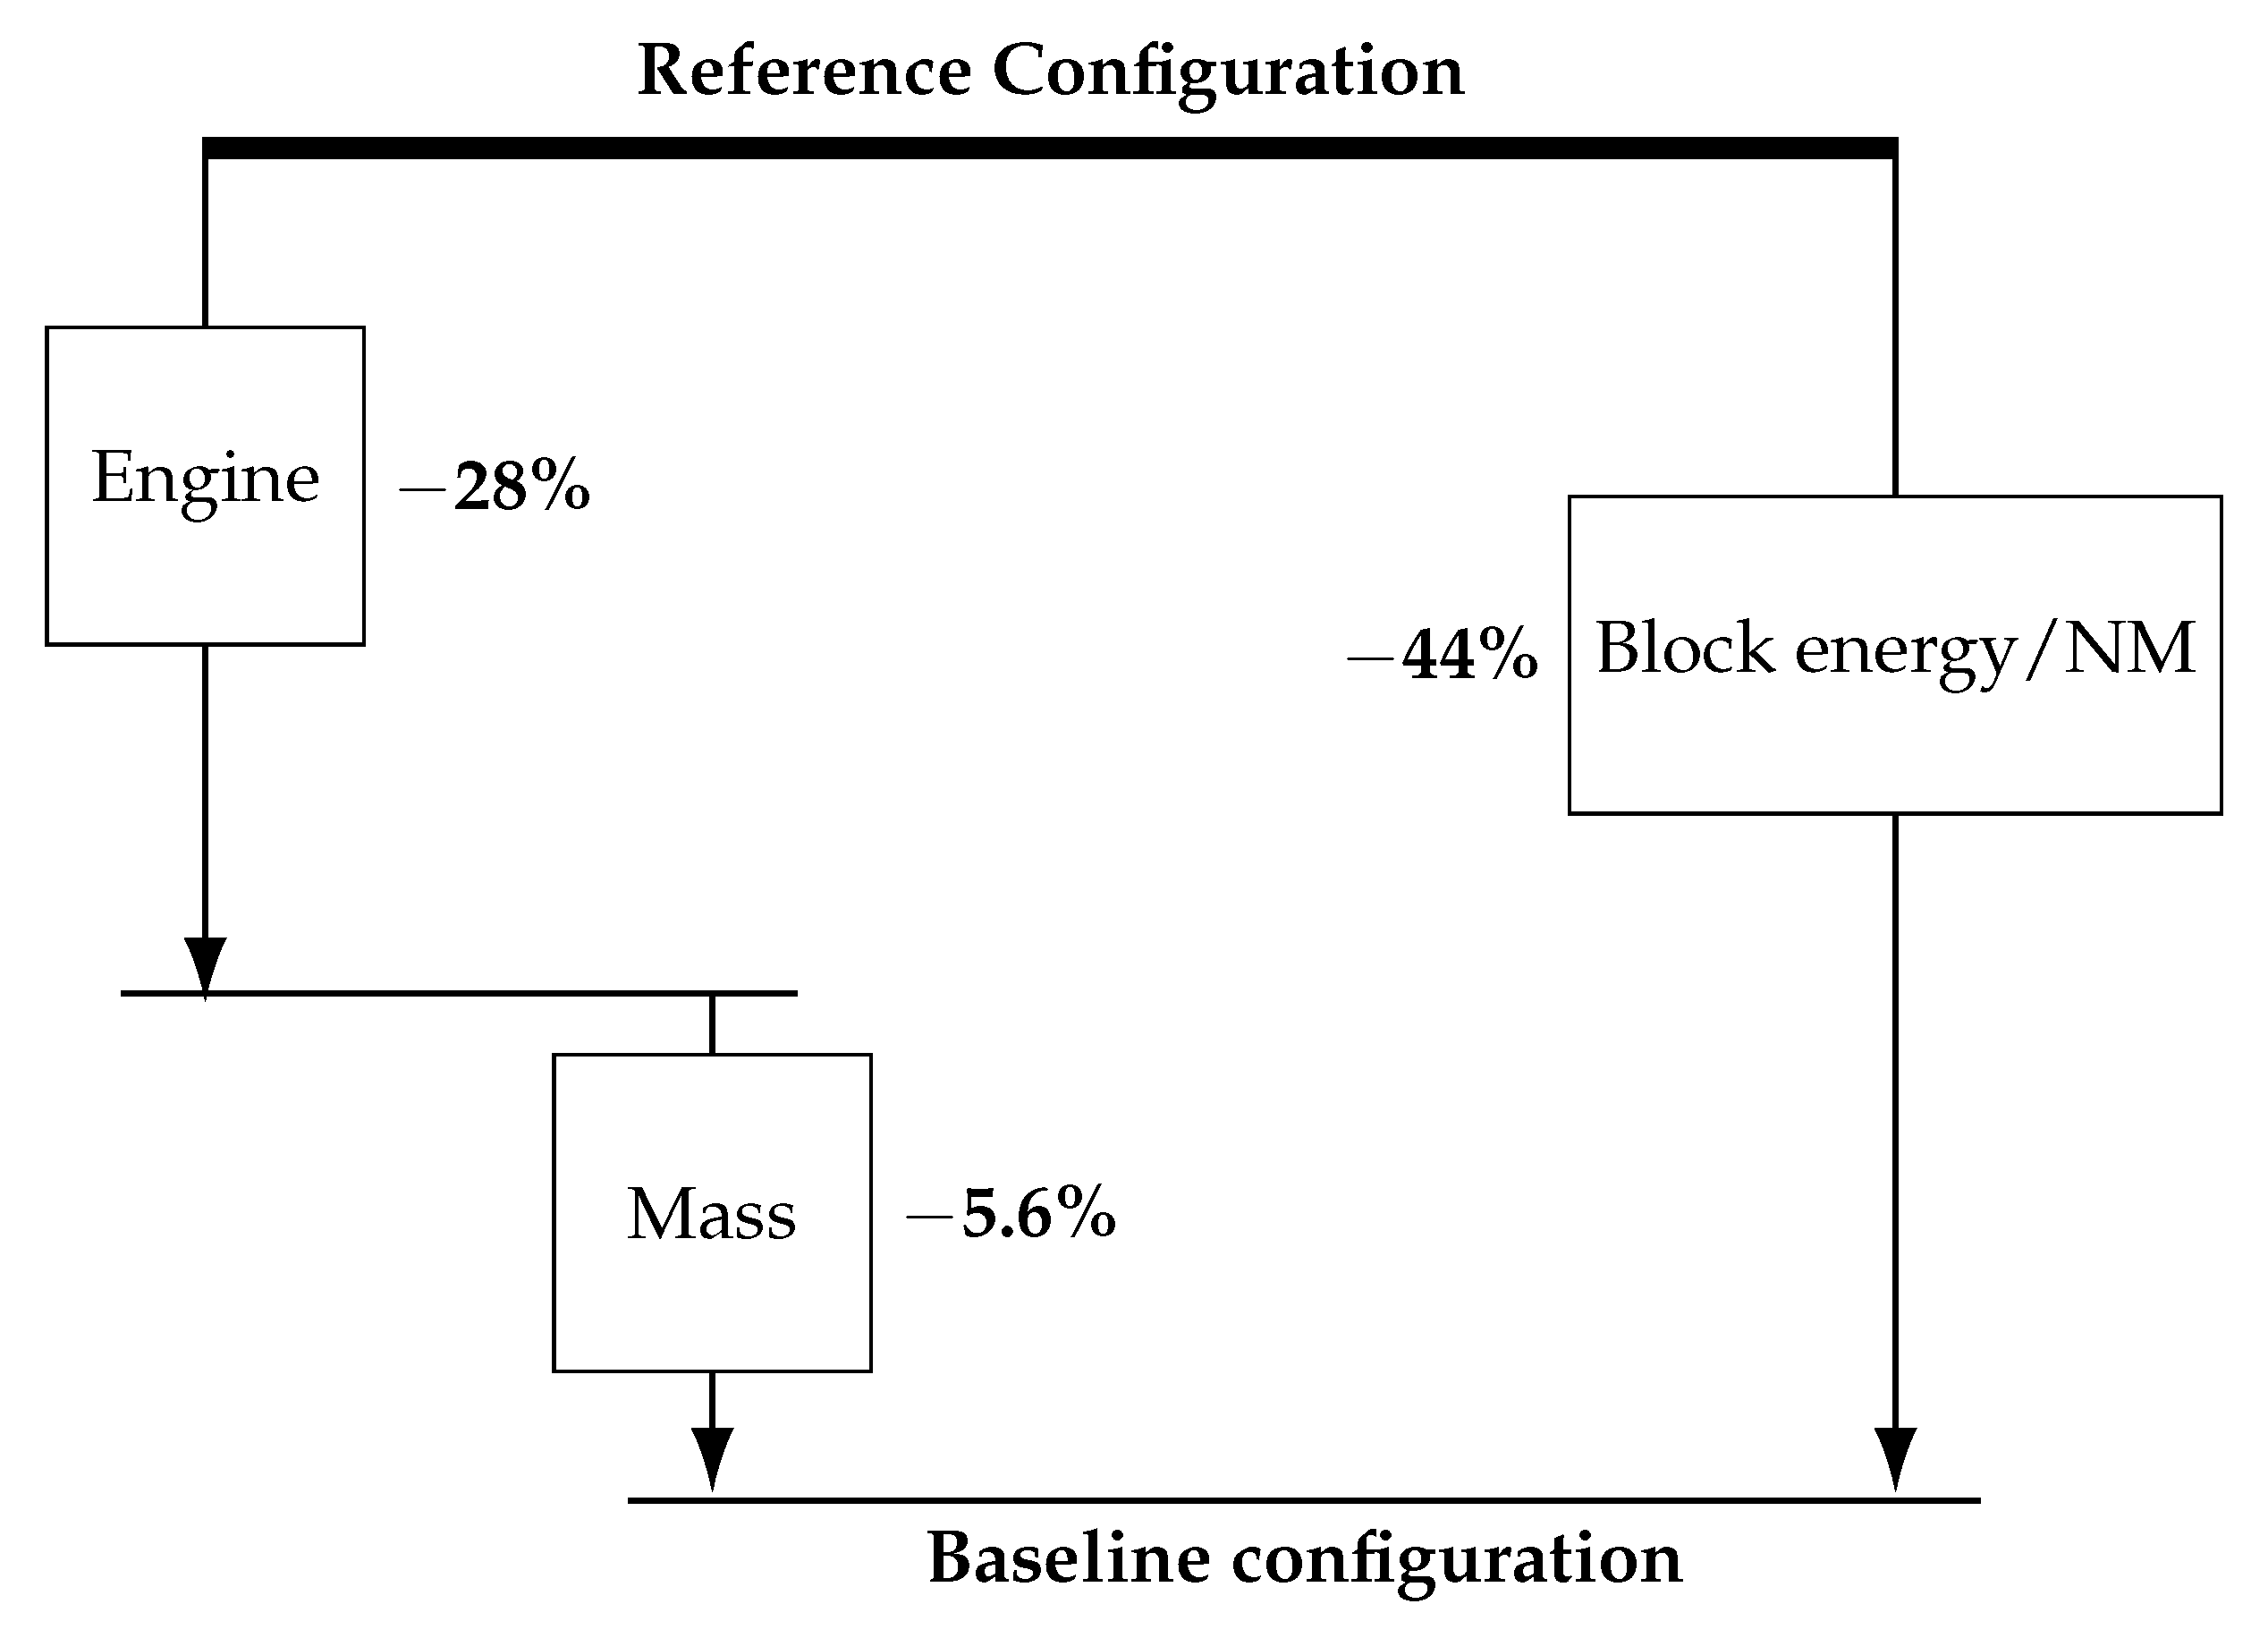
  • Reference configuration: A reverse-engineered ATR 72-500-like aircraft serves as the basis for the other configurations.
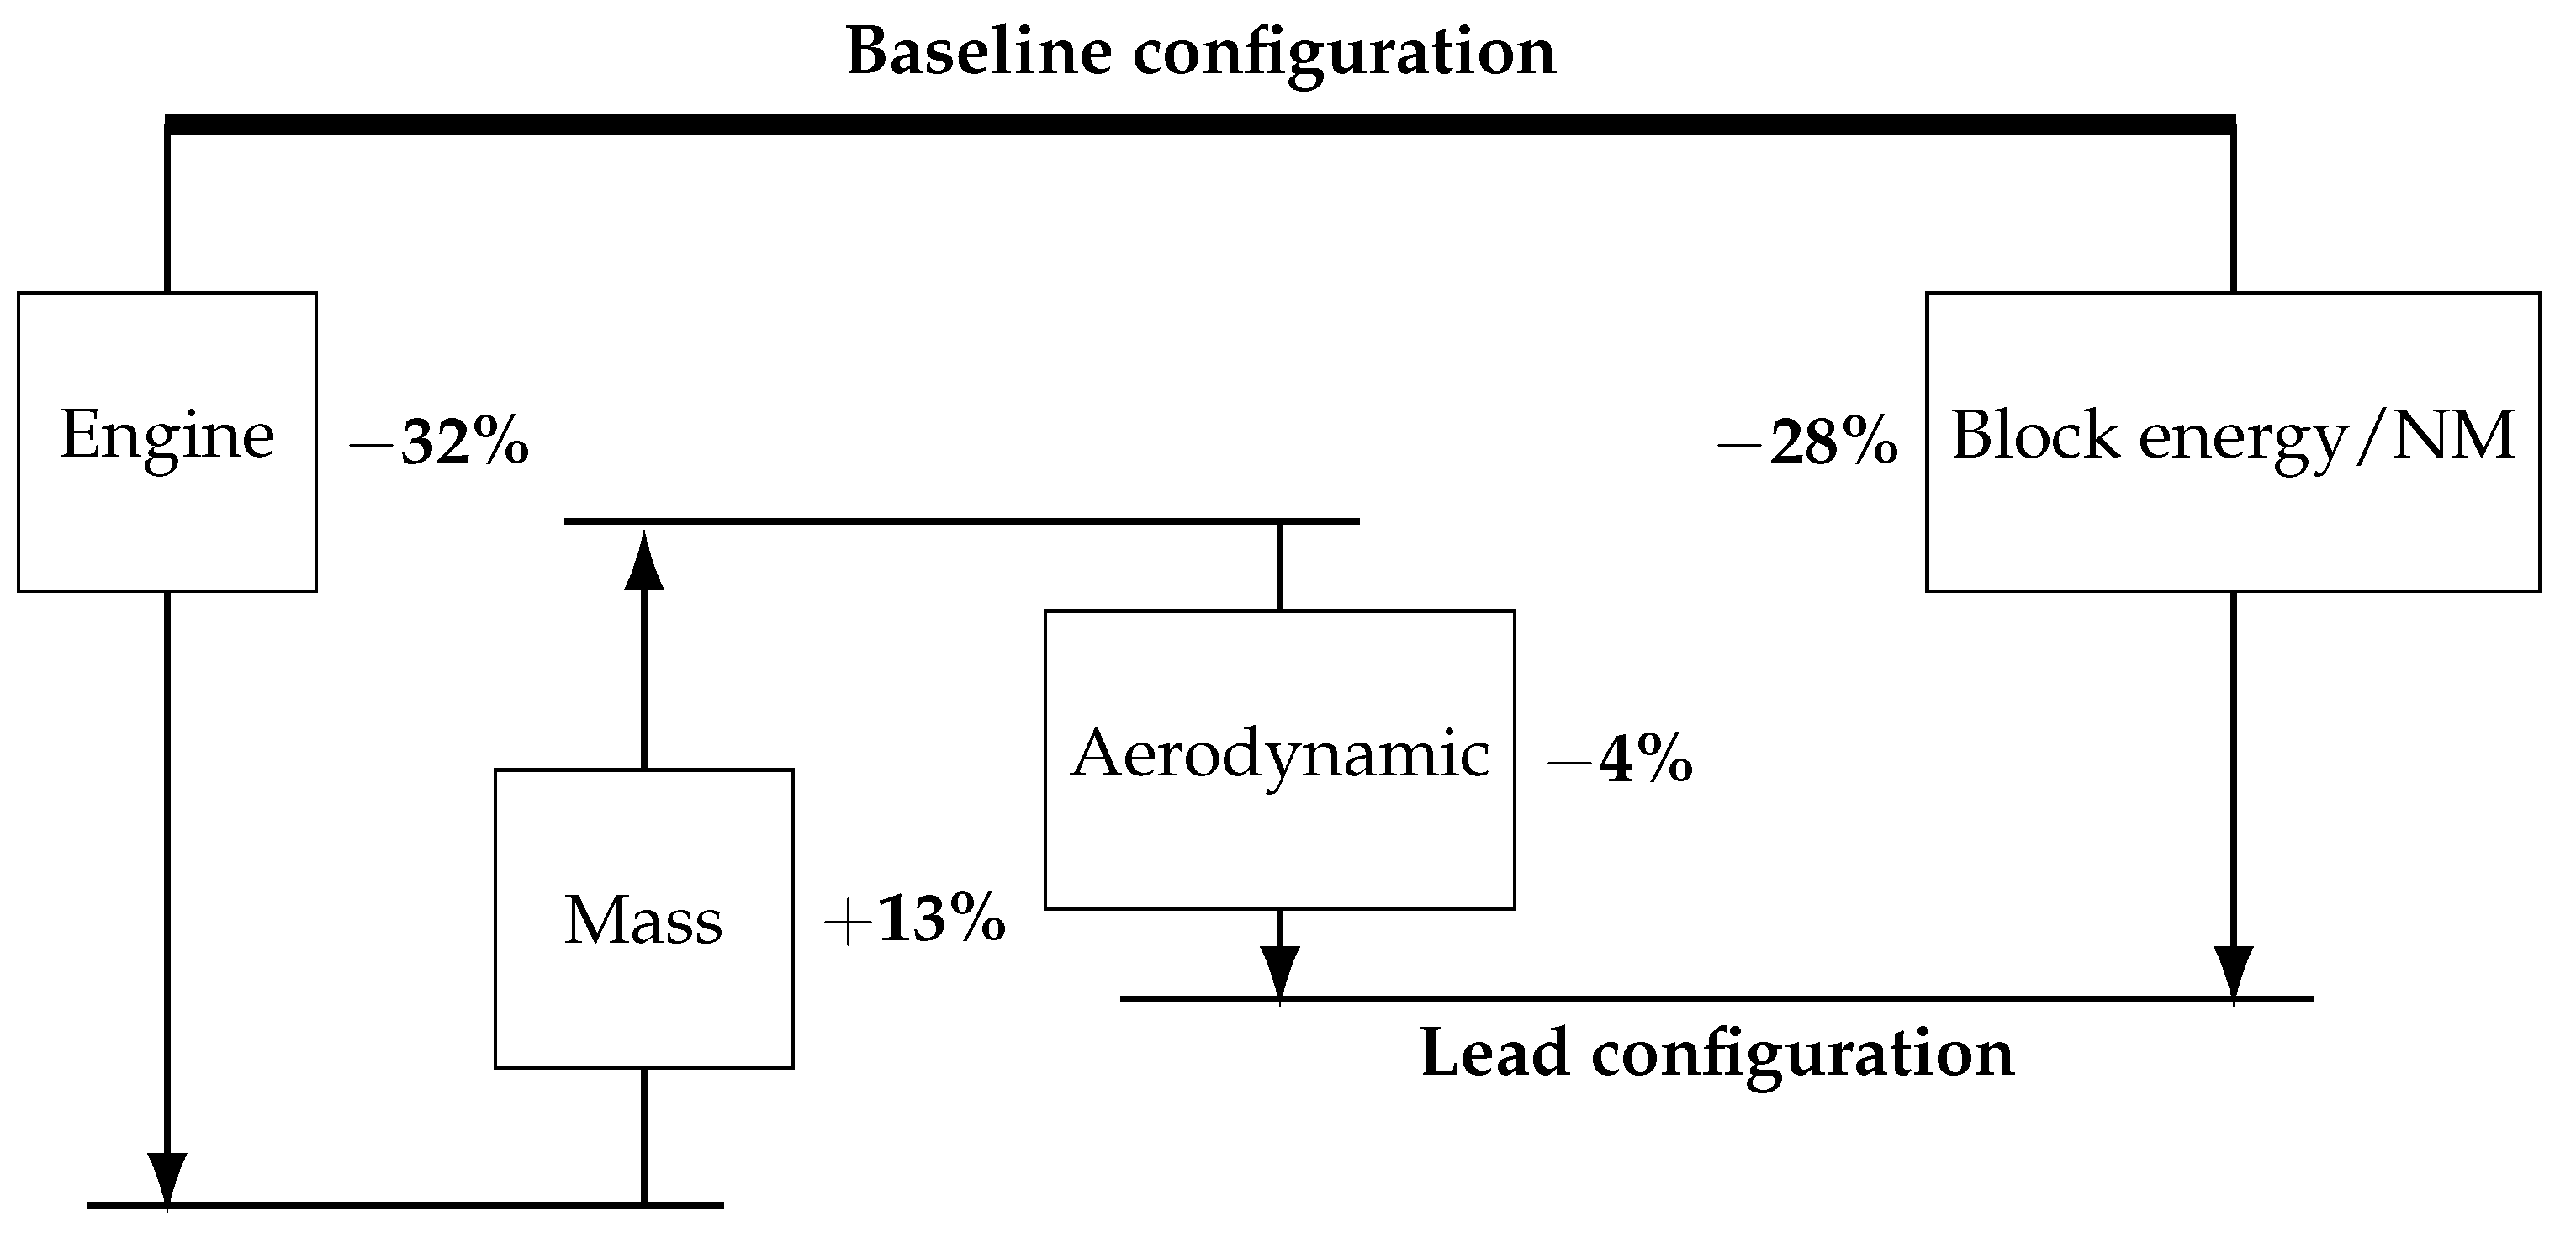
  • Baseline configuration: An ATR 72-500-like aircraft with a state-of-the-art turboprop with an entry-in-service date equal to the lead configuration, which serves as a benchmark for comparison.
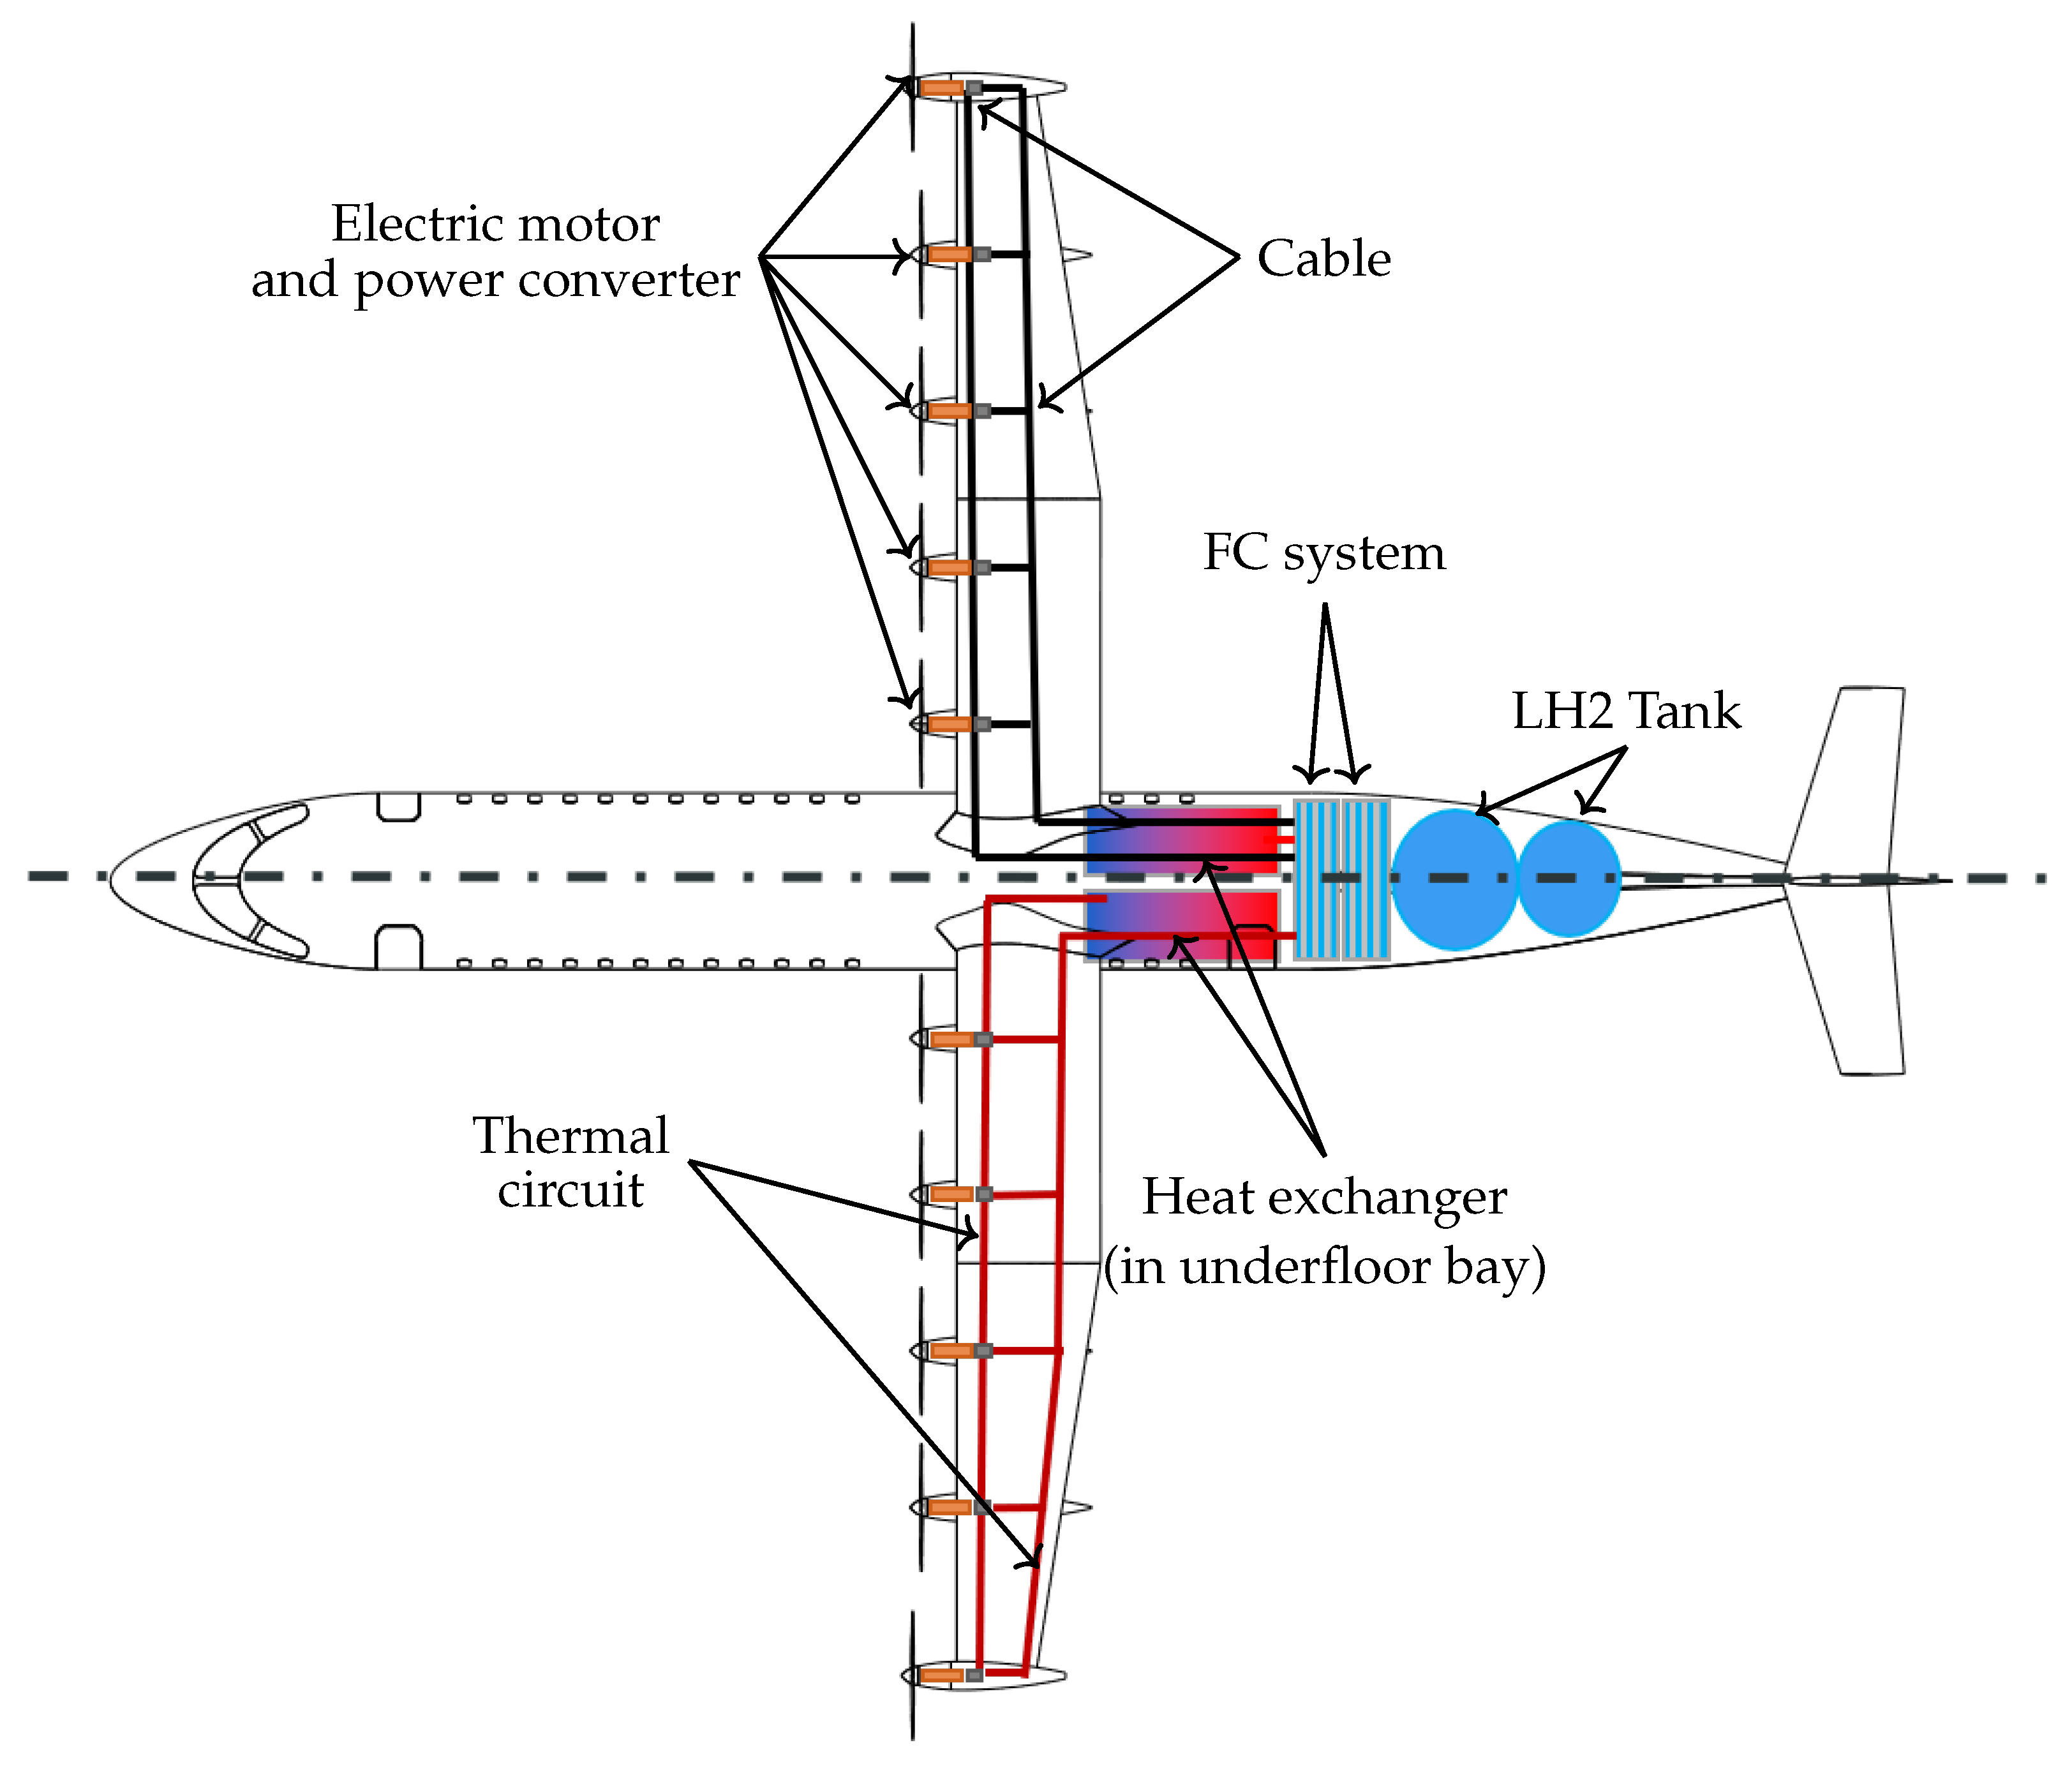
  • Lead configuration: A design utilizing DEP powered by an FC electric powertrain.

1.2. State of the Art and Motivation

The integration of propulsion systems into the airframe, such as DEP and multifunctional thrust generation configurations, has the potential to deliver 10 to 20% additional energy savings [12]. Achieving these synergies requires a higher fidelity, multidisciplinary approach that transcends traditional research boundaries. Future transport aircraft demand a comprehensive understanding of physical processes and phenomena that emerge at high levels of system integration. These include:
  • Thermal management of electric and hydrogen-based systems
  • Multi-functional structural design to reduce weight and enhance efficiency
  • Aerodynamic interactions between the airframe and propulsion systems
  • Advanced acoustic modeling for noise reduction
Previous research efforts have focused mainly on isolated aspects of these challenges. In contrast, SynTrac adopts a cross-disciplinary approach, encompassing aerodynamics, acoustics, flight physics, thermodynamics, and structural mechanics. By addressing the interfaces between these disciplines, it aims to unlock synergies that simultaneously optimize energy efficiency, aerodynamic performance, and noise reduction.
To investigate these synergies, a high level of detail in the models must account for the interactions and mutual influences between subsystems. Therefore, an energy system model (see Section 2.4.2) has been created in which every main component of the powertrain and its interaction with the system are represented separately.
Hydrogen-based systems offer notable environmental benefits but also present distinct challenges, such as thermal management, volumetric energy density limitations, and integration complexities [13]. This study publishes comprehensive data on hydrogen-based energy systems, the complete set of equations for a mid-fidelity FC system model, and off-design performance data to enhance the understanding of various operational scenarios.
In contrast to previous publications that focus solely on final results, this paper transparently details the calculation processes and methodologies. By prioritizing analytically solvable energy methods, the proposed approach reduces reliance on numerical calculations, clarifies correlations, and saves time. Typically, FC electric aircraft designs rely on sizing processes based on fixed component-level efficiencies [8]. However, this study guarantees reproducibility by integrating higher-fidelity subsystem models through the Stanford University Aerospace Vehicle Environment (SUAVE) [14] framework and enables a thorough analysis of component interactions and synergies. The scalable models can adapt to various design requirements and complexities.
As this research operates within a low Technology Readiness Level (TRL) context of Overall Aircraft Design (OAD), the approach enables early-stage exploration and sizing of subsystems.
Overall, the research establishes a comprehensive framework for addressing the challenges and opportunities of climate-neutral regional aviation. The methodology in Section 2 addresses the energy system model integration in SUAVE, which allows for mission solving of the system of equations and integration of interchangeable components. Key methodological steps include the calibration of the reference aircraft, the effect of DEP, and the development of an energy network for modeling FC systems. Particular attention is given to the effects on aircraft sizing, performance, and center of gravity, ensuring a detailed understanding of design impacts. The study provides a realistic assessment of emerging configurations and technologies, contributing to the broader goal of achieving sustainable, efficient, and climate-neutral air transport.
The Results Section 3 provides calibrated data of the ATR-72-500-like configuration, including mass breakdown, aerodynamic performance, and payload-range capabilities. It also presents the design and performance of the baseline and lead configurations. Comparative analyses, including ladder charts, payload-range diagrams, and off-design performance evaluations, are used to illustrate the different behaviors and trade-offs. By integrating higher-fidelity subsystem models and presenting transparent data and equations, this study fills critical methodological gaps. The results contribute to advancing hybrid-electric aircraft design by offering scalable, reliable models and insights into the benefits and challenges of FC systems.

2. Materials and Methods

This section outlines a comprehensive methodology for designing and calibrating a hybrid-electric aircraft within the SUAVE framework. It begins with an overview of SUAVE’s flexibility in integrating data from multiple sources and its extension by the Institute of Aircraft Design at the University of Stuttgart for iterative aircraft design. The calibration process of a reference ATR 72-500-like model, using data from manufacturer manuals and literature, is then described. Following this, the impact of a new propulsion architecture, particularly the incorporation of DEP, on key aerodynamic performance parameters is discussed. Finally, the section presents a detailed aircraft energy system model that encompasses FCs, liquid hydrogen storage, power converters, and related components, as well as methods for calculating mass, volume, and energy balances. This integrated approach forms the foundation for subsequent off-design analyses and performance evaluations.

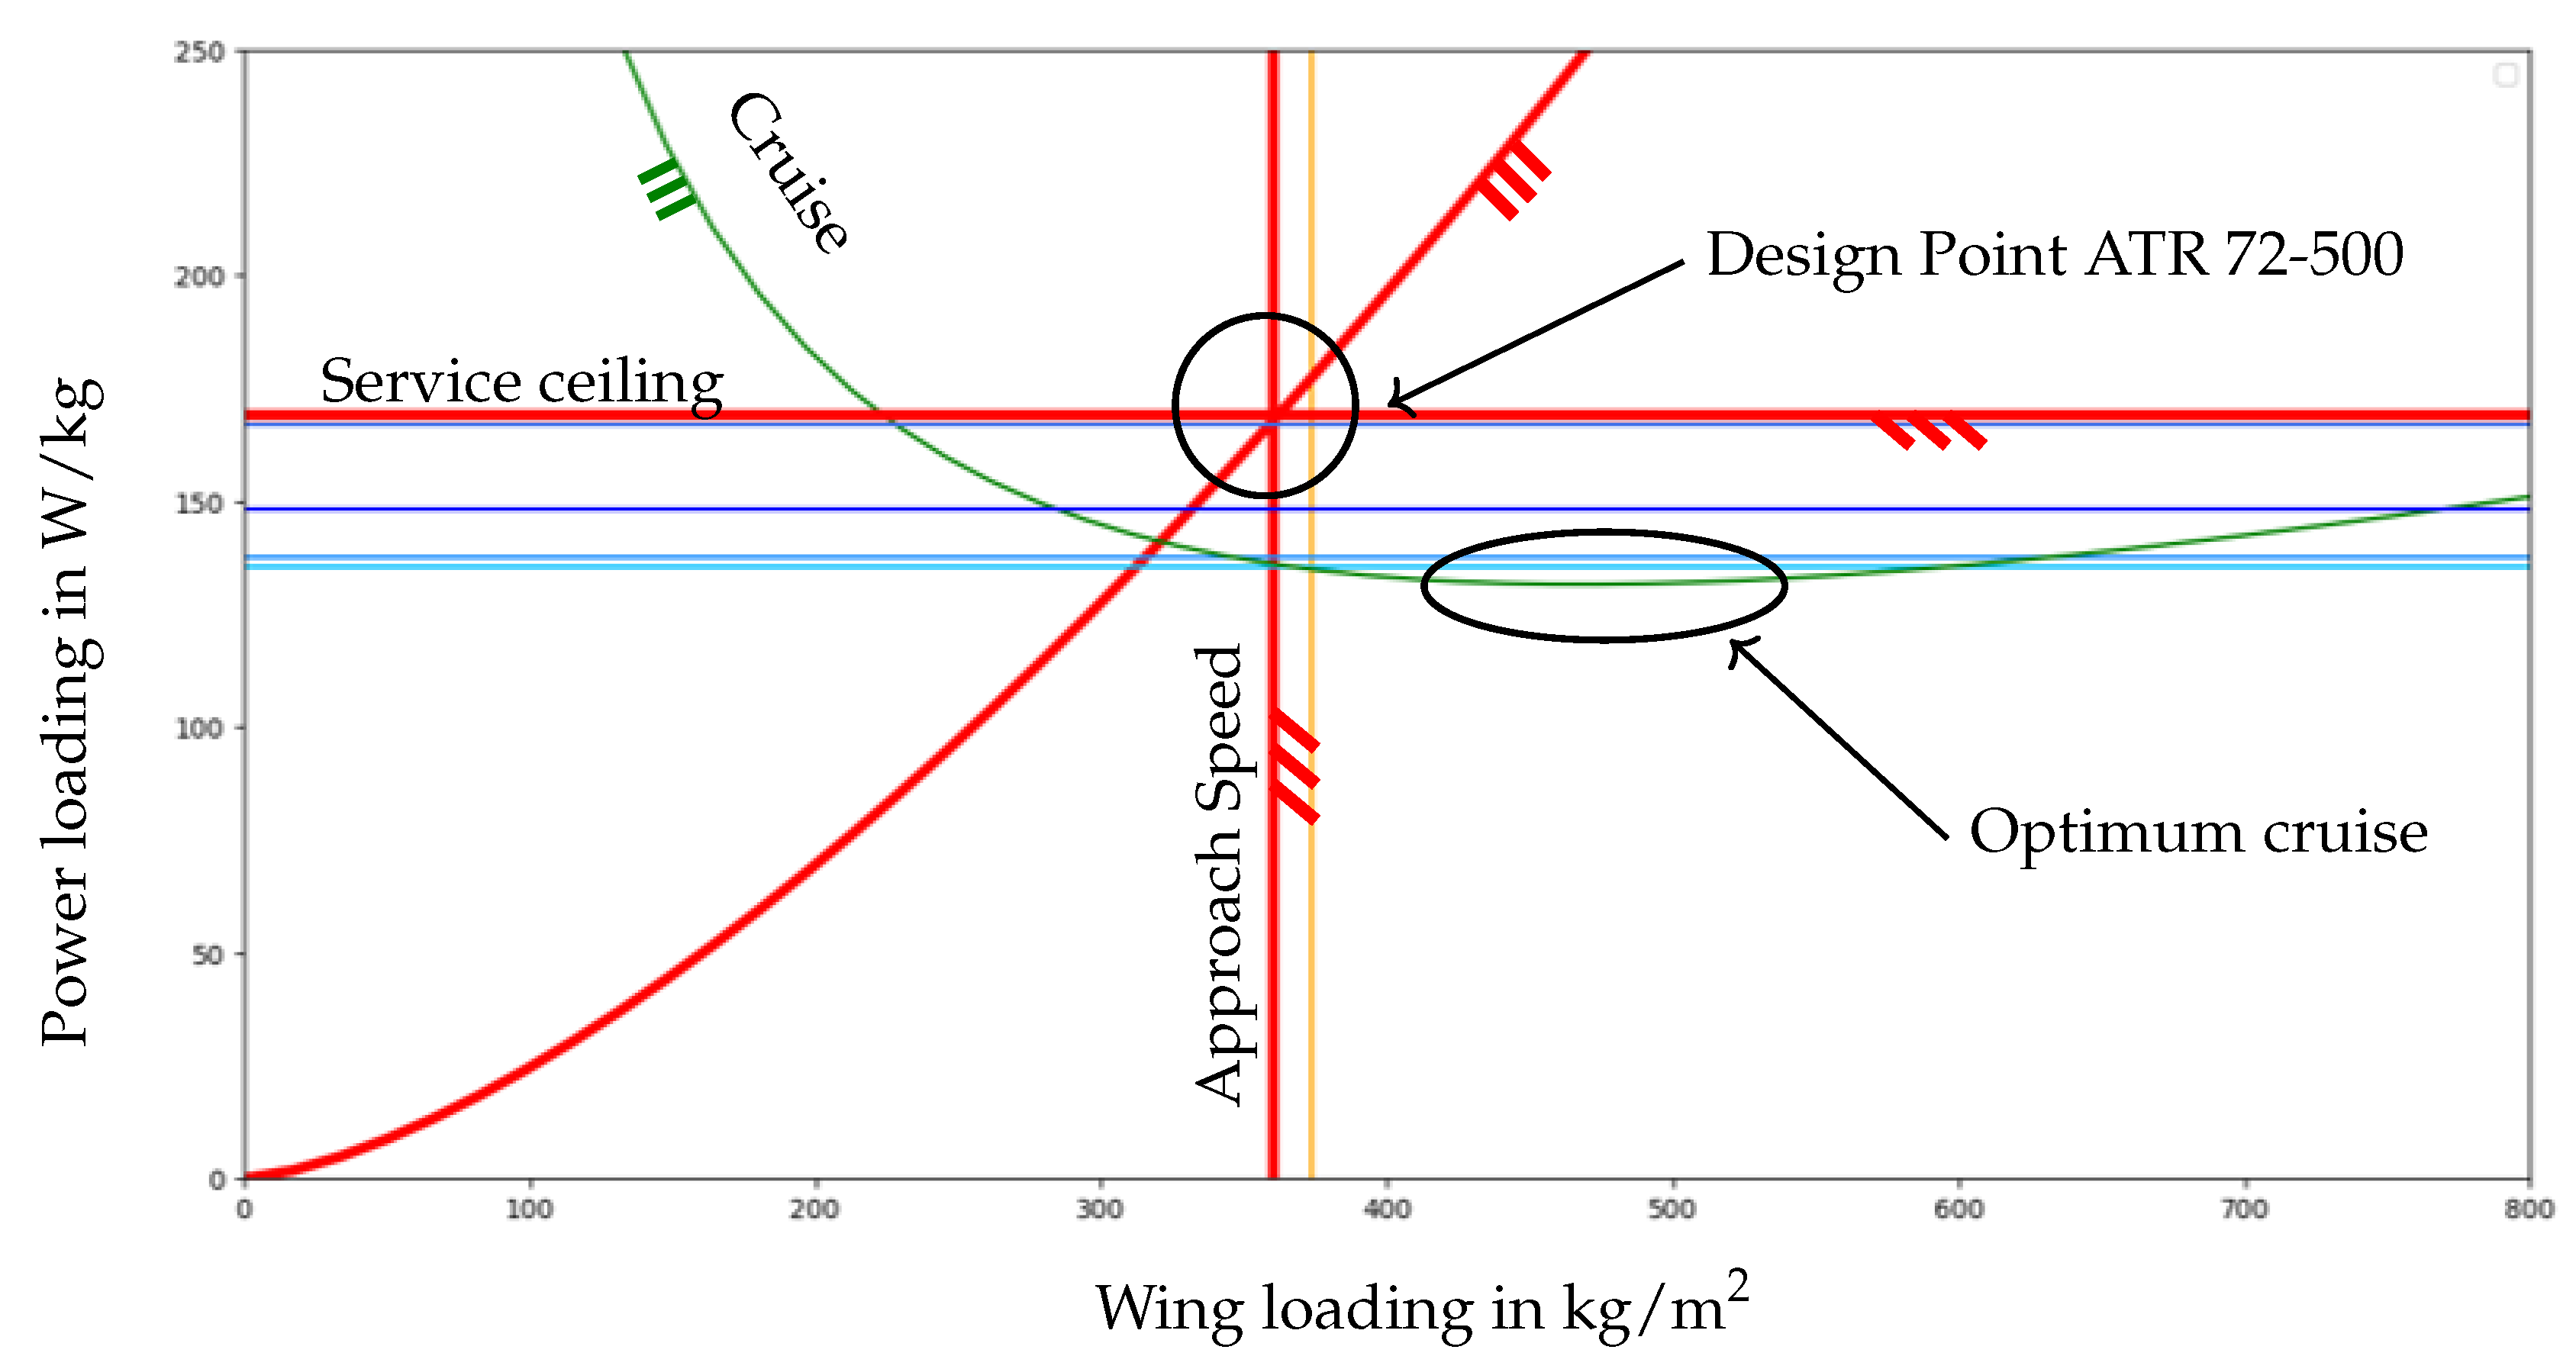
2.1. Design and Calibration in SUAVE

SUAVE offers notable flexibility, particularly its ability to decouple propulsion architectures from mission calculations, thereby enabling the integration of novel energy systems and advanced thermal management strategies for energy-efficient solutions. This flexible framework integrates data from multiple sources, unlike traditional aircraft design tools that rely primarily on fixed empirical correlations and handbook approximations [15]. This customizability makes it possible to integrate advanced technologies into the design process by complementing conventional methods with physics-based approaches (i.e., higher fidelity). This flexibility allows for the seamless integration of interchangeable components, such as surrogate models, and facilitates public open-source collaboration. By combining these capabilities, more accurate modeling and optimization of next-generation aircraft are possible. Its ability to handle both conventional and unconventional design architectures makes it an ideal platform for exploring innovative propulsion systems and configurations, such as hybrid electric or DEP, and guarantees a precise assessment of these technologies.
Additionally, the mission-solving capabilities are noteworthy, as they rely on iterative methods to resolve a force equilibrium at each mission point. The flight equation, which considers mass, lift, drag, and thrust, must be solved at each mission point, emphasizing energy network balance and enabling efficient convergence of implicit systems of equations. While explicit formulations for these equations are desirable to enhance computational efficiency, simplified representations, such as those for energy networks, offer practical solutions. This versatility has made SUAVE a valuable tool for high-level academic and industrial research in the field of conceptual aircraft design.
SUAVE was extended by the Institute of Aircraft Design at the University of Stuttgart as part of the FutPrInt50 research project [16] to include an iterative design loop to enable the design of aircraft with alternative propulsion [17]. This modified version is used and further developed to support hybrid-electric FC architectures by realistic modeling of the corresponding components and to enable a detailed analysis of the aircraft’s performance. The enhancements include the implementation of higher fidelity models for hybrid-electric propulsion systems to analyze synergies between propulsion architectures.
The input parameters must be carefully defined to set up the energy network. SUAVE is capable of solving both implicit and explicit calculations. However, explicit calculations are generally preferred, as implicit calculations require additional computational loops, significantly increasing the computation time.
In its basic form, the SUAVE environment is equipped with a comprehensive set of standard aircraft sizing equations, as outlined in widely recognized handbooks such as Raymer [18]. These foundational equations serve as a starting point and will be significantly advanced. The mass and parasite aerodynamic models are based on Raymer’s Class II methods [18], with the mass models offering detailed component-level breakdowns and the aerodynamic models delivering refined drag estimates for individual components and mission phases. Calibration in both mass and aerodynamic models ensures alignment with observed data and enhances accuracy. These calibrations are implemented using mass factors to adjust primary calculations and aerodynamic factors, including drag counts, tailored to specific mission segments. The combination of these methodologies, alongside SUAVE’s iterative sizing loop, enables precise performance predictions and robust design iterations. The modified SUAVE framework thus serves as a cornerstone for analyzing hybrid-electric aircraft concepts, balancing computational precision and flexibility to accommodate unconventional propulsion technologies.

2.2. Method Calibration

To ensure accurate and meaningful results, this research begins by reverse-engineering the ATR 72-500 using literature data from manufacturer manuals and aircraft repositories, which are shown in Table 1. This initial reference aircraft is used for the validation and calibration of the foundational equations. Calibration factors are systematically derived from multiple trusted sources, including ATR performance and handling manuals [19,20,21], as well as publicly available datasets such as Jane’s All the World’s Aircraft [22].
Specifications, including top-level aircraft requirements and necessary parameters for the ATR72-500 in Table 1, were derived from the literature and are used as design specifications.
The calibration process involves iteratively refining the model outputs to ensure consistency with the known performance metrics, aerodynamic characteristics, and physical dimensions of the ATR 72-500, visualized in Figure 1. Once the model’s results align with these established parameters, the calibration is considered complete, providing a robust foundation for further studies involving advanced propulsion systems and configurations [25].

2.3. Impact of the New Propulsion Architecture

Previous research projects have identified a significant increase in the maximum lift coefficient ( c L , max ) as a potential key advantage of distributed electric propulsion systems [26]. This increase enables a reduction in wing size while maintaining or improving overall aerodynamic performance, making this approach particularly promising [26]. As a result, this study incorporates adjustments to the sizing charts to accurately capture the fundamental performance characteristics of the configuration under investigation [27]. c L , max plays a critical role in the following flight phases:
Wing Loading Based on Approach Speed [18,28]
m 0 S = v Approach 2 · ρ · c L , max 1 . 23 2 · 2 · g · m Ldg m 0
The parameters used in this equation include the maximum takeoff mass ( m 0 ) and the reference wing area (S). The approach speed ( v Approach ) is considered with a safety factor of 1.23 as per certification requirements. Air density is denoted by ( ρ ), while ( c L , max ) represents the maximum lift coefficient, which is dimensionless. The gravitational acceleration (g) is taken as 9.81 m/s2, and the maximum landing mass is ( m Ldg ).
Power loading based on take off field length [29]
P m 0 · g = K TOC · 1.2 η TP · σ · S TOFL · 2 g ρ 0 · σ · m 0 · g S · C A , max TO 3 2
The parameters in this equation include the engine power (P) and the proportionality factor ( K TOC ), which depends on the engine configuration. The propeller efficiency ( η TP ) is a dimensionless quantity that accounts for the conversion of shaft power into thrust power. The density altitude factor ( σ ) is represented by σ , while the takeoff field length ( S TOFL ) refers to the required runway distance. The maximum aerodynamic lift coefficient during takeoff ( C A , max , TO ) is also included. The proportionality factor ( K TOC ) is derived from the ATR 72-500 configuration, as the impact of the electric propulsion system cannot yet be accounted for within this formula. Further investigation is required, but this falls outside the scope of the present study.
As shown in Section 3.1, it is evident that the wing of the ATR 72-500 was not originally designed for optimal cruise conditions. However, by utilizing distributed electric propulsion, this can be achieved. The wing loading for the DEP configuration is adjusted towards the optimum for cruise flight, as illustrated in Section 3.3. As discussed in Keller et al. [26], the maximum lift coefficient increases with the number of propellers. For this study, the minimum number of propellers required to achieve the necessary c L , max is selected to ensure aerodynamic and propulsive efficiency. Since c L , max is particularly relevant for landing and low thrust conditions, the “maximum lift coefficient without propeller forces” from Keller et al. [26] is used. Operational strategies and the interaction of distributed electric propulsion with critical flight phases will be examined in future studies through the implementation of higher-fidelity surrogate models, made possible by the findings of this investigation.

2.4. Aircraft Energy System Model

In the following, the integration of the energy network into the design environment is demonstrated, including key inputs and outputs as well as geometric considerations for the tank placement. Subsequently, the network model is explained in detail, outlining each subsystem’s equations and their interactions within the energy architecture.

2.4.1. Integration Aspects of Energy Network

The throttle, which is unknown (i.e., there is an implicit solving for this unknown) in these calculations, is therefore the input for the energy network. For the design process, the mass and the volume of each component are required to calculate the center of gravity and allocate the corresponding volume within the aircraft. These parameters significantly influence the geometry of the configuration. The liquid hydrogen tank plays a unique role in this process and is incorporated into the fuselage. See Figure 2; the following relations are used:
The required tank lengths l for the fuel tanks are based on the fuel mass and tank geometry, considering a cylindrical volume with end caps. The diameter of the fuel tank is based on the fuselage width: D = Fuselage width. The volume of each section is given as the volume of a cylinder V cylinder = π D 2 4 l and the volume of ellipsoidal end caps, where k is a flattening factor and defined as 0.1 for V cap = k · π D 3 6 . Since each tank has two end caps, their total volume is V caps = k · π D 3 3 . The total volume of one tank is therefore V tank = π D 2 4 l + k · π D 3 3 .
Since the tank stores liquid hydrogen, the total volume must equal the volume occupied by the fuel. This relationship is determined by the fuel mass m fuel and the density of liquid hydrogen ρ LH 2 : V tank = m fuel ρ LH 2 .
The density of liquid hydrogen is given by ρ LH 2 = 71 kg / m 3 , as well as the volumetric efficiency (allowances), which is assumed to be η v = 0.927 [30]. The values used for the tank calculations refer to a pressure of 1.2 to 1.4 B a r a , as stated by Brewer et al. [30]. The pressures and the thermodynamic behavior of L H 2 over time are not considered in detail. This aspect is accounted for through the allowances. Additionally, the tank’s inner diameter is assumed to be 85% of the fuselage diameter ( s t = 0.85 ) to account for structures and insulation.
This leads to the following expression for the required tank length:
l = 4 π D 2 · m fuel ρ LH 2 k D · 1 η v · s t + 2 k D
This value is then stored in the iterative sizing process and used to extend the fuselage by the corresponding length. The position of the fuel tank is assumed to be located behind the cabin. The Gravimetric Index is defined as 0.35. For the initial design, the topology illustrated in Figure 2 was used. The FC system, cooling components, and hydrogen tank are positioned within the fuselage, while the electric propulsion motors and corresponding power converters are located in the nacelles. This configuration facilitates efficient space allocation with minimal effort, as the aerodynamic effects of a fuselage extension can be easily accounted for. The component-based structure of SUAVE, organized into distinct classes, enables future adjustments to the topology to be implemented.

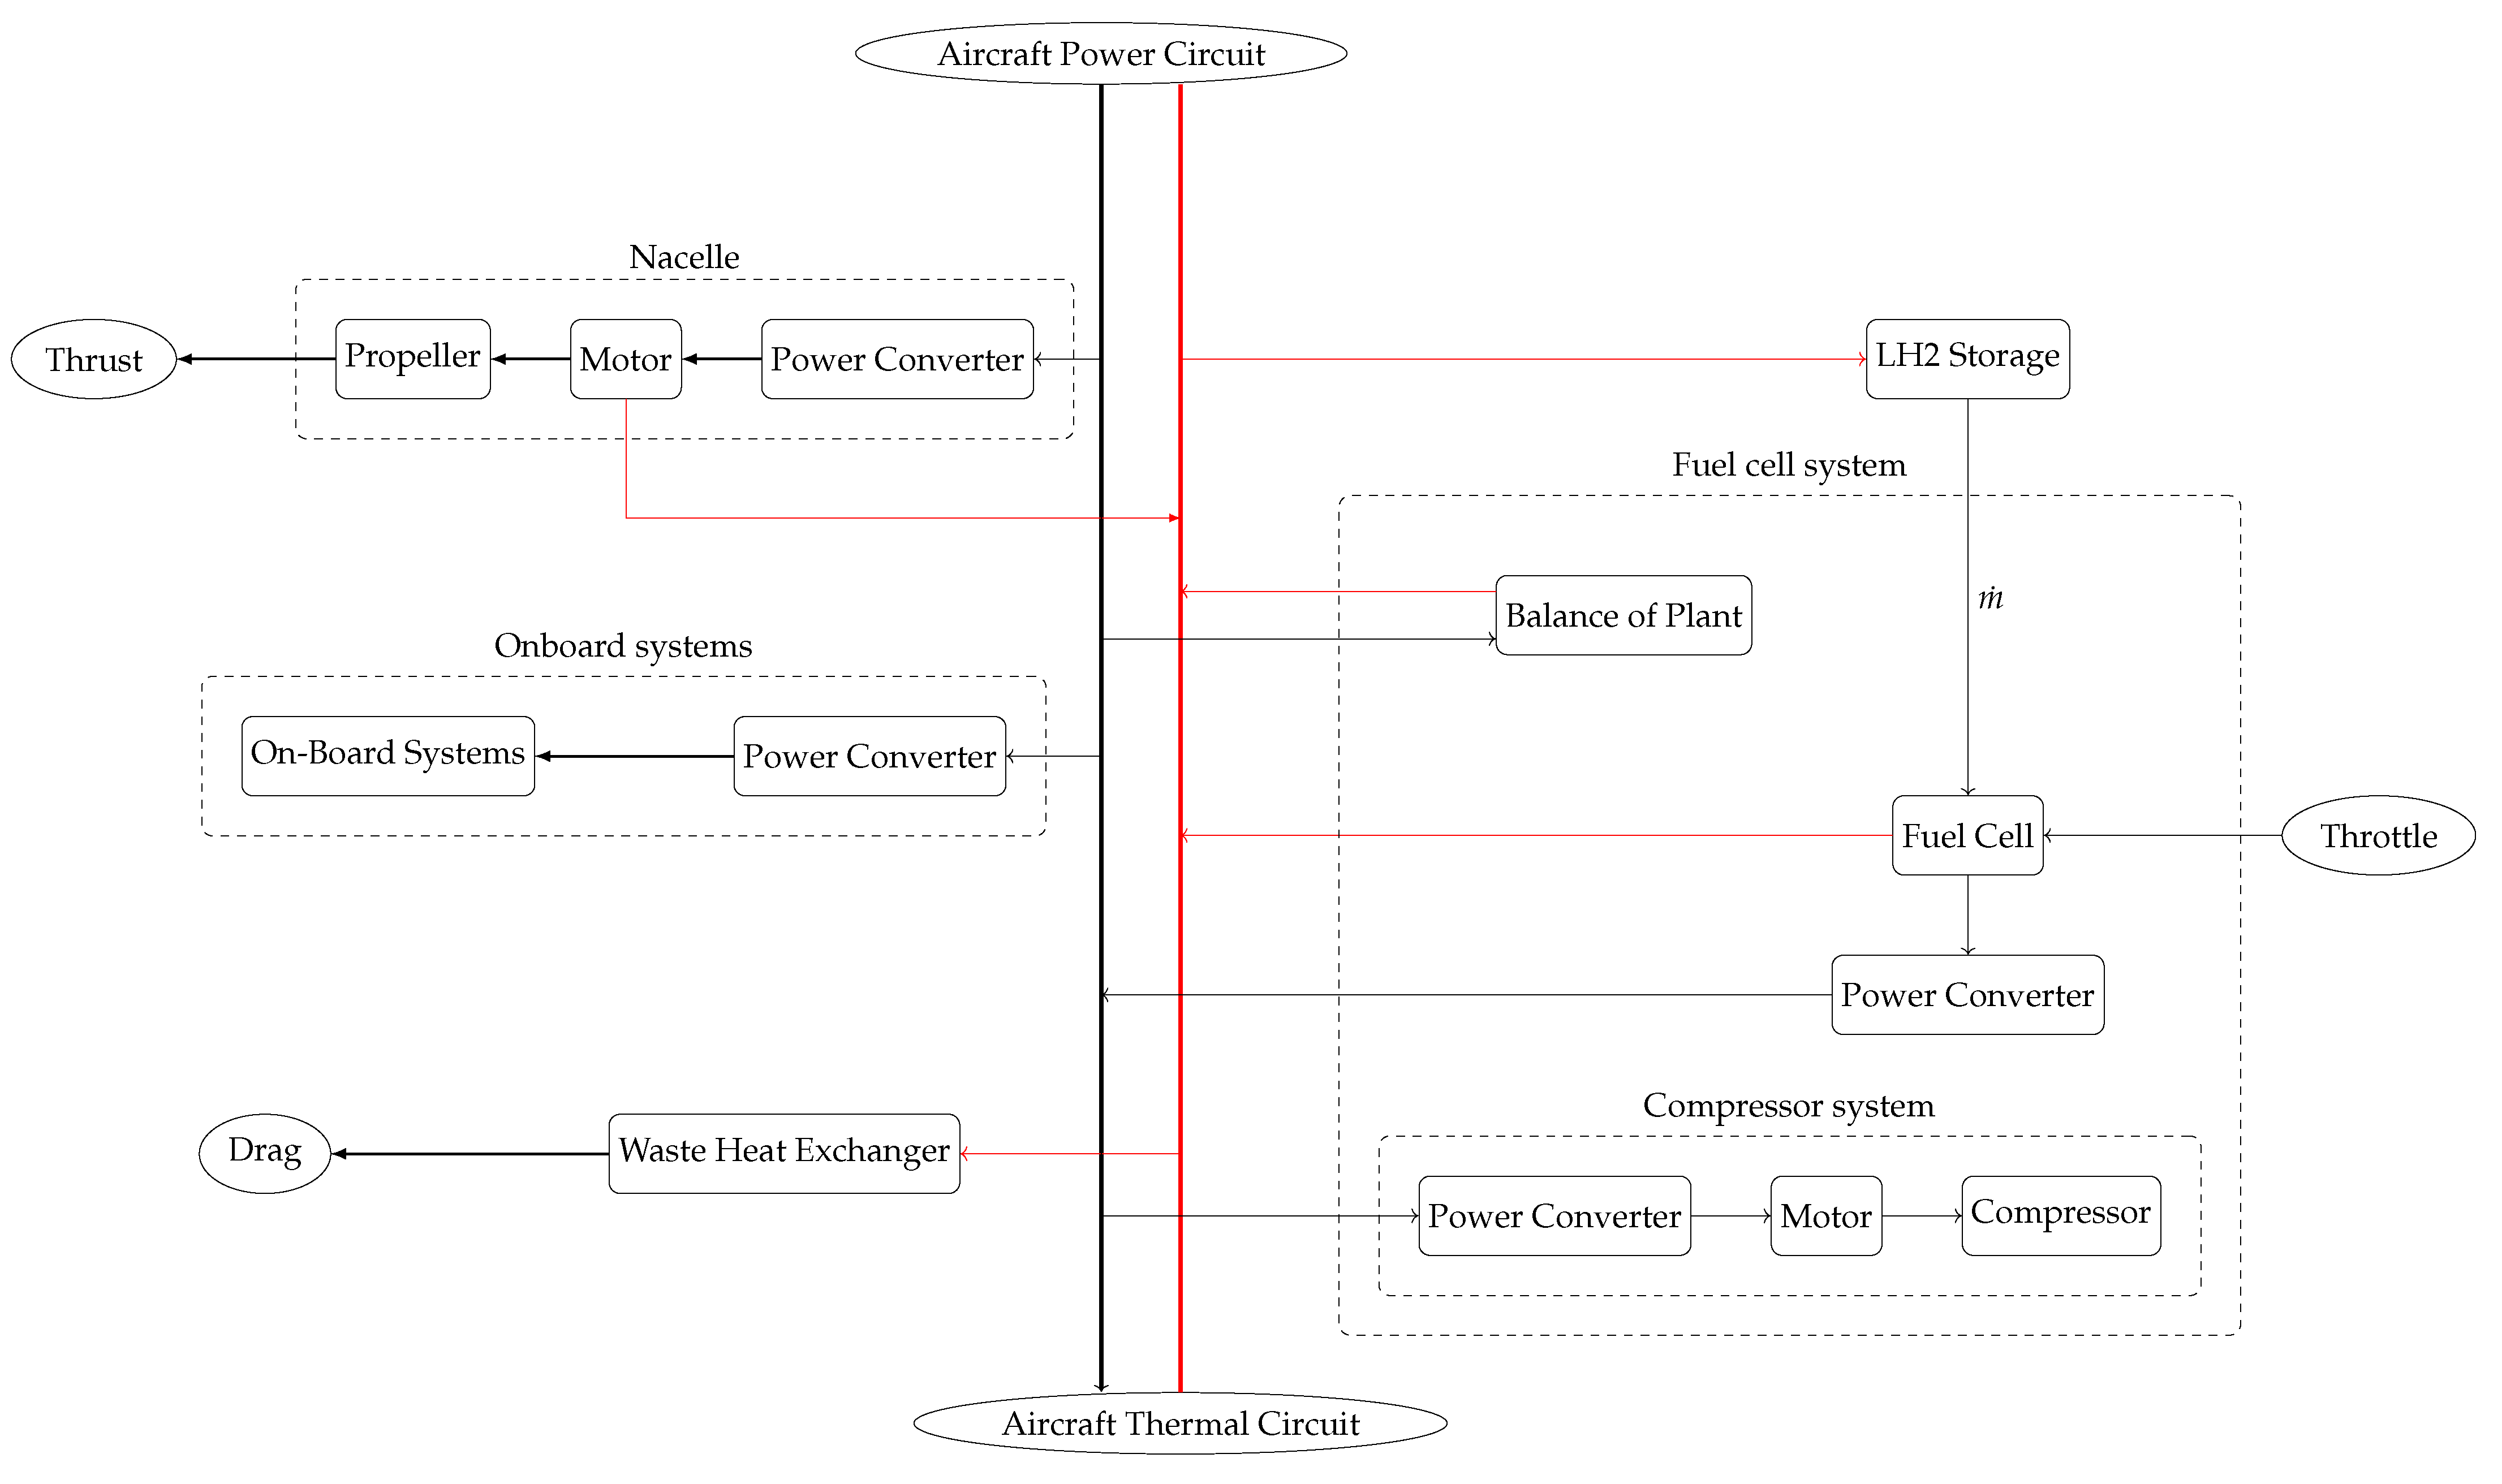
2.4.2. Energy Network Model

The energy network model represents the propulsion architecture, illustrated in Figure 3. To avoid reverse calculations, the throttle is directly applied to the FC to obtain an explicitly solvable system of equations, as mentioned in Section 2.1. As outputs of the energy network, the thrust, waste heat, and hydrogen mass flow computed by the energy system are returned to the design loop.
Hydrogen is fed from the tanks to the FCs, and the electric power output of each cell is then routed to the main aircraft power circuit via a power converter. From there, power is provided to the propulsion motors driving the propellers, electric motors driving compressors for each FC’s air supply, and other onboard systems like avionics, environmental control systems, etc., with separate power converters considered for each of these. Additionally, power is provided to other necessary FC balance of plant components, such as humidifiers, recirculation blowers, or cooling pumps.
In addition, power is also needed for the main aircraft thermal circuit, which manages waste heat from the FC systems and propulsion motors and dissipates it via the main heat exchangers, which is taken into account by a constant additional resistance value per mission section, but will be taken into account exactly in the future depending on the operating conditions.
The model also considers a buffer battery to account for the transient behavior of the FC. However, these do not affect the operation of the model during mission analysis but only contribute to their masses and volumes during vehicle sizing. The sizing is performed by assuming a buffer capacity of 0.15 h at nominal power.
All other components of the model are represented by simple, physics-based equations and a set of parameters derived from literature for an optimistic future scenario. In the following, the model equations used for the energy network are presented and explained, with the corresponding parameter values provided in the Appendix A.
Fuel Cells Including Power Converters
As mentioned before, the throttle T ( t ) in SUAVE is directly applied to the FCs to set the FC output power P el , out FC ( t ) using
P el , out FC ( t ) = T ( t ) · P el , out FC , max
with P el , out FC , max being the maximum rated FC power. The output power of the FC power converters P el , out F C P C ( t ) is then determined using the efficiency of the converters η ( FC - PC ) :
P el , out FC - PC ( t ) = P el , out FC ( t ) · η ( FC - PC )
To describe the efficiency of the FCs themselves, ε el FC ( P el , out FC ( t ) ) representing the specific electric energy drawn from the FCs in kWh per kg of hydrogen input is calculated with the following linear correlation:
ε el FC ( P el , out FC ( t ) ) = ε el FC , r 1 α FC 1 P el , out FC ( t ) P el , out FC , max
where ε el FC , r is the specific energy drawn at rated power and α F C is the factor representing the dependence of the specific energy on the FC load factor. The origin of this equation is further explained in Appendix A.1. Note that for the network setup in this study, the load factor used in this equation equals the throttle setting of the system mentioned in Equation (4).
The value calculated above can then be used to determine the required hydrogen mass flow M H 2 FC ( t ) with
M H 2 FC ( t ) = P el , out FC ( t ) ε el FC ( P el , out FC ( t ) )
as well as the air mass flow using the fuel to air ratio f Air FC :
M Air FC ( t ) = M H 2 FC ( t ) · f Air FC
Using the difference between the total specific energy released from the hydrogen ε tot F C and the above calculated ε el FC ( P el , out FC ( t ) ) , the waste heat from the FC Q heat FC ( t ) can now also be calculated as follows:
Q heat FC ( t ) = M H 2 FC ( t ) · ε tot FC ε el FC ( P el , out FC ( t ) )
Fuel Cell Balance of Plant (BOP)
The power required for the additional FC balance of plant components like humidifiers or water separators, but excluding air compressors and thermal management systems P el , out FC - PC ( t ) , is calculated using a power factor k BOP :
P el FC - BOP ( t ) = k BOP · P el , out FC ( t )
Fuel Cell Air Compressor
The input power for the air compressors required for FC operation P mech ( FC - AirComp ) ( t ) can, according to [31], be described by
P mech ( FC - AirComp ) ( t ) = M Air FC ( t ) N FC N ( FC - AirComp ) · c p , air · T amb ( t ) η ( FC - AirComp ) · 1.05 p FC p amb ( t ) γ 1 γ 1
where N ( FC - AirComp ) is the number of compressors, c p , air is the heat capacity of the air, T amb ( t ) is the ambient temperature, η ( FC - AirComp ) is the compressor efficiency, γ is the isentropic exponent of the air, and p F C and p amb ( t ) are FC input pressure and ambient air pressure, respectively.
The necessary output power of the compressor electric motors P mech ( FC - AirCompM ) ( t ) is equal to the compressor input power, while the input power P el , out ( FC - AirCompM - PC ) ( t ) and output power P el , in ( FC - AirCompM - PC ) ( t ) of the corresponding power converters is calculated using the efficiency of the motors η ( FC - AirCompM ) and converters η ( FC - AirCompM - PC ) , respectively:
P mech ( FC - AirCompM ) ( t ) = P mech ( FC - AirComp ) ( t )
P el , out ( FC - AirCompM - PC ) ( t ) = P mech ( FC - AirCompM ) ( t ) η ( FC - AirCompM )
P el , in ( FC - AirCompM - PC ) ( t ) = P el , out ( FC - AirCompM - PC ) ( t ) η ( FC - AirCompM - PC )
LH2 Storage
The total hydrogen mass flow M H 2 LH 2 S ( t ) from the fuel tanks is determined by:
M H 2 LH 2 S ( t ) = N FC · M H 2 FC ( t )
with N FC being the number of FCs in the system.
In order to provide the necessary vaporization enthalpy Δ H v H 2 to the hydrogen stored in liquid form, a heat flow Q heat LH 2 S ( t ) must be provided to the tanks:
Q heat LH 2 S ( t ) = M H 2 LH 2 S ( t ) · Δ H v H 2
Aircraft Thermal Circuit
The amount of waste heat that needs to be dissipated from the aircraft via each main heat exchanger can then be calculated as follows:
Q heat WHex ( t ) = N FC · Q heat FC ( t ) Q heat LH 2 S ( t ) N WHex
where N WHex is the number of heat exchangers. The power to run the aircraft thermal circuit P el ATC ( t ) is based on the work of NASA [32] and simplified to
P el ATC ( t ) = 0.371 · Q heat FC ( t ) + 1.33 kW
While this empirical equation does not yet account for changing temperatures for example, it represents the average conditions for the flight profile assuming standard atmosphere.
Power Off-Take for On-Board Systems
A constant power off-take P el POT for other onboard consumers is assumed that needs to be provided as the output power of a corresponding power converter P el , out ( POT - PC ) ( t ) :
P el , out ( POT - PC ) ( t ) = P el POT t
The required input power for the converter is determined by its efficiency η ( POT - PC ) :
P el , in ( POT - PC ) ( t ) = P el , out ( POT - PC ) ( t ) η ( POT - PC )
Power Balance Aircraft Power Circuit
Losses in the aircraft power circuit are accounted for using
P el APC , loss = N FC P el , out ( FC - PC ) ( t ) ( 1 η APC )
with η A P C representing the efficiency of the power circuit. Finally, the power provided to the electric propulsion motor converters P el , in ( PM - PC ) ( t ) can be determined using the following power balance:
P el , in ( PM - PC ) ( t ) = 1 N PM ( N FC P el , out ( FC - PC ) ( t ) N ( FC - BOP ) P el ( FC ) ( t ) N ( FC - AirComp ) P el , in ( FC - AirCompM - PC ) ( t ) P el , in ( POT - PC ) ( t ) P el ATC ( t ) P el APC , loss )
Propulsion Motors Including Power Converters
The output power of the propulsion converters P el , out ( PM - PC ) ( t ) can then be determined using their efficiency η ( PM - PC ) by
P el , out ( PM - PC ) ( t ) = P el , in ( PM - PC ) ( t ) · η ( PM - PC )
and the shaft power P mech PM ( t ) supplied to the propulsors by the propulsion motors by
P mech PM ( t ) = P el , out ( PM - PC ) ( t ) · η PM
where η PM is the propulsion motor efficiency.
Masses and Volumes
During vehicle sizing, the masses and volumes of all components are calculated using values for gravimetric and volumetric power density, respectively:
m Component = P el , out ( Component , max ) p m Component
V Component = P el , out ( Component , max ) p V Component
Here, m Component and V Component are the calculated mass or volume of the component, P el , out ( Component , max ) is the rated power of the component used for sizing, and p m Component and p V Component are the gravimetric and volumetric power density of the component, respectively.
These equations are used for every component except for the tank and buffer battery and are listed in detail in Appendix A.3 for mass calculations and Appendix A.4 for volumes, respectively. The calculations for the tank are described in Section 2.4.1.
For the battery, its capacity is first determined using a sizing factor τ ( FC , trans ) :
C Bat = τ ( FC , trans ) · P el , out ( FC , max )
where C Bat represents the battery capacity and P el , out ( FC , max ) is the rated FC power. Mass and volume of the battery are then determined using the specific energy c e , m Bat and energy density c e , V Bat of the battery:
m Bat = C Bat c e , m Bat
V Bat = C Bat c e , V Bat
with m Bat being the mass and V Bat the volume of the battery. These formulas describe the complete energy system integrated within SUAVE.

2.5. Assessment and Figure of Merit

For a meaningful evaluation of the concepts, selecting an appropriate figure of merit is essential. Since this study focuses on assessing efficiency improvements, the Energy Specific Air Range (ESAR) is chosen as the primary metric. Additionally, for the evaluation of off-design performances, the ESAR is further adapted to align with the specific conditions of it.

2.5.1. Energy Specific Air Range

The (ESAR) is derived from the well-known Specific Air Range (SAR) [33], which is typically defined as:
SAR = d R d m
where d R represents the change in range and d m the change in the aircraft mass. Since two different energy carriers are compared, the change in mass is not a relevant parameter and is therefore replaced by energy as the defining metric. To obtain an energy-based performance indicator at the aircraft level, the concept of ESAR is developed. This metric takes into account both the propulsion system efficiency and aircraft-specific parameters. An ESAR formulation is given by the adapted equation of Seitz et al. [34]:
ESAR = d R d E = V 0 · L D TSPC · m 0 · g
This formulation shows that the aircraft range is directly related to the lift-to-drag ratio L D , and overall efficiency of the propulsion system. In summary, the Energy Specific Air Range (ESAR) is a comprehensive figure of merit that enables the comparison of efficiency gains for modern propulsion systems, whether thermal or electrical, by accounting for the entire efficiency pathway from the energy source to the produced thrust, which leads to synergies through better aerodynamics. This can be effectively represented using a Ladder Chart, which splits the respective parameters accordingly and references them to the comparative aircraft, as illustrated in Section 3.3.

2.5.2. Improvements for the Off-Design Assessment

As described in Section 1, a more significant variation in performance outside the design point can be expected for configurations utilizing hydrogen as an energy carrier. This is primarily because the tank, rather than the energy carrier itself, is the dominant factor in terms of the required volume and mass and, therefore, is not mission dependent.
A performance matrix based on ESAR, incorporating multiple off-design points with adapted mission profiles, is integrated into the payload-range diagram to evaluate this effect. Therefore, the figure of merit (i.e., ESAR) is further refined by incorporating the mass of the payload m payload , while energy (E) and range (R) are expressed as total values now to account for the performance of off-design points appropriately. As a result, the Energy Specific Payload Air Range (ESPAR) emerges as the figure of merit for the off-design analysis.
ESPAR = E R · m payload
This approach enables a comprehensive evaluation of performance across all relevant missions. In this context, higher-fidelity methods become increasingly significant.

3. Results

As mentioned in Section 1, all relevant results of the three configurations are presented, namely the reference, baseline, and lead configuration. The results include the sizing chart, which forms the basis of the designs. Additionally, the physical properties of the configurations, including masses and geometries, as well as their calibration parameters, are outlined. The performance is depicted using payload-range diagrams and ladder charts as figures of merit for the assessment. As a final representation of performance, the EPSAR is incorporated as a figure of merit across various off-design points within the payload range.

3.1. Reference Configuration

The reference configuration sizing chart in Figure 4 illustrates the design space, with key constraints marked in thick red. The wing loading results in 352 kg / m 2 , as specified in Section 2.2, since it reflects the sizing chart of the ATR 72-500. As shown in green, the cruise constraint gets its minimum and hence optimum for lowest power loading to the right of the approach speed constraint.
Thus, the resulting design point shows that the wing loading for optimal cruise conditions does not fall within this area. As described in Section 2.3, this means the wing area is too big for optimum cruise but is needed to allow acceptable approach speeds and relatively low power loading for an acceptable take-off distance. The design space is located in the upper-left region and is bounded by the thick red lines, where the approach speed is represented as a horizontal line, the service ceiling as a vertical line, and the take-off distance as an exponential curve.
The stated results were calculated using the following calibration factors (see Section 2.2) given in Table 2. The calibration factors show that they are all in the expected regions, except for the wing and fuselage factors. These deviations might originate from the family concept with the ATR 42, which has a similar fuselage and wing to keep the additional detailed design to a minimum.
Due to the low fidelity of low-speed aerodynamic calculations with high-lift devices, significant calibration is required for takeoff and landing, as shown in Table 3.
As shown in Section 4.1, the calibration results in a deviation of 0.5% in the Maximum Takeoff Mass and 0.01% in the Operating Empty Mass. As can be seen in Section 4.1. the payload-range characteristics of the ATR 72-500 and the reference configuration are very close to each other. This, along with their similar masses and geometries, indicates the successful calibration of the reference configuration.

3.2. Baseline Configuration

The results of this configuration, as shown in Figure 5, demonstrate the effects of an improved Power Specific Fuel Consumption (PSFC) by 28% [25] on the otherwise unchanged reference configuration. The improved PSFC results in a mass reduction of −5.6% and an overall improvement in SAR by 44%.

3.3. Lead Configuration
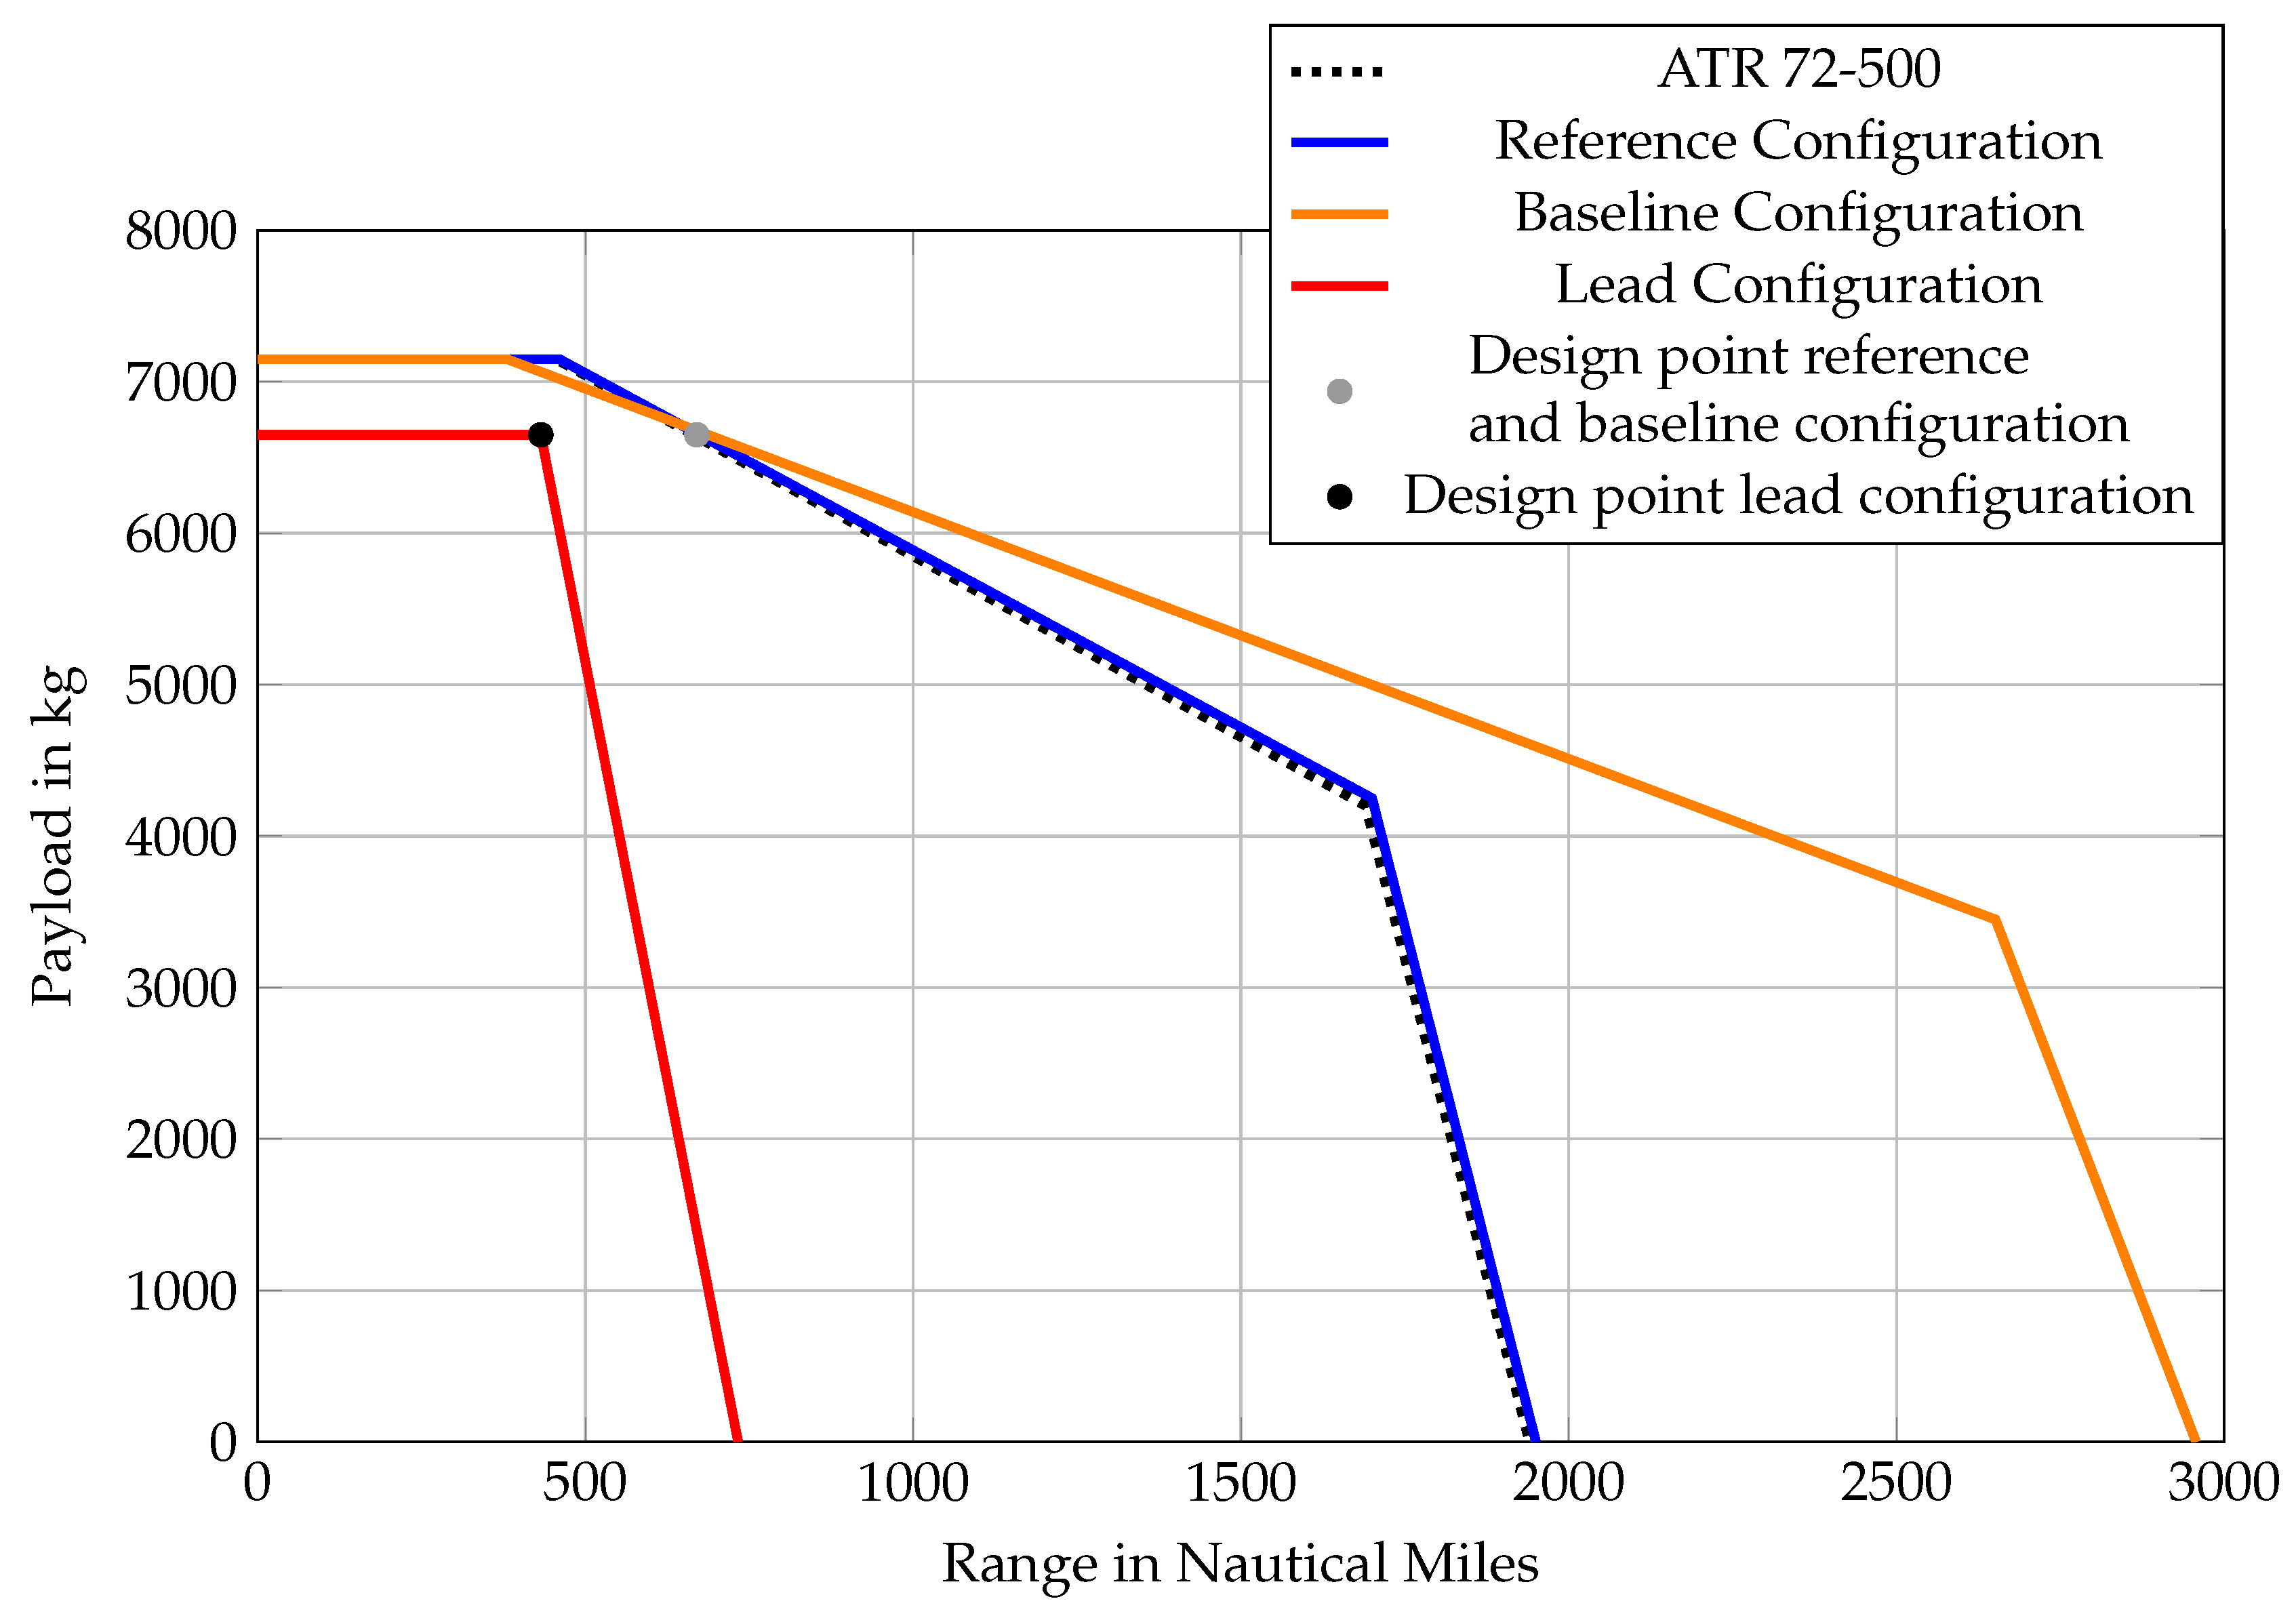
The design point of this configuration is optimized for cruise, which can be seen in Figure 6, resulting in a wing loading of 440 kg/m2 with a c L , max of 3.3 and a power loading of 0.16 kW/kg. As described in Section 2.3, the minimum possible number of propellers was selected, leading to a configuration with 10 propellers. Since the option to consider a battery electric configuration should be preserved for future research, the design range has been reduced to 800 km, while all other TLARs mentioned in Section 2.2 have been maintained.
With a significant improvement in PSFC and an increase in wing loading, which leads to a 4% aerodynamic enhancement in cruise, the ESAR improves by 28% compared to the baseline configuration, considering the same design mission; see Figure 7. This significant gain is primarily limited due to the approximately 3.5 times heavier propulsion system.

4. Discussion

The following section presents the effects on the three configurations’ mass, geometry, and performance. Subsequently, a detailed performance assessment is conducted, examining the variations in efficiency outside the design point and relating them to real-world applications.

4.1. Comparison

The mass examination highlights the effects of the significantly heavier powertrain in the FC configuration and the resulting mass increases in other components, such as the landing gear, which is strongly affected by this additional weight due to snowball effects, see Table 4. Furthermore, the space required for the fuel cell and tanks within the fuselage and the resulting elongation lead to a noticeable increase in overall mass.
Further significant variations are presented in Table 5, which, despite the mass increase, features a reduced reference wing area enabled by the higher c L , max . Additionally, the fuselage is nearly three meters longer, and due to the aft-shifted center of gravity (CG), the main wing origin is positioned three meters further aft.
In the payload-range diagram in Figure 8, the differences in operational flexibility are clearly evident. It is apparent that, for a conventional turboprop aircraft, an improvement in PSFC significantly expands the potential mission envelope. Moreover, for configurations with hydrogen as the energy carrier, the adjusted design range restrictions and the abrupt downturn of the MTOM curve immediately after the design point additionally limit the operational range.

4.2. Off-Design

The energy network model, which incorporates interactions with the mission profile, enables a wide range of analyses. Figure 7 illustrates the potential savings of the lead configuration compared to the baseline configuration for the design mission of the lead configuration. However, considering off-design points reveals that these potential savings diminish significantly outside the design mission.
Figure 9 illustrates a payload-range diagram depicting the percentage deviation of ESPAR performance relative to the design point. The diagram has been cropped for small ranges and payloads to highlight the relevant region. Within this region, the progression of the respective ESPAR values is shown, referenced to the design point. Dark violet indicates zero deviation from the design point, while the color gradient towards yellow represents the percentage degradation of ESPAR. The dashed lines indicate constant ESPAR values, making it evident that ESPAR decreases not only with decreasing payload but also with decreasing range.
The results presented in Section 4 indicate that the variation with respect to payload is significantly stronger than the variation with respect to range. To make the deviation over the range more visible, the ESPAR is differentiated with respect to the range for different payload values, d d R ESPAR ; see Figure 10. For example, the ESPAR of the lead configuration declines by 7.7% from the off-design point with a 5000 kg payload from 500 NM to 250 NM range. This highlights the necessity of evaluating new aircraft concepts not only at the design point but also in off-design conditions. In future research, these insights will be further applied to market data to assess the overall impact.

5. Conclusions

The study evaluates the potential and challenges of integrating hydrogen-based propulsion systems into regional aircraft, with a particular focus on highly integrated aircraft configurations featuring distributed electric propulsion (DEP). Through a rigorous design and calibration process using the SUAVE framework, three aircraft configurations (reference, baseline, and lead) were assessed to quantify the benefits of advanced propulsion architectures.
The integration of FC technology with DEP also introduces potential new risks that must be addressed in future research. While this study focuses on the overall aircraft design, it is essential to acknowledge key safety challenges related to high-voltage power distribution, insulation requirements, and redundancy strategies to ensure operational safety.
Furthermore, while the subsystems of current FC systems ensure most of the necessary functions in an electrified propulsion system, the development of reliable design solutions for cold start, in-flight restart, and emergency shutdown is still required [35]. These operational aspects are critical for ensuring the reliability of hydrogen fuel cell systems in aviation applications, particularly in adverse environmental conditions.
High-voltage electrical architectures necessary for DEP pose challenges such as electric arcing, insulation breakdown, and electromagnetic interference, which could impact system reliability. Additionally, thermal management strategies for power electronics and energy storage systems must be optimized to mitigate risks related to overheating and potential failure. The safety implications of hydrogen as an energy carrier further necessitate robust fault detection and isolation strategies to prevent hazardous scenarios.
Based on this preliminary data, higher-fidelity models will be developed, which will feed back into the OAD framework. In particular, the results of this study will contribute to the refinement of a detailed thermal management system (TMS) surrogate model, which will facilitate the consideration of ISA variations in the next research stage to better represent real-world conditions. Moreover, the dependency of fuel cell and fuel tank operations on operating pressure will also be integrated into those models, as well as the possible need for a hydrogen compressor for the fuel cell system in some cases.
This investigation also highlights the necessity of a new assessment approach and integrating its findings into preliminary aircraft design, which will be examined in greater detail in future studies. Implementing higher-fidelity formulations and their impact plays a crucial role in this evaluation.
A key novelty of this study is the full transparency of the energy network model, including all equations governing the propulsion and energy system, as well as the detailed calibration factors used in the design process. By making these equations publicly available, this work ensures that engineers and researchers can replicate the results, validate methodologies, and build upon the findings to further refine hybrid-electric aircraft design. The open-access approach fosters reproducibility and accelerates advancements in sustainable aviation technology by providing a robust framework for future studies.
The findings demonstrate that integrating fuel cell electric propulsion with DEP can lead to significant improvements in energy efficiency, provided that key design trade-offs, such as mass penalties, are carefully addressed. The lead configuration, optimized for cruise conditions, achieved a 28% improvement in Energy Specific Air Range (ESAR) compared to the baseline, despite a 13% increase in operating empty mass. However, off-design performance assessments revealed that hydrogen-based aircraft configurations exhibit sensitivity to mission variations, implicating the need for refined operational planning.
The payload-range diagrams and ESAR-based performance metrics indicate that hydrogen aircraft require tailored mission planning strategies to maximize operational efficiency. Moreover, the integration of LH2 storage and DEP necessitates novel aircraft design considerations, including optimized fuselage layouts, refined mass and balance, and enhanced aerodynamic efficiency.
By advancing methodologies for hybrid-electric and hydrogen-powered aircraft design and ensuring full transparency in its modeling framework, this research contributes to the broader goal of achieving climate-neutral aviation while maintaining competitive operational schedules. The insights presented pave the way for further investigation into sustainable propulsion systems, ultimately supporting the transition to low-emission air transport. Future research will focus on improving energy systems modeling, refining off-design performance evaluations, and addressing key challenges in certification and operational integration.

Author Contributions

Conceptualization, J.S., Y.F. and J.M.; methodology, J.S. and Y.F.; software, J.S. and J.M.; investigation, J.S. and J.M.; resources, J.S. and Y.F.; writing—original draft preparation, J.S.; writing—review and editing, J.S., Y.F., J.M., R.H.-R. and A.S.; visualization, J.S.; supervision, R.H.-R. and A.S.; project administration, R.H.-R. and A.S. The energy network section was primarily developed by Y.F. and R.H.-R. All authors have read and agreed to the published version of the manuscript.

Funding

This research was funded by the Deutsche Forschungsgemeinschaft (DFG, German Research Foundation) Project ID 498601949—TRR 364.

Data Availability Statement

Data are contained within the article.

Conflicts of Interest

The authors declare no conflicts of interest.

Abbreviations

The following abbreviations are used in this manuscript:
ATRFrench: Avions de Transport Régional,
Italian: Aerei da Trasporto Regionale,
lit.: ‘Regional Transport Airplanes’
APCAircraft Power Circuit
ATCAircraft Thermal Circuit
BOPBalance of Plant
c L , m a x Maximum Lift Coefficient
CGCenter of Gravity
DEPDistributed Electric Propulsion
EASAEuropean Union Aviation Safety Agency
EISEntry Into Service
ESAREnergy Specific Air Range
ESPAREnergy Specific Payload Air Range
FCFuel Cell
FC-PCFuel Cell-Power Converter
HTPHorizontal Tail Plane
ISAInternational Standard Atmosphere
LH2Liquid Hydrogen
MACMean Aerodynamic Chord
MTOMMaximum Take-Off Mass
NMNautical Mile
OADOverall Aircraft Design
OEMOperating Empty Mass
PMPropulsion Motor
POTPower Off-Take
PSFCPower Specific Fuel Consumption
SARSpecific Air Range
SUAVEStanford University Aerospace Vehicle Environment
SynTracSynergies of Highly Integrated Transport Aircraft
TMSThermal Management System
TRLTechnology Readiness Level
VTPVertical Tail Plane
WHexWaste Heat Exchanger

Appendix A. Model Derivation and Parameters

Appendix A.1. Fuel Cell Equations

The total specific energy ε t o t F C in kWh/kg states how much energy can be released from the hydrogen fuel. It can be calculated using the molar enthalpy of the hydrogen oxidation reaction Δ R h , the molar mass of hydrogen M H 2 and the fuel efficiency of the FC stack η f u e l F C , which is the stoichiometric ratio of hydrogen consumed to the amount of hydrogen fed to the stack:
ε t o t F C = Δ R h · η f u e l F C M H 2
In contrast, the specific electric energy ε e l F C describes how much electric energy is produced from the hydrogen, and can be described as follows:
ε e l F C = U c e l l 2 F · η f u e l F C M H 2
where U c e l l is the mean cell voltage of the stack and F is the Faraday constant. The cell voltage can thus also be used as a measure of efficiency for the cell. It changes depending on the operating conditions, but above all depending on how much current is drawn from the cell. This can be shown using the FC polarization curve as in Figure A1a, which shows the cell voltage U c e l l over the current density I, which is the current per cell surface area and measured in A/cm2. This results in a maximum theoretical power output of the cell. Increasing the current density further, will lead to a decrease in power due the dropping voltage, as can be seen in Figure A1b,c, which show the power output of the cell P e l F C over the current density and cell voltage over power output, respectively. The rated power of a FC P e l F C , r is usually set slighty below this maximum peak. The direct relation of ε e l F C and U c e l l can also be seen when comparing Figure A1c,d, where the drawn power was also normalized to the maximum rated power of the cell P e l F C , r / P e l F C , r .
Figure A1. Different operating points of the FC stack shown on (a) the FC characteristic curve, (b) the power over current density curve, (c) the voltage over power curve and (d) the specific energy over the load factor.
Aerospace 12 00249 g0a1
The resulting curve can now be fitted by a linear approximation using Equation (6) of the network model. To determine the parameters, two operating points must be examined, one at part-load (1) and one at rated power (2). The parameters can then be calculated as follows:
ε e l F C , r = U c e l l , ( 2 ) 2 F · η f u e l F C M H 2
ε e l F C , ( 1 ) = U c e l l , ( 1 ) 2 F · η f u e l F C M H 2
α F c = 1 ε e l F C , r · ε e l F C , r ε e l F C , ( 1 ) 1 P e l F C , ( 1 ) P e l F C , r
with U c e l l , ( 1 ) and U c e l l , ( 2 ) being the voltages measured at the two operating points. Note that α F c will always be negative, because ε e l F C is higher in part-load conditions. For this study, ε e l F C , r and α F c have been chosen based on expected FC performance.

Appendix A.2. Energy-Related Parameters

Table A1. Energy-related parameters.
SymbolName/MeaningValueRef.
η P M Efficiency of propulsion motor (in %)95[36]
η ( P M P C ) Efficiency of propulsion motor power converters (in %)99[36]
η A P C Efficiency of Aircraft Power Circuit (in %)99.5[36]
η ( F C P C ) Efficiency of fuel cell power converters (in %)97[36]
ε el ( F C , r ) Specific electric energy from fuel cell feed (kWh/kg)20[37]
α F C Factor for variable specific energy from fuel cell feed−0.5[37]
ε tot F C Specific total energy from fuel cell feed (kWh/kg)33.3[37]
f Air F C Fuel cell air demand factor (kgAir/kgH2)60[38]
k B O P Factor for BOP power demand (kW/kW)0.01[37]
η ( F C A i r C o m p ) Efficiency of air compressor (in %)87[39]
η ( F C A i r C o m p M ) Efficiency of air compressor motor (in %)95[36]
η ( F C A i r C o m p M P C ) Efficiency of air compressor motor power converters (in %)99[36]
P el P O T Constant power off-take (kW)150[40]
η ( P O T P C ) Efficiency of consumer power converters (in %)97[36]
Δ H v H 2 Specific vaporization enthalpy of H2 (kWh/kg)0.125[41]
c p , air Isobaric heat capacity of air (kWh/kgK) 2.8 × 10 4 [42]
γ Isentropic exponent of air1.4[42]
τ ( F C , trans ) Sizing factor for buffer battery (h)0.15[43]
FFaraday constant kAs/kmol96,485[31]
M H 2 Molar mass H 2 kg/kmol2[31]

Appendix A.3. Mass-Related Formulation and Parameters

m F C = P el , out ( F C , max ) p m F C
m ( F C P C ) = P el , out ( F C P C , max ) p m ( F C P C )
m ( F C B O P ) = P el ( F C B O P , max ) p m ( F C B O P )
m ( F C A i r C o m p ) = P mech ( F C A i r C o m p , max ) p m ( F C A i r C o m p )
m ( F C A i r C o m p M ) = P mech ( A i r C o m p M , max ) p m A i r C o m p M
m ( F C A i r C o m p M P C ) = P el , out ( A i r C o m p M P C , max ) p m ( A i r C o m p M P C )
m B a t = C B a t c e , m B a t
m ( B a t P C ) = P el , out ( B a t P C , max ) p m ( B a t P C )
m W H e x = Q heat ( W H e x , max ) q m W H e x
m A T C = Q heat ( A T C , max ) q m A T C
m ( P O T P C ) = P el , out ( P O T P C , max ) p m ( P O T P C )
m A P C = P el ( A P C , max ) p m A P C
m ( P M P C ) = P el , out ( P M P C , max ) p m ( P M P C )
m P M = P mech ( P M , max ) p m P M
m L H 2 S = m L H 2 η m L H 2 S
m tot = j N ( j ) · m ( j )
Table A2. Mass-related parameters.
SymbolName/MeaningValueRef.
p m F C Gravimetric power density Fuel Cell (kW/kg)3.5[37]
p m ( F C P C ) Gravimetric power density Fuel Cell converters (kW/kg)25[36]
p m ( F C B O P ) Gravimetric power density Fuel Cell balance of plant (kW/kg)                          10[37]
p m ( F C A i r C o m p ) Gravimetric power density air compressor (kW/kg)12[44]
p m A i r C o m p M Gravimetric power density air compressor motor (kW/kg)10[36]
p m ( A i r C o m p M P C ) Gravimetric power density air compressor motor power converter (kW/kg)100[36]
c e , m B a t Specific Energy battery (kWh/kg)0.3[43]
p m ( B a t P C ) Gravimetric power density battery converters (kW/kg)25[36]
q m W H e x Gravimetric power density heat exchanger (kW/kg)2[37]
q m A T C Gravimetric power density aircraft thermal circuit (kW/kg)5.5[37]
p m ( P O T P C ) Gravimetric power density consumer power converters (kW/kg)25[36]
p m A P C Gravimetric power density aircraft power circuit (kW/kg)500[36]
p m ( P M P C ) Gravimetric power density propulsion motor power converters (kW/kg)100[36]
p m P M Gravimetric power density propulsion motor (kW/kg)10[36]
η m L H 2 S LH2 gravimetric storage density (kg/kg)1[45]

Appendix A.4. Volume-Related Formulation and Parameters

V F C = P el , out ( F C , max ) p v F C
V ( F C P C ) = P el , out ( F C P C , max ) p v ( P C P C )
V ( F C B O P ) = P el ( F C B O P , max ) p v ( F C B O P )
V ( F C A i r C o m p ) = P mech ( F C A i r C o m p , max ) p v ( F C A i r C o m p )
V ( F C A i r C o m p M ) = P mech ( A i r C o m p M , max ) p v A i r C o m p M
V ( F C A i r C o m p M P C ) = P el , out ( A i r C o m p M P C , max ) p v ( A i r C o m p M P C )
V B a t = C B a t c e , v B a t
V ( B a t P C ) = P el , out ( B a t P C , max ) p v ( B a t P C )
V W H e x = Q heat ( W H e x , max ) q v W H e x
V A T C = Q heat ( A T C , max ) q v A T C
V ( P O T P C ) = P el , out ( P O T P C , max ) p v ( P O T P C )
V A P C = P el ( A P C , max ) p v A P C
V ( P M P C ) = P el , out ( P M P C , max ) p v ( P M P C )
V P M = P mech ( P M , max ) p v P M
V L H 2 S = m L H 2 η V L H 2 S
V tot = j N ( j ) · V ( j )
Table A3. Volume-related parameters.
SymbolName/MeaningValueRef.
p v F C Volumetric power density Fuel Cell (kW/m3)5000[46]
p v ( F C P C ) Volumetric power density Fuel Cell power converters (kW/m3)3500[47]
p v ( F C B O P ) Volumetric power density Fuel Cell balance of plant (kW/m3)2000[37]
p v ( F C A i r C o m p ) Volumetric power density air compressor (kW/m3)5000[44]
p v A i r C o m p M Volumetric power density air compressor motor (kW/m3)4500[48]
p v ( A i r C o m p M P C ) Volumetric power density air compressor motor power converter (kW/m3)2500[49]
c e , v B a t Energy density battery (kWh/m3)200[50]
p v ( B a t P C ) Volumetric power density battery power converters (kW/m3)3500[47]
q v W H e x Volumetric heat Volumetric power density heat exchanger (kW/m3)400[51]
q v A T C Volumetric heat Volumetric power density aircraft thermal circuit (kW/m3)--
p v ( P O T P C ) Volumetric power density consumer power converters (kW/m3)3500[47]
p v A P C Volumetric power density aircraft power circuit (kW/m3)--
p v ( P M P C ) Volumetric power density propulsion motor power converters (kW/m3)2500[49]
p v P M Volumetric power density propulsion motor (kW/m3)4500[48]
η V L H 2 S LH2 volumetric storage density (kg/m3)50[45]

References

  1. Masson-Delmotte, V.; Zhai, P.; Pirani, A.; Connors, S.L.; Péan, C.; Berger, S.; Caud, N.; Chen, Y.; Goldfarb, L.; Gomis, M.I.; et al. Climate Change 2021: The Physical Science Basis; Cambridge University Press: Cambridge, UK, 2021. [Google Scholar]
  2. United Nations. Paris Agreement; United Nations: New York, NY, USA, 2015. [Google Scholar]
  3. United Nations. Transforming Our World: The 2030 Agenda for Sustainable Development; United Nations: New York, NY, USA, 2015. [Google Scholar]
  4. United Nations. Sustainable Development Goals; United Nations: New York, NY, USA, 2015. [Google Scholar]
  5. European Commission. The European Green Deal; Publications Office of the European Union: Luxembourg, 2019. [Google Scholar]
  6. European Commission and Directorate-General for Research and Innovation. Fly the Green Deal—Europe’s Vision for Sustainable Aviation; Publications Office of the European Union: Luxembourg, 2022. [Google Scholar] [CrossRef]
  7. TRR-SynTrac. TRR-SynTrac Project; TU Braunschweig, Institut für Akustik und Dynamik: Braunschweig, Germany; Universität Stuttgart, Institut für Luftfahrtantriebe: Stuttgart, Germany, 2025. [Google Scholar]
  8. Eissele, J.; Lafer, S.; Mejía Burbano, C.; Schließus, J.; Wiedmann, T.; Mangold, J.; Strohmayer, A. Hydrogen-Powered Aviation—Design of a Hybrid-Electric Regional Aircraft for Entry into Service in 2040. Aerospace 2023, 10, 277. [Google Scholar] [CrossRef]
  9. Ansell, P.J. Hydrogen-electric aircraft technologies and integration: Enabling an environmentally sustainable aviation future. IEEE Electrif. Mag. 2022, 10, 6–16. [Google Scholar] [CrossRef]
  10. Wu, S.; Li, Y. Fuel cell applications on more electrical aircraft. In Proceedings of the 2014 17th International Conference on Electrical Machines and Systems (ICEMS), Hangzhou, China, 22–25 October 2014; pp. 198–201. [Google Scholar] [CrossRef]
  11. Kim, H.; Perry, A.; Ansell, P. A Review of Distributed Electric Propulsion Concepts for Air Vehicle Technology. In Proceedings of the AIAA AIAA/IEEE Electric Aircraft Technologies Symposium, Cincinnati, OH, USA, 9–11 July 2018. [Google Scholar] [CrossRef]
  12. Vechtel, D.; Buch, J.P. Aspects of yaw control design of an aircraft with distributed electric propulsion. Ceas Aeronaut. J. 2022, 13, 847–860. [Google Scholar] [CrossRef] [PubMed]
  13. Asli, M.; König, P.; Sharma, D.; Pontika, E.; Huete, J.; Konda, K.R.; Mathiazhagan, A.; Xie, T.; Höschler, K.; Laskaridis, P. Thermal management challenges in hybrid-electric propulsion aircraft. Prog. Aerosp. Sci. 2024, 144, 100967. [Google Scholar] [CrossRef]
  14. Macdonald, T.; Clarke, M.; Botero, E.; Vegh, J.; Alonso, J. SUAVE: An Open-Source Environment Enabling Multi-fidelity Optimization. In Proceedings of the AIAA SciTech Forum, Denver, CO, USA, 5–9 June 2017. [Google Scholar] [CrossRef]
  15. Stanford University Department of Aeronautics and Astronautics. SUAVE: Aerospace Vehicle Environment; Stanford University Department of Aeronautics and Astronautics: Stanford, CA, USA, 2024. [Google Scholar]
  16. FutPrInt50 Consortium. FutPrInt50—Greening Tomorrow’s Aviation. An EU-Funded Collaborative Research Project Focused on Technologies and Configurations for Hybrid-Electric Aircraft up to 50 Seats. Online Resource. Available online: https://futprint50.eu/about/project-overview (accessed on 1 December 2024).
  17. Mangold, J.; Eisenhut, D.; Brenner, F.; Moebs, N.; Strohmayer, A. Preliminary Hybrid-Electric Aircraft Design with Advancements on the Open-Source Tool SUAVE. J. Phys. Conf. Ser. 2023, 2526, 012022. [Google Scholar] [CrossRef]
  18. Raymer, D.P. Aircraft Design: A Conceptual Approach; American Institute of Aeronautics and Astronautics, Inc.: Reston, VA, USA, 2012. [Google Scholar]
  19. ATR. ATR 72-500 Performance Data; ATR: Blagnac, France, 1997. [Google Scholar]
  20. ATR. ATR 72-600 Flight Crew Operating Manual; ATR: Blagnac, France, 2011. [Google Scholar]
  21. ATR. ATR 72 Flight Crew Operating Manual; ATR: Blagnac, France, 1996. [Google Scholar]
  22. Jackson, P. Jane’s All the World’s Aircraft 2006–2007; Jane’s Information Group: Croydon, UK, 2007. [Google Scholar]
  23. European Union Aviation Safety Agency. Type Certificate Data Sheet for ATR 42 and ATR 72, EASA.A.084, Issue 12; European Union Aviation Safety Agency: Cologne, Germany, 2023. [Google Scholar]
  24. European Union Aviation Safety Agency. AMC and GM to Annex VII (Part-NCO) to Commission Regulation (EU) No 965/2012—Issue 2, Amendment 12; European Union Aviation Safety Agency: Cologne, Germany, 2022. [Google Scholar]
  25. Brenner, F.; Mangold, J.; Eisenhut, D.; Moebs, N.; Strohmayer, A. Deriving a year 2040 reference aircraft from a modern turboprop, implemented and calibrated in SUAVE. J. Phys. Conf. Ser. 2023, 2526, 012009. [Google Scholar] [CrossRef]
  26. Keller, D. Aerodynamic Investigation of the High-Lift Performance of a Propeller-Driven Regional Transport Aircraft with Distributed Propulsion. J. Phys. Conf. Ser. 2023, 2526, 012007. [Google Scholar] [CrossRef]
  27. Dietz, M. Einführung in den Flugzeugentwurf. In Aerodynamik des Fliegens: Von den Grundlagen bis zur Flugzeugauslegung; Springer: Berlin/Heidelberg, Germany, 2024; pp. 637–670. [Google Scholar] [CrossRef]
  28. European Union Aviation Safety Agency. Certification Specifications for Large Aeroplanes (CS-25); European Union Aviation Safety Agency: Cologne, Germany, 2007. [Google Scholar]
  29. Loftin, L. Subsonic aircraft: Evolution and the matching of size to performance. In National Aeronauticsand Space Administration, Reference Publication 1060; NASA Langley Research Center: Hampton, VA, USA, 1980. [Google Scholar]
  30. Brewer, G.D. Hydrogen Aircraft Technology; CRC Press: Boca Raton, FL, USA, 2017. [Google Scholar] [CrossRef]
  31. Larminie, J.; Dicks, A. Fuel Cell Systems Explained, 2nd ed.; John Wiley & Sons Ltd.: Hoboken, NJ, USA, 2003. [Google Scholar] [CrossRef]
  32. Chapman, J.; Schulo, S.; Nitzsche, M. Development of a Thermal Management System for Electrified Aircraft; Technical Report, NASA TM 2020-220473; NASA: Washington, DC, USA, 2020. [Google Scholar] [CrossRef]
  33. Schmitz, O.; Hornung, M. Unified Applicable Propulsion System Performance Metrics. J. Eng. Gas Turbines Power 2013, 135, 111201. [Google Scholar] [CrossRef]
  34. Seitz, A.; Schmitz, O.; Isikveren, A.T.; Hornung, M. Electrically Powered Propulsion: Comparison and Contrast to Gas Turbines. In Proceedings of the Deutscher Luft- und Raumfahrtkongress 2012, Berlin, Germany, 10–12 September 2012. [Google Scholar]
  35. Kazula, S.; Staggat, M.; De Graaf, S. Functional and Safety Challenges of Hydrogen Fuel Cell Systems for Application in Electrified Regional Aircraft. J. Phys. Conf. Ser. 2023, 2526, 012063. [Google Scholar] [CrossRef]
  36. Ebersberger, J.; Fauth, L.; Keuter, R.; Cao, Y.; Freund, Y.; Hanke-Rauschenbach, R.; Ponick, B.; Friebe, J. Power Distribution and Propulsion System for an All-Electric Short-Range Commuter Aircraft—A Case Study. IEEE Access 2022, 10, 114514–114539. [Google Scholar] [CrossRef]
  37. Palladino, V.; Jordan, A.; Bartoli, N.; Schmollgruber, P.; Pommier-Budinger, V.; Benard, E. Preliminary studies of a regional aircraft with hydrogen-based hybrid propulsion. In Proceedings of the AIAA AVIATION 2021 FORUM. American Institute of Aeronautics and Astronautics, Virtual Event, 2–6 August 2021; pp. 1–29. [Google Scholar] [CrossRef]
  38. Schröder, M.; Becker, F.; Kallo, J.; Gentner, C. Optimal operating conditions of PEM fuel cells in commercial aircraft. Int. J. Hydrogen Energy 2021, 46, 33218–33240. [Google Scholar] [CrossRef]
  39. Fu, J.; Wang, H.; Bao, H.; Sun, X.; Liu, J. Multi-parameter optimization for the performance of the fuel cell air compressor. Therm. Sci. Eng. Prog. 2023, 44, 102057. [Google Scholar] [CrossRef]
  40. Buticchi, G.; Wheeler, P.; Boroyevich, D. The More-Electric Aircraft and Beyond. Proc. IEEE 2022, 111, 356–370. [Google Scholar] [CrossRef]
  41. VDI. VDI-Wärmeatlas; Springer: Berlin/Heidelberg, Germany, 2013. [Google Scholar] [CrossRef]
  42. Langeheinecke, K.; Jany, P.; Thieleke, G.; Langeheinecke, K.; Kaufmann, A. Thermodynamik für Ingenieure; Springer Fachmedien Wiesbaden: Wiesbaden, Germany, 2013. [Google Scholar] [CrossRef]
  43. Stückl, S.; Lobentanzer, H. Voltair—The all-electric propulsion concept platform—A vision for atmospheric friendly flight. In Proceedings of the 4th International Conference on Aerospace, Augsburg, Germany, 13–14 November 2012; pp. 2737–2747. [Google Scholar]
  44. Teichel, S.; Dörbaum, M.; Misir, O.; Merkert, A.; Mertens, A.; Seume, J.; Ponick, B. Design considerations for the components of electrically powered active high-lift systems in civil aircraft. Ceas Aeronaut. J. 2014, 6, 49–67. [Google Scholar] [CrossRef]
  45. Kadyk, T.; Winnefeld, C.; Hanke-Rauschenbach, R.; Krewer, U. Analysis and design of fuel cell systems for aviation. Energies 2018, 11, 375. [Google Scholar] [CrossRef]
  46. Tongsh, C.; Wu, S.; Jiao, K.; Huo, W.; Du, Q.; Park, J.; Xuan, J.; Wang, H.; Brandon, N.; Guiver, M. Fuel cell stack redesign and component integration radically increase power density. Joule 2023, 8, 175–192. [Google Scholar] [CrossRef]
  47. Beiranvand, H.; Rokrok, E.; Liserre, M. Volume optimization in Si IGBT-based dual-active-bridge converters. In Proceedings of the PEDSTC, Shiraz, Iran, 12–14 February 2019; pp. 577–582. [Google Scholar] [CrossRef]
  48. Wolnik, T.; Jarek, T.; Golec, J.; Topolewski, R.; Jastrzębski, D. High power density motor for light electric aircraft—Design study and lab tests. In Proceedings of the 2023 WEMDCD, Newcastle upon Tyne, UK, 13–14 April 2023; pp. 1–6. [Google Scholar] [CrossRef]
  49. Itoh, J.-i.; Araki, T. Volume evaluation of a PWM inverter with wide band-gap devices for motor drive system. In Proceedings of the 2013 ECCE-Asia, Melbourne, VIC, Australia, 3–6 June 2013; pp. 372–378. [Google Scholar] [CrossRef]
  50. Zhang, X.; Gong, Y.; Xu, C.; Qu, P.; Wang, G. Thickness dependence of high volumetric energy density lithium ion battery based on Sn–Zn eutectic alloy foil anode. Ionics 2022, 28, 2685–2692. [Google Scholar] [CrossRef]
  51. PowerCell. PowerCell S3 Datasheet. 2018. Available online: https://www.powercell.se/wordpress/wp-content/uploads/2018/12/S3-Produktblad-190430.pdf (accessed on 1 December 2024).
Figure 1. Design and calibration process of the baseline aircraft in enhanced version of SUAVE, including data of documents, calibration of the textbook equations and the validaiton based on output of the aircraft performance.
Aerospace 12 00249 g001
Figure 2. Geometrical topology of the system. This diagram represents the components allocation and connection of components within the energy system model.
Aerospace 12 00249 g002
Figure 3. Topology of the energy system model, showing the interconnections between its components. This diagram depicts the thermal circuit in red, while the power circuit is in black.
Aerospace 12 00249 g003
Figure 4. Sizing chart of the reference configuration. The chart highlights key constraints in red, the resulting design point, and the optimum cruise wing loading, illustrating a mismatch between the design point and the optimum cruise conditions.
Aerospace 12 00249 g004
Figure 5. Ladder chart comparing the baseline to the reference configuration, where the deltas in engine efficiency and aerodynamic efficiency are referenced to mid-cruise conditions.
Aerospace 12 00249 g005
Figure 6. Sizing chart of the lead configuration. The chart highlights key constraints in thick red, the resulting design point, and the optimal cruise, illustrating a match between the design point and the optimal cruise condition.
Aerospace 12 00249 g006
Figure 7. Ladder chart comparing the Lead to the Baseline configuration, where the deltas in engine efficiency and aerodynamic efficiency are referenced to mid-cruise conditions.
Aerospace 12 00249 g007
Figure 8. Payload range diagram of the reference, baseline and lead configurations as well as an ATR 72-500.
Aerospace 12 00249 g008
Figure 9. Payload-Range Diagram with ESPAR performance matrix (zoom on design point).
Aerospace 12 00249 g009
Figure 10. ESPAR differentiated with respect to range, for different payload values.
Aerospace 12 00249 g010
Table 1. ATR 72-500 Specifications for the reference configuration.
ParameterATR 72-500Reference
Top of Climb
Altitude22,000 ft[19]
Climb rate500 ft/min[19]
Service Ceiling
Altitude25,000 ft[19]
Climb rate300 ft/min[19]
Design Mission
Passengers (à 95 kg)70
Payload6650 kg[19]
Range670 NM[19]
Cruise Mach number (speed)0.44 (265 kts)[19]
Take-off and Landing
Take-off field length1300 m (ISA +0)[21]
Landing field length1000 m (ISA +0)[21]
Approach speed115 kts[21]
Certification basisCS-25[23]
Max payload7200 kg[20]
OEI net ceiling (95% MTOM, ISA +10)7700 ft[19]
Entry-Into-Service1997[23]
Maximum take-off mass22,500 kg[19]
Operating empty mass12,850 kg[19]
Maximum fuel mass5000 kg[19]
Maximum operational Mach number0.55 Ma[19]
Design Mach number0.44 Ma[19]
Reference wing area61.00 m 2 [19] 1
Wing loading352.4 kg / m 2 [19] 1
Engine (SLS, SA)2051 kW (each)[19]
Power loading0.18 kW/kg[19] 1
Volume coefficient horizontal stabilizer1.07[21] 1
Volume coefficient vertical stabilizer0.124[21] 1
Final reserve fuel/energy45 min at holding speed[24]
Alternate87 NM[19]
1 This value was derived from data presented in the cited reference.
Table 2. Mass calibration factors.
ComponentMass Calibration Factor
Operational items1.15
Landing gear0.94
Main wing1.38
Fuselage0.81
Horizontal stabilizer1.12
Vertical stabilizer1.03
Propulsion system0.99
Table 3. Drag calibration factors.
Flight SegmentDrag Counts per Flight Segment
Take-off150
Second segment6
Climb6
Cruise1
Descent6
Landing190
Table 4. Comparison of mass breakdown and corresponding center of gravity for all configurations.
ComponentReferenceBaselineLead
Mass
in kg
X-Axis CG
in m
Mass
in kg
X-Axis CG
in m
Mass
in kg
X-Axis CG
in m
Main wing197312.37211912.40188315.08
Fuselage207812.29213612.29225913.25
VTP22223.9423824.0020925.82
HTP13225.2314725.2612327.80
Nose landing gear1154.091194.091254.80
Main landing gear55712.8158512.8462715.81
Crew3138.193138.193138.83
Propulsion System164410.20173610.20567418.9
Systems442211.67443611.67438212.77
Operational items102210.92102210.92102211.77
Design Fuel180012.23260112.2637320.35
Design Payload665012.29665012.29665013.25
OEM12,47811.8812,85111.9316,61715.38
MTOM20,92812.0422,10212.0823,64014.86
Table 5. Summary of most defining aircraft parameters of all three configurations.
Key FactReferenceBaselineLead
MTOM CG in percent MAC151515
MTOM CG in m12.0812.0414.86
OEM in kg12,85112,47816,617
Main Wing in m2625954
Span in m27.426.627.05
VTP in m216.215.014.9
HTP in m212.011.010.8
Design fuel energy in kWh (670 NM) 129,88620,682n/a
Design fuel energy in kWh (432 NM) 122,72715,76412,309
Total installed shaft power in kW412039024408
Fuselage length in m272729.44
L/D Cruise16.816.817.3
max CL2.62.63.3
Main Wing Origin11.45 m11.45 m14.47
1 The Design mission of the lead configuration differs from the reference and baseline configuration.
Disclaimer/Publisher’s Note: The statements, opinions and data contained in all publications are solely those of the individual author(s) and contributor(s) and not of MDPI and/or the editor(s). MDPI and/or the editor(s) disclaim responsibility for any injury to people or property resulting from any ideas, methods, instructions or products referred to in the content.

