Article

Passive Rotor Noise Reduction Through Axial and Angular Blade Spacing Modulation

by
Chingiz Arystanbekov
*,
Altay Zhakatayev
and
Basman Elhadidi
Department of Mechanical and Aerospace Engineering, School of Engineering and Digital Science, Nazarbayev University, Astana Z05H0P9, Kazakhstan
*
Author to whom correspondence should be addressed.
Aerospace 2025, 12(3), 167; https://doi.org/10.3390/aerospace12030167
Submission received: 20 December 2024 / Revised: 30 January 2025 / Accepted: 7 February 2025 / Published: 20 February 2025

Abstract

:
This study investigates the aerodynamic and aeroacoustic performance of a novel two-stage two-bladed coaxial propeller that is axially and angularly spaced. Aerodynamic propulsive thrust and efficiency are validated and evaluated using a Reynolds-averaged Navier–Stokes computational fluid dynamics (CFD) model for the two-bladed APC27x13 propeller. Aeroacoustic assessment is conducted using a Ffowcs Williams–Hawkings integral model. A four-bladed coplanar APC27x13 propeller is simulated and considered as the baseline propeller. The CFD results suggest that changes in the rotor thrust for the coaxial blades are within 3 % for propellers with 0.25 D axial spacing (where D is the propeller diameter) and 30 angular spacing for the advance ratio of J = 0.3 0.5 . The aeroacoustic assessment for J = 0.3 reveals that blades with 30 and 60 azimuthal spacing and 0.25 D axial spacing significantly reduce noise compared to the baseline propeller. The reduction is attributed to the redistribution of tonal noise blade passing frequencies, resulting in a reduction in the A-weighted noise levels by up to 2 dBA. Additionally, the study accounts for the effect of the blade tip Mach number, concluding that a tip Mach number ranging between 0.7 and 0.9 is optimal for noise reduction in the 30 configuration. The results highlight the potential noise reduction benefits of uneven axial and angular blade spacing while maintaining similar aerodynamic performance.

1. Introduction

Propellers play a critical role in aviation, converting rotational energy into thrust to propel aircraft. However, they generate significant noise, which poses environmental and health challenges, particularly within densely populated urban areas. Studies have shown that exposure to aircraft noise can lead to various health issues, such as cardiovascular diseases, sleep disturbances, and heightened stress levels [1,2,3,4,5,6,7], underscoring the need for effective noise reduction methods in urban air mobility applications. Future expansion of vehicles capable of vertical take-off and landing (VTOL) and unmanned aerial vehicles (UAVs) is dependent on the success of noise reduction and/or mitigation efforts.
Rotor noise can be broadly classified into tonal and broadband noise [8]. Tonal noise is associated with the rotor blade passing frequency (BPF). The noise is concentrated at specific frequencies related to blade count and rotational speed. Blade thickness noise, which arises from the displacement of air by the physical presence of the blades, is considered a major source of tonal noise. Broadband noise spans a wide range of frequencies, and it originates from flow turbulence. Blade loading noise exhibits both tonal and broadband characteristics as it stems from the aerodynamic forces acting on the blade surfaces. As tonal noise is often dominant due to its high intensity, the challenge is to reduce blade thickness noise by manipulating the rotor characteristics, which is the subject of this paper.
To address noise mitigation, several areas of research have been explored for passive noise reduction. For instance, to reduce broadband noise, serrated [9,10,11,12,13] and swept blade designs [14,15,16,17,18] were implemented. Toroidal propellers (connected blade tips) have reduced both tonal and broadband noise signatures by reducing the effect of the tip vortex [19]. While these techniques are effective, these design modifications pose manufacturing challenges and can reduce rotor aerodynamic performance.
Another passive approach to noise reduction is the application of uneven azimuthal blade spacing (Figure 1). The perceived noise level is reduced by redistributing the tonal noise frequencies across a broader range. In this configuration, blades are separated in a symmetric azimuthal pattern to maintain rotor balance, effectively reducing the BPF. This shift in BPF has been shown to reduce noise by up to 4 dBA, since lower frequencies are generally perceived as quieter [20]. However, while promising, this configuration also tends to reduce aerodynamic efficiency. For instance, a study found that a four-bladed propeller with a 30 azimuthal separation between consecutive blades produced 8.5 % less thrust than a conventional propeller, which is attributed to increased aerodynamic losses and rotor wake interactions [21].
One potential solution to mitigate thrust loss while employing uneven blade spacing is the use of coaxial propellers with axial separation. By spacing the propellers axially, blade interference effects are reduced, maintaining aerodynamic efficiency. However, this configuration can introduce rotor–rotor interaction effects, particularly at closer axial spacings. To identify optimal distances that minimize these interactions, Stephen [22] examined the recommended axial spacing for various propeller diameters. For small UAV propellers, the optimal spacing falls within 0.2 D 0.3 D , while for larger helicopter propellers, a smaller separation of 0.1 D is preferable. To further mitigate rotor wake interference in coaxial setups, a “lag” configuration is often used, where the leading edge of the upstream blades is positioned slightly behind that of the downstream blades, as shown in Figure 2. Findings by Tinney [23] suggest that this “lag” configuration enhances thrust performance by preventing the downstream blades from encountering the upstream swirling wake. Combining axial and angular spacing strategies enables coaxial rotor configurations to preserve thrust while achieving effective noise reduction, presenting a balanced approach for applications that demand both efficiency and reduced noise levels.
This paper numerically addresses whether an optimal axial and angular spacing for a coaxial propeller that has a reduced noise signature for the same aerodynamic performance can be determined. Specifically, two axially and angularly spaced two-bladed propellers will be investigated and compared to a baseline four-bladed propeller with the same blade profile. The aims of this paper are the following:
  • comparing different axial distance ratios for coaxial four-bladed propellers;
  • identifying the optimal four-bladed propeller configuration;
  • conducting an acoustic analysis to evaluate the A-weighted noise reduction.
Additionally, preliminary investigation of the aeroacoustic performance of a five-bladed propeller was accomplished. To achieve these objectives, CFD simulations were conducted to evaluate different configurations of propellers and aerodynamic performance. The pressure on the suction and pressure sides of the blades computed using CFD were extracted and set as an input for aeroacoustic assessment using an integral technique. This paper is organized as follows. The methodology of performed computations is presented in Section 2 (Methodology). The results of CFD simulations, aeroacoustic analysis, and a parametric study are presented and discussed in Section 3 (Results and Discussion). The paper then concludes with Section 4 (Conclusions).

2. Methodology: Numerical Tools

To explore the optimal axial and angular spacing configurations for coaxial propellers, a series of computational simulations were conducted. This section describes the propeller configurations, the CFD model for aerodynamic performance, and the aeroacoustic analysis.

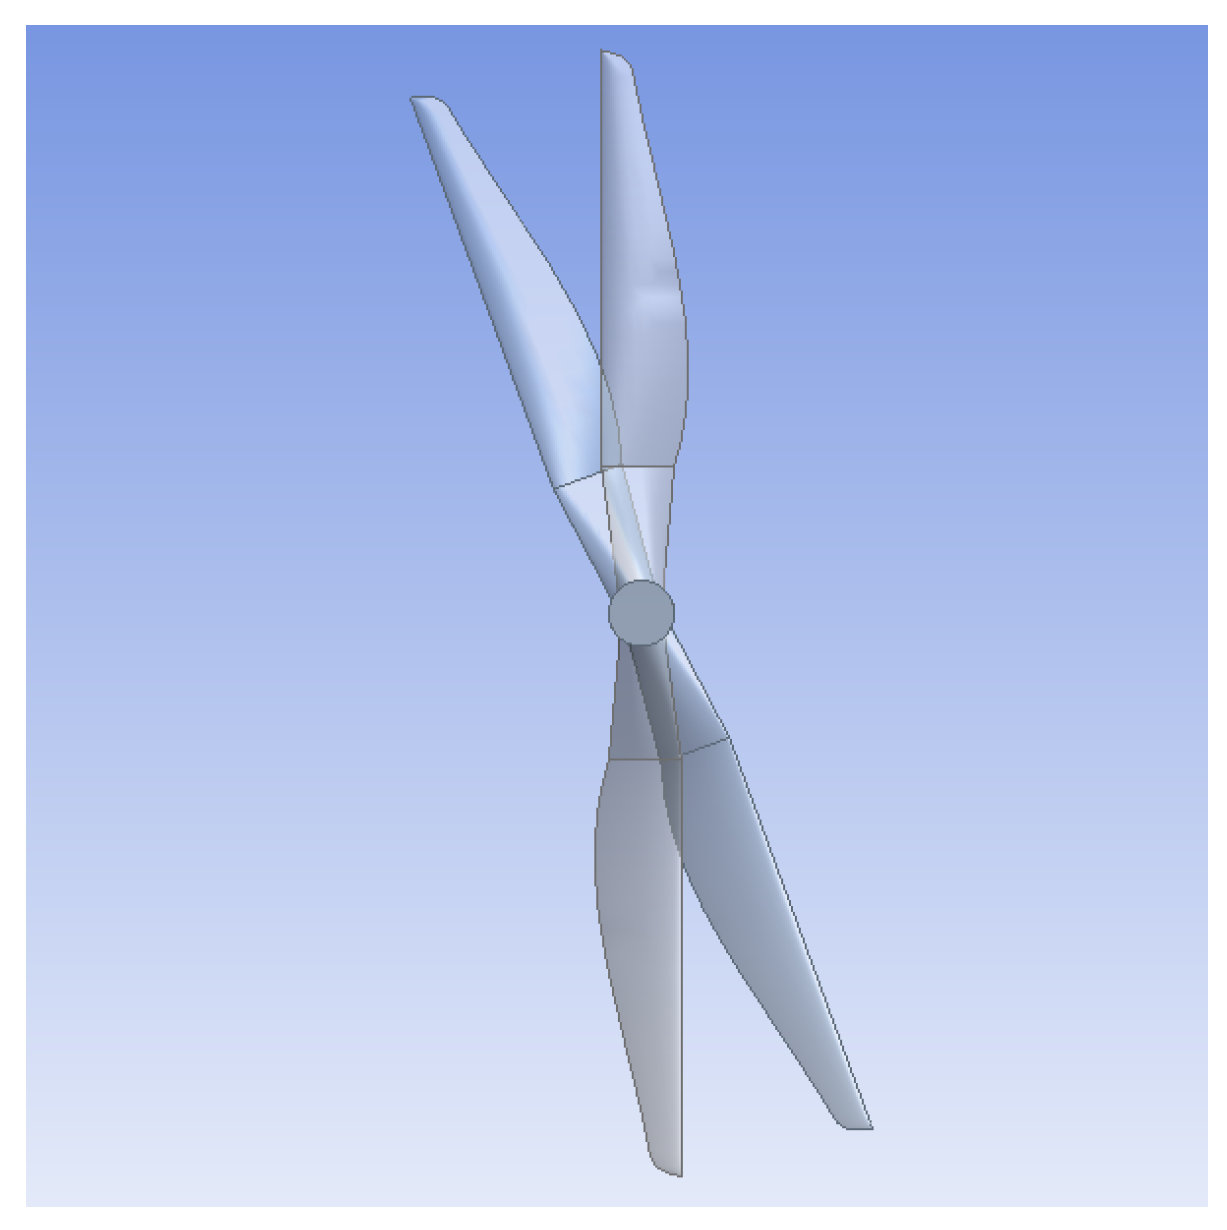
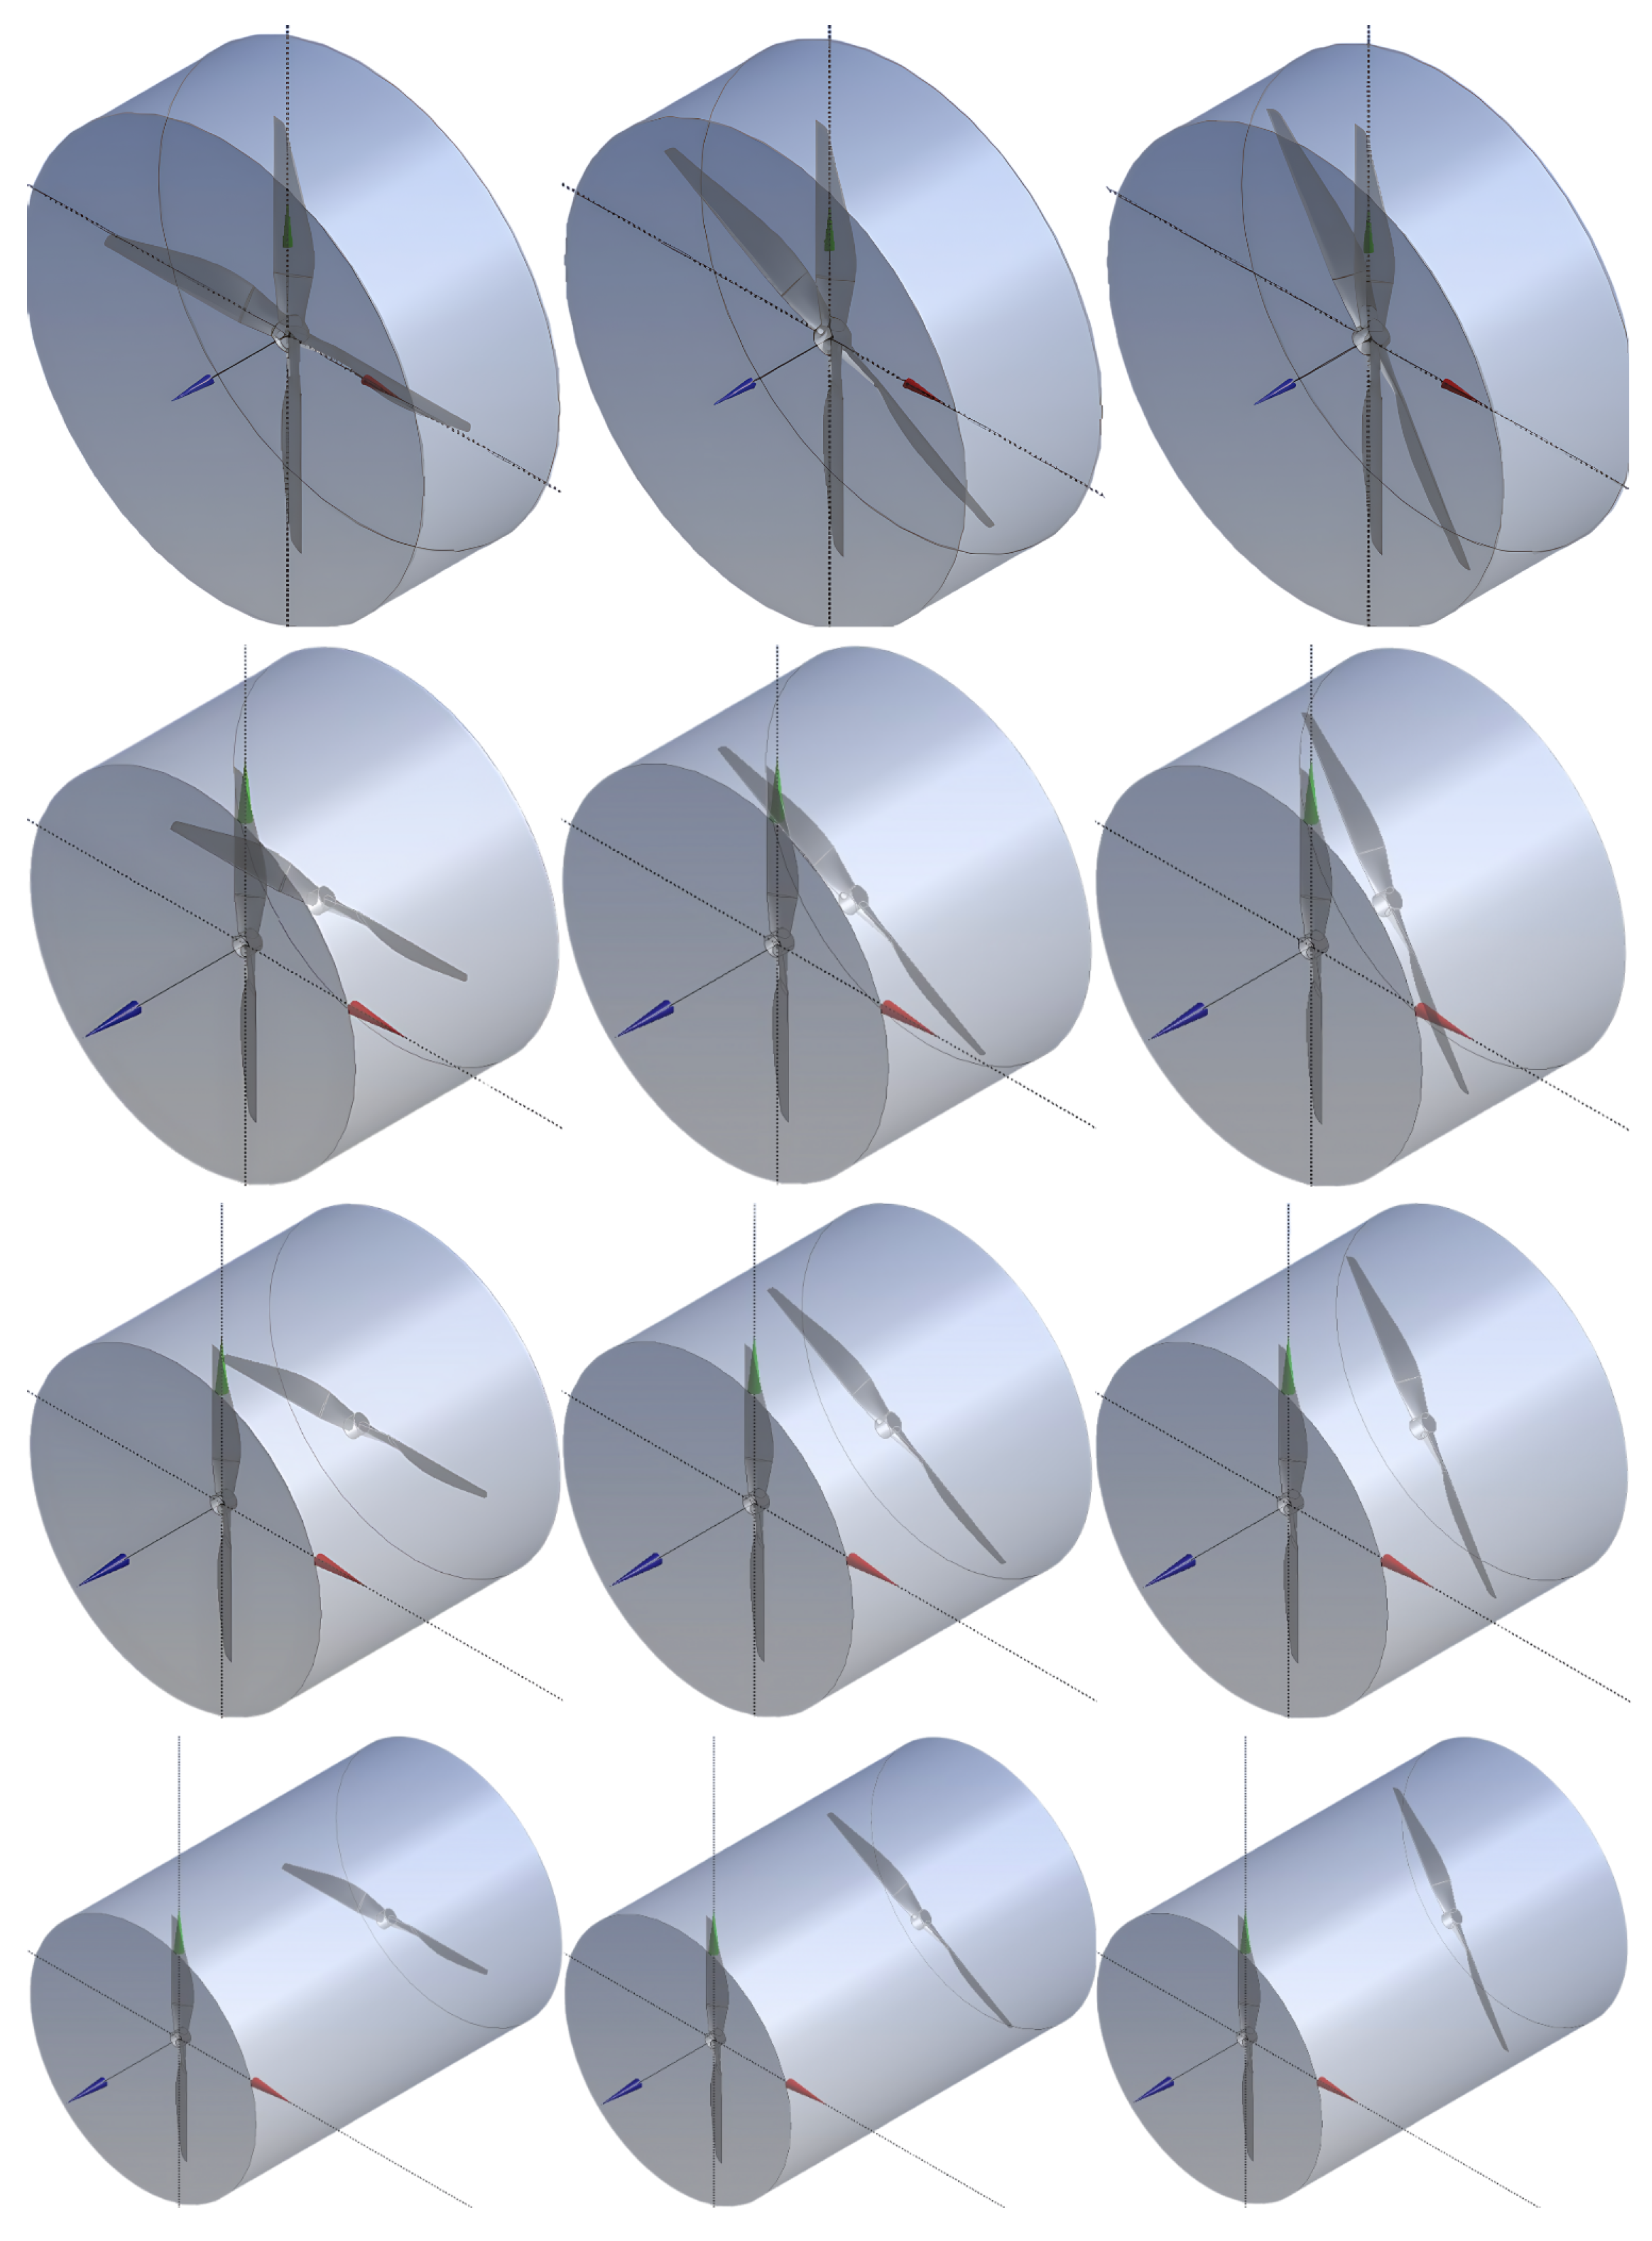
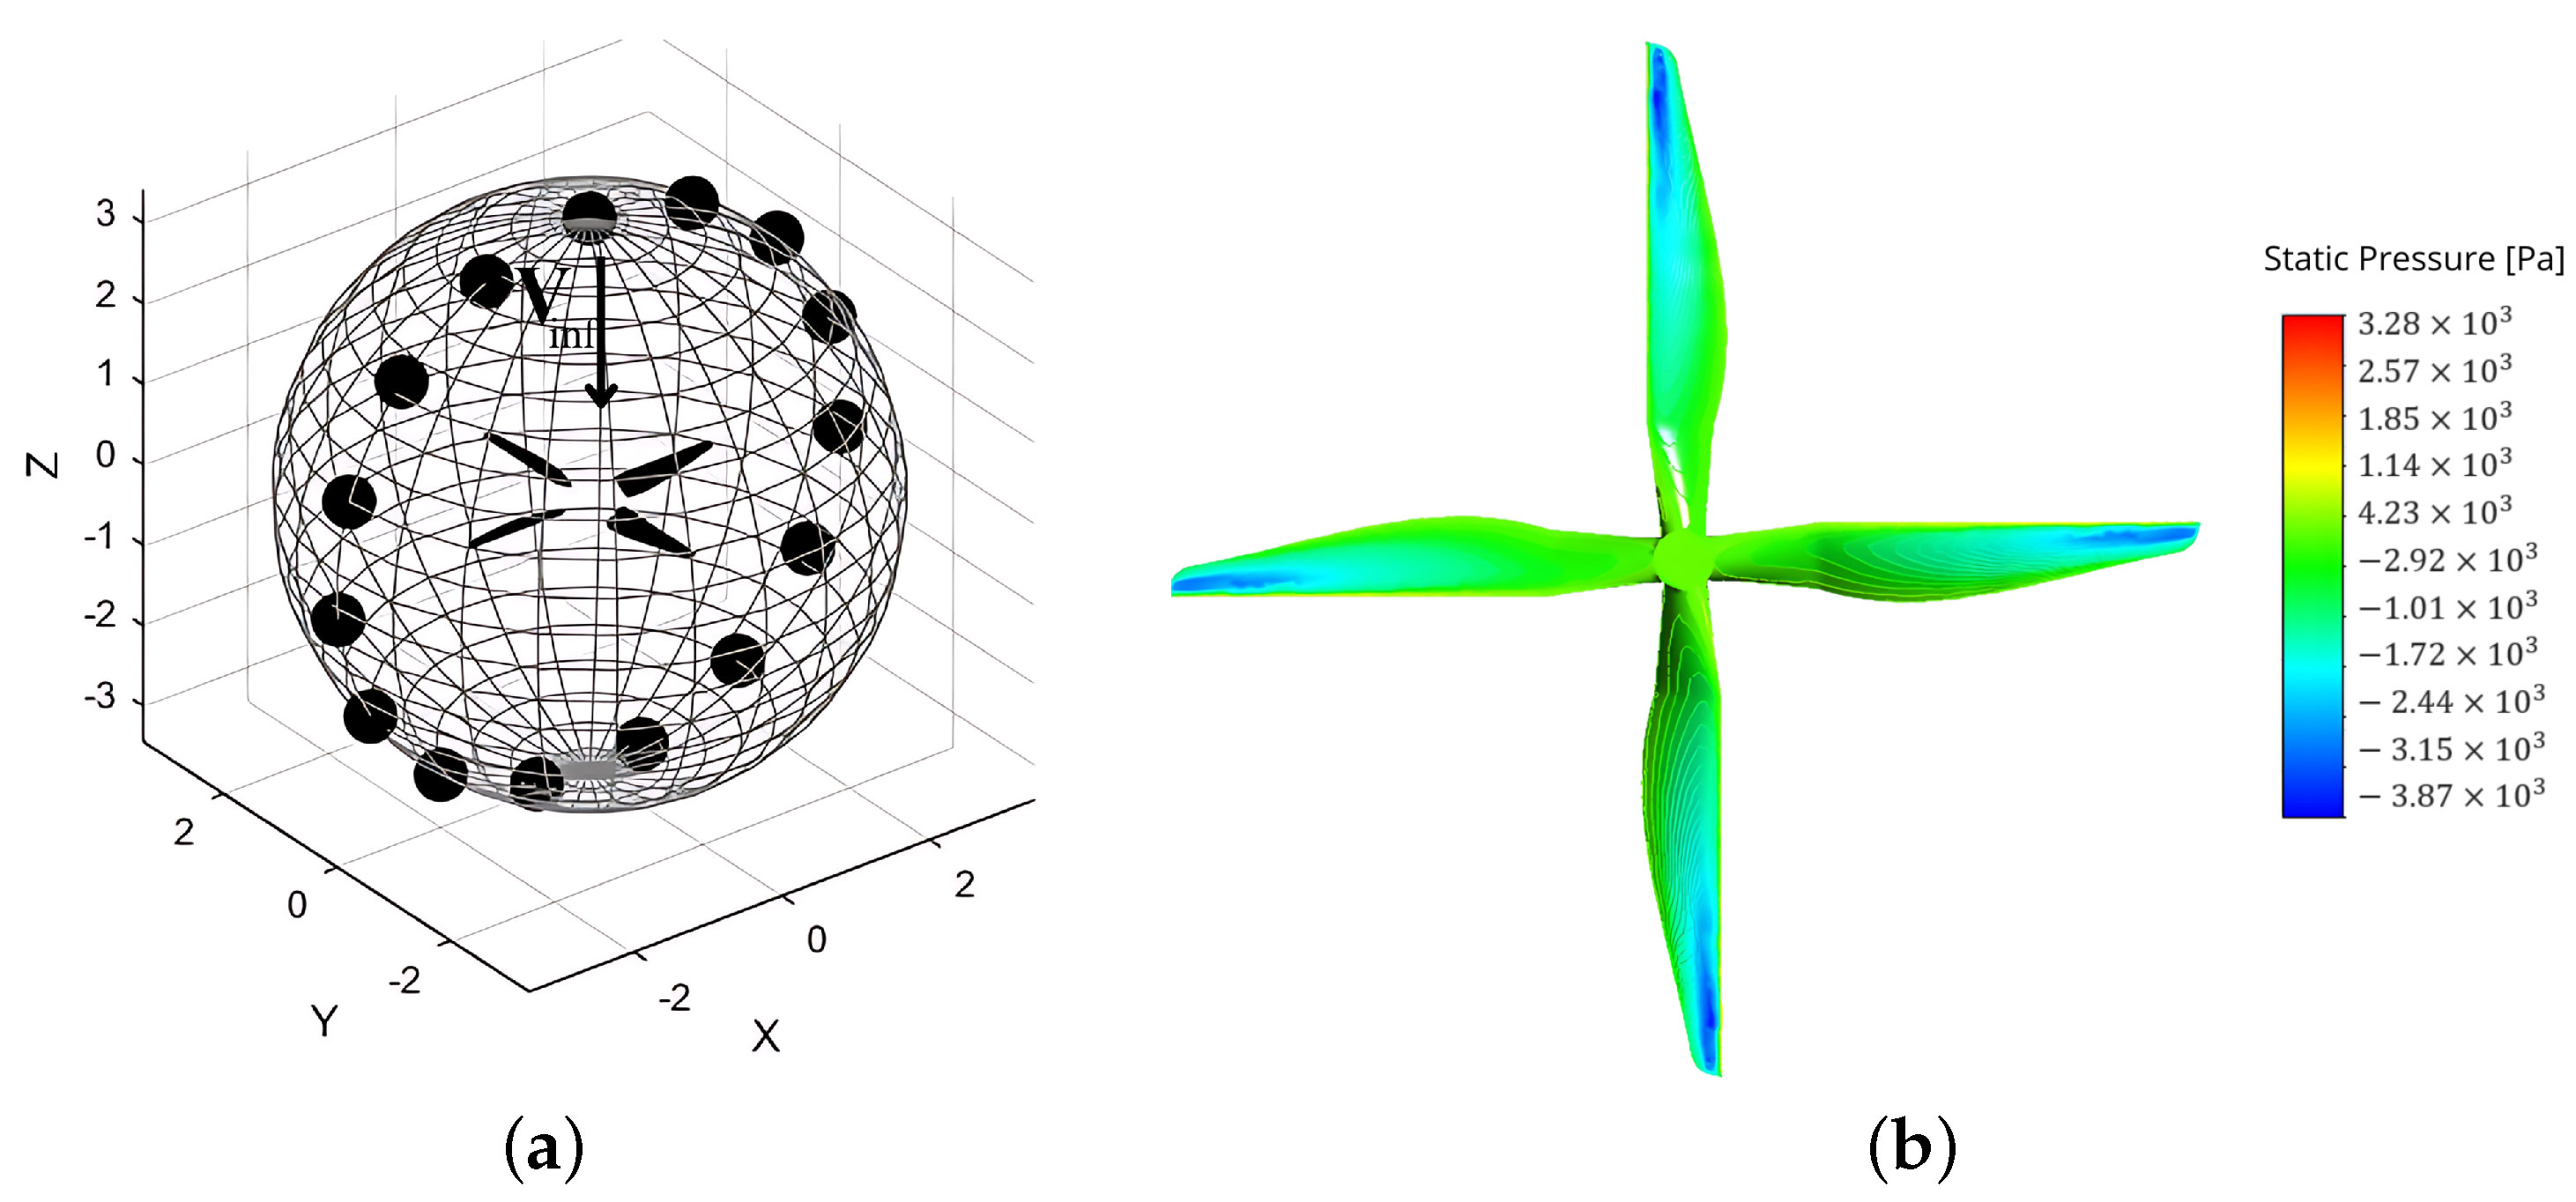
2.1. Propeller and Blade Configurations

In this study, the APC27x13 propeller model was selected, as its detailed geometry and experimental data are available [24]. The baseline propeller is a two-bladed model with a 27-inch diameter and NACA4412 airfoil section. The propeller was modified to examine various coaxial configurations: a baseline four-bladed propeller with even spacing and coaxial two-bladed propellers with axial separations of 0 D , 0.25 D , 0.5 D , 1 D and angular separations of 30 , 60 , 90 (Table 1 and Figure 3). All configurations were designed to maintain identical solidity to ensure comparable performance metrics.

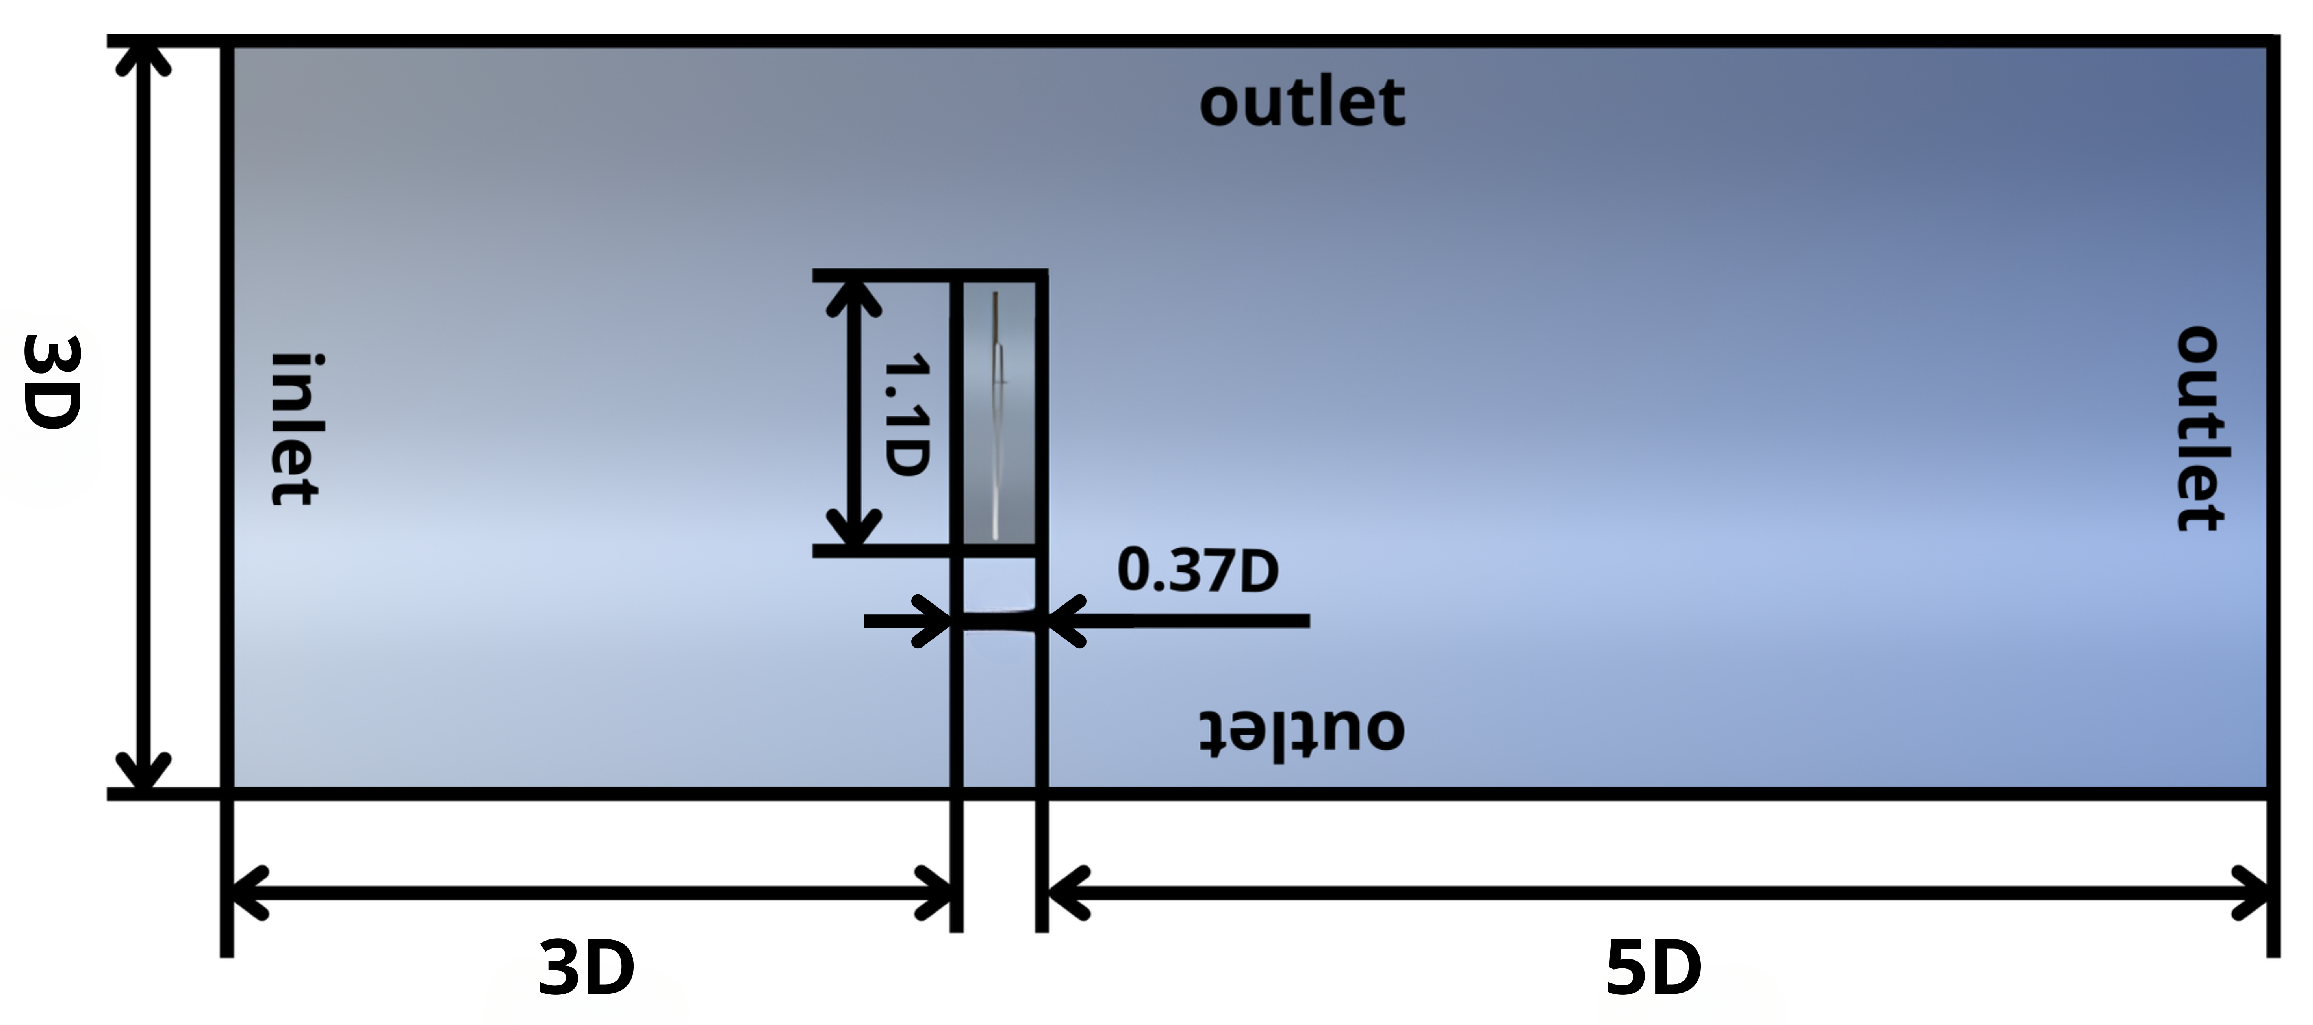
2.2. Computational Fluid Dynamics Model

For this paper, a commercial CFD solver (ANSYS Fluent 2024 R2) was used to identify the best-performing configurations for various azimuthal separation angles [25]. The multiple reference frame (MRF) model, which is based on two computational zones, a stationary (primary) zone and a rotating (secondary) zone, is used in this study. Rotor–rotor interaction noise cannot be accounted for in this study as the tip vortex from the upstream blade is not captured in a steady MRF model. This is acceptable in this study as we consider blades in the “lag” configuration, where the effect of the vortex interaction is expected to be minimal. However, this effect will be considered in a future study that will use an unsteady sliding mesh simulation. The primary zone is a cylindrical zone with a length of 8 D , extending 3 D upstream and 5 D downstream of the propeller plane, as shown in Figure 4. The primary zone has an external diameter of 3 D . The secondary zone has a diameter of 1.1 D , with a length that varies based on the axial separation of the rotors.
A steady and incompressible k- ω SST model with an inlet turbulence intensity of 0.1 % and a turbulent viscosity ratio of 10 is used. This solver setting has been utilized to generate accurate results for small-scale propellers [26]. The inlet turbulent intensity was varied, and no significant effect on the results was observed. Based on these findings, the same simulation settings are applied for all configurations.
A grid independence study was conducted to validate the numerical model by comparing the advance ratio, J = V n D , where V is the freestream velocity, and n is the rotational speed in revolutions per second to the thrust coefficient c T = T n 2 D 4 ρ and torque coefficient c Q = Q n 2 D 5 ρ , where T is the thrust force, Q is the torque, and ρ is the air density. Simulations were compared for an initial mesh of ∼91,347 cells and a finer mesh of ∼205,155 cells, which was achieved by modifying the surface mesh. Table 2 shows that the changes in both c T and c Q are less than 5 % . As a result, further simulations will be performed with the former mesh.
In this study, the median y + value was 100, placing the simulations within the wall-function regime, where the near-wall region is modeled rather than fully resolved. The increase in mesh density from approximately 91,347 to 205,155 cells was achieved by refining the surface mesh (reducing the minimum size from 0.005 m to 0.0035 m) while maintaining a constant first-layer height in the inflation layers. Despite the high y + values, the grid independence study demonstrated that further mesh refinement had a minimal effect on the thrust coefficient (<2.4% difference), indicating the robustness of the results. When compared to experimental data, the numerical torque coefficient showed good agreement (within 4.39 % ), whereas the thrust coefficient exhibited a larger discrepancy ( 20.59 % ). This deviation may be attributed to the low magnitude of the experimental thrust and the sensitivity of normalization to the RPM measurement accuracy. A detailed comparison of the relative percentage errors at various advance ratios (J) is presented in Figure 5b, highlighting the variability of the deviations across the operating range.

2.3. Aeroacoustic Modeling

PSU-WOPWOP is a computational model that predicts noise generated for rotorcraft based on Farassat Formulation 1A [27]. In this study, pressure data obtained from the CFD simulations were fed into PSU-WOPWOP to analyze propeller acoustics. The unsteady scattered sound can be modeled as
p ( x , t ) = 1 4 π f = 0 ρ 0 ( U n + U ˙ n ) r ( 1 M r ) 2 + ρ 0 U n r M ˙ r + c ( M r M 2 ) r 2 ( 1 M r ) 3 d S τ + 1 4 π c f = 0 L ˙ r r ( 1 M r ) 2 + L r L M r 2 ( 1 M r ) 2 + L r r M ˙ r + c ( M r M 2 ) r 2 ( 1 M r ) 3 d S τ
where p ( x , t ) is the acoustic pressure at observer position x and time t, U n is the normal velocity of the surface, r is the distance between the observer and the source point, M r is the Mach number in the radiation direction, c is the speed of sound in the medium, L r is the redefined loading vector in the radiation direction, L M is the Mach number component of the loading vector, d S is the differential surface area element, and τ is the retarded time. For the aeroacoustic modeling, steady-state RANS simulations were used, and time-averaged surface pressure data were extracted from ANSYS Fluent and reformatted via a custom Python script (version 3.12.8) for PSU-WOPWOP input. The impermeable surface approach was applied, treating the blade surfaces as noise sources, which is suitable for steady-state simulations. Since unsteady flow data (e.g., from large eddy simulations) were not available, permeable surface calculations were not performed. Consequently, no off-body control surface was required, as the blade surfaces themselves provided the necessary input for PSU-WOPWOP noise predictions. The first integral represents thickness noise, which arises from the movement of the propeller as it displaces air and, as a result, generates sound waves. This type of noise is primarily caused by the physical displacement of air as the propeller blades rotate, effectively acting as a source of monopole-like noise. The second integral accounts for loading noise, which is related to the forces exerted by the pressure distribution along the propeller blades. This type of noise originates from the aerodynamic forces acting on the blade surfaces, generating a moving source that produces sound waves. By combining these two sources, the equation provides a comprehensive description of the acoustic pressure generated by the propeller, accounting for both the physical displacement of air (thickness noise) and the aerodynamic loading on the blades (loading noise).
Observers were positioned at a distance of 5 D from the propeller, perpendicular to the plane of rotation, as shown in Figure 6a. As a demonstration, aeroacoustic calculations were performed for forward flight with V = 20 m/s and an advance ratio of J = 0.3 . Over one period, the number of pressure peaks corresponds to the number of blades on the propeller. Figure 7a presents the unsteady pressure at a fixed point (located at [5D, 0, 0] relative to the center) As seen for one complete rotation, there are two peaks, which are equal to the number of blades, reflecting the periodic nature of the noise generated by the rotating blades. Figure 7b presents the frequency spectrum at this point. There are evident peaks at the blade passing frequency, B P F = n N , representing the number of blades multiplied by the rotational speed 8 × 10 3 .
The aeroacoustic model estimates the overall sound pressure level (dB), as shown in Figure 8.
To demonstrate that uneven blade spacing can result in a reduced sound footprint, a comparison between a two-bladed propeller and a four-bladed evenly spaced coplanar propeller is conducted. Figure 9 compares the noise spectrum for the two propellers, which have the same thrust coefficient. Two observations are clear. First, the tonal noise peaks for the four-bladed propeller are at twice the BPF compared to the two-bladed propeller. This implies that the perceived sound is at a higher frequency. Second, the perceived sound for the two-bladed propeller is higher than for the four-bladed propeller. This is because the two-bladed propeller operates at a higher rotational speed to generate the same thrust, increasing the sound considerably. This suggests that increasing the number of blades has an effect of reducing the sound level, but the sound is at higher frequencies. Ultimately, the aim is to increase the number of blades while maintaining the lower tonal peak frequencies, which is achievable using uneven blade spacing.
In the context of propellers with uneven blade spacing, the BPF becomes particularly significant, as it affects the distribution of noise frequencies. Uneven blade spacing can shift the BPF and spread the noise energy over a wider frequency range, potentially reducing the peak noise levels and making the noise less perceptible to human ears. This redistribution can lead to a reduction in the overall noise footprint of the propeller.

3. Results and Discussion
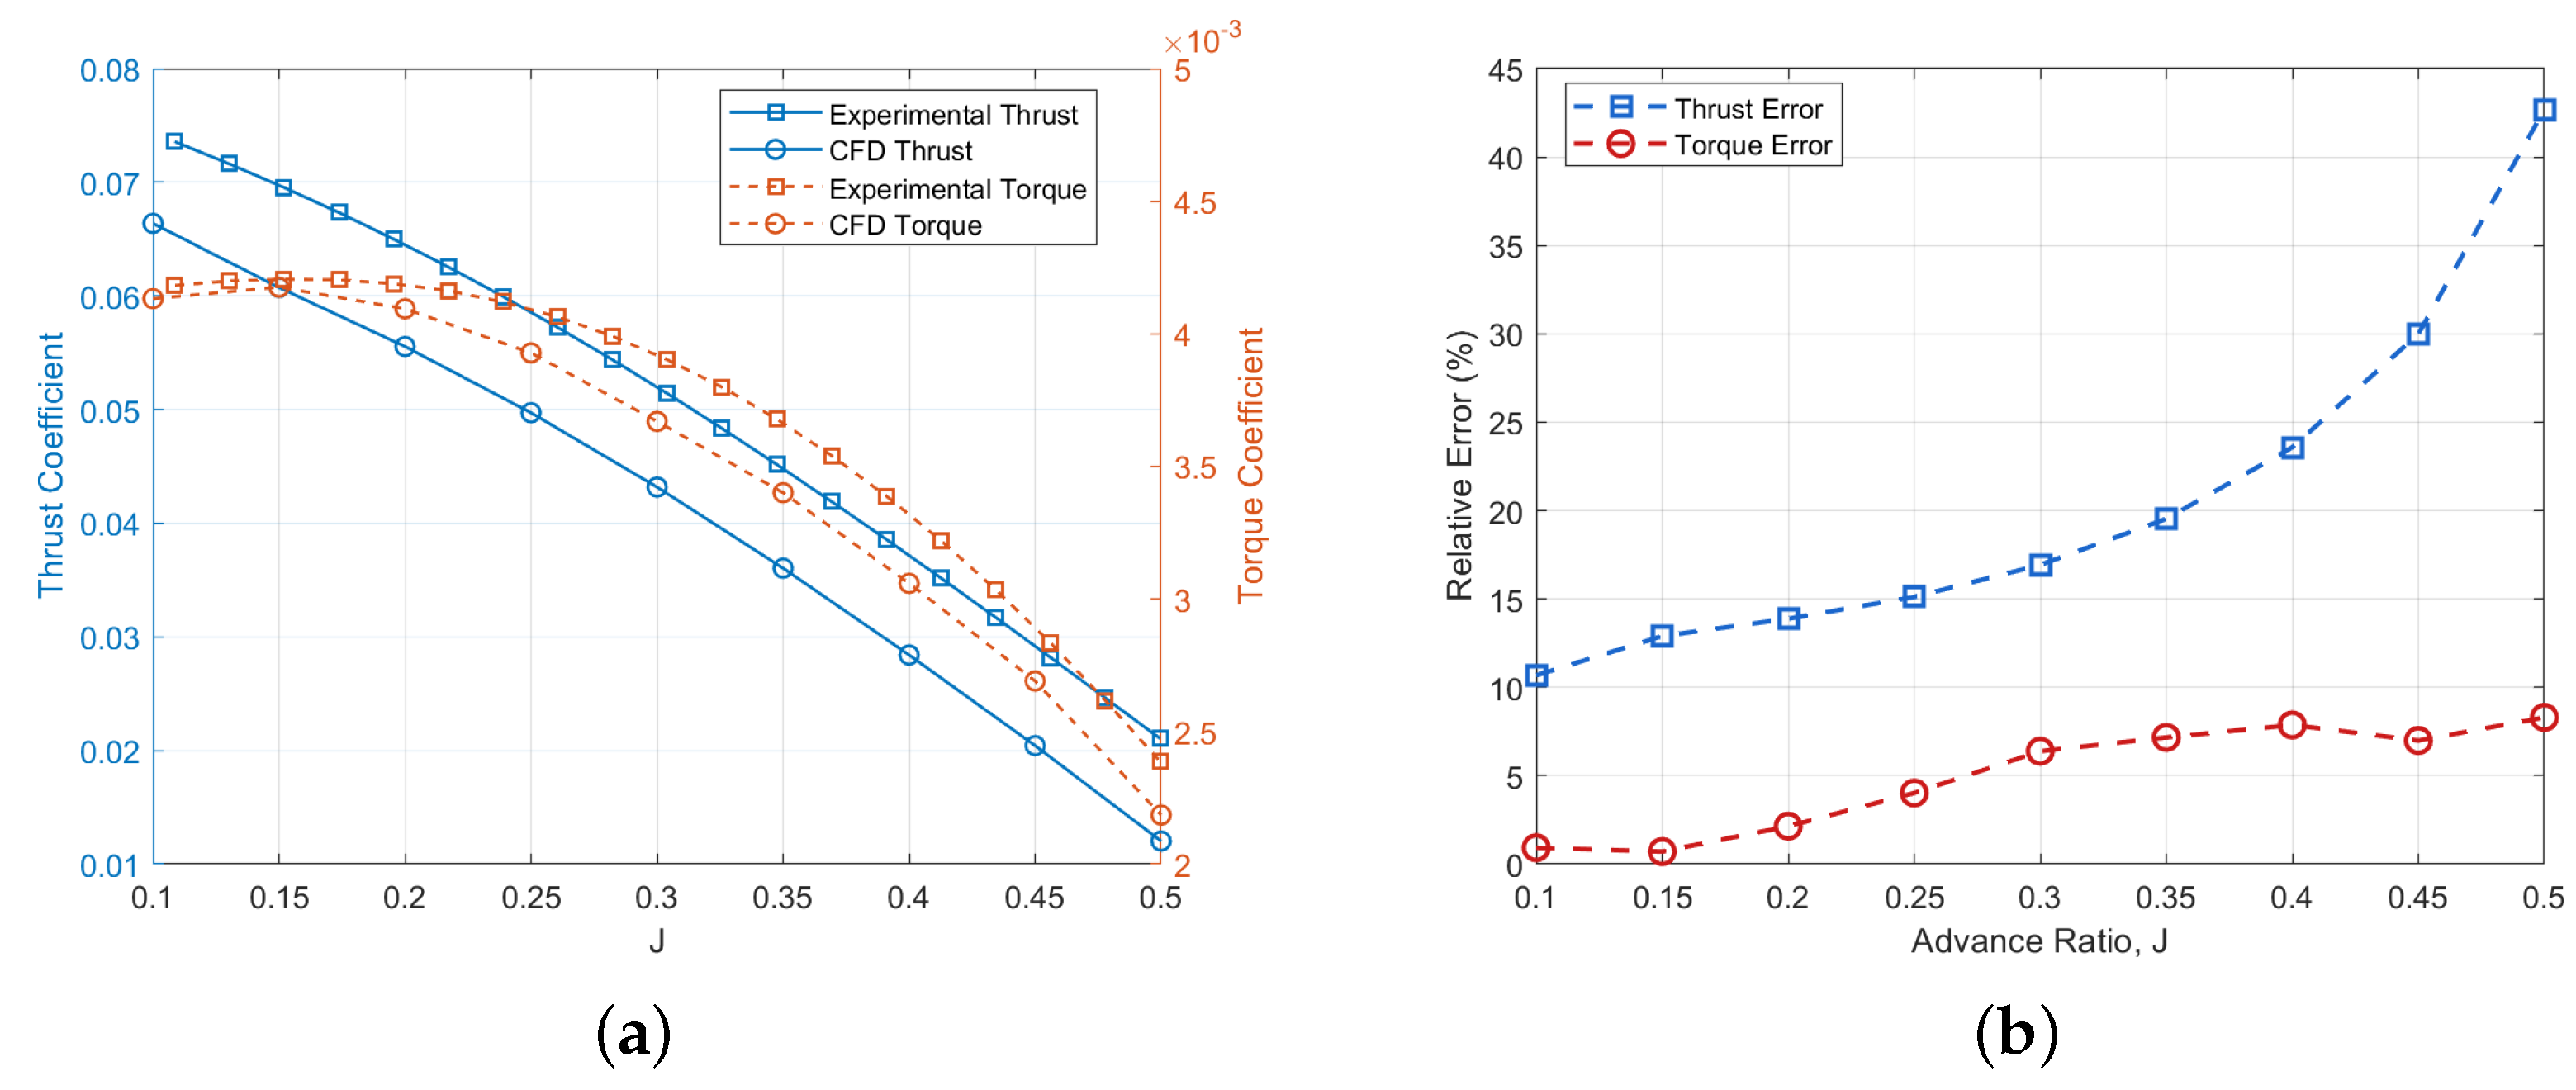
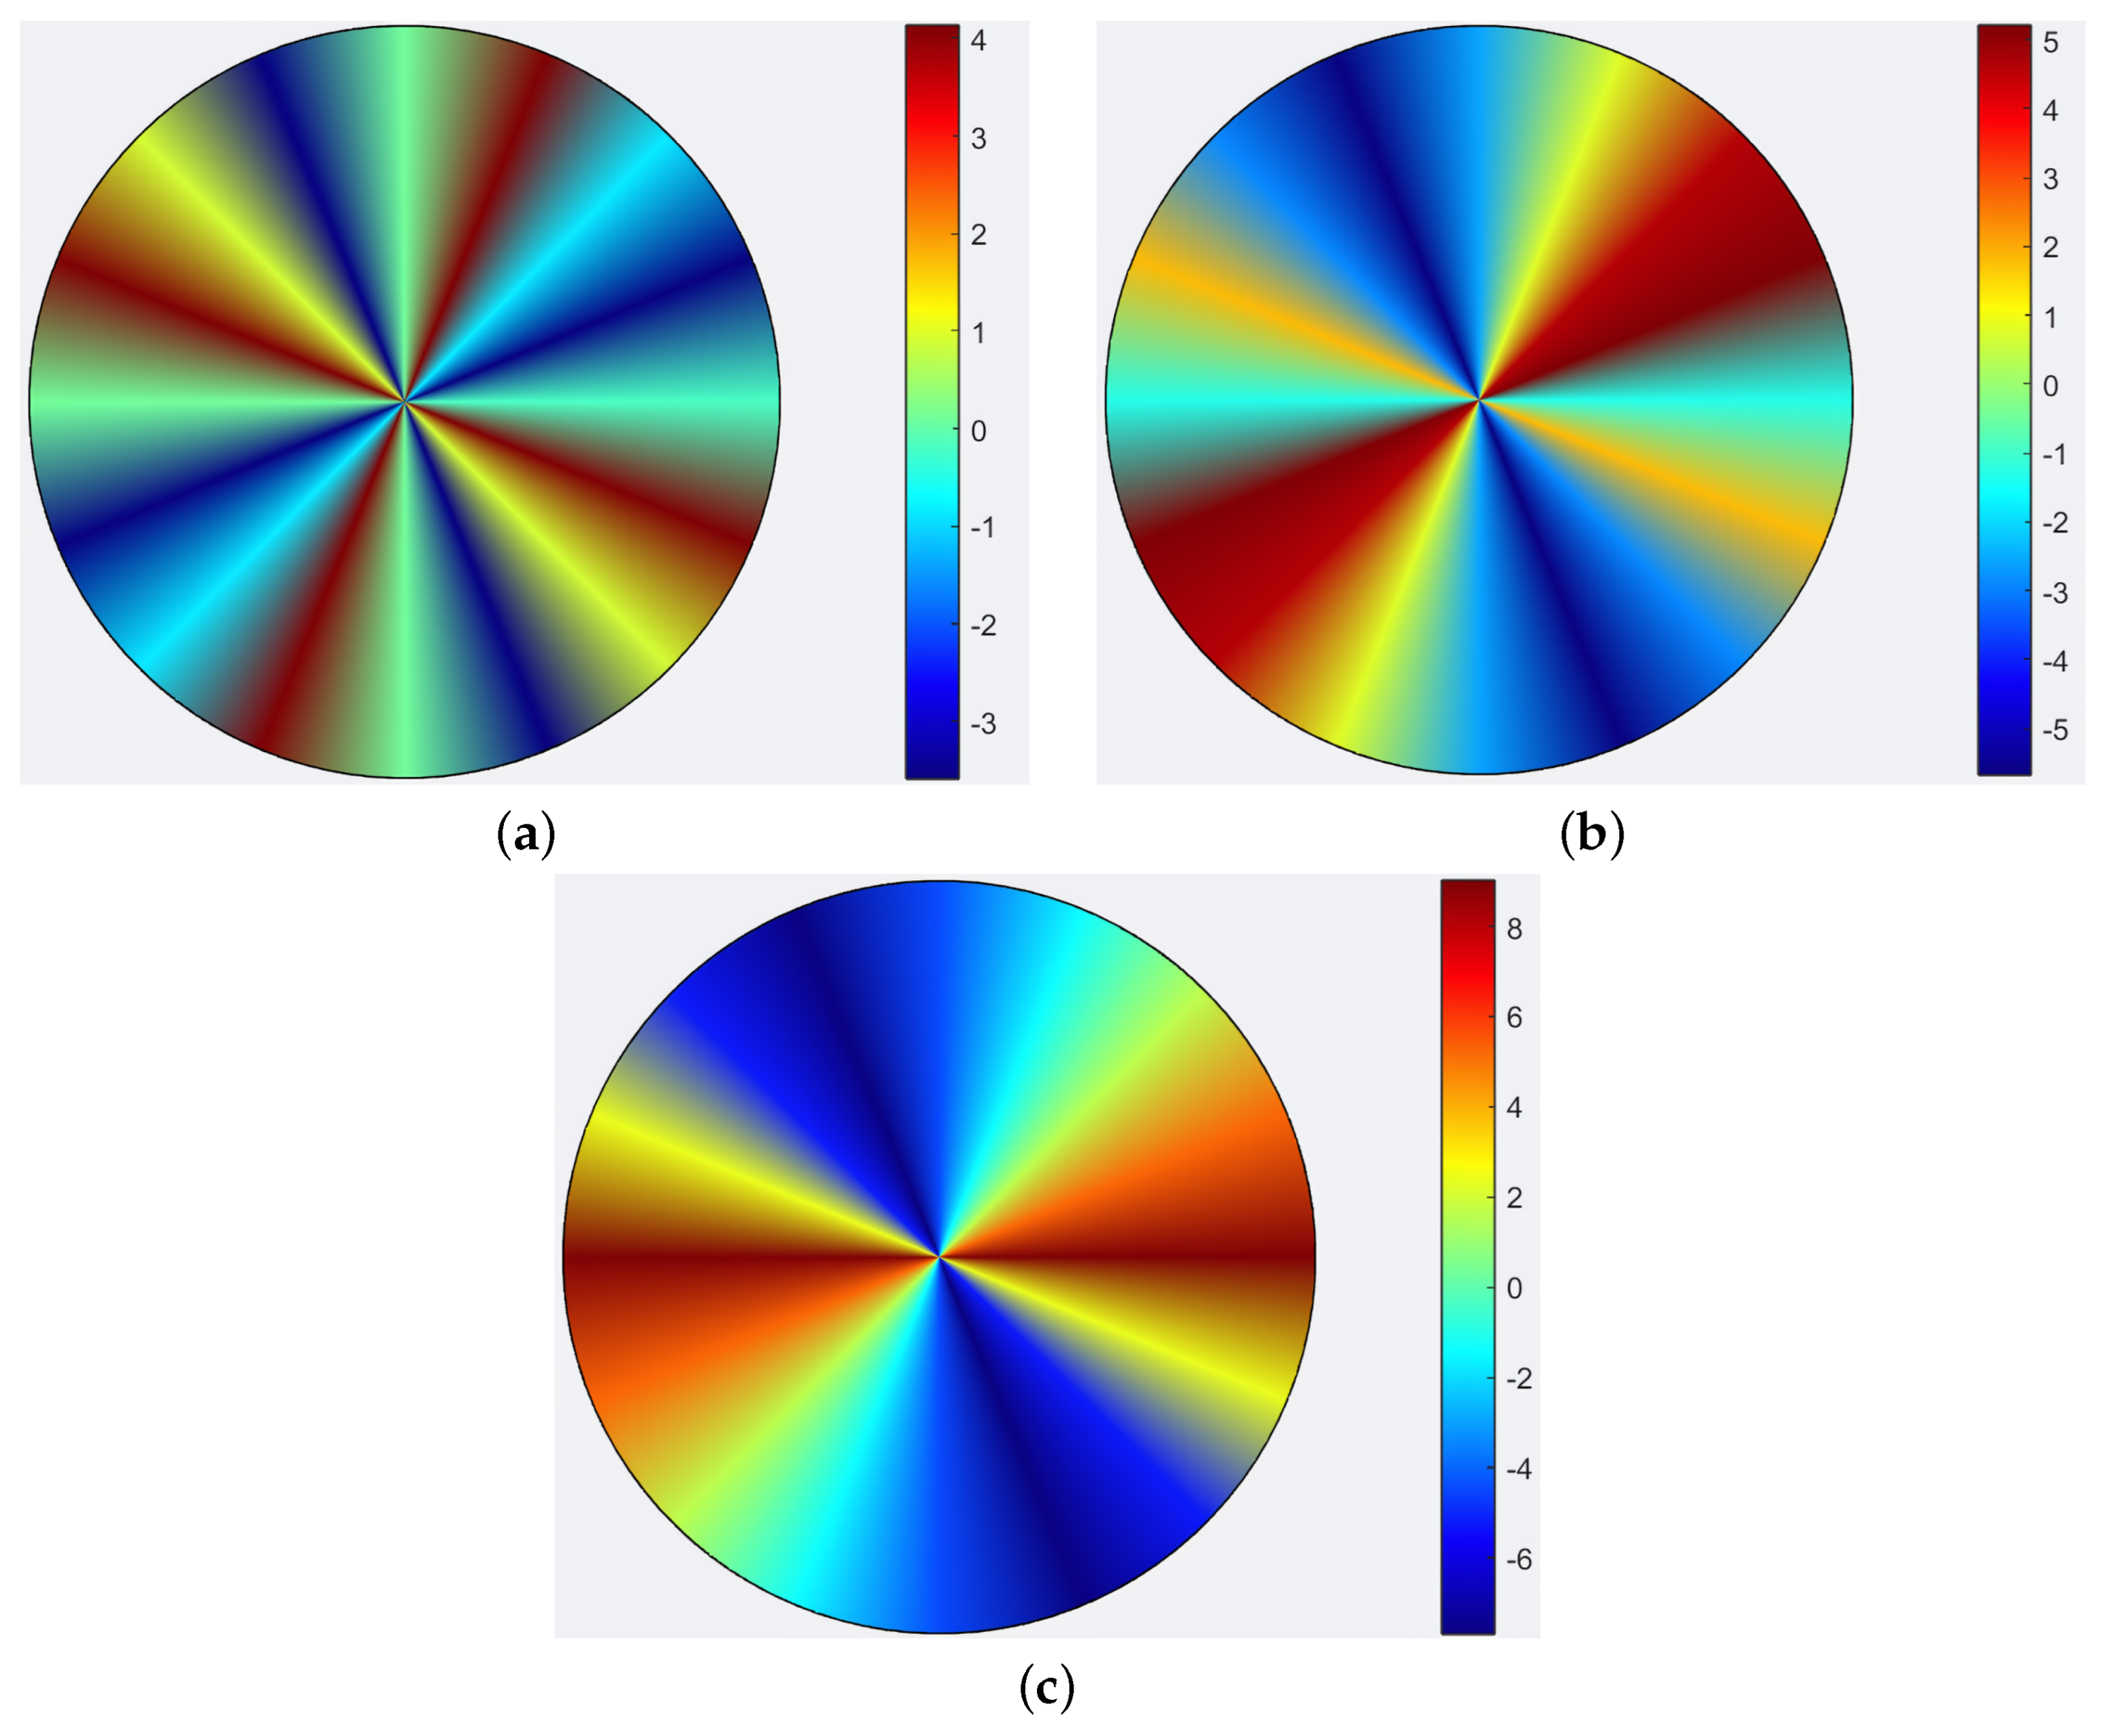
3.1. CFD Results

Figure 10 shows the difference in thrust coefficients between various angular and axial spacing configurations and the baseline case ( ϕ = 90 , 0 D ). The differences are minimal, with variations generally within a small percentage range, indicating that the thrust performance remains consistent across the tested configurations. The results indicate that for evenly spaced propeller blades, the baseline case with the default axial spacing of 0 D is optimal. When the angular spacing is 60 , the optimal axial spacing remains 0 D , whereas for an angular spacing of 30 , the optimal axial spacing shifts to 0.25 D .

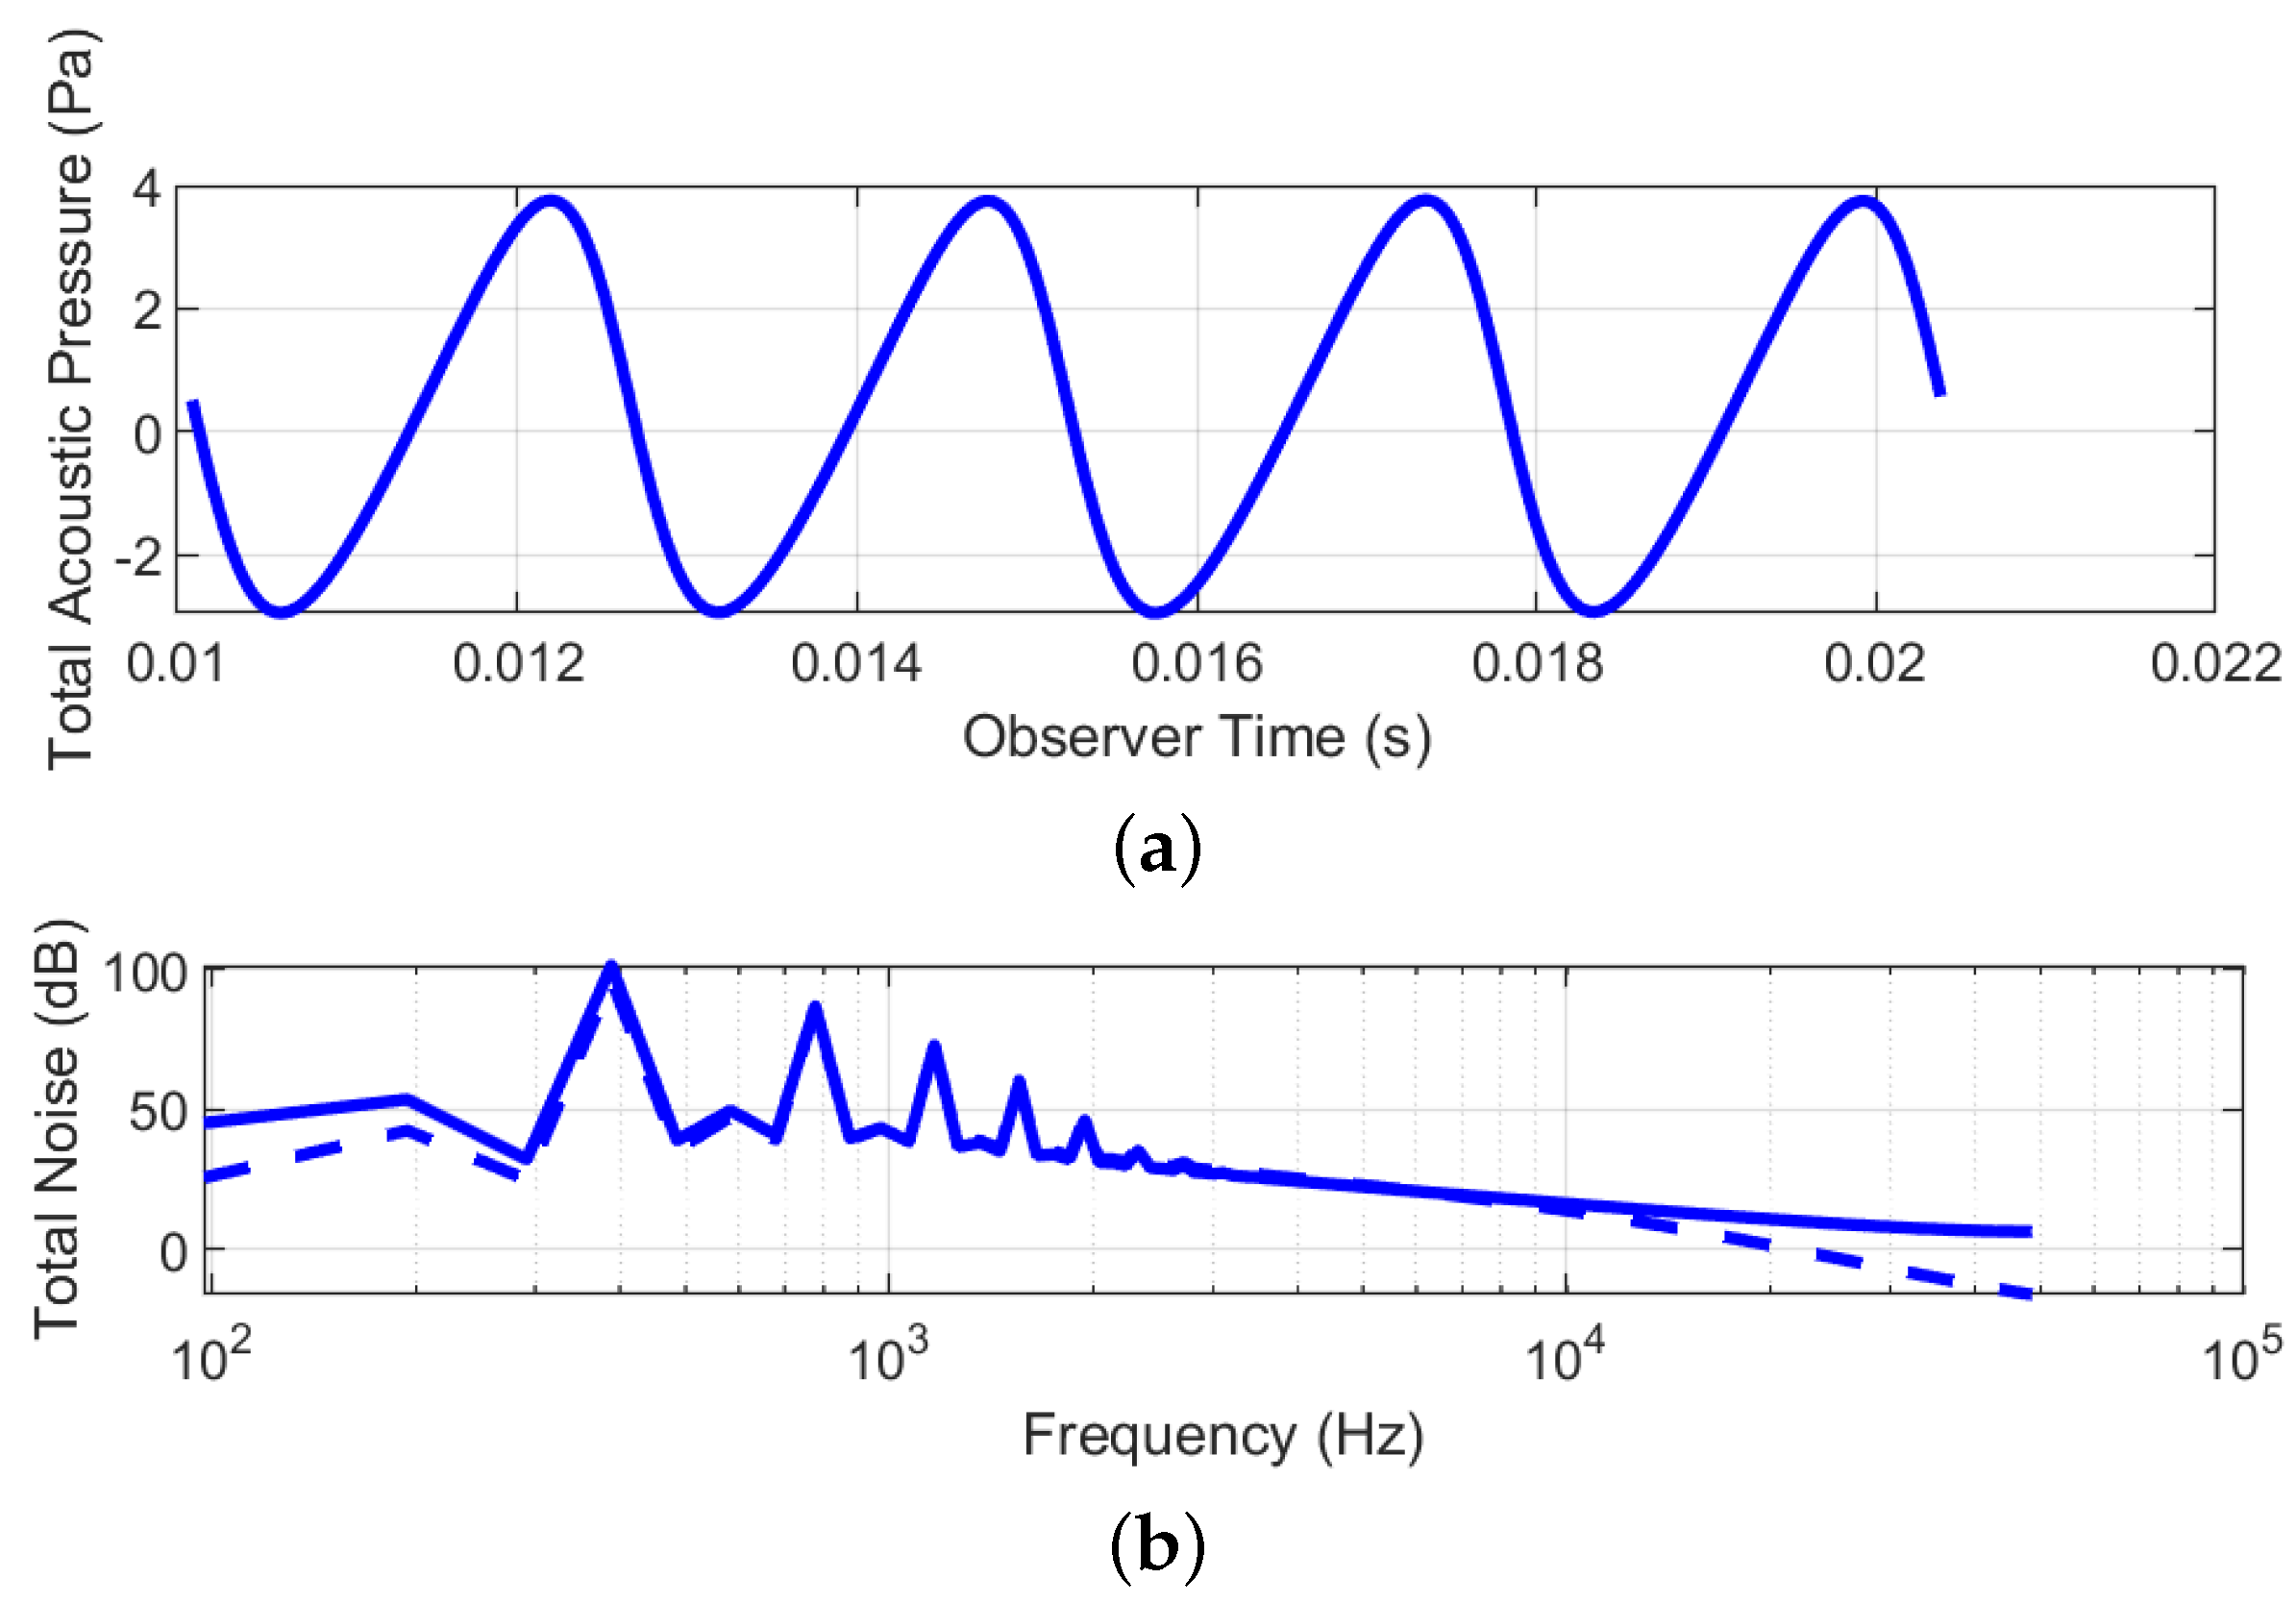
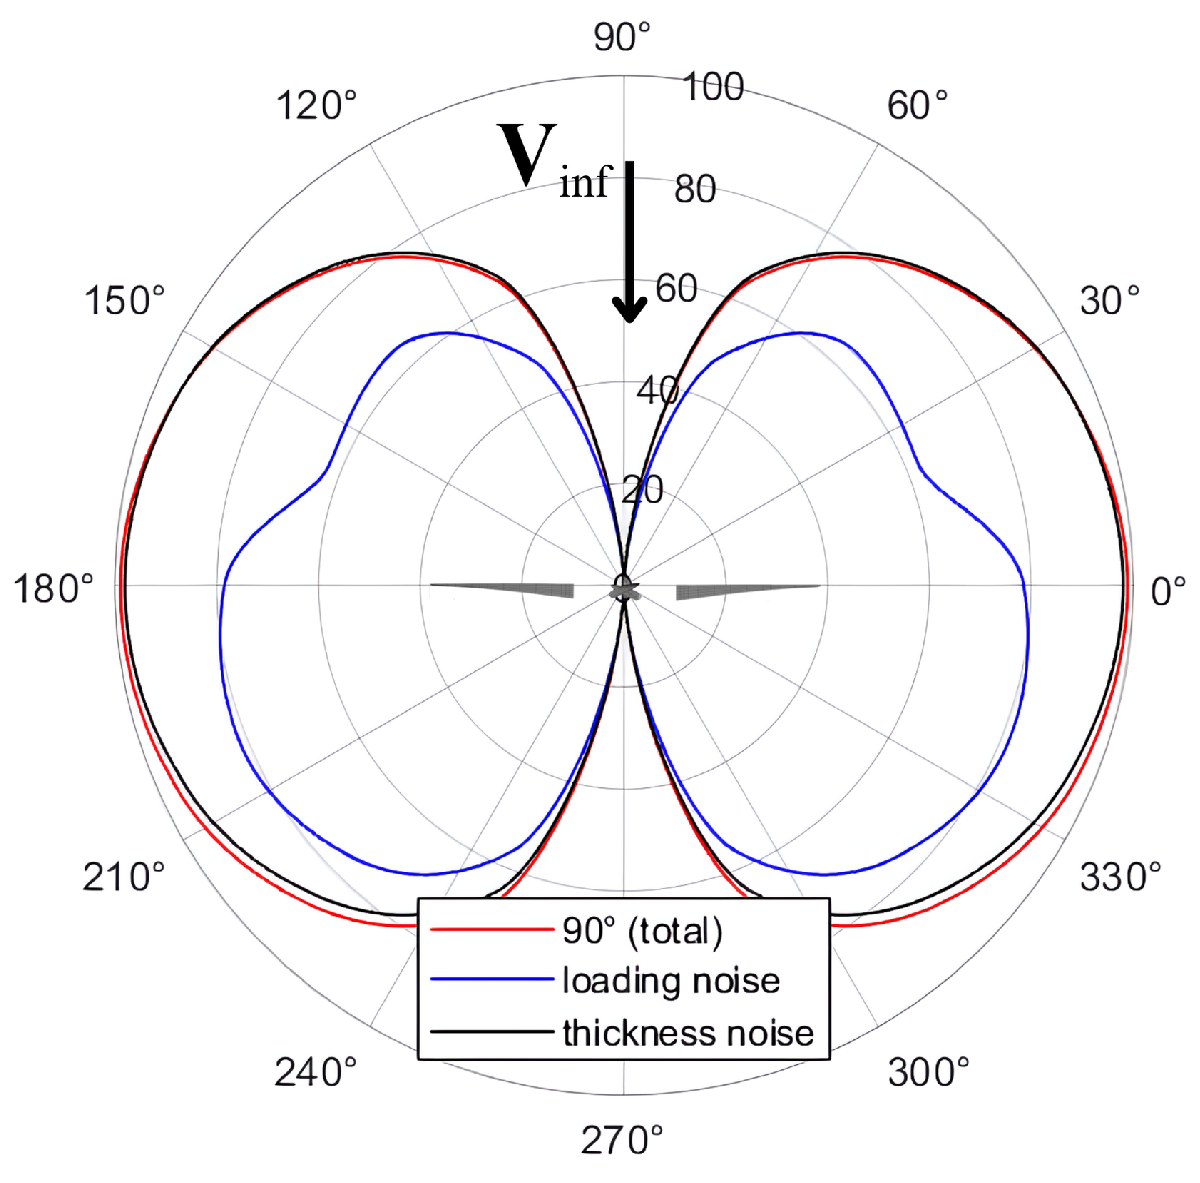
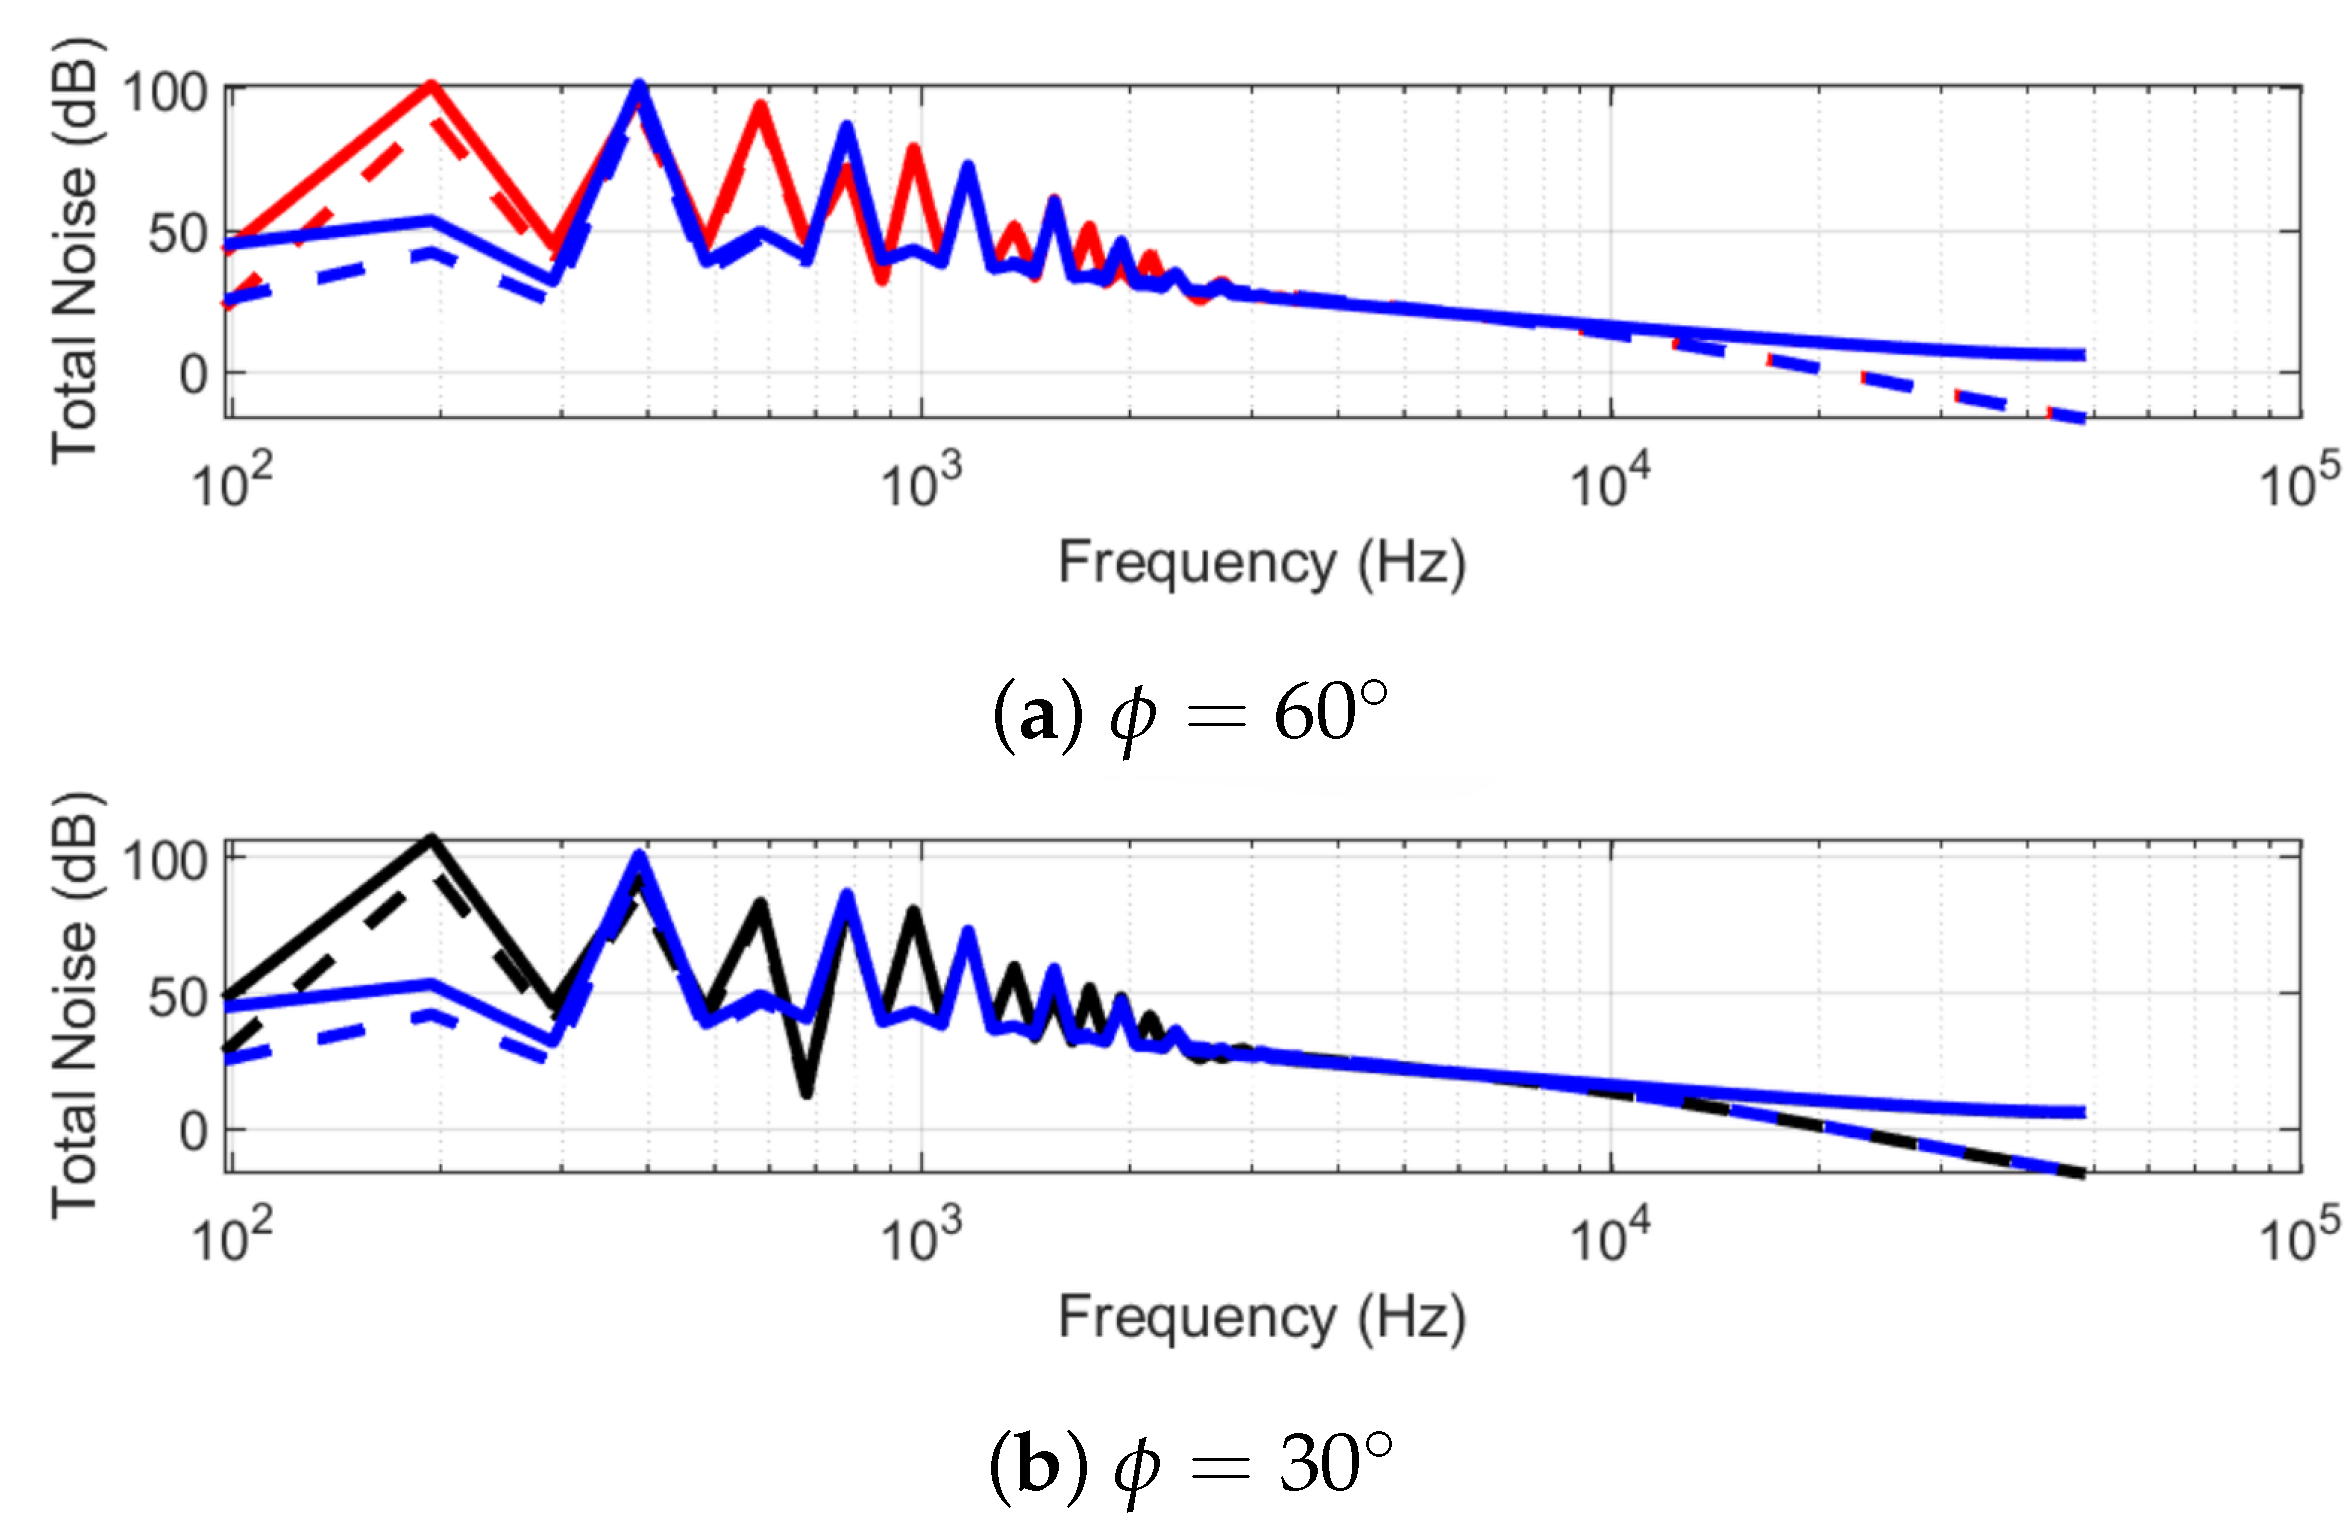
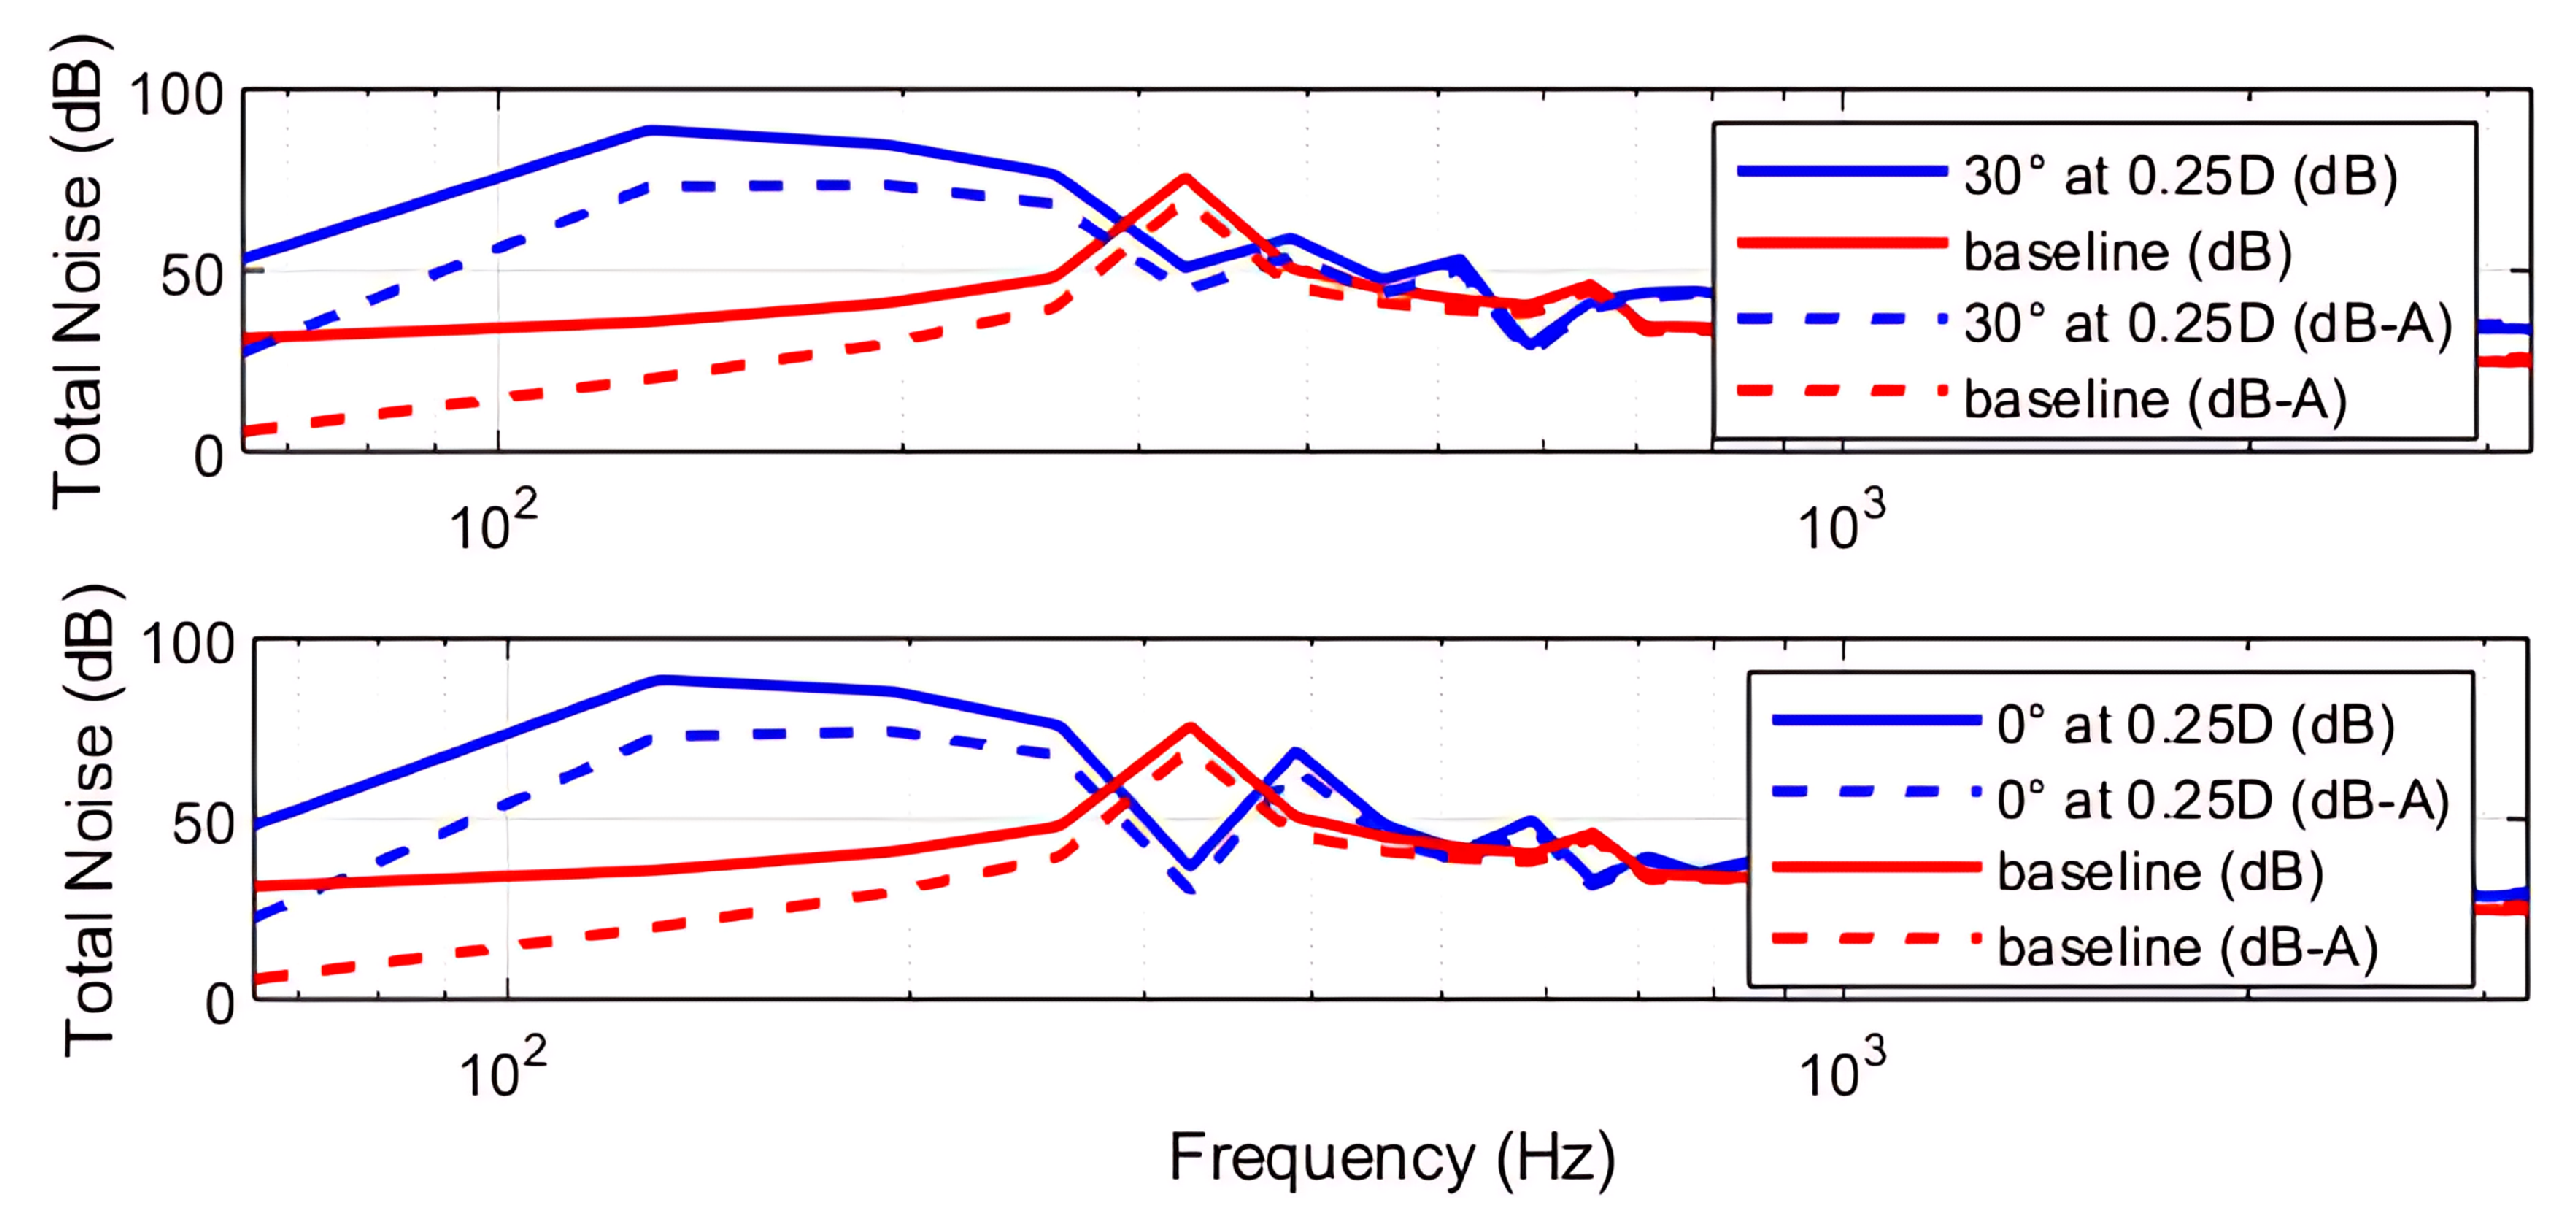
3.2. Aeroacoustic Analysis
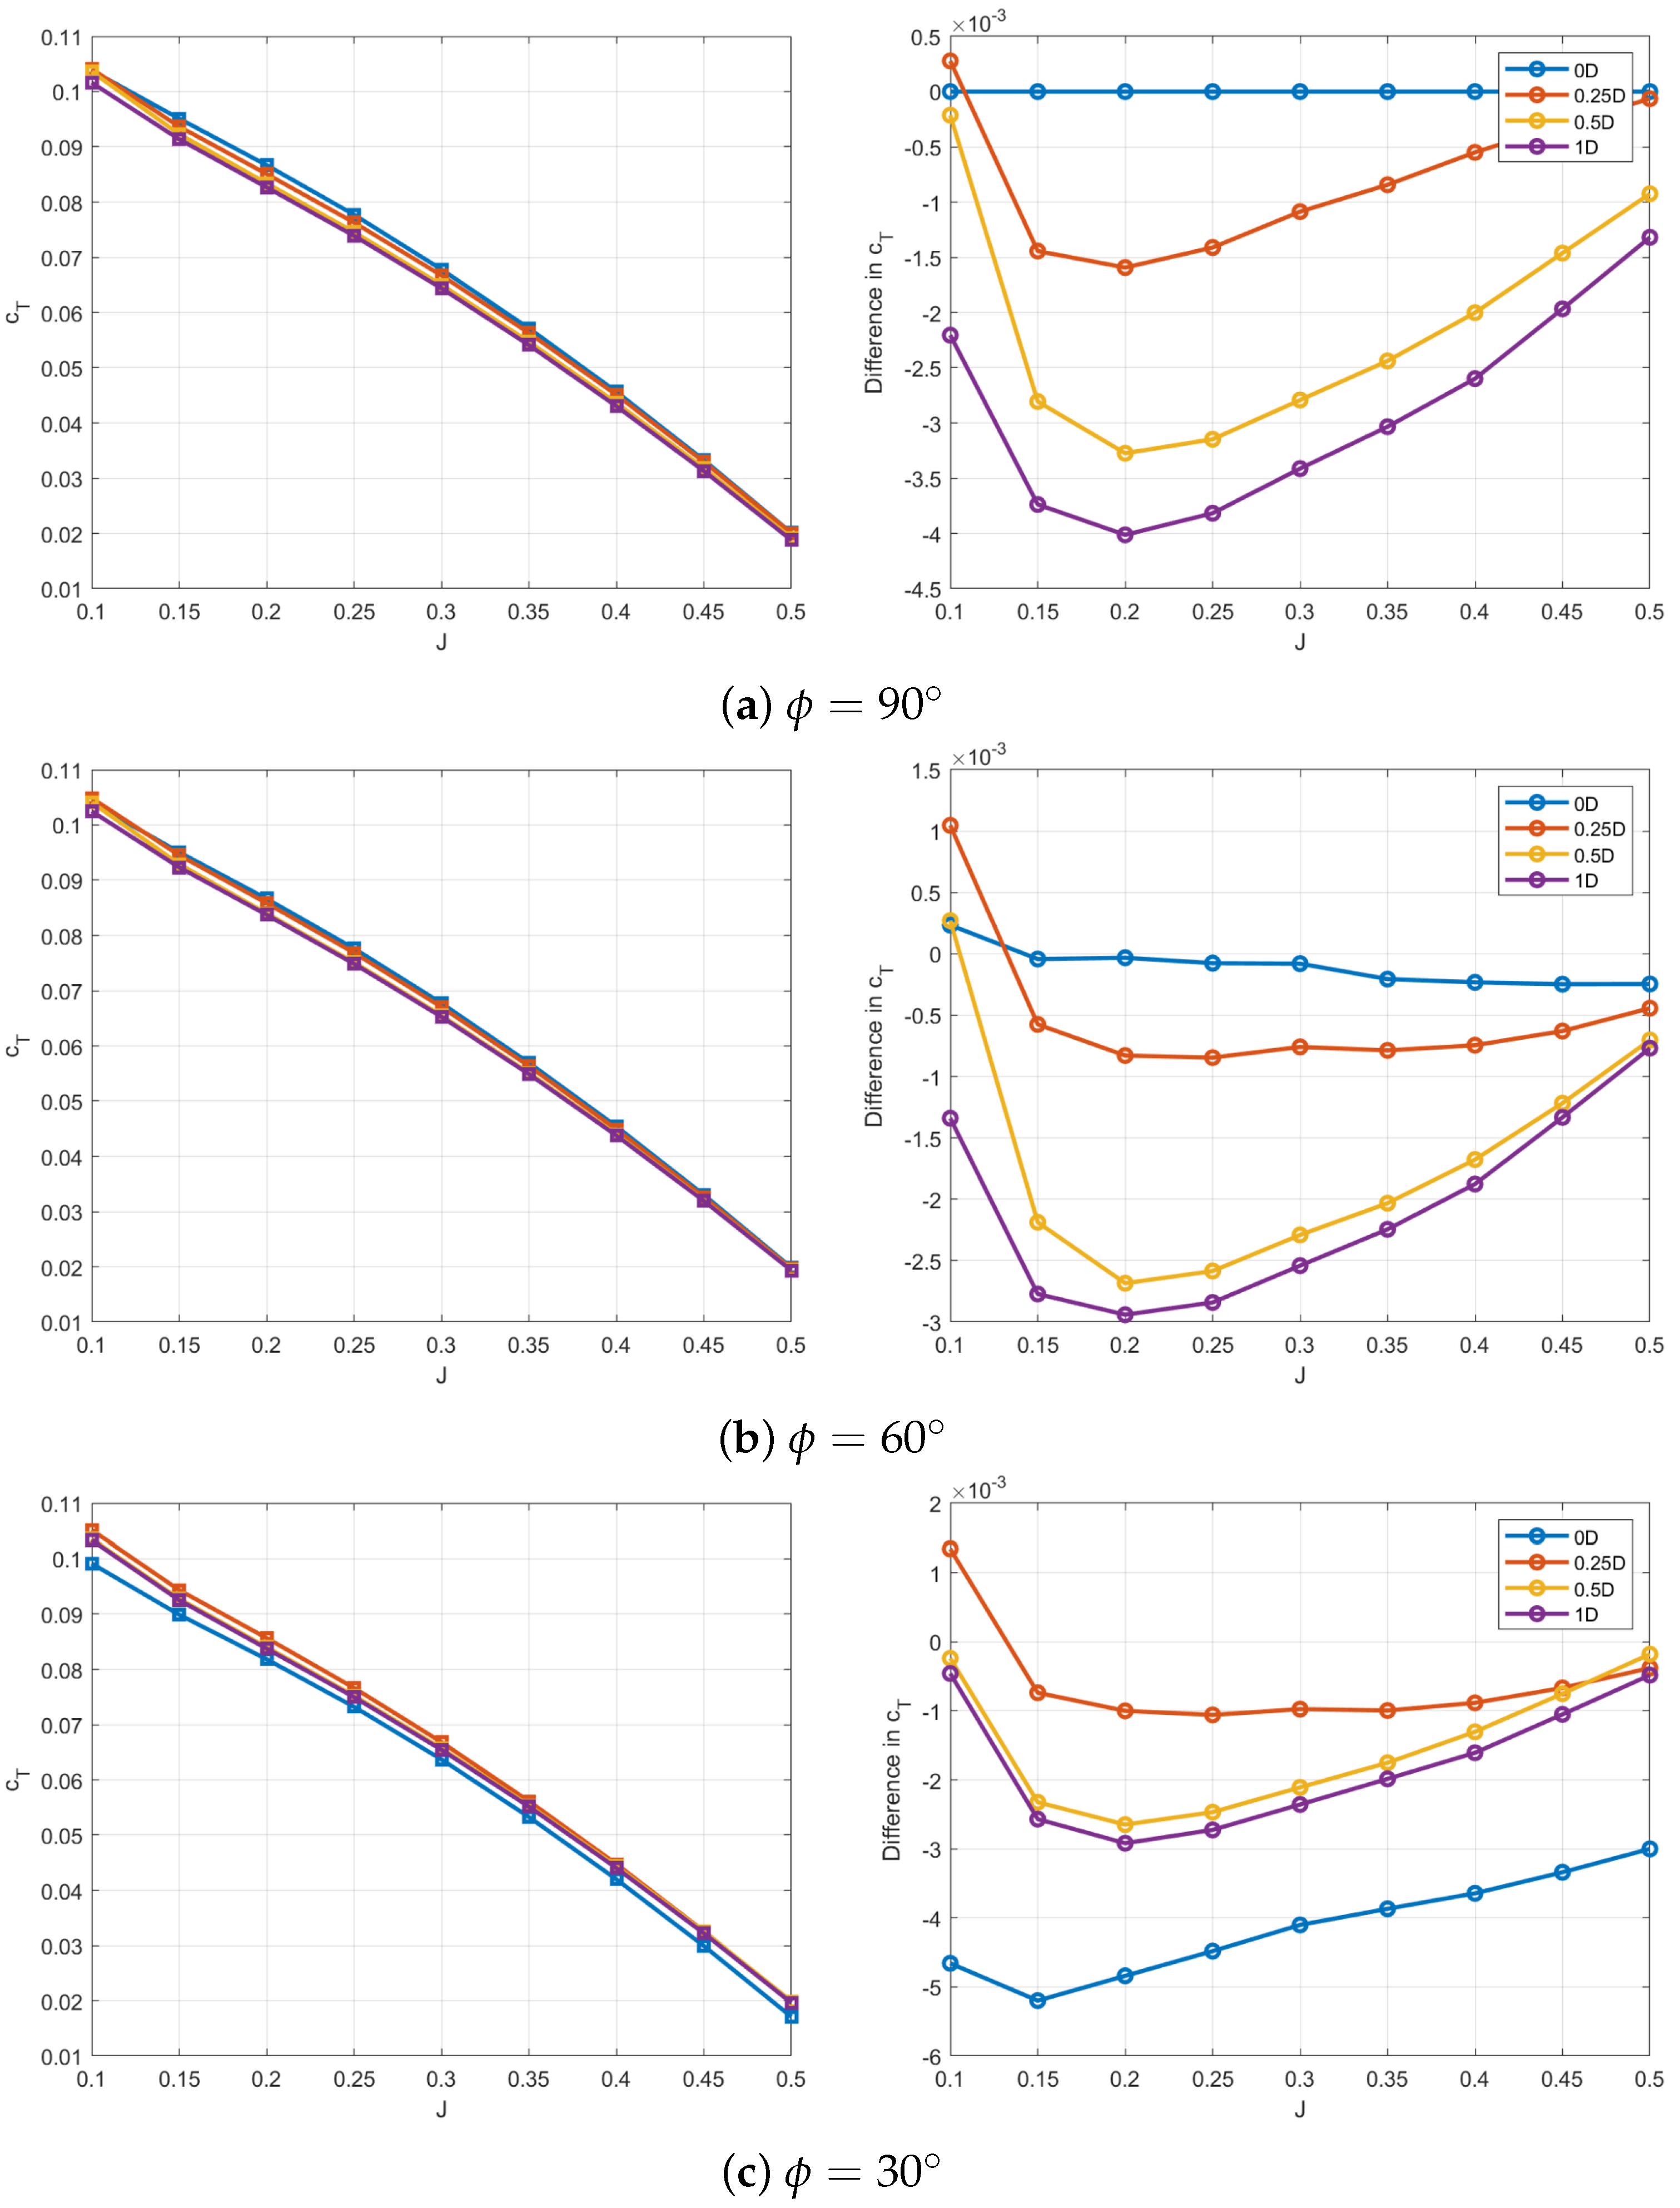
As observed in the previous section, three configurations will be considered here, namely, the baseline four-bladed coaxial propeller and two two-bladed propellers with azimuthal spacings of 30 and 60 and an axial spacing of 0.25 D . Propeller noise will be considered for two cases of a high and low thrust coefficient.

3.2.1. Thrust Coefficient ( c T = 0.065 )

The blade pressure extracted from the CFD analysis for different configurations is used as an input for the aeroacoustic analysis, as shown in Figure 11. The average pressure difference between the suction and pressure sides of the blades remained consistent across all configurations used in the aeroacoustic analysis. As a result, it was anticipated that the loading noise would be similar across these configurations.
The aeroacoustic simulations reveal that each configuration exhibits a unique unsteady pressure wave at the same observer point, as shown in Figure 12. For the 90 baseline configuration, there is a well-defined harmonic response with four peaks within a single period. This is expected for this configuration, as there are four equally spaced rotating sources. For the 30 configuration, there are two pressure peaks within a single period, suggesting that the sound source is emitted from two rotating sources rather than four sources. This is expected as the angular spacing between the propeller blades is small. For the 60 configuration, the pressure at the observer is a superposition of two harmonics, one representing a rotating source of a two-bladed propeller and one representing a rotating source of a four-bladed propeller. This is expected as the angular spacing is relatively large. This pressure distribution impacts the frequency spectrum and alters the BPF, influencing the overall noise characteristics of the propeller.
The frequency spectrum shows that the first BPF for the 90 case appears at twice the frequency of the 30 case, as seen in Figure 13. For the 60 configuration, the first two BPFs appear to have the same noise level. This can be explained by the aeroacoustic pressure waves generated by the propeller configurations. The shift to a broader frequency bandwidth helps to reduce the perceived A-weighted noise level. The A-weighted noise level is indicated by dashed lines on the plot, showing that at lower frequencies, the filter is more significant because the human ear perceives low-frequency noise as less noisy. This results in an overall noise level reduction of 2 dBA.
Figure 14 illustrates the aeroacoustic pressure distribution at Z = 0 for the baseline and two test configurations. The 60 configuration, represented in panel (b), exhibits two distinct red regions, indicating areas of higher pressure.
These regions are broader than the 30 configuration in panel (c), where the higher-pressure zones are thinner but still only show two distinct “waves”. In contrast, the conventional 90 configuration, shown in panel (a), displays four distinct variations in pressure. This analysis highlights a key aeroacoustic difference between the configurations: the conventional 90 case effectively behaves as though there are four rotating sources, each contributing to the noise spectrum. In the 60 and 30 cases, the aeroacoustic behavior suggests the presence of only two “effective blades” despite the actual blade count. As a result, the frequency spectrum for the 60 and 30 configurations resembles that of a two-bladed propeller, not a four-bladed one. Consequently, the BPF in these cases is halved compared to the 90 configuration, which has a higher BPF corresponding to the four-bladed behavior. This shift in the frequency spectrum underscores the impact of blade spacing on the aeroacoustic characteristics of the propeller.

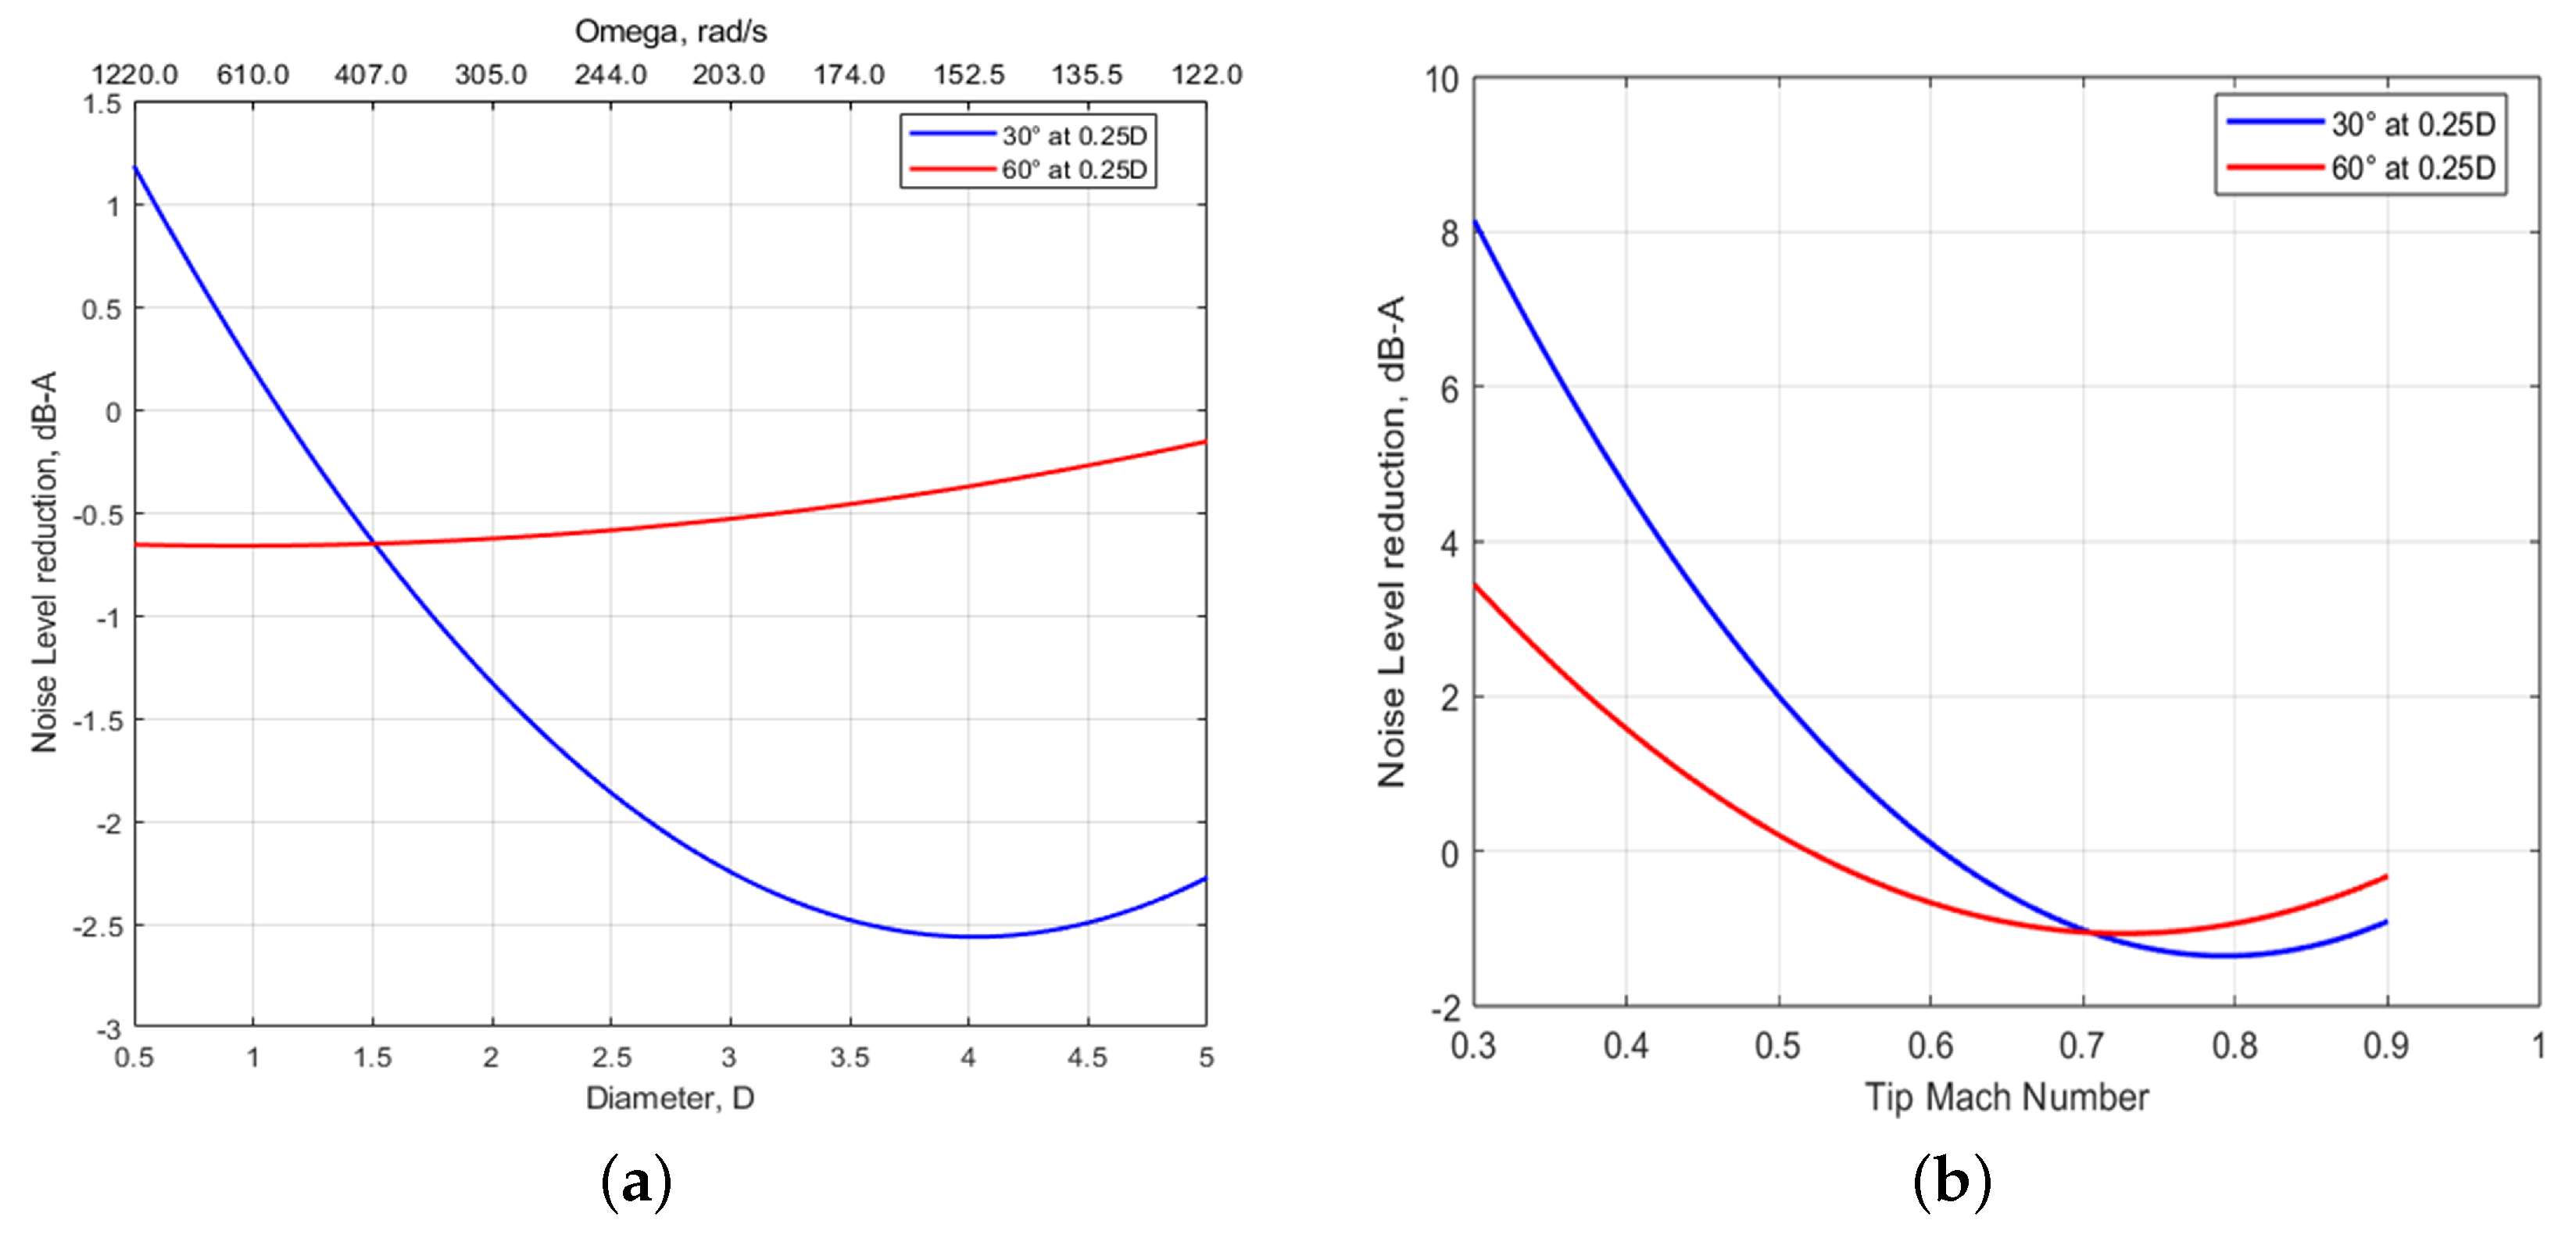
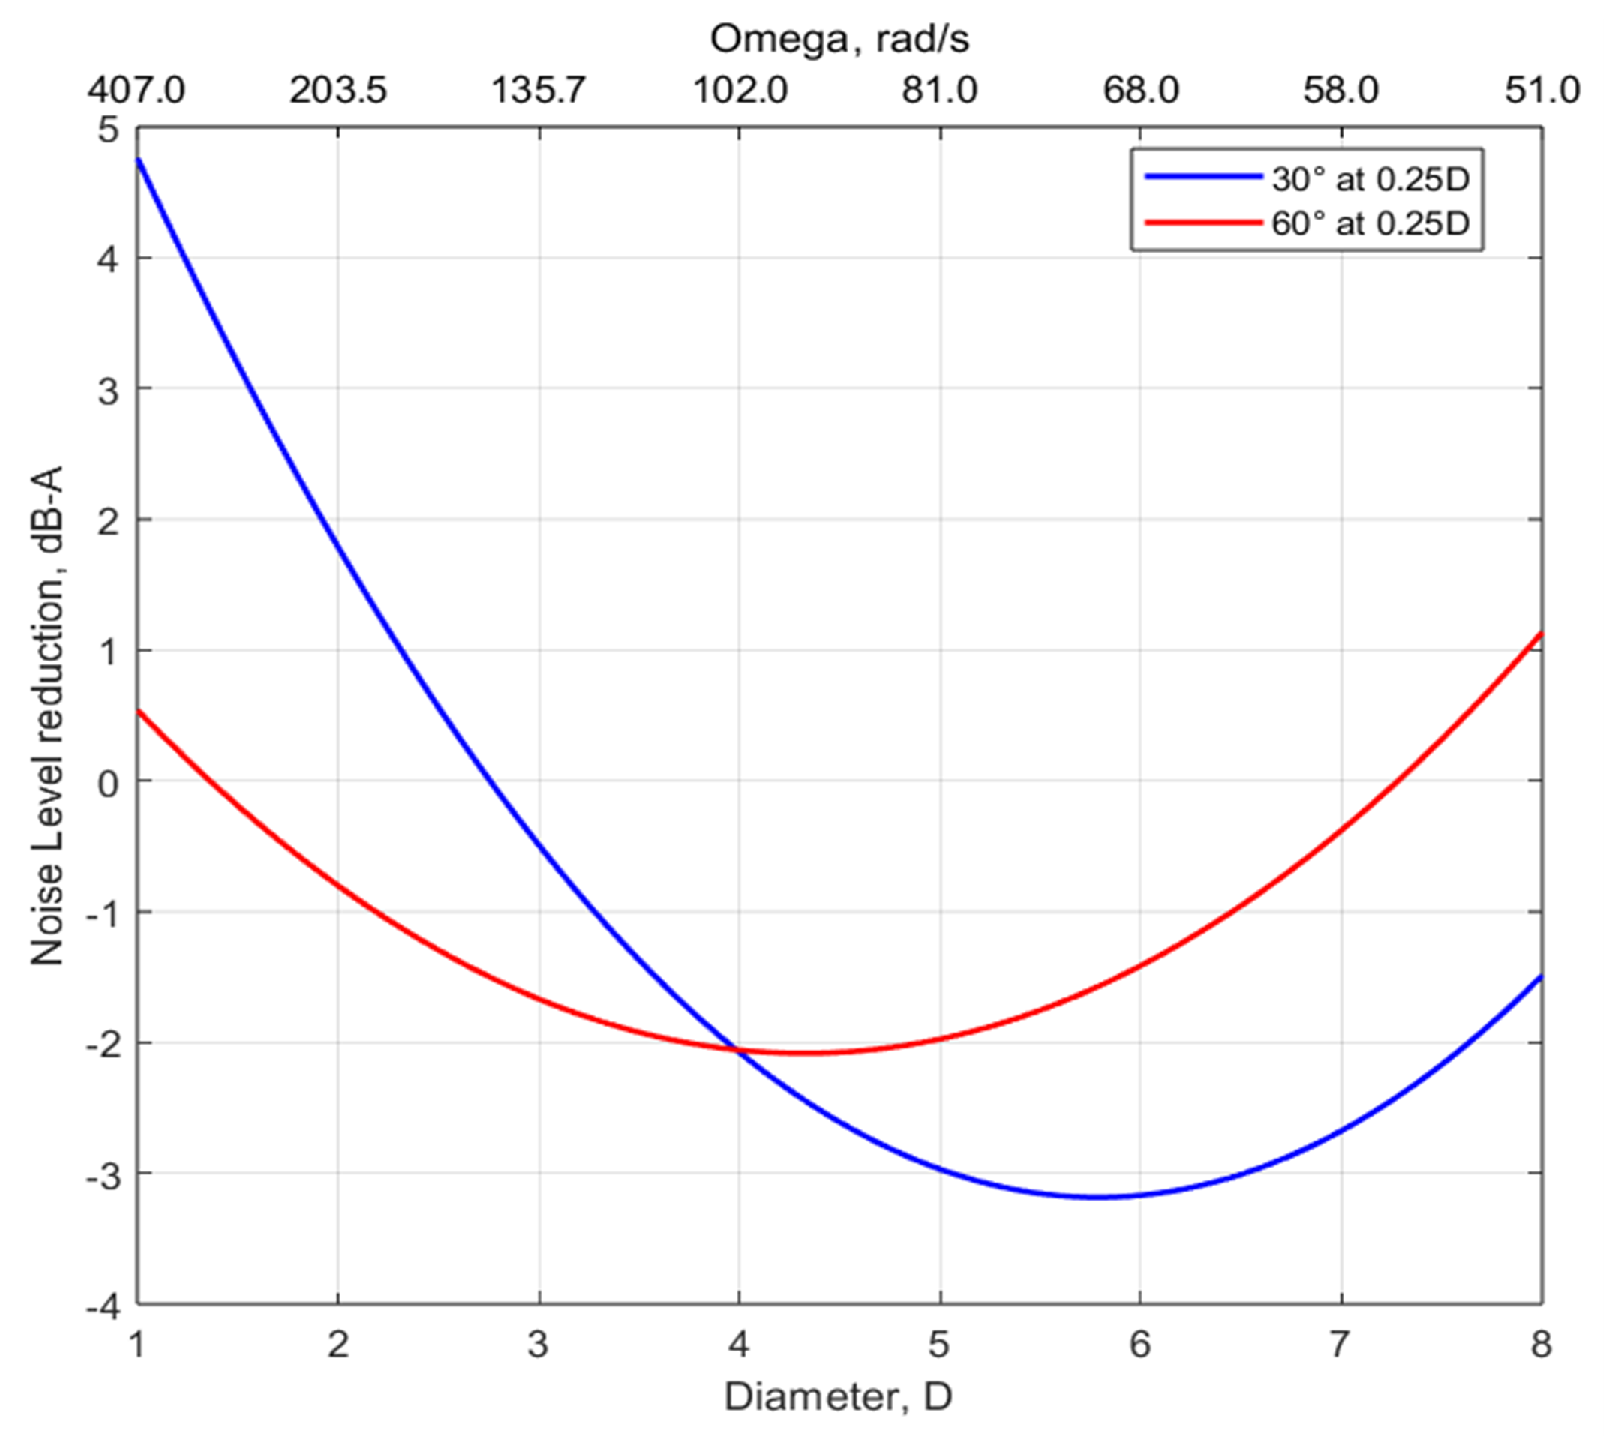
3.2.2. Parametric Study

This parametric study investigates the effects of varying the propeller diameter and RPM on noise reduction while maintaining a constant thrust coefficient ( c T = 0.063 ). The results demonstrate that scaling the propeller dimensions can significantly enhance aeroacoustic performance.
For a 30 angular spacing, increasing the propeller diameter to 4.5 times the baseline achieves a maximum noise reduction of 2.5 dBA, as shown in Figure 15a. This reduction is attributed to the redistribution of noise energy across broader frequency ranges, thereby decreasing the perceived intensity of tonal noise. The influence of the tip Mach number was also analyzed. For a 30 angular spacing, the optimal tip Mach number range lies between 0.7 and 0.9 , effectively minimizing noise by balancing aerodynamic loading with acoustic efficiency. Conversely, for the 60 angular spacing, a slightly lower tip Mach number range of 0.6 0.8 also achieves considerable noise reduction, as shown in Figure 15b. Adjusting both the RPM and the propeller diameter simultaneously can achieve an additional noise reduction of up to 3 dBA in the 30 configuration, as illustrated in Figure 16. These findings underscore the importance of tailoring tip Mach numbers to specific angular spacing configurations for effective noise management. These results highlight the sensitivity of noise reduction to both geometric and operational parameters, emphasizing the potential benefits of scaling and tuning design features to achieve desirable aeroacoustic characteristics.

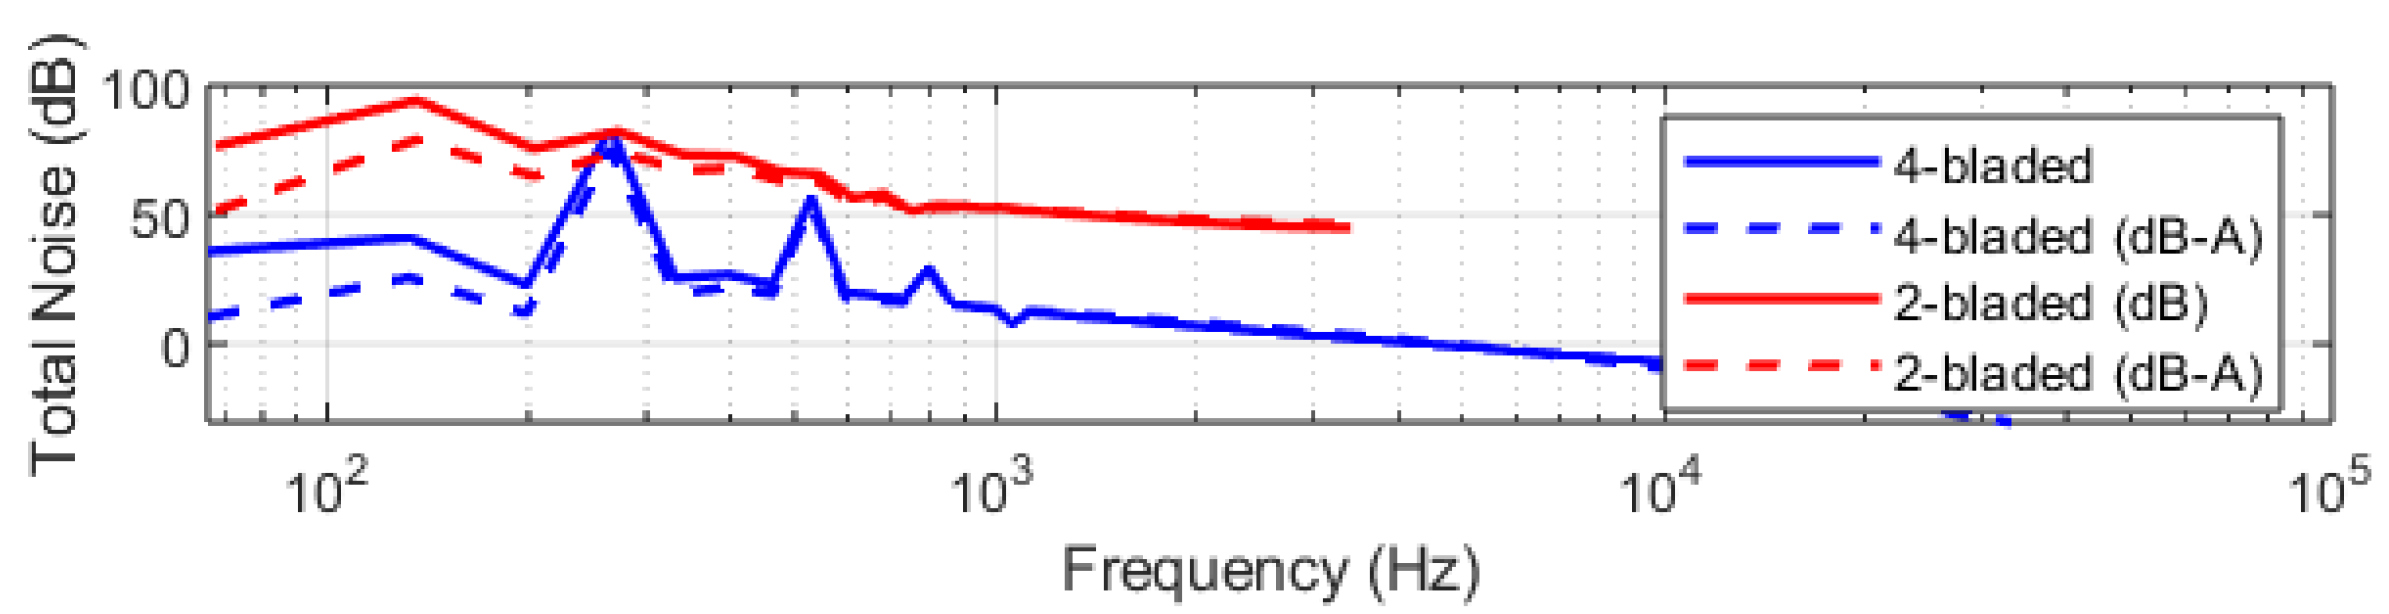
3.3. Five-Bladed Configuration

In an additional study, a five-bladed propeller was analyzed and compared to an unconventional unevenly spaced five-bladed coaxial configuration. This study included three configurations: the coplanar evenly spaced baseline and two propellers with an axial separation of 0.25 D , as shown in Figure 17. For both coaxial separations, three blades were used upstream, with two different azimuthal separations. In the 0 configuration, the smallest angle between the upstream and downstream propellers was 0 , while in the 30 configuration, the smallest separation angle was 30 .
Moreover, these uneven configurations did not achieve significant noise reduction, as illustrated in Figure 18, even though the BPF for the tonal noise was modified. This suggests that it might be possible to further improve the noise reduction, but further work is needed to investigate the optimal axial spacing, operating diameter, and tip Mach speed ratio.

4. Conclusions

The study investigates the aerodynamic and aeroacoustic performance of propellers with uneven blade spacing, focusing on various axial distances and angular spacing configurations to identify optimal noise reduction and thrust performance. The key findings are as follows:
1. Aerodynamic Performance: The thrust coefficient results indicate that for angular spacings of 90 and 60 , the best-performing axial distance is 0 D . For the 30 angular spacing, the optimal axial distance is 0.25 D . The performance differences across these configurations are minimal, as they are within the range of 1– 2 % , and they can be considered negligible.
2. Aeroacoustic Performance: The aeroacoustic results reveal unique pressure patterns for each configuration. The 30 configuration shows two distinct pressure peaks, the 60 configuration shows two large and two smaller peaks, and the 90 configuration shows four equal peaks. Directivity analysis indicates a 2 dBA noise reduction in the 30 and 60 configurations compared to the 90 configuration at the plane of blade rotation, although the noise levels significantly increase in the directions along the axis of rotation of the propeller. The frequency spectrum analysis shows that the 30 and 60 configurations spread the noise energy of the first BPF over a broader frequency range, reducing the perceivable A-weighted noise level by about 2 dBA.
3. Scaling and Tip Mach Number Study: A parametric study varying the diameter and RPM of the propeller while maintaining a constant thrust coefficient indicates that at 4.5 times the initial diameter, a maximum noise reduction of 2.5 dBA can be achieved with a 30 angular spacing. The tip Mach number study reveals that for a 30 spacing, a tip Mach number between 0.7 and 0.9 is most preferable for noise reduction. For the 60 spacing, a lower tip Mach number (0.6–0.8) can also be effective in reducing noise.
4. Preliminary research results of the five-bladed propeller design indicate that it does not provide any noticeable advantage in terms of noise reduction. However, further research is needed to make a valid decision.
In conclusion, the study highlights that while uneven blade spacing can effectively reduce noise levels, particularly when combined with optimal axial distance and tip Mach number values, maintaining aerodynamic performance requires careful consideration of these parameters. Even so, small decreases in noise can have a significant impact on public health, especially in urban areas where UAVs and VTOLs are becoming more common. Such noise level reductions can greatly improve quality of life by mitigating the adverse effects of noise pollution on human well-being.
Future work should explore the practical implementation of these findings in real-world propeller designs and further investigate the trade-offs between noise reduction and aerodynamic efficiency. Additionally, we plan to thoroughly investigate the aeroacoustic performance of different five-bladed propeller configurations. Future work will also focus on validating the acoustic results by conducting experiments to compare the predicted outcomes with real-world data, ensuring the accuracy and applicability of the findings in practical settings.

Author Contributions

Conceptualization, B.E.; Methodology, C.A.; Validation, C.A. and A.Z.; Formal analysis, C.A.; Investigation, C.A.; Writing—original draft, C.A.; Writing—review & editing, A.Z. and B.E.; Supervision, B.E. All authors have read and agreed to the published version of the manuscript.

Funding

This research was funded by Nazarbayev University under the faculty development research grant program for 2024–2026 (Grant No. 20122022FD4124) entitled “Aeroacoustic Assessment for a Novel Propeller with Rotor Lean”.

Data Availability Statement

The raw data supporting the conclusions of this article will be made available by the authors on request.

Conflicts of Interest

The authors declare no conflicts of interest.

Nomenclature

Latin Letters
c T Thrust Coefficient
c Q Torque Coefficient
V Freestream Velocity (m/s)
ρ Air Density (kg/m3)
TThrust Force (N)
QTorque (Nm)
JAdvance Ratio
nRotational Speed (revolutions per second)
DPropeller Diameter (m)
cChord Length (m)
rDistance Between Observer and Source Point (m)
M r Mach Number in the Radiation Direction
L r Loading Vector in the Radiation Direction
L M Mach Number Component of the Loading Vector
Greek Letters
α Angle of Attack [°]
β Blade Twist Angle [°]
δ Tail Deflection Angle [°]
ζ Damping Ratio
ω n Undamped Natural Frequency (Hz)
ϕ Azimuthal Spacing [°]
Subscripts
acAerodynamic Center
Freestream
Operators and Other
( ) ˙ First Time Derivative
( ) Perturbation Quantity
( ) n Component Normal to a Surface
( ) norm Normalized Quantity
BPFBlade Passing Frequency
MRFMoving Reference Frame
RANSReynolds-Averaged Navier–Stokes
RPMRevolutions per Minute
SSTShear Stress Transport
UAVUnmanned Aerial Vehicle
d S Differential Surface Area Element

References

  1. Chen, H.; Kwong, J.C.; Copes, R.; Tu, K.; Villeneuve, P.J.; Van Donkelaar, A.; Hystad, P.; Martin, R.V.; Murray, B.J.; Jessiman, B.; et al. Living near major roads and the incidence of dementia, Parkinson’s disease, and multiple sclerosis: A population-based cohort study. Lancet 2017, 389, 718–726. [Google Scholar] [CrossRef] [PubMed]
  2. Clark, C.; Paunovic, K. WHO environmental noise guidelines for the European region: A systematic review on environmental noise and quality of life, wellbeing and mental health. Int. J. Environ. Res. Public Health 2018, 15, 2400. [Google Scholar] [CrossRef] [PubMed]
  3. Lowson, M.V. Noise radiation from V/STOL aircraft. In Proceedings of the International Council of the Aeronautical Sciences, NASA Technical Reports Server (NTRS), Adelaide, Australia, 1 July–31 December 1972; Available online: https://ntrs.nasa.gov/citations/19720057481 (accessed on 1 September 2024).
  4. Anonymous. Impact of Aircraft Noise on Health. Detailed Review on the Impact of Aircraft Noise on Health Including Sleep Disturbances and Cardiovascular Diseases. SpringerLink. 2018. Available online: https://link.springer.com (accessed on 1 September 2024).
  5. Anonymous. Drone Noise Emission Characteristics and Noise Effects on Humans—A Systematic Review. Systematic Review of Drone Noise Emissions and Their Health Effects on Humans. PubMed. 2020. Available online: https://pubmed.ncbi.nlm.nih.gov (accessed on 2 September 2024).
  6. Anonymous. Aviation Noise Impacts: State of the Science. Exploration of the Adverse Health Effects of Aviation Noise. National Center for Biotechnology Information. 2019. Available online: https://www.ncbi.nlm.nih.gov (accessed on 2 September 2024).
  7. Green, N.; Torija, A.J.; Ramos-Romero, C. Perception of Noise from Unmanned Aircraft Systems: Efficacy of Metrics for Indoor and Outdoor Listener Positions. J. Acoust. Soc. Am. 2024, 155, 915–929. [Google Scholar] [CrossRef] [PubMed]
  8. Pagano, A.; Barbarino, M.; Casalino, D.; Federico, L. Tonal and Broadband Noise Calculations for Aeroacoustic Optimization of a Pusher Propeller. J. Aircr. 2010, 47, 835–846. [Google Scholar] [CrossRef]
  9. Chen, J.; Xie, J.; Lee, H.M. Noise Attenuation by Half Flat tip Serrated Trailing Edge in Rotating Blades. J. Phys. Conf. Ser. 2023, 2489, 012022. [Google Scholar] [CrossRef]
  10. Sinayoko, S.; Azarpeyvand, M.; Lyu, B. Trailing edge noise prediction for rotating serrated blades. In Proceedings of the 20th AIAA/CEAS Aeroacoustics Conference, Atlanta, GA, USA, 16–20 June 2014. [Google Scholar]
  11. Halimi, A.; Marinus, B.G.; Larbi, S. Analytical prediction of broadband noise from mini-RPA propellers with serrated edges. Int. J. Aeroacoustics 2019, 18, 517–535. [Google Scholar] [CrossRef]
  12. Ning, Z.; Wlezien, R.; Hu, H. An Experimental Study on Small UAV Propellers with Serrated Trailing Edges. In Proceedings of the 47th AIAA Fluid Dynamics Conference, Denver, CO, USA, 5–9 June 2017. Number AIAA 2017-3813. [Google Scholar]
  13. Li, Y.; Yang, Y.; Liu, Y.; Wang, Y.; Huang, B.; Li, W. Aerodynamic and Aeroacoustic Analyses of a UAV Propeller with Trailing Edge Serrations. In Proceedings of the ACOUSTICS, Hamburg, Germany, 4–6 October 2018. [Google Scholar]
  14. Keil, T.H. A Sensitivity Study on the Effect of Blade Sweep on the Trade-Off Between Propeller Efficiency and Noise with Panel Method Analysis. Master’s Thesis, Delft University of Technology, Delft, The Netherlands, 2021. Available online: https://repository.tudelft.nl/record/uuid:39e67ba0-3409-4069-be3e-f1f12443a9ff (accessed on 7 September 2024).
  15. de Haan, W. Impact of Blade Sweep on Aerodynamic and Aeroacoustic Performance Optimization of Isolated Propellers. Master’s Thesis, Delft University of Technology, Delft, The Netherlands, 2021. Available online: https://repository.tudelft.nl/record/uuid:09137b04-f499-47f5-9c17-7334d0ef92ac (accessed on 7 September 2024).
  16. Wiedemann, A.D. A Study of the Aeroacoustics of Swept Propellers for Small Unmanned Aerial Vehicles. Master’s Thesis, Old Dominion University, Norfolk, VA, USA, 2020. [Google Scholar] [CrossRef]
  17. Ghodake, D.; Sanjosé, M.; Moreau, S.; Henner, M. Effect of Sweep on Axial Fan Noise Sources Using the Lattice Boltzmann Method. Int. J. Turbomach. Propuls. Power 2022, 7, 34. [Google Scholar] [CrossRef]
  18. Marinus, B.G. Comparative Study of the Effects of Sweep and Humps on High-Speed Propeller Blades. In Proceedings of the 18th AIAA/CEAS Aeroacoustics Conference (33rd AIAA Aeroacoustics Conference), Colorado Springs, CO, USA, 4–6 June 2012; pp. 1–16. [Google Scholar] [CrossRef]
  19. Huang, Z.; Yao, H.; Sjögren, O.; Lundbladh, A.; Davidson, L. Aeroacoustic analysis of aerodynamically optimized joined-blade propeller for future electric aircraft at cruise and take-off. Aerosp. Sci. Technol. 2020, 106, 106336. [Google Scholar] [CrossRef]
  20. Dobrzynski, W. Propeller Noise Reduction by Means of Unsymmetrical Blade-Spacing. J. Sound Vib. 1993, 163, 123–126. [Google Scholar] [CrossRef]
  21. Kim, T.Y. Reduction of Tonal Propeller Noise by Means of Uneven Blade Spacing. Master’s Thesis, University of California, Irvine, CA, USA, 2016. [Google Scholar]
  22. Prior, S.D. Reviewing and Investigating the Use of Co-Axial Rotor Systems in Small UAVs. Int. J. Micro Air Veh. 2010, 2, 1–16. [Google Scholar] [CrossRef]
  23. Tinney, C.E.; Valdez, J.A.; Zhao-Dubuc, Y. Distilling the Acoustics of Stacked Rotors Using Conventional POD with Vold-Kalman Filters. In Proceedings of the AIAA SCITECH 2024 Forum, Orlando, FL, USA, 8–12 January 2024. [Google Scholar] [CrossRef]
  24. APC Propellers. APC Model Aircraft Propellers. 2024. Available online: https://www.apcprop.com/ (accessed on 2 October 2024).
  25. ANSYS, Inc. ANSYS Engineering Simulation Software. 2024. Available online: https://www.ansys.com/ (accessed on 2 October 2024).
  26. Kutty, H.A.; Rajendran, P. 3D CFD Simulation and Experimental Validation of Small APC Slow Flyer Propeller Blade. Aerospace 2017, 4, 10. [Google Scholar] [CrossRef]
  27. Hennes, C.C.; Lopes, L.V.; Shirey, J.; Cheng, R.; Erwin, J.; Lee, S.; Goldman, B.A.; Botre, M.; Zachos, D.R.; Gan, Z.F.T.; et al. PSU-WOPWOP 3.5.0 User’s Guide; The Pennsylvania State University: University Park, PA, USA, 2022. [Google Scholar]
Figure 1. Propeller with unevenly spaced blades.
Aerospace 12 00167 g001
Figure 2. (a) Lead case; (b) lag case.
Aerospace 12 00167 g002
Figure 3. Rotor configurations.
Aerospace 12 00167 g003
Figure 4. Boundary conditions.
Aerospace 12 00167 g004
Figure 5. (a) Thrust and torque coefficient validation; (b) relative error.
Aerospace 12 00167 g005
Figure 6. (a) Observers’ positioning; (b) pressure distribution on propeller blades.
Aerospace 12 00167 g006
Figure 7. ϕ = 90 : (a) Acoustic pressure at the rotation plane ( 0 and 180 ); (b) frequency spectrum—dashed lines indicate A-weighted noise levels (dBA).
Aerospace 12 00167 g007
Figure 8. Directivity plot ( ϕ = 90 ).
Aerospace 12 00167 g008
Figure 9. Frequency spectrum comparison between two-bladed and four-bladed propellers.
Aerospace 12 00167 g009
Figure 10. The value of c T (left subplots) and the difference in c T compared to the baseline case (right subplots) as a function of J for different configurations.
Aerospace 12 00167 g010
Figure 11. Pressure contours and the average pressure difference between the upper and lower surfaces of the blades.
Aerospace 12 00167 g011
Figure 12. Aeroacoustic pressure at the plane of rotation (0° and 180°).
Aerospace 12 00167 g012
Figure 13. Comparison of the frequency spectrum between ϕ = 60 (red) and ϕ = 90 (blue), and between ϕ = 30 (black) and ϕ = 90 . The dashed plot indicates the A-weighted noise level.
Aerospace 12 00167 g013
Figure 14. Aeroacoustic pressure (Pa) at t = 0.01 s: (a) 90 ; (b) 60 ; (c) 30 .
Aerospace 12 00167 g014
Figure 15. Noise level reduction as a function of (a) D and RPM ( J = 0.3 ); (b) tip Mach number (for 1 D ).
Aerospace 12 00167 g015
Figure 16. Noise level reduction for different values of D and RPM ( J = 0.45 ).
Aerospace 12 00167 g016
Figure 17. Five-bladed propeller configurations: (a) 120 ; (b) 30 ; (c) 0 .
Aerospace 12 00167 g017
Figure 18. Frequency spectrum of the five-bladed propeller.
Aerospace 12 00167 g018
Table 1. Test cases considered.
ConfigurationAngular Spacing ( ϕ )Axial Spacing
1–4 30 0 D , 0.25 D , 0.5 D , 1 D
5–8 60 0 D , 0.25 D , 0.5 D , 1 D
9–12 90 0 D , 0.25 D , 0.5 D , 1 D
Table 2. Grid sensitivity.
Cell CountThrust Coefficient ( c T )Relative Error (%)
∼91,3470.0685
∼205,1550.06692.37
Disclaimer/Publisher’s Note: The statements, opinions and data contained in all publications are solely those of the individual author(s) and contributor(s) and not of MDPI and/or the editor(s). MDPI and/or the editor(s) disclaim responsibility for any injury to people or property resulting from any ideas, methods, instructions or products referred to in the content.

