
Quantifying the Effects of Climate Change on Aircraft Take-Off Performance at European Airports


Abstract
1. Introduction
2. Materials and Methods
2.1. Input Data

| Title 1 | Title 2 |
|---|---|
| SSP1-2.6 | Sustainable development [9] |
| SSP3-7.0 | Regional rivalry [10] |
| SSP5-8.5 | Fossil-fuelled development [11] |
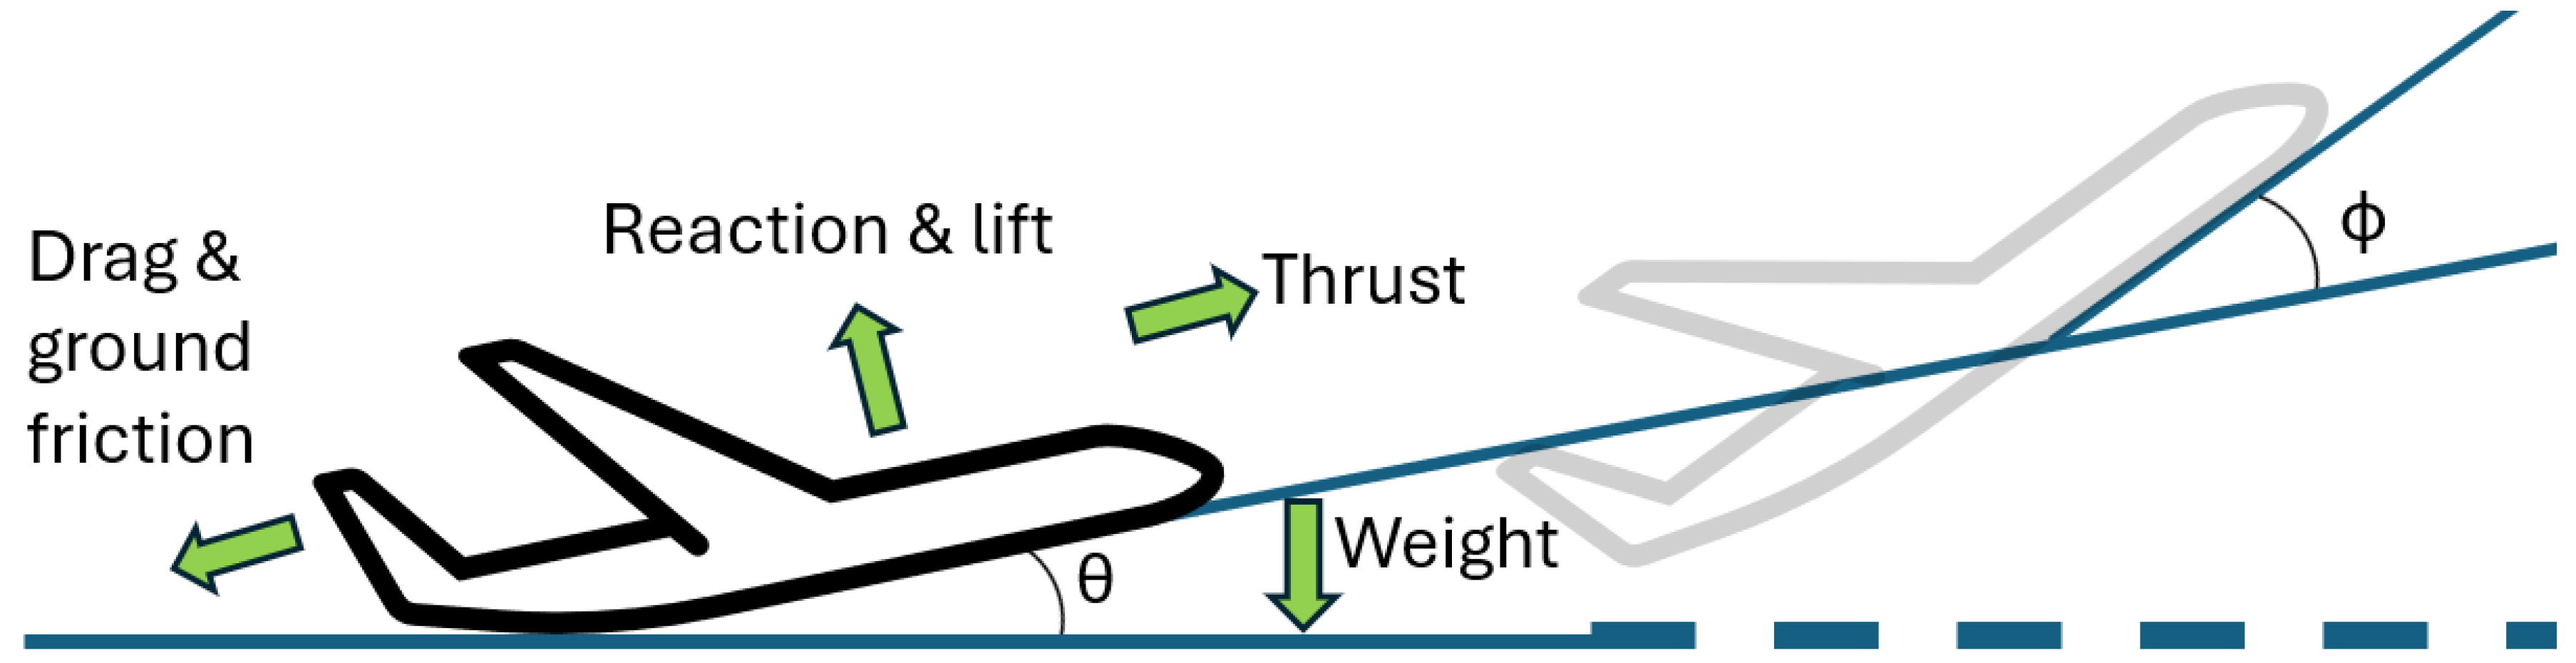
2.2. Take-Off Distance Calculation
- Obtain the thrust value from the openAP model assuming minimum take-off speed.
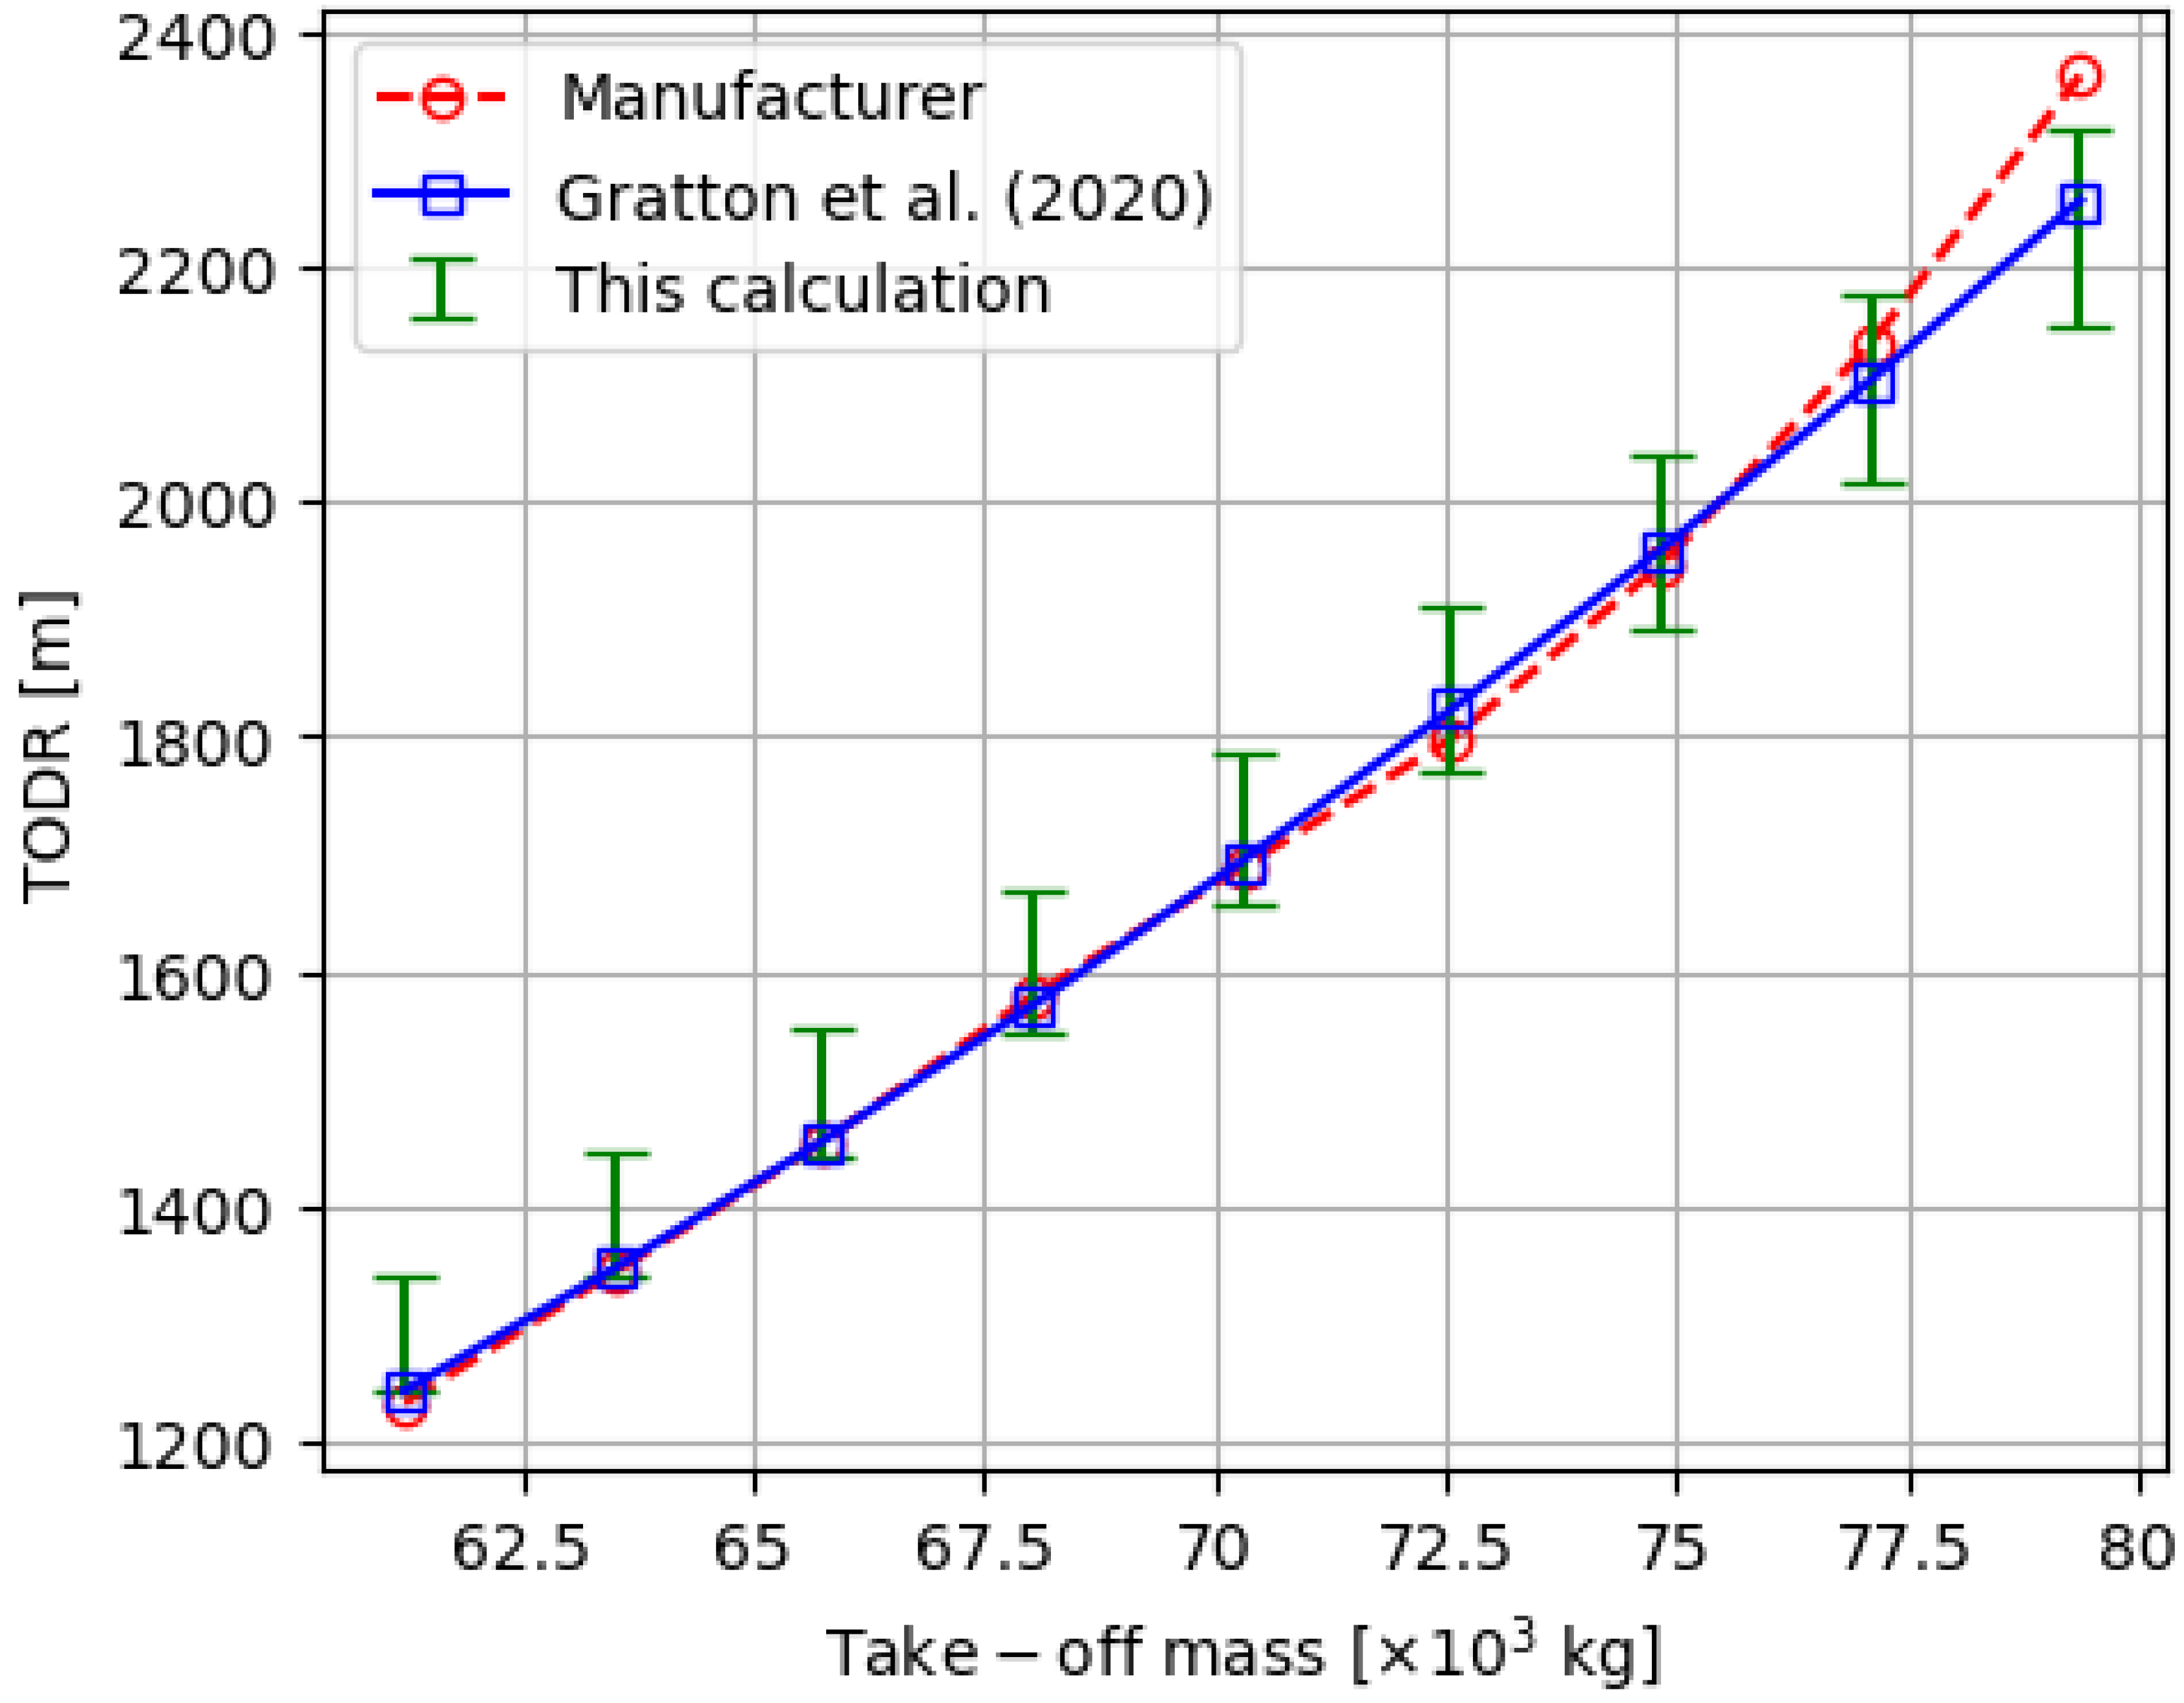
- Calculate the TODR as a function of the masses from Gratton et al. [4] for = 1 to = 2 in increments of 0.01.
- Find the root–mean–squared difference (RMSD) value between the array of TODRs found in step 2 and the manufacturer values.
- Find the value of which gives the lowest RMSD value; this provides an estimate of the lower bound ,
- Repeat steps 1–4 for the optimum and maximum take-off speeds. This will provide a central, optimum value of with an associated uncertainty range.
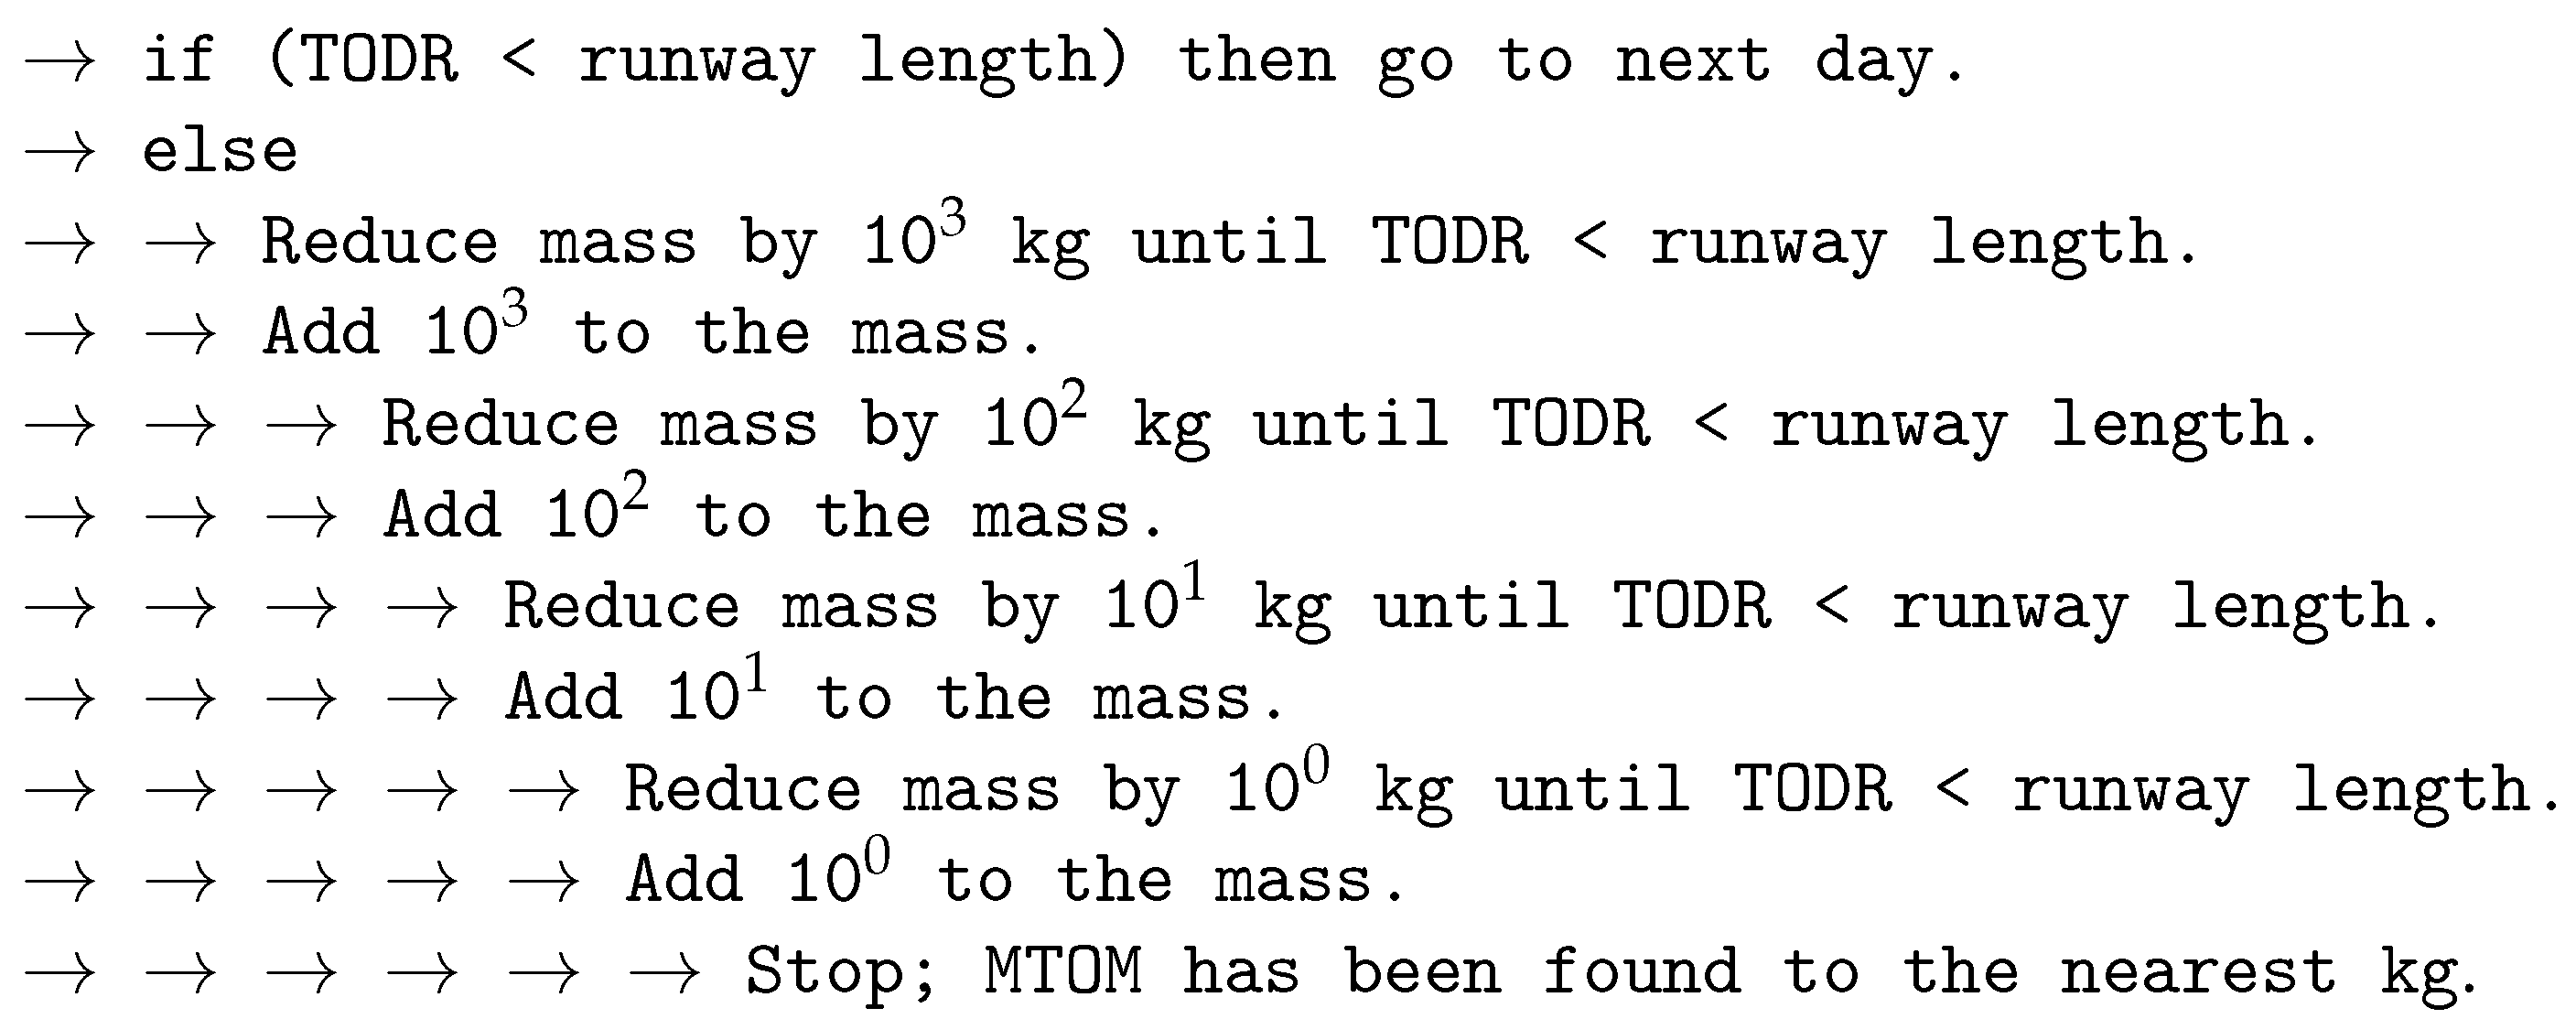
2.3. MTOM Calculation
3. Results and Discussion
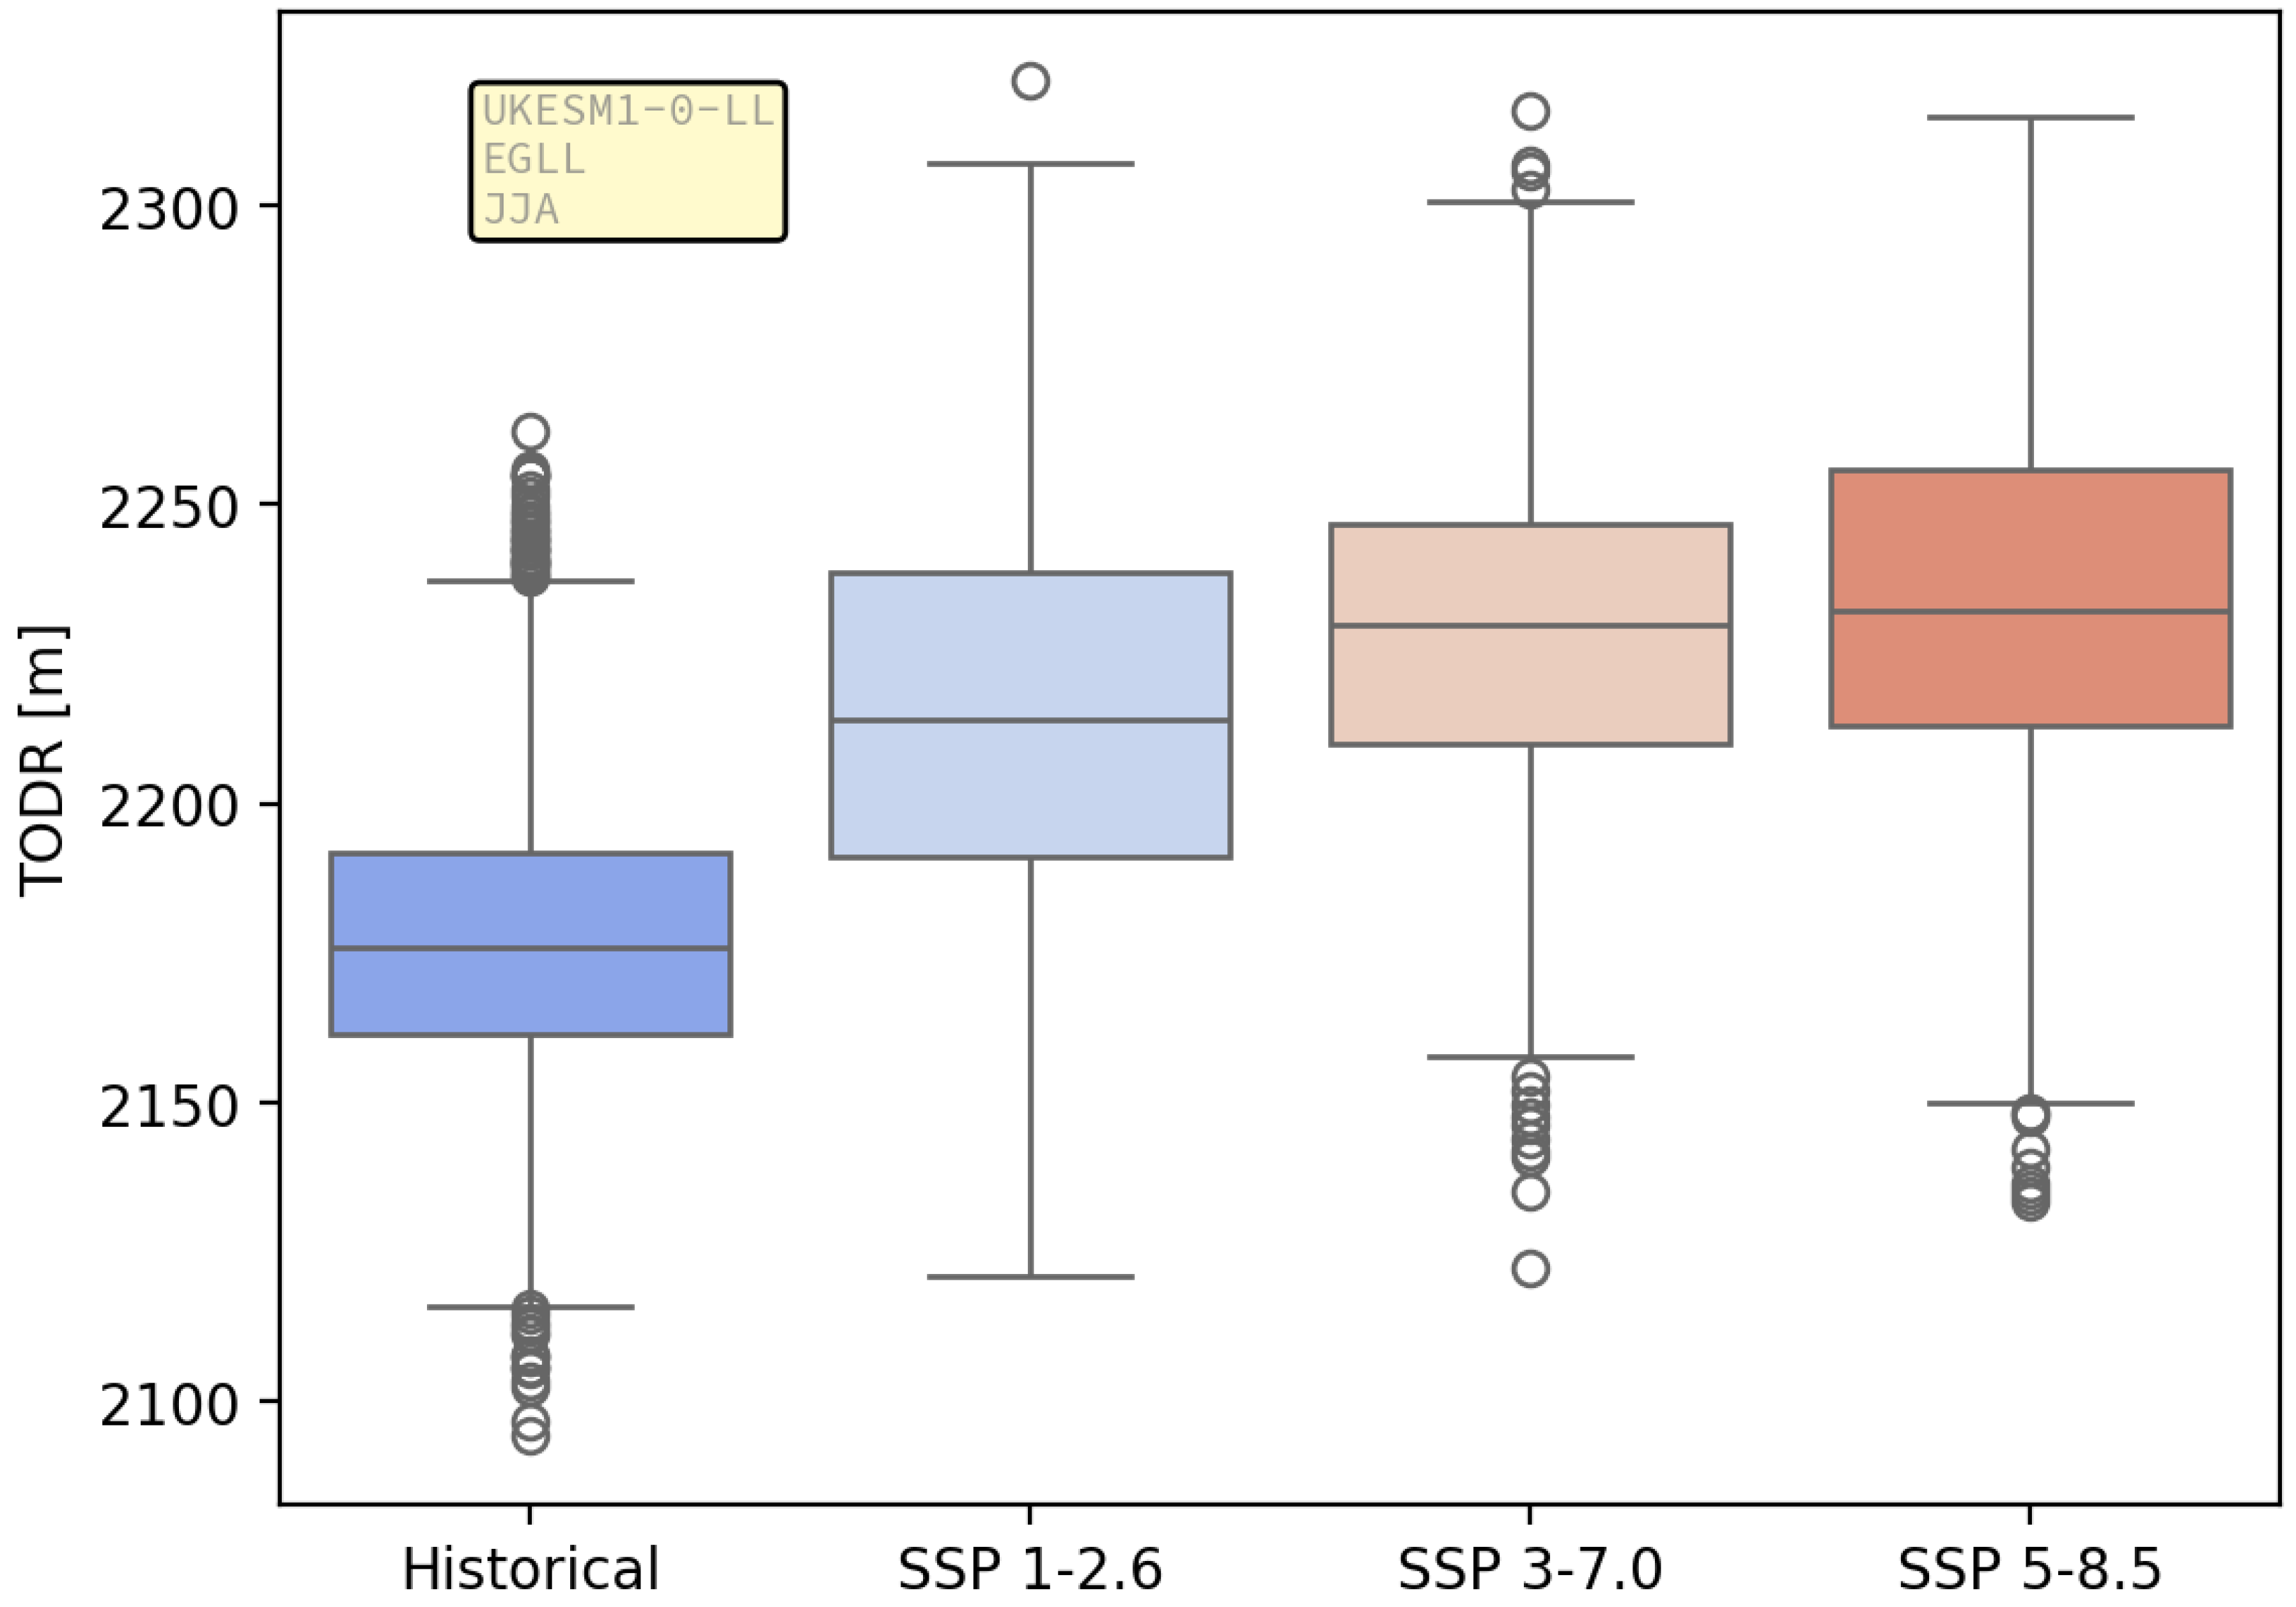
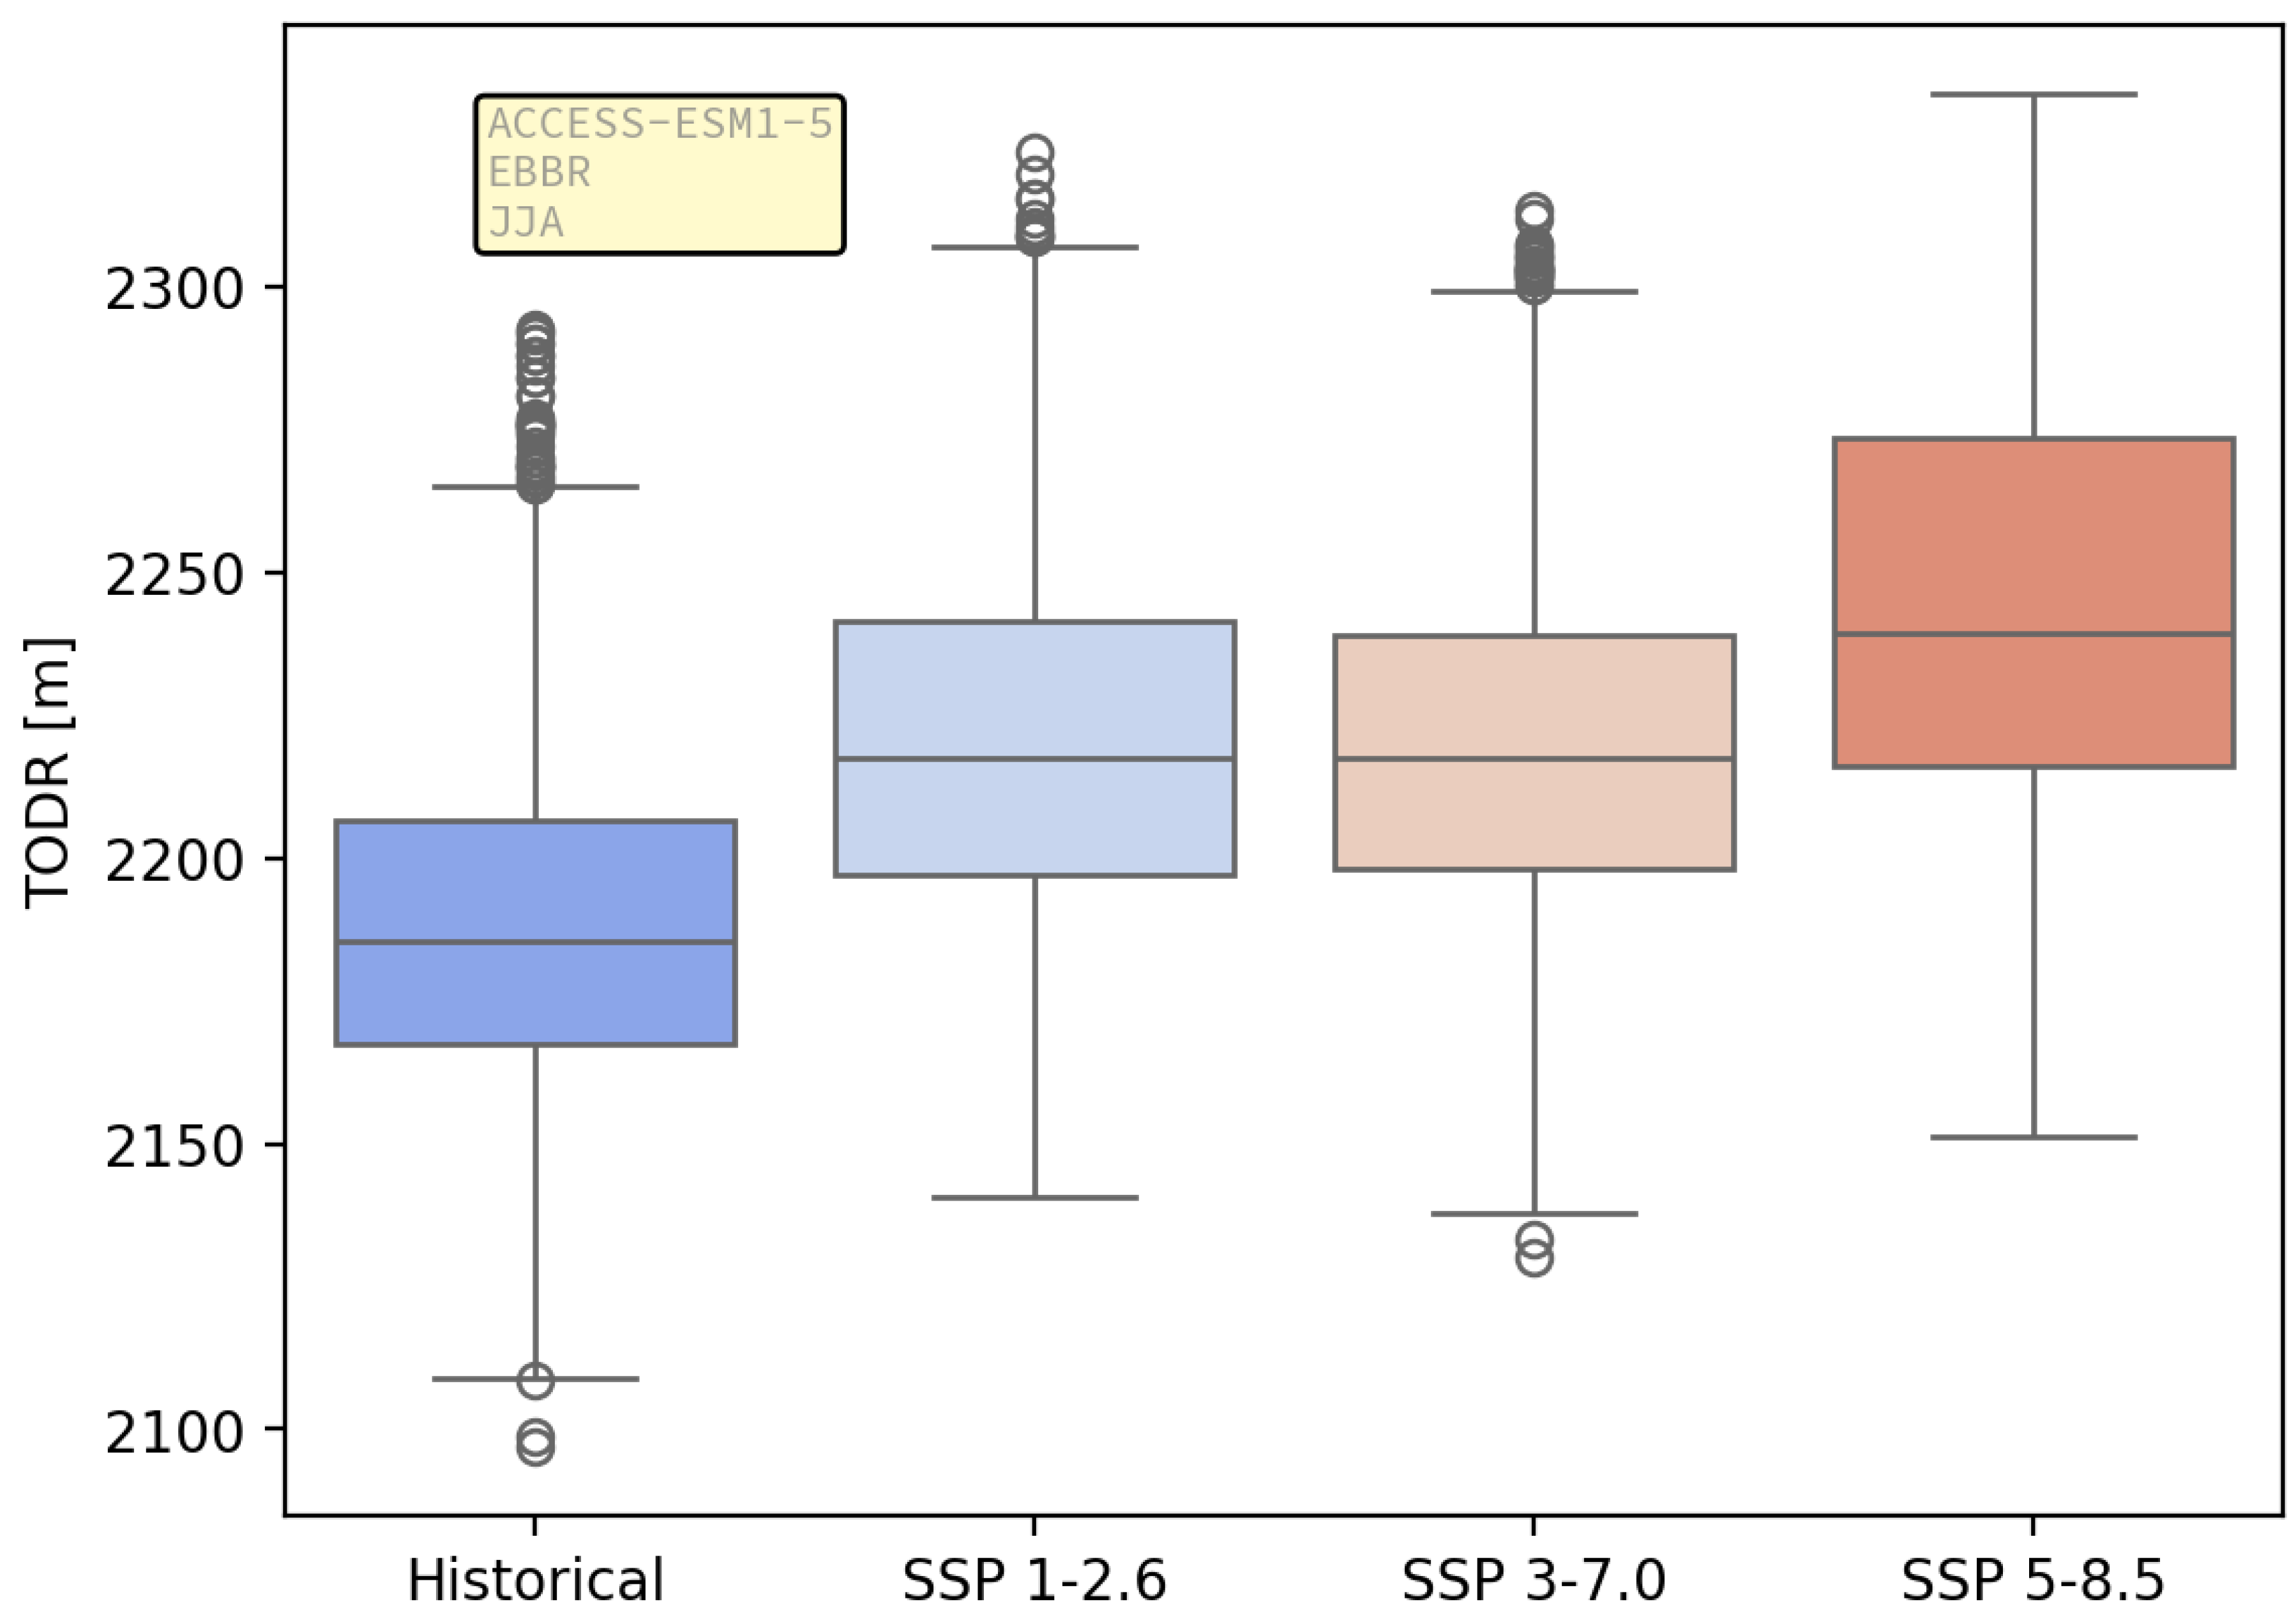
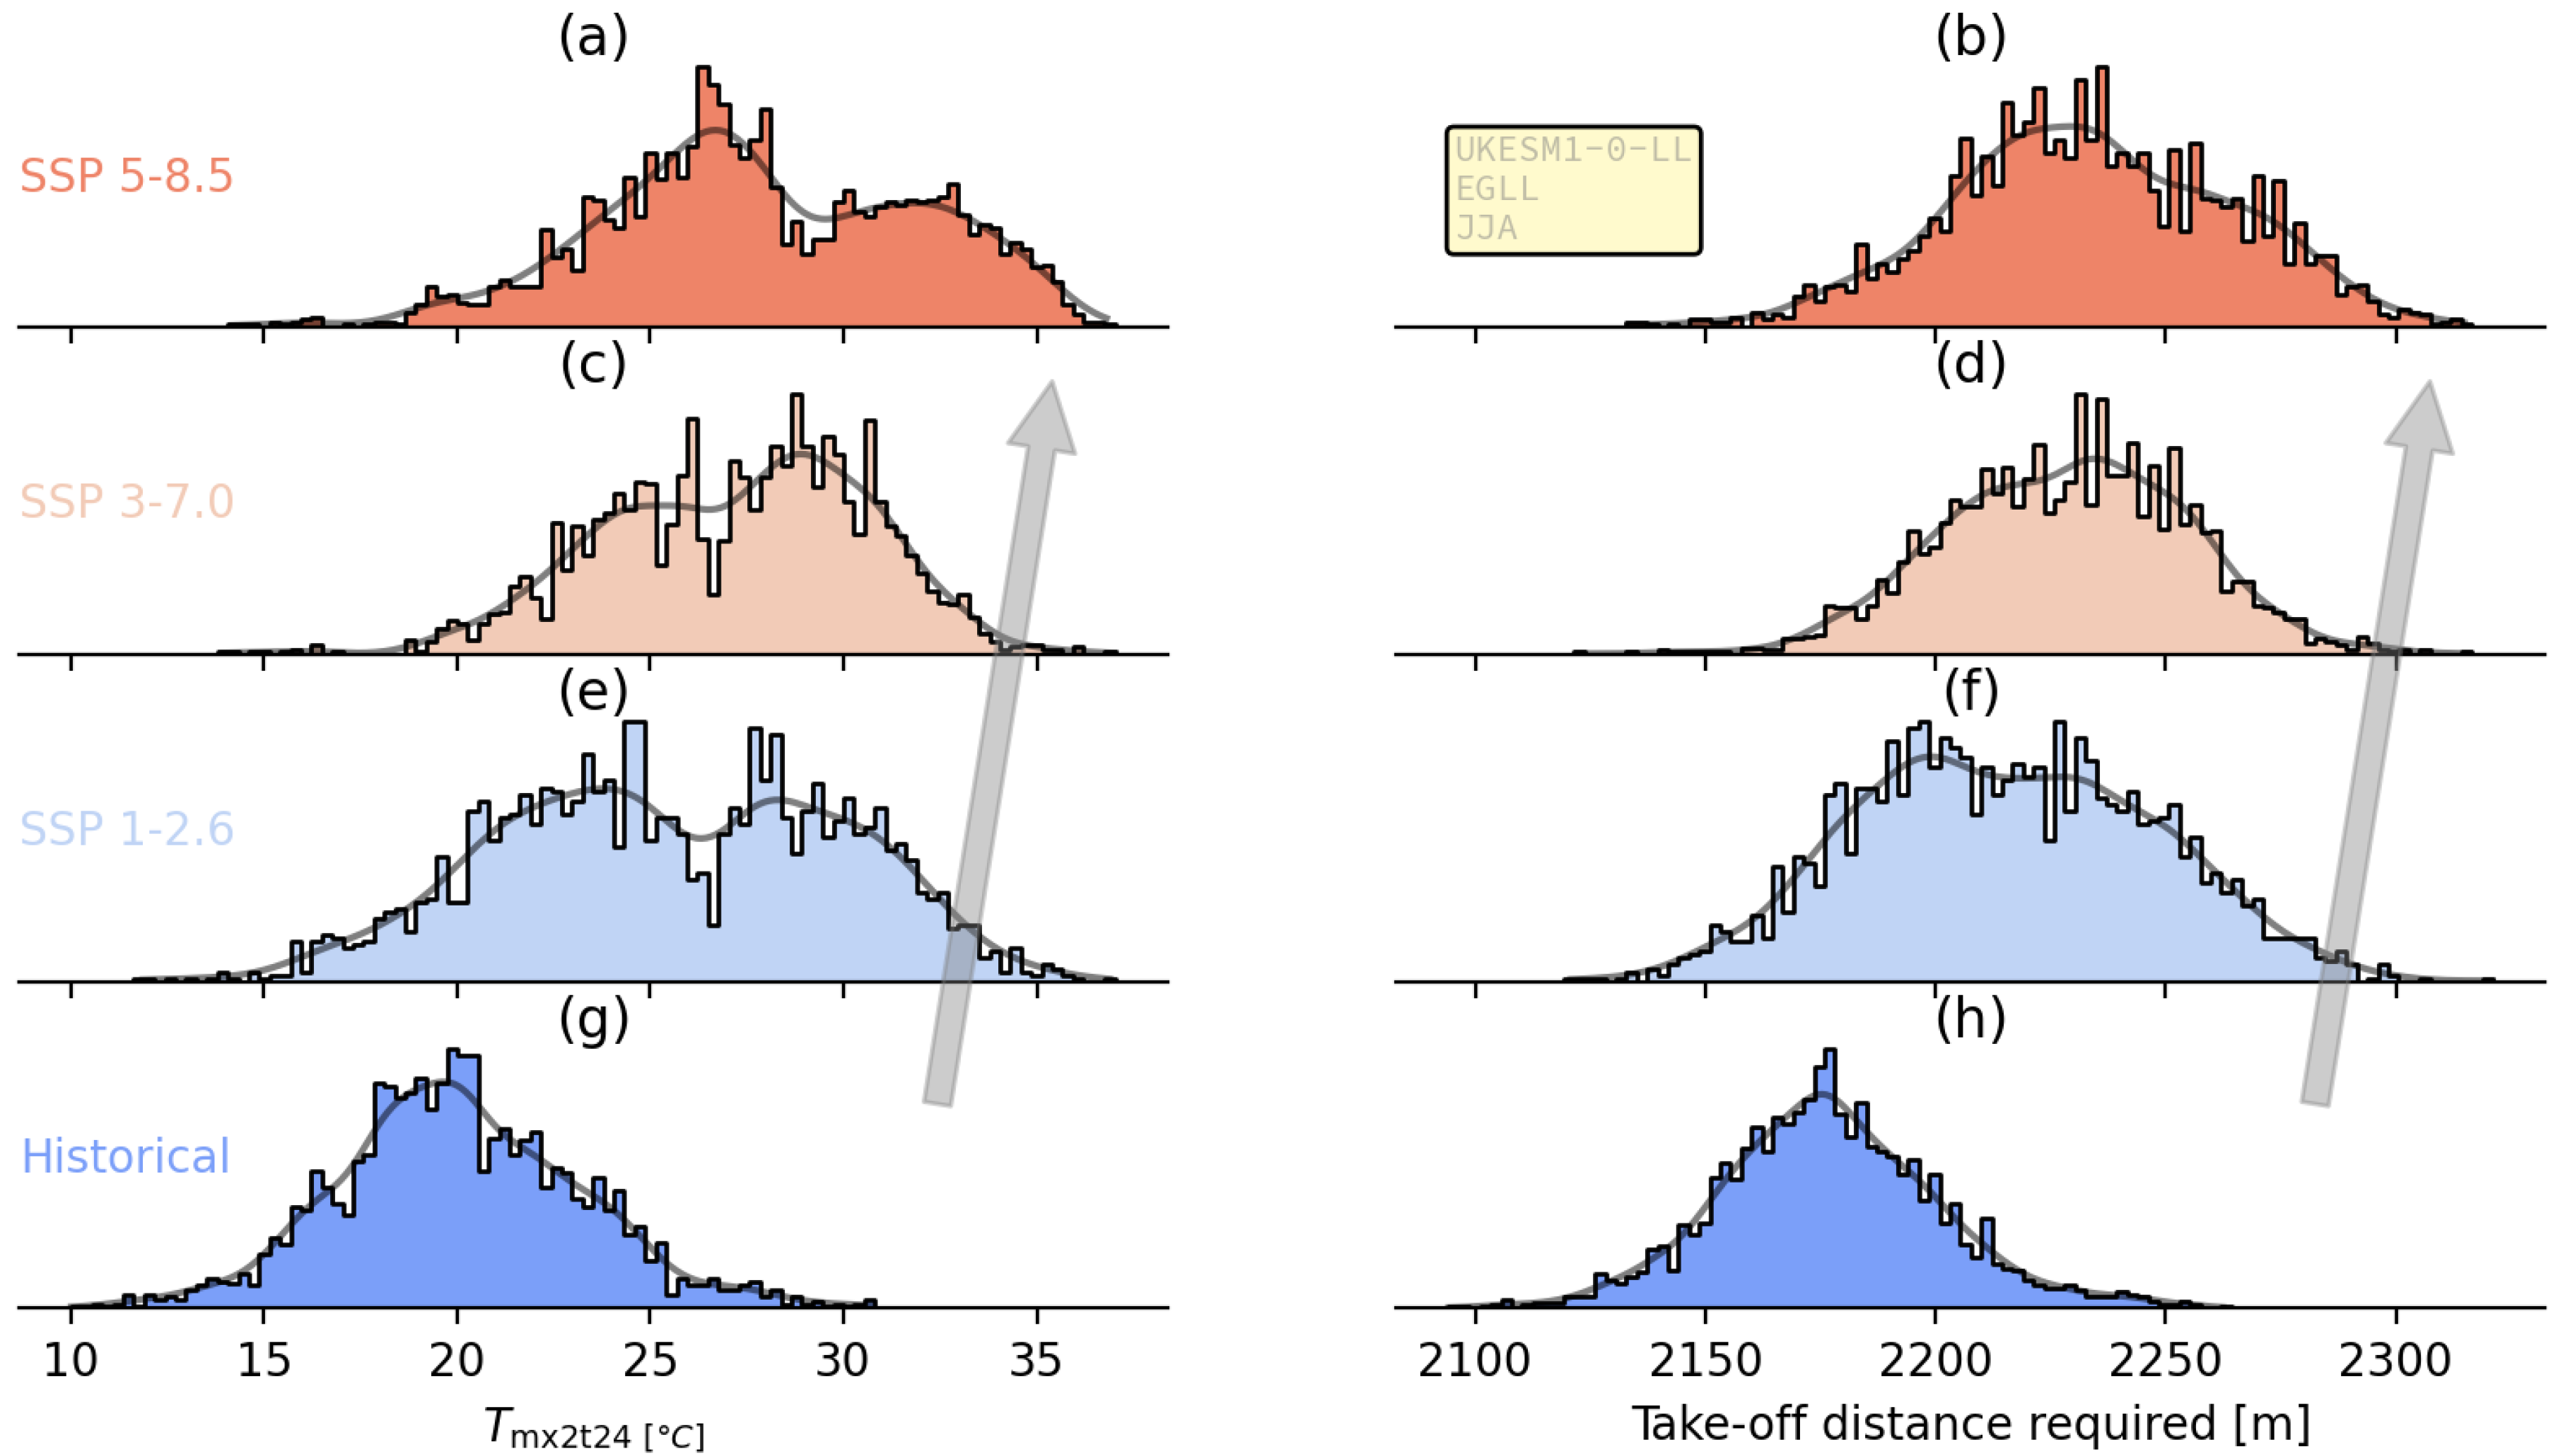
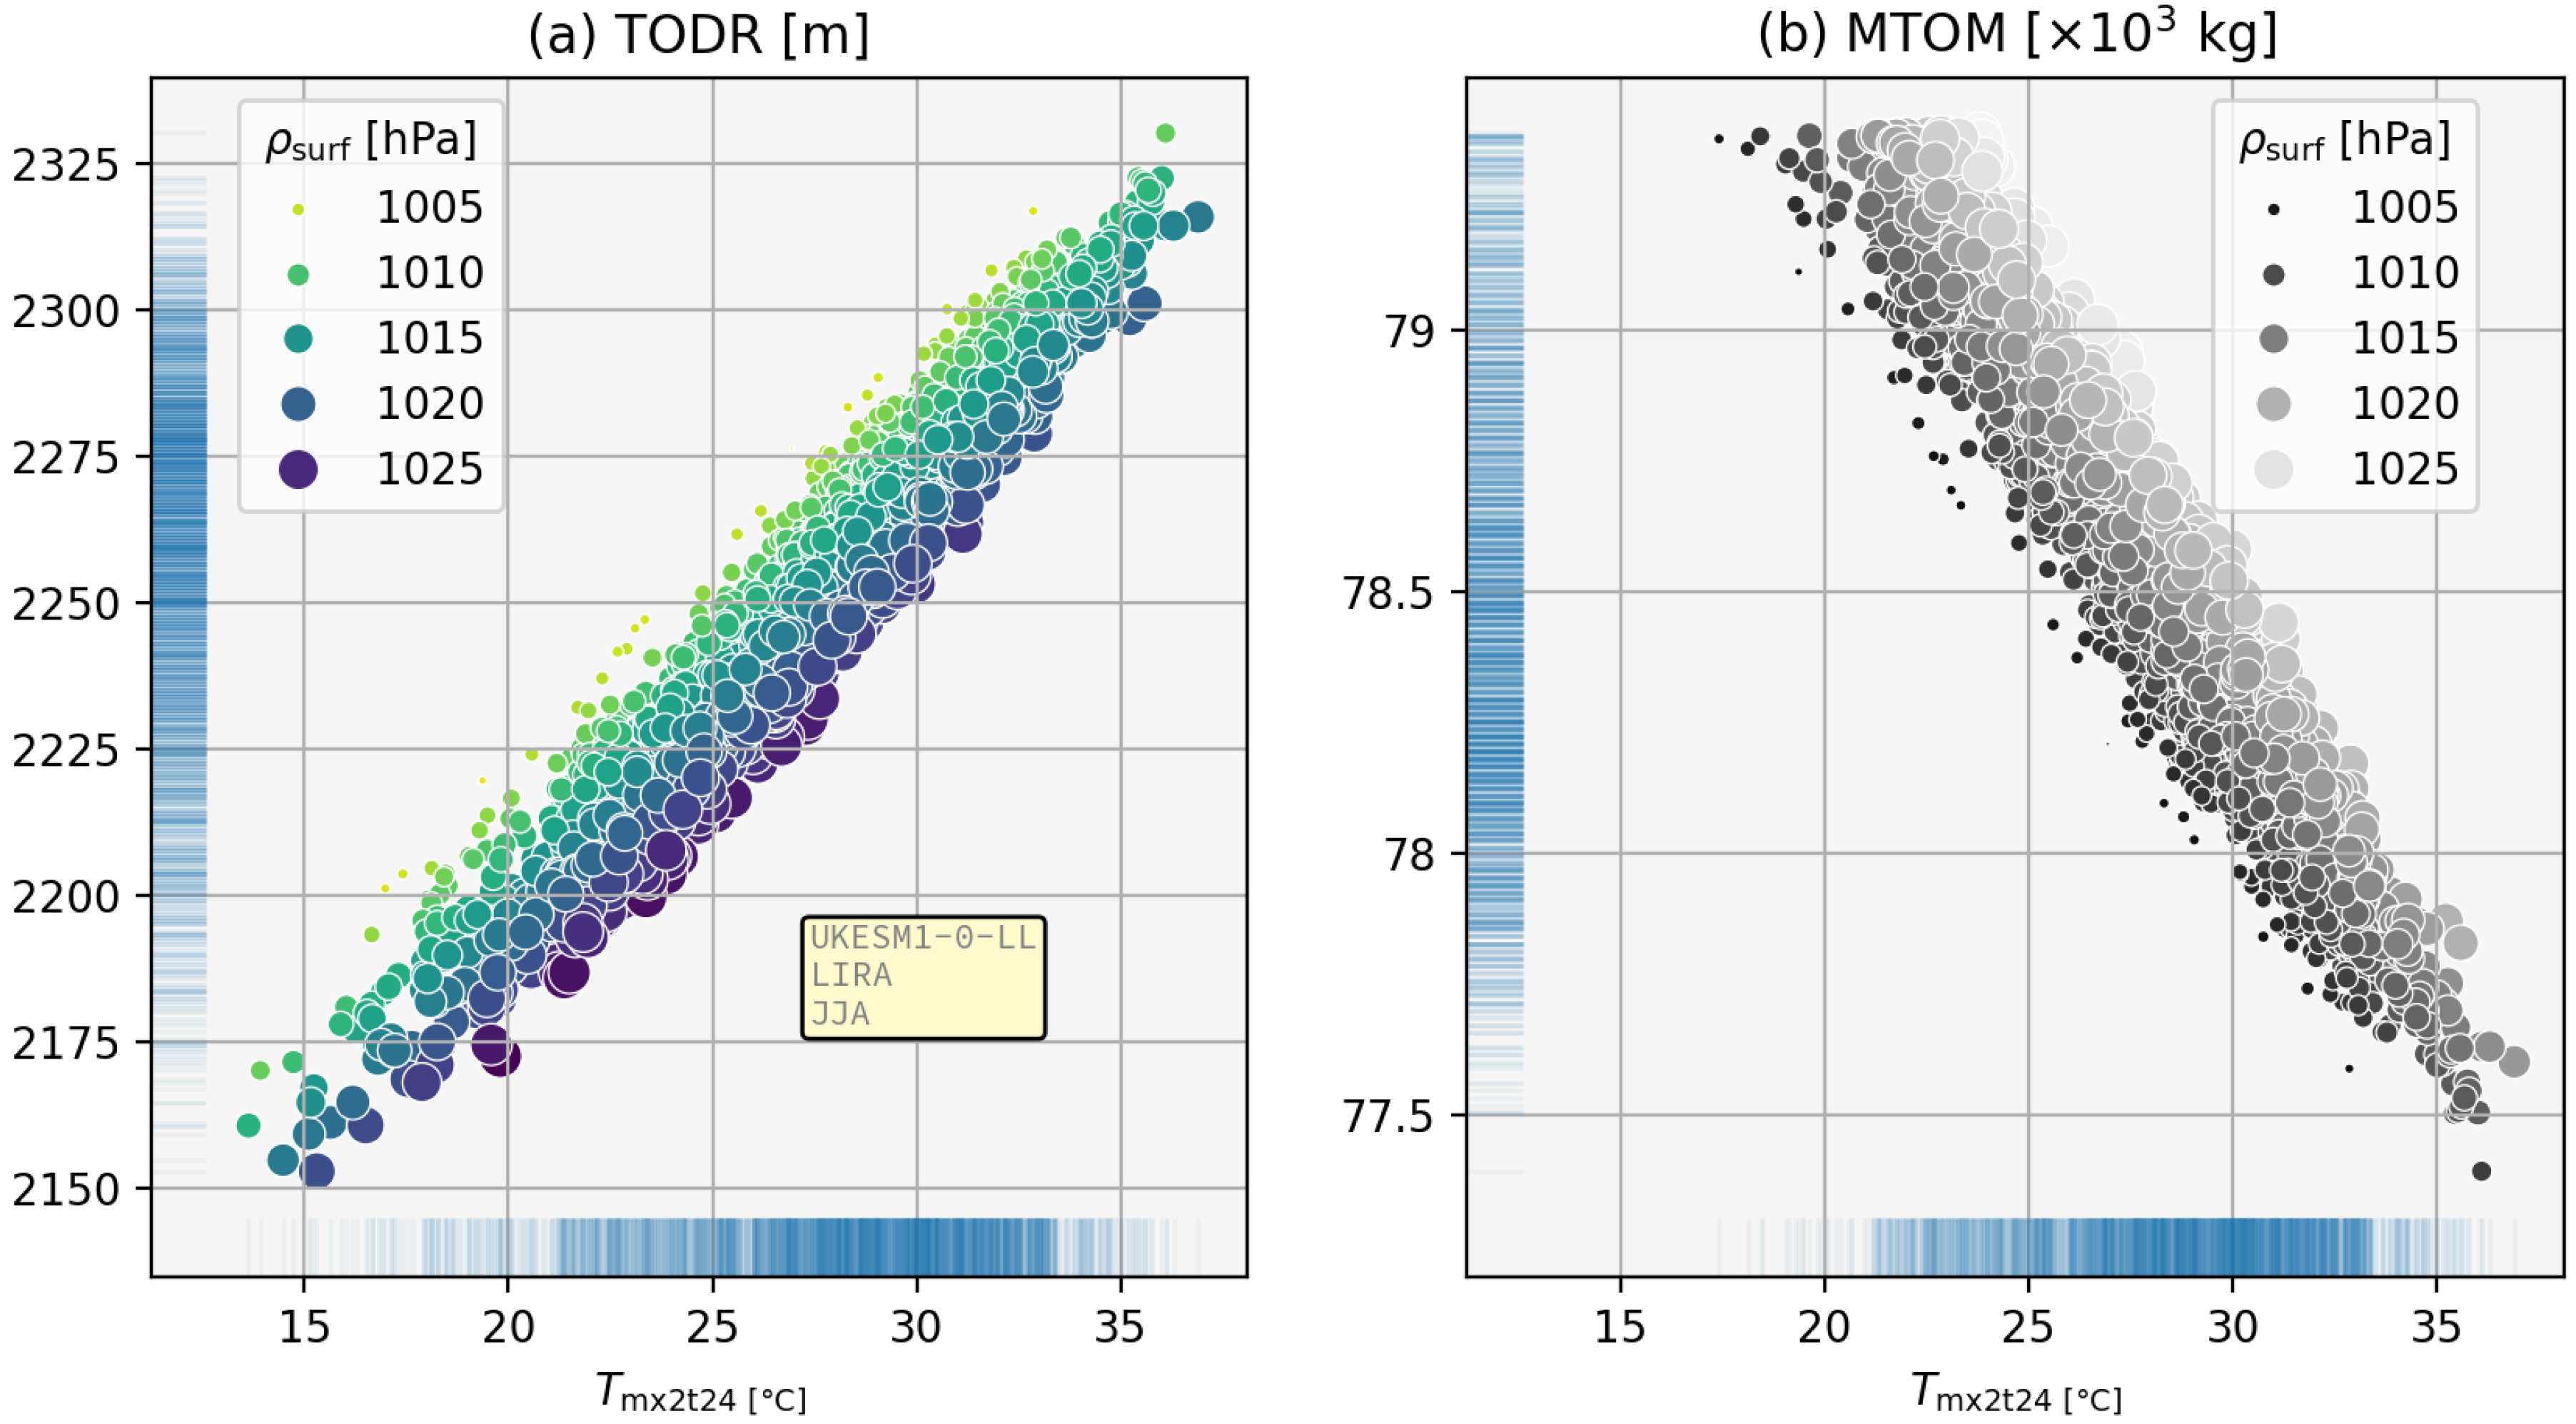
3.1. Take-Off Distance Required
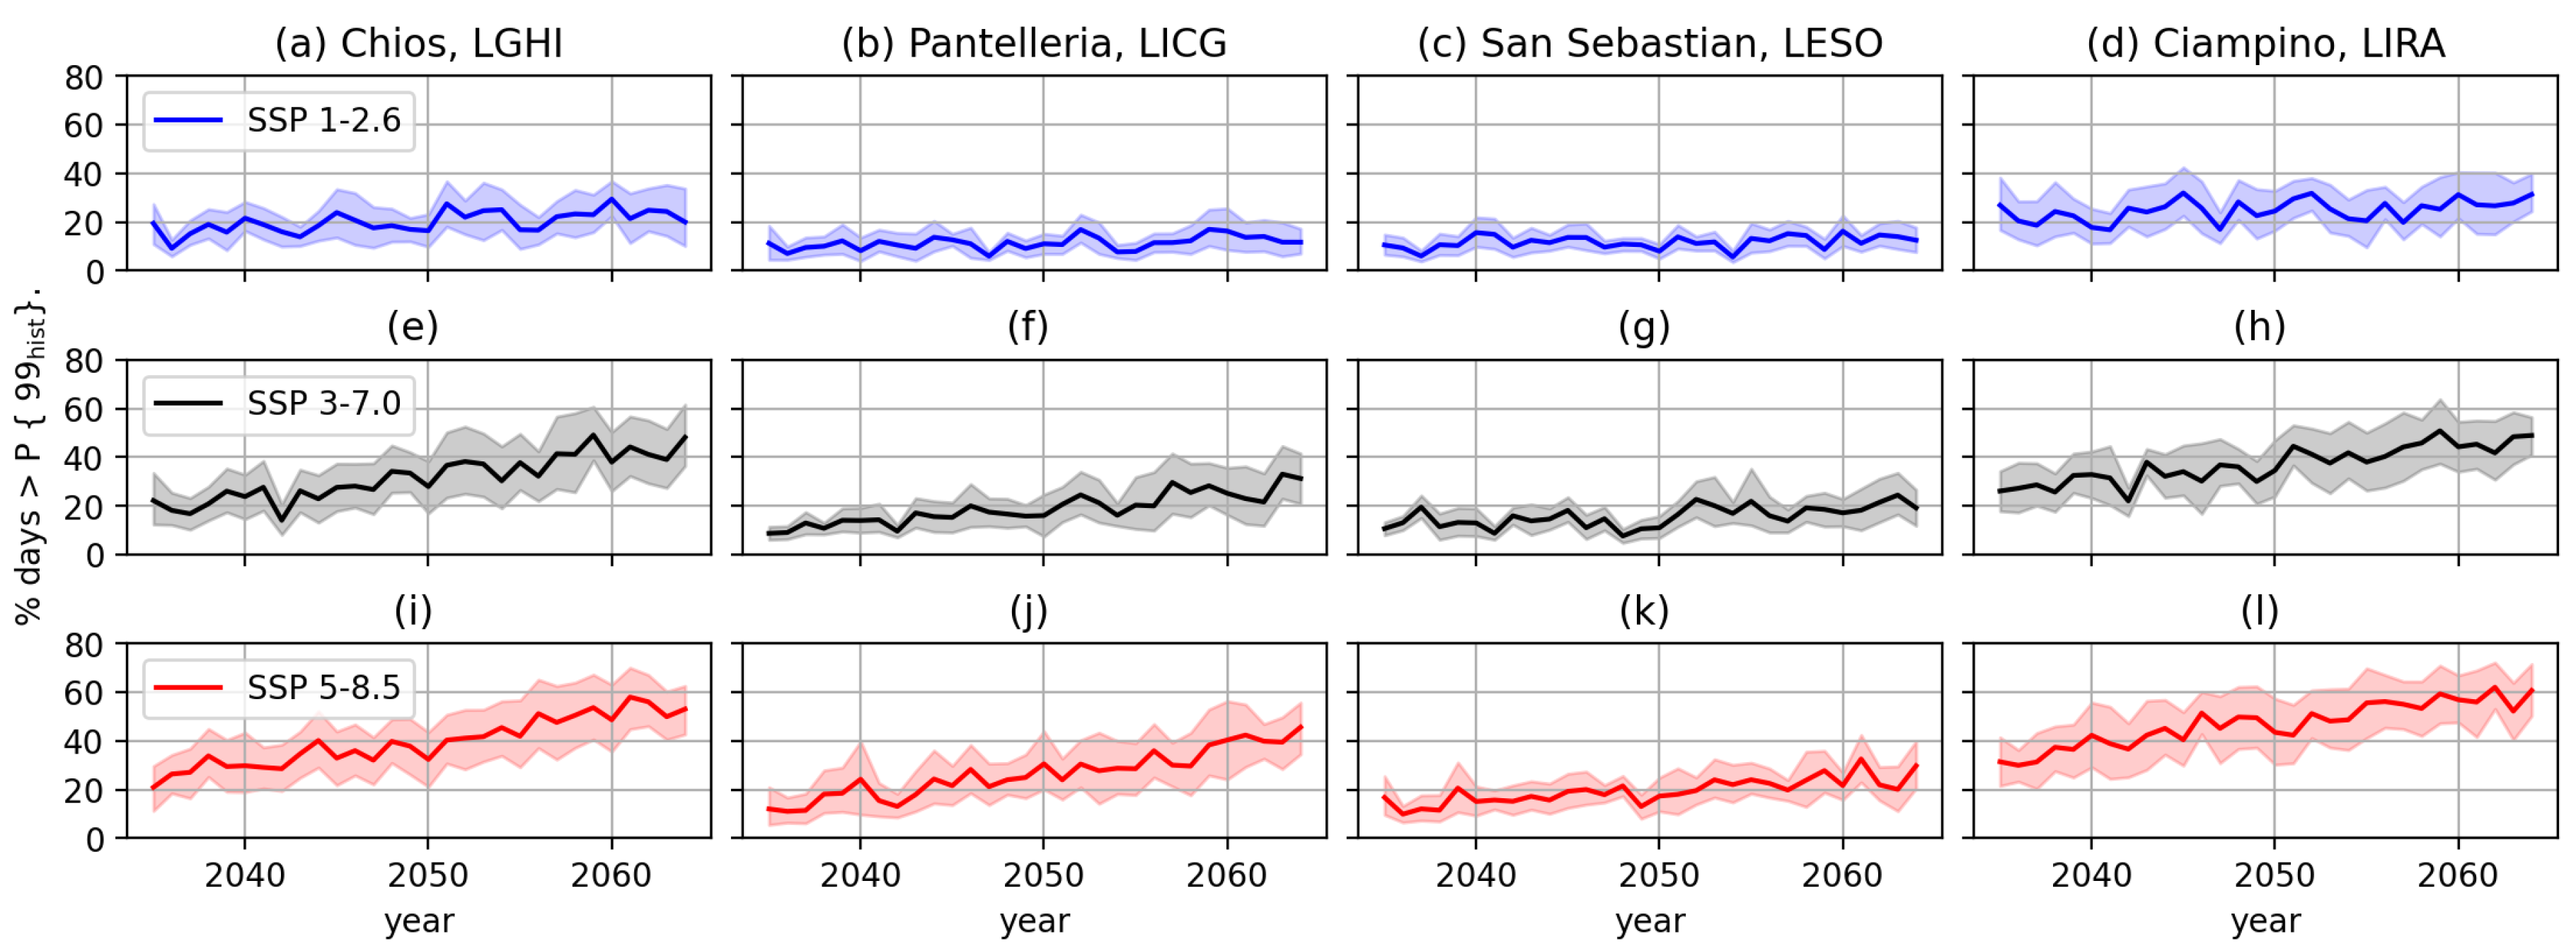
3.1.1. Case Study
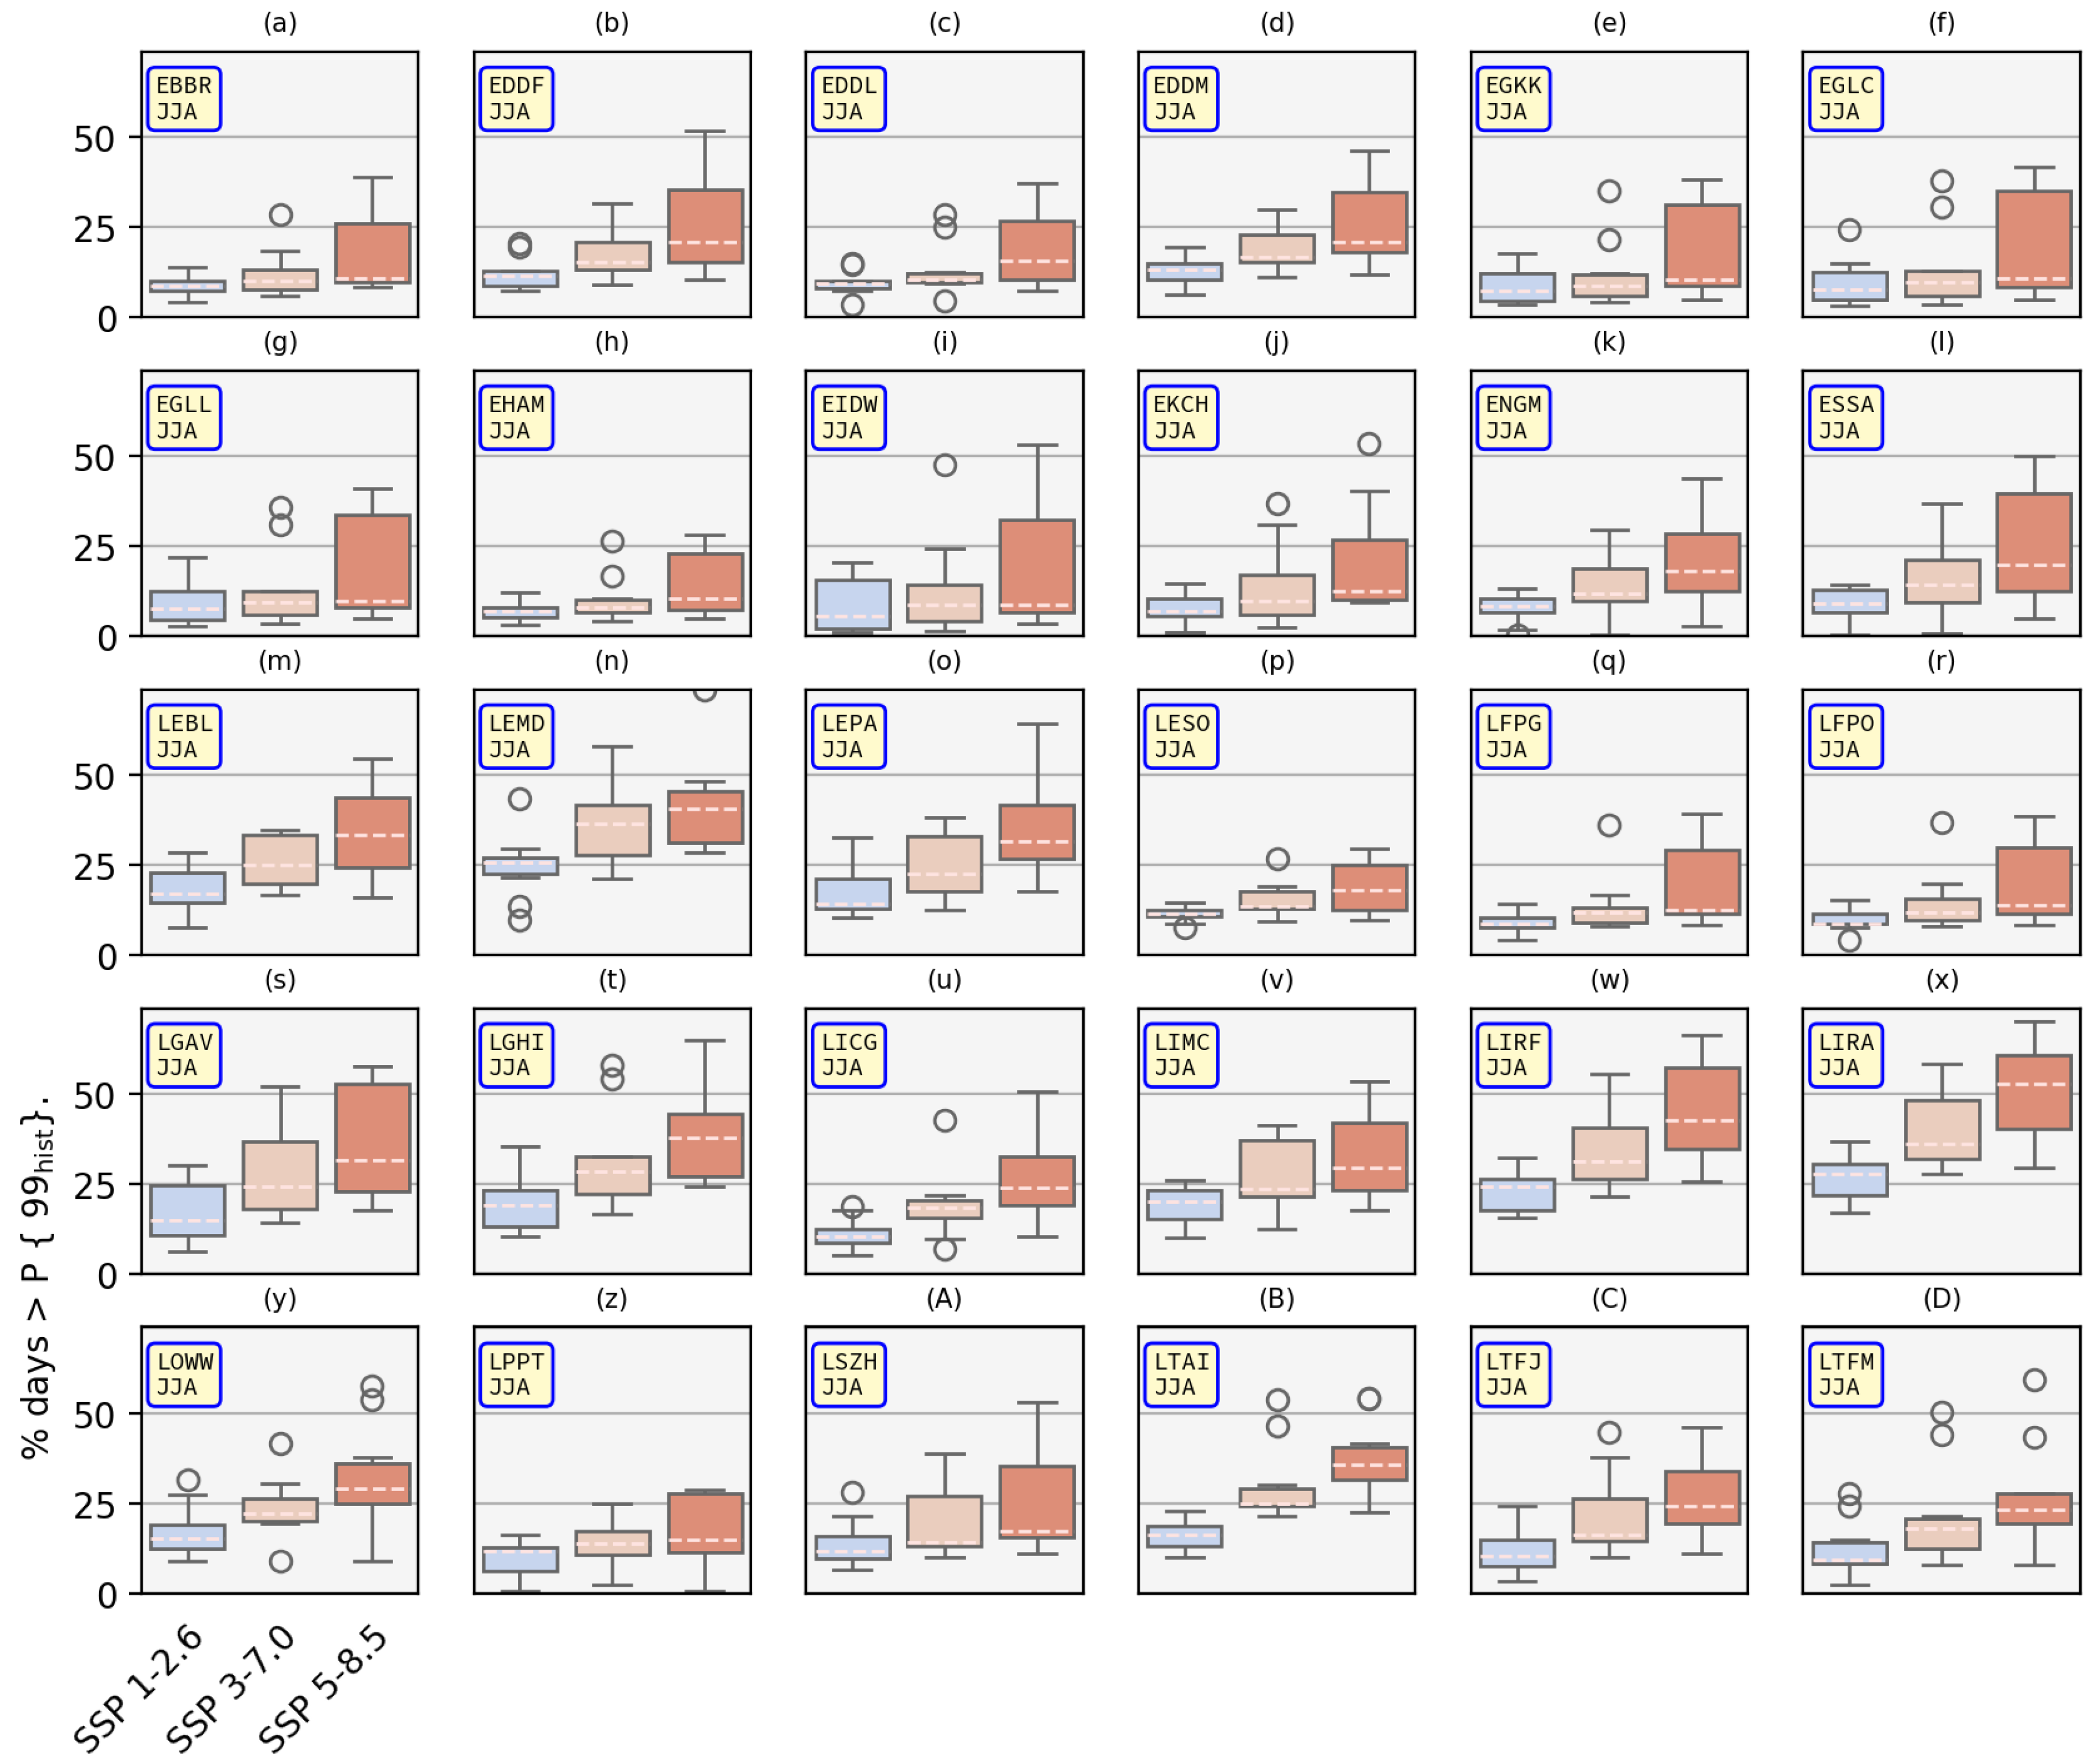
3.1.2. Ensemble
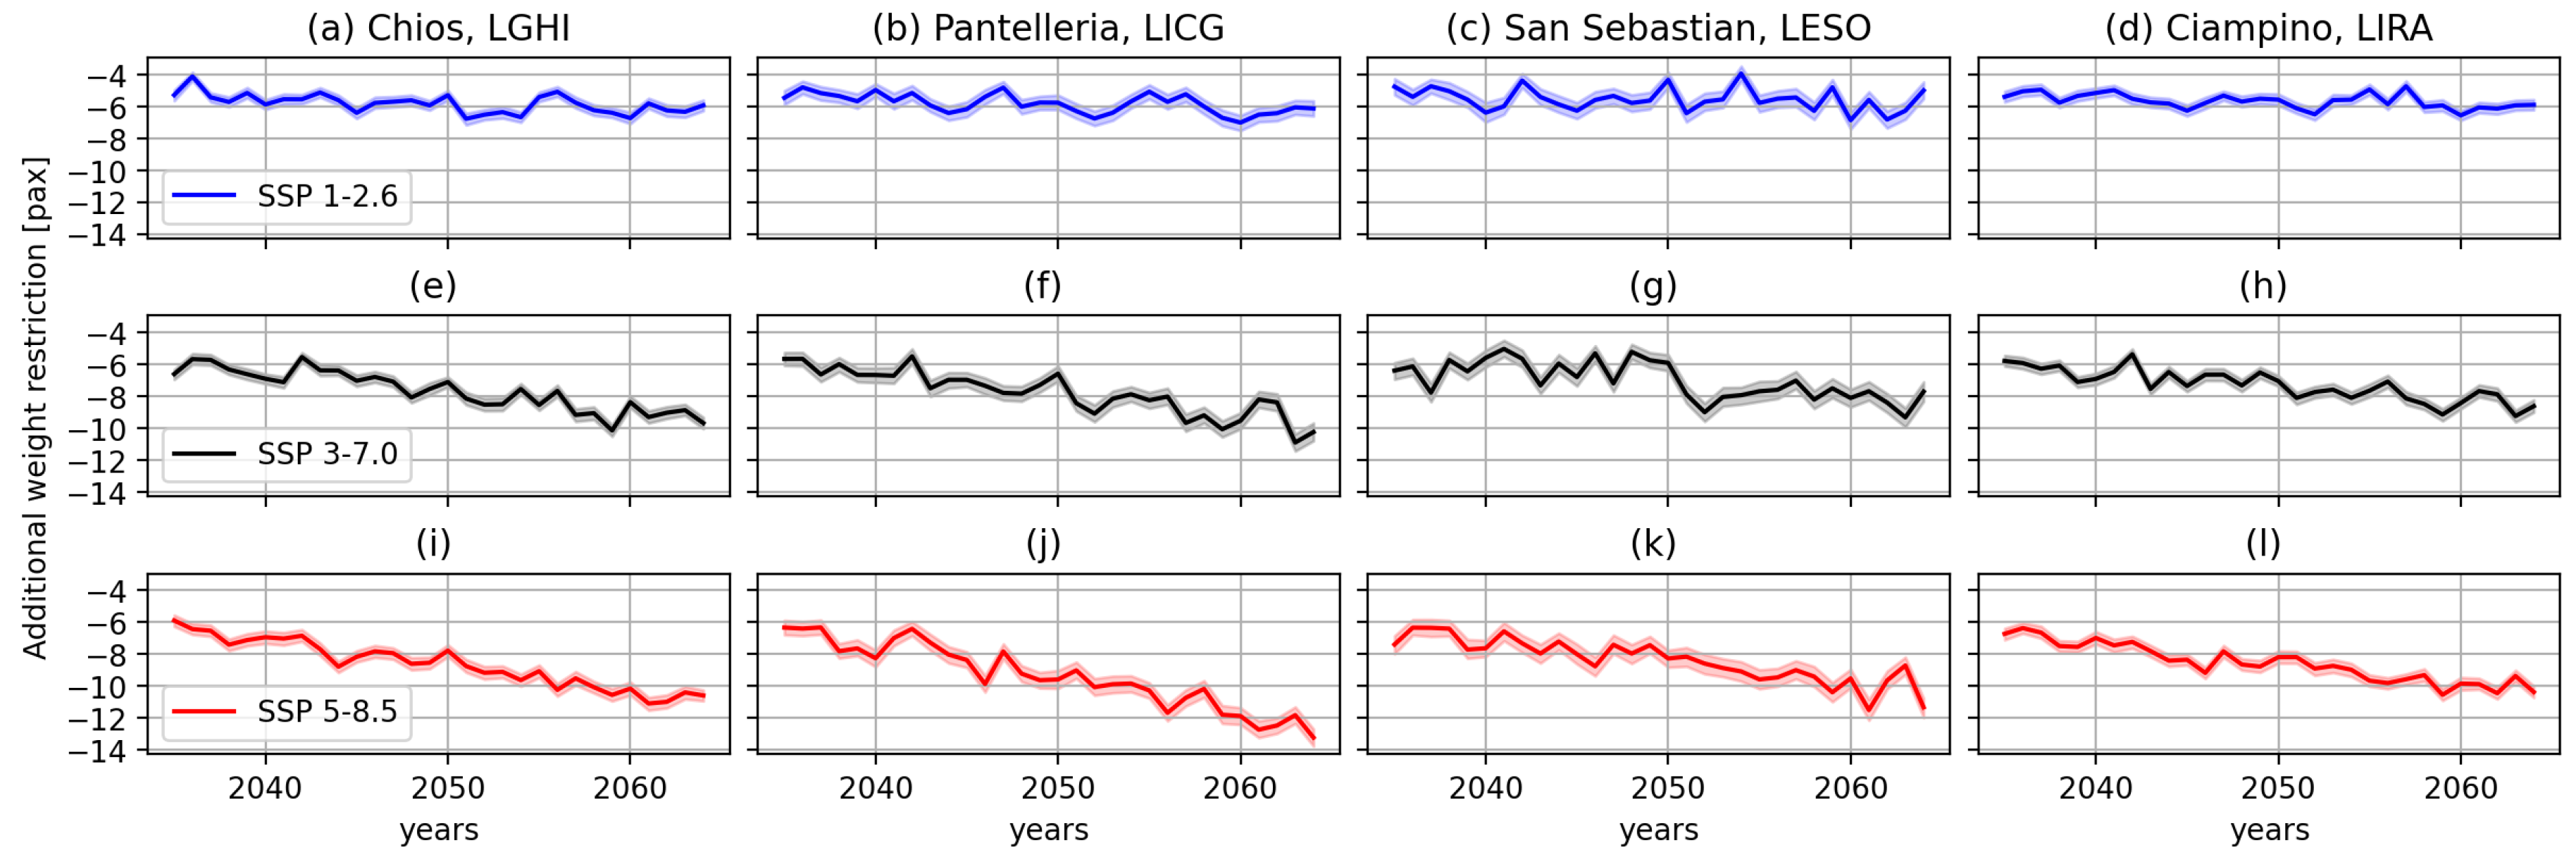
3.2. MTOM
4. Conclusions
Author Contributions
Funding
Data Availability Statement
Acknowledgments
Conflicts of Interest
Abbreviations
| TODR | Take-off Distance Required |
| MTOM | Maximum Take-off Mass |
| CMIP6 | Coupled model Intercomparison Project, phase 6 |
| ICAO | International Civil Aviation Organization code |
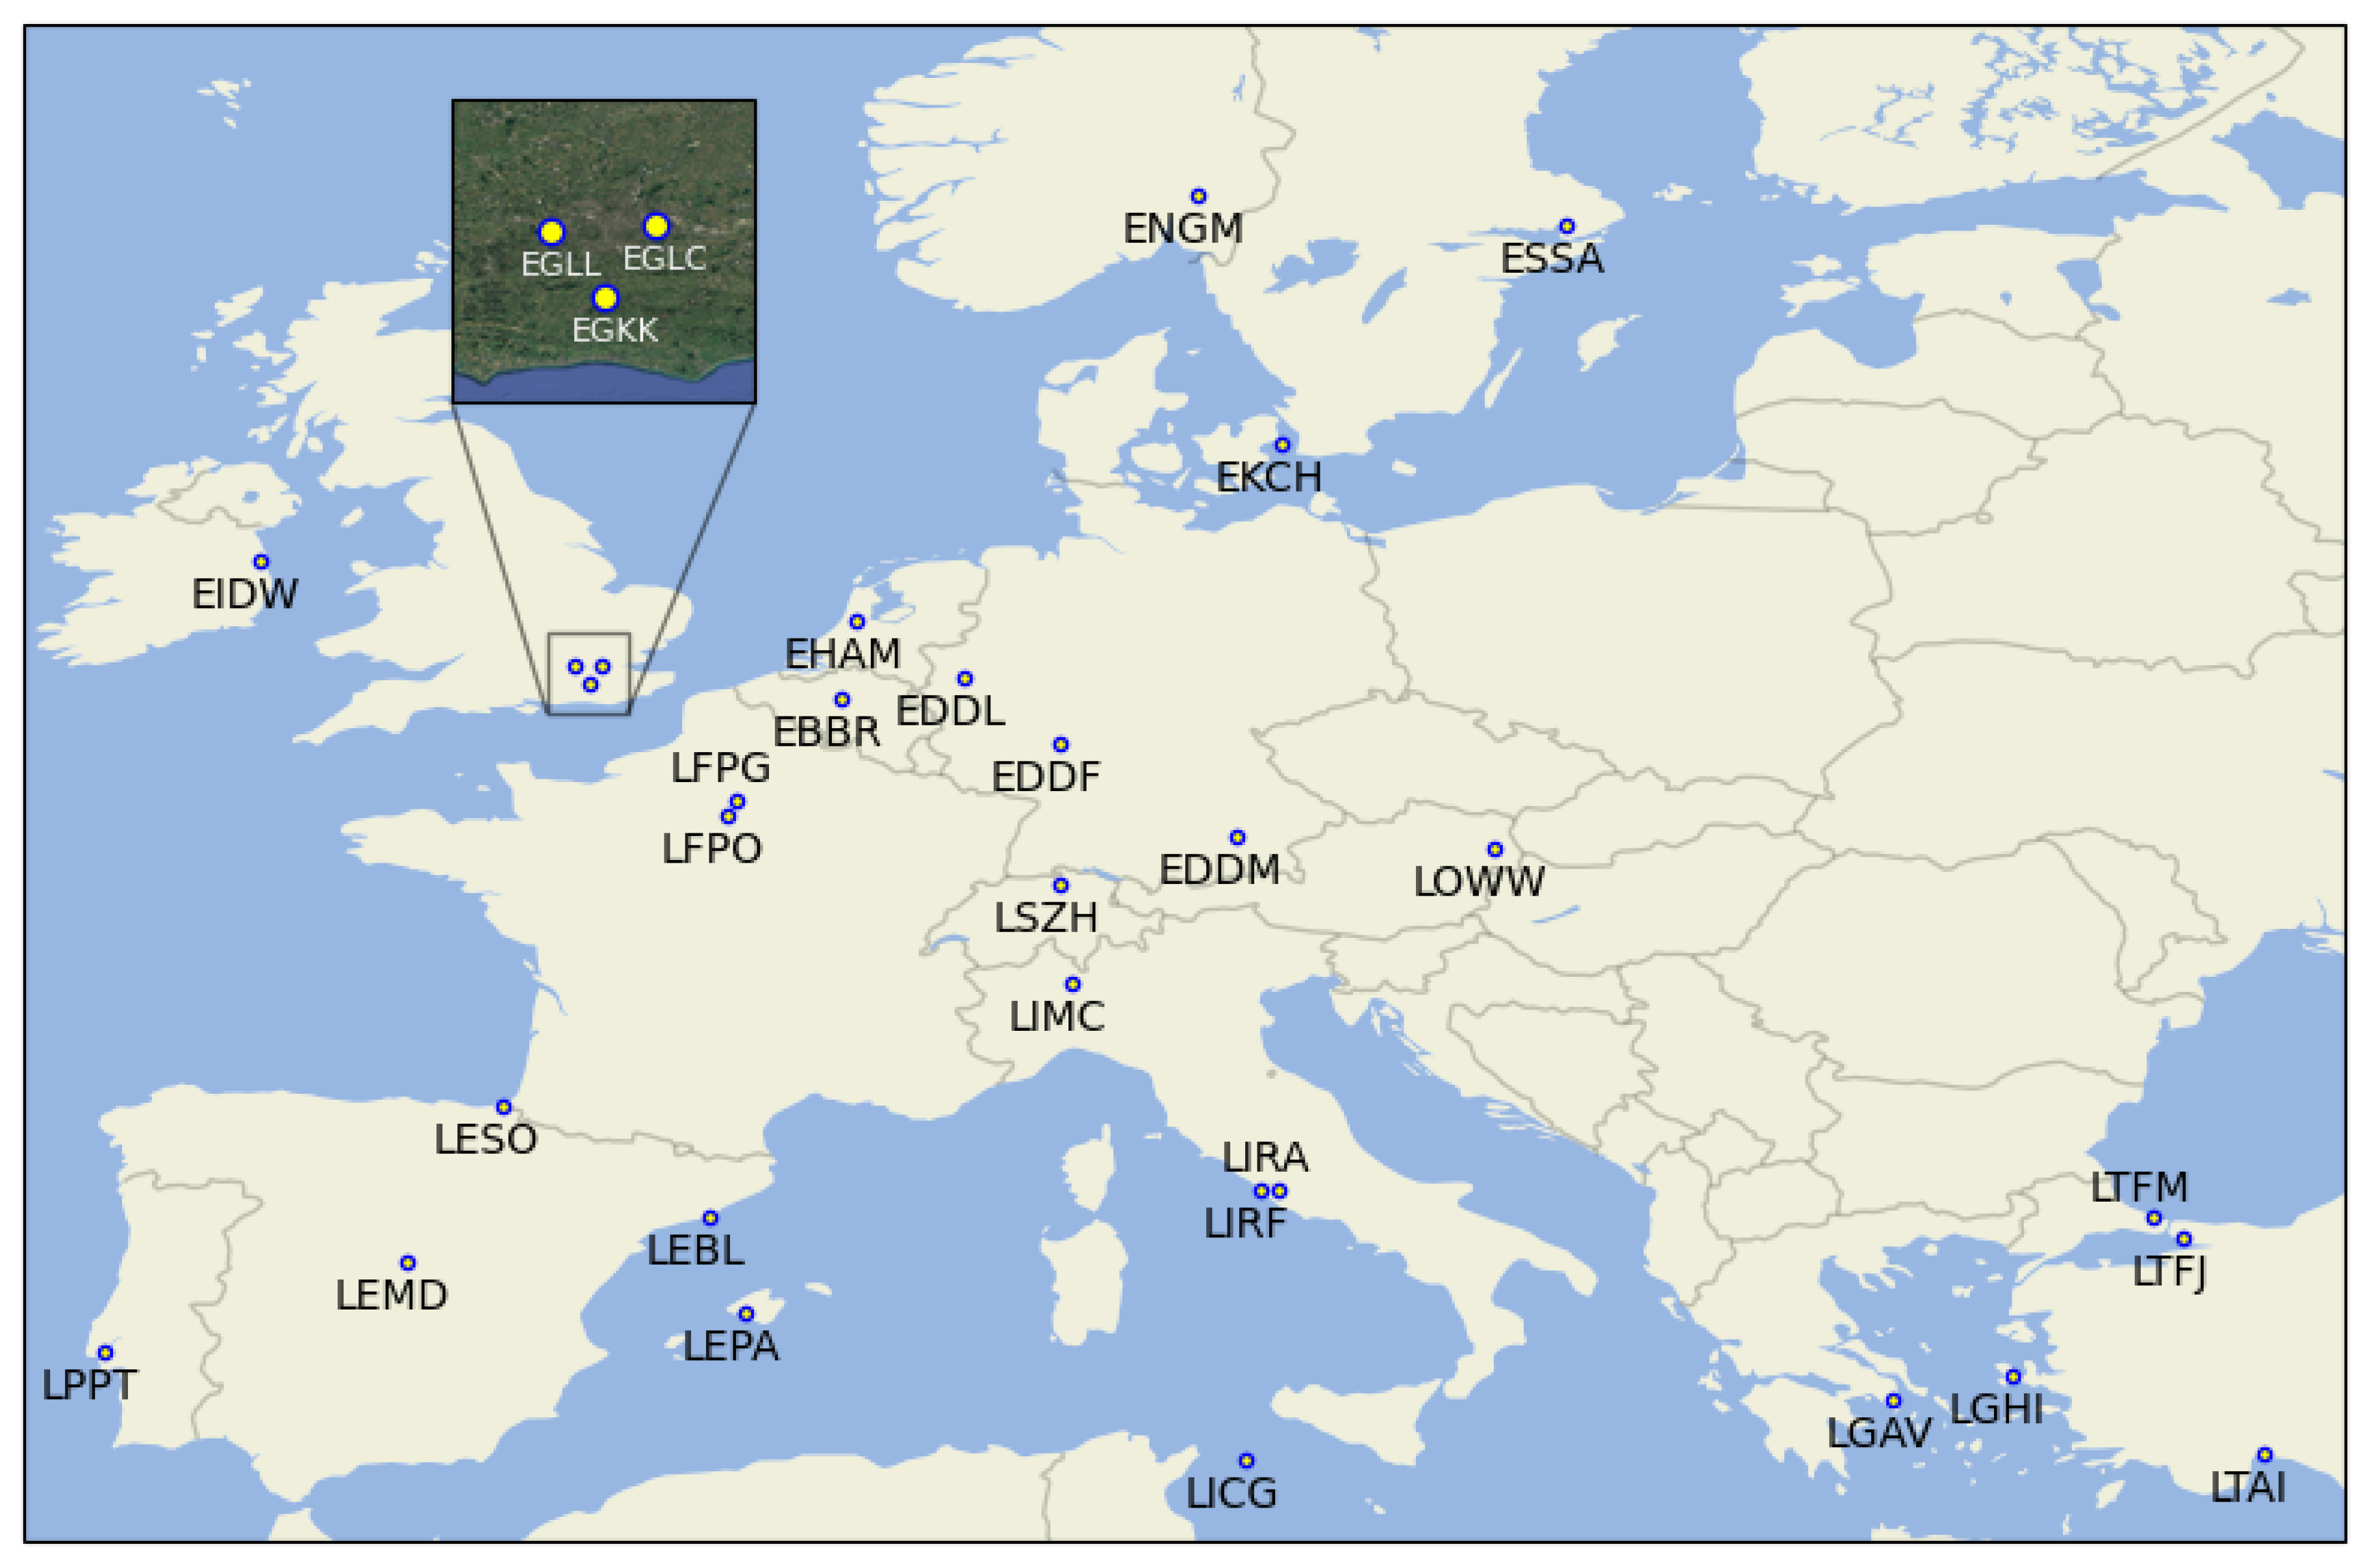
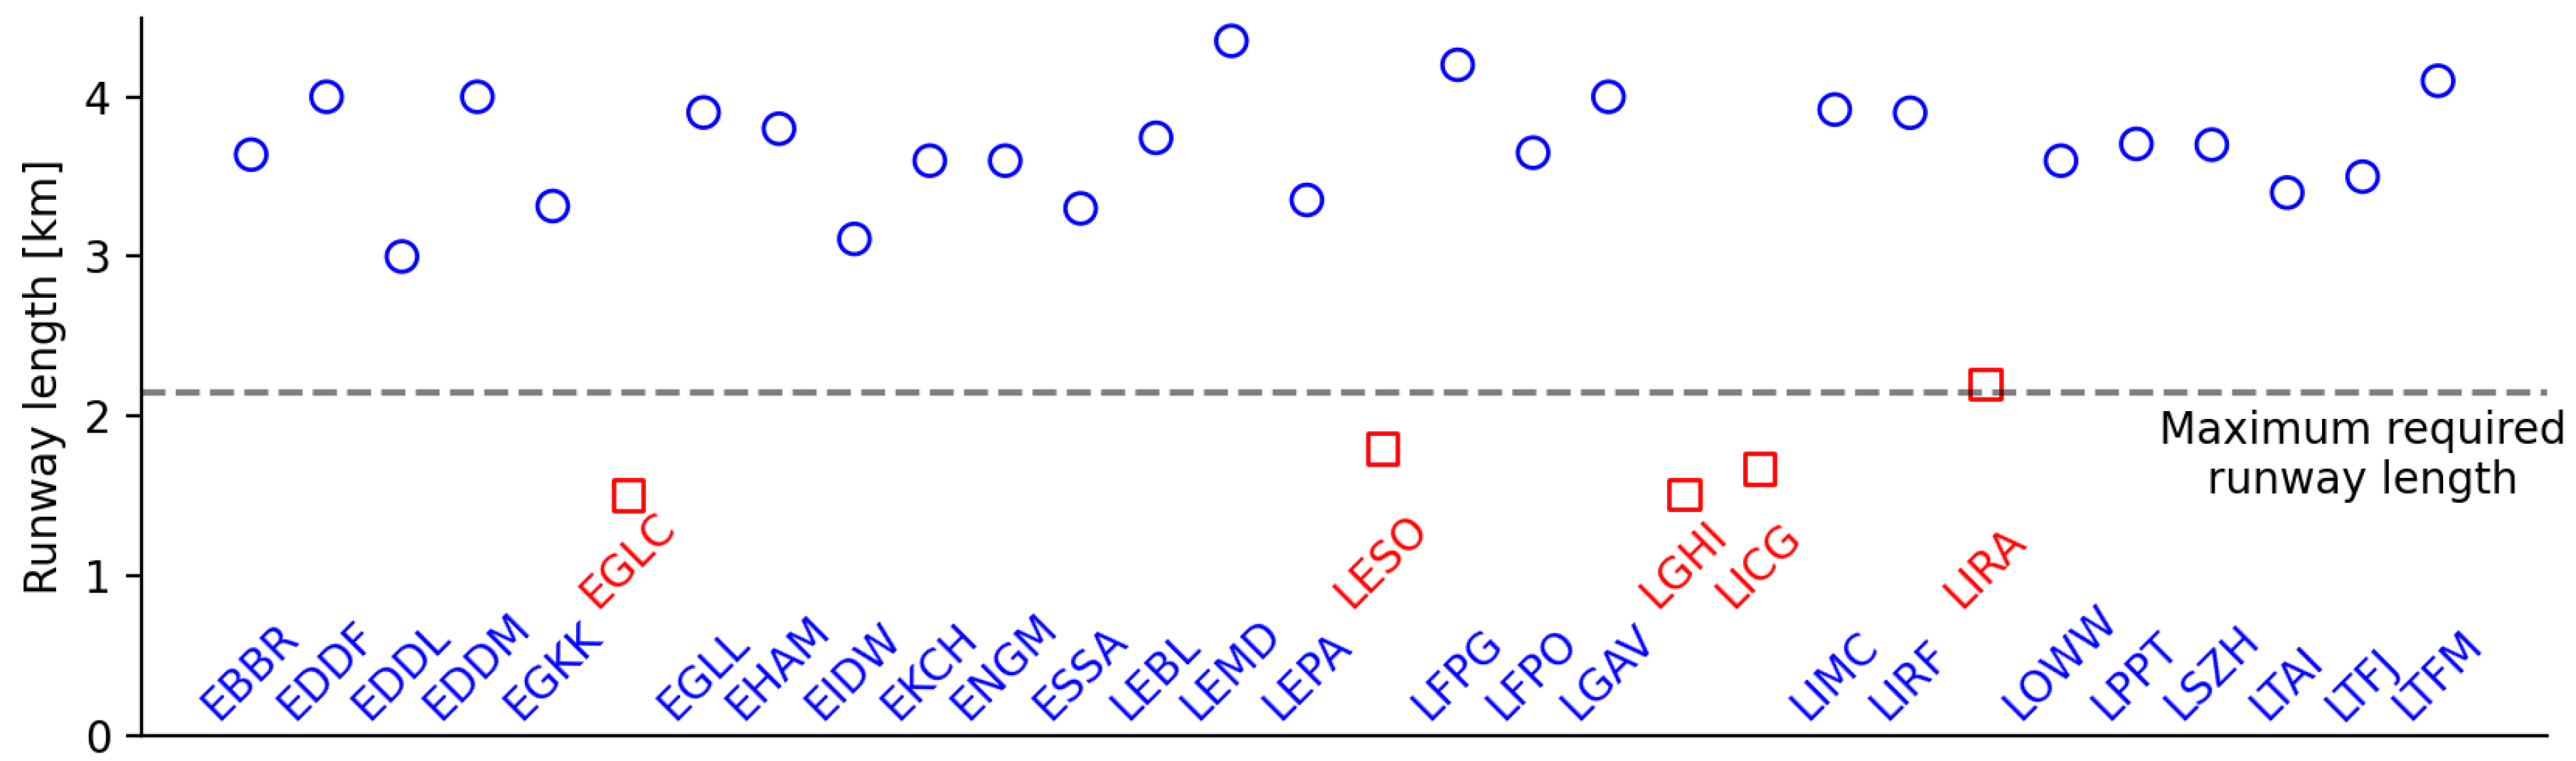
Appendix A. ICAO Airport Codes and Runway Lengths
| Acronym | Description | Location |
|---|---|---|
| EBBR | Brussels Airport | Belgium |
| EDDF | Frankfurt am Main International Airport | Germany |
| EDDL | Dusseldorf International Airport | Germany |
| EDDM | Munich International Airport | Germany |
| EGKK | London Gatwick Airport | UK |
| EGLC | London City Airport | UK |
| EGLL | London Heathrow Airport | UK |
| EHAM | Amsterdam Airport Schiphol | Netherlands |
| EIDW | Dublin Airport | Ireland |
| EKCH | Copenhagen Kastrup Airport | Denmark |
| ENGM | Oslo Gardermoen Airport | Norway |
| ESSA | Stockholm-Arlanda Airport | Sweden |
| LEBL | Barcelona International Airport | Spain |
| LEMD | Madrid Barajas International Airport | Spain |
| LEPA | Palma De Mallorca Airport | Spain |
| LESO | San Sebastian Airport | Spain |
| LFPG | Charles de Gaulle International Airport | France |
| LFPO | Paris-Orly Airport | France |
| LGAV | Eleftherios Venizelos International Airport | Greece |
| LGHI | Chios Island National Airport | Greece |
| LICG | Pantelleria Airport | Italy |
| LIMC | Malpensa International Airport | Italy |
| LIRF | Leonardo Da Vinci (Fiumicino) International Airport | Italy |
| LIRA | Ciampino Airport | Italy |
| LOWW | Vienna International Airport | Austria |
| LPPT | Lisbon Portela Airport | Portugal |
| LSZH | Zurich Airport | Switzerland |
| LTAI | Antalya International Airport | Turkey |
| LTFJ | Sabiha Gokcen International Airport | Turkey |
| LTFM | Istanbul Airport | Turkey |
| Airport Code | Runway Length (m) |
|---|---|
| EGLC | 1508 |
| LGHI | 1511 |
| LICG | 1675 |
| LESO | 1800 |
| LIRA | 2203 |
| EDDL | 3000 |
| EIDW | 3110 |
| ESSA | 3301 |
| EGKK | 3316 |
| LEPA | 3354 |
| LTAI | 3400 |
| LTFJ | 3500 |
| EKCH | 3600 |
| ENGM | 3600 |
| LOWW | 3600 |
| EBBR | 3638 |
| LFPO | 3650 |
| LSZH | 3700 |
| LPPT | 3705 |
| LEBL | 3743 |
| EHAM | 3800 |
| LIRF | 3900 |
| EGLL | 3902 |
| LIMC | 3920 |
| EDDF | 4000 |
| EDDM | 4000 |
| LGAV | 4000 |
| LTFM | 4100 |
| LFPG | 4200 |
| LEMD | 4350 |
Appendix B. Climate Models Used
| Model | Description |
|---|---|
| ACCESS-ESM1-5 | CSIRO Commonwealth Scientific and Industrial Research Organisation, Australia [28] |
| CMCC-ESM2 | CMCC Centro Euro Mediterraneo sui Cambiamenti Climatici, Italy [29] |
| CNRM-ESM2-1 | CNRM Centre National de Recherches Météorologiques and CERFACS Centre Européen de Recherche et de Formation Avancée en Calcul Scientifique, France [30] |
| CanESM5 | CCCMa Canadian Centre for Climate Modelling and Analysis, Canada [31] |
| EC-Earth3 | EC-Earth Consortium Europe [32] |
| GFDL-ESM4 | NOAA-GFDL National Oceanic and Atmospheric Administration, Geophysical Fluid Dynamics Laboratory, USA [33] |
| IPSL-CM6A-LR | IPSL Institut Pierre Simon Laplace, France [34] |
| MPI-ESM1-2-LR | MPI-M Max Planck Institute for Meteorology, Germany [35] |
| NorESM2-LM | NCC NorESM Climate Modelling Consortium, Norway [36] |
| UKESM1-0-LL | MOHC Met Office Hadley Centre, UK [37] |
References
- World Economic Forum. 2016. Available online: https://www.weforum.org/stories/2016/07/this-visualization-shows-you-24-hours-of-global-air-traffic-in-just-4-seconds/ (accessed on 25 November 2024).
- EUROCONTROL. EUROCONTROL Aviation Outlook 2050. 2022. Available online: https://www.eurocontrol.int/publication/eurocontrol-aviation-outlook-2050 (accessed on 25 November 2024).
- Gallardo, V.; Sánchez-Gómez, E.; Riber, E.; Boé, J.; Terray, L. Evolution of high-temperature extremes over the main Euro-Mediterranean airports. Clim. Dyn. 2023, 61, 1717–1740. [Google Scholar] [CrossRef]
- Gratton, G.; Padhra, A.; Rapsomanikis, S.; Williams, P.D. The impacts of climate change on Greek airports. Clim. Change 2020, 160, 219–231. [Google Scholar] [CrossRef]
- Coffel, E.; Horton, R. Climate Change and the Impact of Extreme Temperatures on Aviation. Weather. Clim. Soc. 2015, 7, 94–102. [Google Scholar] [CrossRef]
- Coffel, E.D.; Thompson, T.R.; Horton, R.M. The impacts of rising temperatures on aircraft takeoff performance. Clim. Change 2017, 144, 381–388. [Google Scholar] [CrossRef]
- Wang, K.; Peng, X.; Dan, B.; Liu, H.; Cheng, S.; Fu, N.; Fu, H.; Liu, C. Decreased Aircraft Takeoff Performance under Global Warming. Atmosphere 2023, 14, 106. [Google Scholar] [CrossRef]
- Abram, N.; Gattuso, J.-P.; Prakash, A.; Cheng, L.; Chidichimo, M.P.; Crate, S.; Enomoto, H.; Garschagen, M.; Gruber, N.; Harper, S.; et al. IPCC Special Report on the Ocean and Cryosphere in a Changing Climate. In The Ocean and Cryosphere in a Changing Climate; Cambridge University Press: Cambridge, UK; New York, NY, USA, 2022; Chapter Framing and Context of the Report; pp. 73–130. [Google Scholar] [CrossRef]
- Van Vuuren, D.P.; Stehfest, E.; Gernaat, D.E.; Doelman, J.C.; Van den Berg, M.; Harmsen, M.; de Boer, H.S.; Bouwman, L.F.; Daioglou, V.; Edelenbosch, O.Y.; et al. Energy, land-use and greenhouse gas emissions trajectories under a green growth paradigm. Glob. Environ. Change 2017, 42, 237–250. [Google Scholar] [CrossRef]
- Fujimori, S.; Hasegawa, T.; Masui, T.; Takahashi, K.; Herran, D.S.; Dai, H.; Hijioka, Y.; Kainuma, M. SSP3: AIM implementation of shared socioeconomic pathways. Glob. Environ. Change 2017, 42, 268–283. [Google Scholar] [CrossRef]
- Kriegler, E.; Bauer, N.; Popp, A.; Humpenöder, F.; Leimbach, M.; Strefler, J.; Baumstark, L.; Bodirsky, B.L.; Hilaire, J.; Klein, D.; et al. Fossil-fueled development (SSP5): An energy and resource intensive scenario for the 21st century. Glob. Environ. Change 2017, 42, 297–315. [Google Scholar] [CrossRef]
- EUROCONTROL. Performance Review Report 2019, an Assessment of Air Traffic Management in Europe During the Calendar Year 2019; Technical report; Performance Review Commission: Brussels, Belgium, 2020. [Google Scholar]
- Kang, X.; Zhao, G.; Song, H.; Zeng, X. Analysis of Density Altitude Characteristics at Chinese Airports. Atmosphere 2023, 14, 1784. [Google Scholar] [CrossRef]
- Trentini, L.; Dal Gesso, S.; Venturini, M.; Guerrini, F.; Calmanti, S.; Petitta, M. A Novel Bias Correction Method for Extreme Events. Climate 2022, 11, 3. [Google Scholar] [CrossRef]
- Trentini, L.; Venturini, M.; Guerrini, F.; Dal Gesso, S.; Calmanti, S.; Petitta, M. Identifying climate extremes in Southern Africa through advanced bias correction of climate projections. Bull. Atmos. Sci. Technol. 2025. Available online: https://meetingorganizer.copernicus.org/EMS2024/EMS2024-604.html (accessed on 18 December 2024).
- Sun, J.; Hoekstra, J.M.; Ellerbroek, J. OpenAP: An Open-Source Aircraft Performance Model for Air Transportation Studies and Simulations. Aerospace 2020, 7, 104. [Google Scholar] [CrossRef]
- European Union Aviation Safety Agency. Easy Access Rules for Large Aeroplanes (CS-25). 2023. Available online: https://www.easa.europa.eu/en/document-library/easy-access-rules/easy-access-rules-large-aeroplanes-cs-25 (accessed on 18 December 2024).
- Sun, J.; Ellerbroek, J.; Hoekstra, J.M. WRAP: An open-source kinematic aircraft performance model. Transp. Res. Part C Emerg. Technol. 2019, 98, 118–138. [Google Scholar] [CrossRef]
- McNeall, D.; Williams, J.; Booth, B.; Betts, R.; Challenor, P.; Wiltshire, A.; Sexton, D. The impact of structural error on parameter constraint in a climate model. Earth Syst. Dyn. 2016, 7, 917–935. [Google Scholar] [CrossRef]
- Stainforth, D.A.; Chapman, S.C.; Watkins, N.W. Mapping climate change in European temperature distributions. Environ. Res. Lett. 2013, 8, 034031. [Google Scholar] [CrossRef]
- Zhang, Y.; Li, Q.; Ge, Y.; Du, X.; Wang, H. Growing prevalence of heat over cold extremes with overall milder extremes and multiple successive events. Commun. Earth Environ. 2022, 3, 73. [Google Scholar] [CrossRef]
- Zelinka, M.D.; Myers, T.A.; McCoy, D.T.; Po-Chedley, S.; Caldwell, P.M.; Ceppi, P.; Klein, S.A.; Taylor, K.E. Causes of Higher Climate Sensitivity in CMIP6 Models. Geophys. Res. Lett. 2020, 47, e2019GL085782. [Google Scholar] [CrossRef]
- Gratton, G.B.; Williams, P.D.; Padhra, A.; Rapsomanikis, S. Reviewing the impacts of climate change on air transport operations. Aeronaut. J. 2022, 126, 209–221. [Google Scholar] [CrossRef]
- Yuan, W.; Dai, P.; Xu, M.; Song, W.; Zhang, P. Estimating the Impact of Global Warming on Aircraft Takeoff Performance in China. Atmosphere 2021, 12, 1472. [Google Scholar] [CrossRef]
- Willett, K.M. HadISDH.extremes Part I: A Gridded Wet Bulb Temperature Extremes Index Product for Climate Monitoring. Adv. Atmos. Sci. 2023, 40, 1952–1967. [Google Scholar] [CrossRef]
- Eyring, V.; Bony, S.; Meehl, G.A.; Senior, C.A.; Stevens, B.; Stouffer, R.J.; Taylor, K.E. Overview of the Coupled Model Intercomparison Project Phase 6 (CMIP6) experimental design and organization. Geosci. Model Dev. 2016, 9, 1937–1958. [Google Scholar] [CrossRef]
- Gutiérrez, J.M.; Treguier, A.M.; Durack, P.J.; Emori, S.; Nowicki, S.; Ruiz, L.; Sierra, J.D.; Guilyardi, E.; Satoh, Y.; Stockhause, M. Climate Change 2021: The Physical Science Basis; Contribution of Working Group I to the Sixth Assessment Report of the Intergovernmental Panel on Climate Change; Cambridge University Press: Cambridge, UK; New York, NY, USA, 2023; Chapter AII—Annex II: Models; pp. 2087–2138. [Google Scholar] [CrossRef]
- Ziehn, T.; Lenton, A.; Law, R.M.; Matear, R.J.; Chamberlain, M.A.; Ridgway, K.R.; Srbinovsky, J.; Stevens, L.; Vohralik, P.; Wang, Y.P. The Australian Earth System Model: ACCESS-ESM1.5. J. South. Hemisph. Earth Syst. Sci. 2020, 70, 1–28. [Google Scholar] [CrossRef]
- Lovato, T.; Peano, D.; Butenschön, M.; Materia, S.; Iovino, D.; Scoccimarro, E.; Fogli, P.G.; Cherchi, A.; Bellucci, A.; Gualdi, S.; et al. CMIP6 simulations with the CMCC Earth System Model (CMCC-ESM2). J. Adv. Model. Earth Syst. 2022, 14, e2021MS002814. [Google Scholar] [CrossRef]
- Séférian, R.; Nabat, P.; Michou, M.; Saint-Martin, D.; Voldoire, A.; Colin, J.; Decharme, B.; Delire, C.; Berthet, S.; Chevallier, M.; et al. Evaluation of CNRM Earth-System Model (CNRM-ESM2-1) for CMIP6. J. Adv. Model. Earth Syst. 2019, 11, 2530–2560. [Google Scholar] [CrossRef]
- Swart, N.C.; Cole, J.N.S.; Kharin, V.V.; Lazare, M.; Scinocca, J.F.; Gillett, N.P.; Anstey, J.; Arora, V.; Christian, J.R.; Hanna, S.; et al. The Canadian Earth System Model version 5 (CanESM5.0.3). Geosci. Model Dev. 2019, 12, 4823–4873. [Google Scholar] [CrossRef]
- Döscher, R.; Acosta, M.; Alessandri, A.; Anthoni, P.; Arsouze, T.; Bergman, T.; Bernardello, R.; Boussetta, S.; Caron, L.P.; Carver, G.; et al. The EC-Earth3 Earth system model for the Coupled Model Intercomparison Project 6. Geosci. Model Dev. 2022, 15, 2973–3020. [Google Scholar] [CrossRef]
- Dunne, J.P.; Horowitz, L.W.; Adcroft, A.J.; Ginoux, P.; Held, I.M.; John, J.G.; Krasting, J.P.; Malyshev, S.; Naik, V.; Paulot, F.; et al. The GFDL Earth System Model version 4.1 (GFDL-ESM4.1): Model description and simulation characteristics. J. Adv. Model. Earth Syst. 2020, 12, e2019MS002008. [Google Scholar] [CrossRef]
- Boucher, O.; Servonnat, J.; Albright, A.L.; Aumont, O.; Balkanski, Y.; Bastrikov, V.; Bekki, S.; Bonnet, R.; Bony, S.; Bopp, L.; et al. Presentation and evaluation of the IPSL-CM6A-LR climate model. J. Adv. Model. Earth Syst. 2020, 12, e2019MS002010. [Google Scholar] [CrossRef]
- Mauritsen, T.; Bader, J.; Becker, T.; Behrens, J.; Bittner, M.; Brokopf, R.; Bunzel, F.; Esch, M.; Falk, D.; Fiedler, S.; et al. Developments in the MPI-M Earth System Model version 1.2 (MPI-ESM1.2) and its response to increasing CO2. J. Adv. Model. Earth Syst. 2019, 11, 998–1038. [Google Scholar] [CrossRef] [PubMed]
- Bentsen, M.; Bethke, I.; Debernard, J.B.; Iversen, T.; Kirkevåg, A.; Seland, Ø.; Drange, H.; Roelandt, C.; Seierstad, I.A.; Hoose, C.; et al. The Norwegian Earth System Model, NorESM2—Evaluation of the CMIP6 DECK and historical simulations. Geosci. Model Dev. 2019, 12, 6165–6200. [Google Scholar] [CrossRef]
- Sellar, A.A.; Jones, C.G.; Mulcahy, J.P.; Tang, Y.; Yool, A.; Wiltshire, A.; O’Connor, F.M.; Stringer, M.; Hill, R.; Palmieri, J.; et al. UKESM1: Description and evaluation of the UK Earth System Model. J. Adv. Model. Earth Syst. 2019, 11, 4513–4558. [Google Scholar] [CrossRef]

Disclaimer/Publisher’s Note: The statements, opinions and data contained in all publications are solely those of the individual author(s) and contributor(s) and not of MDPI and/or the editor(s). MDPI and/or the editor(s) disclaim responsibility for any injury to people or property resulting from any ideas, methods, instructions or products referred to in the content. |
© 2025 by the authors. Licensee MDPI, Basel, Switzerland. This article is an open access article distributed under the terms and conditions of the Creative Commons Attribution (CC BY) license (https://creativecommons.org/licenses/by/4.0/).
Share and Cite
Williams, J.; Williams, P.D.; Guerrini, F.; Venturini, M. Quantifying the Effects of Climate Change on Aircraft Take-Off Performance at European Airports. Aerospace 2025, 12, 165. https://doi.org/10.3390/aerospace12030165
Williams J, Williams PD, Guerrini F, Venturini M. Quantifying the Effects of Climate Change on Aircraft Take-Off Performance at European Airports. Aerospace. 2025; 12(3):165. https://doi.org/10.3390/aerospace12030165
Chicago/Turabian StyleWilliams, Jonny, Paul D. Williams, Federica Guerrini, and Marco Venturini. 2025. "Quantifying the Effects of Climate Change on Aircraft Take-Off Performance at European Airports" Aerospace 12, no. 3: 165. https://doi.org/10.3390/aerospace12030165
APA StyleWilliams, J., Williams, P. D., Guerrini, F., & Venturini, M. (2025). Quantifying the Effects of Climate Change on Aircraft Take-Off Performance at European Airports. Aerospace, 12(3), 165. https://doi.org/10.3390/aerospace12030165