Article

Estimation Method for Basic Parameters of High-Speed Vertical Take-Off and Landing Aircraft

1
Key Laboratory of Fundamental Science for National Defense—Advanced Design Technology of Flight Vehicle, Nanjing University of Aeronautics and Astronautics, Nanjing 210016, China
2
National Key Laboratory of Helicopter Aeromechanics, Nanjing University of Aeronautics and Astronautics, Nanjing 210016, China
*
Author to whom correspondence should be addressed.
Aerospace 2025, 12(11), 992; https://doi.org/10.3390/aerospace12110992
Submission received: 30 September 2025 / Revised: 1 November 2025 / Accepted: 2 November 2025 / Published: 6 November 2025
(This article belongs to the Section Aeronautics)

Abstract

The research aims to propose a basic parameter estimation method for high-speed vertical take-off and landing (HSVTOL) aircraft, balancing rotor and fixed-wing mode requirements. Flight profiles and performance indicators are defined based on mission phases, and maximum take-off weight is estimated using the fuel fraction method. A pre-estimation model for a turboshaft–turbofan variable cycle engine (TSFVCE) was established, and the conversion between thrust and power was conducted. Constraints related to different performance requirements were analyzed, and the relationship between the rotor and the wing was established, resulting in the generation of constraint diagrams for the selection of basic parameters. This method allows for the rapid and effective estimation of basic parameters, including maximum take-off weight, rotor disk loading, and wing loading. Two tiltrotor aircraft were analyzed using this method. The estimated results closely matched actual values, with errors within a reasonable range. These findings demonstrate the method’s reliability and provide a reference for HSVTOL conceptual design and engine power matching.

1. Introduction

Currently, there is a growing and urgent need for major maritime nations worldwide to strengthen the construction of amphibious landing equipment. The High-Speed Vertical Take-Off and Landing aircraft (HSVTOL) is a new-concept vehicle designed for future maritime warfare. Employing a tiltrotor configuration that combines helicopter capabilities (vertical take-off/landing and hovering) with fixed-wing aircraft advantages (high cruise speed and long range), this aircraft has been identified by the U.S. Government Accountability Office (GAO) as the ideal platform for the Future Long-Range Assault Aircraft (FLRAA) [1]. As such, it represents a significant development direction for future high-speed helicopters and is a forefront research area in next-generation helicopter technology [2,3].
To meet the performance requirements of the HSVTOL, the turboshaft–turbofan variable cycle engine (TSFVCE) presents a highly advantageous power system solution [4]. When the HSVTOL operates in helicopter mode for vertical take-off and landing, the engine functions in turboshaft mode, delivering shaft power to drive the rotors and generate lift. During high-speed cruise, the rotors stop and are stowed, enabling the aircraft to fly as a fixed-wing aircraft; simultaneously, the engine switches to turbofan mode to generate forward thrust. A representative example is the HSVTOL concept developed by Bell in the US, for which functional demonstration and validation of a conceptual prototype have been completed [5]. The research presented in this article primarily focuses on aircraft of this configuration.
Compared to traditional helicopters or fixed-wing aircraft, high-speed vertical take-off and landing aircraft often employ novel configurations or propulsion solutions. Consequently, their conceptual design methodology presents unique challenges and demands a higher level of airframe–propulsion integration.
In the late 20th century, Talbot et al. [6] from the National Aeronautics and Space Administration (NASA) conducted analyses of several conceptual schemes for high-speed rotorcraft. One of these concepts utilized a “convertible engine” as the propulsion system and investigated the basic parameters influencing the performance of high-speed rotorcraft, although a specific design process was not elaborated. Subsequently, Davis [7] proposed a design and analysis method applicable to rotorcraft. This method calculated rotorcraft performance and power requirements using a modified momentum theory and determined the minimum gross weight satisfying specific mission requirements based on the “ratio of fuel” method. However, for power availability estimation, only traditional turboshaft and piston engines were considered. Later, Johnson [8,9,10] established the NASA Design and Analysis of Rotorcraft (NDARC) methodology for NASA. This approach determines the basic parameters of a rotorcraft by defining mission segments and employing an iterative process to reconcile the relationships between geometry, power, and weight. The NDARC method is now widely used for the conceptual design of rotorcraft.
Building upon conventional helicopter design principles, Zhu [11] proposed a reference prototype design method suitable for tiltrotor aircraft. Zuo [12] estimated the aircraft weight through parametric equations and established a performance model based on momentum-blade element theory to derive a preliminary basic parameter scheme. Zhou et al. [13] developed a basic parameter optimization model for a high-speed quad tiltrotor using a continuous domain ant colony algorithm, performing multi-objective optimization for range and endurance. Gong et al. [14] addressed the experimental validation gap in tiltrotor vertical take-off and landing (VTOL) aircraft by developing a novel fixed-wing/multi-rotor hybrid prototype, achieving stable control and structural optimization through dual-PID control and mechanical refinement. However, these studies primarily approached the design from a rotorcraft perspective, focusing on rotor dynamics and related parameter design, and did not conduct an in-depth exploration of the basic parameter selection for the fixed-wing flight mode or the performance requirements for high-speed cruise. Furthermore, current research on high-speed VTOL aircraft remains largely concentrated on aspects such as aerodynamic characteristic analysis. For instance, references [15,16,17,18,19] employed various methods for aerodynamic modeling and computation of tiltrotor aircraft or tilting rotors, further investigating issues like aerodynamic interference and optimization.
As outlined above, current research on the conceptual design of HSVTOL aircraft has limitations, and a systematic methodology has yet to be established. Although designs for tiltrotor aircraft consider a flight mode analogous to propeller aircraft, most existing design schemes still largely follow a helicopter-centric design philosophy. There is insufficient research focused on the design for the fixed-wing aircraft mode, and the power requirements of the engine across different flight states remain relatively unclear. Furthermore, conceptual design methodologies for aircraft configurations employing TSFVCEs are even more scarce.
Both conventional helicopters and fixed-wing aircraft possess mature conceptual design methods. However, the HSVTOL, as a new-concept aircraft combining the characteristics of both, necessitates the simultaneous consideration of both flight modes during the selection of basic parameters. This includes accounting for the interdependencies between the rotor and the wing, preventing the direct application of any single existing design process. Concurrently, its configuration and propulsion system represent significant departures from past designs, and there is a lack of sufficient historical aircraft data for reference [20]. Furthermore, it should be noted that although there are currently multiple configurations for VTOL aircraft, after nearly 60 years of exploration, the high-speed rotorcraft configurations widely considered to have the greatest application potential mainly include: coaxial rigid-rotor high-speed helicopters, tiltrotor aircraft, dual-thrust compound high-speed helicopters, and multi-rotor tiltrotor electric-drive high-speed helicopters derived from electric propulsion technology. Among these, the tiltrotor is currently the only type of high-speed rotorcraft that has been practically applied globally [3], with its maturity demonstrated by the V-22 and V-280 platforms. Therefore, the HSVTOL concept presented in this paper also adopts a tiltrotor configuration but achieves a higher cruise speed of 750–800 km/h, which falls within the high-subsonic regime. This represents a key distinction between HSVTOL and conventional VTOL aircraft. To achieve this objective, the HSVTOL configuration incorporates foldable rotors and the TSFVCE as its core technological solutions. This configuration represents a significant innovation over conventional VTOL and tiltrotor aircraft.
Therefore, it is necessary to develop a method for estimating the basic parameters of HSVTOL aircraft that adequately addresses both the rotor mode and the fixed-wing mode. This method facilitates the design of the aircraft according to specific requirements, enabling the rational determination of its main dimensional parameters and the definition of clear thrust/power requirements for the intended TSFVCE propulsion system.
Combining existing aircraft conceptual design processes [3,20,21,22] with rotorcraft conceptual design methodologies [23,24,25,26,27], this study begins with the mission definition for the HSVTOL. It sequentially presents methods for weight estimation and performance constraint analysis for the different flight modes. Subsequently, by introducing geometric constraints between the wing and the rotor, a comprehensive analysis is conducted to establish a method for estimating the basic parameters of the HSVTOL. Finally, the applicability of the proposed method is validated using two typical tiltrotor aircraft as calculation examples.
The structure of this paper is organized as follows. Section 2 defines the mission profiles and design requirements for the HSVTOL, establishing the basis for the entire sizing process. Section 3 details the methodology for estimating the maximum take-off weight. Section 4 presents the core of the proposed method, including the modeling of the TSFVCE and the development of the integrated constraint analysis framework for both helicopter and aircraft flight modes. Section 5 validates the proposed methodology through detailed case studies of the V-22 tiltrotor and a conceptual high-speed folding rotor aircraft. Finally, Section 6 summarizes the main conclusions drawn from this study and suggests directions for future research.

2. Mission Definition

Based on the intended use and operational conditions of the aircraft being designed, it is essential to first define its mission phases to establish the corresponding mission profile, which in turn determines the requirements for various flight performance metrics. The basic mission phases for the HSVTOL, categorized according to different flight modes, are defined as follows:
Helicopter Mode: vertical take-off and landing, hover, climb, and forward flight;
Fixed-Wing Aircraft Mode (including propeller aircraft mode and jet aircraft mode): climb, turn, cruise, and descent;
Tilt Transition: mutual transition between helicopter mode and propeller aircraft mode;
Engine Mode Transition: mutual switching between the engine’s turboshaft and turbofan modes;
Payload Deployment.
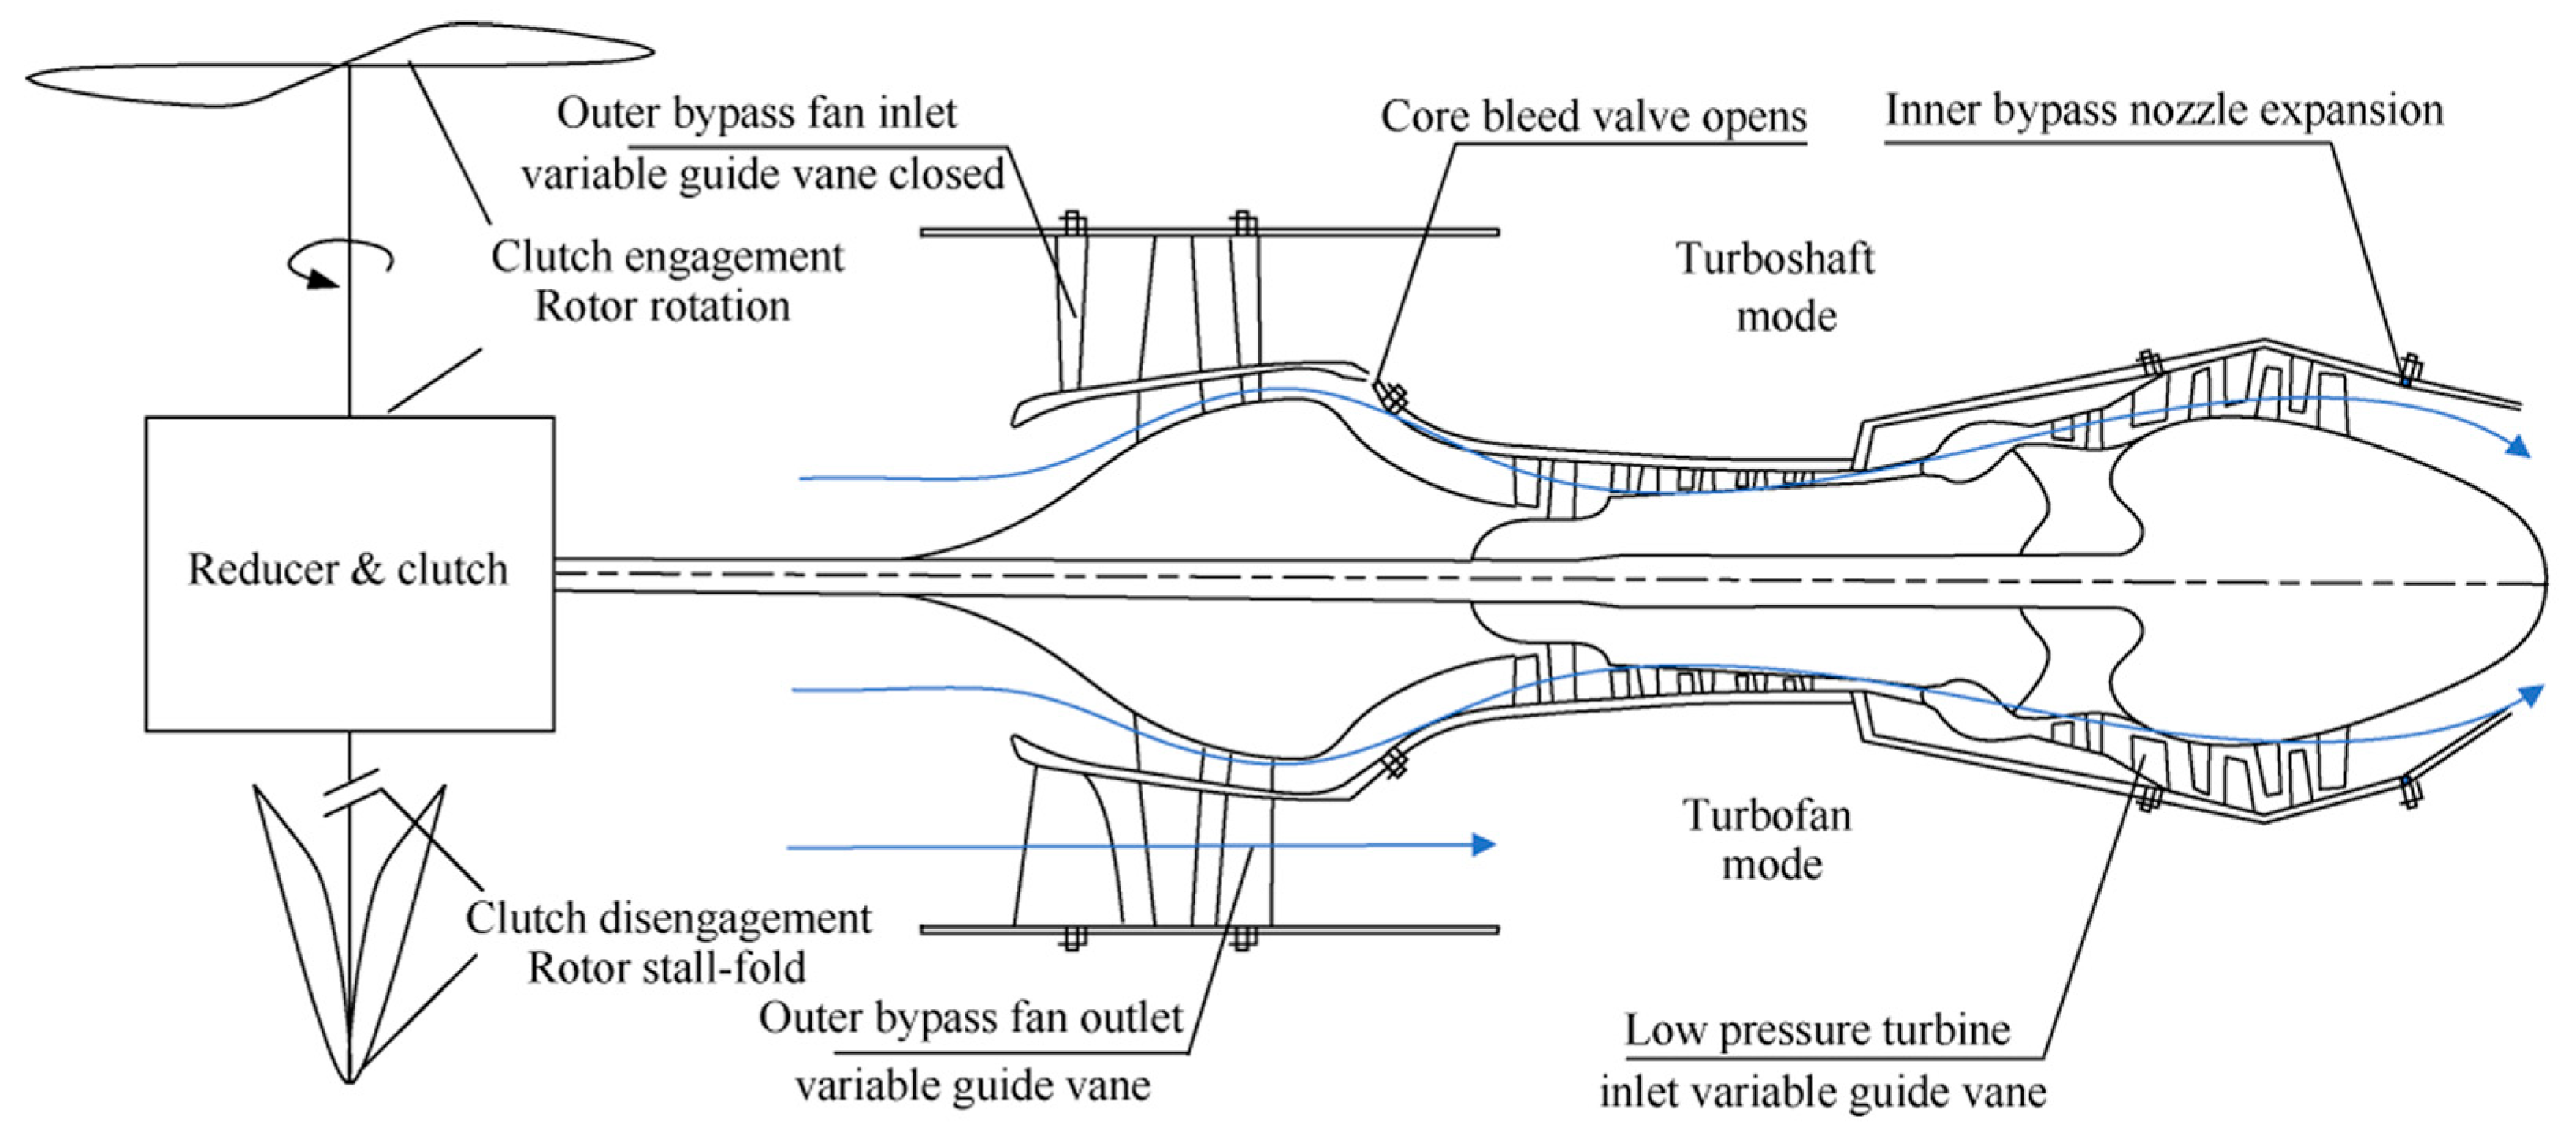
The typical flight modes of the HSVTOL and their corresponding TSFVCE operational modes are illustrated in Figure 1.
The operational phases outlined above may be selectively configured per mission-specific requirements. For instance, during rapid transport operations, following tilt transition completion, the rotor system ceases rotation and folds, enabling conversion to jet aircraft mode with engines switching to turbofan operation for high-speed cruise; during return flights, to optimize fuel efficiency, the HSVTOL operates in propeller aircraft mode without requiring engine modal transitions.

3. Maximum Take-Off Weight Estimation

For fuel-powered aircraft, the maximum take-off weight Wto is generally composed of the empty weight We, the fuel weight Wf, and the payload weight Wp, as shown in Equation (1) [20]:
W to   =   W e +   W f   +   W p
where Wp is determined by the design requirements and can be further divided into the deployable payload weight Wpe (e.g., supplies, ammunition) and the permanent payload weight Wpp (e.g., crew members); We represents the combined weight of the airframe structure and onboard systems; Wf denotes the total weight of fuel required to complete the entire mission, including reserve fuel, which is typically taken as 6% of the usable fuel. These three weight components are commonly expressed as fractions of the maximum take-off weight. Therefore, Equation (1) can be rewritten as:
W to   = W p 1 W e W to W f W to
where We/Wto is the empty weight fraction, and Wf/Wto is the fuel weight fraction. Given the payload weight, the maximum take-off weight can be solved iteratively once the empty weight fraction and fuel weight fraction are estimated. The specific estimation methods for these are presented below.

3.1. Empty Weight

For different types of aircraft, a statistical empirical relationship exists between the empty weight fraction and the maximum take-off weight [21]:
W e W to   =   a W to c K vs
where a and c are empirical coefficients that can be selected from references [20,21] based on aircraft of a similar class and scale; Kvs is a correction factor, taken as 1.04 for variable-sweep wing configurations and 1.0 for other wing types. As no HSVTOL aircraft has yet been put into practical service, the weight parameters of existing fuel-powered tiltrotor aircraft, as summarized in Table 1, can be referenced in conjunction with Equation (3) [11].
Based on the empirical coefficients of aircraft with similar characteristics to the HSVTOL (such as twin-turboprop aircraft and jet transports), and referencing the weight parameters of tiltrotor aircraft in the same class along with relevant research data on high-speed rotorcraft from literature [6], the empirical coefficients for the HSVTOL empty weight fraction are proposed as follows, taking into account technological advancement trends: a = 0.97, c = −0.05. If insufficient reference data is available, the empty weight fraction can be approximated as 0.6.

3.2. Fuel Weight

Based on the mission phases defined in Section 2, Wf is determined using the fuel fraction method. Except during payload deployment, the change in the total aircraft weight is equal to the weight of fuel consumed during flight. Assuming the mission profile consists of n segments, for each mission segment i, the aircraft weights at the start and end of the segment are, respectively, denoted as Wi−1 and Wi. The weight ratio for each individual mission segment can be expressed as:
  • Vertical Take-off and Climb in Helicopter Mode
The weight ratio for this phase is selected with reference to literature [9,27]:
W i W i 1   =   0.987   ~   0.990
2.
Tilt Transition and Engine Mode Transition
Due to the short duration of these two phases, the weight change can be considered negligible, and the weight is therefore assumed to remain constant:
W i W i 1     1
3.
Climb in Fixed-Wing Aircraft Mode
The weight ratio can be estimated based on the current flight Mach number (Ma) [20]:
W i W i 1   =   1.0065 0.0325   Ma
Alternatively, statistical data can be used directly:
W i W i 1   =   0.985
4.
Cruise in Fixed-Wing Aircraft Mode
The weight ratio for this phase is calculated using the Breguet range equation [20,21]:
W i W i 1   =   exp R cruise · C cruise V cruise · L / D cruise
where Rcruise is the cruise range (in m), Ccruise is the thrust-specific fuel consumption in cruise condition (in N/(N·s)), Vcruise is the cruise speed (in m/s), and (L/D)cruise represents the lift-to-drag ratio during cruise.
5.
Loiter (or Turn) in Fixed-Wing Aircraft Mode
The weight ratio is calculated using the Breguet endurance equation:
W i W i 1   =   exp E loiter · C loiter L / D loiter
where Eloiter is the loiter time (in s), Cloiter is the thrust-specific fuel consumption during loiter (in N/(N·s)), and (L/D)loiter is the lift-to-drag ratio during loiter.
6.
Descent in Fixed-Wing Aircraft Mode
Statistical data is adopted for this phase [20,21]:
W i W i 1   =   0.990   ~   0.995
7.
Payload Deployment
Deployment is typically completed within a short duration, during which the total aircraft weight is considered to undergo a step change. The weight ratio for this phase is:
W i W i 1   =   W i 1     W pe W i 1   =   1 W pe W i 1
where Wpe denotes the weight of the deployed payload.
8.
Vertical Landing
Statistical data can also be used for this phase [27]:
W i W i 1   =   0.995   ~   0.997
In summary, the total fuel weight fraction (considering 6% reserve fuel) is:
W f W to   =   1.06 1 i = 1 n W i W i 1
Following the calculations above, expressions for both the empty weight fraction We/Wto and the fuel weight fraction Wf/Wto are obtained. Substituting these into Equation (2) allows for the determination of the maximum take-off weight.

4. Preliminary Modeling of Engine and Aerodynamic Characteristics

In addition to the inherent design requirements of the aircraft itself, the process of estimating the basic parameters requires input data regarding engine performance parameters (such as thrust/power characteristics and specific fuel consumption) and aerodynamic parameters (such as the lift-to-drag ratio, L/D, and the zero-lift drag coefficient, CD0). Therefore, it is necessary to establish reasonable preliminary estimates for these data sets.

4.1. Engine Model

The determination of an aircraft’s basic parameters can be based on either an existing engine or a new engine designed to meet specific requirements, with the latter approach often referred to as a “rubber engine”. Since different flight modes of the HSVTOL require different types of power, the selected engine must simultaneously meet the demands of vertical take-off and landing, hover, and high-speed cruise. This necessitates establishing the relationship between the thrust and power output under different operational modes of the TSFVCE and performing a unified conversion to determine the engine output power requirements for each performance metric of the aircraft.
To simplify the design process, the TSFVCE is treated as a “rubber engine” in this study. The engine employs a structure with variable inlet guide vanes (VIGVs) in the bypass duct [28,29,30]. The airflow rate and pressure ratio in the bypass duct are controlled by adjusting the VIGV angle, as illustrated in Figure 2 [30]. Based on currently available reference data, the engine’s performance parameters and characteristics are estimated according to data from references [28,29,30], as summarized in Table 2 and illustrated in Figure 3. The parameters of the TSFVCE in this study are derived from the TF34-400 engine, as this engine model served as a foundational research platform for investigating turboshaft-to-turbofan mode-switching variable cycle technology [31]. As research into TSFVCEs advances, this engine model will be subsequently refined and improved.
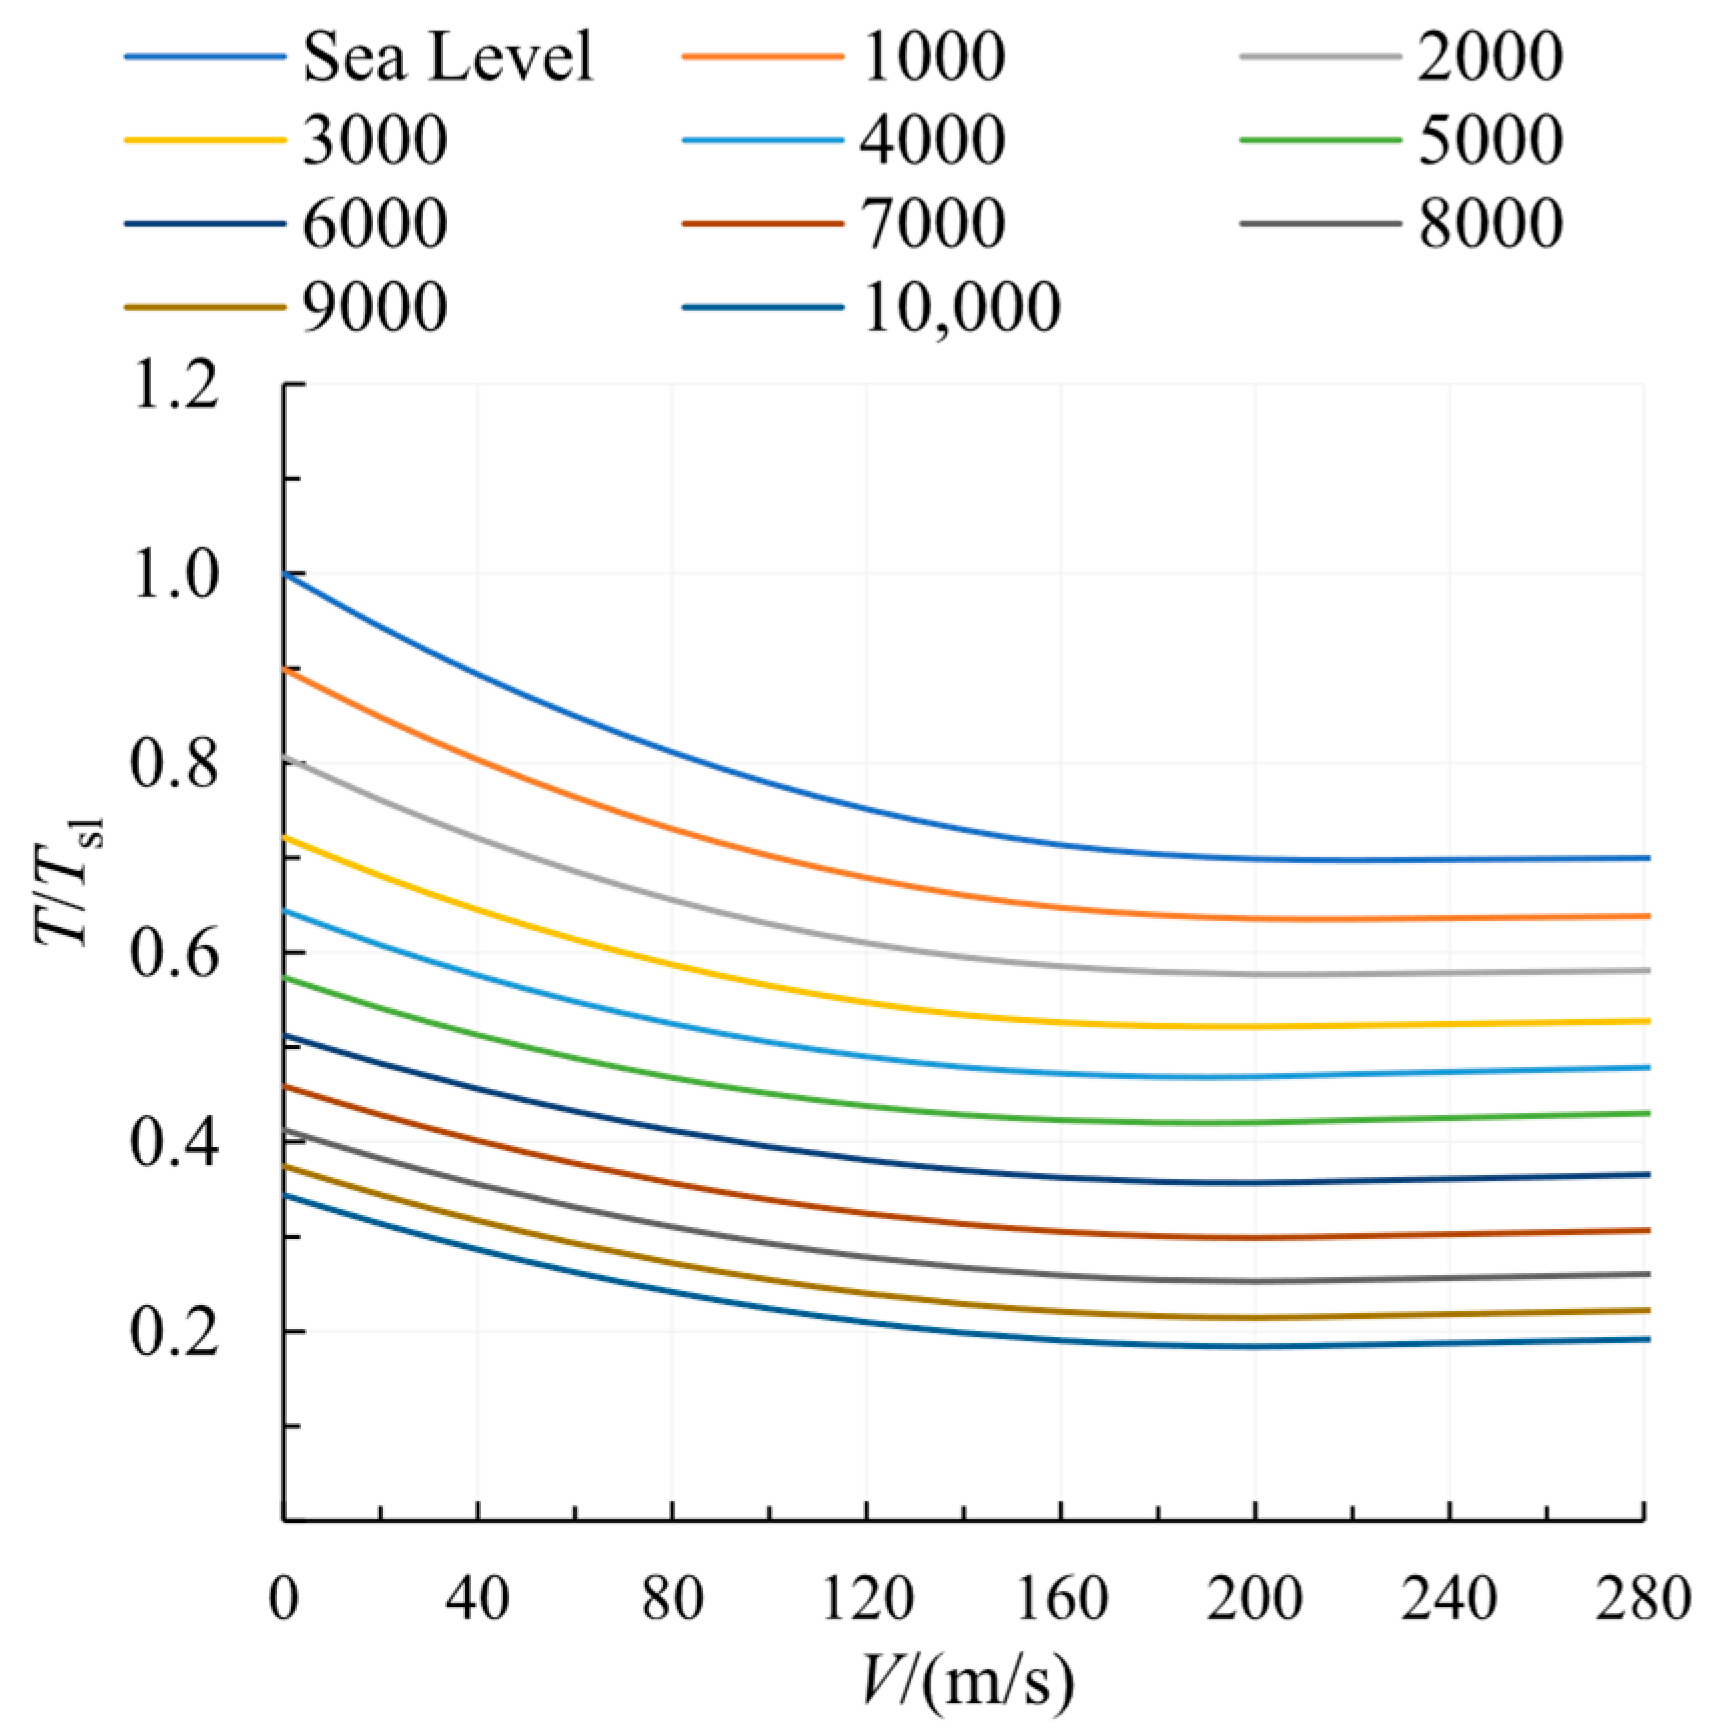
The engine’s design point is set at sea-level static conditions. In Table 2, BPR denotes the bypass ratio; Tsl represents the thrust at the design point; and Psl is the output power at the design point. Figure 3 shows the estimated thrust lapse ratio αt (αt = T/Tsl), of the TSFVCE at different flight altitudes H (in m), and velocities V (in m/s).
Typically, the thrust-to-weight ratio, Tsl/Wto, is used as a fundamental parameter to define the powerplant requirements of an aircraft. To establish the relationship between the different flight modes of the HSVTOL and the various operational modes of the TSFVCE, this study converts the power requirements of all flight conditions into a unified requirement for engine power output at sea-level static conditions. This unified requirement is characterized by a “power-to-weight ratio”, Psl/Wto.
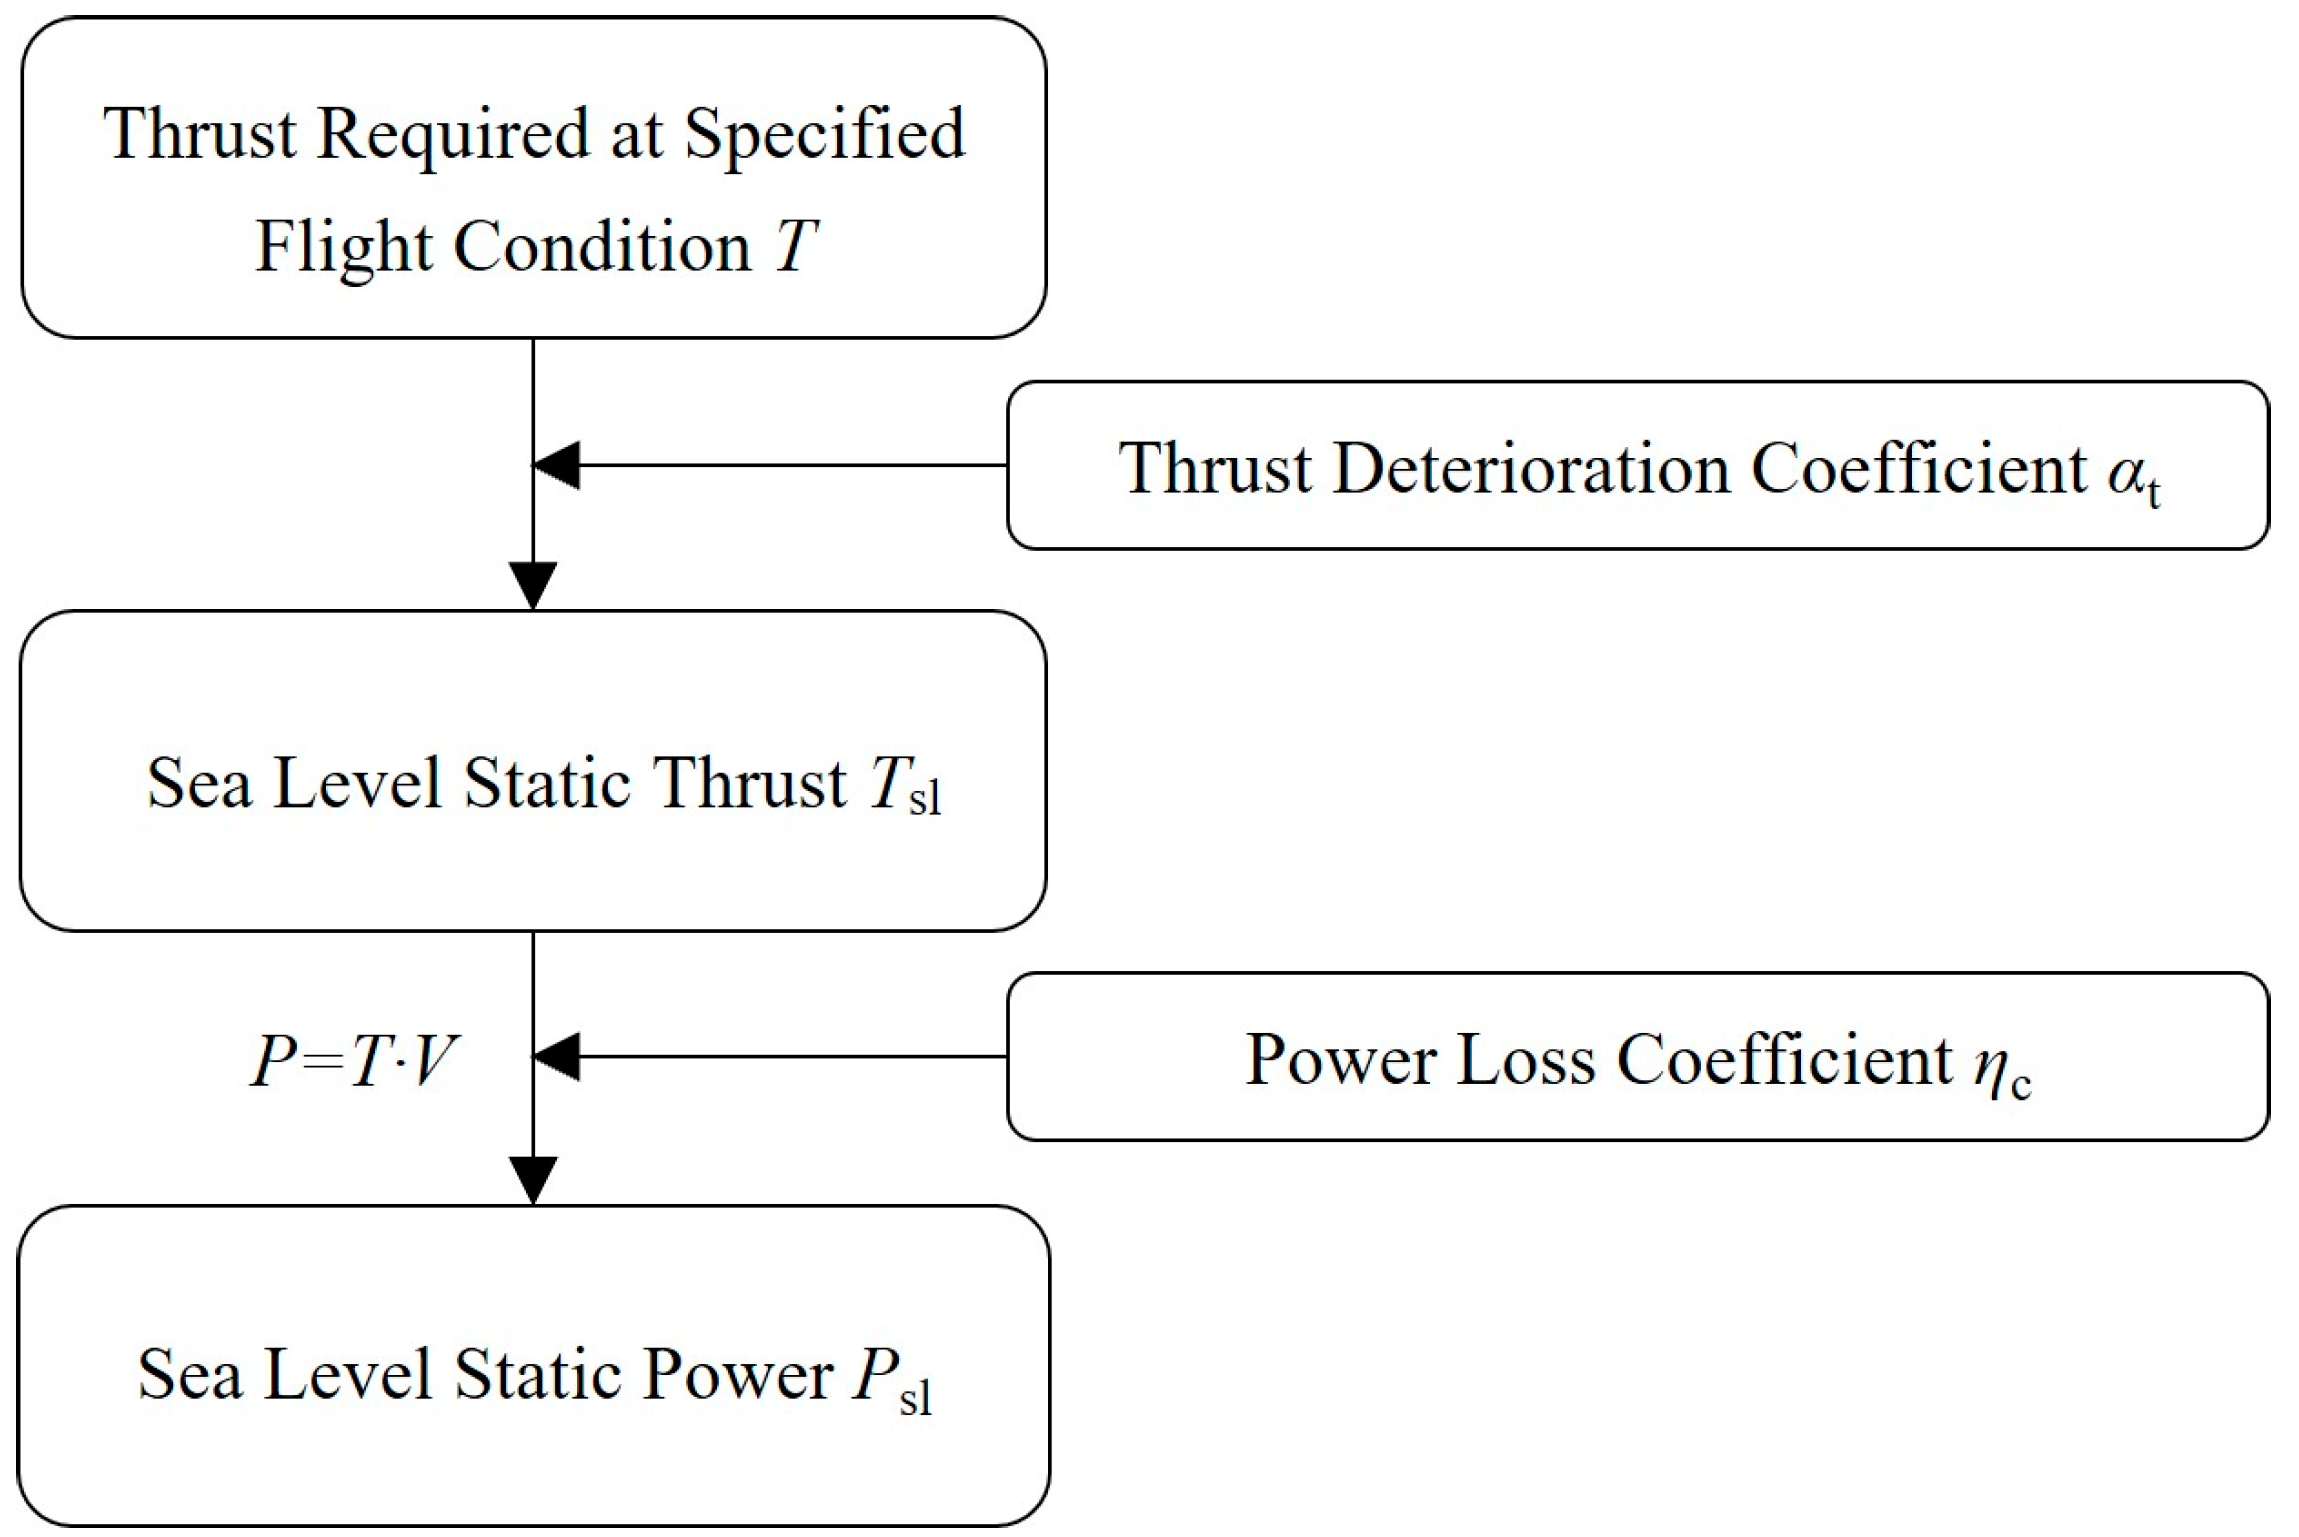
The thrust requirement for the HSVTOL in jet aircraft mode is directly converted using the thrust lapse ratio αt and is then transformed into a power requirement via Equation (14). This conversion process must account for the power loss coefficient ηc, associated with the engine mode transition. The specific procedure is illustrated in Figure 4.
P = T · V η c
For the HSVTOL in helicopter mode, the engine’s low-pressure shaft outputs shaft power to drive the rotors, eliminating the need for the aforementioned conversion. The power lapse ratio, denoted as αp, is determined based on the value of αt at the current flight condition. This power is then corrected using the power transmission efficiency ηt, and the rotor figure of merit (FM), as illustrated in Figure 5.
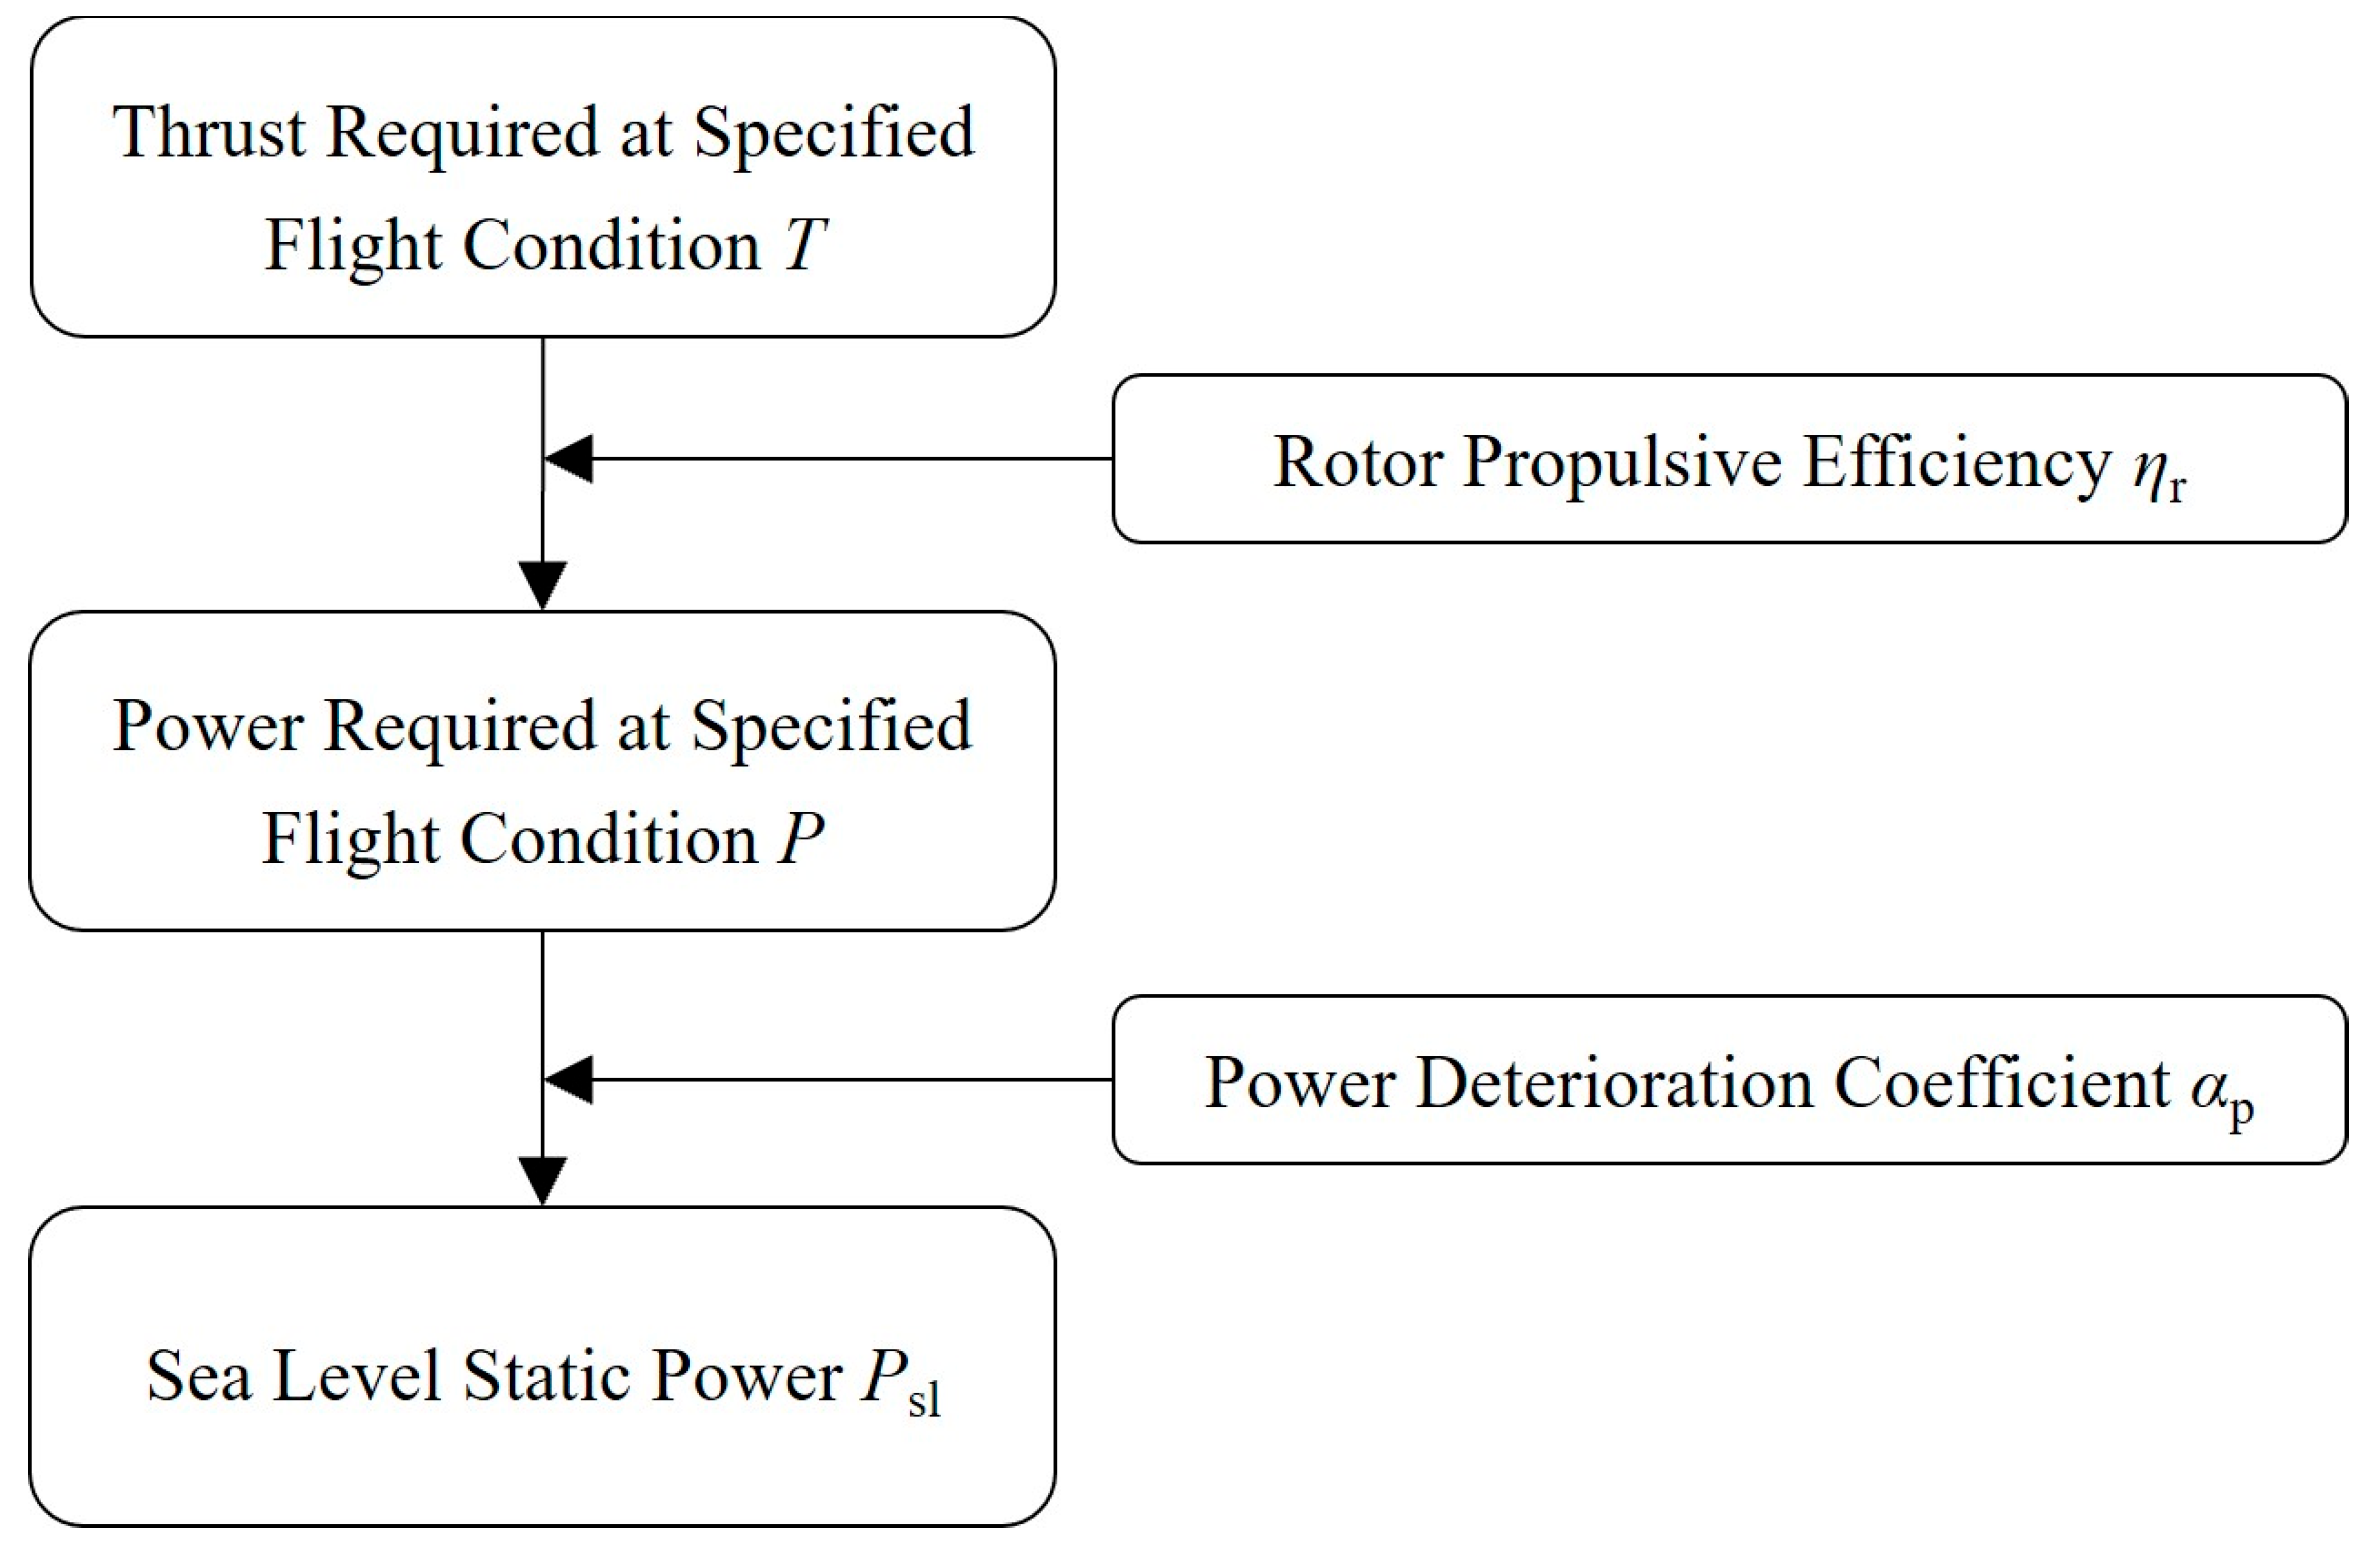
For the HSVTOL in propeller aircraft mode, the required thrust can be converted into power following the methodology of Equation (14). However, it is important to note that the power type in this mode is inherently shaft power; therefore, the process does not involve a “mode conversion.” Consequently, the conversion efficiency coefficient ηc in Equation (14) should be replaced by the rotor propulsive efficiency ηr. This adjusted power is then converted to the required engine sea-level static power Psl, using the power lapse ratio αp, as detailed in Figure 6.

4.2. Aerodynamic Parameters

The aerodynamic model of an aircraft is generally composed of parameters such as the maximum lift coefficient CLmax, the lift-to-drag ratio L/D, and the drag polar. The lift-drag characteristics are typically represented by the drag polar relationship:
C D   =   C D 0   +   K C L 2
where CD is the drag coefficient, CL is the lift coefficient, CD0 is the zero-lift drag coefficient, and K is the induced drag factor, which can be preliminarily estimated using Equation (16):
K   =   1 π · λ · e
where λ is the wing aspect ratio, which can be referenced from similar aircraft types, and e is the Oswald efficiency factor, generally taken as approximately 0.8 for most aircraft.
Additionally, in helicopter conceptual design, the parasite drag coefficient Cx (m2/N) is typically used to represent the overall drag characteristics of the aircraft [24]. At higher flight speeds, it becomes one of the primary factors influencing the total power required. Its value can be estimated based on CD0 and by referencing aircraft of similar class.
Finally, preliminary estimates of the rotor’s aerodynamic characteristics are also required. These include the lift-to-drag ratio C7 at the characteristic blade section (typically at 0.7R) and the rotor tip speed Vt, as both significantly impact the rotor profile power [25]. These parameters can be selected according to methods described in references [24,25,26,27] or by referencing data from tiltrotor aircraft of a similar class [11,12].

5. Performance Constraint Analysis

In the traditional aircraft design process, constraint analysis is typically employed to estimate the wing loading Wto/S and the thrust-to-weight ratio Tsl/Wto. This involves establishing constraint equations relating these two parameters based on flight mechanics and performance requirements and then selecting a suitable design point from the resulting constraint diagram. In the conceptual design of rotorcraft, the power loading Wto/Psl is often used as a key parameter instead [32], thereby establishing a relationship between the power required and flight performance [24,26].
Firstly, given that the HSVTOL possesses both helicopter and fixed-wing aircraft flight modes, the dimensions of both the rotor and the wing need to be designed simultaneously. Therefore, based on the fundamental principles of constraint analysis, this study first translates the performance requirements for the helicopter mode into a relationship between the power-to-weight ratio Psl/Wto (the inverse of power loading) and the rotor disk loading p. The rotor disk loading is defined as follows:
p   =   W to A   =   W to r · π R 2
where A is the rotor disk area; r is the number of main rotors; and R is the rotor radius.
Secondly, following the methodology outlined in Section 4.1, the thrust/power requirements for the fixed-wing aircraft mode are uniformly translated into a relationship between the power-to-weight ratio Psl/Wto and the wing loading Wto/S. Thereafter, functional curves of “power-to-weight ratio versus disk loading” and “power-to-weight ratio versus wing loading” for different flight modes and states are plotted, constituting a novel “constraint diagram for tiltrotor aircraft.”
Finally, a design point is selected within the feasible region of this constraint diagram. The resulting basic parameters—p, Wto/S, and Psl/Wto—will simultaneously satisfy the performance requirements for all flight conditions of the HSVTOL.

5.1. Helicopter Mode

Rotorcraft aerodynamic theory establishes that the power required Pre, in helicopter mode is primarily composed of induced power Pi, profile power Ppr, and parasite power Ppa [25,26,27], as given by the equation:
P re   =   P i   +   P pr   +   P pa
Based on the mission phase definitions provided in Section 2, the performance constraints for the HSVTOL in helicopter mode are selected as follows: the vertical take-off requirement, the hover ceiling Hh, the maximum rate of climb Vh_ymax, the maximum forward flight speed Vh_xmax, and the minimum disk loading pmin.
  • Vertical Take-off Requirement
During vertical take-off, which corresponds to the maximum take-off weight condition, and accounting for both vertical augmentation weight and ground effect, the relationship between the power-to-weight ratio (in kW/kg) and the disk loading p (in kg/m2) is expressed as:
P sl W to   =   k v β g 1000 α p η t τ 3 k p V t 4 k t k b C 7   +   ζ k i gp 2 k b ρ
where g is the acceleration due to gravity, typically taken as 9.8 m/s2; β is the weight fraction, calculated based on the aircraft weight corresponding to the current mission phase from Section 3.2, i.e., β = Wi/Wto; kv is the vertical thrust augmentation factor during take-off, generally taken as approximately 1.2; τ represents the engine throttle setting; kp is the profile power correction factor, for commonly used rectangular blades, kp ≈ 1; Vt is the rotor tip speed, considering tip shock waves and noise limitations, typically Vt = 210~240 m/s; kt is the thrust correction factor, representing the non-uniform distribution of rotor thrust along the blade, generally kt = 0.95~0.98; kb is the blade tip loss factor, usually kb = 0.9~0.94; C7 is the lift-to-drag ratio at the characteristic blade section (at 0.7R); ki is the induced power correction factor, typically ki = 1.05~1.10; ρ is the air density at the current altitude (in kg/m3); ζ is the correction factor for induced power accounting for ground effect, given by the formula:
ζ   =   1 0.9926   +   0.03794 2 R / h 2
where R is the rotor radius and h is the height above ground. However, during the estimation of basic parameters, the disk loading is an output variable, and R must be derived from the disk loading. Under these circumstances, the value of ζ cannot be directly calculated. Therefore, while R remains undetermined, ζ ≈ 0.85 [11,12].
2.
Hover Ceiling
The hover ceiling is categorized into in-ground-effect (IGE) and out-of-ground-effect (OGE) conditions. Since accounting for ground effect requires correcting the induced power using Equation (20), and the OGE hover condition generally imposes a higher power demand on the engine, this analysis considers only the OGE hover case. The relationship between the power-to-weight ratio and the disk loading under this condition is given by:
P sl W to   =   β g 1000 α p η t τ FM 3 k p V t 4 k t k b C 7   +   k i gp 2 k b ρ
where FM is the figure of merit, which can be selected based on statistical data [7,26,27,33]; ρ is the air density at the hover ceiling altitude Hh (in m); the remaining variables are consistent with those defined in Equation (19).
3.
Maximum Rate of Climb
The excess power available from the engine, beyond the minimum power required for hover, is converted into a climb rate. The relationship between the power-to-weight ratio and the disk loading required to achieve the maximum rate of climb Vh_ymax (in m/s) is given by:
P sl W to   =   β g 1000 α p η t τ V h _ ymax   +   3 k p V t 4 k t k b C 7   +   k i 2 ρ k b v 0   +   ρ C x v 0 3 2 · gp 3 4
where
v 0 = k i 3 ρ 2 k b C x 4
4.
Maximum Forward Speed
As flight speed increases, the profile power remains relatively stable, while the parasite power increases significantly and the induced power continuously decreases. Since the induced power is solely influenced by the disk loading, its impact on the power-to-weight ratio becomes relatively minor at high forward speeds. Therefore, when calculating the performance constraint for the maximum forward speed, the power-to-weight ratio can be approximated as a constant:
P sl W to   =   β g 1000 α p η t τ 3 k p V t 4 k t k b C 7   +   ρ C x V h _ xmax 3 2
where Vh_xmax is the maximum forward flight speed in helicopter mode (in m/s), and Cx is the equivalent flat plate drag area of the aircraft.
5.
Minimum Disk Loading Constraint
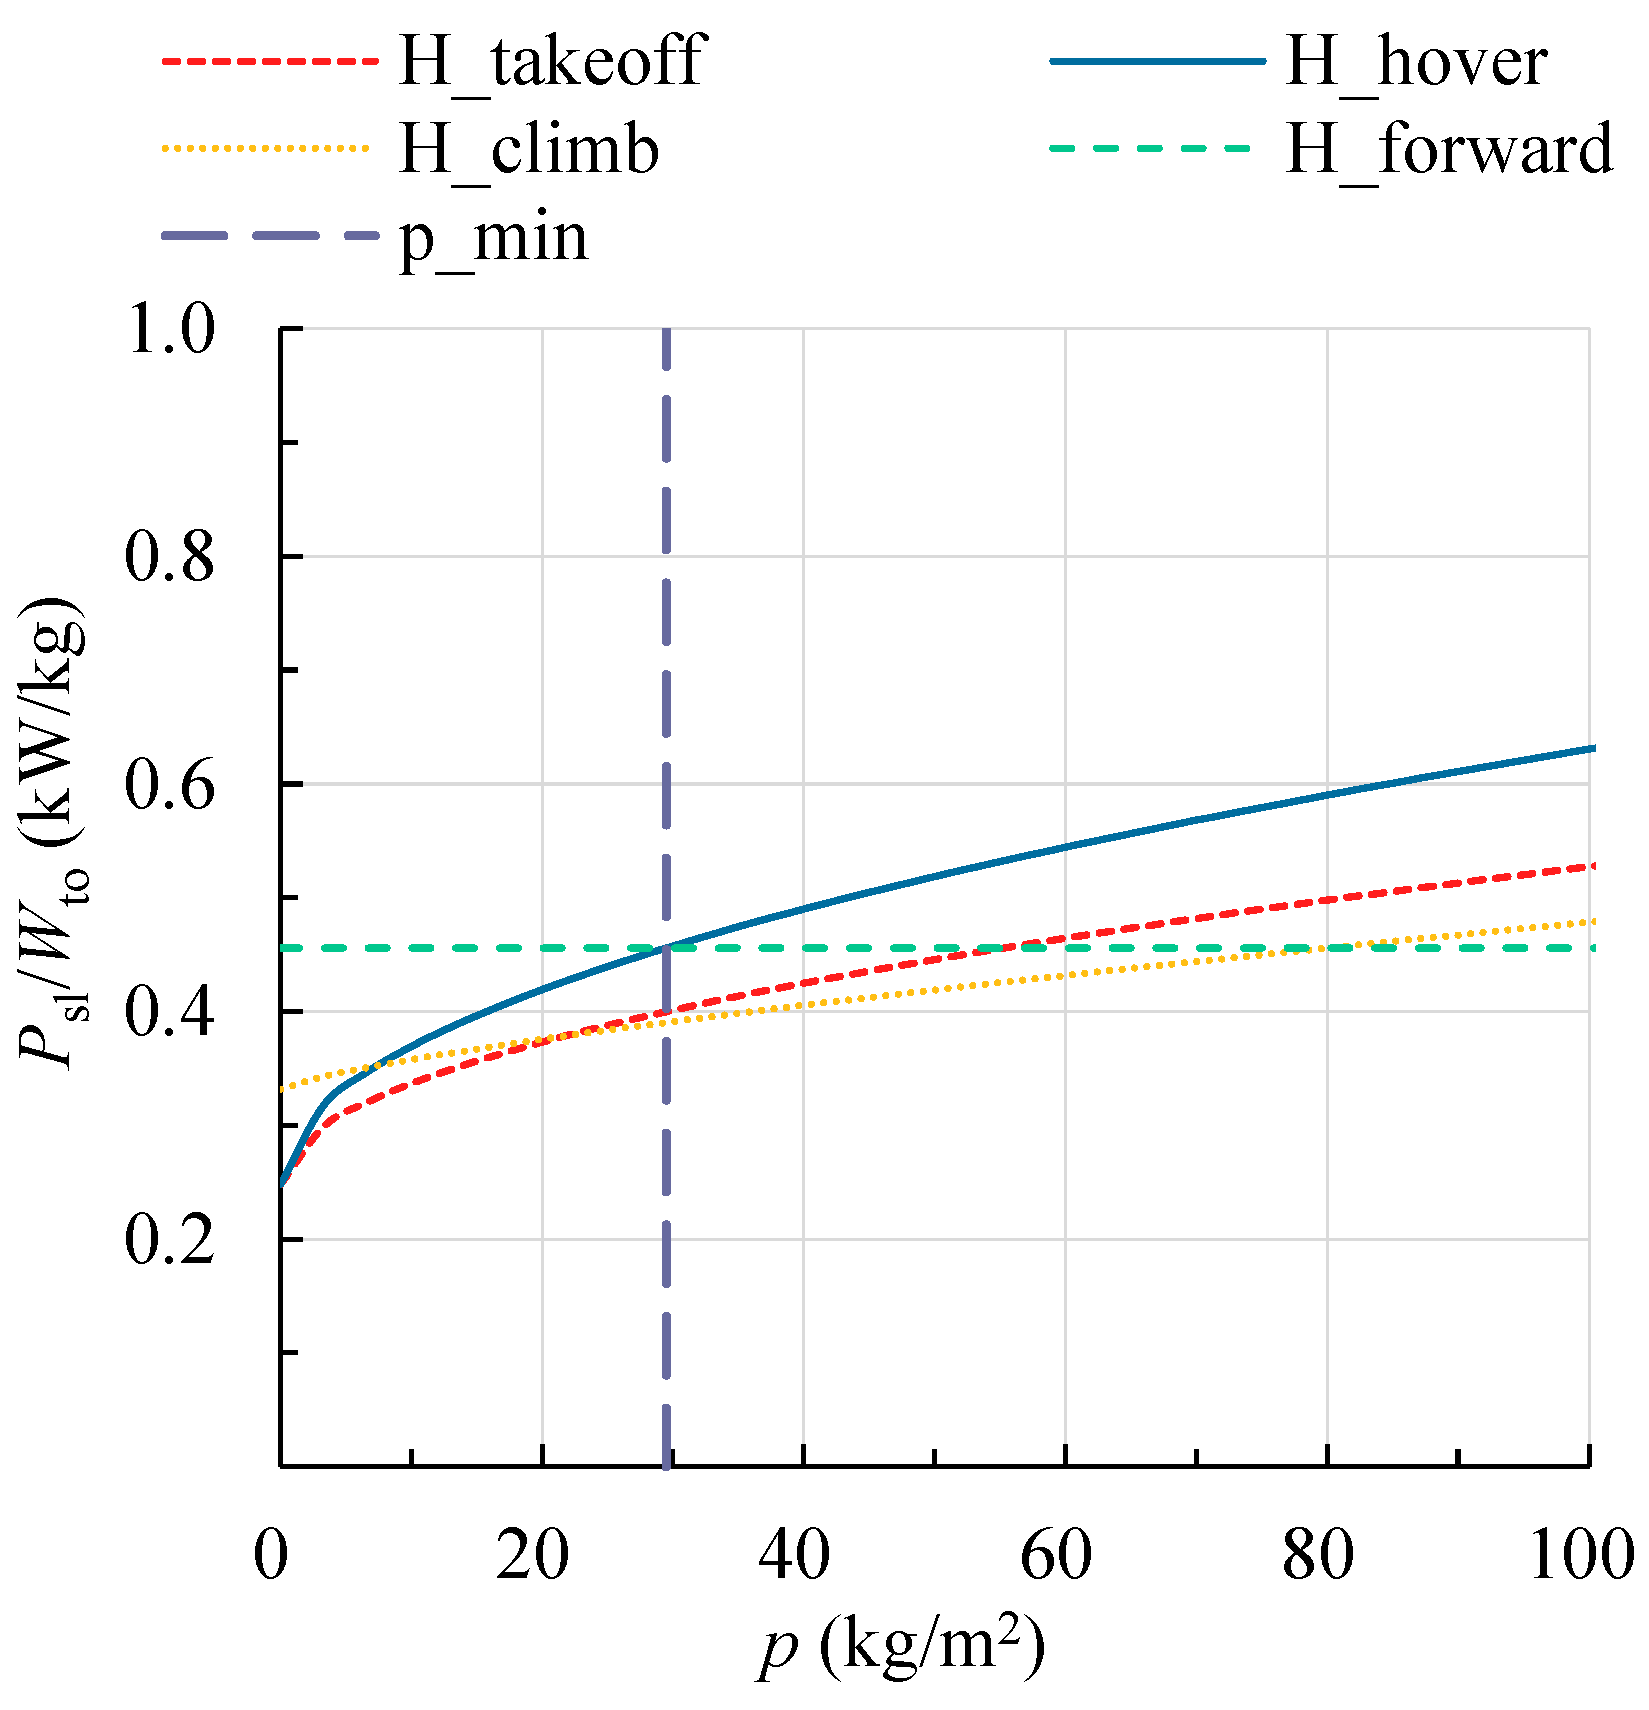
By treating the aforementioned performance requirements as constraints, a constraint diagram of power-to-weight ratio versus disk loading for the HSVTOL in helicopter mode can be plotted, as shown in Figure 7. In this diagram, the curve corresponding to the maximum forward speed, labeled “H_forward”, intersects the curves for the vertical take-off requirement (“H_takeoff”), the hover ceiling (“H_hover”), and the maximum rate of climb (“H_climb”). The leftmost intersection point defines the minimum disk loading requirement, pmin. The selected disk loading must satisfy ppmin, with the horizontal coordinate of this point serving as the boundary. The rationale is as follows: if a disk loading value to the left of pmin is selected, the required power-to-weight ratio would be dictated by the Vh_xmax requirement. This implies that the engine power would need to be greater than that required at pmin. Since engine weight does not decrease with increasing power, and assuming a constant rotor disk area, the total aircraft weight would decrease as p decreases. However, this would result in a remaining useful load that is necessarily less than the payload weight achievable when selecting pmin. This outcome is clearly suboptimal. Therefore, the selected disk loading should not be less than pmin.
In summary, within the “power-to-weight ratio versus disk loading” constraint diagram, the feasible region is defined as the area bounded above by the “H_takeoff”, “H_hover”, “H_climb”, and “H_forward” curves, and to the right of the “p_min” vertical boundary. Selecting a design point within this feasible region ensures that the performance requirements for the HSVTOL in helicopter mode are satisfied.

5.2. Fixed-Wing Aircraft Mode

The HSVTOL’s fixed-wing aircraft mode comprises both propeller aircraft mode and jet aircraft mode. While the underlying principles of performance constraint analysis for both are identical, they differ solely in the power conversion process, which has already been elaborated in Section 4.1. This section details the constraint analysis procedure specifically for the jet aircraft mode. Based on flight dynamics, the governing equations for the fixed-wing aircraft mode are established and subsequently transformed into functional relationships between the power-to-weight ratio (in kW/kg) and the wing loading (in kg/m2):
P sl W to   =   gV 1000 α t η c τ gK n 2 β 2 q · W to S   +   C D 0 q g W to / S   +   β P s V
where
    n = 1 + V 2 g R loiter 2
q = 1 2 ρ V 2
where V is the flight speed (in m/s); n is the load factor, with n = 1 for steady level flight; Rloiter is the turning radius (in m); q is the dynamic pressure; Ps is the specific excess power (rate of change of energy height); the remaining variables and units are consistent with those defined previously.
Based on the mission definitions, the following performance metrics are selected as constraints for the fixed-wing aircraft mode: the maximum rate of climb Vj_climb, the turning (or loiter) radius Rloiter, the cruise speed Vcruise, the maximum flight speed Vj_max, and the stall speed Vj_min. Since the HSVTOL employs vertical take-off and landing, the take-off and landing performance requirements specific to the fixed-wing mode are not considered.
  • Maximum Rate of Climb
Under steady climb conditions where dH/dt > 0, dV/dt = 0, and n ≈ 1, Equation (25) simplifies to:
P sl W to   =   gV 1000 α t η c τ gK β 2 q · W to S   +   C D 0 q g W to / S   +   β V j _ climb V
2.
Turning (or Loiter) Radius
During steady, level turning flight (loiter), where dH/dt = 0, dV/dt = 0, and n > 1, Equation (25) simplifies to:
P sl W to   =   gV 1000 α t η c τ gK n 2 β 2 q · W to S   +   C D 0 q g W to / S
3.
Cruise Speed
Under steady-level flight conditions where dH/dt = 0, dV/dt = 0, and n = 1, Equation (25) simplifies to:
P sl W to   =   g V cruise 1000 α t η c τ gK β 2 q · W to S   +   C D 0 q g W to / S
where Vcruise is the cruise speed (in m/s), which can be directly specified as an input parameter or derived from the cruise Mach number.
4.
Maximum Flight Speed
The calculation method for the maximum flight speed is identical to that for the cruise speed. The flight altitude is set according to the actual requirements, and Vcruise in Equation (30) is replaced by Vj_max. The required power-to-weight ratio is then determined.
5.
Stall Speed
To ensure a smooth tilt transition, the stall speed in fixed-wing aircraft mode should be significantly lower than the maximum forward flight speed in helicopter mode. Considering a safety margin [34], the relationship can be set as 1.15Vj_minVh_xmax. The stall speed determines the maximum allowable value of the wing loading, with their relationship given by:
W to S max   =   1 2 g β C Lmax ρ V j _ min 2
where CLmax is the maximum lift coefficient of the clean wing configuration estimated in Section 4.2.
For the propeller aircraft mode, the control Equation (25) is adapted by substituting αt with αp and ηc with ηr, following the methodology outlined in Section 4.1. The remaining procedure is consistent with that of the jet aircraft mode.

5.3. Comprehensive Constraint Analysis

Based on the established constraint equations for both the helicopter mode and fixed-wing aircraft mode of the HSVTOL, a comprehensive analysis is further conducted.
For fixed-wing aircraft, drag increases sharply with flight speed. To achieve a higher lift-to-drag ratio, a smaller wing area and consequently larger wing loading are typically required. In contrast, helicopters require a larger rotor disk area and smaller disk loading to avoid excessive downwash velocity during hover [24]. Since the HSVTOL incorporates characteristics of both, the design requirements for its wing and rotor may conflict due to these constraints. To address this, this study proposes linking the wing area S and the rotor disk area A, thereby facilitating a trade-off between their values during the conceptual design of the basic parameters.
For tiltrotor aircraft configurations, various interactions, including geometric and aerodynamic effects, occur between the rotor and the wing, which may adversely affect both hover and cruise performance simultaneously [19]. During the conceptual design phase, the primary concern is to prevent geometric interference between components. As shown in Figure 8, let R be the rotor radius, w be the width of the fuselage at the wing root, and b be the wingspan. Defining f = w/b, with a typical value of 0.15 [6], the condition for unobstructed rotor tilting can be expressed as:
1 f · b     2 R
Based on the definitions of rotor disk area A and wing aspect ratio λ:
A   =   2 π R 2
λ = b 2 S
Substituting into Equation (32) yields:
S A     2 π 1 f 2 λ
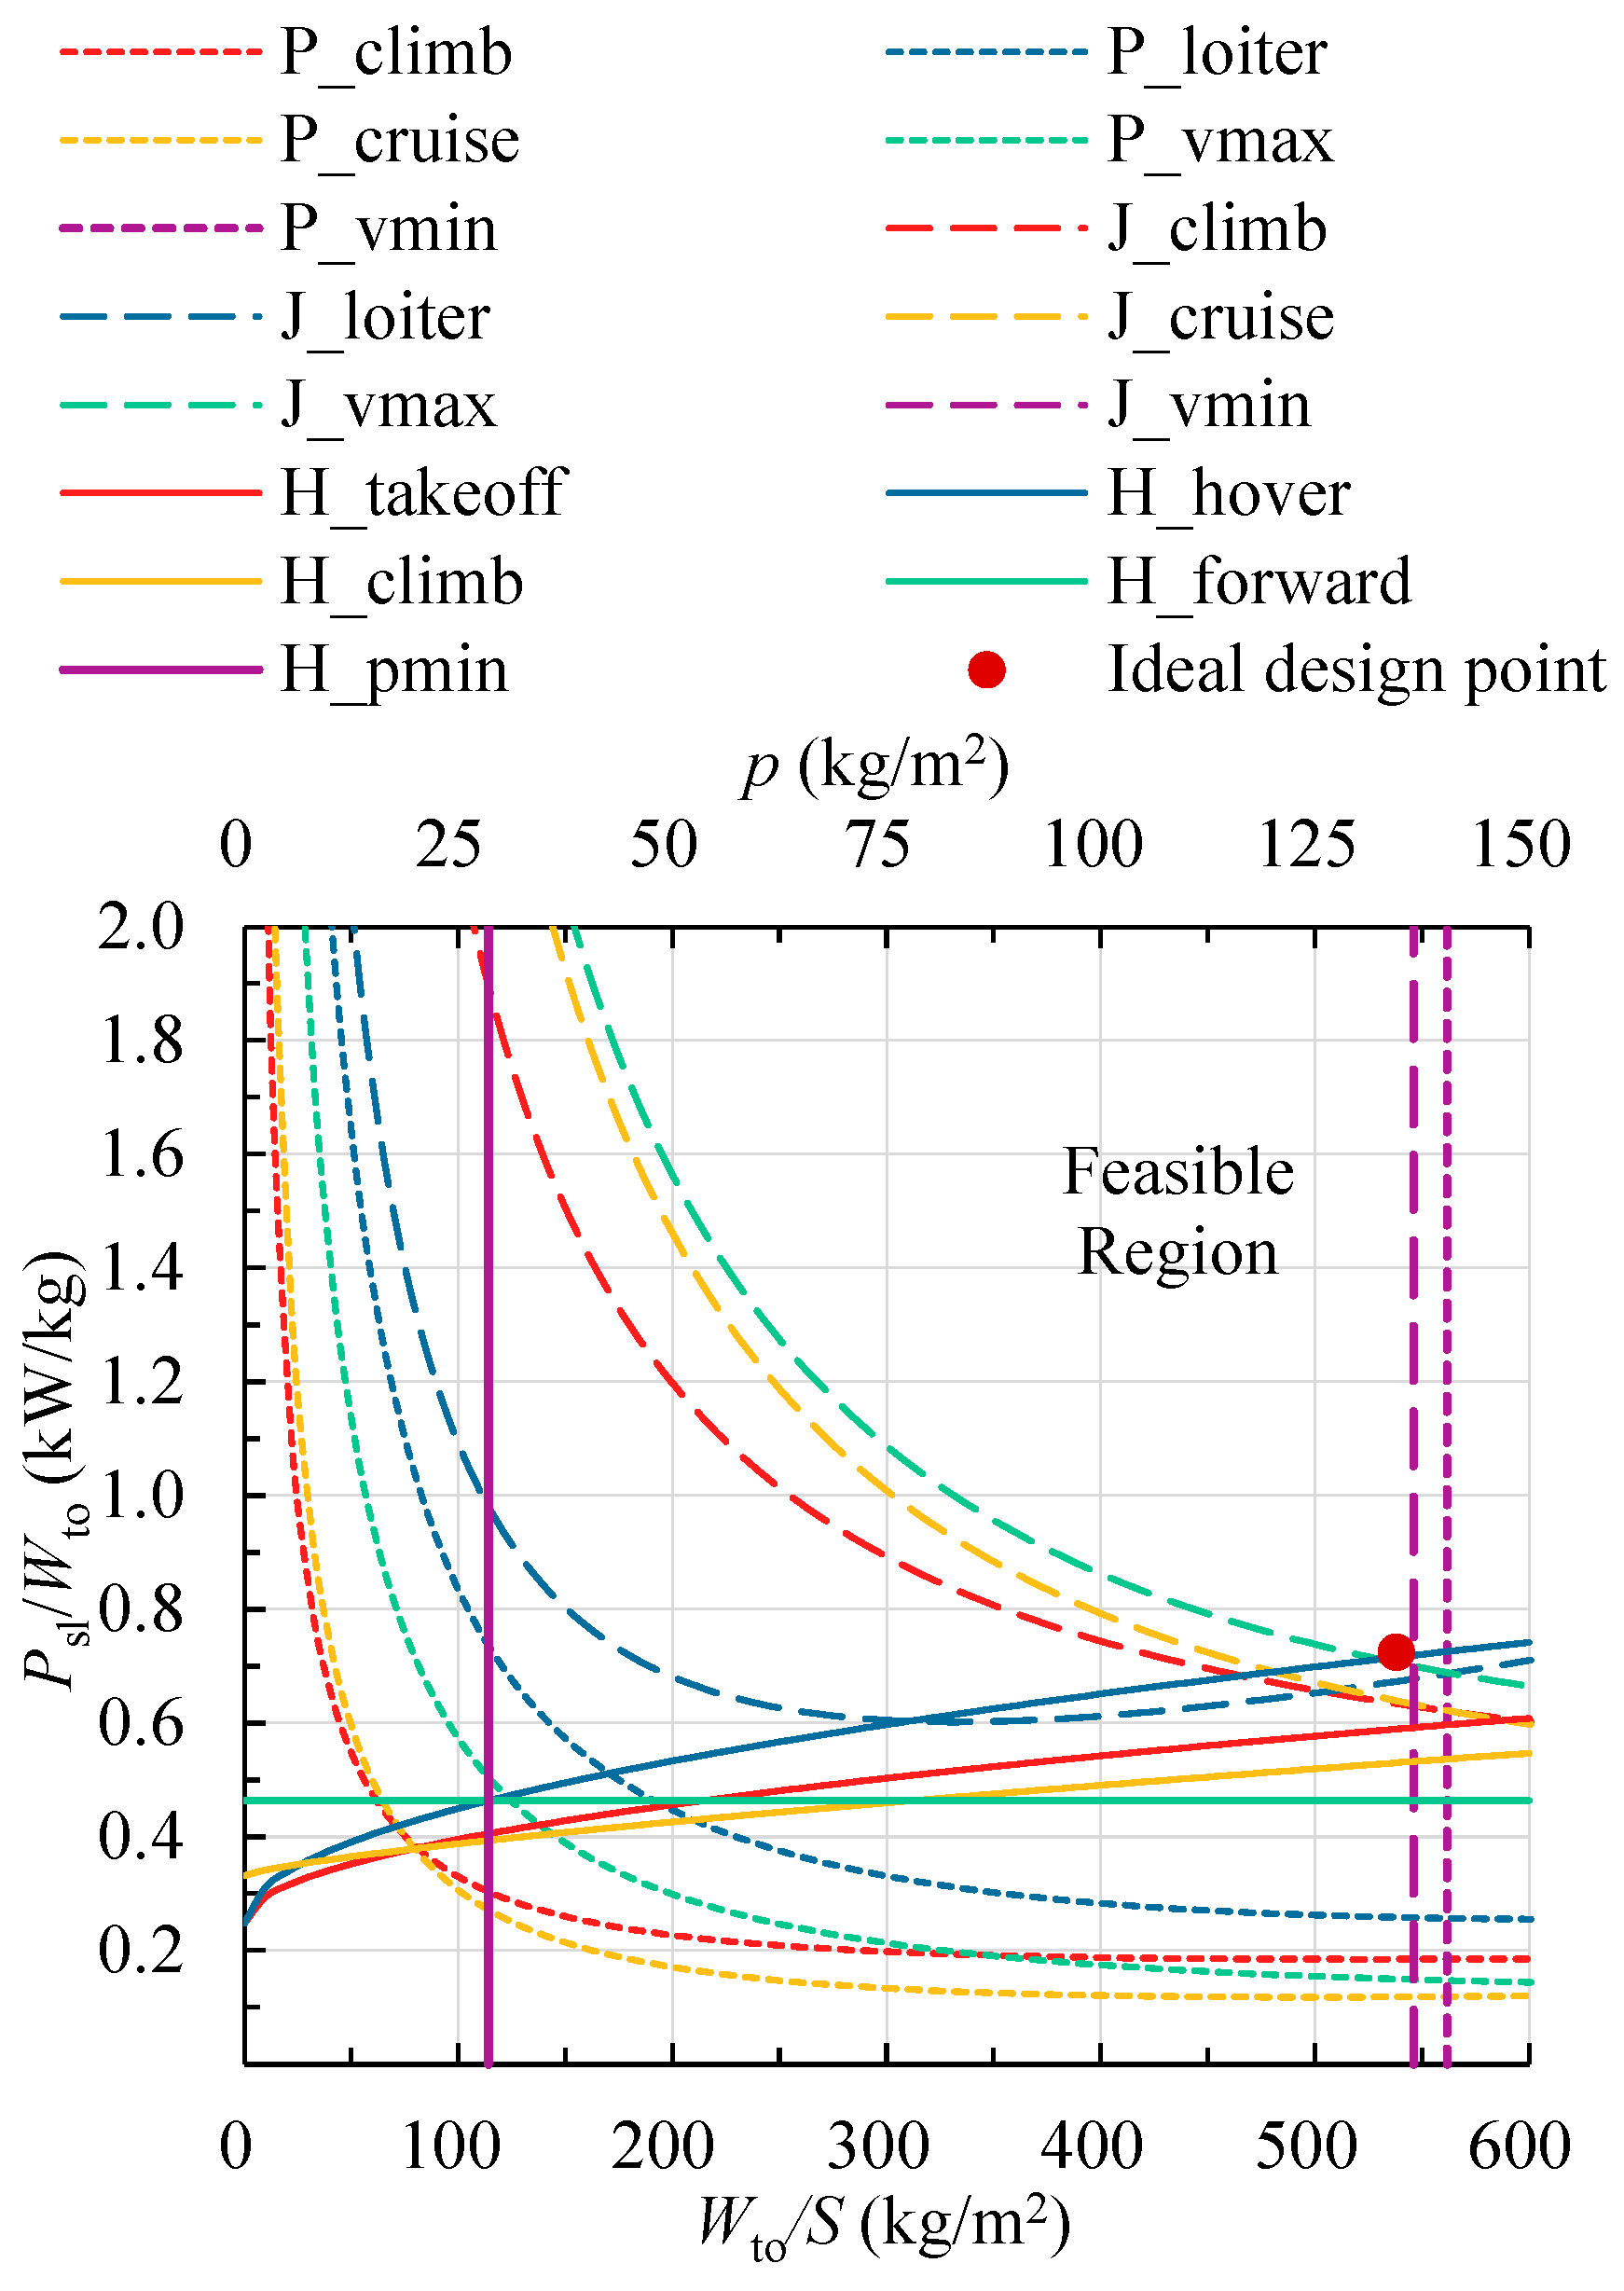
Equation (35) indicates that the ratio of wing area to rotor disk area is constrained by a lower limit. Similarly, the selected values of disk loading p and wing loading Wto/S are subject to a corresponding limiting relationship, thereby establishing the connection between the basic parameters of the different flight modes of the HSVTOL. Following the constraint analysis procedures outlined in Section 5.1 and Section 5.2, constraint curves for the various performance requirements across the different flight modes are plotted. By introducing S/A as an input variable to control the scale of the primary and secondary horizontal axes, the constraint diagram for the HSVTOL can be generated, as illustrated in Figure 9. In this diagram, the primary horizontal axis (bottom) represents wing loading, the secondary horizontal axis (top) represents disk loading, and the vertical axis represents the power-to-weight ratio. The labels “H”, “P”, and “J”, respectively, denote the helicopter, propeller aircraft, and jet aircraft modes. The region bounded by the various performance constraint curves constitutes the feasible design space. Selecting a design point within this feasible region yields corresponding values of Wto/S, p, and Psl/Wto. Based on the maximum take-off weight calculated in Section 3, the required engine power at sea-level static conditions, Psl, can be determined. An engine designed to deliver this Psl will satisfy all the flight performance requirements of the HSVTOL.
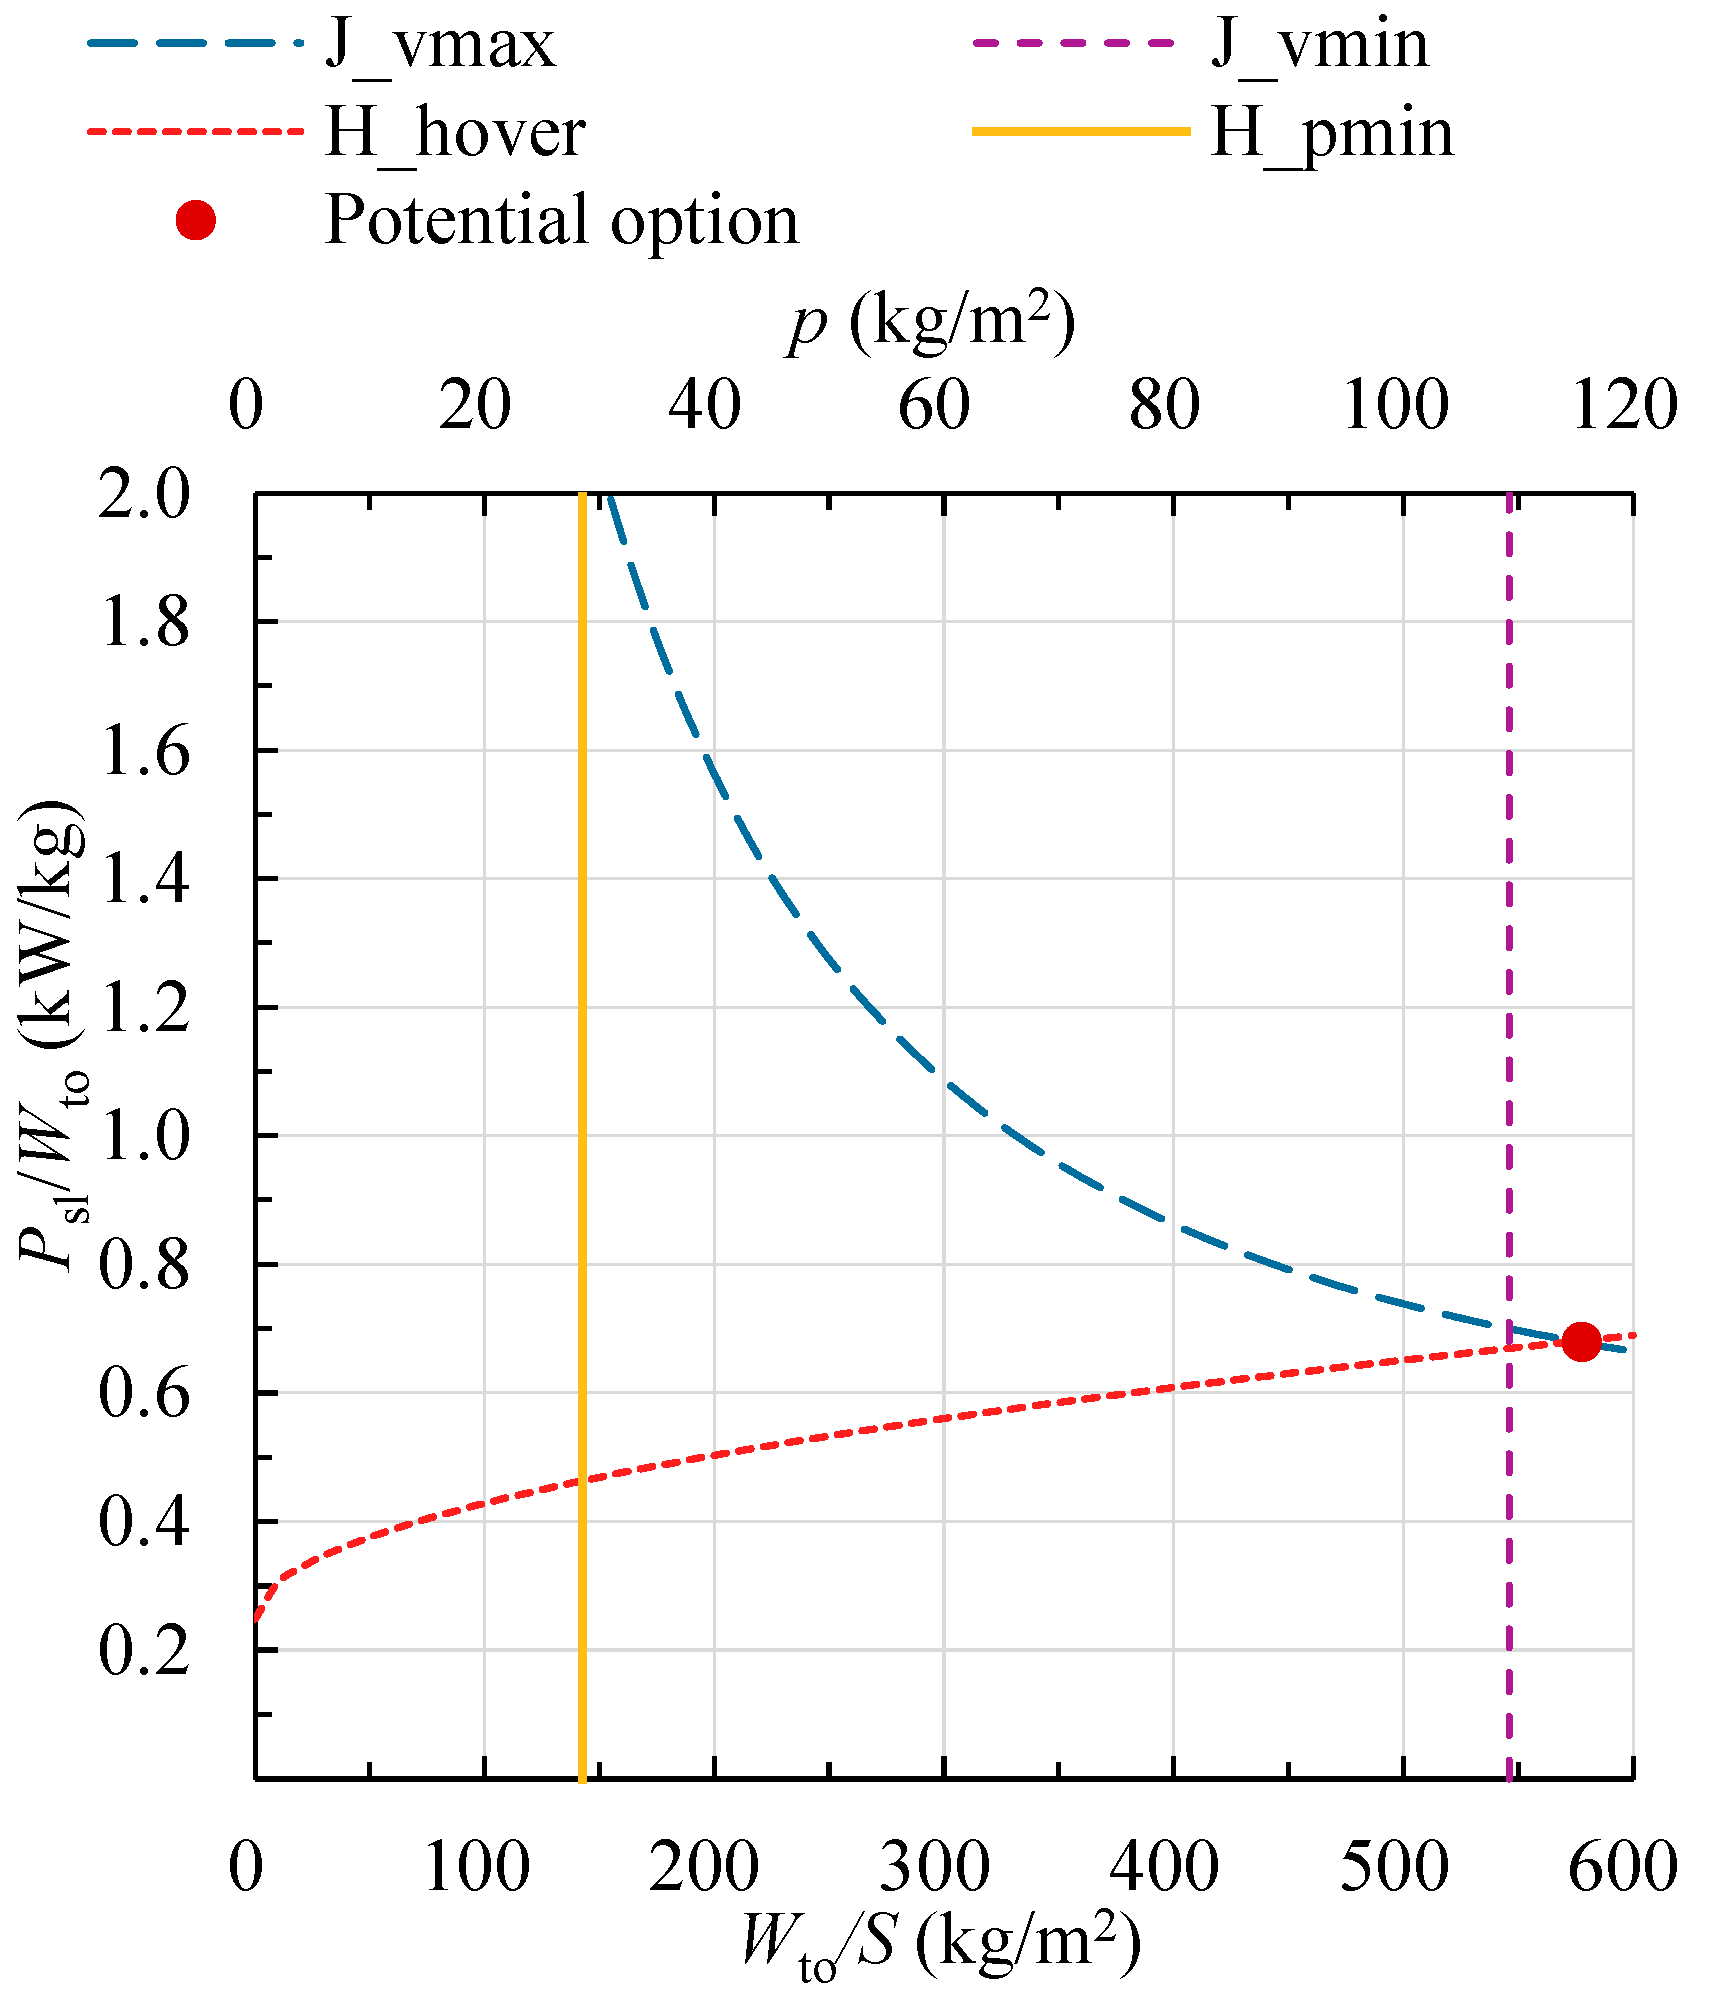
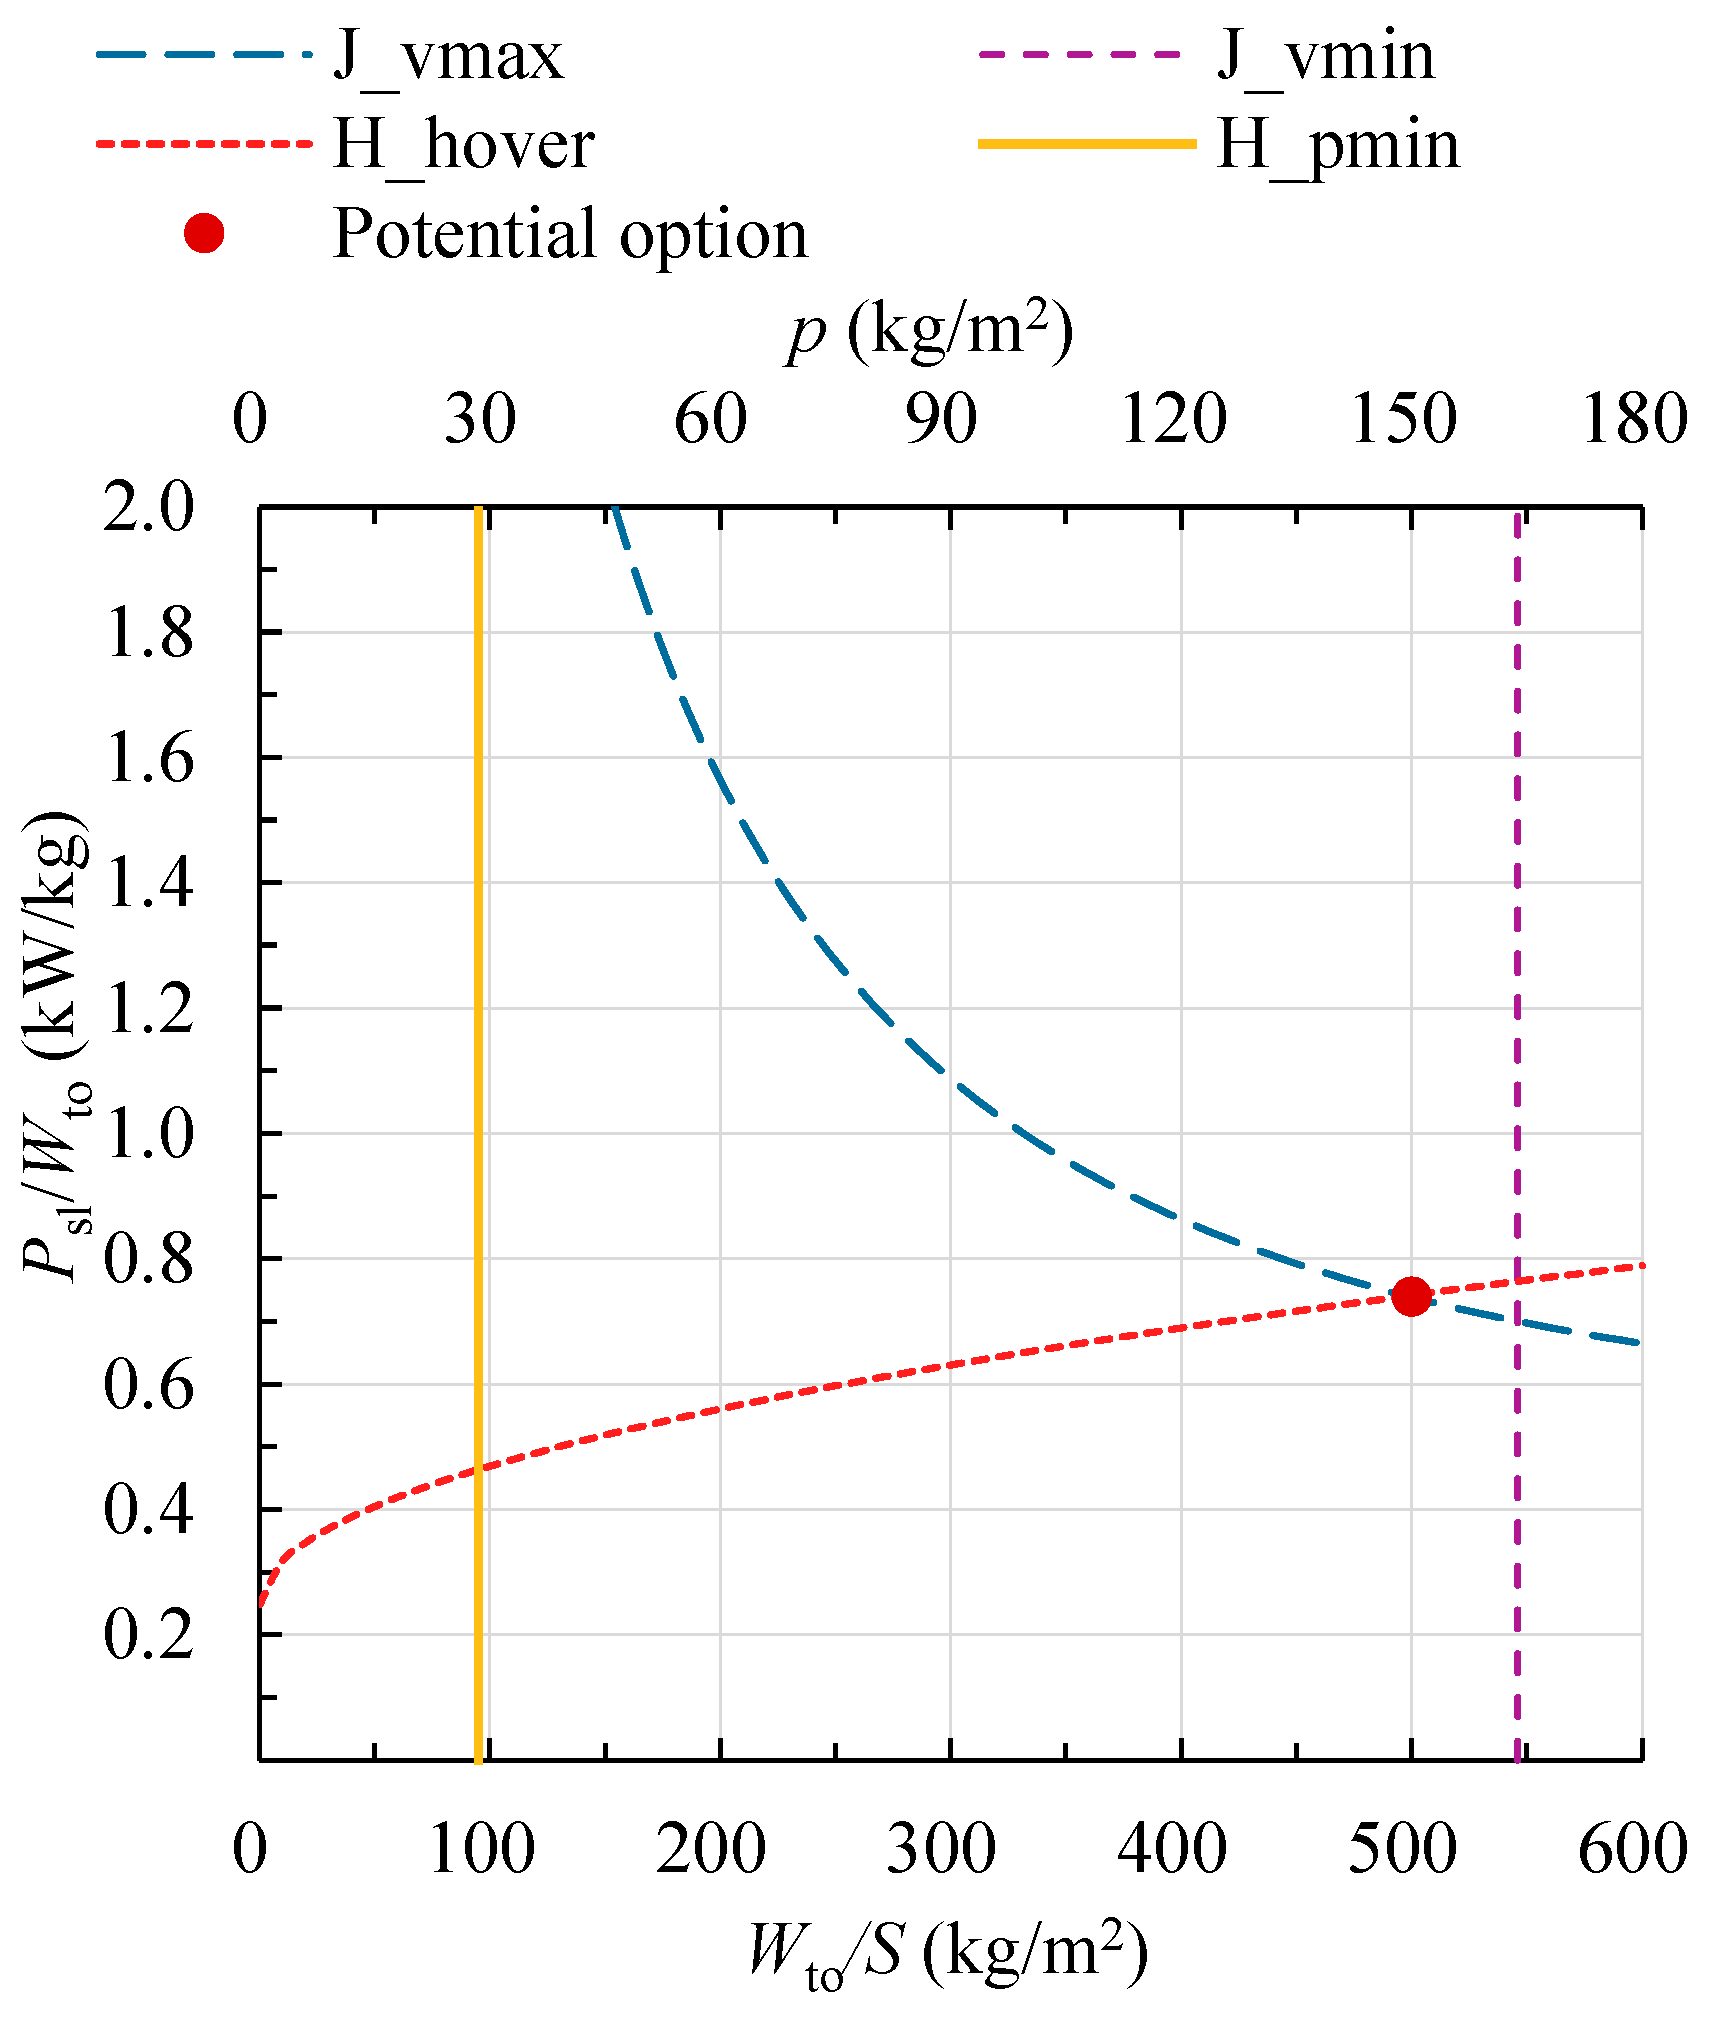
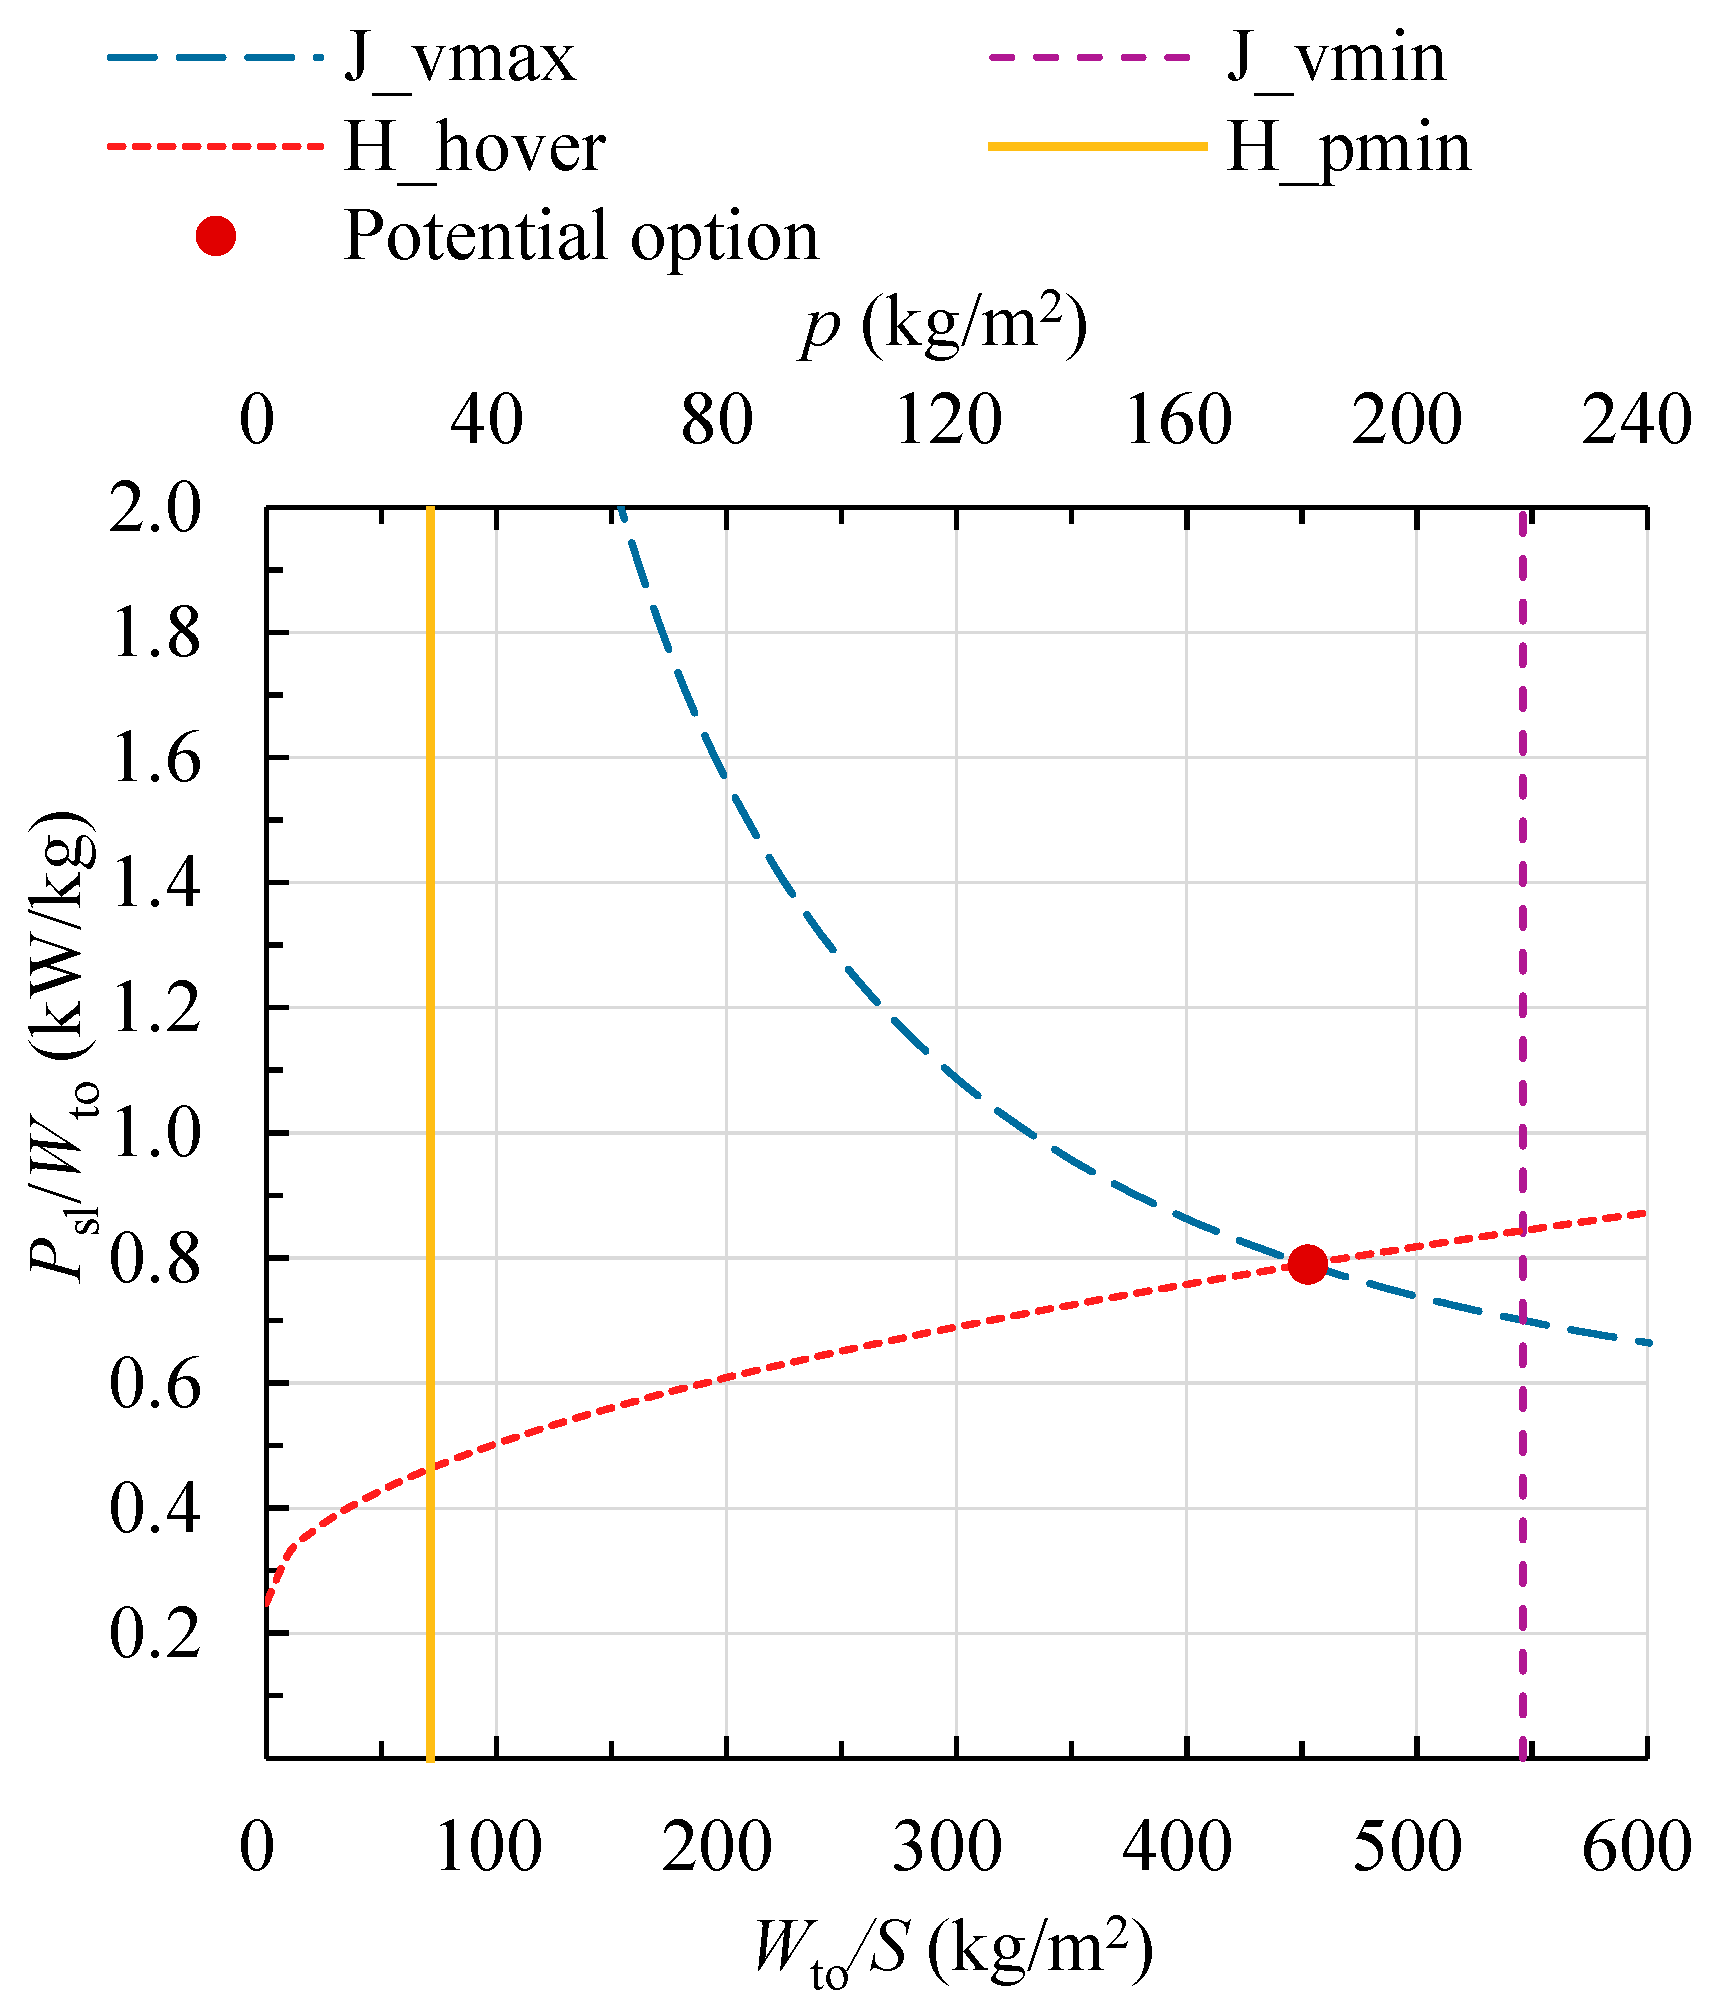
Typically, in a constraint diagram, there is a preference for selecting a design point with a lower power-to-weight ratio and a higher wing loading. A smaller power-to-weight ratio implies lower required power/thrust, leading to a smaller engine size. A higher wing loading means a smaller wing area and lower induced drag, which is beneficial for reducing structural weight and cost. In practice, the S/A ratio is a crucial parameter influencing the selection of the design point. Using Figure 9 as an example, the “Ideal design point” is located at the intersection of the most demanding constraint curves, “H_hover” and “J_vmax”, as this represents the minimum power-to-weight ratio required to meet the performance specifications. However, this point must also lie within the regions defined by the minimum disk loading (“H_pmin”) and the maximum wing loading (“J_vmin”) constraints. By retaining these four primary constraint curves and removing the others, different constraint diagrams can be generated by varying the S/A value, as shown in Figure 10, Figure 11 and Figure 12. The analysis reveals that while the primary horizontal axis (wing loading) scale remains fixed, the maximum value on the secondary horizontal axis (disk loading) increases with S/A. Furthermore, the constraint curves for helicopter mode tend to shift and compress towards the left. From the sole perspective of achieving the minimum power-to-weight ratio, the “Potential option” shifts towards the upper left as S/A increases. This corresponds to a decrease in wing loading, an increase in disk loading, and an increase in the power-to-weight ratio. In the sequence from Figure 10 to Figure 12, where S/A increases from 0.2 to 0.4, the power-to-weight ratio of the potential design point increases from 0.68 to 0.79 kW/kg. This indicates that a smaller S/A ratio leads to lower engine power requirements and is more favorable for wing sizing. However, the S/A value cannot be arbitrarily small. It must satisfy both the geometric constraint given by Equation (35) and the maximum wing loading limitation. As shown in Figure 10, the “Potential option” lies outside the feasible region and is therefore invalid. In this case, a design point must be selected within the feasible region according to the jet mode performance requirements, resulting in a higher power-to-weight ratio and consequently creating excess power margin for the helicopter mode.
The S/A ratio, as a key input parameter, should be selected during conceptual parameter design according to the following rationale: under the premise of satisfying the geometric constraint and the maximum wing loading limitation, the value of S/A should be made as small as possible. This allows the intersection point corresponding to the minimum achievable power-to-weight ratio to be positioned exactly on the right boundary of the feasible region, as illustrated by the “Ideal design point” in Figure 9. This approach minimizes the power demand on the engine and concurrently favors a reduced wing area, thereby enhancing cruise efficiency. Subsequently, a final design point is selected within the feasible region near the “Ideal design point,” maintaining appropriate margins from the various constraint boundaries. The introduction of the S/A parameter establishes the critical link between the wing and the rotor, enabling the conceptual parameter design for both helicopter and fixed-wing aircraft characteristics to be conducted within a unified framework.
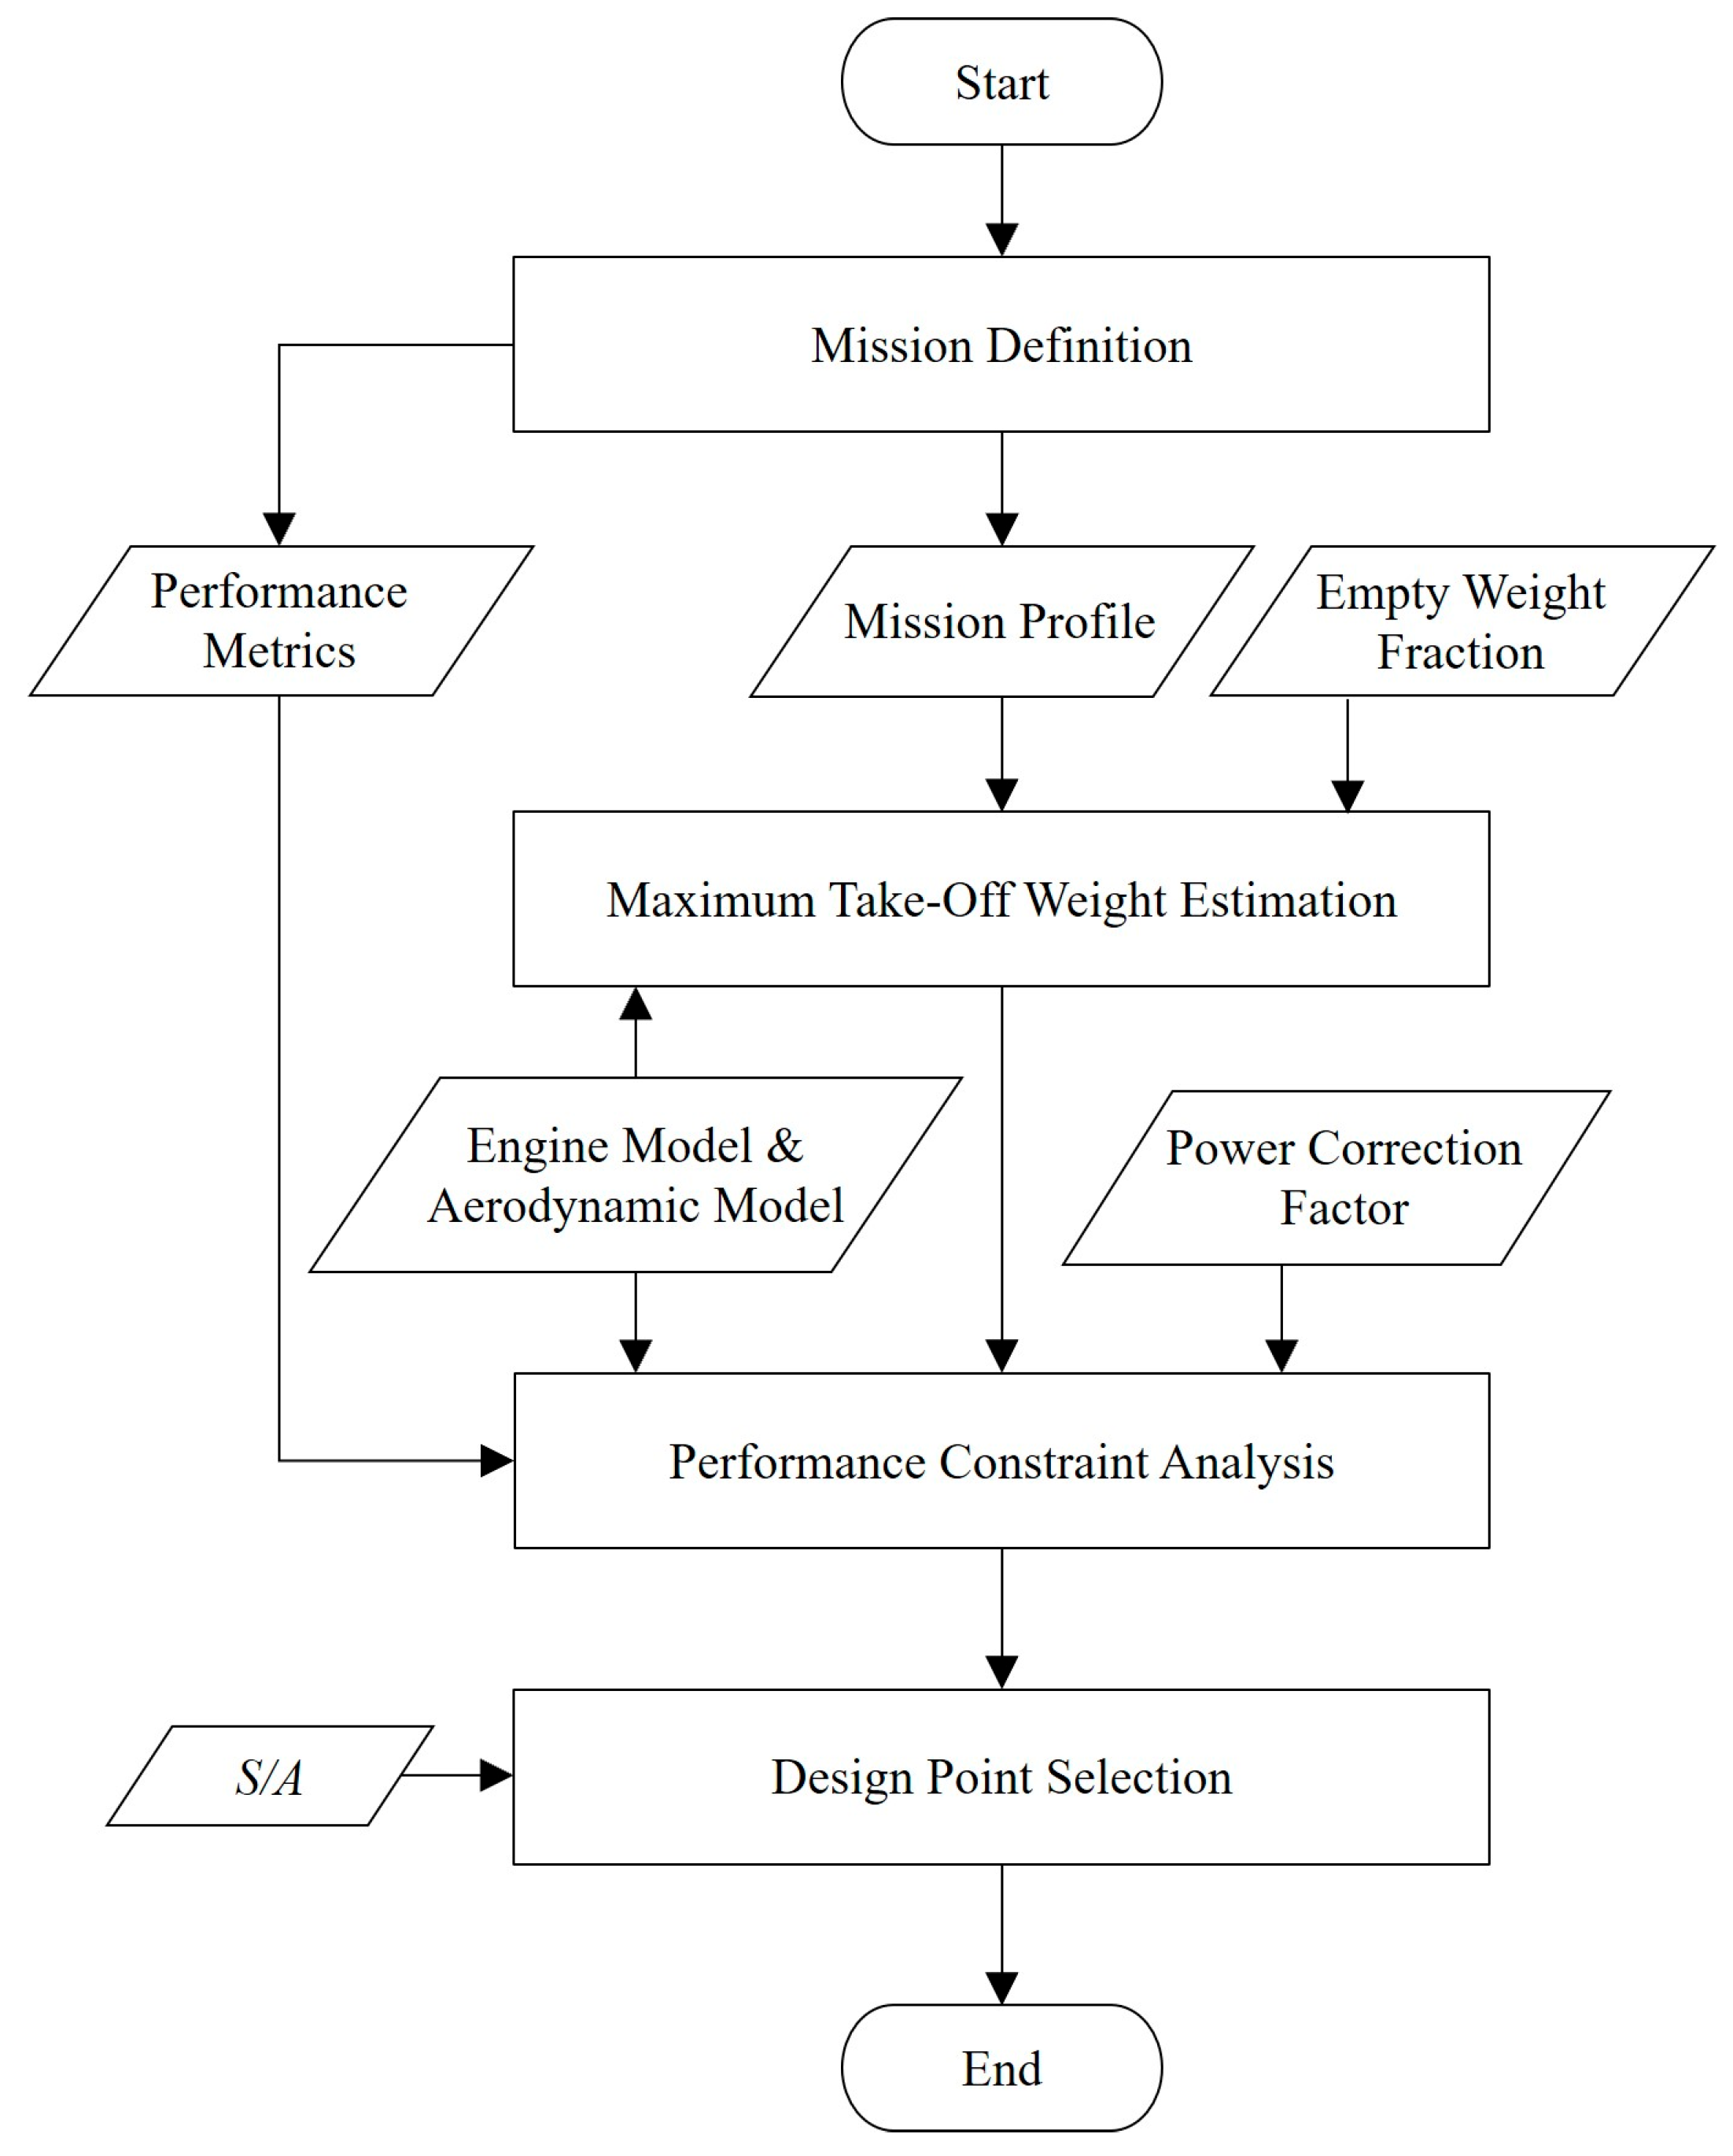
In summary, the workflow of the HSVTOL basic parameter estimation methodology established in this study is depicted in Figure 13. The process begins with mission definition and proceeds step-by-step through the conceptual design work. Input parameters include preliminary estimates for the empty weight fraction, engine model, aerodynamic model, power correction coefficients, etc., along with the key parameter S/A. Transfer parameters encompass the mission profile and performance metrics, representing the flow of information and data between modules. For instance, the defined mission phases not only determine the weight calculation for each flight segment but also specify the precise performance metrics used in the constraint analysis. Finally, selecting a point in the constraint diagram yields the corresponding basic parameters, including wing area, rotor disk area, required sea-level static engine power, and weight parameters.
In practice, any point within the feasible region determined by the constraint diagram presented in this paper can serve as a design point. However, designers tend to prefer points in the vicinity of the “Ideal design point,” as illustrated in Figure 14, because this allows for a lower “thrust-to-weight ratio” or “power-to-weight ratio” while meeting all performance constraints. This implies that a lighter engine can be adopted, reducing overall weight.
In this study, for different case studies, as long as the design point lies within the feasible region and within a certain range from the ideal design point, it is considered reasonable. To quantitatively describe and analyze this specific difference, this study introduces the power-to-weight ratio margin, denoted as ΔPmargin, as a key metric. The power-to-weight ratio margin, ΔPmargin, can be derived from the vertical distance between the actual and ideal points in Figure 14, as expressed in Equation (36).
P margin = P s l / W t o actual     P s l / W t o i deal P s l / W t o i deal   ×   1 00 %
Typically, 5% to 15% is regarded as a typical design margin range in industrial practice [35]. Moreover, design cases and parameter selection recommendations provided in reference [20] commonly adopt a margin of around 10%.
It is important to note that this methodology offers good generality and flexibility. It is applicable not only to the HSVTOL discussed here but also to other tiltrotor-type aircraft. In practical application, constraint conditions can be added or removed based on the specific case. For example, for a conventional tiltrotor like the V-22, which lacks a jet aircraft mode and does not employ a TSFVCE, only the mission phases and performance constraints for its helicopter and propeller aircraft modes need to be considered. Furthermore, the analysis modules in Figure 13 are weakly coupled; each module can be used independently. For instance, the weight fraction β can be obtained from the weight estimation module or can be input as an independent parameter.

6. Validation

To assess the validity of the proposed estimation method, two different tiltrotor aircraft configurations are selected as validation cases.

6.1. V-22 Osprey Tiltrotor Aircraft

The V-22 Osprey is a tiltrotor aircraft jointly developed by Bell Helicopter (now part of Bell Textron Inc., Providence, RI, USA) and Boeing, designed to meet the operational requirements of the four U.S. military branches: the Air Force, Navy, Army, and Marine Corps. Although the V-22’s cruise speed does not reach the range defined for HSVTOL in this study, it shares the same fundamental design logic and configuration. As a tiltrotor aircraft that has been practically deployed and is technologically mature, it serves as a suitable case study. The relevant performance parameters of the V-22, used as input data [11,12,36,37], are listed in Table 3.
The V-22 is powered by AE 1107C engines, for which detailed performance parameters are not readily available. Therefore, the engine’s altitude characteristics and specific fuel consumption were estimated based on Reference [24]. Furthermore, during the performance constraint analysis, the engine output power was limited to 90% of its maximum rated power, and the weight fraction was set corresponding to a 60% fuel state.
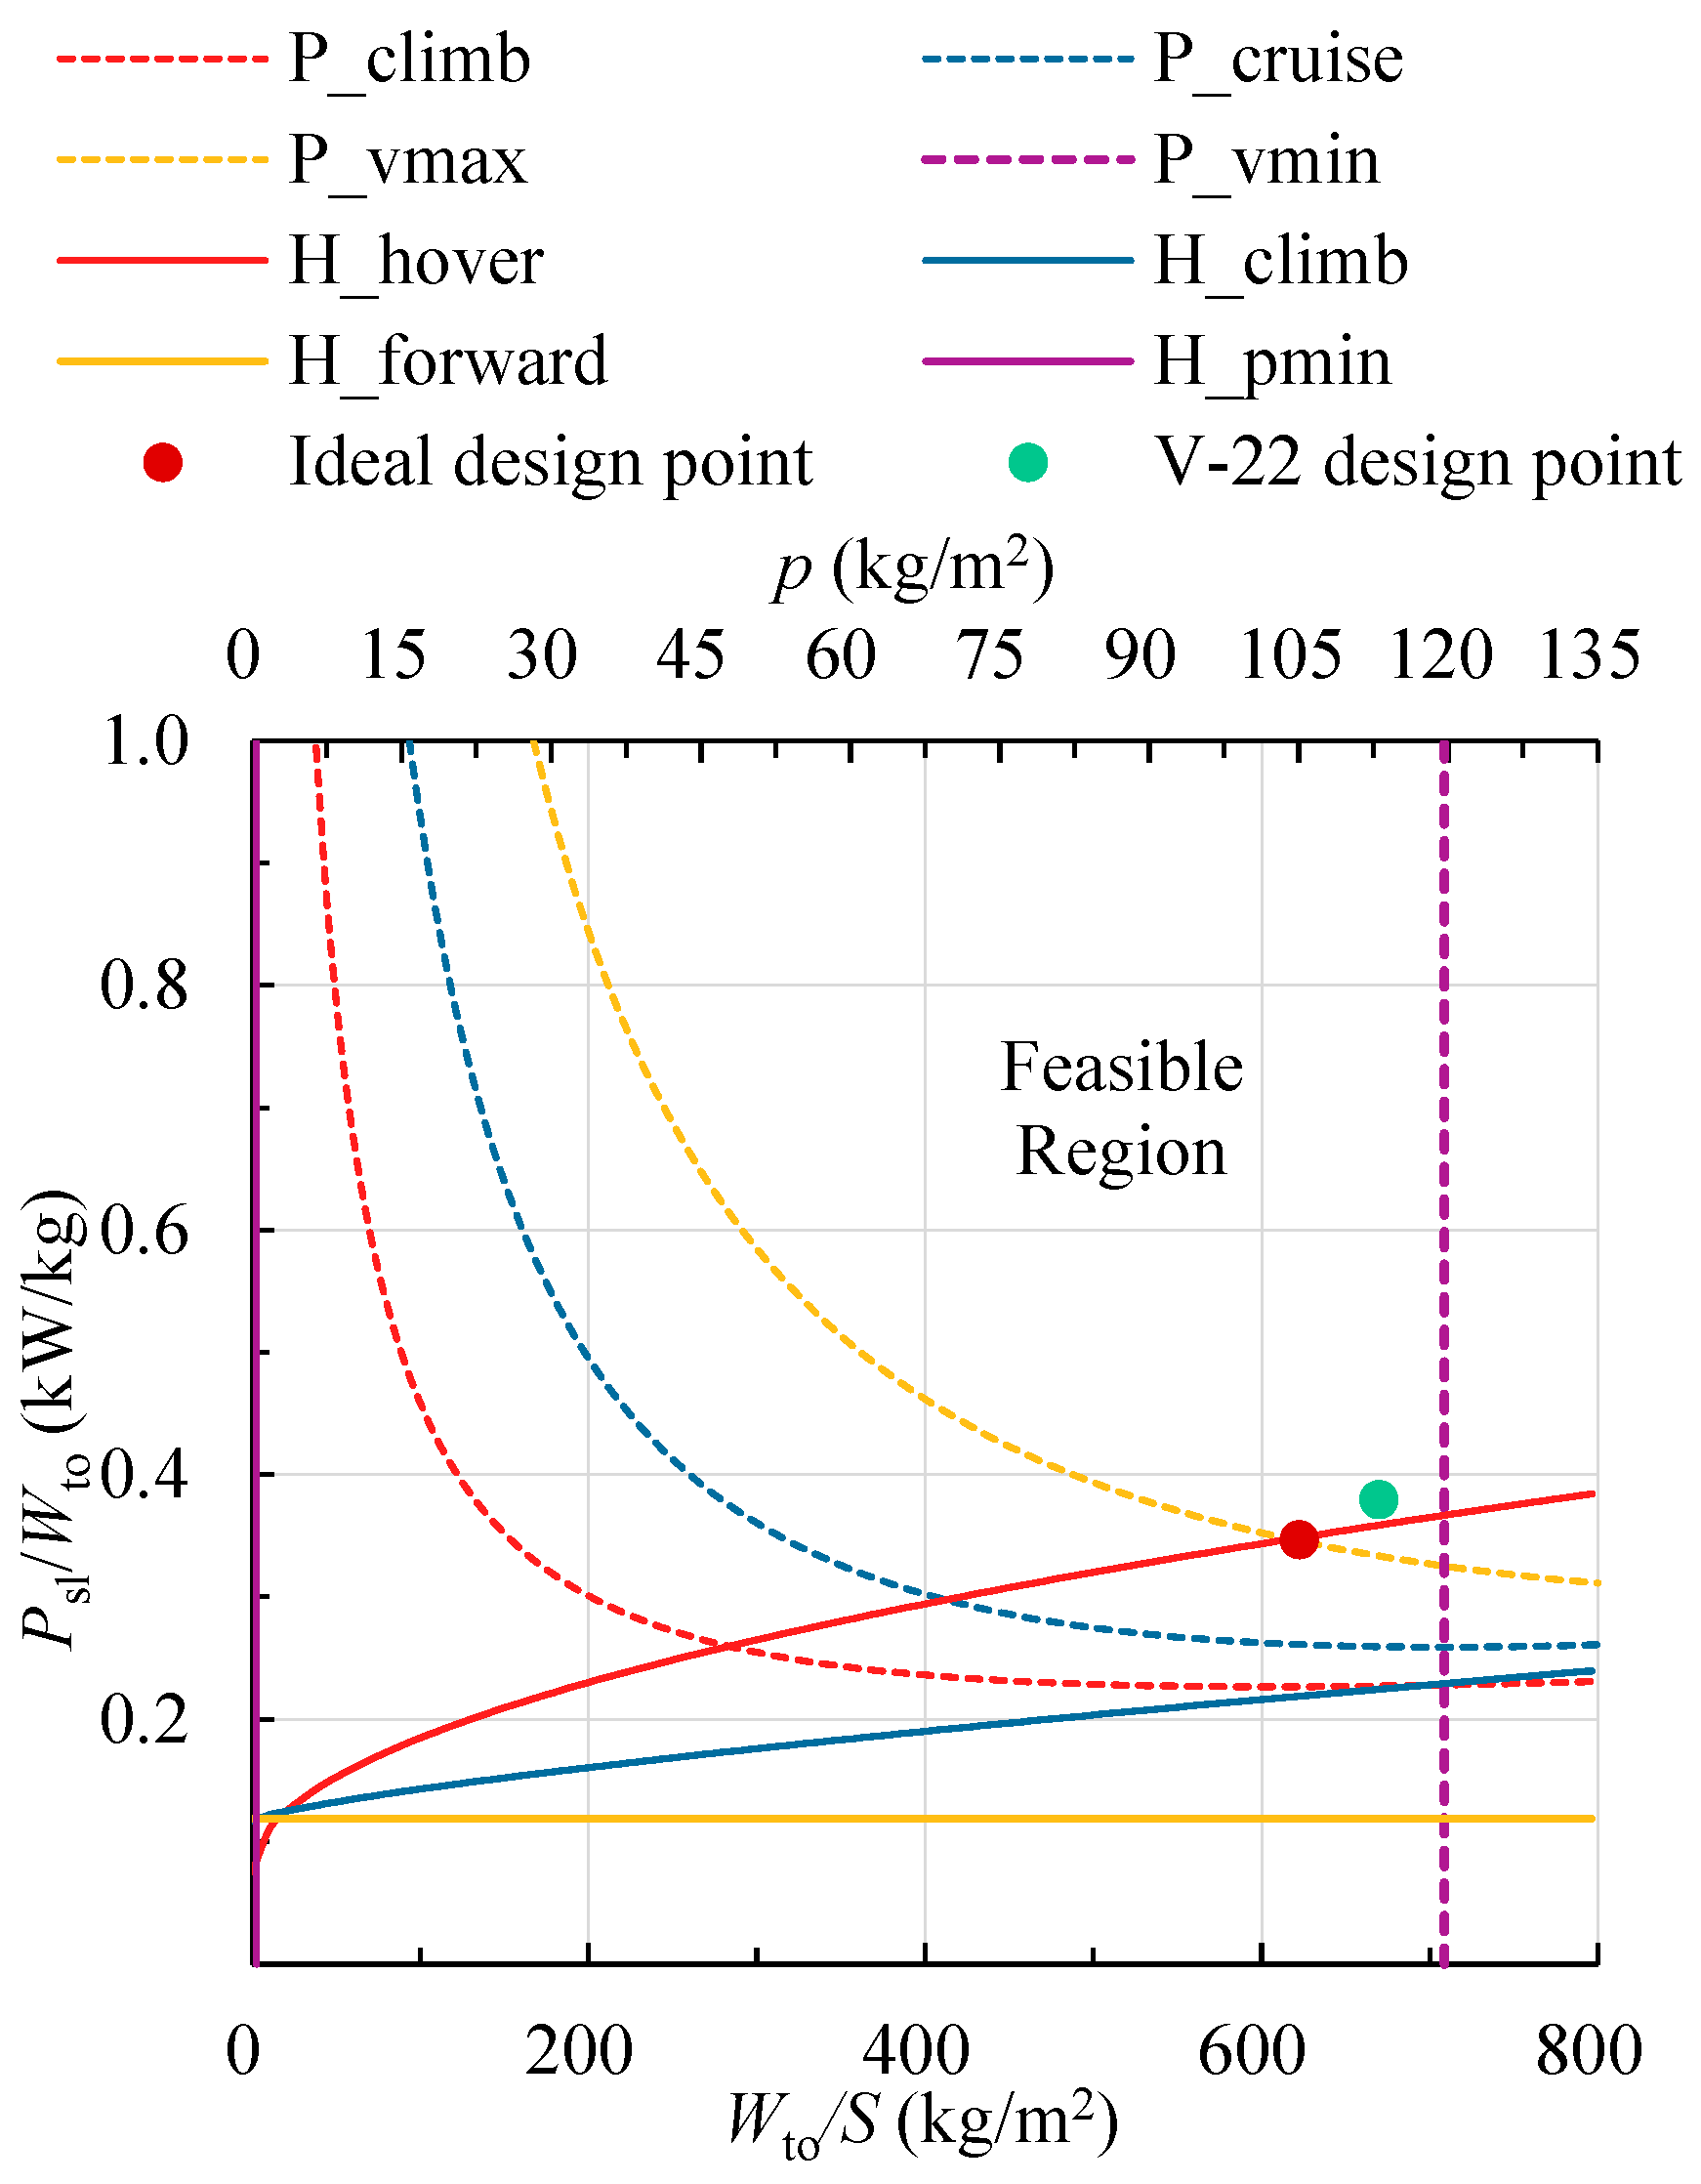
The mission profile was defined according to Reference [38]: ①Vertical Take-off→②Tilt Transition→③Climb→④Cruise→⑤Descent→⑥Tilt Transition→⑦Hover for Cargo Delivery→⑧Return Flight (repeating phases ②~⑥)→⑨Vertical Landing. Using the methodology established in this study and the aforementioned data, the basic parameters of the V-22 were estimated, with the results presented in Figure 15 and Table 4.
Figure 15 shows that the feasible region is bounded by the curves “H_hover”, “H_pmin”, “P_vmax”, and “P_vmin”. The V-22’s design point lies within this feasible region, proximate to the “Ideal design point,” and maintains a margin from the constraint boundaries. A comparison of the data in Table 4 indicates minor differences between the actual V-22 parameters and the values corresponding to the “Ideal design point” estimated by the proposed method. This close agreement demonstrates the effectiveness of the constraint diagram in guiding the rational selection of disk loading, wing loading, and the power-to-weight ratio.

6.2. High-Speed Folding Rotor Aircraft

The High-Speed Folding Rotor aircraft (FTR) is a folding tiltrotor concept proposed by the NASA Ames Research Center. It shares the same configuration as the HSVTOL discussed in this study. Its performance parameters are listed in Table 5 [33]. The engine model utilized for this case study is the TSFVCE described in Section 4.1 of this article.
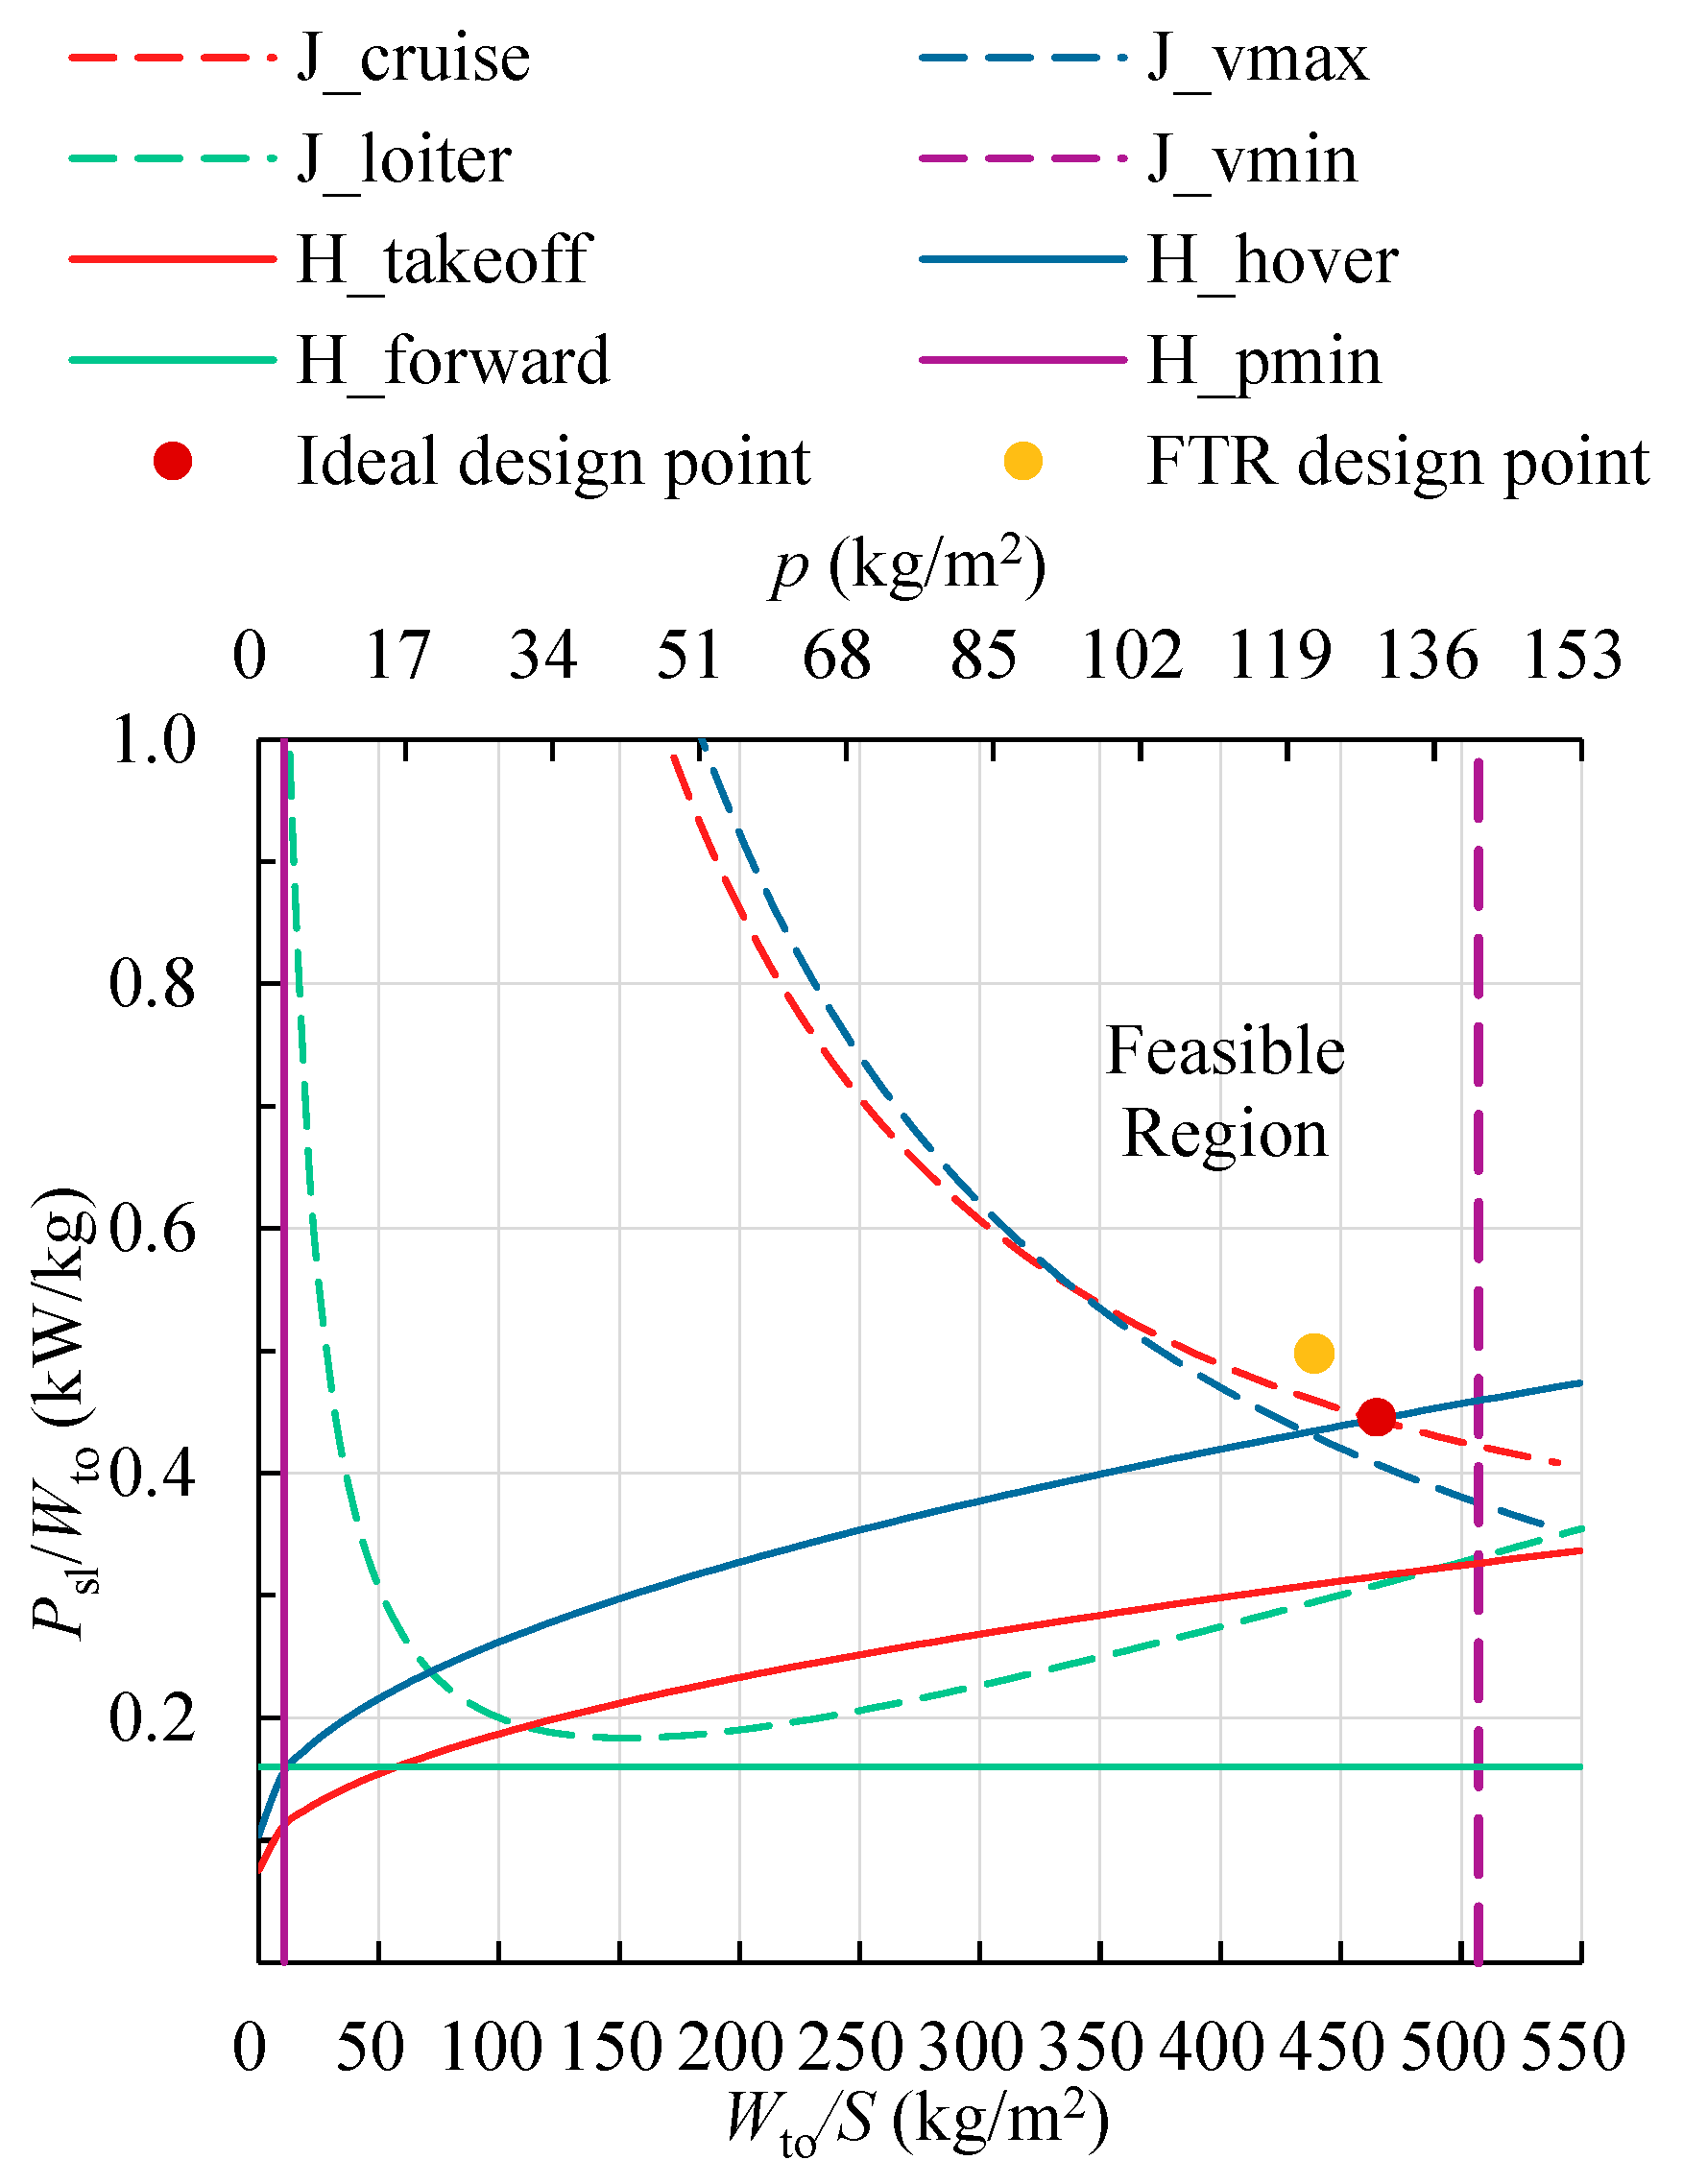
Based on the military transport mission requirements proposed by NASA in reference [33], the mission profile for the FTR is defined as follows: ①Vertical Take-off→②Tilt Transition→③Thrust/Power Mode Transition→④Climb→⑤Cruise→⑥Loiter for Cargo Deployment→⑦Return Flight→⑧Vertical Landing. The total payload includes a permanent payload (1574 kg) and a deployable payload (1315 kg). The performance constraint analysis uses the aircraft weight corresponding to a 60% fuel state. The estimation results are shown in Figure 16 and Table 6.
Figure 16 indicates that the FTR’s design point lies within the feasible region and is close to the “Ideal design point.” In this configuration, the cruise performance imposes a higher power demand on the engine, while still maintaining sufficient margin for hover performance. This observation aligns with the description in reference [33] that “the engine installed power is determined based on cruise conditions.”
The data in Table 6 similarly show minor differences between the actual FTR data and the values corresponding to the “Ideal design point” estimated by the proposed method. This close agreement validates the rationality of the proposed methodology.
In practical aircraft design, it is standard practice to incorporate a design margin, meaning the selected engine power is typically slightly greater than the requirement or the estimated value. From this perspective, the value of Psl estimated by the method presented in this study provides a valuable reference for engine selection or design.

6.3. Discussion on Estimation Results

As observed in Figure 15 and Figure 16, there exists a certain difference between the “Ideal design point” and the “Actual design point”. This difference is not an error or limitation of the methodology but rather a profound and noteworthy aspect worthy of discussion in engineering design.
As we know, the selection of a design point is not a matter of “right” or “wrong” but of rationality. Therefore, it is appropriate to use the term “difference” here, not “error.” In Figure 15 and Figure 16, the “Ideal design point” represents the theoretical minimum power-to-weight ratio required to simultaneously satisfy all performance constraints, derived from the intersection of the constraint curves. In contrast, the actual design point in the case studies is intentionally chosen by designers to incorporate a design margin that accounts for real-world uncertainties, such as model inaccuracies, weight growth during development, and operational variations.
  • Evaluation and Quantification of the Difference
The power-to-weight ratio margin for the two aforementioned case studies is quantified separately based on Equation (36). In the V-22 case study, ΔPmargin = 9.5%, while in the FTR case study, ΔPmargin = 11.7%. The differences in power-to-weight ratio between the design points and the ideal design points in both case studies fall within the acceptable range of 5% to 15%. This margin aligns with established industry practices for design robustness and adheres to the foundational principles outlined in Section 5.
2.
The Implications of Selecting the Ideal Design Point
The ideal design point is essentially a theoretical value. In practical aircraft design work, directly selecting the ideal design point without considering design margins would lead to extremely high risks and no tolerance for errors. First, any unforeseen weight increase (e.g., due to material changes or system additions) or performance degradation (e.g., engine efficiency loss) could result in the aircraft failing to meet key performance requirements. Second, aviation authorities typically require designs to include safety margins to address uncertainties; a zero-margin design would likely fail certification. Finally, under non-standard conditions (e.g., high-temperature or high-altitude operations), performance could severely degrade, compromising mission success.
3.
Consequences of Oversizing
As mentioned earlier, so-called “oversizing,” if controlled within the reasonable range described previously (e.g., <15%), should be defined as a “necessary design margin.” However, if it far exceeds this range, it constitutes genuine “over-design,” where the penalties in weight, cost, and performance begin to significantly outweigh the benefits of risk reduction.
Based on the above discussion, this study can be understood as proposing an efficient and rapid estimation framework for the preliminary sizing of HSVTOL and TSFVCE. Its core value lies in accurately defining the design feasible domain, guiding aircraft designers to select robust design solutions with reasonable margins within the design space while meeting all performance requirements.

7. Conclusions

This study presents a systematic methodology for estimating the basic parameters of the HSVTOL during the conceptual design phase. By integrating design principles from both rotorcraft and fixed-wing aircraft, and through mission definition, weight estimation, and performance constraint analysis, the method enables rapid and effective preliminary sizing of key parameters for HSVTOL and other tiltrotor-configuration vehicles, including maximum take-off weight, disk loading, and wing loading.
Considering the application of a TSFVCE as the propulsion system, a corresponding thrust/power conversion procedure is established. This procedure unifies the power requirements for all flight modes and performance conditions into a single metric: the required engine output at sea-level static conditions. This provides a valuable reference for engine selection and design.
The computational analysis of two representative tiltrotor aircraft validates the proposed methodology, demonstrating its satisfactory generality and effectiveness for different vehicle configurations and performance requirements.
As most current research on HSVTOL aircraft and TSFVCE technology remains at the conceptual and theoretical stage, with limited published data available, some input parameters for the estimation method relied on preliminary estimates and empirical values. Consequently, while the method may not yield highly precise parameter design, it successfully identifies a reasonable design space. It offers significant reference value for the conceptual design of HSVTOL aircraft and the preliminary matching of engine power. Future work will involve refining vehicle configuration design and performance calculations based on this methodology, alongside further exploration of integrated airframe–propulsion design strategies specifically for HSVTOL vehicles equipped with TSFVCEs.

Author Contributions

Conceptualization, Y.W. and Q.L.; methodology, Y.W., Q.L. and P.L.; software, Q.L.; validation, Y.W. and Q.L.; formal analysis, Y.W. and Q.L.; investigation, Q.L. and P.L.; resources, Y.W. and Q.L.; data curation, Q.L. and P.L.; writing—original draft preparation, Y.W. and Q.L.; writing—review and editing, Y.W., Q.L. and P.L.; visualization, Y.W. and Q.L.; supervision, Y.W. All authors have read and agreed to the published version of the manuscript.

Funding

This research was funded by Hunan Innovation-oriented Provincial Special Fund, grant number 2021GK1020.

Data Availability Statement

The original contributions presented in this study are included in the article. Further inquiries can be directed to the corresponding author.

Conflicts of Interest

The authors declare no conflicts of interest.

References

  1. Marano, A.D.; Diodati, G.; Paletta, N.; Di Palma, L.; Belardo, M.; Nour, P.A. Structural Scalability Preliminary Studies for the Next Generation Civil Tiltrotor Composite Wing. Aerospace 2023, 10, 478. [Google Scholar] [CrossRef]
  2. Wu, X. Current status, development trend and countermeasure for high-speed rotorcraft. J. Nanjing Univ. Aeronaut. Astronaut. 2015, 47, 173–179. [Google Scholar] [CrossRef]
  3. Deng, J. Key technologies and development for high-speed helicopters. Acta Aeronaut. Astronaut. Sin. 2024, 45, 529085. [Google Scholar]
  4. Ren, C.; Jia, L.; Zhang, P.; Chen, Y.; Yang, J. Fusion algorithm of multi design points for turboshaft-turbofan variable cycle engine scheme design. J. Aerosp. Power 2024, 39, 47–56. [Google Scholar] [CrossRef]
  5. Tan, M.; Liu, Y. SPRINT promotes the development of HSVTOL Aircraft. Aerosp. Power 2024, 1, 47–49. [Google Scholar]
  6. Talbot, P.D.; Phillips, J.D.; Totah, J.J. Selected design issues of some high-speed rotorcraft concepts. J. Aircr. 1993, 30, 864–871. [Google Scholar] [CrossRef]
  7. Davis, J.H. Design Methodology for Developing Concept Independent Rotorcraft Analysis and Design Software. Ph.D. Thesis, Georgia Institute of Technology, Atlanta, GA, USA, 2007. [Google Scholar]
  8. Johnson, W. NDARC-NASA Design and Analysis of Rotorcraft Theoretical Basis and Architecture; Technical Report: ARC-E-DAA-TN1109; NASA: Moffett Field, CA, USA, 2010.
  9. Johnson, W. NDARC-NASA design and analysis of rotorcraft validation and demonstration. In Proceedings of the American Helicopter Society Aeromechanics Specialists Conference, San Francisco, CA, USA, 20–22 January 2010. [Google Scholar]
  10. Johnson, W. NDARC-NASA Design and Analysis of Rotorcraft; Technical Report: NASA/TP-2015-218751; NASA: Moffett Field, CA, USA, 2017.
  11. Zhu, Q. General Parameters Optimum Design of Tiltrotor Aircraft. Master’s Thesis, Nanjing University of Aeronautics and Astronautics, Nanjing, China, 2011. [Google Scholar]
  12. Zuo, Z. Tiltrotor Aircraft Conceptual/Preliminary Design and Optimization. Master’s Thesis, Nanjing University of Aeronautics and Astronautics, Nanjing, China, 2016. [Google Scholar]
  13. Zhou, Q.; Li, C. Optimization design of primary parameters for high-speed quad tiltrotor. Helicopter Tech. 2016, 1, 1–6. [Google Scholar]
  14. Gong, H.; He, W.; Hou, S.; Chen, M.; Yang, Z.; Si, Q.; Zhao, D. Design and Validation of a New Tilting Rotor VTOL Drone: Structural Optimization, Flight Dynamics, and PID Control. Sensors 2025, 25, 3537. [Google Scholar] [CrossRef] [PubMed]
  15. Xue, L. Research on Aerodynamic/Dynamic Multidisciplinary Design Optimization for Tilt-Rotor Aircraft. Ph.D. Thesis, Nanjing University of Aeronautics and Astronautics, Nanjing, China, 2011. [Google Scholar]
  16. Li, P.; Zhao, Q. CFD calculations on the interaction flow-field and aerodynamic force of tiltrotor/wing in hover. Acta Aeronaut. Astronaut. Sin. 2014, 2, 80–90. [Google Scholar]
  17. Wang, Z.; Yang, Y.; Zhao, H.; Wang, X. Aerodynamic optimization design of tiltrotor under multiple flight conditions. Acta Aeronaut. Astronaut. Sin. 2024, 45, 529024. [Google Scholar]
  18. Savino, A. Multi-Fidelity Aerodynamic Optimization of the Wing Extension of a Tiltrotor Aircraft. Appl. Sci. 2025, 15, 9491. [Google Scholar] [CrossRef]
  19. Yang, Y.; Wang, X. Enhanced hybrid panel-vortex particle method for aerodynamic analysis of tiltrotor rotor/wing interactions. Acta Aeronaut. Astronaut. Sin. 2025, 46, 165–183. [Google Scholar]
  20. Raymer, D.P. Aircraft Design: A Conceptual Approach, 6th ed.; AIAA Education Series: Reston, VA, USA, 2018. [Google Scholar]
  21. Yu, X.; Xu, H.; Luo, D. The Basic Principles of Aircraft Preliminary Design, 1st ed.; Science Press: Beijing, China, 2023. [Google Scholar]
  22. Nicolai, L.M.; Carichner, G.E. Fundamentals of Aircraft and Airship Design Volume I—Aircraft Design; AIAA Inc.: Reston, VA, USA, 2010. [Google Scholar]
  23. Padfield, G.D. Helicopter Flight Dynamics: Including a Treatment of Tilt Rotor Aircraft; John Wiley & Sons Inc.: Hoboken, NJ, USA, 2018. [Google Scholar]
  24. Zhang, C.; Guo, C. Preliminary Design Helicopters; National Defense Industry Press: Beijing, China, 2006. [Google Scholar]
  25. Wang, S. Helicopter Aeromechanics; Editorial Group for Aviation Professional Textbooks: Beijing, China, 1985. [Google Scholar]
  26. Johnson, W. Rotorcraft aeromechanics. J. Name J. Am. Helicopter Soc. 2013, 58, 1. [Google Scholar]
  27. Seddon, J.M. Basic Helicopter Aerodynamics; John Wiley & Sons Inc.: Chichester, UK, 2011. [Google Scholar]
  28. Edkins, D.P.; Hirschkron, R.; Lee, R. TF-34 Turbofan Quiet Engine Study; Technical Report; General Electric Company Aircraft Engine Group: Lynn, MA, USA; Cincinnati, OH, USA, 1972. [Google Scholar]
  29. Mcardle, J.G. Outdoor Test Stand Performance of a Convertible Engine with Variable Inlet Guide Vanes for Advanced Rotorcraft Propulsion; Technical Report; NASA Lewis Research Center: Cleveland, OH, USA, 1986. [Google Scholar]
  30. Ji, C.; Wang, Y.; Wang, Z.; Song, J.; Zhang, H. Serial optimization design method for optimal transfer point of a turboshaft turbofan conversion engine. J. Propuls. Technol. 2025, 46, 259–271. [Google Scholar]
  31. Bellin, A.I.; Brooks, A. Status Report: DARPA/NASA Convertible Turbofan/Turboshaft Engine Program; V002T02A016; American Society of Mechanical Engineers: New York, NY, USA, 1983. [Google Scholar]
  32. Li, L.; Bai, J.; Liu, C. A sizing method of all-electric aircraft for conceptual design. J. Aerosp. Power 2022, 37, 2749–2761. [Google Scholar]
  33. Detore, J.; Conway, S. Technology Needs for High-Speed Rotorcraft; Technical Report: NAS2-13072; NASA Ames Research Center: Moffett Field, CA, USA, 1991.
  34. CCAR 25-R4; China Civil Aviation Regulations Part 25: Airworthiness Standards for Transport Airplanes. Civil Aviation Administration of China: Beijing, China, 2016; pp. 5–6.
  35. National Aeronautics and Space Administration. NASA Systems Engineering Handbook, 2nd ed.; NASA: Washington, DC, USA, 2020.
  36. Bolkcom, C.; Knight, W. V-22 Osprey Tilt-Rotor Aircraft; Congressional Research Service, Library of Congress: Washington, DC, USA, 2001.
  37. Rosenstein, H.; Clark, R. Aerodynamic development of the V-22 tilt rotor. In Proceedings of the Aircraft Systems, Design and Technology Meeting, Dayton, OH, USA, 20–22 October 1986. [Google Scholar]
  38. 40th Annual Student Design Competition 2022–2023 Request for Proposals (RFP) High-Speed Vertical Takeoff. 2022. Available online: https://www.prweb.com/releases/the-vertical-flight-society-announces-the-winners-of-the-40th-annual-student-design-competition-301910372.html (accessed on 1 November 2025).
Figure 1. Flight Modes of HSVTOL.
Aerospace 12 00992 g001
Figure 2. Structure schematic of TSFVCE [30].
Aerospace 12 00992 g002
Figure 3. TSFVCE thrust ratio map.
Aerospace 12 00992 g003
Figure 4. Process of converting required thrust into power.
Aerospace 12 00992 g004
Figure 5. Process of required power estimation for helicopter mode.
Aerospace 12 00992 g005
Figure 6. Process of required power estimation for propeller aircraft mode.
Aerospace 12 00992 g006
Figure 7. The determination of the minimum disk loading.
Aerospace 12 00992 g007
Figure 8. Geometric constraints between rotor, fuselage and wing.
Aerospace 12 00992 g008
Figure 9. Constraint diagram of HSVTOL (S/A = 0.25).
Aerospace 12 00992 g009
Figure 10. Constraint diagram of S/A = 0.2.
Aerospace 12 00992 g010
Figure 11. Constraint diagram of S/A = 0.3.
Aerospace 12 00992 g011
Figure 12. Constraint diagram of S/A = 0.4.
Aerospace 12 00992 g012
Figure 13. Process of basic parameter estimation.
Aerospace 12 00992 g013
Figure 14. Preferred design region in the constraint diagram.
Aerospace 12 00992 g014
Figure 15. Constraint diagram of V-22.
Aerospace 12 00992 g015
Figure 16. Constraint diagram of FTR.
Aerospace 12 00992 g016
Table 1. Weight parameters of the current tiltrotor aircraft powered by fuel.
Weight
Parameters
XV-15V-22AW-609V-280
Wto/kg6009.223,860760014,000
We/kg457415,03047658200
We/Wto0.7610.6300.6270.586
Table 2. Performance parameters of TF34-400 engine and TSFVCE.
Engine
Parameters
TF34-400TSFVCE
TurboshaftTurbofanTurboshaftTurbofan
BPR0.536.220.5796.4
Tsl/kN7.7336.665.829.6
Psl/kN3930043000
Ccruise/(kg/(daN·h))-0.65-0.64
Table 3. Input data of V-22.
ParametersValue
WingAspect ratio5.49
WeightEmpty weight coefficient0.63
Payload weight/kg4360
EngineSingle engine power/kW4586
Specific fuel consumption */(kg/(kW·h))0.255
Helicopter Mode
Performance
Parasite drag coefficient */(m2/N)3.6 × 10−5
Figure of merit *0.85
HIGE ceiling/m1646
Max climb speed/(m/s)6.8
Max forward speed/(m/s)62
Rotor tip speed/(m/s)241
Rotor airfoil L/D *29
Propeller Aircraft Mode
Performance
Mission radius/km722
Cruise L/D *7.5
Zero-lift drag coefficient *0.05
Cruise altitude/m4600
Cruise speed/(m/s)123.9
Max cruise speed/(m/s)156.9
Max rate of climb/(m/s)11.8
Stall speed/(m/s)56.9
Parameters marked with an asterisk (*) indicate values for which no direct reference source was readily available and were therefore replaced with estimated values.
Table 4. Comparison of actual data and estimated results for the basic parameters of V-22.
ParametersActual ValueEstimated Value
Wto/kg23,86023,080.63
We/kg15,03014,540.8
Wf/kg44704179.83
S/m235.4937.32
Wto/S/(kg/m2)672.30618.51
A/m2211.37222.12
p/(kg/m2)112.88103.91
Psl/kW4586 × 24004 × 2
Psl/Wto/(kW/kg)0.3840.347
Table 5. Input data of FTR.
ParametersValue
WingAspect ratio5.33
WeightEmpty weight coefficient0.66
Payload weight/kg2889
Helicopter Mode
Performance
Parasite drag coefficient */(m2/N)2.1 × 10−5
Figure of merit *0.8
HIGE ceiling/m1524
Max forward speed/(m/s)67
Rotor tip speed/(m/s)228
Rotor airfoil L/D *28
Jet Aircraft Mode
Performance
Mission radius/km648
Cruise L/D *10
Zero-lift drag coefficient *0.024
Cruise altitude/m7620
Cruise speed/(m/s)231.4
Maximum speed at sea level/(m/s)246.9
Turn load factor/g1.7
Stall speed/(m/s)62
Parameters marked with an asterisk (*) indicate values for which no direct reference source was readily available and were therefore replaced with estimated values.
Table 6. Comparison of actual data and estimated results for the basic parameters of FTR.
ParametersActual ValueEstimated Value
Wto/kg23,317.3721,924.80
We/kg15,366.3514,470.37
Wf/kg4964.574565.43
S/m253.0547.11
Wto/S/(kg/m2)439.42465.41
A/m2191.10169.59
p/(kg/m2)122.06129.28
Psl/kW11,610.559778.46
Psl/Wto/(kW/kg)0.4980.446
Disclaimer/Publisher’s Note: The statements, opinions and data contained in all publications are solely those of the individual author(s) and contributor(s) and not of MDPI and/or the editor(s). MDPI and/or the editor(s) disclaim responsibility for any injury to people or property resulting from any ideas, methods, instructions or products referred to in the content.