Article

Impact Fatigue Life Prediction of Arresting Hooks Using Virtual Fatigue Testing and Continuum Damage Mechanics

1
State Key Laboratory of Mechanics and Control for Aerospace Structures, Nanjing University of Aeronautics and Astronautics, Nanjing 210016, China
2
Key Laboratory of Fundamental Science for National Defense-Advanced Design Technology of Flight Vehicle, Nanjing University of Aeronautics and Astronautics, Nanjing 210016, China
3
Key Laboratory of Flight Simulation Aviation Technology, Chinese Flight Test Establishment, Xi’an 710089, China
*
Author to whom correspondence should be addressed.
Aerospace 2025, 12(11), 983; https://doi.org/10.3390/aerospace12110983 (registering DOI)
Submission received: 27 September 2025 / Revised: 26 October 2025 / Accepted: 29 October 2025 / Published: 31 October 2025
(This article belongs to the Section Aeronautics)

Abstract

Carrier-based aircraft arresting hooks are subjected to repeated high-strain-rate impacts during arrested landings, leading to impact-induced fatigue that governs their service life and structural safety. To quantitatively evaluate this phenomenon, this study proposes a comprehensive experimental–numerical framework integrating collision–rebound testing, finite element dynamic simulation, and continuum damage mechanics (CDM)-based fatigue modeling. Repeated impact experiments were performed on a custom-built test platform to capture the transient strain evolution of critical regions in the hook head. A validated finite element (FE) model incorporating the VDISP subroutine was then developed to reproduce cyclic impact sequences under realistic boundary conditions. Using the simulated strain histories, a CDM-based fatigue life prediction model for 30CrMnSiNi2A high-strength steel was formulated and calibrated. Comparative analyses showed excellent agreement between experimental and numerical results, with strain and impact-force deviations within 6.6%. The proposed approach not only bridges the gap between physical testing and virtual prediction but also provides a generalized methodology for evaluating rate-dependent fatigue degradation, enabling predictive design and life assessment of carrier-based arresting systems.

1. Introduction

Carrier-based aircraft rely on arresting hooks to achieve rapid deceleration by engaging the arresting cable during landing. During the arrested landing process, the hook head endures repeated high-rate impact loadings, which impose stringent durability requirements on its high-strength steel structure. When the strain rate induced by impact becomes sufficiently high to significantly affect the material’s fatigue performance, the phenomenon is commonly referred to as impact fatigue. Because the steels used in naval arresting systems are highly strain-rate sensitive, their fatigue degradation behavior cannot be accurately captured using conventional quasi-static fatigue analysis. Therefore, a systematic investigation into the dynamic response and fatigue behavior of arresting hooks under repeated impact loading is essential for ensuring the safety and reliability of carrier-based aircraft operations.
Recent years have witnessed considerable progress in the study of arresting hook dynamics and fatigue mechanisms. Peng and Xie [1] experimentally investigated the bounce dynamics of a carrier-based aircraft arresting hook during deck impact, establishing a collision–rebound test platform to characterize transient contact behavior. Shao et al. [2] developed a full-scale rigid–flexible coupling dynamic model for the aircraft arresting process, effectively capturing the hook–cable engagement and deceleration response. Complementarily, Li et al. [3] proposed a parameter inversion method to model the transient dynamics of arresting hooks and cables, bridging the gap between experimental observations and numerical predictions. From the fatigue-resistance perspective, Rankin et al. [4] studied the effect of laser peening on the fatigue life of an arrestment hook shank, reporting a more than threefold improvement in fatigue performance. Similarly, the ASTM investigation [5] on the F/A-18E/F hook point shank demonstrated that fatigue cracks initiated at the root fillet region after approximately 1361 arrested landings, revealing the critical failure mode of high-strength steel hooks. Additionally, Chen et al. [6] optimized a carrier-based UAV drawbar through strain fatigue analysis, providing a methodological reference for the fatigue-oriented parameter optimization of carrier-borne components. Although these studies have significantly advanced the understanding of arresting hook mechanics, most have focused either on single-impact dynamics or static fatigue enhancement, while systematic research integrating cyclic high-strain-rate impacts with virtual fatigue modeling remains limited.
For the high-strength steels used in arresting hooks, a large body of literature has explored their dynamic constitutive and deformation behaviors under high-strain-rate and temperature conditions. Kuang et al. [7] optimized the Johnson–Cook constitutive model for HRB400 steel under multi-condition high strain rate and high temperature validation, improving model accuracy for impact scenarios. Dekhtyar et al. [8] analyzed deformation and strain hardening mechanisms of titanium alloys and metal–matrix composites under both quasi-static and dynamic compression, providing key insights into high-rate plasticity. Zhang et al. [9] reported the superior dynamic mechanical properties of high-nitrogen austenitic stainless steel, highlighting its exceptional strain-rate strengthening effect. Wang et al. [10] investigated the dynamic mechanical response of laser-directed energy deposited AerMet100 ultra-high-strength steel, identifying its strain-rate-dependent fracture behavior and deformation mechanisms. Song et al. [11] examined the coupling effects of temperature and strain rate on a refractory high-entropy alloy, revealing a strong thermomechanical interaction on deformation resistance. At the microstructural and atomistic level, Reis et al. [12] demonstrated via molecular dynamics that Fe and Co additions markedly influence the high-strain-rate mechanical behavior of NiTi shape-memory alloys. Kim et al. [13] simulated the fracture behavior of AH36 shipbuilding steel under drop-test conditions using the GISSMO damage model, validating its predictive accuracy for ductile fracture. Furthermore, Duntu and Boakye-Yiadom [14] investigated adiabatic shear band formation in tempered AISI 4340 steel under high-strain-rate and elevated-temperature impacts, confirming the role of thermal softening in shear localization. These studies together enrich the understanding of rate-dependent plasticity, thermal coupling, and microstructural evolution of metallic materials, laying a theoretical foundation for modeling arresting hook steels under cyclic high-strain-rate conditions.
In addition, numerous investigations have addressed the dynamic strength and fatigue degradation of high-strength steels commonly used in aerospace and naval applications. Bouce et al. [15] examined dynamic plastic deformation in high-strength steels under tension, identifying strong strain-rate sensitivity. Gilat and Goldberg [16] characterized compressive responses at 10–200 s−1 strain rates using split Hopkinson pressure bar tests. Xu and Zhang [17] analyzed dynamic fracture toughness using finite element simulations, while Yu et al. [18] proposed a fatigue life prediction model for aircraft steel components under impact conditions based on linear damage accumulation theory. However, most of these studies were limited to uniaxial loading or low-velocity impacts and did not replicate the cyclic high-strain-rate environment typical of carrier-based aircraft landings.
To overcome the aforementioned limitations and achieve a quantitative understanding of impact-induced fatigue in carrier-based arresting hooks, this study establishes a comprehensive experimental–numerical framework integrating collision–rebound testing, finite element impact simulation, and fatigue damage modeling. First, repeated impact experiments were conducted on a custom-built collision–rebound platform to characterize the transient strain evolution and cyclic plasticity behavior in critical regions of the hook head. Subsequently, a validated finite element (FE) dynamic impact model was developed using the experimentally derived boundary conditions, incorporating the VDISP subroutine to reproduce cyclic impact loading sequences with high numerical stability. Finally, based on the simulated strain histories, a continuum damage mechanics (CDM)-based fatigue life prediction model for 30CrMnSiNi2A high-strength steel was formulated and calibrated, enabling virtual fatigue assessment under arbitrary deck impact conditions. The proposed framework not only bridges the gap between experimental observation and numerical prediction but also provides a generalized methodology for evaluating rate-dependent fatigue degradation in high-strength steel components of carrier-based aircraft.

2. Experimental Setup and Numerical Simulation

2.1. Experimental Setup

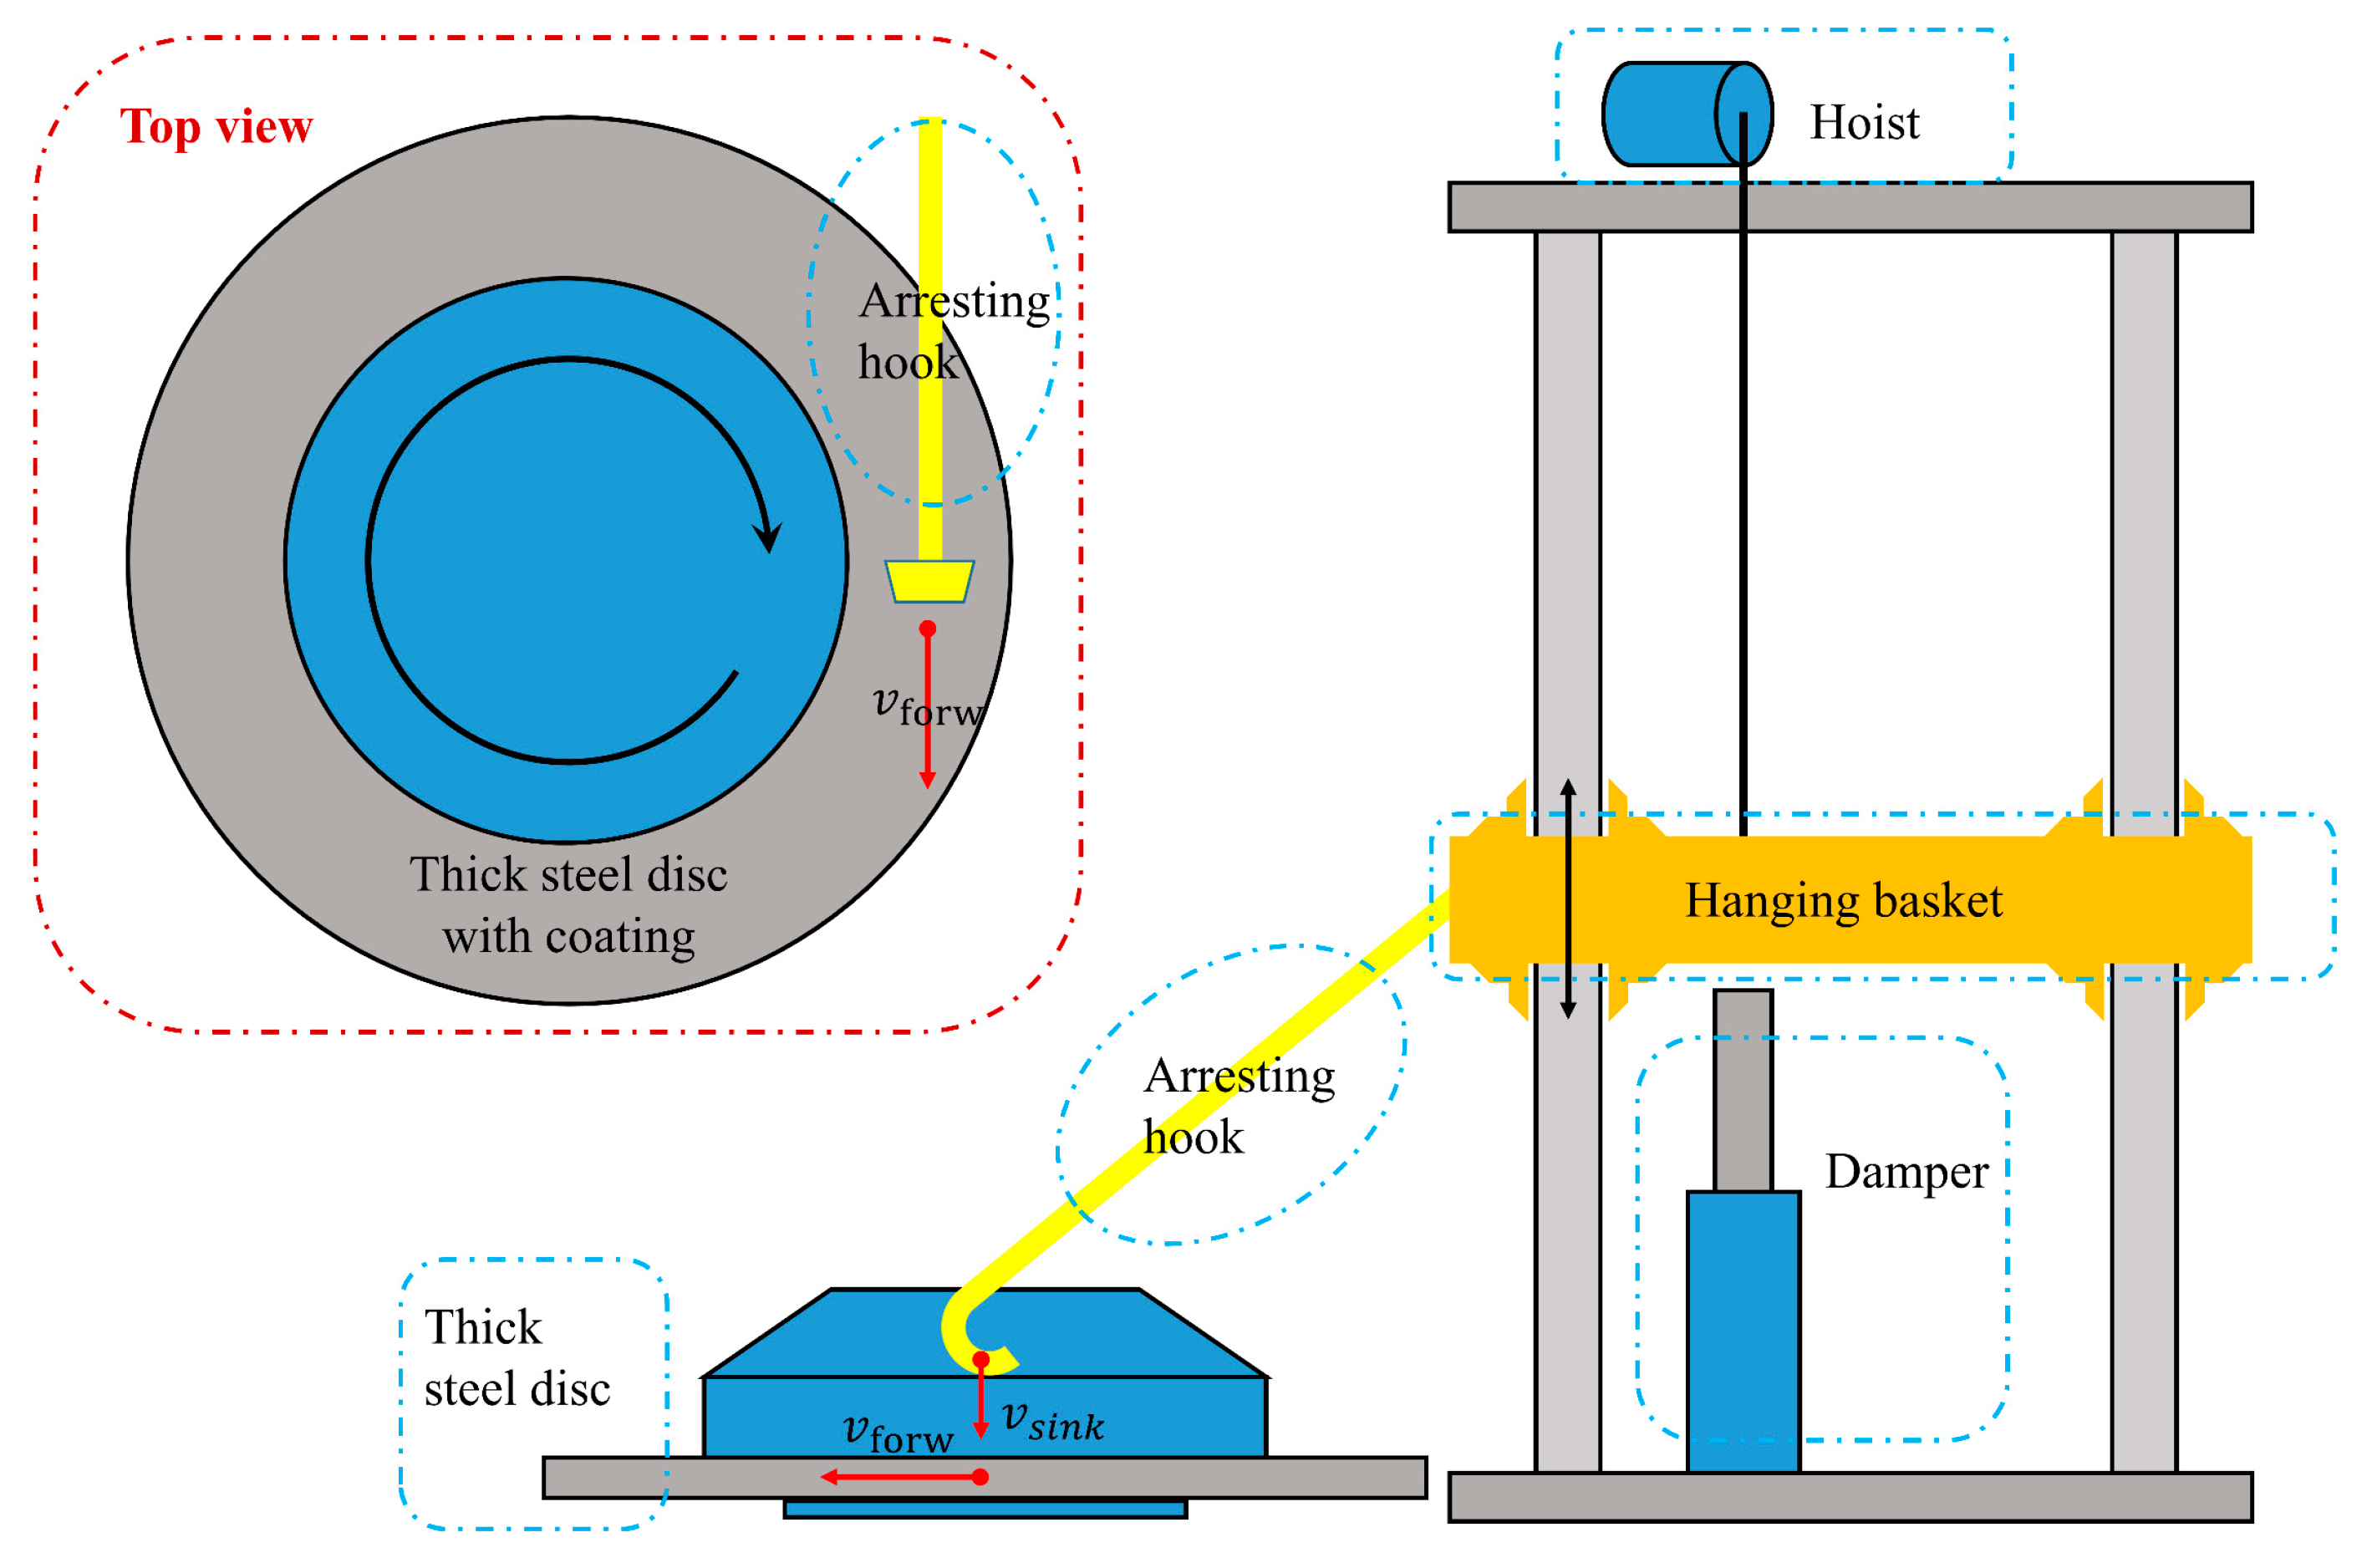
To investigate the dynamic impact and fatigue characteristics of the carrier-based aircraft arresting hook, repeated impact experiments were conducted using a custom-built collision–rebound testing platform. The system was designed to reproduce the vertical sink speed and impact energy encountered during arrested landings, while allowing accurate measurement of strain and deformation evolution in critical regions of the hook head. The test specimen was machined from 30CrMnSiNi2A high-strength steel, as this region endures the most severe impact loads during carrier-based aircraft landings. The hook was laterally mounted on a suspended basket connected to a gas–oil buffer, which simulated the cushioning behavior of the main landing gear and absorbed residual kinetic energy after impact.
The test rig mainly consisted of two primary subsystems: a free-fall basket carrying the arresting hook to simulate the aircraft’s vertical descent, and a motor-driven rotating disc that reproduced the aircraft’s forward velocity through relative tangential motion. In addition, auxiliary components—including the supporting frame constraining the basket, the hoisting motor for positioning it at the desired height, the quick-release mechanism for initiating the drop, and the multi-channel data acquisition system—together formed a complete experimental platform. This configuration enabled the simultaneous reproduction of vertical impact and horizontal velocity effects of arrested landings under controlled conditions.
The vertical sink speed of the basket was controlled by adjusting its release height and was calibrated through preliminary free-fall tests to achieve target velocities between 3.0 m/s and 6.5 m/s. The collision plate (or rotating disc) was driven by an electric motor in the direction opposite to the simulated aircraft heading, providing realistic tangential contact velocity.
Its surface was coated with a resin-based anti-skid material identical to that used on aircraft carrier decks, and internal stiffeners were installed to maintain structural rigidity and surface flatness during impact.
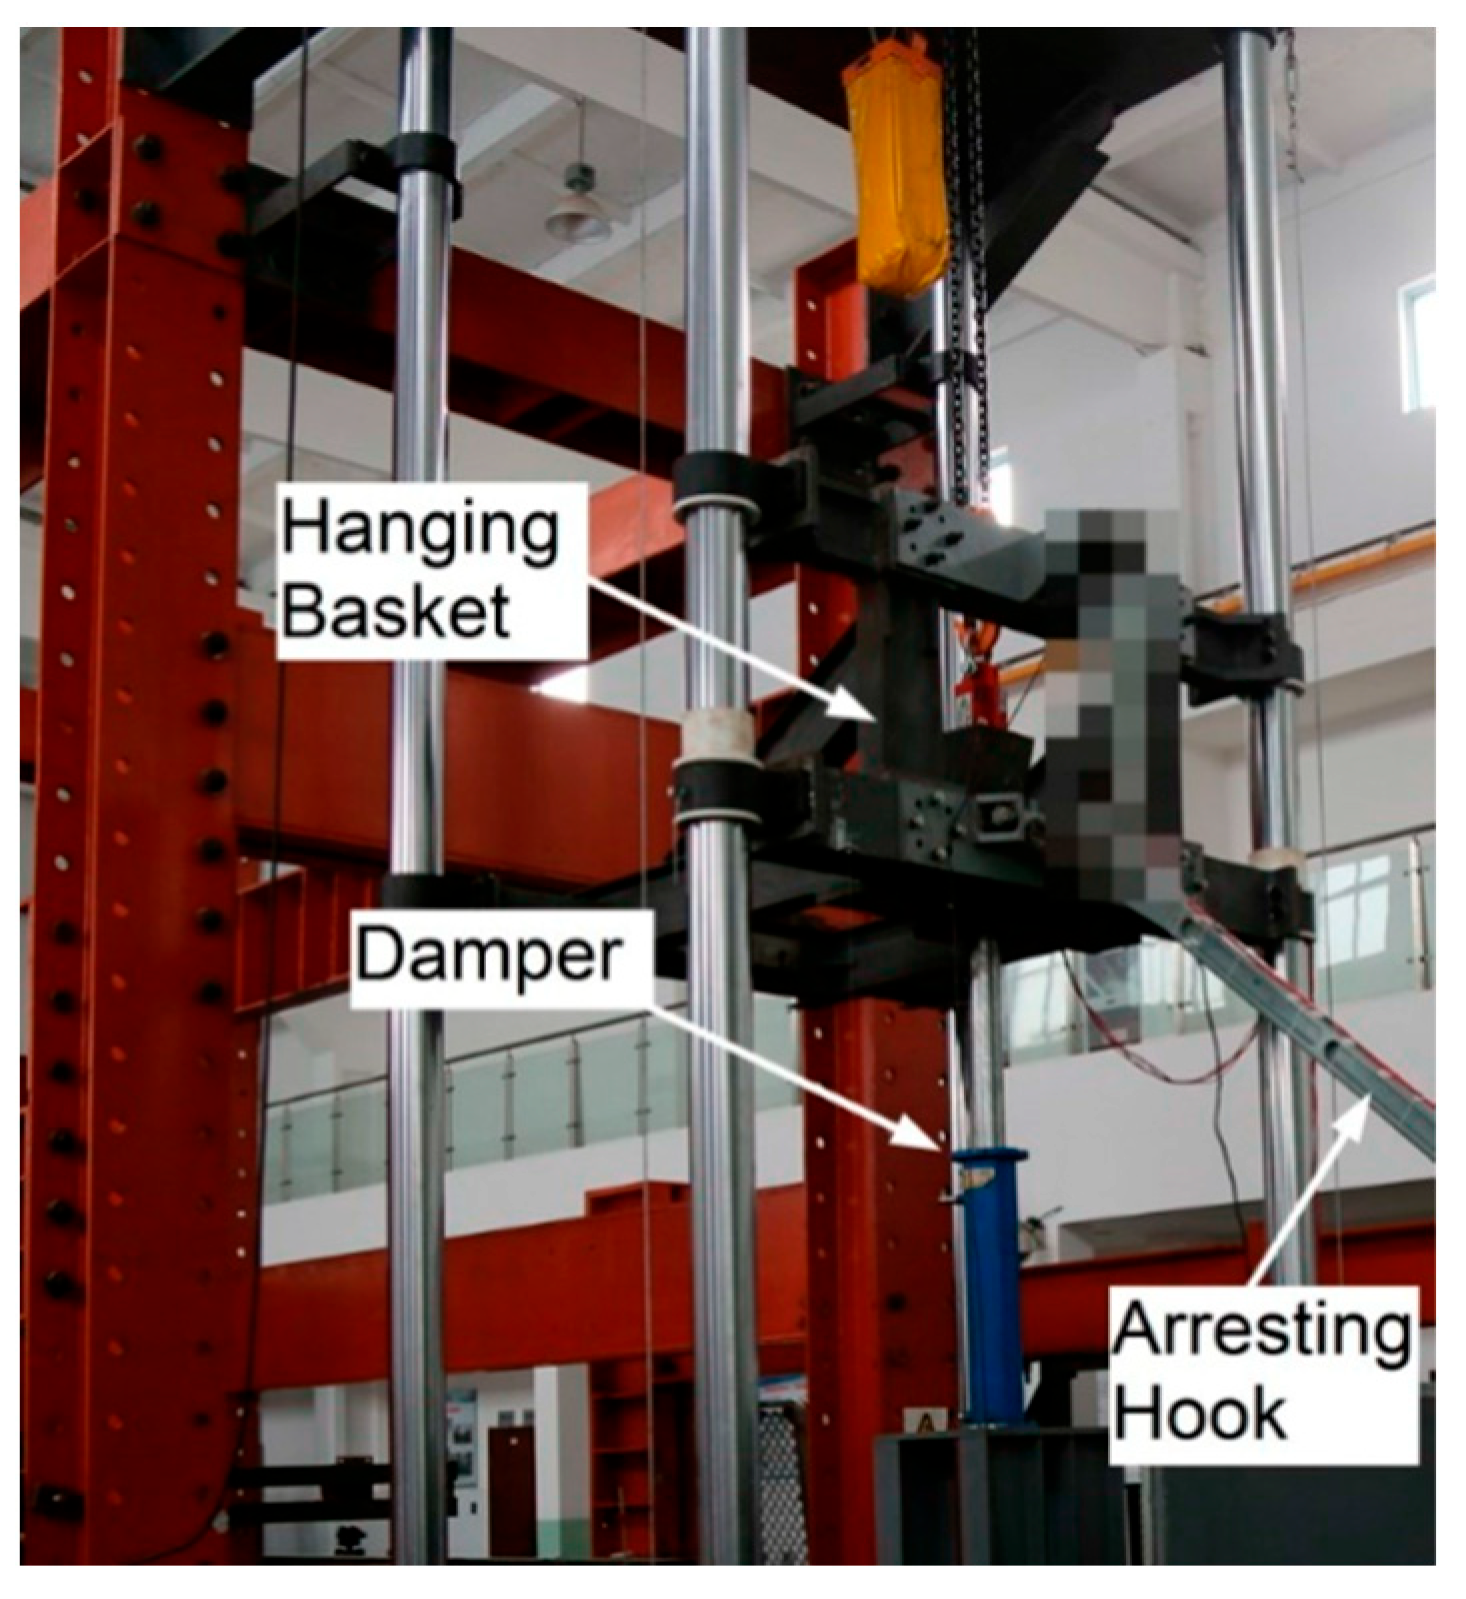
During each test, the basket was released remotely, allowing the hook head to collide with the rotating disc and rebound onto an adjacent platform, thus preventing secondary impact. High-speed cameras (10,000 fps) and strain gauges positioned at the hook neck and shank recorded the transient deformation process, while displacement sensors monitored basket motion, rebound height, and buffer stroke. The test parameters—including sink speed, impact force, and strain signals—were synchronously acquired at a sampling rate of 100 kHz using a multi-channel dynamic acquisition system. These experimental data provided accurate boundary conditions for finite element (FE) validation and calibration of material and contact parameters used in the VDISP-based virtual impact simulation. The main components and operating principles of the test system are shown in Figure 1 (schematic) and Figure 2 (photograph of the apparatus).

2.2. Numerical Simulation

2.2.1. Finite Element Modeling

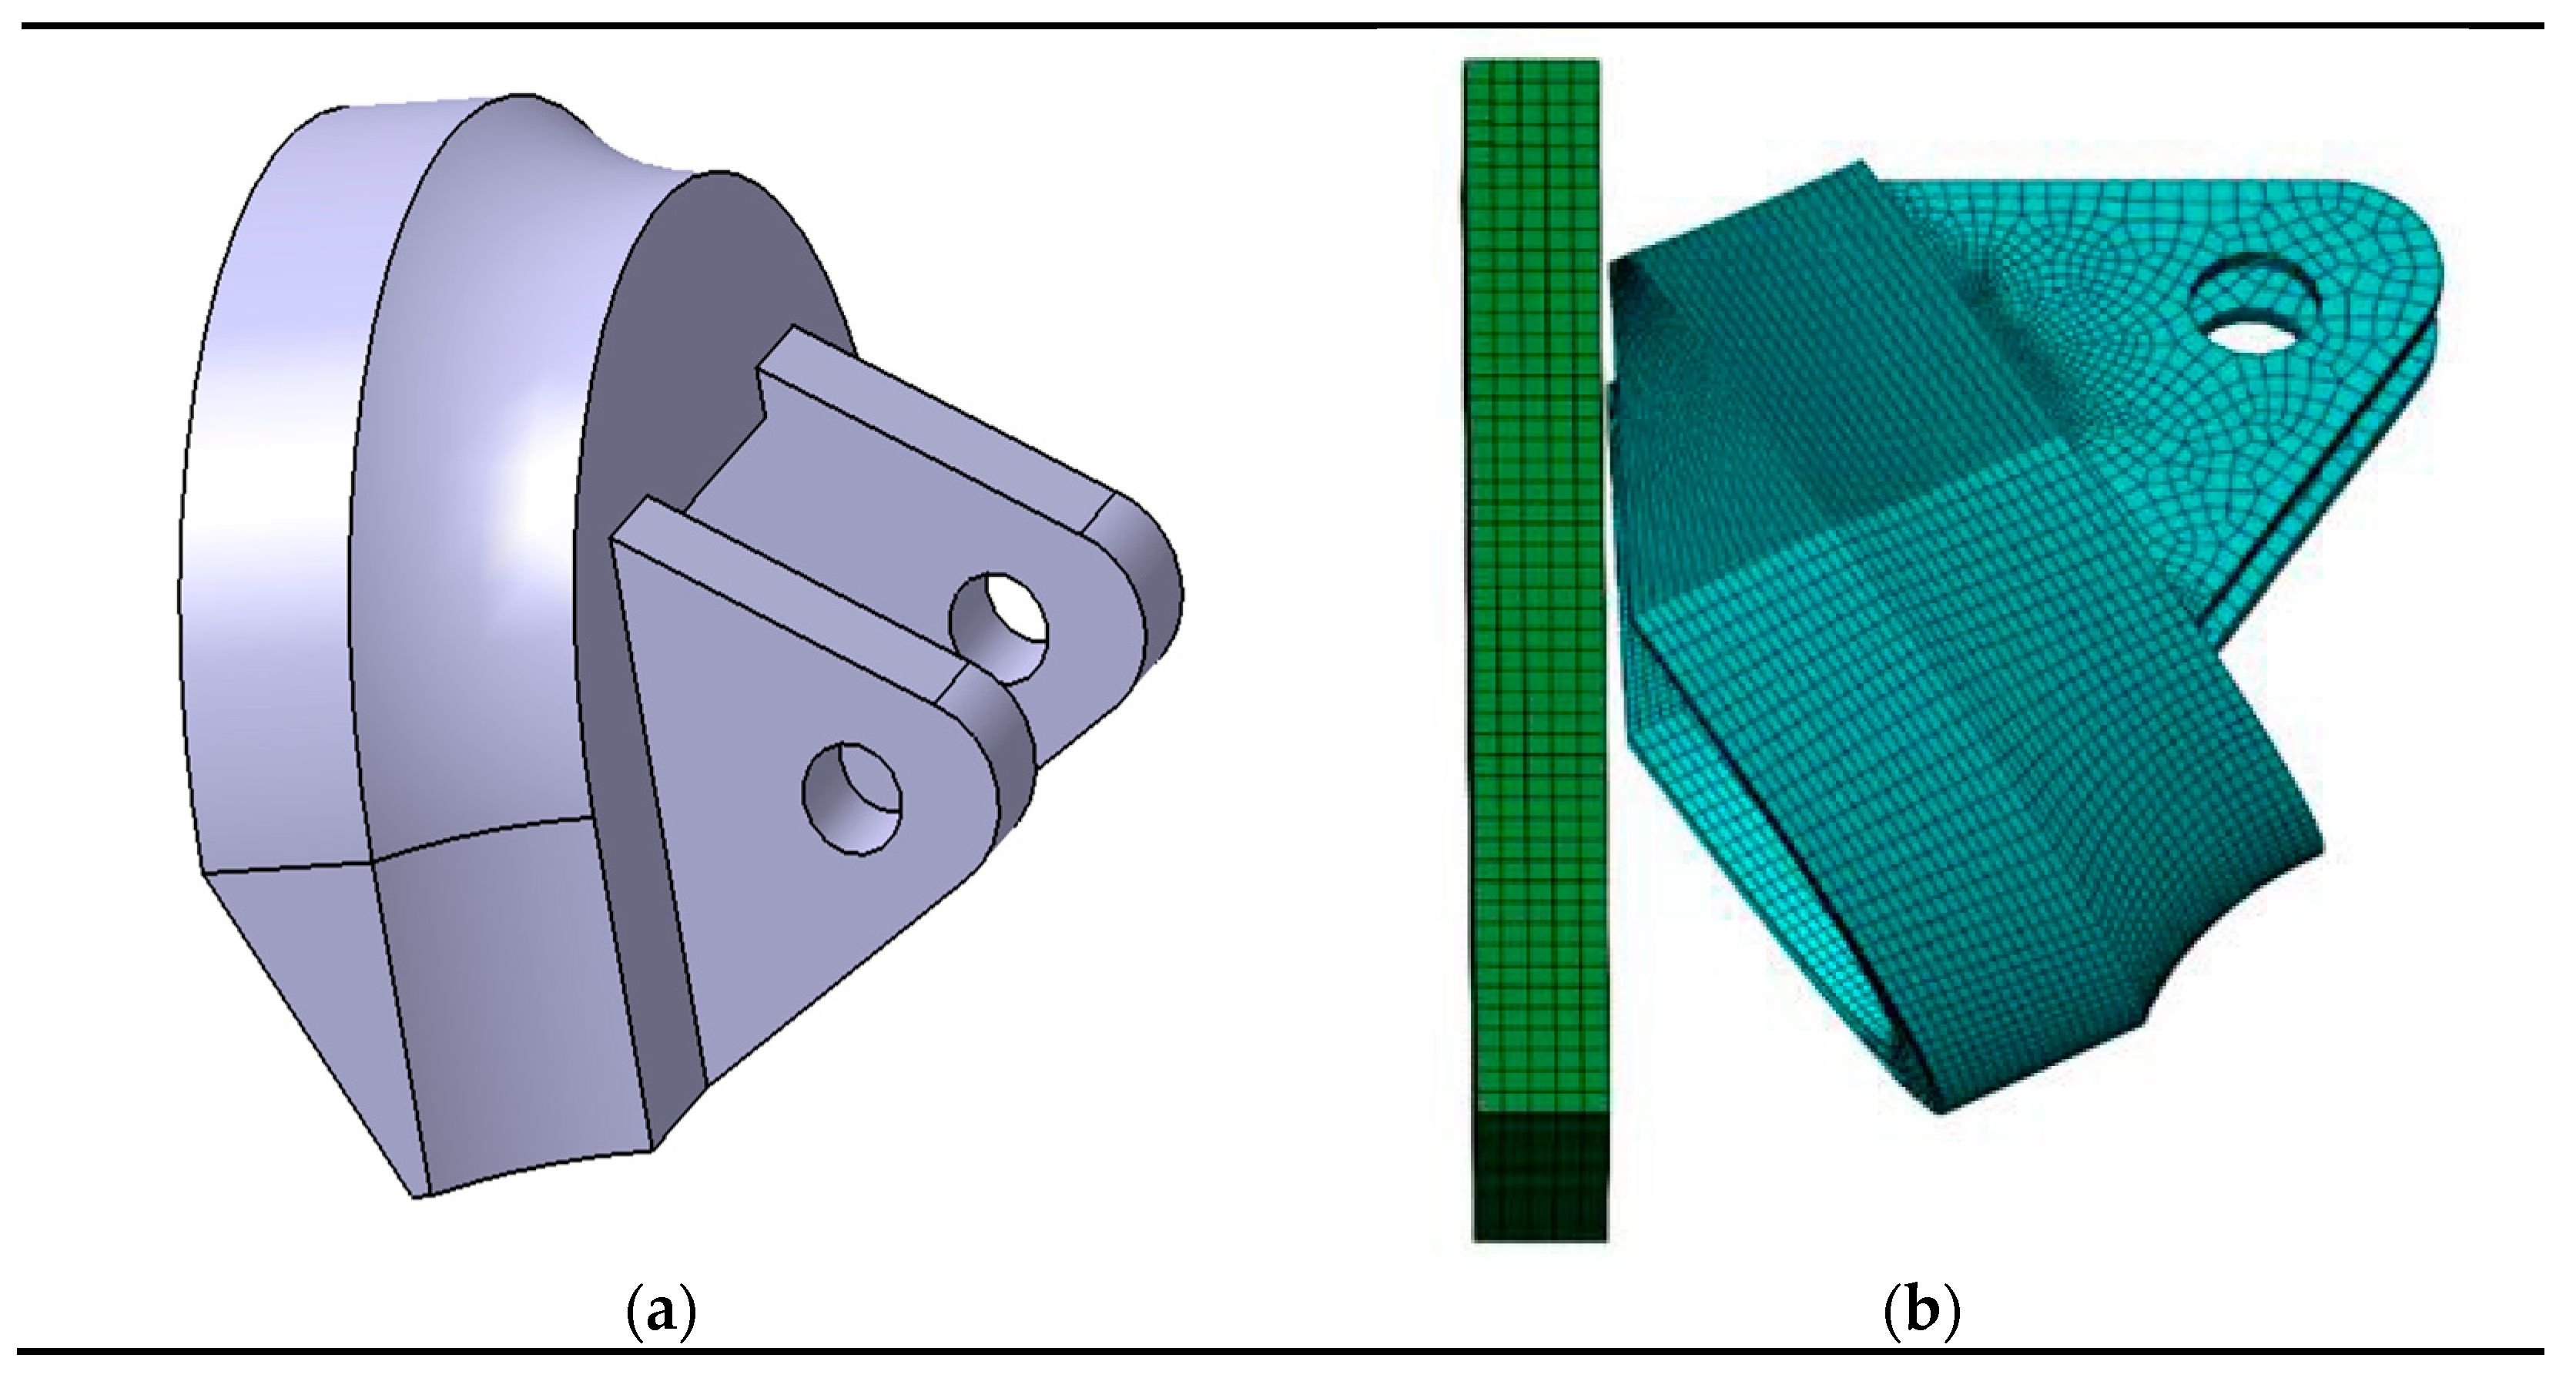
To replicate the experimental impact process and to evaluate the local stress and strain distributions, an explicit dynamic finite element model of the arresting hook head was developed using Abaqus/Explicit. The geometric model was simplified by removing non-load-bearing features while preserving the contact region and the lug area, which are critical for impact response prediction (Figure 3a). The finite element mesh was generated in HyperMesh with particular attention to element quality and aspect ratio, and the model was then imported into Abaqus for dynamic simulation. Hexahedral C3D8R elements were employed, with local mesh refinement in the contact zone and around the strain-gauge locations (Figure 3b).
Boundary conditions were defined to match the experimental configuration:
1.
The lug region of the hook head was fully constrained.
2.
The impact surface was allowed only vertical translation.
3.
The impact loading was applied as an initial velocity assigned to the hook head to ensure consistent kinetic energy across test conditions.
4.
The contact between the hook and the deck plate was modeled using a surface-to-surface interaction with a penalty-based normal behavior and a friction coefficient of 0.2.
Figure 4a presents the arrangement of strain measurement points consistent with the strain-gauge locations used in the experiment, while Figure 4b depicts the impact contact area defined for load application in both the experimental setup and the numerical model.

2.2.2. Material Constitutive and Failure Model

Given that high-strength steels exhibit pronounced strain-rate sensitivity and that certain regions of the arresting hook enter the plastic regime under the test conditions, the Johnson–Cook (J–C) constitutive model was adopted in this study to account for strain-rate effects. Its formulation is expressed as
σ = ( A + B ε p n ) [ 1 + C ln ( ε ˙ p / ε ˙ 0 ) ] [ 1 ( T T r o o m T m e l t T r o o m ) m ]
where ε ˙ 0 , ε p and ε ˙ p denote the reference strain rate, equivalent plastic strain, and equivalent plastic strain rate, respectively; T r o o m , T 0 and T m e l t represent the reference temperature, test temperature, and melting point of the material; and A , B , C , n m are material constants fitted from quasi-static mechanical tests of 30CrMnSiNi2A steel.
The corresponding J–C failure model is given as
ε f = [ D 1 + D 2 exp ( D 3 σ m σ e ) ] [ 1 + ε ˙ ε ˙ 0 ] D 4 [ 1 + D 5 T ]
The first term accounts for the influence of stress triaxiality σ ¯ m / σ e , while the second term accounts for the strain-rate effect. The parameters D 1 D 5 were calibrated from experimental data.
Failure was evaluated through a cumulative damage criterion, expressed as
D = Δ ε ε f
where D is the accumulated damage variable. Material failure is assumed to occur once D = 1 .
The parameters of the Johnson–Cook constitutive and failure models for 30CrMnSiNi2A steel, calibrated from quasi-static tensile and fracture tests, are summarized in Table 1 and Table 2.

3. Results and Analysis

3.1. Comparison Between Simulation and Experiment

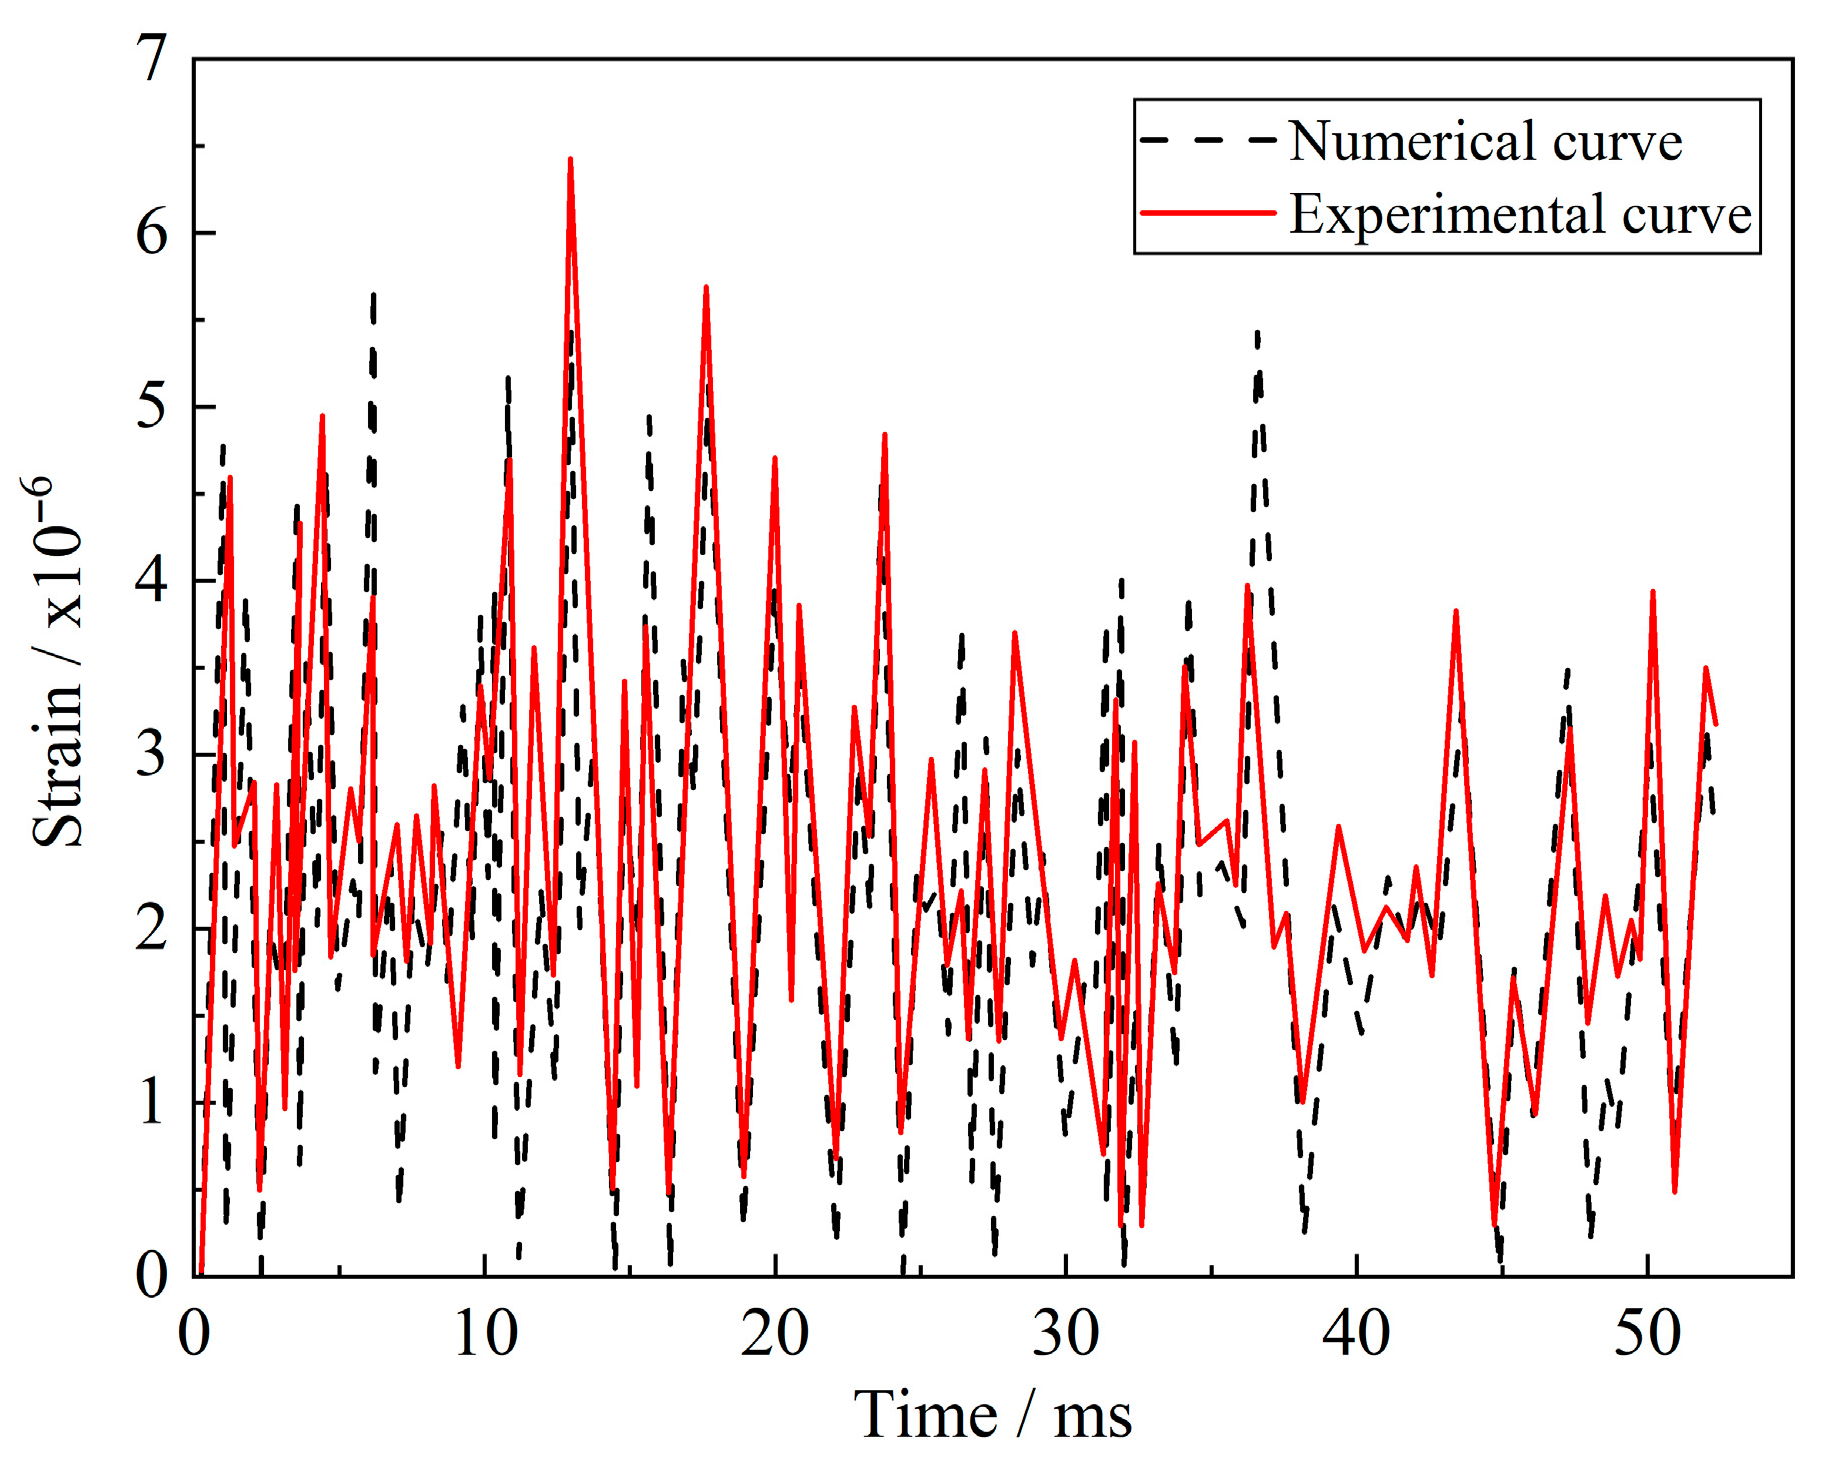
Due to experimental constraints and the limitations of strain-gauge placement, strain data could only be obtained from the lug-side region of the hook head (Figure 4a), and the corresponding simulation data were extracted from the same area. Figure 5 compares the simulated and experimental impact forces of the hook head under a single impact, while Figure 6 presents the strain responses of typical regions under three repeated impacts.
The results demonstrate close agreement between the experimental and numerical data. The experimentally measured peak impact force was 39.3 kN, while the simulated value was 41.9 kN, yielding a relative error of 6.6%. The amplitude and waveform of the simulated strain histories are consistent with the experimental observations, confirming that the finite-element (FE) model can accurately reproduce the transient contact and deformation process of the hook–deck system.
The slightly higher simulated values are attributed to the idealized frictionless boundary and the neglect of microscale surface roughness, which tend to increase model stiffness. Nevertheless, the consistency in response trends verifies the reliability of the FE model for further dynamic and fatigue simulations.

3.2. Dynamic Response of the Hook Head Impact Zone

After validation, the dynamic response of the hook head during repeated impacts was analyzed in detail. Figure 7 shows the contour distributions of maximum contact force, displacement, stress, and strain at a representative sink speed of 3.6 m/s. All responses exhibit strong localization in the hook–deck contact region, corresponding to the zone most prone to damage during service.
The maximum stress in this region (≈1794 MPa) exceeds the yield strength of 30CrMnSiNi2A steel, resulting in local plastic deformation and strain accumulation. With successive impacts, both the peak stress and the plastic strain slightly decrease, indicating the onset of material hardening and a reduction in incremental plastic energy dissipation.
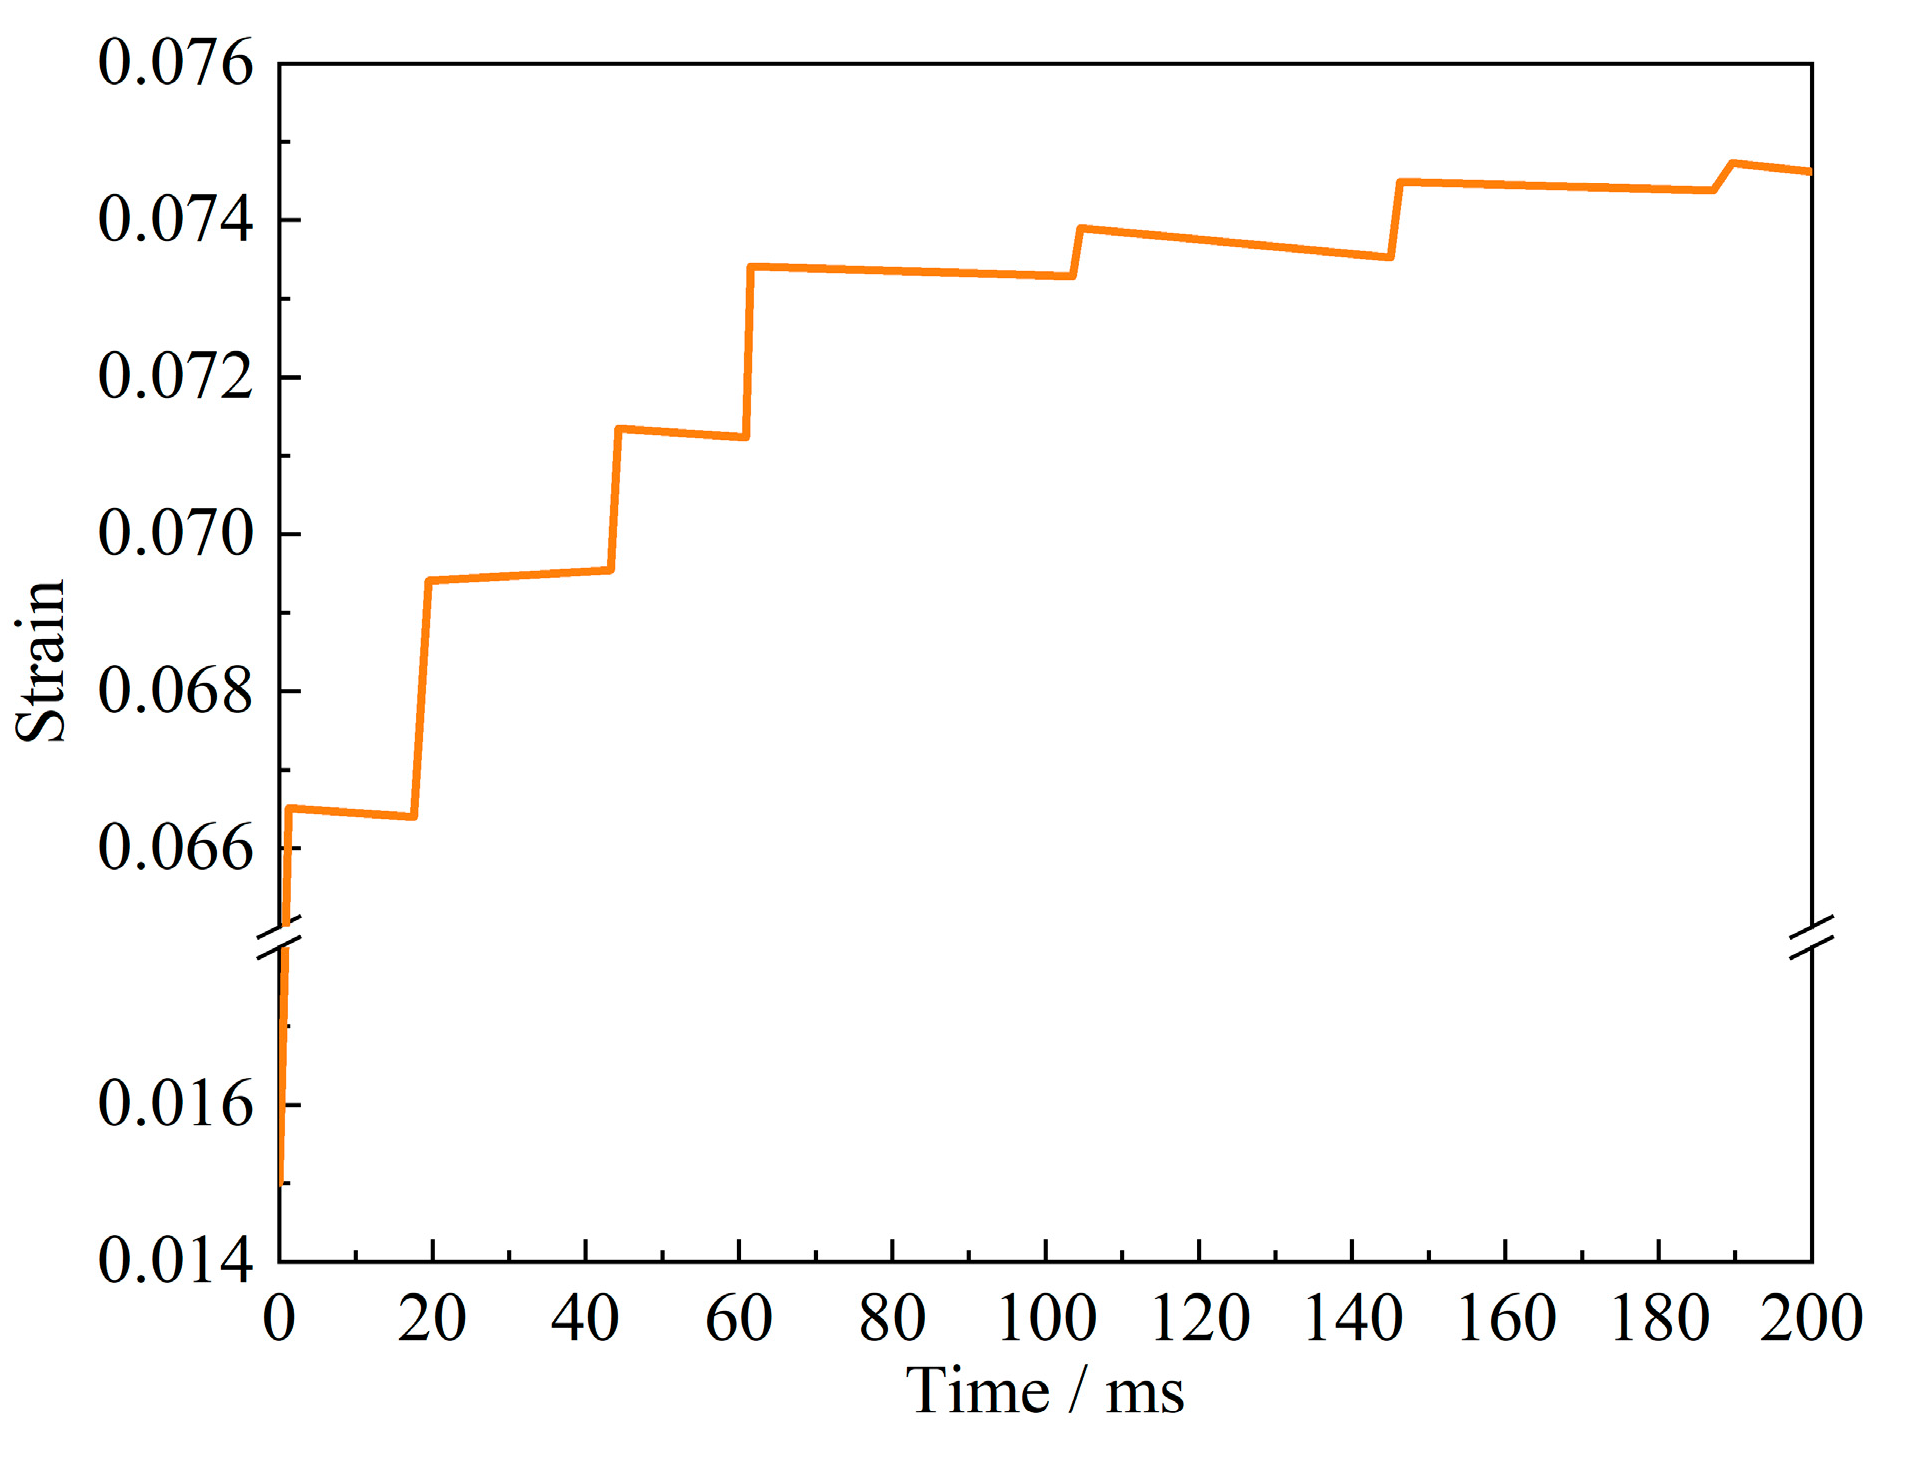
Figure 8 depicts the strain–time history of the critical element in the contact zone. A clear ratcheting effect of plastic strain is observed: the strain increases rapidly during the first several impacts and gradually stabilizes after about ten cycles. This evolution reflects the progressive increase in dislocation resistance and the transition from initial plastic accommodation to stable cyclic plasticity.
Quantitative results are summarized in Table 3. The first impact produced a plastic-strain increment of 0.0669, which decreased to approximately 0.0002 after ten impacts, confirming that plastic energy dissipation becomes less significant with repeated loading. This phenomenon is typical for high-strength steels subjected to transient impact loads.

3.3. Effect of Sink Speed on Dynamic Response

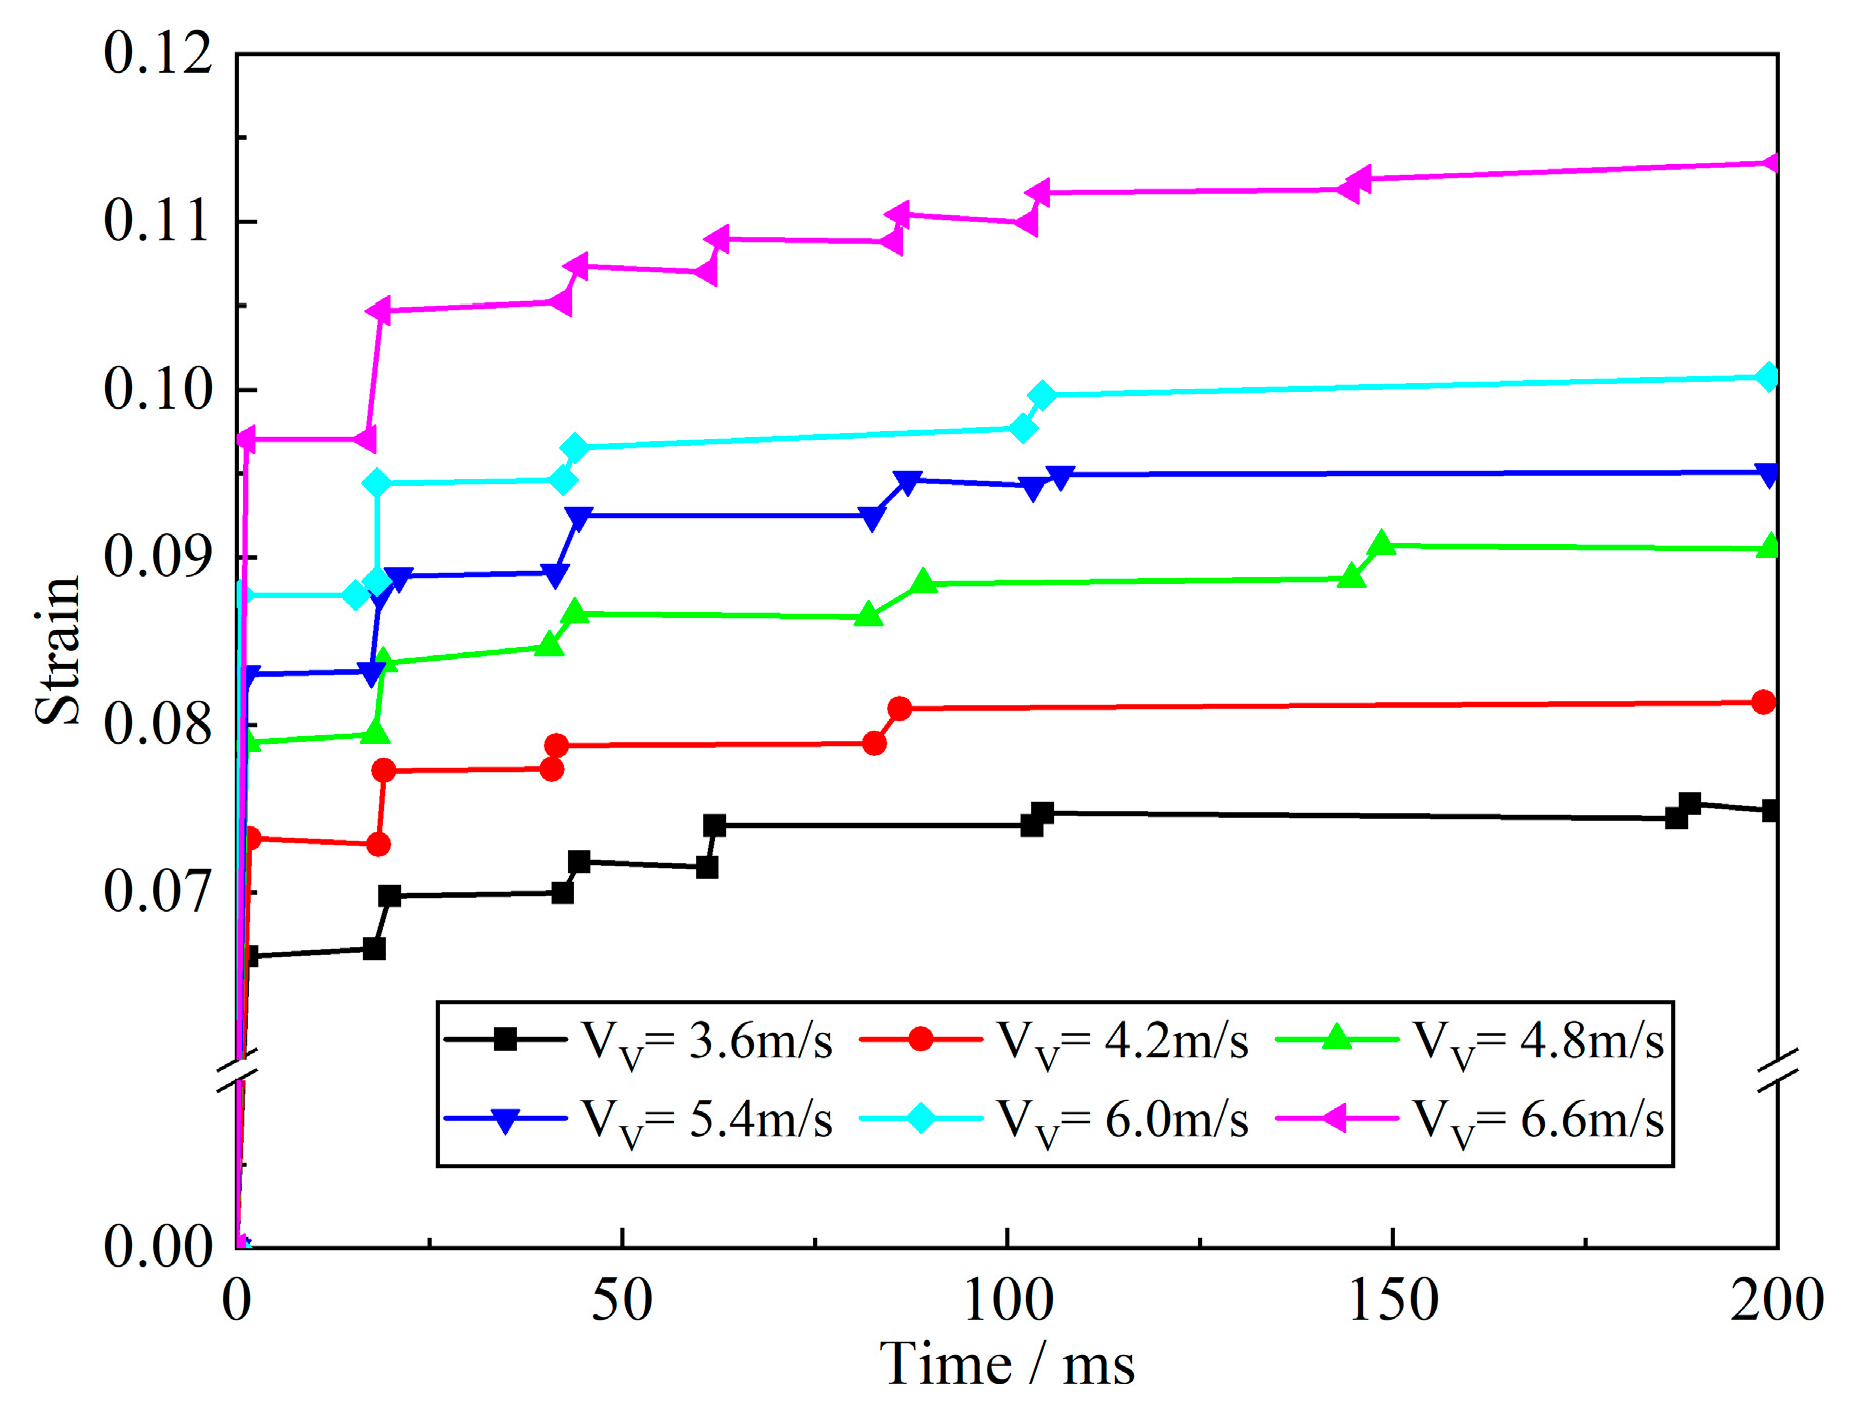
To investigate the influence of landing severity, six sink-speed conditions (3.6, 4.2, 4.8, 5.4, 6.0, and 6.6 m/s) were simulated using the validated FE model. Figure 9, Figure 10, Figure 11, Figure 12 and Figure 13 display the distributions of maximum contact force, displacement, stress, and strain for each case, while Figure 14 presents the corresponding strain–time histories of the critical regions.
As the sink speed increases, both contact force and stress–strain amplitudes rise markedly. The growth of plastic strain, however, is nonlinear and exhibits an increasingly pronounced ratcheting behavior. For sink speeds ≤ 4.2 m/s, plastic strain stabilizes after about five cycles; for ≥6.0 m/s, accumulation persists beyond ten cycles. The cumulative plastic strain and its incremental evolution are listed in Table 3, showing that higher sink speeds lead to larger residual strain and faster accumulation rates.
The cumulative plastic strain and its incremental evolution are listed in Table 3, showing that higher sink speeds lead to larger residual strain and faster accumulation rates. These results confirm that sink speed is the dominant factor controlling impact-induced fatigue damage. Consequently, maintaining a lower vertical descent velocity during carrier landings can effectively mitigate local plastic deformation and extend the service life of the arresting hook.

3.4. Discussion

The above experimental and numerical analyses reveal the mechanisms governing the deformation and fatigue evolution of the arresting hook under repeated impacts. The good agreement between experimental and simulated impact forces verifies that the Johnson–Cook constitutive model accurately captures the strain-rate-dependent behavior of 30CrMnSiNi2A steel. The slightly higher peaks in the simulation stem mainly from idealized boundary assumptions and material homogeneity. In real deck conditions, friction and the anti-slip coating introduce additional damping, slightly lowering the measured impact forces.
The strain–time histories demonstrate that cyclic impacts induce a non-uniform ratcheting process: early cycles dominate plastic energy dissipation, followed by gradual stabilization as the microstructure hardens. This behavior corresponds to the low-cycle fatigue characteristics commonly observed in high-strength steels under dynamic loading. The decreasing incremental strain per impact indicates that the system eventually reaches a quasi-stable cyclic state, transitioning from rapid damage accumulation to steady plastic response.
As sink speed increases, the accelerated accumulation of plastic strain leads to a shorter number of cycles to failure. The dependence of cumulative strain on sink speed provides a quantitative link between impact severity and fatigue degradation rate. These findings serve as the experimental and numerical foundation for the virtual fatigue testing framework introduced in Section 2.2.2 and the fatigue life prediction model developed in Section 4.
Overall, the combined experimental–numerical results confirm that the fatigue behavior of the arresting hook is governed primarily by the evolution of local plastic strain in the hook–deck interface. Accurate modeling of this region is thus essential for reliable fatigue-life prediction and for guiding structural optimization in carrier-based arresting systems.

4. Virtual Fatigue Testing and Fatigue Life Prediction Model

4.1. Virtual Fatigue Simulation Results

Based on the validated finite-element model and the VDISP subroutine framework described in Section 2.2.2, a series of virtual impact fatigue simulations was performed under different sink speeds ranging from 3.6 to 6.6 m/s. Each simulation reproduced the cyclic contact–rebound process of the hook head impacting the deck surface. The number of cycles was automatically controlled through the displacement–time function defined in the VDISP subroutine, which enabled continuous impact–separation–recontact cycles until local failure occurred.
Plastic strain accumulation and equivalent stress evolution were monitored at the critical elements near the lug region, where experimental strain gauges had been placed. As shown in Figure 15, the cumulative plastic strain increased progressively with each impact. The slope of the strain accumulation curve decreased after approximately ten cycles, indicating strain stabilization and the transition from rapid damage accumulation to a steady-state phase.
At higher sink speeds, the plastic strain accumulation rate was significantly accelerated, and local yielding propagated toward the fillet region. Once the equivalent plastic strain reached the critical threshold ε f , c r = 0.2307 , local failure was considered to occur. The number of impacts required to reach this limit defined the impact fatigue life N f . To summarize, the fatigue life under six sink speeds was determined through virtual fatigue testing, as listed in Table 4.

4.2. Development of the Fatigue Life Prediction Model

Building upon the virtual fatigue dataset in Table 4, the fatigue life prediction model was developed using the framework of Continuum Damage Mechanics (CDM). The fatigue life prediction model was developed within the framework of Continuum Damage Mechanics (CDM), which quantifies material degradation in terms of a scalar damage variable D (ranging from 0 for an undamaged state to 1 for complete failure). Under cyclic plastic loading, damage evolution can be expressed as
d D d N = S ( Δ ε p ) b ( 1 D ) c
where
D —scalar damage variable ( 0 D 1 );
S —damage coefficient reflecting material sensitivity to plastic strain;
Δ ε p —plastic strain increment per cycle;
b —cyclic hardening exponent;
c —damage saturation parameter describing the rate at which damage slows down as D approaches 1.
Integrating Equation (4) with the initial condition D = 0 at N = 0 gives
0 D f d D ( 1 D ) c = S ( Δ ε p ) b 0 N f d N
Which yields the analytical expression for the number of cycles to failure N f :
N f = ( 1 D f ) 1 c 1 S ( 1 c ) ( Δ ε p ) b
Here, D f represents the critical damage at macroscopic failure, generally assumed to be 1. Substituting D f = 1 simplifies the equation to
N f = K ( Δ ε p ) b , K = 1 S ( 1 c )
Equation (7) reveals a power-law relationship between the fatigue life and the plastic strain amplitude. By taking logarithms, this relationship can be linearized for regression analysis:
ln N f = ln K b ln ( Δ ε p )
This framework establishes a clear physical relationship between fatigue life and cyclic plastic strain amplitude.

4.3. Model Calibration and Validation

Nonlinear least-squares regression was used to identify the parameters S , b , c , and K , corresponding, respectively, to the material’s damage coefficient, cyclic hardening exponent, saturation parameter, and fatigue resistance constant.
By logarithmic linearization of Equation (8), a direct regression between N f and ln ( Δ ε p ) was obtained, yielding the best-fit relationship:
N f = 1.27 × 10 3 ( Δ ε p ) 1.48
The coefficient of determination R 2 = 0.991 indicates excellent agreement between simulation and prediction. The fitted curve and simulation data are illustrated in Figure 16, where the solid curve represents the fitted model and the data points correspond to the virtual simulation results.
The fitted parameters and regression quality are summarized in Table 5. The obtained values of S , b and c are consistent with the strain rate sensitivity and hardening characteristics of 30CrMnSiNi2A steel discussed in Section 3.4, confirming the physical consistency of the model.
The fatigue life and damage accumulation predicted under different impact severities are shown in Figure 17. With increasing sink speed, the plastic strain amplitude and damage rate both increase, leading to shorter fatigue lives. The damage evolution curve clearly demonstrates the transition from rapid ratcheting to a stable cyclic response, validating the physical reliability of the model. For quantitative verification, Table 6 compares the fatigue lives obtained from simulation, model prediction, and experimental references. The deviations are within 5%, confirming that the CDM model provides accurate life predictions for 30CrMnSiNi2A steel under cyclic impact conditions.
Overall, the maximum deviation between simulated, predicted, and measured data remains below 5%, demonstrating that the developed fatigue model can reliably capture both the trend and magnitude of life degradation under impact cyclic loading.

4.4. Discussion and Engineering Implications

The CDM-based fatigue life model effectively captures the progressive damage evolution of 30CrMnSiNi2A steel under cyclic impact loading. The calibrated parameters ( b = 1.48 , c = 0.21 ) show strong physical consistency with the material’s strain hardening and saturation behavior. As shown in Table 6, the deviation among simulated, predicted, and experimental fatigue lives remains below 5%, confirming the reliability of the model across varying impact severities.
The model successfully describes the transition from rapid ratcheting to stabilized cyclic plasticity. At low sink speeds, uniform plastic deformation dominates; at higher velocities, strain localization accelerates damage accumulation and initiates early failure near the lug fillet. This behavior aligns with the stress–strain evolution presented in Figure 5 and Figure 6 and the damage-rate trends in Figure 17.
From an engineering perspective, the proposed model provides an efficient tool for estimating the service life of arresting hooks without repetitive testing. It enables rapid evaluation under different sink speeds or impact energies and supports optimization of material selection and geometric parameters. The same framework can be extended to other high-strength alloys in carrier recovery systems, offering a unified approach for fatigue life management under cyclic impact conditions.
5. Conclusions

This study investigated the impact fatigue behavior of a 30CrMnSiNi2A steel arresting hook through repeated impact tests, finite element simulations, and a combined virtual fatigue testing and damage modeling approach. The main conclusions are:
1.
The repeated impact tests and simulations showed good agreement, confirming the reliability of the numerical model and capturing the dynamic response of the hook head under typical landing conditions.
2.
A pronounced stress–strain ratcheting effect was observed in the hook–deck contact zone. Accumulated plastic strain increased with sink speed, leading to reduced fatigue life.
3.
A fatigue life prediction model was developed based on virtual fatigue tests and an elasto-plastic coupled damage accumulation framework, providing a useful tool for fatigue assessment and life extension of arresting hook structures.

Author Contributions

Conceptualization, Y.P. and T.W.; methodology, T.W.; software, L.L.; validation, Y.P., T.W. and L.L.; formal analysis, L.L.; investigation, T.W.; resources, S.X.; data curation, L.L.; writing—original draft preparation, L.L.; writing—review and editing, Y.P.; visualization, L.L.; supervision, Y.P.; project administration, Y.P.; funding acquisition, Y.P. All authors have read and agreed to the published version of the manuscript.

Funding

This research was funded by the National Natural Science Foundation of Jiangsu (BK20220910); National Natural Science Foundation of China (52202441); Aeronautical Science Foundation of China (20240013052003).

Data Availability Statement

The original contributions presented in this study are included in the article. Further inquiries can be directed to the corresponding author.

Conflicts of Interest

The authors declare no conflicts of interest.

References

  1. Peng, Y.; Xie, P.; Wei, X.; Nie, H. Dynamics test research of bounce of carrier-based aircraft arresting hook. Appl. Sci. 2020, 10, 9033. [Google Scholar] [CrossRef]
  2. Shao, H.; Li, D.; Kan, Z.; Bi, L.; Yao, Z.; Xiang, J. Numerical simulation of aircraft arresting process with an efficient full-scale rigid-flexible coupling dynamic model. Chin. J. Aeronaut. 2024, 37, 586–602. [Google Scholar] [CrossRef]
  3. Li, L.; Peng, Y.; Wang, Y.; Wei, X.; Nie, H. Modeling the Transient Dynamics of Arresting Hooks and Cables through the Parameter Inversion Method. Aerospace 2023, 11, 20. [Google Scholar] [CrossRef]
  4. Leap, M.J.; Rankin, J.; Harrison, J.; Hackel, L.; Nemeth, J.; Candela, J. Effects of laser peening on fatigue life in an arrestment hook shank application for Naval aircraft. In Proceedings of the 2011 IEEE Conference on Prognostics and Health Management, Denver, CO, USA, 20–23 June 2011; IEEE: New York, NY, USA, 2011; pp. 1–11. [Google Scholar]
  5. MacKenzie, D.S. Failure Analysis of an Arresting Hook Point Shank. Mater. Perform. Charact. 2017, 6, 795–806. [Google Scholar] [CrossRef]
  6. Chen, H.; Fang, X.; Zhang, Z.; Xie, X.; Nie, H.; Wei, X. Parameter optimisation of a carrier-based UAV drawbar based on strain fatigue analysis. Aeronaut. J. 2021, 125, 1083–1102. [Google Scholar] [CrossRef]
  7. Yang, P.; Gong, S.; Yan, M. Low-cycle Impact Fatigue Crack Growth Behavior of 40Cr Steel. J. Nanchang Univ. (Nat. Sci. Ed.) 2002, 46–52. [Google Scholar]
  8. Dekhtyar, D.I.; Janiszewski, J.; Markovsky, P.E. Patterns of the mechanisms of deformation and strain hardening of titanium alloys and metal matrix composites based on the analysis of experimental results on quasi-static and dynamic compressions. Metall. Phys. Phys.-Chem. Met. 2025, 26, 626–679. [Google Scholar]
  9. Zhang, N.B.; Zhao, S.P.; Cai, Y.; Li, J.; Liang, X.; Lu, L.; Luo, S. Superior dynamic mechanical properties of high nitrogen austenitic stainless steel. Int. J. Mech. Sci. 2025, 307, 110897. [Google Scholar] [CrossRef]
  10. Wang, C.; Ran, X.; Cheng, X.; Li, Z.; Dong, H.; Wu, H.J.; Zhang, S.Q. Dynamic Mechanical Response and Deformation Mechanism of Laser-Directed Energy Deposited AerMet100 Ultra-High-Strength Steel Under Critical Fracture Strain-Rate Conditions. Metall. Mater. Trans. A 2025, 56, 5311–5330. [Google Scholar] [CrossRef]
  11. Song, X.R.; Wang, J.J.; Tu, X.X.; Hu, X.Y.; Zhao, D.; Ma, S.G.; Jiao, Z.M.; Zhang, T.W.; Wen, W.; Wang, Z.H. Coupling effects of temperature and strain rate on the deformation behavior of an equiatomic refractory high-entropy alloy. Rare Met. 2025, 1–19. [Google Scholar] [CrossRef]
  12. Reis, H.; Elri, K.; Öztürk, B.; Sezer, R. Impact of Fe and Co Additions on the Mechanical Behavior of NiTi Shape Memory Alloys: A Molecular Dynamics Study Under High Strain Rate. In Proceedings of the 6th International Conference of Materials and Engineering Technology (TICMET’25), Gaziantep, Turkey, 6–8 October 2025. [Google Scholar]
  13. Kim, S.J.; Kim, J.Y.; Park, D.K.; Sohn, J.M. Fracture behavior simulation of AH36 steel under drop test conditions using the GISSMO damage model. J. Constr. Steel Res. 2026, 236, 110056. [Google Scholar] [CrossRef]
  14. Duntu, S.H.; Boakye-Yiadom, S. Microstructural Evolution and Adiabatic Shear Band Formation in Tempered AISI 4340 Steel Under High Strain Rate and Elevated Temperature Impact. Mater. Today Commun. 2025, 49, 114059. [Google Scholar] [CrossRef]
  15. Boyce, B.L.; Dilmore, M.F. The Dynamic Tensile Behavior of Tough, Ultrahigh-strength Steels at Strain-Rates from 0.0002/s to 200/s. Int. J. Impact Eng. 2009, 36, 263–271. [Google Scholar] [CrossRef]
  16. Gilat, A.; Matrka, T.A. A New Compression Intermediate Strain Rate Testing Apparatus. In Proceedings of the European Physical Journal Web of Conferences, New York, NY, USA, 24–28 May 2010; pp. 425–429. [Google Scholar]
  17. Sun, Q.; Liu, X.R.; Liang, K. Impact fatigue life prediction for notched specimen of steel Aermet100 subjected to high strain rate loading. Int. J. Appl. Mech. 2018, 10, 1850030. [Google Scholar] [CrossRef]
  18. Lemaitre, J.; Desmorat, R. Engineering Damage Mechanics; Springer: Berlin/Heidelberg, Germany, 2005. [Google Scholar]
Figure 1. Schematic diagram of the test of arresting hook bounce.
Aerospace 12 00983 g001
Figure 2. Experimental setup of the arresting hook rebound test (reproduced from [1]).
Aerospace 12 00983 g002
Figure 3. Finite element modeling of the arresting hook head: (a) simplified geometric model of the arresting hook head; (b) meshed model for the explicit dynamic simulation.
Aerospace 12 00983 g003
Figure 4. Key structural regions of the arresting hook head: (a) layout of strain measurement points; (b) distribution of the impact contact area.
Aerospace 12 00983 g004
Figure 5. Comparison of simulated and experimental impact forces of the arresting hook head under a single impact.
Aerospace 12 00983 g005
Figure 6. Strain responses of typical regions of the arresting hook head under three repeated impacts.
Aerospace 12 00983 g006
Figure 7. Dynamic response contours of the hook head impact zone under a sink speed of 3.6 m/s: (a) maximum contact force; (b) maximum displacement; (c) maximum strain; (d) maximum stress.
Aerospace 12 00983 g007
Figure 8. Strain–time curve of the impact zone.
Aerospace 12 00983 g008
Figure 9. Dynamic response contours of the hook head impact zone under a sink speed of 4.2 m/s: (a) maximum contact force; (b) maximum displacement; (c) maximum strain; (d) maximum stress.
Aerospace 12 00983 g009
Figure 10. Dynamic response contours of the hook head impact zone under a sink speed of 4.8 m/s: (a) maximum contact force; (b) maximum displacement; (c) maximum strain; (d) maximum stress.
Aerospace 12 00983 g010
Figure 11. Dynamic response contours of the hook head impact zone under a sink speed of 5.4 m/s: (a) maximum contact force; (b) maximum displacement; (c) maximum strain; (d) maximum stress.
Aerospace 12 00983 g011
Figure 12. Dynamic response contours of the hook head impact zone under a sink speed of 6.0 m/s: (a) maximum contact force; (b) maximum displacement; (c) maximum strain; (d) maximum stress.
Aerospace 12 00983 g012
Figure 13. Dynamic response contours of the hook head impact zone under a sink speed of 6.6 m/s: (a) maximum contact force; (b) maximum displacement; (c) maximum strain; (d) maximum stress.
Aerospace 12 00983 g013
Figure 14. Strain–time curves of the impact contact region under different sink speeds.
Aerospace 12 00983 g014
Figure 15. Illustration of accumulated plastic strain in the hook head with increasing impact cycles: (a) 1 impact; (b) 10 impacts; (c) 50 impacts; (d) 100 impacts; (e) 400 impacts; (f) 800 impacts.
Aerospace 12 00983 g015
Figure 16. Fitted relationship between fatigue life and landing sink velocity of the arresting hook head.
Aerospace 12 00983 g016
Figure 17. Fitting curve of average damage parameter versus fatigue life of the hook head.
Aerospace 12 00983 g017
Table 1. Johnson–Cook constitutive model parameters of 30CrMnSiNi2A steel.
ParameterValueParameterValue
A/MPa1532n0.059
B/MPa1557m2.50
C0.016
Table 2. Failure model parameters of 30CrMnSiNi2A steel.
ParameterValueParameterValue
D 1 0.012 D 3 3.221
D 2 0.013 D 4 0.008
Table 3. Accumulated plastic strain with increasing impact cycles.
Number of ImpactsCumulative Plastic StrainIncremental Plastic Strain
10.06690.0669
20.07160.0047
30.07400.0024
40.07420.0002
50.07440.0002
60.07450.0001
70.07460.0001
80.07470.0001
90.07490.0002
100.07510.0002
Table 4. Fatigue life of the arresting hook head under different landing sink velocities..
Vertical Landing Speed (m/s)Fatigue Life (Landings)
3.6816
4.2551
4.8405
5.4239
6.0201
6.659
Table 5. Parameters of the fatigue damage model.
ParameterValue
S11.0507
c13.51756
b−0.82465
K0.65250
Table 6. Comparison between the fatigue life predicted by the proposed model and that estimated from virtual fatigue testing.
Vertical Landing Speed (m/s)Model Prediction
(Landings)
Virtual Test Estimation (Landings)Error (%)
3.68538164.53
4.25745514.17
4.8390405−3.70
5.42492394.18
6.0191201−4.98
6.661593.39
Disclaimer/Publisher’s Note: The statements, opinions and data contained in all publications are solely those of the individual author(s) and contributor(s) and not of MDPI and/or the editor(s). MDPI and/or the editor(s) disclaim responsibility for any injury to people or property resulting from any ideas, methods, instructions or products referred to in the content.