Abstract
Carbon fiber-reinforced polymer (CFRP) composite–metal joint structures are susceptible to localized discharge and thermal damage under lightning current, posing serious safety concerns for critical aircraft components such as fuel tanks. In this study, we investigated the conductive behavior of composite–metal lap joint structures subjected to multiple continuous lightning current components (A, B, and C*) through a combination of experimental testing and numerical simulations. The effects of fastener assembly methods on ignition events were systematically examined, and the ignition source generation mechanisms under interference-fit and clearance-fit conditions were revealed. The protective performance of different assembly approaches against ignition sources was also evaluated. The results indicate that the assembly type and installation method have a pronounced influence on the ignition threshold and damage modes. Specifically, interference-fit joints with wet installation exhibited no ignition even at a current of 91 kA, whereas clearance-fit joints without wet installation generated potential ignition sources at 14 kA. Wet installation effectively increased the ignition threshold by approximately twofold. Copper mesh on the composite surface played a crucial role in current conduction. The simulation results further demonstrated that the current became concentrated at the composite–metal interface upon removal of the copper mesh, causing local temperatures to exceed the resin pyrolysis temperature (893 K), thereby creating potential ignition sites. This study enhances the understanding of lightning ignition mechanisms in composite–metal lap joint structures and provides both theoretical and experimental foundations for improving lightning protection design in aircraft fuel tank structures.
1. Introduction
Lightning strikes are high-energy atmospheric discharge events that pose a major threat to civil aviation safety. According to statistics from the China Meteorological Administration, approximately 1800 thunderstorms occur in the Earth’s atmosphere at any given moment, with an average of over 100 lightning strikes per second. Among these strikes, about 1% exhibit current amplitudes exceeding 200 kA [1]. Carbon fiber-reinforced polymer (CFRP) composites have become primary load-bearing materials in modern commercial aircraft due to their high specific strength and substantial weight savings. For example, CFRP accounts for roughly 50% of the structural weight of the Boeing 787 and about 53% of the Airbus A350 XWB [2,3]. However, the inherently low electrical conductivity of composites makes them susceptible to localized heating, electrical arcing, and resin ablation, which may generate potential ignition sources within the structure and pose a serious risk to flight safety [4,5,6,7]. Aircraft fuel tanks are therefore critical components in lightning strike protection (LSP) design.
The prevention and suppression of lightning-induced ignition in aircraft fuel tanks have long been a major focus of the aviation industry. Since the 1960s, organizations such as the Federal Aviation Administration (FAA) and the Joint Aviation Authorities (JAA) have been established and subsequently issued a series of airworthiness and industrial standards. To guide LSP design, SAE-ARP 5412 [8] and SAE-ARP 5414 [9] divided the complex and variable characteristics of lightning into four standardized waveform components and specified detailed requirements for aircraft lightning zoning tests based on strike probability. In addition, SAE-ARP 5416 defines the use of photographic methods to effectively assess the likelihood of ignition within fuel tanks, further emphasizing the significance of studying the lightning response characteristics and ignition mechanisms of aircraft fuel tank structures [10,11].
In recent years, extensive experimental and numerical studies have been conducted to investigate the damage characteristics of carbon fiber-reinforced polymer (CFRP) composites with fasteners under lightning strikes. Feraboli et al. [12] performed scaled lightning current component A injections on single CFRP plates, both with and without fastener connections. Post-test evaluation combining ultrasonic inspection and mechanical testing revealed that the presence of fasteners significantly alters the evolution and severity of lightning-induced damage in CFRP materials [13,14]. When the lightning current conducts through the fastener, the current density at the metal–composite interface increases sharply. The resulting Joule heating can induce resin pyrolysis [15,16,17,18,19,20,21,22], often leading to spark ejection events within composite structures. Jiang et al. [23] conducted an in-depth study on the influence of interfacial material properties on damage behavior at the fastener–lap joint interface and highlighted the critical role of the fastening assembly method. Other researchers have investigated ignition phenomena in composite structures. Daniel et al. [24] developed an optical detection method using high-response photodiodes to capture and classify outgassing events at fasteners based on their temporal and intensity characteristics. Simon et al. [25] employed photographic techniques to compare the effects of different lightning current components on internal ignition phenomena, confirming the dominant role of high-peak current components in ignition occurrence. Although these studies have advanced the understanding of lightning effects and ignition characteristics in single CFRP plates, several limitations remain. In practice, most ignition incidents occur in composite–metal plate lap joint structures, whereas previous investigations have mainly focused on single-composite configurations. Moreover, the effects of assembly methods on interfacial conductivity and the evolution of ignition sources have not been systematically explored.
To investigate the ignition characteristics and underlying mechanisms of composite–metal joint structures under lightning current, this study focuses on a representative CFRP–aluminum alloy lap joint structure with four fasteners. Multiple continuous lightning current components (A, B and C*) were designed and applied in conduction experiments, complemented by thermo-electrical coupled finite element simulations. A systematic analysis was conducted on the ignition threshold and energy transfer pathways under different fastener assembly methods and sealing conditions. Furthermore, the roles of the protective layer and interfacial electrical conductivity in suppressing ignition sources were elucidated. This study provides important theoretical and experimental foundations for the lightning protection design and safety assessment of fuel tank regions in composite structures.
2. Research Methodology
2.1. Simulated Lightning Current Conduction Test Method
2.1.1. Preparation of Samples
To elucidate the ignition mechanism of composite structures during lightning current conduction, a simplified composite–aluminum lap joint configuration was selected as the research specimen (as shown in Figure 1). The upper composite plate measured 200 mm × 100 mm × 4.5 mm, while the lower aluminum plate measured 200 mm × 100 mm × 3 mm. The two plates were joined using a four-fastener lap joint arrangement. The specimens were fabricated using a co-curing process, achieving functional and structural integration between the copper mesh and the CFRP composites. The 73 g/m2 copper mesh was uniformly applied across the composite surface, and an 815 g/m2 copper mesh was additionally embedded in the fastener region (62 mm × 100 mm) as a protective layer. Finally, a corrosion-resistant epoxy primer was applied to the outer surface to enhance environmental durability and interfacial stability.
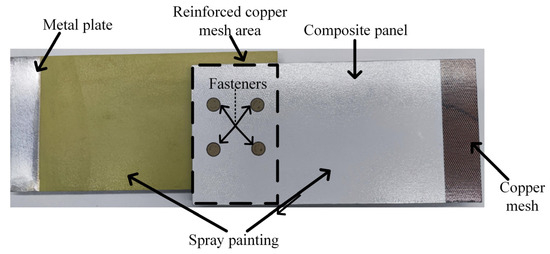
Figure 1.
Physical specimen of the composite–metal lap joint structure featuring four fastener connections.
This study investigates the influence of the fastener assembly type and installation method on ignition formation in composite–metal joint structures. The interference fit refers to a condition in which the nominal diameter of the fastener is slightly larger than that of the hole in the joined components, resulting in radial pressure and elastic deformation between the fastener and the hole wall after assembly. In contrast, a clearance fit occurs when the nominal diameter of the fastener is slightly smaller than that of the hole, leaving a macroscopic gap between the two after assembly. The wet installation method does not describe a dimensional fit but rather a processin which a paste-like chemical agent is pre-applied to the fastener threads or mating surfaces prior to tightening and installation. Based on different combinations of fit and installation methods, four types of specimens were fabricated, as follows S1 (interference fit with wet installation, composite edge sealed); S2 (clearance fit with dry installation, no primer applied in the nut area); S3 (interference fit with dry installation); and S4 (clearance fit with wet installation), as detailed in Table 1. Two specimens were prepared for each configuration. Considering variations in fabrication processes and lightning current parameters, only the most representative results were selected for experimental analysis and discussion.

Table 1.
Classification of assembly types and installation methods for the composite–metal lap joint specimens.
2.1.2. Experimental Setup
Simulated lightning tests are a common approach for investigating aircraft damage mechanisms and evaluating the direct effects of lightning strikes. To realistically reproduce the conditions of multiple discharge processes during a lightning event, the Society of Automotive Engineers (SAE) Lightning Committee established the standard SAE ARP5412 [8], which specifies the lightning environment for aircraft and defines the corresponding test waveform requirements. This standard has been widely adopted in aircraft testing and certification procedures. The standard lightning current waveform consists of four components, A, B, C, and D, each representing a different stage of a lightning strike. Component A corresponds to the initial stroke current, component B to the intermediate current, component C to the continuing current, and component D to the restrike current. The waveform parameters are illustrated in Figure 2. In addition to the peak current, the transferred charge (Q) and action integral (I) are key parameters for characterizing lightning current waveforms and defined as follows:
where i(t) is the function describing the current as it varies with time.
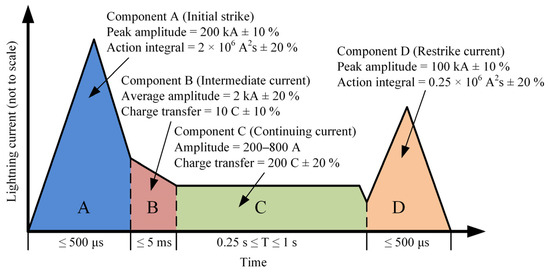
Figure 2.
Standard multiple continuous lightning current waveforms defined with SAE ARP5412 [12].
A lightning ignition source measurement platform for composite–metal structures was designed, as illustrated in Figure 3(a1,a2). Multiple consecutive lightning currents were applied to the specimen during testing. The monitoring equipment included two optical cameras (positioned in front of and behind the specimen) and an infrared thermometer. The cameras captured ignition phenomena during the discharge process using the long exposure mode. An infrared thermometer (model FLIR T62101 Täby, Sweden) recorded the surface temperatures of the specimen during and after lightning strikes, operating at a frame rate of 30 fps. Both the lightning strike platform and monitoring platform were fully enclosed within a darkroom constructed from fire-resistant tarpaulin.
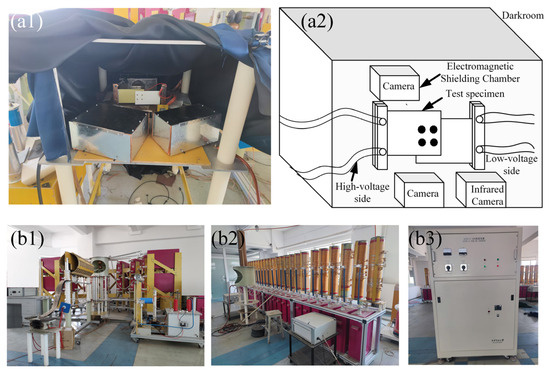
Figure 3.
Testing platform: (a1) and (a2) test platforms; (b1–b3) generators for lightning current components A, B, and C.
The lightning current waveform combination adopted in this study was the ABC mode, and the corresponding current generator systems are shown in Figure 3(b1–b3). During the experiments, multiple continuous component discharges were conducted in accordance with the equipment safety operation procedures. Taking component A as an example, the peak current was sequentially increased from 5 kA to 8 kA and 13 kA, with a 30 min interval between each test, until the specimen exhibited the first observable ignition event. Based on the standard lightning current waveform, the amplitude of component B and the charge transfer of component C were proportionally scaled to maintain waveform consistency. The resulting experimental currents are shown in Figure 4, where Figure 4a illustrates the temporal sequence of the components A, B and C, and Figure 4b–d present the individual waveform of the components A, B, and C. Notably, the initial positive pulse observed in the waveform of component C represents a system interference signal rather than an intrinsic part of the standard waveform.
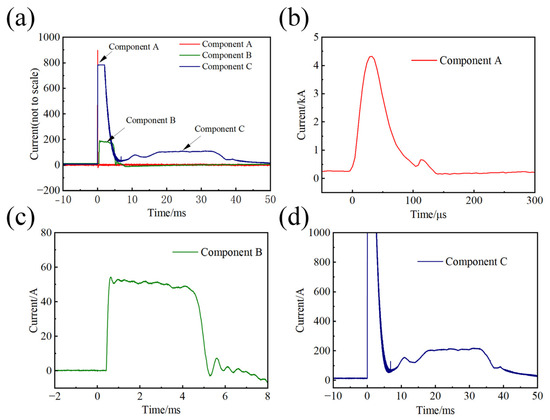
Figure 4.
Lightning current waveforms used in the experiments: (a) multiple continuous lightning current components A, B, and C; (b) lightning current component A; (c) lightning current component B; (d) lightning current component C.
2.2. Thermoelectric Coupling Simulation Modeling
In this study, COMSOL Multiphysics 6.0 was employed to perform a multiphysics simulation of the lightning-induced ignition effects in composite–metal joint structures. This simulation incorporated the electric current, magnetic field, heat transfer, and multiphysics coupling modules to achieve an integrated electro–magneto–thermal coupling analysis.
2.2.1. Thermal–Electrical Coupling Simulation Control Equation
When lightning current is injected, the current distribution within the composite fastener connection structure forms a unified whole. The current flowing out of any enclosed region equals the rate of charge reduction within that region. The conduction process of lightning current within the material follows Maxwell’s charge conservation equation. Due to the anisotropic conductivity of carbon fiber composites, according to Ohm’s law and Gauss’s law, the following holds [26,27]:
where represents the current density, E represents electric field strength, and denotes the charge density.
Using Einstein’s summation convention to expand tensor operations, and considering the actual situation, we note that the conductivity tensor σ does not vary with spatial position, that is .under electrostatic approximation conditions , [26,27]:
Composite panels generate Joule heat under the influence of lightning currents. This heat is conducted within the structure through microscopic molecular motion and dissipated outward via air convection and radiation. Three equations are involved: heat conduction, thermal convection, and thermal radiation, with the formulas as follows:
where Q represents the heat transfer rate (W), k denotes the thermal conductivity of the material (W/m·°C), A indicates the heat transfer area (m2), ΔT signifies the temperature difference (°C), and L represents the length of the heat transfer path (m).
where h denotes the convective heat transfer coefficient, which is related to the physical properties of the fluid and the heat transfer surface. Tsurface represents the surface temperature (°C), and Tfluid denotes the temperature of the main fluid flow (°C).
where ε denotes the surface emissivity, ε = 1 for a blackbody and 0 ≤ ε ≤ 1 for actual materials. σ represents the Stefan–Boltzmann constant, and T denotes the absolute temperature of the object’s surface.
2.2.2. Model Setup and Boundary Conditions
Considering the assembly configurations and key factors of wet installation in practical joint design, numerical models of the composite–metal structures were developed for the four configurations (S1, S2, S3, and S4) corresponding to the experimental lightning current tests. To evaluate the suppression effectiveness of different configurations against lightning ignition sources, identical simulation current parameters were applied: component A with an amplitude of 50 kA, component B with an amplitude of 0.67 kA and a duration of 5.6 ms, and component C with an amplitude of 0.21 kA and a duration of 0.268 s.
The geometric configuration and boundary conditions of the numerical model are illustrated in Figure 5. To enhance computational efficiency while minimizing influence on the local ignition region, the composite structure model was appropriately simplified as follows. Copper and epoxy resin were used to represent the copper mesh and sprayed coating material, respectively. For sealing requirements, epoxy resin material was applied to encapsulate the perimeter of the composite panel, the overlapping region between the two panels, and the nut area. For the wet installation and clearance fit assembly methods, interference fit in the simulation software manifests as complete contact between fasteners and composite plates during dry installation. Based on the estimated resistivity and volume parameters of the insulating sealant, the wet installation condition was represented in the simulation by applying a surface impedance of 100 Ω·m2 at the contact interfaces, as defined in the built-in unit system of COMSOL. The clearance fit is characterized by cutting a 0.14 mm thick annular ring around the bolt. For wet installation, the resin material defines the ring’s properties; for dry installation, air properties are used. The nut area of the S2 model (back side of the red box in the figure) is not painted.
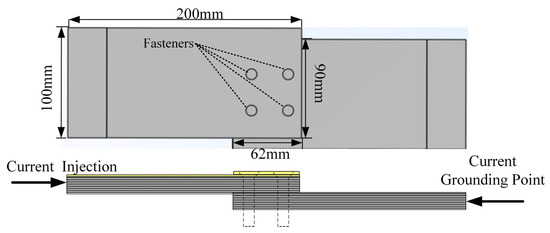
Figure 5.
Simulation model structure.
Three transient analyses were established in the finite element simulation software, corresponding to the effects of lightning components A, B, and C on the composite structure. This paper primarily analyzes the Joule heating distribution during the lightning strike, where the influence of thermal conductivity is negligible. Current injection points were set on the side of the composite plate, with the lower plate surface defined as the grounding point. Here, the ambient temperature T was set to 293K. Considering that the electrical conductivity of the composite material is 3–5 orders of magnitude lower than that of the copper mesh, most of the current is conducted through the copper layer. Therefore, the composite plate was modeled as a monolithic structure. The electrical conductivities (σxx, σyy, and σzz) and thermal conductivities (kxx, kyy, and kzz) were assigned based on experimentally measured values. The x, y, and z directions correspond to the fiber orientation, the transverse direction (perpendicular to the fibers), and the thickness direction, respectively. The detailed electrothermal properties of the composite plate are listed in Table 2.

Table 2.
Electrical and thermal physical parameters of the composite panel.
3. Thermal–Electric Effects and Ignition Source Characteristics Under Lightning Current Conduction in Connection Structures
3.1. Analysis of Test Results
We conducted multiple consecutive lightning tests on four representative specimen groups: an interference fit with wet installation, a clearance fit with no wet installation, an interference fit and no wet installation, and a clearance fit and wet installation. In this way, we systematically investigated the effects of fastener mating methods, wet installation conditions, and sealing conditions on the occurrence of ignition source phenomena in double-plate fastener structures. The findings were categorized into two primary scenarios: non-potential ignition sources and potential ignition sources. Based on the observed ignition locations during the experiments, the ignition sources were classified into non-potential and potential types. The former occurred on the fastener head side, while the latter were observed on the fastener shank side.
3.1.1. Non-Potential Ignition Sources
Conductive lightning current tests were performed on four sets of representative specimens, yielding the typical initial current thresholds at which the first sparking phenomenon occurred (Table 3). It is evident that the current thresholds are relatively low, significantly below the standard lightning current intensity. Photographs of the sparking phenomena are shown in Figure 6. It can be observed that the first instance of visible sparking occurred at the edge region where the fastener contacts the connecting plate, specifically at the fastener head. This occurrence is attributed to current concentration caused by the presence of the surface copper mesh, coupled with contact resistance at the fastener overlap area, leading to sparking. Notably, specimen S1 and those without wet installation exhibited pronounced sparking. In contrast, specimen S4 and those without wet installation showed only faint sparking. These results indicate that while the fastener head region is highly vulnerable during composite structure assembly using fasteners, it does not constitute a potential ignition source for fuel tanks.

Table 3.
Non-potential ignition test results for specimens with different structural configurations.
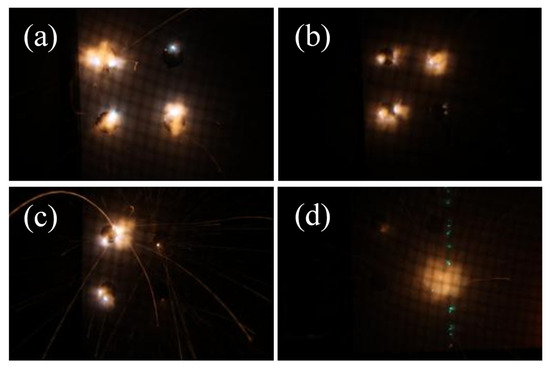
Figure 6.
Ignition source photography: (a) interference fit and wet installation (7.048 kA); (b) clearance fit and dry installation (6.739 kA); (c) interference fit and dry installation (4.205 kA); (d) clearance fit and wet installation (13.4 kA).
3.1.2. Potential Ignition Sources
Increasing the amplitude of the conduction current gradually revealed potential ignition sources, as detailed in Table 4. As the lightning current amplitude increased, the ignition thresholds ranked from lowest to highest as S2, S4, and S3. Comparing S2 with S3 indicates that clearance fits are more prone to generating ignition sources than interference fits. Under dry installation conditions, the lightning current component A threshold for ignition in clearance fits was only 14 kA. Under interference fit conditions, the threshold reached 70 kA. Comparing S2 and S4 indicates that wet installation significantly suppresses lightning ignition sources, doubling the ignition threshold to 44 kA before ignition occurs. Under S1 conditions, no potential ignition source appeared even at 91 kA, remaining present at the fastener head.

Table 4.
Potential ignition test results for specimens with different structural forms.
Images of the initial ignition sources generated by the four test specimens during the lightning test are shown in Figure 7. As seen in Figure 7b, only specimen S2 exhibited sparking at the fastener location, with distinct ablation marks appearing below the fastener in the lower right corner. Specimens S3 and S4 showed ignition at the lap joint interface between the composite panel and aluminum plate, accompanied by noticeable carbon deposits. The ablation marks on specimen S2 appeared near the fastener because the surrounding area lacked a coating layer, demonstrating the critical role of coatings in suppressing ignition sources. In specimens S3 and S4, ignition sources first appeared at the lap joint interface rather than near the fasteners. This result indicates that protection at the lap joint interface is also crucial for aircraft fuel tank ignition sources. For specimen S1, no ignition occurred on the fastener side. Instead, ignition remained concentrated on the fastener head side located outside the tank and did not, therefore, cause tank ignition. This outcome demonstrates that applying sealant at the fastener location and lap joint interface provides excellent ignition source suppression.
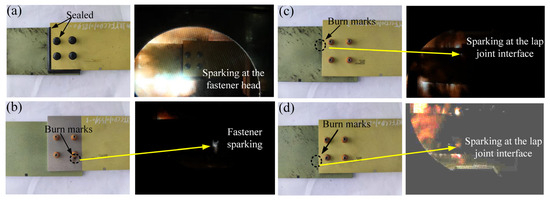
Figure 7.
Lightning strike test results: (a) interference fit with wet installation, S1; (b) clearance fit without wet installation, S2; (c) interference fit without wet installation, S3; (d) clearance fit with wet installation, S4.
Under the initial current injection conditions, severe ablation occurred on the surface copper mesh, with the specimen sustaining lightning strike damage. This damage compromised the copper mesh’s current-carrying capacity and structural integrity, rendering the derived ignition threshold inaccurate. Nevertheless, since specimens of different configurations experienced identical lightning current levels, conclusions can be drawn regarding the protective efficacy of various configurations against potential lightning-induced ignition sources. We will now validate these findings through simulation.
3.2. Analysis of Thermoelectric Coupling Simulation Results
The experiments indicate that in the presence of a copper mesh shield, non-potential ignition sources predominantly exhibit sparking phenomena, while the generation of potential ignition sources is closely linked to the characteristics of the copper mesh. This part of the study simulates current density and temperature distributions in both complete and copper-mesh-free structures, revealing the ignition source generation mechanism within composite structures. This section comparatively evaluates the ignition source protection effectiveness of four assembly methods: an interference fit with wet installation, a clearance fit with no wet installation, an interference fit with no wet installation, and a clearance fit with wet installation.
3.2.1. Model Validation
To validate the accuracy of the thermoelectric coupling finite element model, we selected the S1 specimen and conducted a comparative analysis between the experimental results and simulation outcomes. Under the conduction of lightning current (component A: 50 kA, component B: 0.67 kA, component C: 220 A), the upper wall panel surface exhibits a significant temperature gradient, with localized high temperatures primarily concentrated at the overlapping edges between fasteners (as shown in Figure 8(A-a)). Simultaneously, a high-temperature zone diffused from the current injection terminal toward the overlapping edges in non-overlapping regions, with surface temperatures exceeding 100 °C at the initial discharge moment. Figure 8B displays the simulated temperature distributions across three lightning currents. The results indicate that in component A, the temperatures rapidly climbed in the copper mesh area and fastener edges, reaching a critical value of 600 K (327 °C) around the fasteners at 200 μs, closely matching the experimentally observed localized high-temperature phenomenon. In component B, the temperature field became more uniform, forming an internal gradient of approximately 100 °C. Following component C, heat slowly diffused from the fastener periphery across the entire panel surface, with the composite surface layer reaching a maximum temperature of 420 K (147 °C).
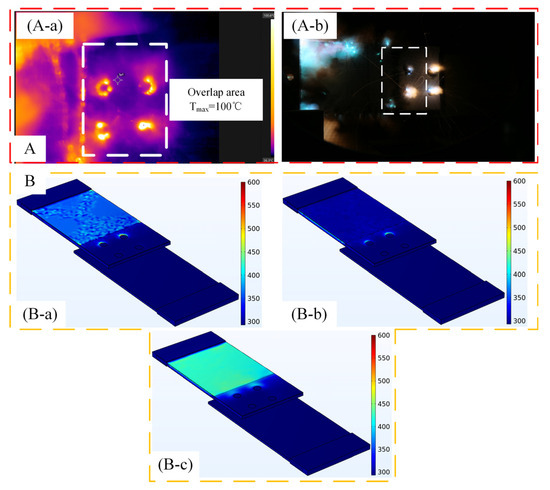
Figure 8.
Lightning current parameters 1 (component A: 50 kA, component B: 0.67 kA, component C: 220 A): (A): (A-a) infrared temperature measurement results on the structural upper surface; (A-b) static image information of ignition on the upper surface; (B): (B-a) simulation results of temperature distribution in component A; (B-b) simulation results of temperature distribution at the end of component B; (B-c) simulation results of temperature distribution at the end of component C.
3.2.2. Full Configuration
Figure 9 shows the temperature and current density distribution contour plots of specimen S1 under the effects of components A, B, and C. As shown in Figure 9(a1–a3), the high-temperature regions of the specimen are concentrated on the upper surface of the composite panel and along the edges of the metal fasteners, consistent with the experimental observations. The formation of these non-potential ignition zones primarily arises from the presence of the protective copper mesh on the composite surface. The conductivity of this material is significantly higher than that of the composite material, causing current to predominantly flow through the copper mesh and into the aluminum plate via the fasteners. The copper mesh–fastener interface generates substantial Joule heating, forming a non-potential ignition source. Concurrently, current conduction within the copper mesh produces Joule heating, leading to localized melting. The generated heat also diffuses via thermal conduction into the composite panel and fasteners. Comparing the (a) and (b) image pairs reveal excellent consistency between the specimen’s temperature and current density distributions. Subsequent analyses in this study primarily focus on temperature comparisons.
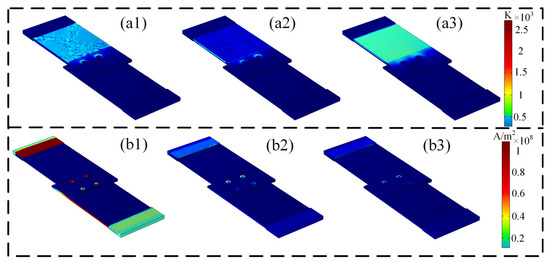
Figure 9.
Overall distribution diagram of S1 configuration (1: lightning current component A; 2: lightning current component B; 3: lightning current component C); (a1–a3) show temperature distribution; (b1–b3) show current density distribution. The current peaks for (a1) and (b1) are both 50 kA.
Figure 10 illustrates the temperature and current density distributions at the lower plate lap joint of specimen S1 under different lightning current components. S1 represents the complete structure, assembled using an interference fit with wet installation. This specimen configuration ensures good contact between the protective copper mesh and fasteners, forming a continuous current conduction path. The temperature increase at the lower plate overlap region is minimal, approximately 20 K, which is far below the melting points of both the composite material and the fasteners. Furthermore, the current density distribution map in (b) corroborates this finding. Due to the presence of the copper mesh, the overlap configuration does not significantly affect the current conduction path. The protective copper mesh provides excellent shielding against ignition sources. Consequently, no additional comparative analysis of the protective effectiveness was conducted under these conditions.
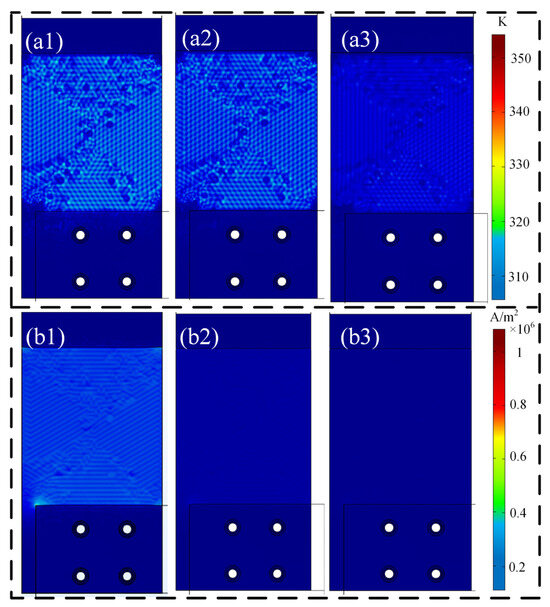
Figure 10.
Distribution diagram of the S1 configuration rear side (1: lightning current component A; 2: lightning current component B; 3: lightning current component C); (a1–a3): temperature distribution; (b1–b3): current density distribution. The current peaks for (a1) and (b1) are both 50 kA.
3.2.3. Copper-Free Mesh Configuration
Figure 11 shows the front and back surface temperature distributions of the S1 specimen without the copper mesh. Comparing the distribution diagrams in Figure 11a,b1–b3 shows that the temperature increase on the composite panel surface is significantly lower than that on the back surface. This difference occurs because the removal of the copper mesh alters the current conduction path. Without the copper mesh, the lower wall panel becomes the preferred current flow route. During multiple lightning current transmissions, current predominantly concentrates on the lower wall panel for conduction. After the injection of lightning current components A, B, and C, temperature rises exceeding 1000 K are observed around the fastener. These temperatures surpass the pyrolysis temperature of the composite resin matrix, creating potential ignition sources.
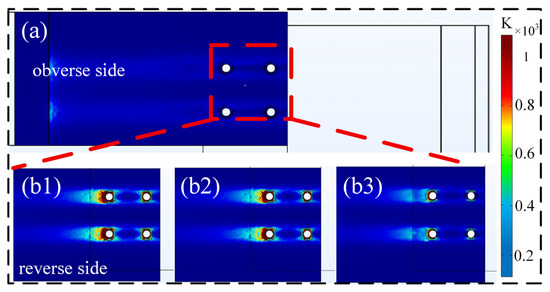
Figure 11.
Temperature distribution diagram of the S1 configuration without copper mesh (1: lightning current component A; 2: lightning current component B; 3: lightning current component C); (a): distribution on front side of the composite panel; (b1–b3): distribution on rear side of the composite panel; current peak: 50 kA.
Figure 12 shows the ignition threshold regions and their areal proportions for the four specimens after the lightning current component A. The threshold for complete resin pyrolysis is 893 K. Using this temperature as the boundary in the COMSOL software, regions exceeding the pyrolysis temperature on the composite panel’s rear surface were identified. The corresponding figure clearly shows that under interference fit conditions, the composite pyrolysis zone appears near the fasteners, covering a small area of less than 3% of the composite. Sparks may occur here, but components like the lower wall panel and nuts prevent them from developing into ignition sources. In contrast, the pyrolysis zone under clearance fit completely covers the overlapping area between the upper and lower panels, accounting for approximately 25%. This result effectively explains the phenomenon observed during testing where ignition sources appeared at the composite-to-metal overlap. Heat conduction is impeded at the gap-fit fastener locations, causing current accumulation at the overlap. This accumulation generates substantial joule heating, which directly evolves into an ignition source once the spark threshold is reached. It should be noted that this model cannot precisely simulate the coating layer, ignition location, or ignition threshold. However, it provides valuable guidance for evaluating the ignition suppression effectiveness of different overlapping structures.
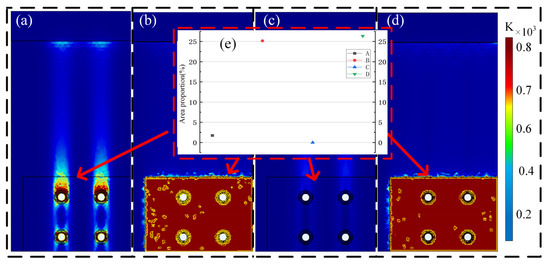
Figure 12.
Diagram of the ignition threshold area and its proportion after Component A (a): S1 specimen; (b): S2 specimen; (c): S3 specimen; (d): S4 specimen; (e): areal proportion; lightning current peak: 50 kA.
3.2.4. Comparison of Multiple Lightning Strike Temperature Results
We conducted multiple independent complex experiments for each sample type (S1–S4). Figure 13 clearly illustrates the temperature field distribution obtained for the S4 specimen under three different lightning current peak conditions. As shown in Figure 13, despite different current peaks, the distribution of high-temperature regions, ignition formation locations, and overall thermal response characteristics exhibited high consistency across all experiments. This reproducible pattern across varying energy levels strongly demonstrates that the observed phenomena are not coincidental but rather inevitable outcomes determined by the intrinsic physical properties of the samples.
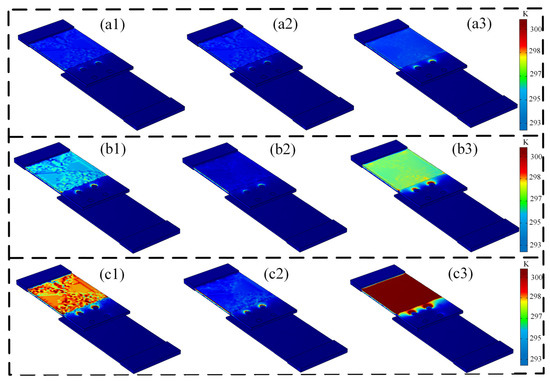
Figure 13.
Temperature distribution of specimen S4 under various lightning current components: (1) component A, (2) component B, and (3) component C; (a1–a3) current peak: 5.5 kA; (b1–b3) current peak: 8.6 kA; (c1–c3) current peak: 13.4 kA.
4. Conclusions
By comparing the ignition images and damage morphologies of specimens, this study systematically investigated the lightning response characteristics and ignition mechanisms of composite structures under different assembly conditions (interference/clearance fits and wet/dry installations). The suppression effectiveness of various assembly methods against ignition sources was evaluated, and the experimental results were further verified and supplemented through three-dimensional multiphysics simulations. The main conclusions are as follows:
(1) Protective layers effectively suppress ignition. The copper mesh protection layer on the composite surface plays a significant role in mitigating lightning-induced ignition. The conductive current primarily propagates along the low-resistance path formed by the copper mesh and metallic fasteners. However, surface ignition tends to occur at the interface between the composite surface and fastener head, disrupting the continuity of the conductive pathway.
(2) Assembly type markedly influences the ignition threshold. Under multiple continuous lightning current conduction, different assembly methods exhibit distinct ignition current thresholds. The interference-fit joint with wet installation did not exhibit ignition even at a lightning current amplitude of 91 kA (component A), whereas the clearance-fit configuration showed a much lower ignition threshold. Damage to the paint layer considerably reduced the suppression performance. Under clearance-fit conditions, ignition occurred at currents as low as 14 kA. An interference fit provides lower contact resistance and more uniform current distribution, while the wet installation suppresses local arc discharge through sealing media, increasing the ignition threshold by approximately twofold.
(3) Copper mesh integrity is critical for lightning protection. In configurations without a copper mesh, the current concentrates at the composite–metal interface, resulting in local temperature rises exceeding 893 K—indicative of potential high-risk ignition zones. Both the simulation and experimental results consistently demonstrate that ignition formation is strongly influenced by interfacial conductivity, thermal accumulation, and the continuity of the copper mesh network.
Although this study provides valuable insights into the ignition threshold and failure mechanisms of composite lightning protection systems through a combination of experimental and simulation approaches, the following limitations remain. The core of this model simulation is thermo-electrical coupling analysis, which successfully reproduces the heating process of composite panels under lightning current conditions and ignition phenomena near fasteners. However, the model treats the composite material as isotropic and employs a uniform contact impedance value, which introduces certain errors in predicting the internal current distribution and the precise locations of local hotspots.
Author Contributions
Conceptualization, K.D. and X.Y.; methodology, R.K. and Y.L.; validation, S.L., R.K. and J.S.; formal analysis, R.K.; investigation, Y.L.; resources, K.D.; data curation, R.K.; writing—original draft preparation, R.K.; writing—review and editing, K.D.; visualization, R.K.; supervision, K.D.; project administration, K.D.; funding acquisition, K.D. All authors have read and agreed to the published version of the manuscript.
Funding
This research received no external funding.
Data Availability Statement
The data presented in this study are not available on request from the corresponding author because they are part of an ongoing study.
Conflicts of Interest
The authors declare no conflicts of interest.
References
- Millen, S.L.J.; Murphy, A.; Abdelal, G.; Catalanotti, G. Specimen representation on the prediction of artificial test lightning plasma, resulting specimen loading and subsequent composite material damage. Compos. Struct. 2020, 231, 111545. [Google Scholar] [CrossRef]
- Wang, H.; Huo, S.; Chevali, V.; Hall, W.; Offringa, A.; Song, P.; Wang, H. Carbon fiber reinforced thermoplastics: From materials to manufacturing and applications. Adv. Mater. 2025, 37, 2418709. [Google Scholar] [CrossRef]
- Li, S.; Sun, J.; Guo, Y.; Liu, Q.; Wu, F.; Li, X.; Yao, X. Experimental investigation of electro-thermal-impact synergisticdamage mechanism of CFRP composites injected by impulse lightning current. Compos. Part B Eng. 2025, 307, 112918. [Google Scholar] [CrossRef]
- Hirano, Y.; Katsumata, S.; Iwahori, Y.; Todoroki, A. Artificial lightning testing on graphite/epoxy composite laminate. Compos. Part A Appl. Sci. Manuf. 2010, 41, 1461–1470. [Google Scholar] [CrossRef]
- Das, S.; Kumar, V.; Lee, J.; Yokozeki, T.; Okada, T. Thickness threshold study of polyaniline-based lightning strike protection coating for carbon/glass fiber reinforced polymer composites. Compos. Struct. 2022, 280, 114954. [Google Scholar] [CrossRef]
- Guo, Y.; Xu, Y.; Wang, Q.; Dong, Q.; Yi, X.; Jia, Y. Eliminating lightning strike damage to carbon fiber composite structures in Zone 2 of aircraft by Ni-coated carbon fiber nonwoven veils. Compos. Sci. Technol. 2019, 169, 95–102. [Google Scholar] [CrossRef]
- Li, S.; Sun, J.; Guo, Y.; Li, Y.; Wang, B.; Zhu, Y.; Li, M.; Yao, X. Analysis of the damage effects of carbon fiber composites under the mechanical impact loads of lightning based on a modified simulation calculation method. Compos. Part B Eng. 2024, 283, 111644. [Google Scholar] [CrossRef]
- SAE ARP 5412; Aircraft Lightning Environment and Related Test Waveforms[S]. SAE International Group: Warrendale, PA, USA, 2005.
- SAE ARP 5414; Aircraft lightning zoning[S]. SAE International Group: Warrendale, PA, USA, 2005.
- Wu, Y.; Wang, F.; Jiang, Z.; Cheng, S.; Duan, Z. An evaluation model of bearing capacity for CFRP connection structure with lightning thermal damage. Compos. Sci. Technol. 2023, 243, 110227. [Google Scholar] [CrossRef]
- Kirchdoerfer, T.; Liebscher, A.; Ortiz, M. CTH shock physics simulation of non-linear material effects within an aerospace CFRP fastener assembly due to direct lightning attachment. Compos. Struct. 2018, 189, 357–365. [Google Scholar] [CrossRef]
- Feraboli, P.; Kawakami, H. Damage of Carbon/Epoxy Composite Plates Subjected to Mechanical Impact and Simulated Lightning. J. Aircr. 2010, 47, 999–1012. [Google Scholar] [CrossRef]
- Chen, J.; Bi, X.; Liu, J.; Fu, Z. Damage Investigation of Carbon-Fiber-Reinforced Plastic Laminates with Fasteners Subjected to Lightning Current Components C and D. Appl. Sci. 2020, 10, 2147. [Google Scholar] [CrossRef]
- Kuang, C.; Zhou, Y.; Zhu, H.; Shi, Q.; Fu, K.; Li, Y. Thermal and mechanical damage to carbon fibre reinforced composites with metallic fasteners under lightning strike. Thin-Walled Struct. 2023, 193, 111280. [Google Scholar] [CrossRef]
- Chemartin, L.; Lalande, P.; Montreuil, E.; Delalondre, C.; Chéron, B.G.; Lago, F. Three dimensional simulation of a DC free burning arc. Application to lightning physics. Atmos. Res. 2009, 91, 371–380. [Google Scholar]
- Liu, Y.; Wang, Y. Modeling the lightning continuing current electric arc discharge and material thermal damage: Effects of combinations of amplitude and duration. Int. J. Therm. Sci. 2021, 162, 106786. [Google Scholar] [CrossRef]
- Chemartin, L.; Lalande, P.; Peyrou, B.; Chazottes, A.; Elias, P.Q.; Delalondre, C.; Cheron, B.G.; Lago, F. Direct Effects of Lightning on Aircraft Structure: Analysis of the Thermal, Electrical and Mechanical Constraints. Aerospace Lab 2012, 5, 1–15. [Google Scholar]
- Cho, Y.; Jeong, G.; Kim, C.; Kim, W.; Jeong, Y. Arc Plasma Flow Variation by Obstruction Structures between Anode and Cathode. Metals 2021, 11, 1416. [Google Scholar] [CrossRef]
- Millmore, S.; Nikiforakis, N. Multi-physics simulations of lightning strike on elastoplastic substrates. J. Comput. Phys. 2020, 405, 109142. [Google Scholar] [CrossRef]
- Ding, N.; Zhao, B. Analysis of damage influence factors on ablation damage of composite laminates subjected lightning strike. Trans. Mater. Heat Treat. 2014, 35, 186–192. [Google Scholar]
- Guo, Y. Lightning Strike Protection of Carbon Fiber Reinforced Polymer Composites. Master’s Thesis, Shandong University, Jinan, China, 2019. [Google Scholar]
- Fu, S.; Zhou, Y.; Shi, L.; Si, Q.; Wang, D.; Xu, J. Experiment and electrical-thermal coupled simulation for lightning current damage of carbon fiber reinforced plastic. Acta Mater. Compos. Sin. 2015, 32, 250–259. [Google Scholar]
- Jiang, Z.; Sun, J.; Guo, Y.; Li, S.; Yao, X. Effect of electrical contact performance between composite materials and fasteners on lightning damage characteristics of assembled structures. J. Compos. Mater. 2025, 42, 6231–6244. [Google Scholar]
- Carr, D.; Clark, D.; Stone, C.; Haddad, M.; Evans, S.; Jenkins, M.; Cole, M. Optical techniques for the analysis of outgassing of composite aircraft joints under lightning. In Proceedings of the 34th International Conference on Lightning Protection (ICLP), Rzeszow, Poland, 3–7 September 2018; IEEE: New York, NY, USA, 2018; pp. 1–5. [Google Scholar]
- Evans, S.; Jenkins, M.; Cole, M.; Haddad, M.; Carr, D.; Clark, D.; Stone, C.; Fay, A.; Mills, R.; Blair, D.; et al. An introduction to a new aerospace lightning direct effects research programme and the significance of Zone 2A waveform components on sparking joints. In Proceedings of the 2016 33rd International Conference on Lightning Protection (ICLP), Estoril, Portugal, 25–30 September 2016; IEEE: New York, NY, USA, 2016; pp. 1–6. [Google Scholar]
- Ma, X.; Wang, F.; Wang, Z.; Li, Y.; Xu, B. Thermal dynamic damage of aircraft composite material suffered from lightning channel attachment based on moving mesh method. Compos. Sci. Technol. 2021, 214, 109003. [Google Scholar] [CrossRef]
- Wang, F.; Ma, X.; Wei, Z.; Wu, Y.; Huang, C. Lightning damage of composite material driven by multi-physics coupling. Compos. Sci. Technol. 2023, 233, 109886. [Google Scholar] [CrossRef]
Disclaimer/Publisher’s Note: The statements, opinions and data contained in all publications are solely those of the individual author(s) and contributor(s) and not of MDPI and/or the editor(s). MDPI and/or the editor(s) disclaim responsibility for any injury to people or property resulting from any ideas, methods, instructions or products referred to in the content. |
© 2025 by the authors. Licensee MDPI, Basel, Switzerland. This article is an open access article distributed under the terms and conditions of the Creative Commons Attribution (CC BY) license (https://creativecommons.org/licenses/by/4.0/).