Article

Research on Residual Strength and Evaluation Methods of Aircraft Panel Structures with Perforations

Aviation Engineering School, Air Force Engineering University, Xi’an 710043, China
*
Author to whom correspondence should be addressed.
Aerospace 2025, 12(11), 950; https://doi.org/10.3390/aerospace12110950 (registering DOI)
Submission received: 11 September 2025 / Revised: 4 October 2025 / Accepted: 20 October 2025 / Published: 24 October 2025
(This article belongs to the Section Aeronautics)

Abstract

This study, via a combination of experiments and numerical simulations, investigates the structural tensile failure mechanisms of battle-damaged aluminum alloy flat panels and stiffened panels, the variation in their residual strength with hole characteristics, and modifies the calculation formula of the net-section failure criterion for evaluating damaged panels’ residual strength. Experimental and simulation results demonstrate that hole size and position exert a significant influence on panels’ residual strength: larger hole size and greater eccentricity both diminish load-bearing capacity, stiffened panels with web damage exhibit lower load-bearing capacity than those with flange damage. Different hole positions induce edge effects that alter stress distribution at the hole cross-section. Introducing a stress averaging coefficient modifies the residual strength evaluation of flat panels, which is further extended to stiffened panels with high result accuracy. This study presents a rapid method for evaluating damaged panels’ residual strength and serves as a reference for aircraft battle damage repair (ABDR) design.

1. Introduction

Aircraft battle damage is inevitable during combat operations [1], and battle damage repair (BDR) is crucial for restoring aircraft mission capability and maintaining fleet size. For instance, during the 1973 Middle East War, Israel effectively implemented battle damage assessment and repair, which yielded significant benefits and helped Israel gain air superiority [2].
In modern warfare, high-velocity fragments from missile warheads have gradually replaced anti-aircraft artillery as the primary threat capable of damaging and destroying aircraft structures [3]. Consequently, the assessment of the residual strength of structures with circular hole damage has become a focal point in battle damage assessment (BDA). Fragment penetration into aircraft structures causes extensive perforation damage. Metallic panel perforation, as a major type of aircraft battle damage, significantly reduces the structural strength of the aircraft, jeopardizes flight safety, and becomes a primary factor affecting the aircraft’s sustained operational capability [4,5]. The battle damage repairability of aircraft plays a crucial role in maintaining the integrity and availability rates of aircraft fleets. Temporary battle damage repairs are often time- and resource-limited, leading to the adoption of sub-strength repairs, non-strength repairs or deferred repairs, provided the structure meets minimum mission requirements for the next sortie [6,7]. Sub-strength repair restores battle-damaged aircraft structure to a strength level below that of the intact structure, such as by applying skin patches. Non-strength repair refers to a simple restoration where the repaired structure’s strength is not significantly improved over the battle-damaged state, involving only operations like trimming the damage, smoothing sharp edges, or drilling stop holes. No repair means leaving the battle damage completely untreated, though this approach is generally not adopted. Perforations caused by low-velocity fragment impacts often have torn edges and cracks. Methods such as grinding or cutting sharp jagged edges (to address fragmentation damage) can be employed to reduce stress concentrations around the hole edge. In contrast, the edges of holes caused by high-velocity fragment impacts are relatively smooth [8], allowing for simple trimming of the burned or affected edges. To assess the extent of damage in battle-damaged structures, it is necessary to introduce non-destructive inspection (NDI) methods such as visual testing or ultrasonic testing to identify the type of damage, thereby further determining the appropriate battle damage repair methods [9,10,11]. Regardless of the repair method for perforation damage, the goal is to shape the hole into a regular, smooth circular opening to mitigate stress concentration. Therefore, evaluating the residual strength of panels containing circular holes is both rational and effective.
During the missile target interception process, combat aircraft frequently perform high-intensity evasive maneuvers (e.g., rapid turns and sudden acceleration/deceleration), generating substantial stresses in critical structural components such as wing skins, fuselage panels, and control surfaces [12], which may lead to local failure of battle-damaged structures. Aircraft that return with battle damage may undergo simple battle damage repair (e.g., cutting irregular ruptures into smooth round holes) for subsequent sorties. However, under high operational loads, such hastily repaired structures risk failure. Simultaneously, the urgency of wartime operations requires that repairs to damaged structures be completed within 24 h. Aircraft that cannot be fully repaired must return to missions with their damage (which may have undergone simple temporary repairs). These damaged aircraft might operate under restricted conditions and for short durations, making fatigue damage negligible in the residual strength assessment of battle-damaged aircraft structures. Consequently, the residual strength evaluation primarily focuses on static strength [13]. It is also necessary to effectively evaluate the structural strength after simple repairs.
In the past, the evaluation of residual strength for aircraft metallic structures after battle damage has covered two types of damaged structures: prefabricated damage and damage induced by fragment impact. In terms of evaluation methods, it has involved either qualitative analysis of failure modes or quantitative evaluation of residual strength. For qualitative analysis, Yang et al. employed experimental research and finite element analysis (FEA) to investigate the influence of through-hole damage on the tensile properties of variable-section titanium alloy honeycomb panels. Their results indicated the existence of a through-hole damage diameter threshold (40 mm) for these panels. The tensile fracture modes varied with different hole diameters, and the tensile failure load decreased linearly with increasing through-hole damage diameter [14]. He et al. investigated the mechanical behaviors and failure mechanisms of fiber metal laminates (FMLs) with multiple holes under tensile loads via various experimental and simulation systems. The results indicated that the number of holes exerted a minor influence on the ultimate strength but significantly affected the final failure strain; as the layup direction deviated from the principal axis, the fracture mode transformed from brittle fracture to tensile-shear mixed-mode failure dominated by fiber pull-out and matrix shear [15]. Wang et al., combining fragment impact damage tests on aircraft skin panels and post-damage residual strength tests, utilized the commercial finite element software LS-Dyna. They performed residual strength simulations of the damaged structures using a restart method based on fragment damage simulations, clarifying the mechanisms influencing residual strength after fragment damage in the skin, stiffener, and joint areas [3]. The aforementioned studies have not proposed a quantitative evaluation method model for damaged structures; they only investigated the laws of damage and residual strength. In terms of quantitative analysis methods, for pre-fabricated damage, such as smooth circular holes, the Net Section Yield (NSY) criterion is typically employed, where structural failure is predicted when the net section stress equals the material yield strength (σnet = σys). Under wartime emergency repair conditions, the United States may utilize σnet = σult (ultimate tensile strength) for calculation to maximize structural utilization [16]. Wu et al. developed residual strength calculation models for metallic plates containing smooth circular holes based on linear elastic theory, elastoplastic analysis, and the NSY criterion. By comparing the flexibility of these three methods, they found that elastoplastic analysis offered superior advantages for predicting residual strength under large deformation conditions, with errors controllable within engineering tolerances (<15%) [17]. Hou et al., based on impact test results, introduced a specific criterion into Battle Damage Assessment and Repair (BDAR) evaluation by comparing its accuracy, along with that of the NSY criterion and traditional fracture mechanics criteria. This allows for rapid assessment of battle damage in field environments based on material properties and projectile damage characteristics [16]. The three aforementioned studies, while having proposed specific evaluation methods, tend to exhibit relatively low accuracy, making it difficult to ensure the reliability of the evaluation results. Jia et al., focusing on multi-hole structures with cracks, designed multiple sets of aluminum alloy specimens with varying hole radii, crack lengths, and crack angles. They improved model accuracy (with errors around 8.4% for both methods) by linearly modifying the NSY criterion based on hole pitch and modifying the plastic connection criterion using a calculated plastic zone model [18]. Callinan conducted a systematic study on the residual strength of carbon fiber-reinforced composites after ballistic impact, covering the degradation laws of mechanical properties under tensile, compressive, and shear loads. Multiple non-destructive inspection (NDI) methods were employed to assess the damage range; further, the Whitney-Nuismer characteristic length model and finite element method (FEM) were used to predict the strength of specimens with holes and ballistic damage, verifying the applicability of the model [19]. While the aforementioned studies have improved the evaluation accuracy of damaged structures, this prediction model adopts numerical fitting and thus lacks generalization ability for different structures. Meanwhile, the prediction method is complex and not suitable for battle damage emergency repair scenarios.
The aforementioned methods, which encompass theoretical derivation, experimental validation, and simulation modeling, have investigated the residual strength of certain metallic materials with perforations. However, research on the variation patterns of residual strength in structures with perforation damage remains insufficient, particularly concerning the influence of size effects and edge effects on these patterns, which is still not well understood. This study focuses on aluminum alloy panels and stiffened panels containing pre-fabricated circular holes, aiming to investigate the variation patterns of failure fracture load and residual strength when holes are located at different positions on the panels. First, five types of plain panel specimens and four types of stiffened panel specimens with pre-fabricated holes at different locations were designed. Quasi-static tensile fracture tests were conducted on these specimens to obtain the load–displacement curves during the testing process. Secondly, finite element analysis was employed to simulate the panels with pre-fabricated holes. Parametric modeling was used for secondary development of the finite element method, extending the numerical data of failure fracture loads for panels under various conditions of hole radius and location. Three-dimensional surface envelope diagrams depicting the relationship between panel fracture load, residual strength, and hole radius and location were plotted. The fracture mechanism of the panels was analyzed, and based on this, a modified formula for the net section failure criterion of the panels was proposed. Finally, this was extended to stiffened panels for validation. This research clarifies the impact of size effects on the variation patterns of residual strength in panel structures with perforation damage. It provides a theoretical foundation for understanding the variation patterns of residual strength in aircraft stiffened panel structures with respect to hole location and size, offers a theoretical basis for evaluating the residual strength of panels with holes, and serves as a reference for the design of aircraft battle damage repairability.

2. Tensile Fracture Tests on Panels with Pre-Fabricated Holes (Plain Panels) and Stiffened Panels

This study designed five types of aluminum alloy panels (plain plates) with different pre-fabricated hole sizes and four types of aluminum alloy stiffened panels with different pre-fabricated hole sizes for tensile fracture tests. The aim was to investigate the maximum tensile fracture load and the variation patterns of the load–displacement curves for panels containing pre-fabricated holes. The panel material was made of 2A12-T4 aluminum alloy, commonly used for aircraft skins. The panel dimensions were 380   mm   ×   80   mm   ×   2   mm . The panels were divided into gripping sections and a test section. The gripping sections were located at both ends of the specimen, each 40 mm long, while the test section was in the middle, 300 mm long. The pre-fabricated holes were located at the center along the length of the specimen. Along the width direction, offsets of 20 mm, 30 mm, and 40 mm from the panel edge were set. The hole diameters were set to three conditions: 10 mm, 30 mm, and 50 mm. The specimen surface was sprayed with speckle patterns for subsequent Digital Image Correlation (DIC) observation. The skin of the stiffened panels was made of the same material as the plain plates, with dimensions of 640   mm   ×   80   mm   ×   2   mm . The stiffener material was 7A04-T6 aluminum alloy. The stiffener was 640 mm long and 2 mm thick, with both the flange plate and web plate being 20 mm wide. Hole diameters were set: 10 mm and 30 mm. The 10 mm diameter holes were located at the center of the stiffener flange plate and the center of the web plate, penetrating through the web plate. The 30 mm diameter holes were located tangent to the web plate at the flange plate and at the center of the web plate, also penetrating through the web plate. The central 300 mm of the entire specimen was the test section, used to study the damage modes of the panel under different hole conditions. Both ends, each 170 mm long, were the gripping sections, designed with rows of rivet holes to connect with the fixtures via rivets, ensuring a uniform application of the tensile load. The skin surface was sprayed with speckle patterns for subsequent DIC observation. For both the plain panels and the stiffened panels, a coordinate system was established with the top-left vertex of the test section as the origin. The width direction was defined as the X-axis, and the length direction as the Y-axis, used to determine the center coordinates of the circular holes. See Figure 1 and Table 1.
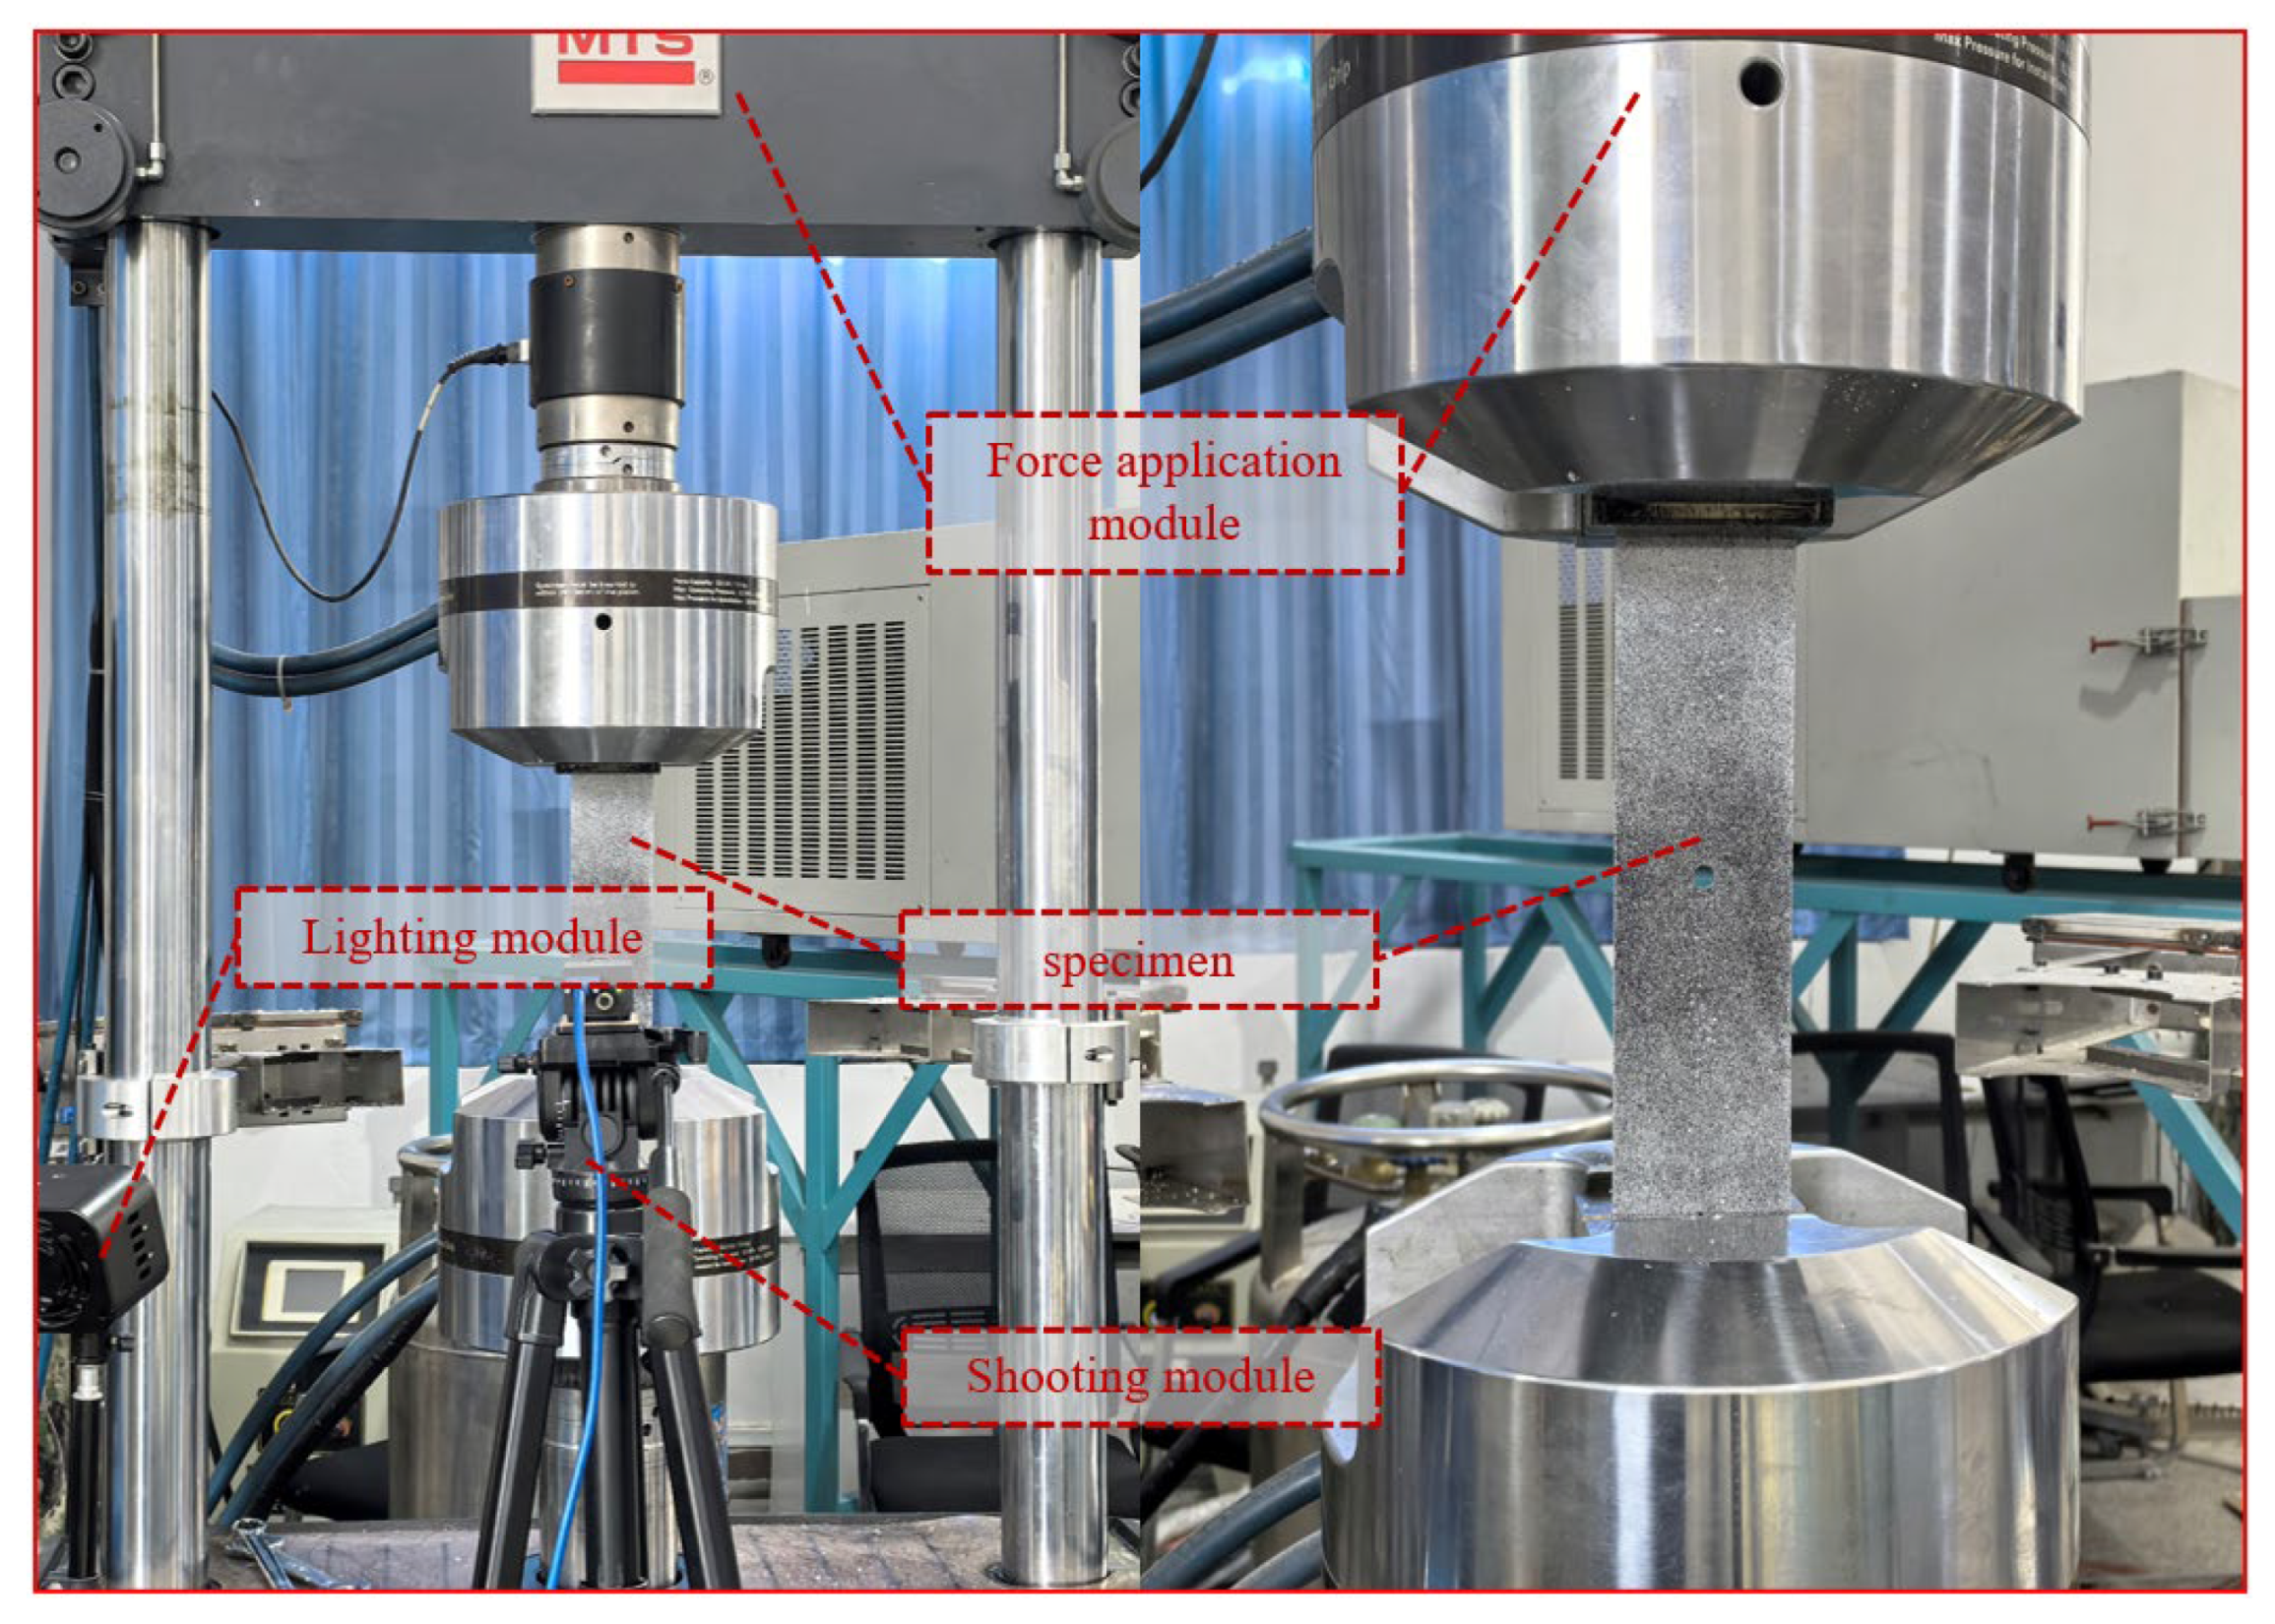
The experimental setup consists of three modules: the loading module, the imaging module, and the illumination module (Figure 2). The loading module serves as the core component of the entire test system and is used to conduct quasi-static tensile fracture tests on specimens. This module includes an MTS-K810 fatigue testing machine, a cooling chamber, and a hydraulic pump, with specimens being stretched at a constant rate of 1 mm/min until fracture failure occurs. The imaging module is employed to record the tensile fracture process of specimens and monitor the evolution of full-field strain distribution during the loading process. This module comprises a digital camera and its accompanying acquisition software, configured to capture images at an interval of 500 ms per frame. The illumination module adjusts light intensity for camera imaging to prevent image blurring caused by insufficient lighting or overexposure due to excessive brightness, consisting of a power supply and two lighting units. The subsequent speckle images were processed using VIC-2D 7.2.0 to calculate strain fields and analyze the strain evolution trends during the quasi-static tensile failure process.

3. Analysis of Test Results

3.1. Analysis of Plain Panel Test Results

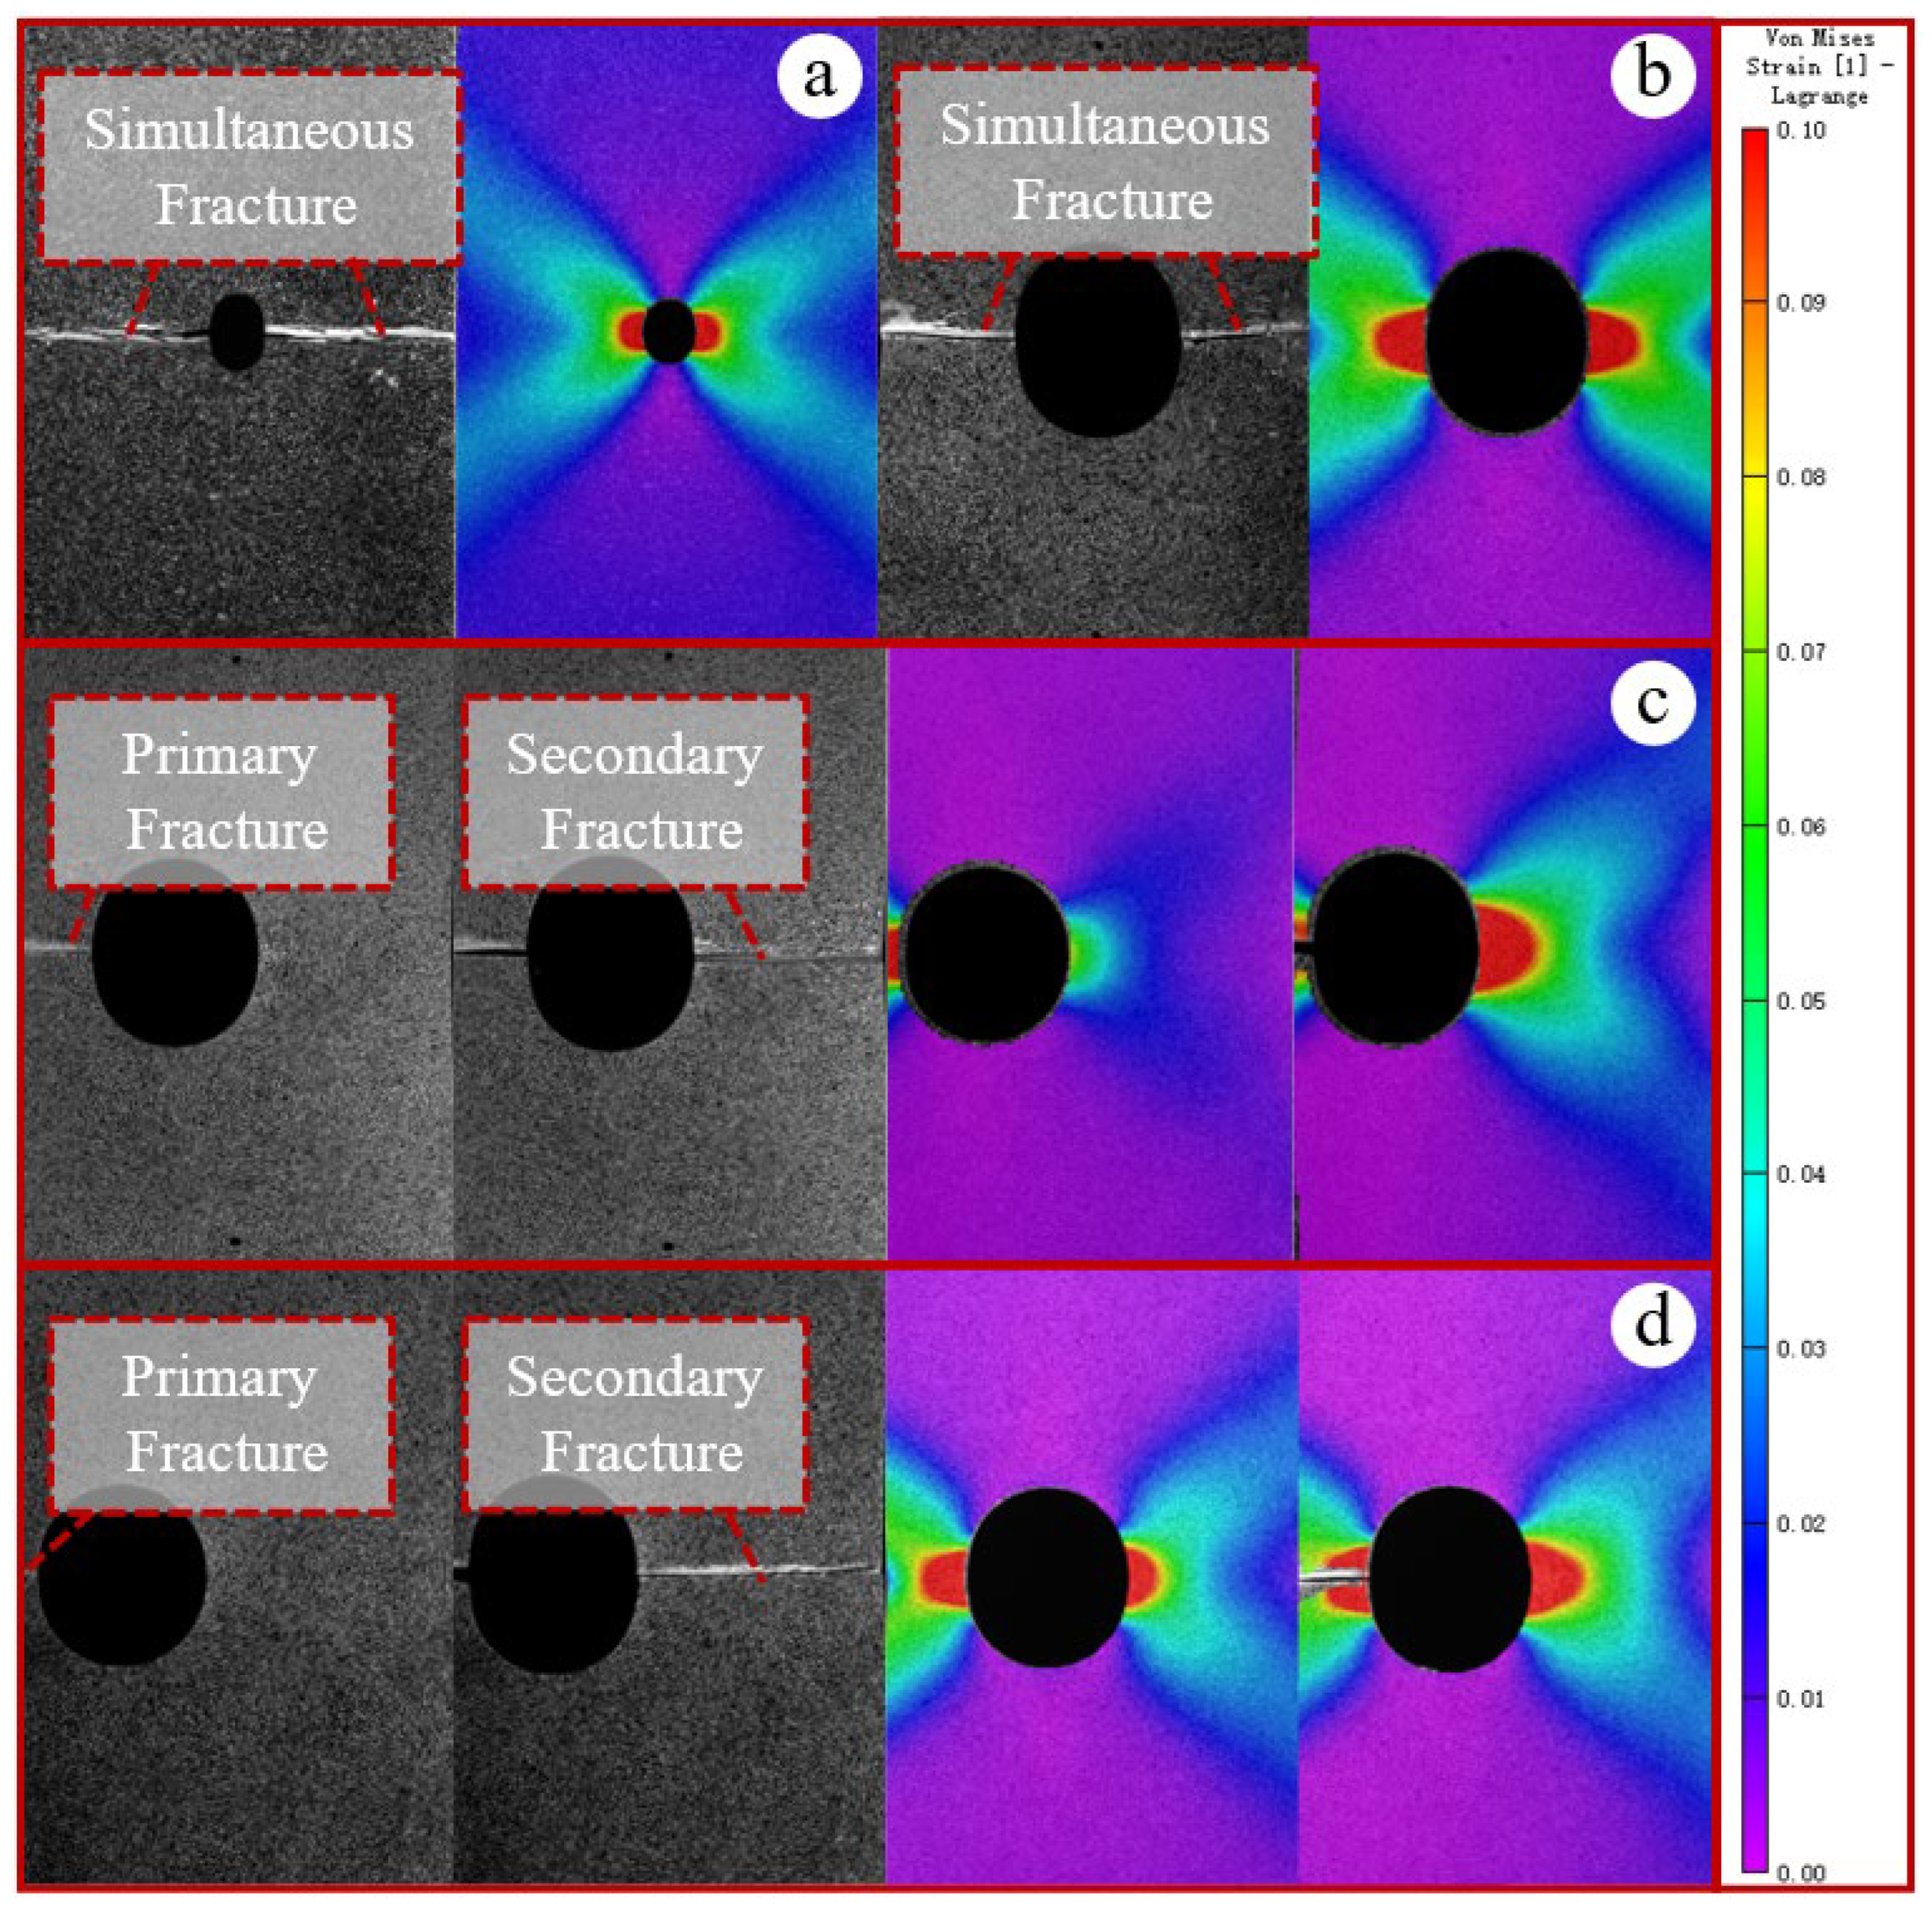
The specimens were subjected to quasi-static tensile testing at a rate of 1 mm/min using an MTS-K810 fatigue testing machine. The fracture processes of the specimens with pre-fabricated holes under five different working conditions were recorded by a camera. The strain nephograms of some specimens captured before fracture are shown in Figure 3. The fracture consistently initiated from both sides of the holes where stress concentration was present. After fracture, necking phenomenon was observed on the panel sections on both sides of the holes. The reduction in cross-sectional area along the width of the side edge was more pronounced where the necking was more evident
For a panel with a pre-fabricated hole located at the center of the specimen, during tensile loading, the presence of the hole forces the tensile stress to flow around it. The reduced material on both sides of the hole cross-section symmetrically bears the stress from both lateral directions, resulting in a shear stress flow around the hole that induces stress concentration at the hole edge. Under high stress, the material around the hole yields first, reducing the local stiffness and load-bearing capacity. The shape of the hole gradually evolves from circular to elliptical. Meanwhile, the material away from the hole experiences increasing stress until it also yields. The plastic zone progressively extends from the hole edge toward the outer boundary until the entire cross-section reaches the ultimate stress, leading to simultaneous failure of the whole section. The specimen fractures rapidly along the width direction on both sides of the hole, accompanied by a loud noise. During this process, necking occurs in the metal between the hole edge and the panel side. The smaller the cross-sectional area between the hole edge and the panel side, the more pronounced the necking phenomenon, as shown in Figure 3a,b.
For a panel with a pre-fabricated rupture hole deviating from the center of the specimen, the initial stage of the tensile loading process is approximately similar to that of a panel with a centrally located hole. However, the stress flow around the hole edge is asymmetric. Under the same stress level, the weaker side with less material bears a higher average stress, resulting in more pronounced stress concentration on this side and consequently faster structural failure. At the moment of failure on the weaker side, the sudden increase in displacement generates kinetic energy. Since the grips restrain the overall movement of the panel, this energy is forced to dissipate through panel vibration. The remaining material then carries the entire load until it fails after yielding and reaching the ultimate stress. Necking occurs in the metal between the hole edge and both sides of the panel, and the smaller the cross-sectional area between the hole edge and the panel side, the more noticeable the necking phenomenon, as shown in Figure 3c,d.
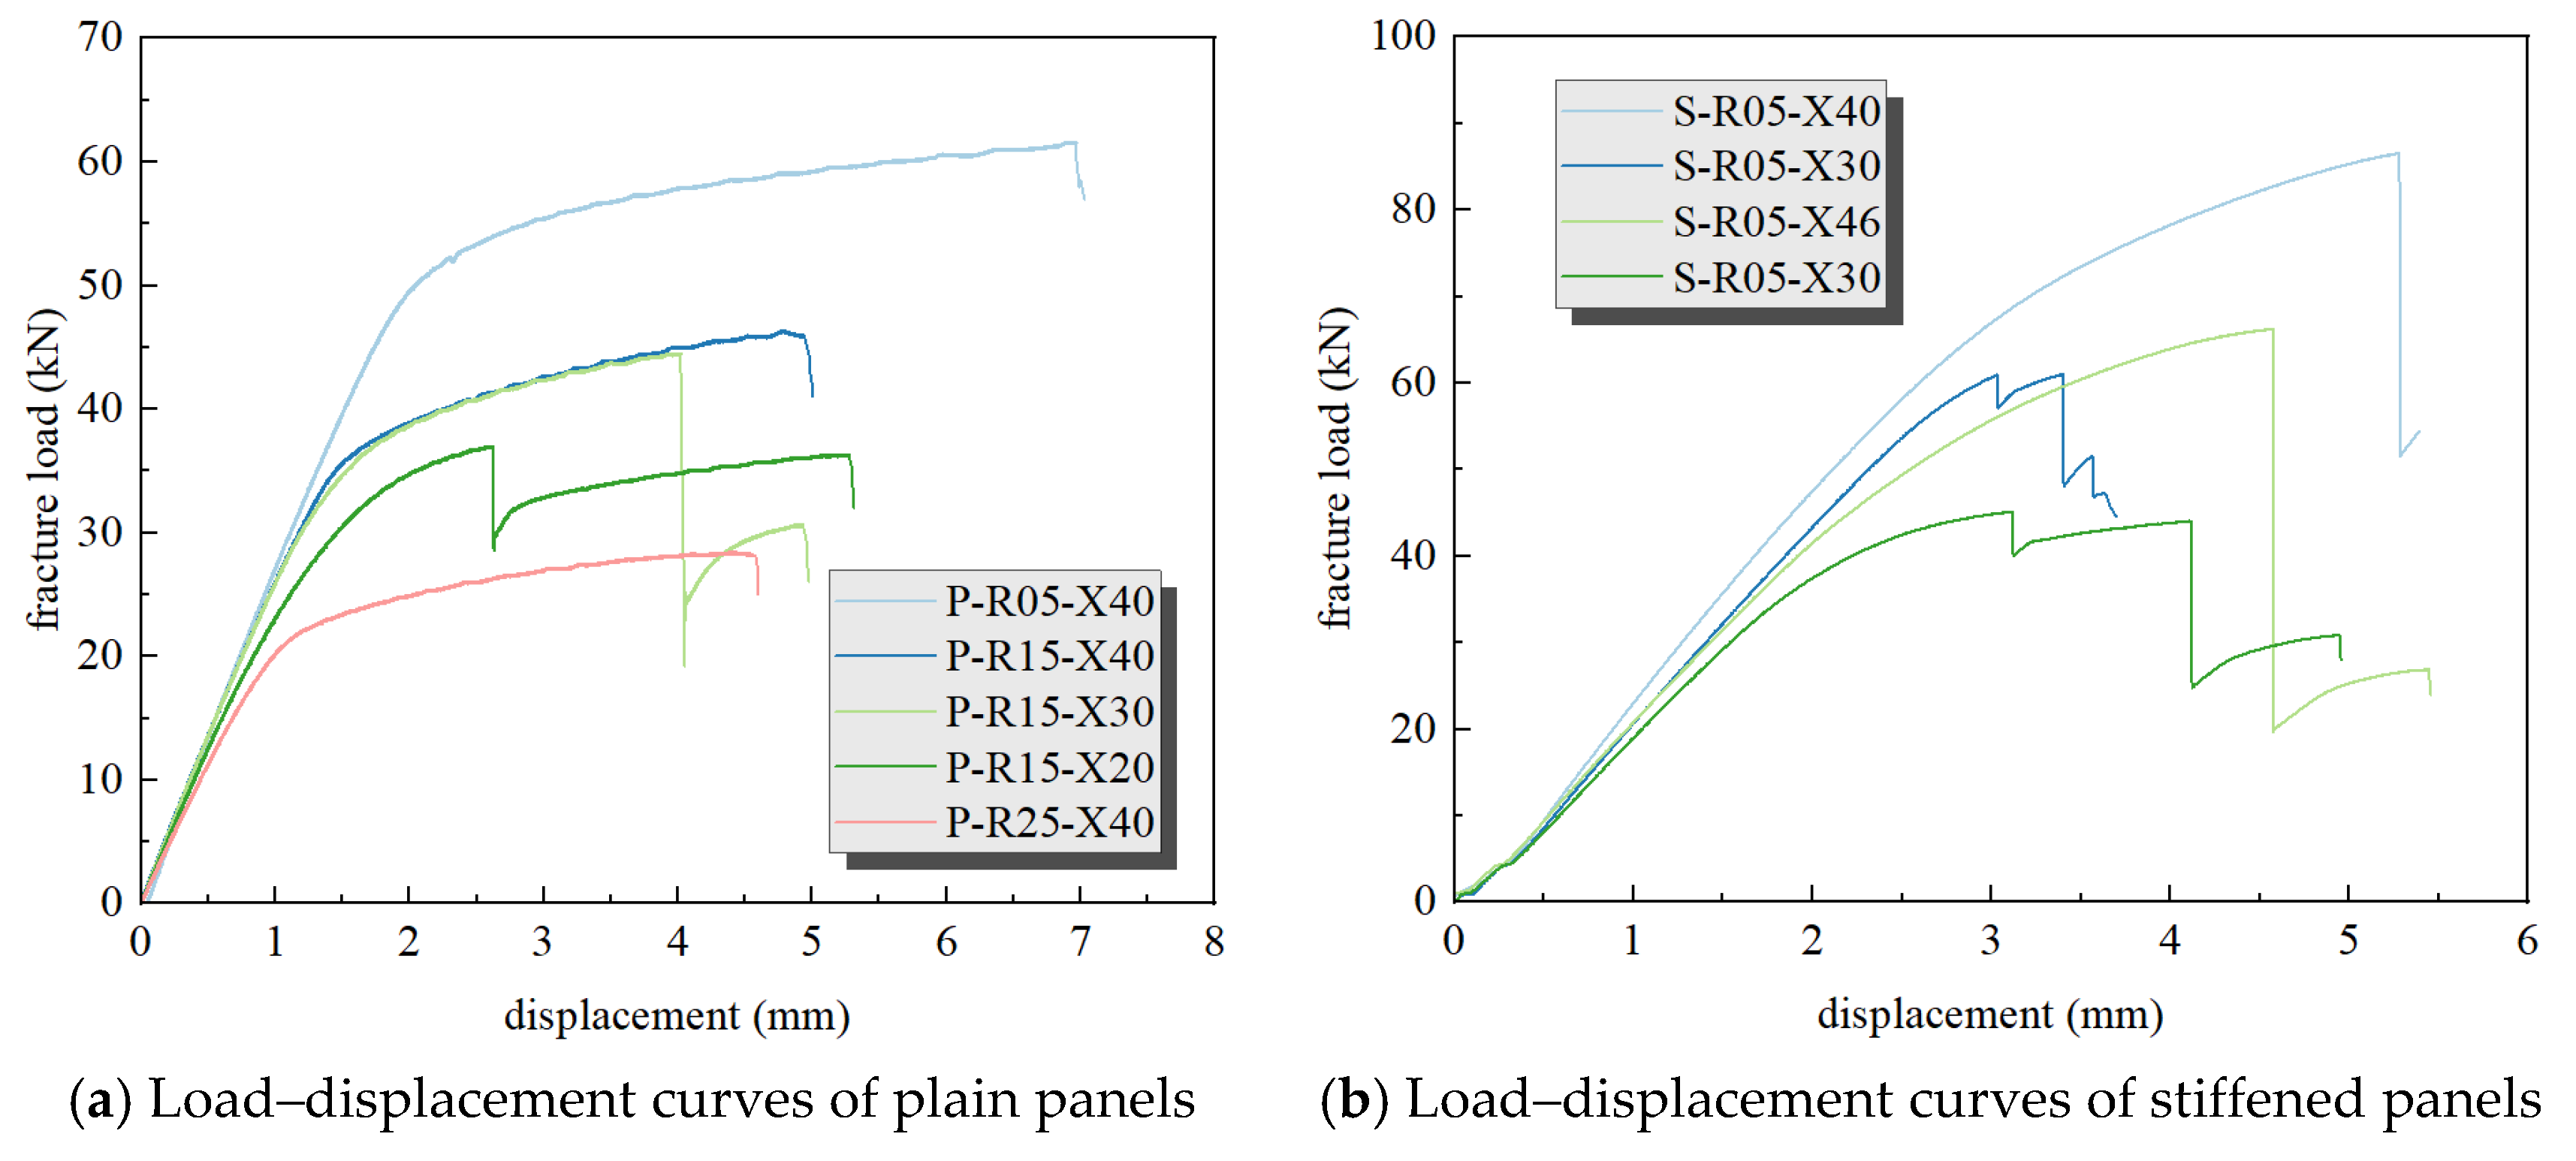
During the quasi-static tensile process, the load–displacement curve of the testing machine’s grips was recorded to analyze the variations in the curve throughout the stretching phase. The load–displacement curve obtained from the quasi-static tensile test of the specimen is shown in Figure 4a.
For the panel with the pre-fabricated hole located at its center, during the tensile loading process, the specimen first enters the elastic stage, where the load exhibits a linear relationship with displacement. Upon reaching the yield strength, the specimen transitions into the plastic stage, where the material undergoes gradual strain hardening, and the load increases slowly. When the fracture load is attained, the cross-section at the hole completely fractures, causing the load to drop instantaneously to zero, marking the end of the tensile loading process.
For panels with pre-fabricated holes located away from the specimen’s center, the behavior during the elastic stage is identical to that of panels with centrally located holes. Upon entering the plastic stage, the tensile load increases gradually until failure occurs on one side of the hole, causing the tensile load to drop instantaneously, though not to zero. At this moment, the specimen undergoes a slight sudden displacement, generating a small amount of kinetic energy. However, due to the constraints imposed by the testing machine’s grips, the displacement of the specimen is restricted. The residual kinetic energy is forced to dissipate through panel vibration, leading to oscillations in the tensile load at the first fracture point on the load–displacement curve. Nevertheless, the remaining portion of the panel retains some load-bearing capacity. The tensile load gradually increases again from this new starting point with further tensile displacement until the remaining section reaches its fracture load and fails, at which point the load drops instantaneously to zero, concluding the tensile loading process. It is important to note that due to the asymmetric nature of the off-center holes, these specimens exhibit a distinct bimodal peak pattern in their load–displacement curves.

3.2. Analysis of Stiffened Panel Test Results

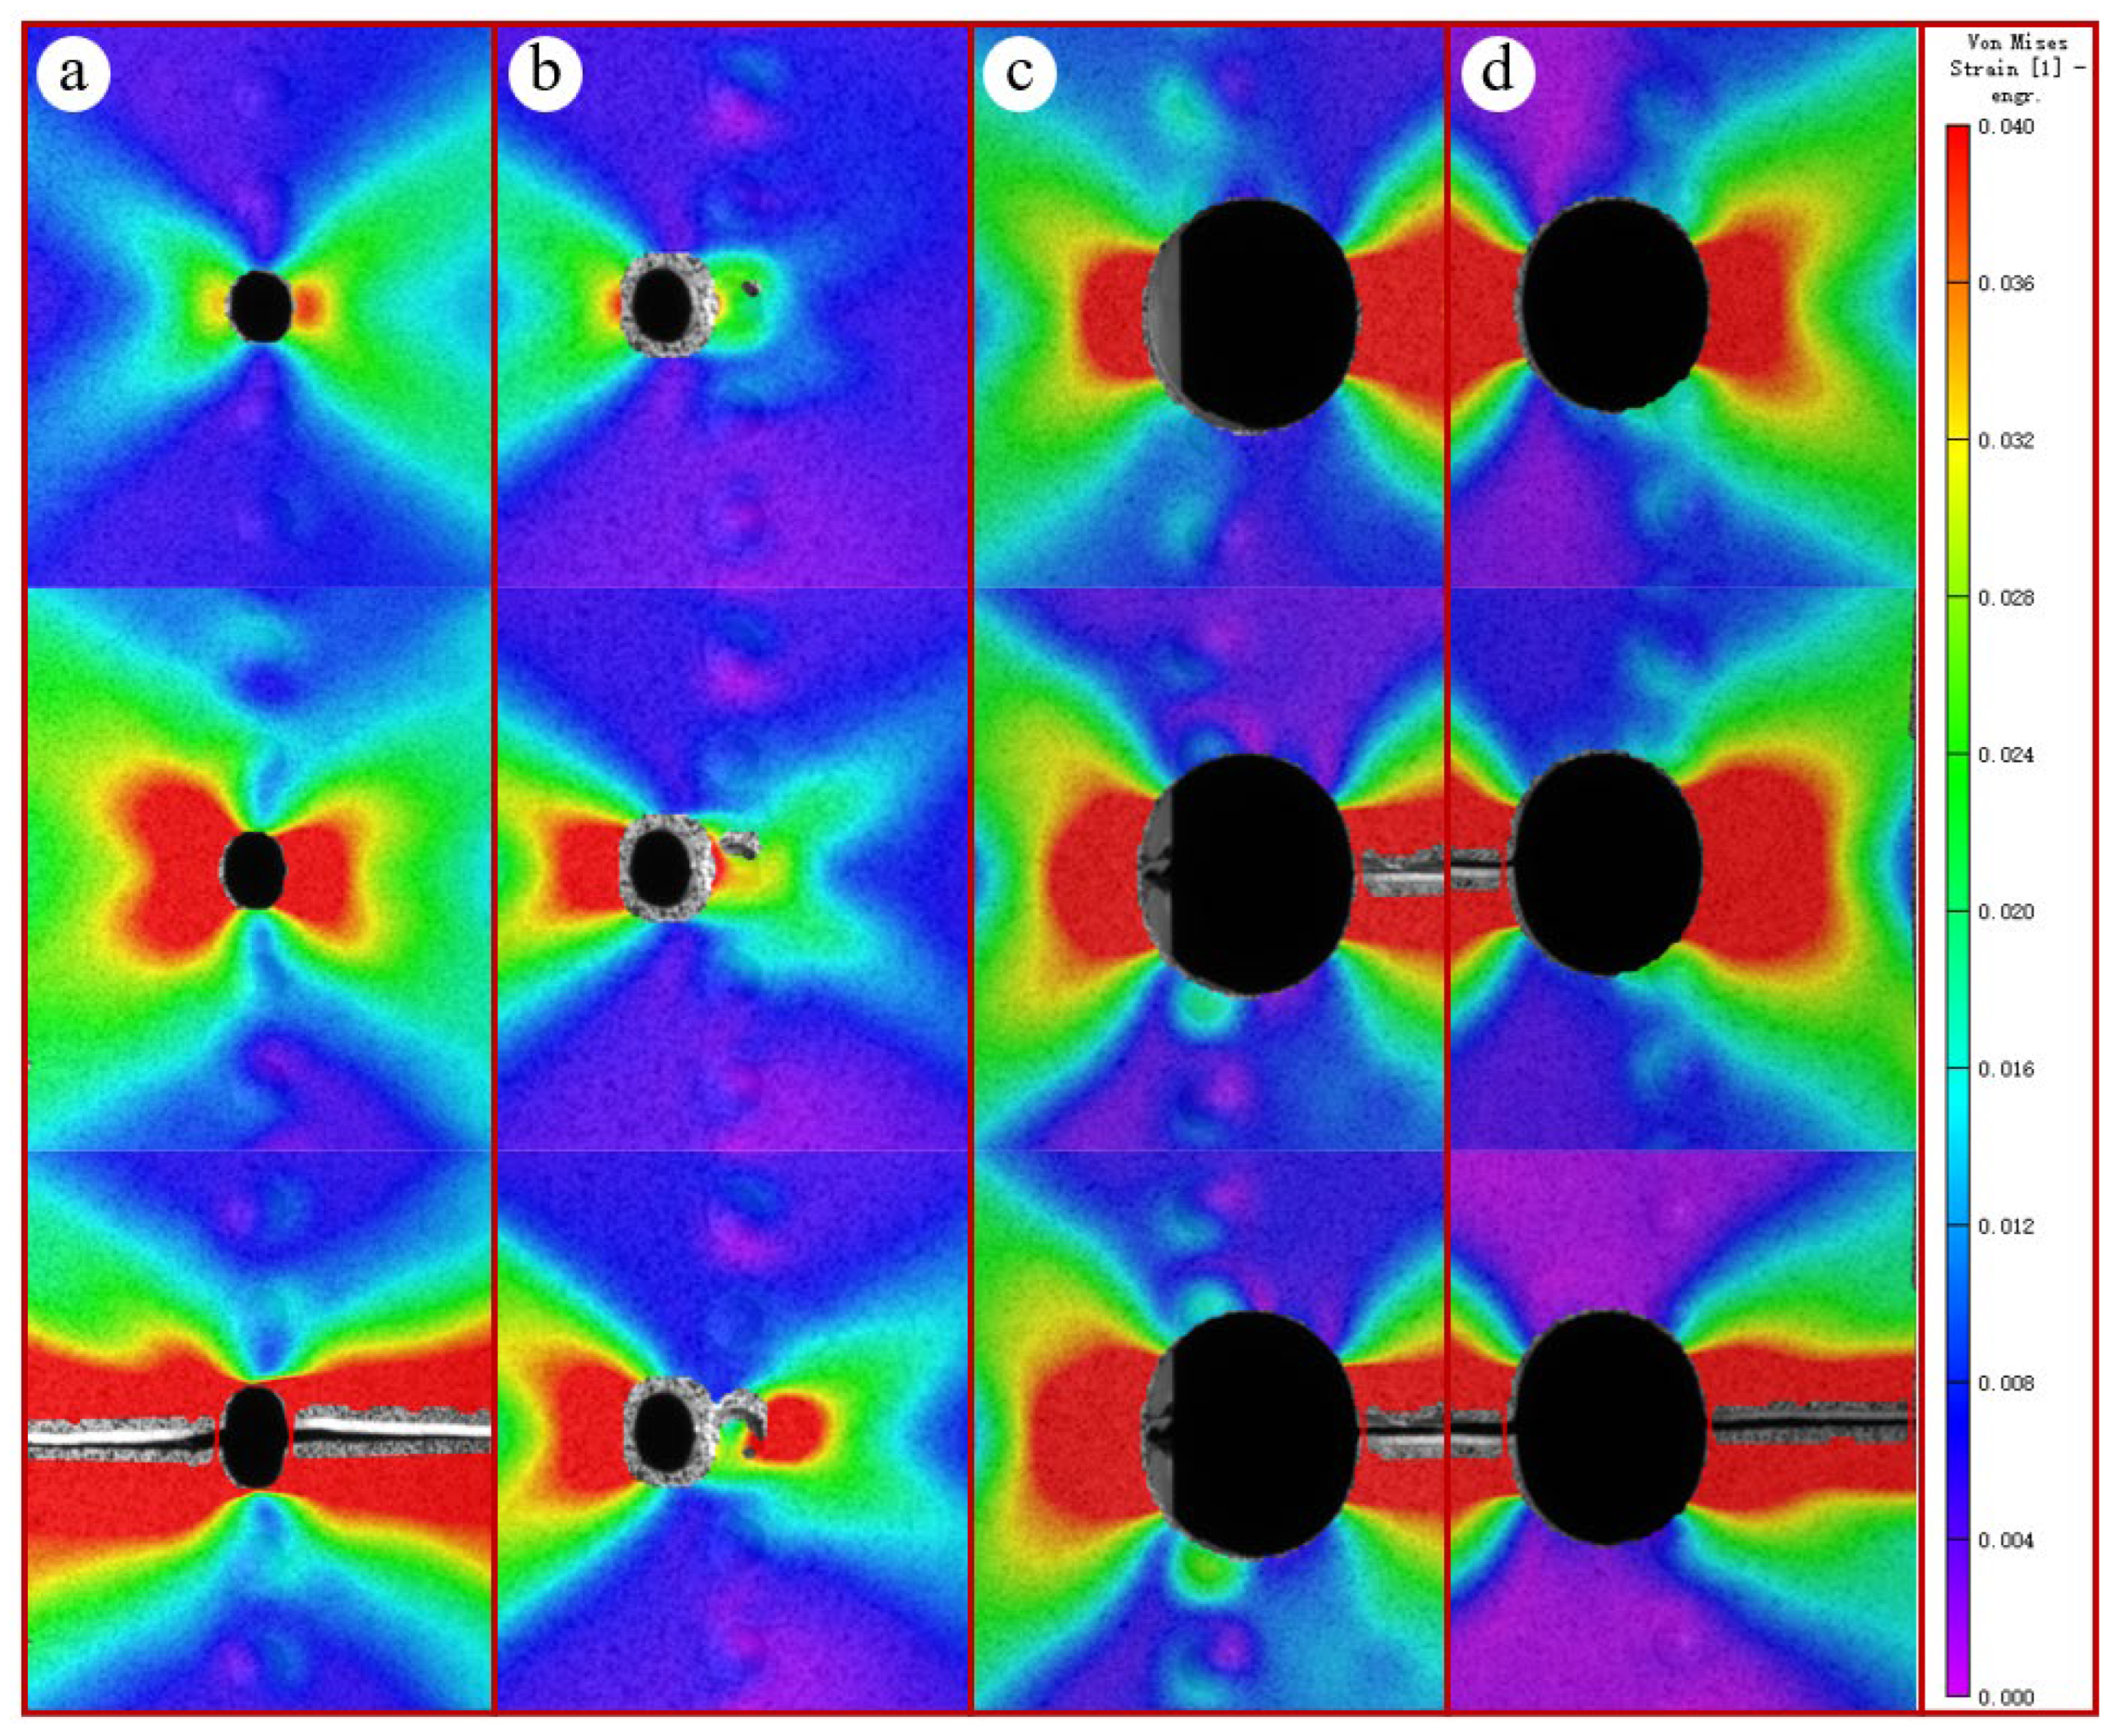
The stiffened panel specimens were subjected to quasi-static tensile testing at a rate of 1 mm/min using an MTS-K810 fatigue testing machine. The fracture processes of the specimens under four different working conditions were captured and recorded via Digital Image Correlation (DIC) equipment. The progression of strain nephogram changes on the back surface of the panel specimens was observed, as shown in Figure 5. The web of the stiffener is located on the left side of the rivet in the nephogram.
Compared to the 7000 series, the 2000 series aluminum alloy shows greater toughness, larger fracture displacement, and lower failure stress. The 7000 series, by contrast, is a high-strength alloy with higher brittleness, smaller fracture displacement, but greater failure stress. In a stiffened panel combining a 2000 series skin with 7000 series stiffeners, under the same tensile displacement, the stiffeners fracture more easily. As a result, across all four working conditions, failure consistently began at the stiffeners’ weak points until their complete rupture. After stiffener failure, the skin behaved similarly to a plain panel, fracturing first on the weaker side. In summary, the fracture sequence of the stiffened panel is stiffeners–weaker (free) side of the skin–stronger constrained side of the skin.
For smooth circular holes, both sides act as primary stress concentration sources. Under increasing tensile load, these zones extend perpendicular to the loading direction and gradually equalize, reflecting the net-section failure criterion for ductile materials. The stiffness discontinuity at the stiffener-skin interface induces interfacial stress concentration and asymmetric strain distribution around the hole. As shown in Figure 5a, the stiffener’s web plate, being stiffer than the flange, carries a greater share of the tensile load before fracture. This redistributes load in the adjacent skin, accelerating high-strain zone expansion on the web-side of the hole. After stiffener fracture, the sudden release of web-load causes an impulsive load increase on the skin, particularly the web-side, inducing slight panel bending and further enlarging the local strain zone. Ultimately, the web-side exhibits a smaller high-strain area than the far side post-fracture. In eccentric holes (Figure 5b–d), the skin’s edge effect dominates, generating high stress concentration on the weaker side (closer to the skin edge). The influence of web-flange stiffness difference is reduced, and the high-strain area localizes on the weaker side regardless of web integrity. After stiffener failure, the skin fractures similarly to a plain plate. Multiple fractures in stiffened panels cause sequential load drops in the load–displacement curve (Figure 4b). However, specimen S-R05-X30 exhibited small-magnitude load drops; its rivet hole remained intact and lay on the same critical cross-section as the main hole. The rivet carried minimal shear stress, leading to superimposed stress concentrations between the holes. A high-stress band formed there, becoming the weakest region and failing first, causing the minor load drops.
The maximum fracture load of the structure depends on the hole location. Based on the net-section failure criterion, larger holes lead to greater loss of cross-sectional area in the stiffened panel, significantly reducing its residual strength. For the same hole size, damage to the stiffener web plate results in a more severe reduction in residual strength compared to damage to the flange plate, as web plate damage causes a greater loss of cross-sectional area and thus more significantly diminishes the load-bearing capacity of the panel.

4. Numerical Simulation Setups

4.1. Material Constitutive

The ductile damage criterion [20,21] serves as a phenomenological model describing ductile fracture in metals, effectively simulating the nucleation, growth, and coalescence of voids during tensile deformation. This criterion consists of two distinct phases: ductile damage initiation and ductile damage evolution.
The ductile damage initiation characterizes the onset of material damage, which is typically governed by three key variables: equivalent plastic strain, stress triaxiality, and strain rate.
ε ¯ D p l η , ε ¯ ˙ p l
The stress triaxiality (η) is defined as η = - p / q , where p is the pressure stress, q is the Mises equivalent stress and ε ¯ p l is the equivalent plastic strain rates.
State variables are defined to characterize the damage initiation criterion. Ductile damage in metallic materials is considered to initiate when ω D = 1 is satisfied.
ω D = d ε ¯ p l ε ¯ D p l η , ε ¯ ˙ p l = 1
In finite element analysis, the computational method for each analysis step increment is as follows:
Δ ω D = Δ ε ¯ p l ε ¯ D p l η , ε ¯ ˙ p l 0
The ductile damage evolution characterizes the progressive stiffness degradation of metallic materials, which can be defined as either linear or exponential. The degradation rate can be quantified using either fracture energy or displacement at failure.
The overall damage variable D quantifies the cumulative damage in the structural element, where D = 1 indicates element failure and removal. The failure process is characterized by both fracture energy and critical displacement, with their relationship established in [22].
G f = ε ¯ o i ε ¯ f p l L σ y d ε ¯ p l
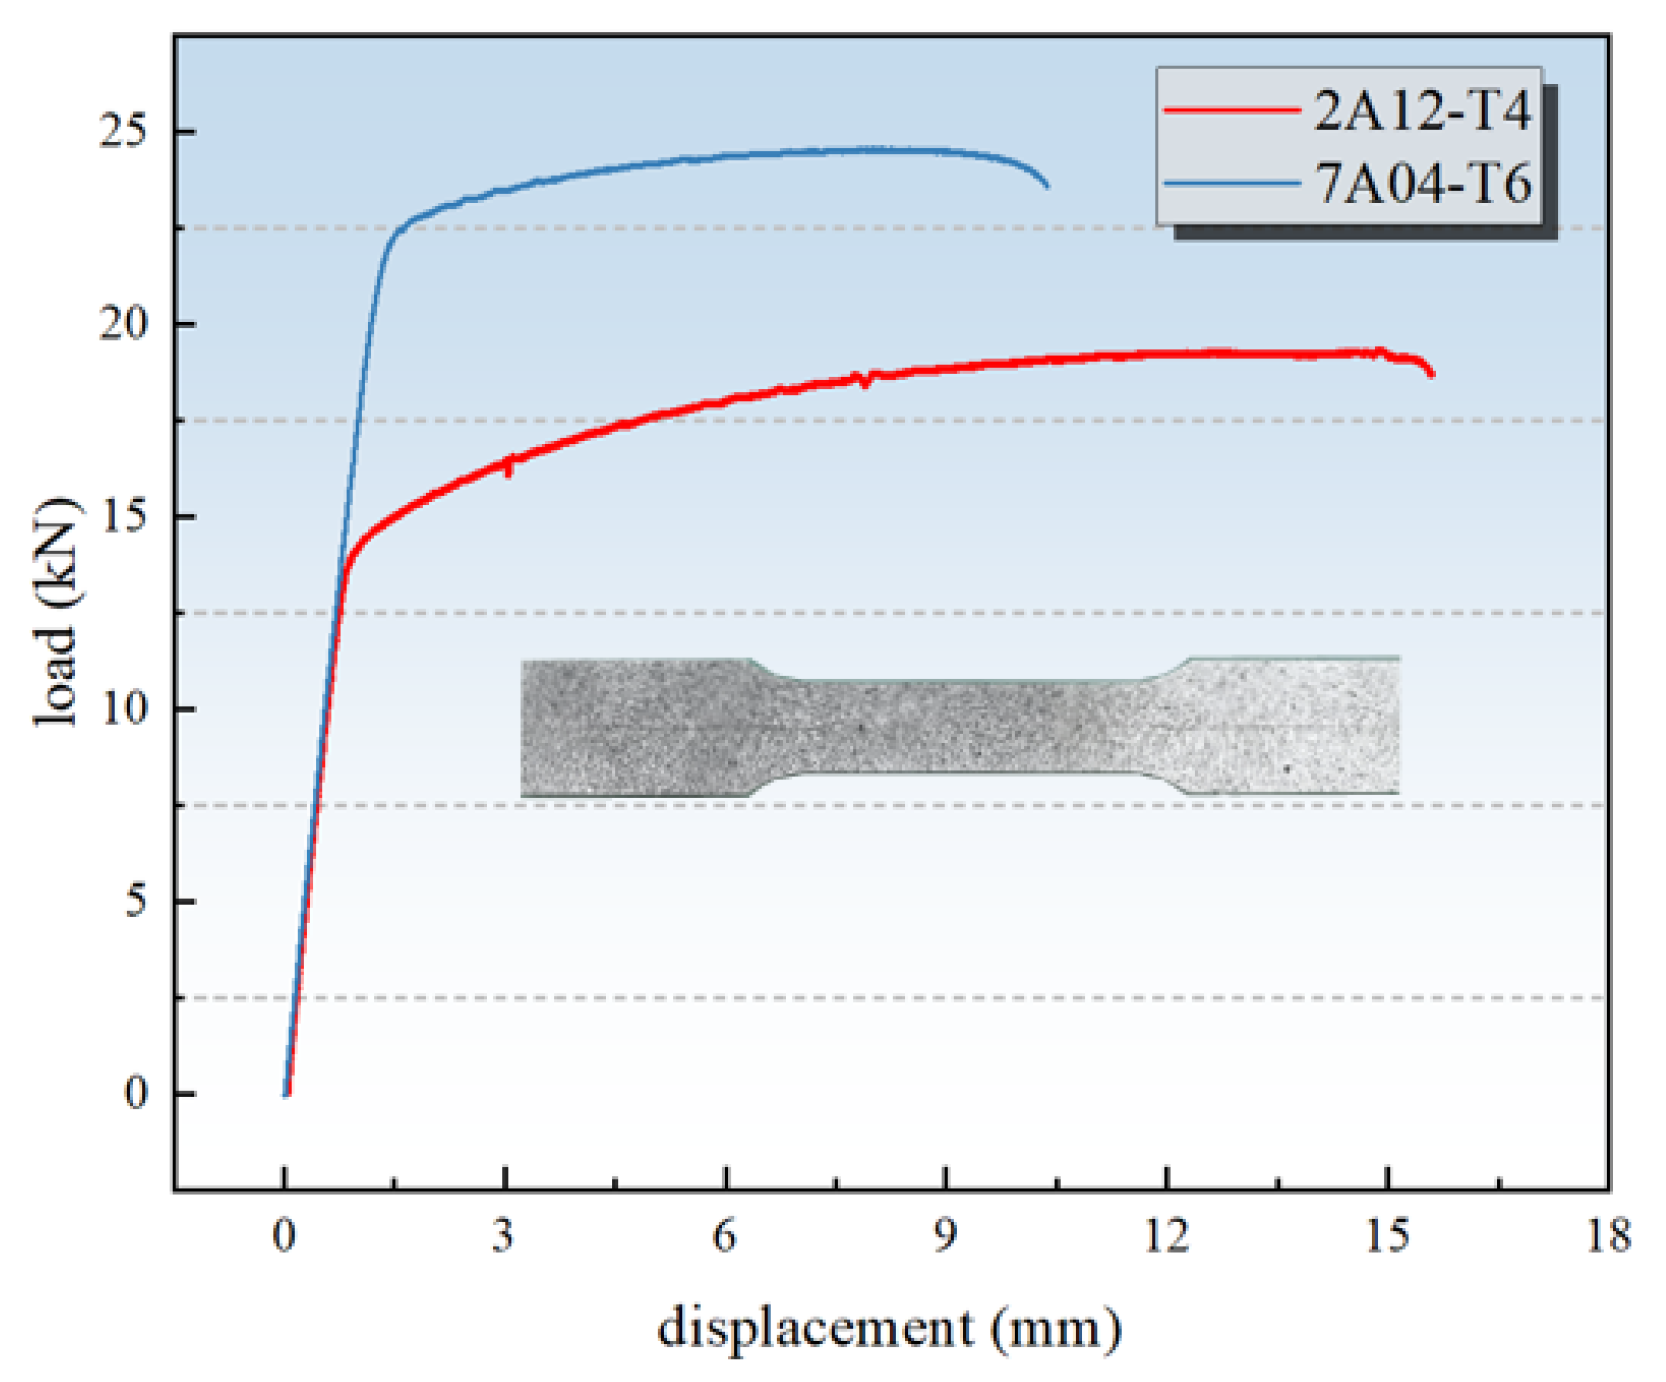
Quasi-static tensile fracture tests were performed on dog-bone specimens designed for parameter calibration. The corresponding load–displacement curve is shown in Figure 6.
The elastic and plastic parameters of the specimens were determined by converting the nominal stress–strain data to true stress–strain using the following transformation method [23]. Assuming constant volume of the material during the tensile process, the corresponding stress–strain relationships for the 2A12-T4 and 7A04-T6 aluminum alloys were calculated based on the conversion relationship between nominal and true stress–strain (5).
ε true = ln ( 1 + ε nom ) σ true = σ nom ( 1 + ε nom ) ε true p l = ε true σ true / E
The material parameters for 2A12-T4 aluminum alloy are specified in Table 2.

4.2. Model Setups

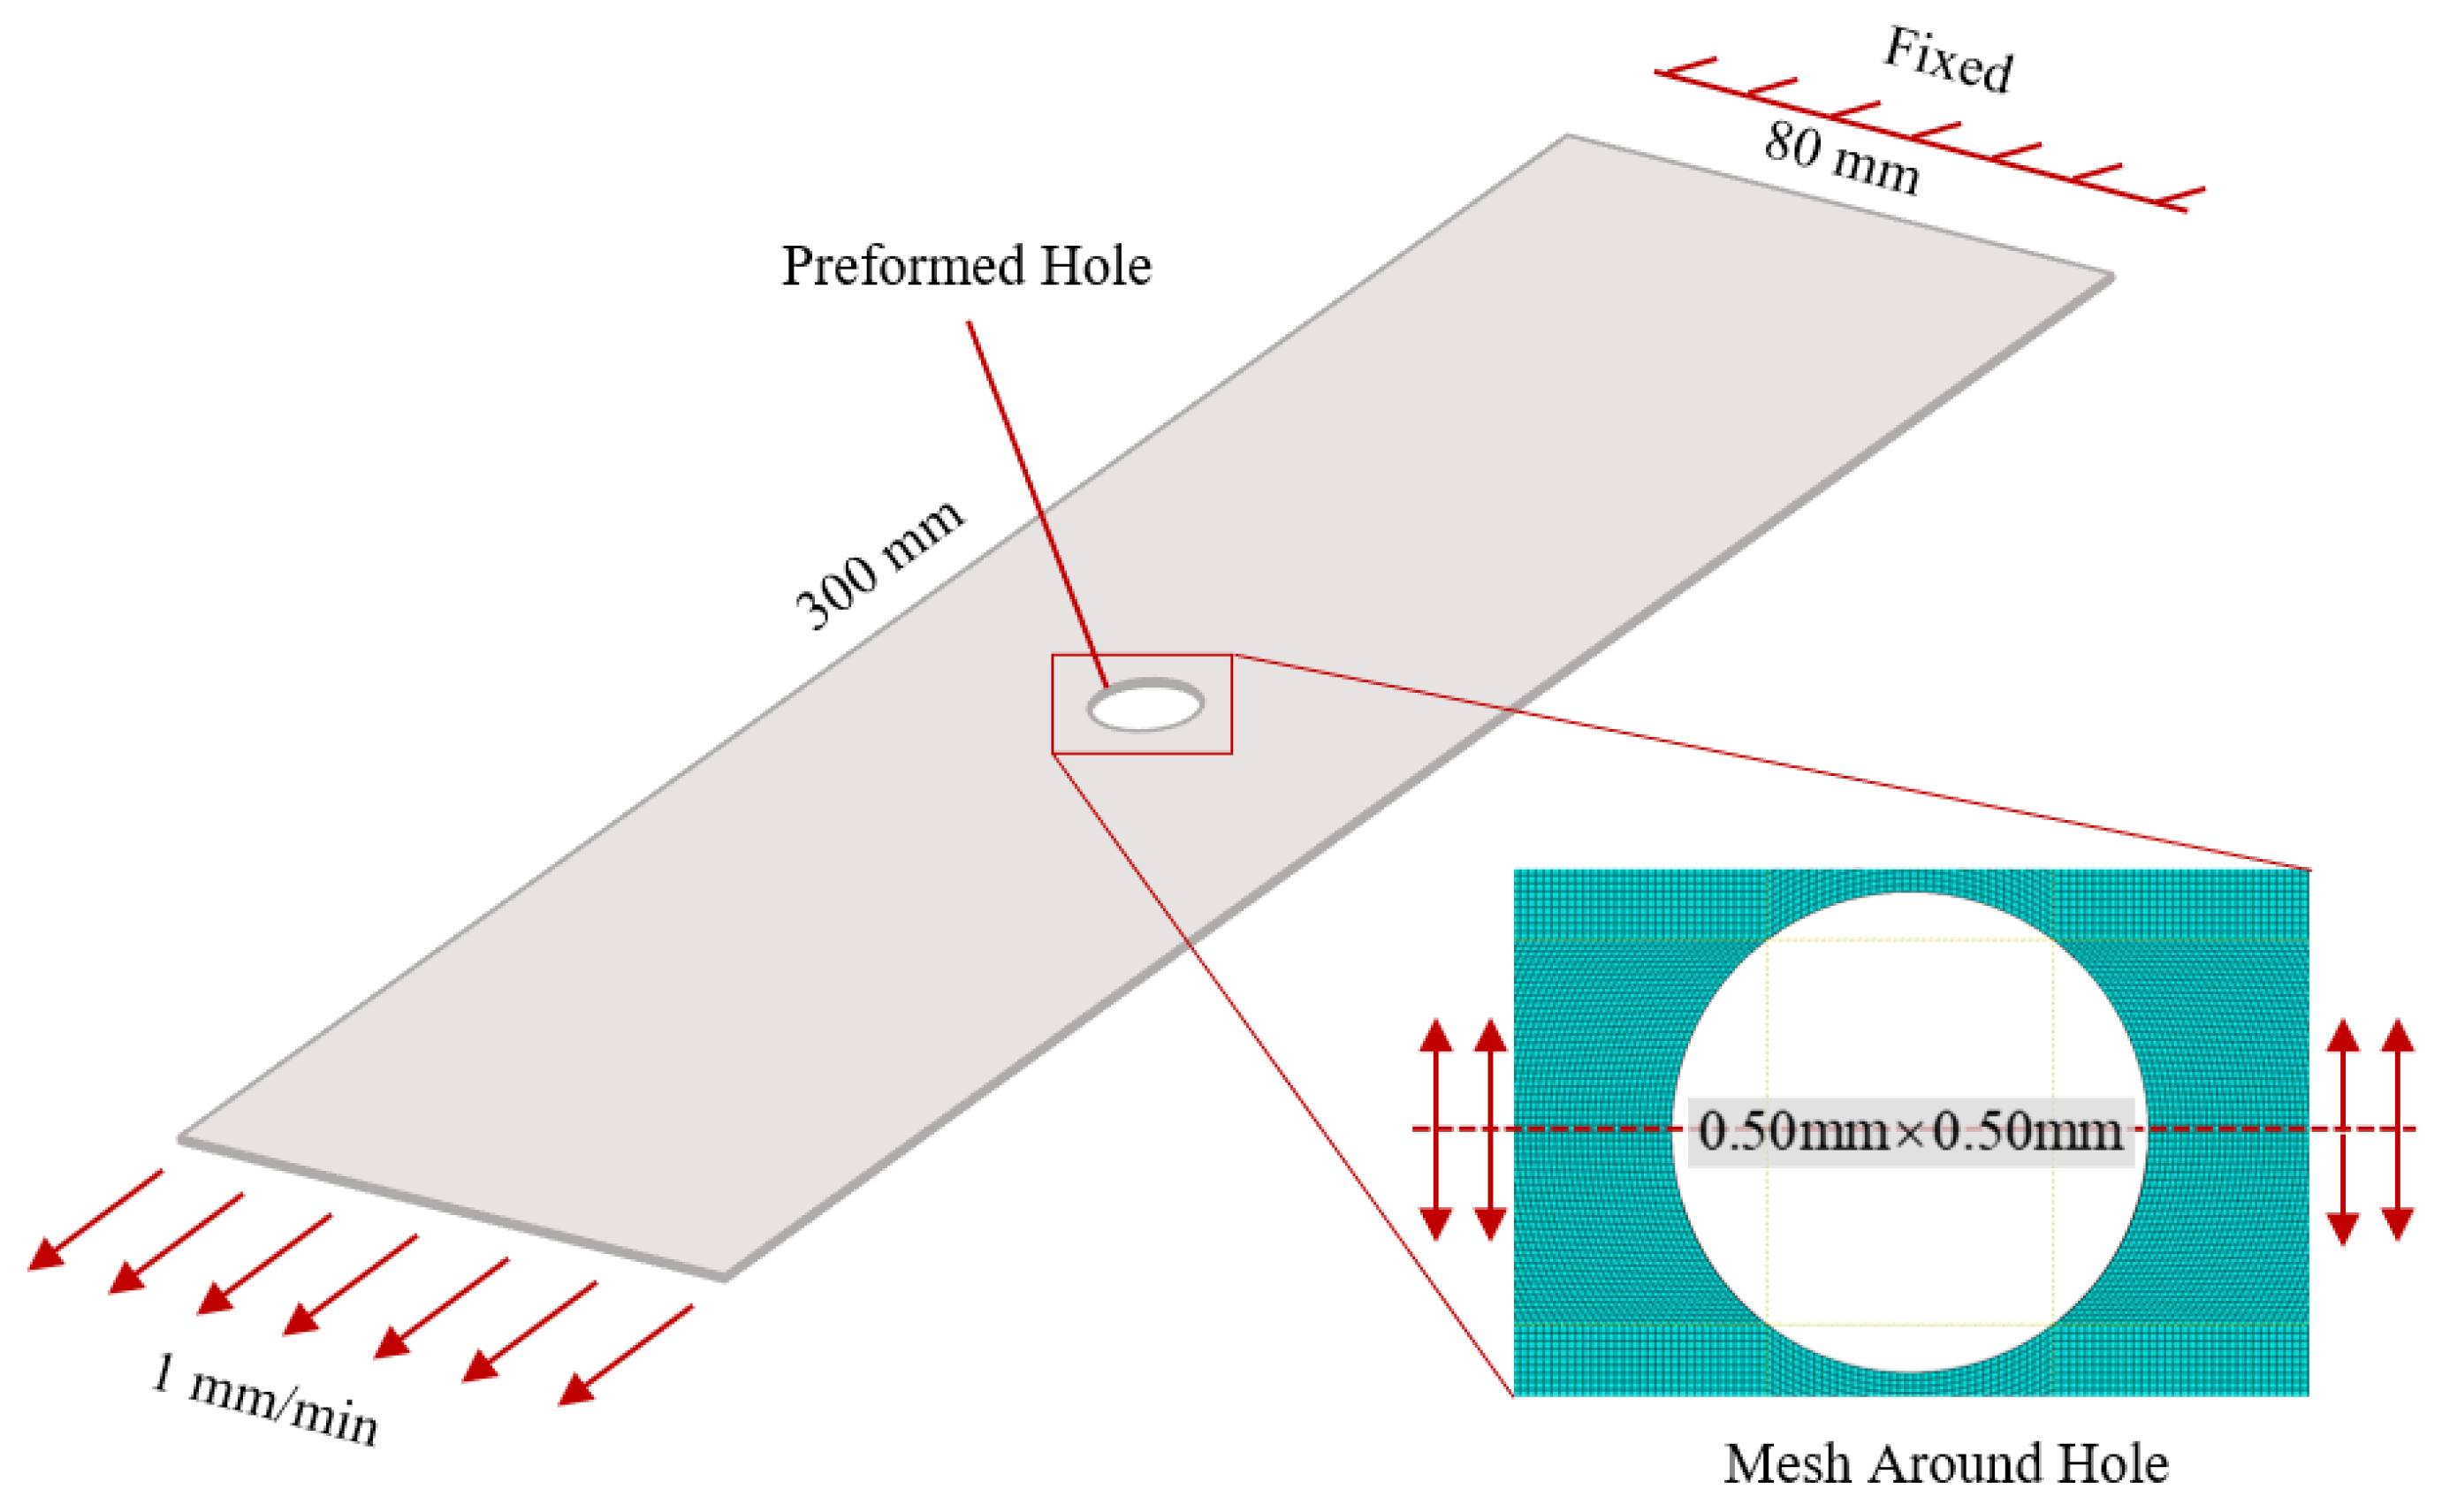
The commercial finite element analysis software Abaqus was employed to simulate the pre-perforated panel test section. The model dimensions were 300   mm   ×   80   mm   ×   2   mm . The global mesh utilized C3D8R elements, with refined meshing (size: 0.50   mm   ×   0.50   mm   ×   0.50   mm ) implemented near the pre-existing perforation and coarser meshing (size: 1.00   mm   ×   1.00   mm   ×   0.50   mm ) applied at both ends. This meshing strategy ensured computational accuracy while maintaining satisfactory efficiency. The complete finite element model is presented in Figure 7.
In the numerical simulation of tensile fracture failure for this metal panel, an explicit dynamic analysis step was employed for computation using the Abaqus/Explicit solver. Reference points were established on both sides of the panel, with one end fully constrained and the other end subjected to tensile displacement with specified loading duration. The displacement, load, and energy data were extracted from the reference point at the tensile end.
To meet the requirements for extensive computational analysis, secondary development of Abaqus was implemented [24,25]. A Python-based parametric script was developed to automate the modeling and simulation process, enabling parametric modeling for various perforation positions and sizes. The script accepts two key geometric parameters as inputs: the perforation radius R, and the perforation center coordinates (X, Y), which collectively determine the perforation’s size and location on the panel.

4.3. Model Validation

4.3.1. Mesh Independence Validation

A mesh sensitivity analysis was first conducted on the simulation model. The case with a 15 mm-radius hole centered on the panel was selected for investigation. Three distinct mesh sizes (specifically 0.25   mm   ×   0.25   mm   ×   0.25   mm , 0.50   mm   ×   0.50   mm   ×   0.50   mm , and 1.00   mm   ×   1.00   mm   ×   1.00   mm ) were implemented in the refined mesh region surrounding the perforation for comparative simulation. The resulting load–displacement curves from these simulations are presented in Figure 8.
The load–displacement curves of the three mesh sizes exhibit identical variation trends. As the mesh size decreases, both the fracture load and fracture displacement increase. This phenomenon occurs because the failure displacement is mesh-dependent: when the mesh size increases while the failure displacement remains unchanged, the relative failure displacement effectively increases, thereby delaying model failure. Compared to the 0.50 mm mesh, the 0.25 mm mesh contains 8 times more elements, resulting in an 8-fold increase in computation time. However, the simulation results obtained with the 0.50 mm mesh are closer to the experimental values than those from the 1.00 mm mesh, while the computational cost of the 0.50 mm mesh remains acceptable. Compared to the 0.50 mm mesh, the fracture load errors for the 0.25 mm and 1.00 mm meshes are only 0.56% and −0.17%, respectively, indicating excellent mesh independence of this model.

4.3.2. Comparison Between Experiment and Simulation

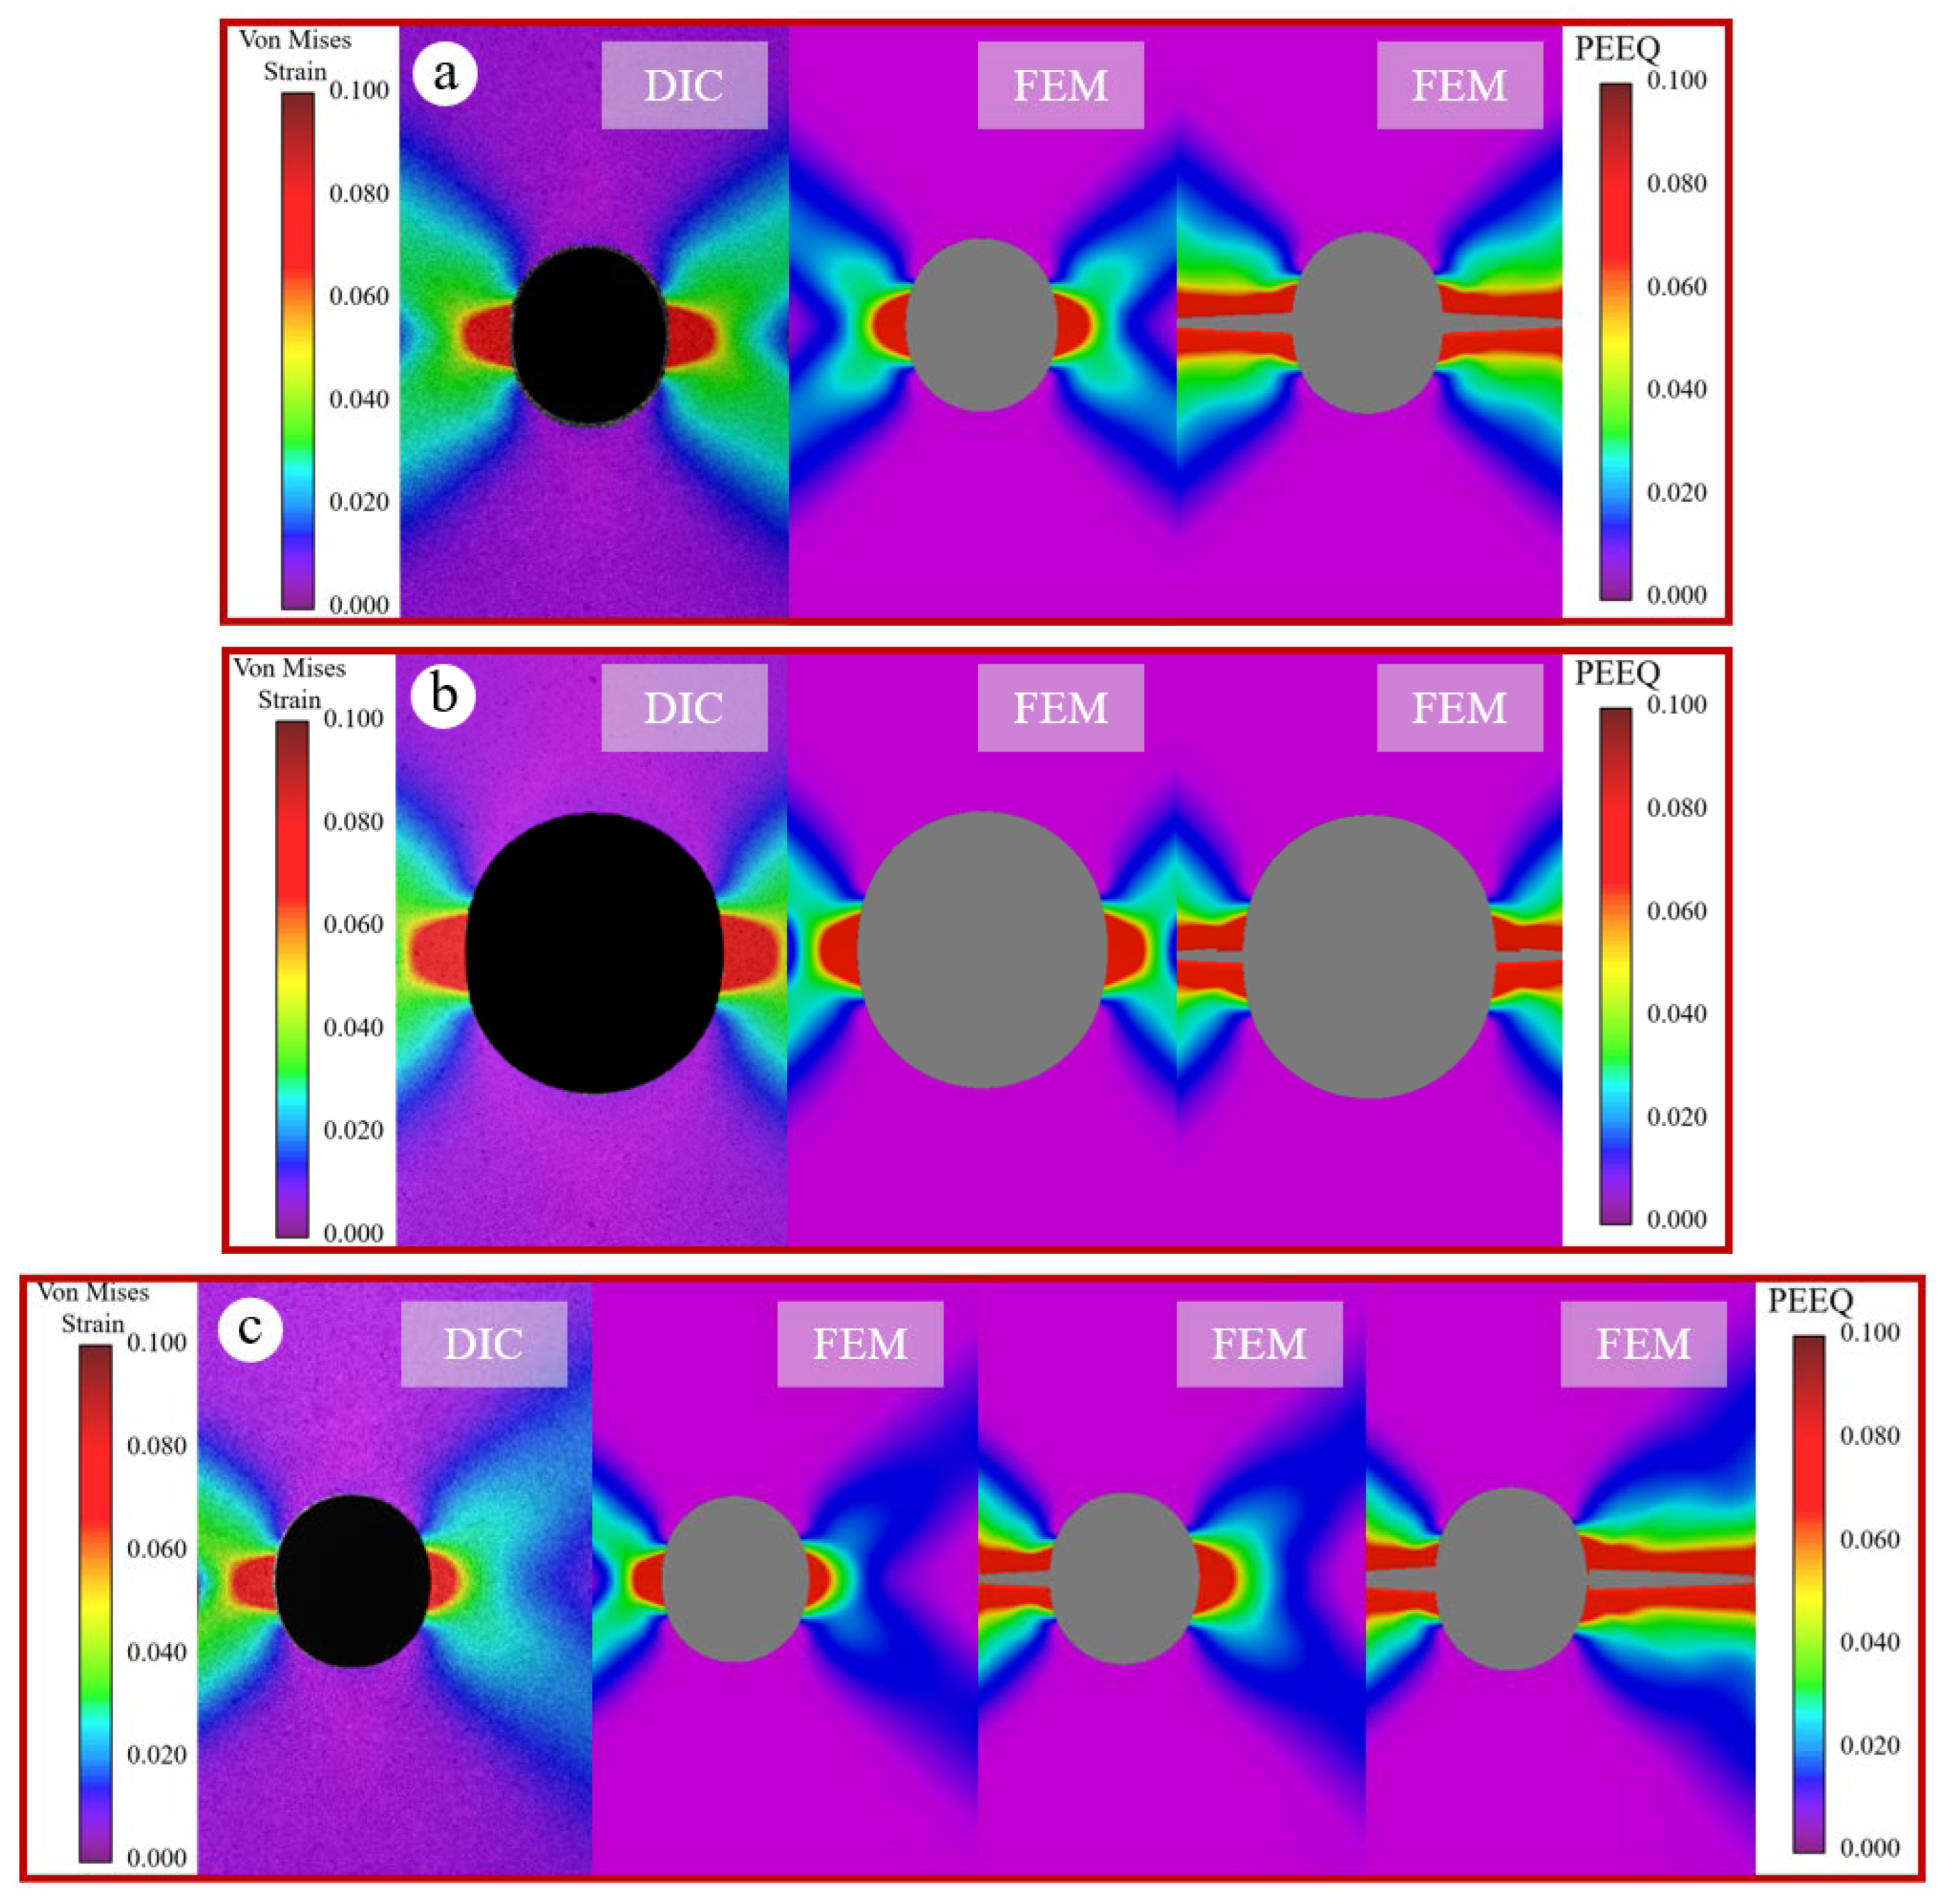
Figure 9a–c shows the comparison between DIC and finite element mode (FEM) results for specimens P-R15-X40, P-R25-X40, and P-R15-X30. In each group, the first image represents the DIC result, while the remaining images correspond to FEM results before failure and at complete failure. Both methods exhibit a similar X-shaped strain field distribution; however, the DIC-measured strain is slightly greater than the FEM result. This discrepancy arises because FEM outputs the equivalent plastic strain (PEEQ), whereas DIC captures the total strain comprising both elastic and plastic components.
Furthermore, by comparing the failure process in Figure 3, specimens with central holes fracture simultaneously on both sides, while those with eccentric holes fracture sequentially. Both DIC and FEM consistently reflect this failure mode. Thus, the DIC and FEM results demonstrate strong agreement.

4.4. Simulation Result

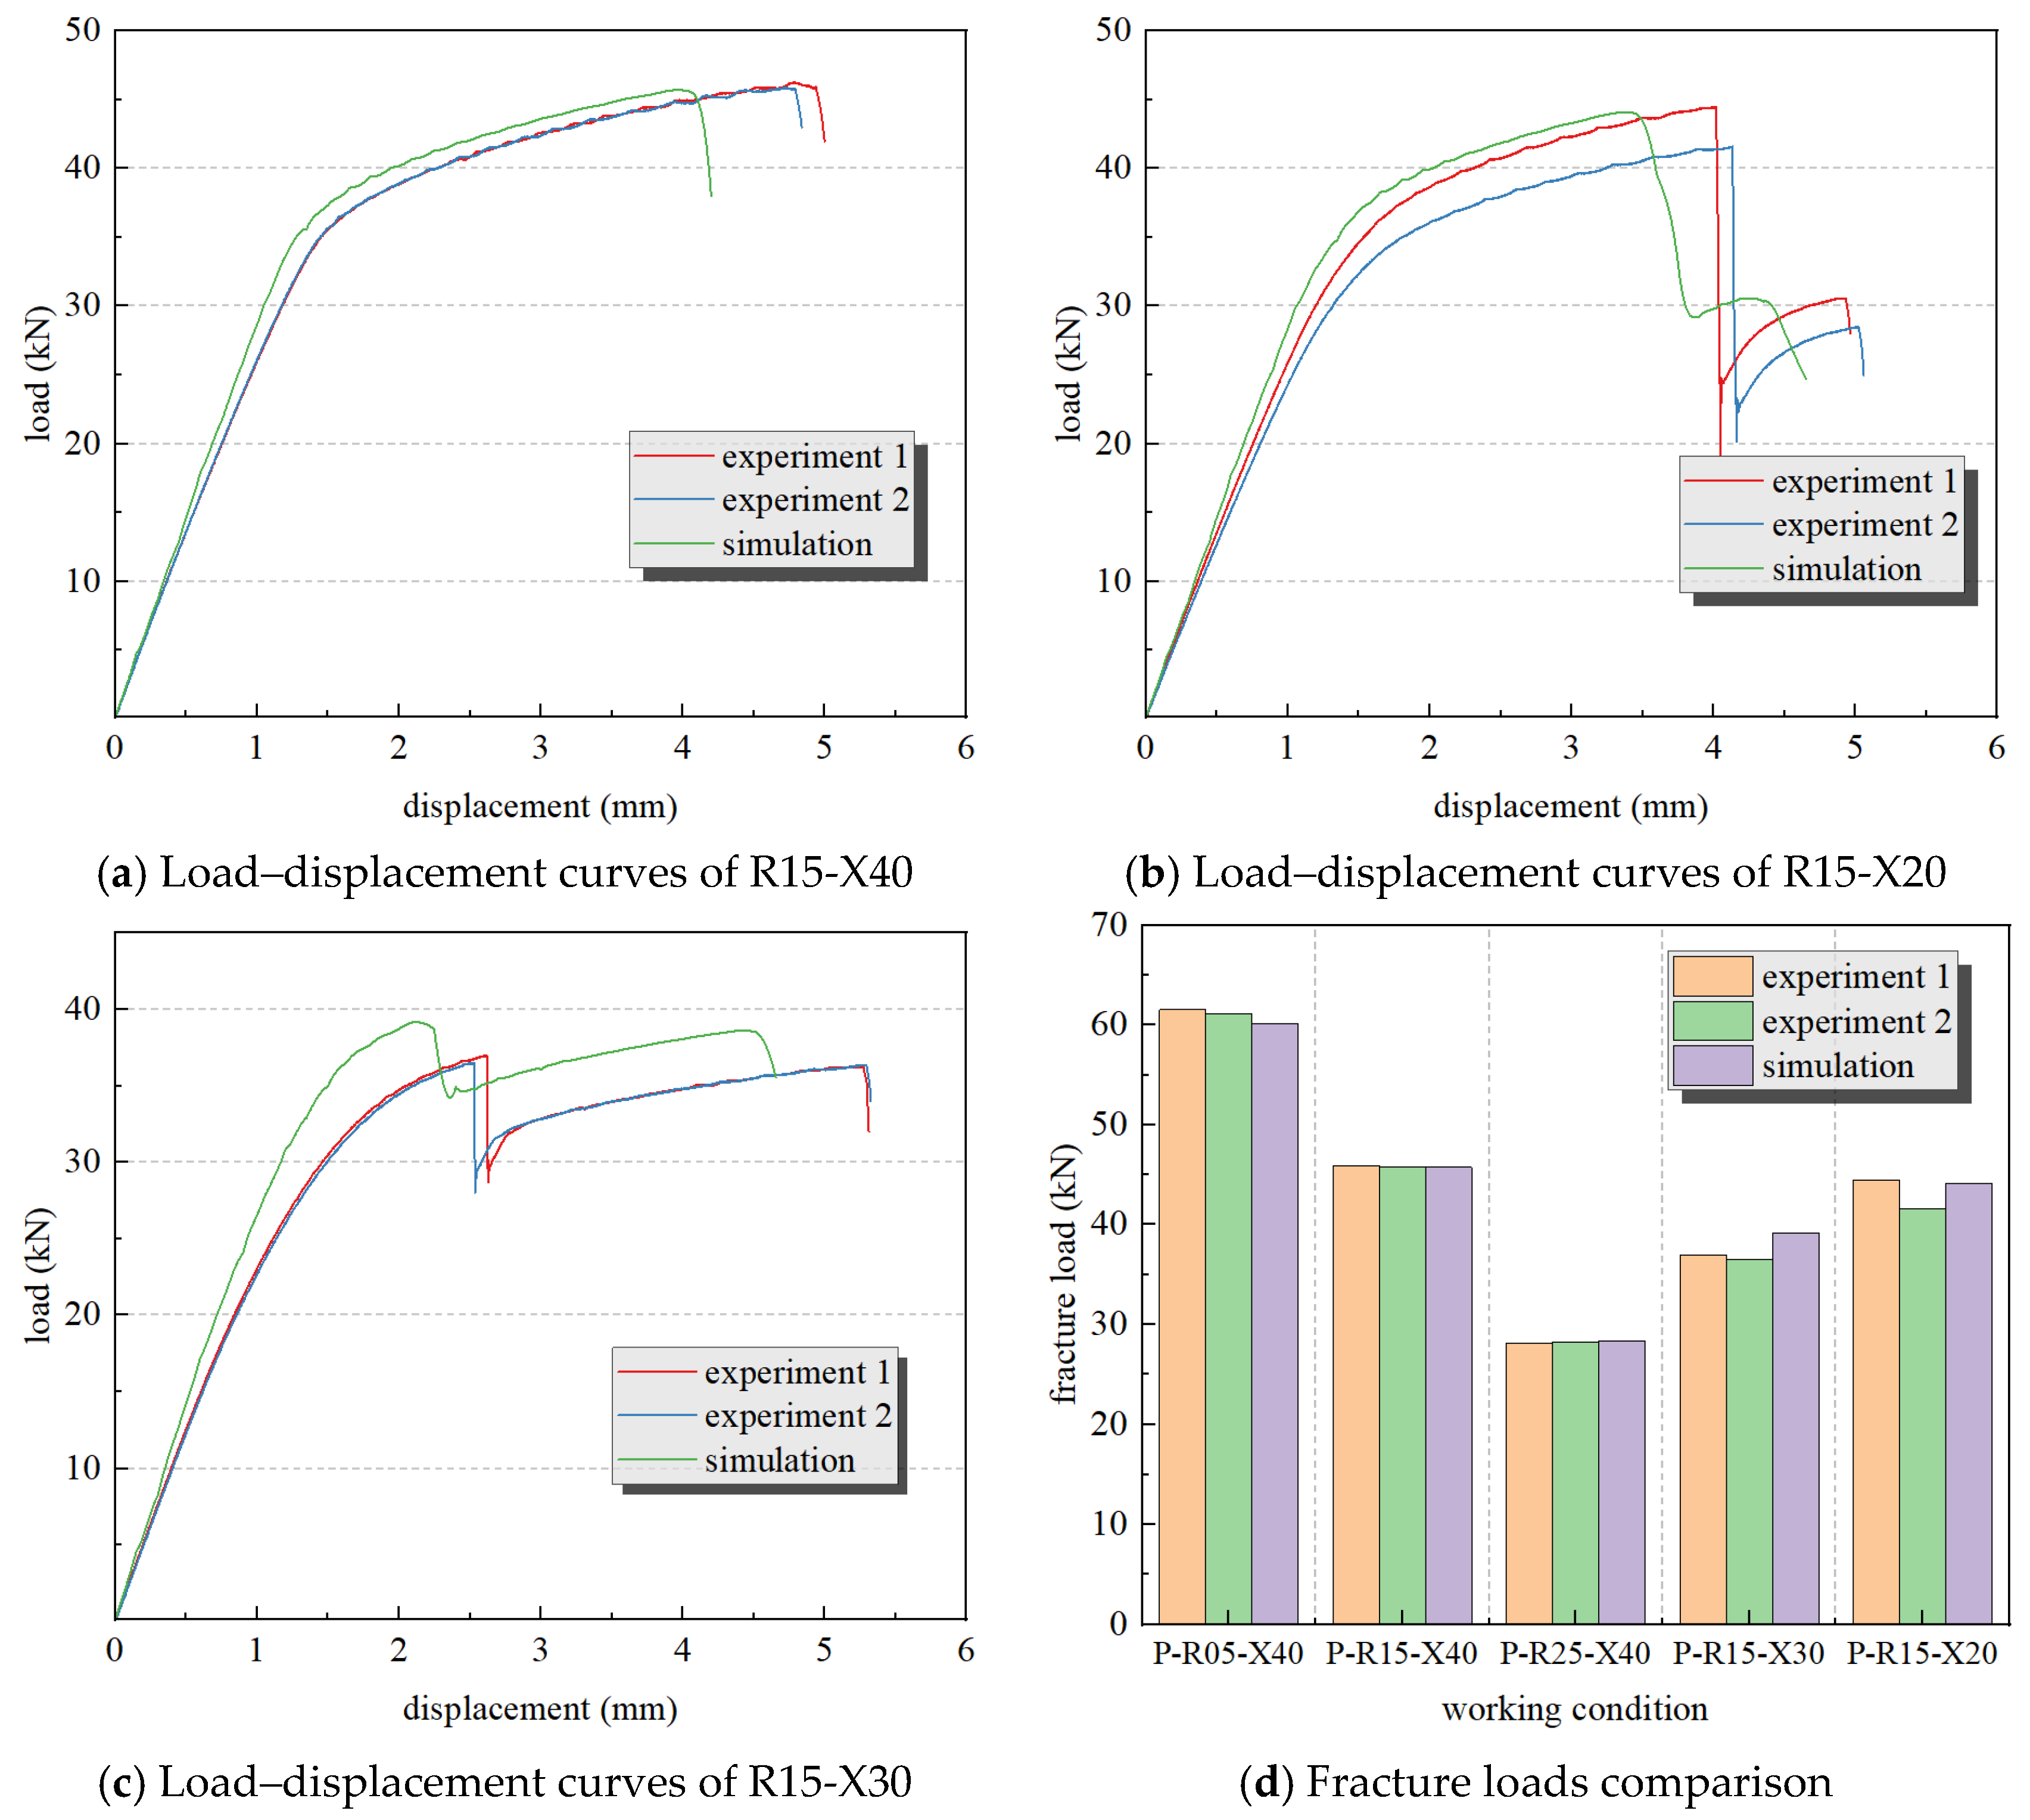
The analysis of the load–displacement curves from both simulation and tests is presented in Figure 10, which shows a comparison for some working conditions. The simulation curves exhibit the same variation trend as the experimental curves. For the case with a central hole, fracture occurred simultaneously on both sides of the hole, resulting in only a single drop in the load–displacement curve. In contrast, cases with eccentric holes exhibited two fracture events, leading to two distinct load drops in the load–displacement curve. The fracture displacement in the simulation results is smaller than that in the test results. This discrepancy arises because the simulation employed a ductile fracture criterion, where damage initiates from elements on both sides of the hole and propagates gradually along the sides of the panel. The progressive stiffness degradation of these elements causes the load to drop gradually in the simulation curve, and panel damage manifests earlier. Conversely, in the physical test, fracture occurred across the entire cross-section of the panel. The more uniform stress distribution within the panel section delayed the onset of damage, resulting in a larger fracture displacement. Meanwhile, the simulation only investigates the elongation displacement of the test section while ignoring the displacement caused by the stretching of the clamped section under the grip jaws, resulting in an underestimation of the overall displacement. The maximum error between the simulated maximum fracture load and the experimental value is 7.44%, indicating that the simulation can accurately reflect the maximum fracture load of the panel.

5. Variation Patterns of Panel Residual Strength

5.1. Fracture Mechanism

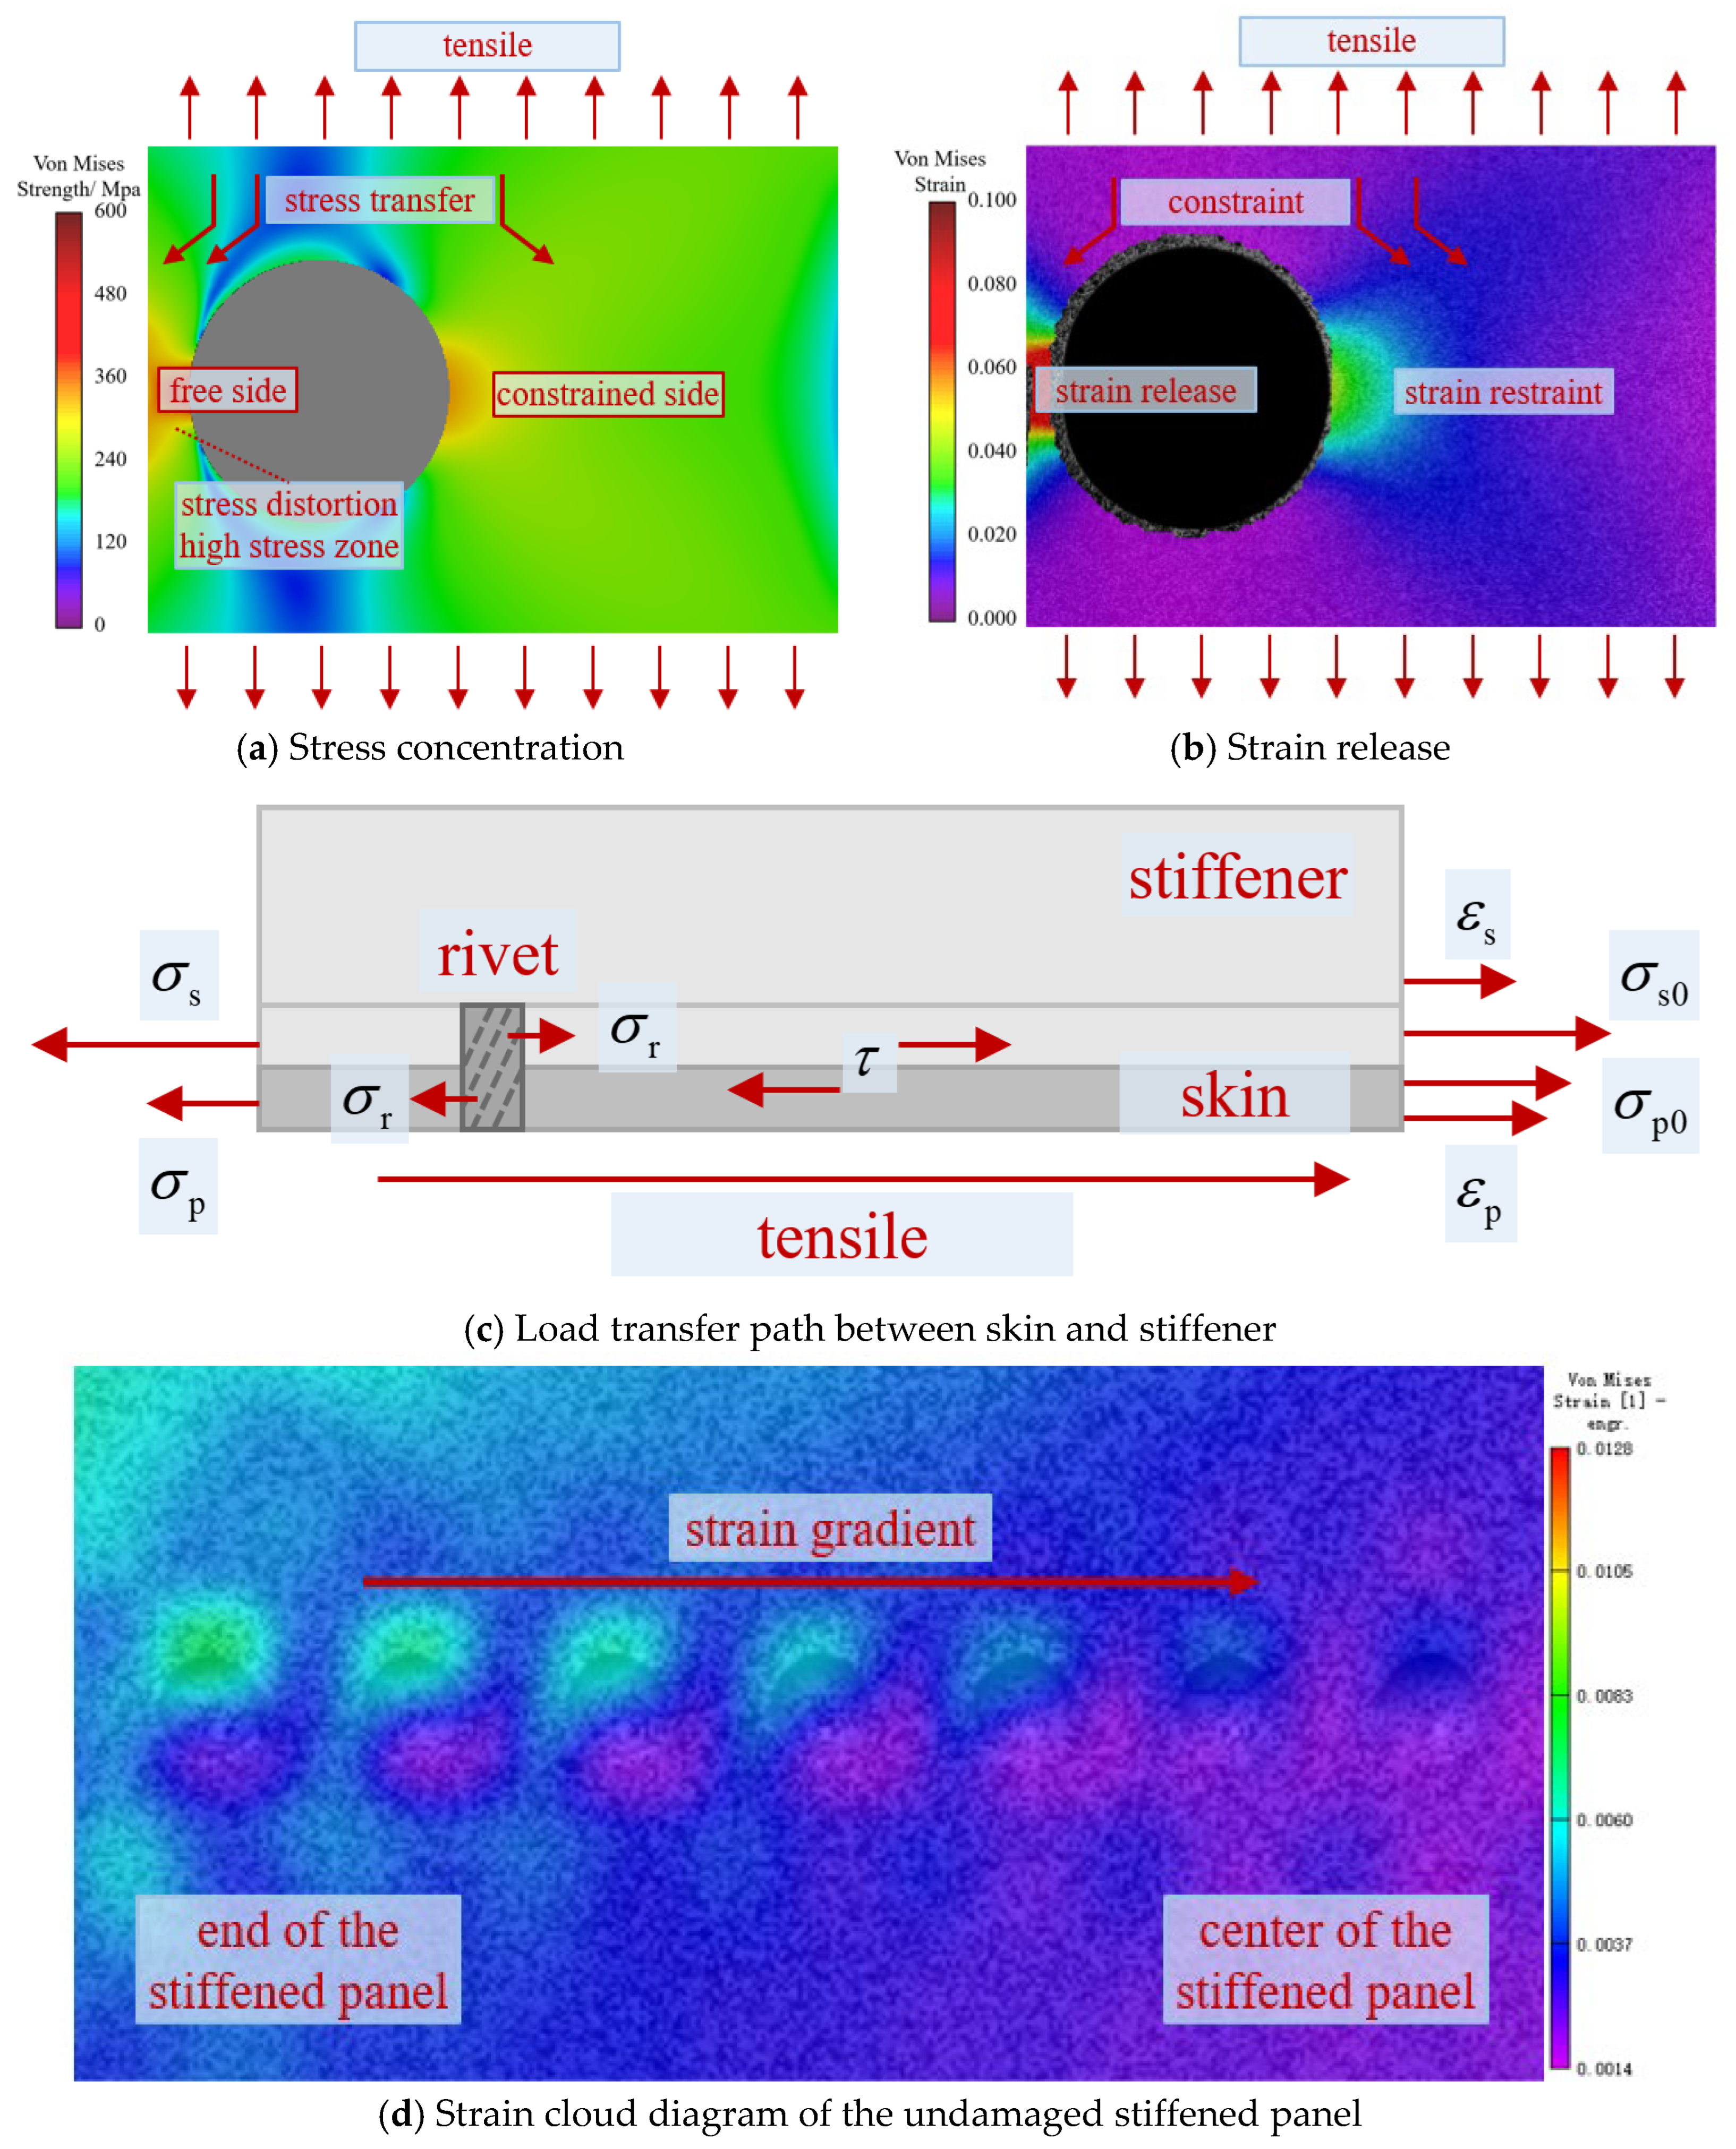
For metal panels with a centrally located hole, the constraints on both sides of the hole are symmetrical, leading to symmetric changes in stress and strain. Consequently, fracture occurs simultaneously on both sides of the hole. In contrast, for metal panels with an eccentric hole, the asymmetry of the material distribution on either side of the hole results in asymmetric constraints. The constraining effect shifts towards the side with more material (the side farther from the panel edge), which inhibits stress expansion on this constrained side. The side closer to the panel edge lacks sufficient material constraint, becoming a free side that approximates a uniaxial stress state (plane stress state). Within this plane, the shear stress increases significantly and gradually dominates the material fracture process, accelerating failure. The edge effect, arising from the coupling interaction between the hole edge and the panel edge on the free side, causes a distortion of the stress field. This leads to the concentration of high-stress areas towards the free side. The short path between the hole edge and the panel edge also increases the stress gradient, progressively forming a high-stress band between the hole edge and the panel edge. Insufficient constraint also makes strain on the free side more readily released. Larger strains accelerate failure on the free side. As clearly observed from the strain nephogram in Figure 3, strain expansion proceeds faster on the free side. Both the aforementioned stress concentration and strain release contribute to the premature fracture on the free side. Macroscopically, this manifests as the free side of the panel fracturing first, followed by the constrained side. The fracture mechanism is illustrated in Figure 11. This edge effect is more applicable when the constraints on both sides of the panel are symmetrical or approximately so. In such cases, the edge effect primarily depends on the uneven stress distribution caused by material asymmetry on either side of the rupture. Special scenarios may arise if the constraint disparity between the two sides of the panel is excessively large.
The stress concentration and strain release result in an uneven distribution of average stress across various sections of the panel. Based on this observation, a modified method for the net-section criterion is proposed.
In stiffened panel structures, the fracture of the stiffener prior to the skin is not only attributable to the material property differences between the 2000-series and 7000-series aluminum alloys but also closely related to the load transfer path between the stiffener and the skin. Figure 11c illustrates the force schematic of an arbitrary small segment of the stiffened panel element along the cross-section from the central boundary. The stiffener and the skin are connected by rivets. The externally applied tensile load is distributed between the stiffener and the skin. The higher elastic modulus of the 7000-series aluminum alloy results in less strain in the stiffener compared to the skin. This difference in deformation (large displacement in the skin vs. small displacement in the stiffener) creates a displacement discrepancy at their interface. Consequently, shear stress (τ) develops due to interfacial friction, as shown in the figure. Simultaneously, the riveted connection resists the relative displacement deformation between the stiffener and the skin. The mutual squeezing between the rivet and the inner wall of the rivet hole generates normal stress (σr). The entire stiffened panel maintains a quasi-static equilibrium, satisfying the force balance Equation (6). In this equation, σs represents the axial tensile stress in the stiffener on the side closer to the panel center, σp denotes the axial tensile stress in the skin on the side closer to the panel center, σs0 signifies the axial tensile stress in the stiffener on the side closer to the panel boundary, and σp0 indicates the axial tensile stress in the skin on the side closer to the panel boundary. A supplementary set of tensile tests was conducted on a complete stiffened panel. Observation of the panel’s skin surface revealed a distinct strain gradient that decreased from the edges of the rivet holes towards the center, as shown in Figure 10d. However, compared with Figure 5, the rupture in the panel had a more significant impact on the overall strain distribution, with the high-strain regions ultimately converging around the rupture.
According to Equation (6), the axial tensile stress in the stiffener gradually increases from the panel boundary towards the panel center, while the axial tensile stress in the skin gradually decreases over the same path
σ s = σ r + τ + σ s 0 σ p + σ r + τ = σ p 0
During the elastic stage, both the skin and the stiffener are subjected to external tensile loading, and the load distribution follows the stiffness allocation principle. The skin, made of 2000-series low-strength aluminum alloy, yields first. As the skin’s stiffness decreases, the tensile load gradually transfers to the stiffener. Consequently, the stiffener bears an increasing load and becomes the primary load-bearing component of the entire panel. The axial stress in the central region of the stiffener reaches its maximum. When the average stress at the central cross-section attains the ultimate stress of the stiffener material, the stiffener fractures instantaneously and loses its load-bearing capacity. The load originally carried by the stiffener is then transferred to the skin through the rivet-induced normal stress (σr) and the interfacial shear stress (τ). This sudden transfer of load imposes an impulsive force on the skin. Depending on the magnitude of this impulse and the residual strength of the skin, two macroscopic failure scenarios may occur: the skin fractures immediately along the perforated cross-section, resulting in simultaneous fracture of both the stiffener and the skin at that section; or the skin does not fracture immediately upon stiffener failure but continues to bear the redistributed load until it fails subsequently, resulting in a sequential failure where the stiffener fractures first, followed by the skin.

5.2. Simulation Data Analysis

Based on the finite element simulations in Section 4, the variation ranges of the punching hole radius R and the center coordinates (X, Y) are determined. Based on the geometric relationship between the hole radius R, the center coordinates (X, Y), and the panel structure, the following constraint conditions are established. The extent of the pre-fabricated hole must not exceed the range of the panel’s width direction, given by the formula:
X R 0 X + R 80
Based on the aforementioned constraint conditions, 35 finite element simulations were conducted within the specified range.
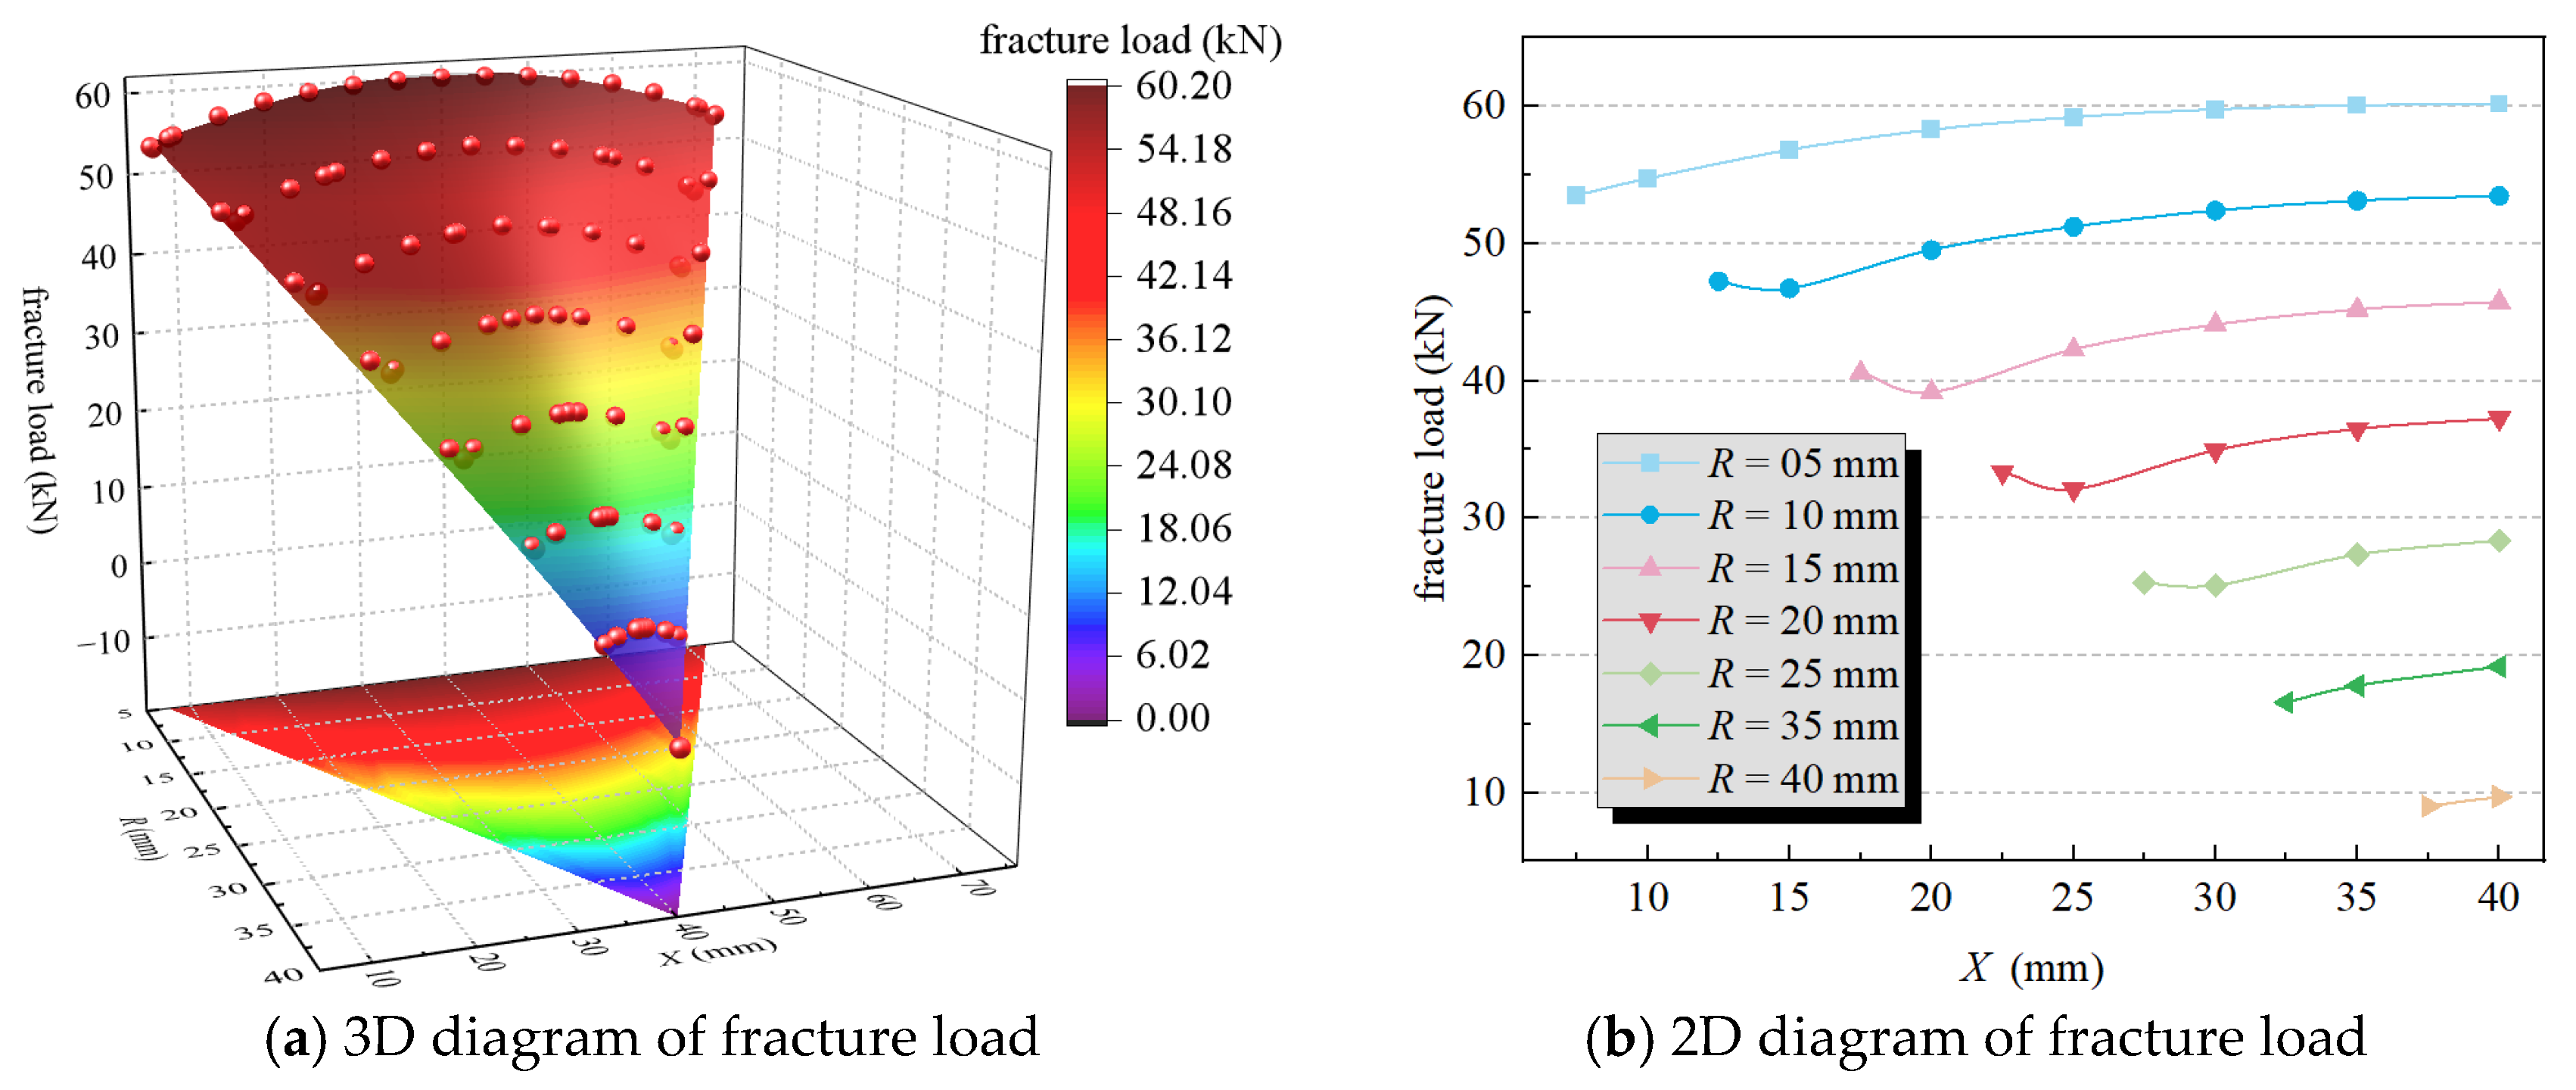
The aforementioned experimental and simulation results indicate that for panels with eccentric holes, the two load peaks generated by the two fracture events exhibit a transitional critical value, termed the dual-peak critical value Xdual. As X increases, the primary fracture load increases, while the secondary fracture load decreases. This occurs because a larger X positions the pre-fabricated hole closer to the center of the panel. This leads to a more balanced constrained region on both sides of the hole and a reduction in the stress concentration and strain release effect on the free side. Concurrently, the cross-sectional area on the free side increases with X, enhancing its load-bearing capacity and resulting in a higher primary fracture load. Conversely, the situation on the constrained side is the opposite: its edge cross-sectional area decreases with increasing X, weakening its load-bearing capacity and leading to a lower secondary fracture load. The cross-sectional areas of both sides gradually tend to become equal, allowing them to bear the tensile load more uniformly and resulting in an overall increase in the load-bearing capacity of the structure.
Based on the aforementioned discussion and the summary of finite element simulation results under various working conditions, a three-dimensional envelope surface diagram of F-R-X for all conditions is plotted, as shown in Figure 12. The overall envelope exhibits an approximately taper-like shape expanding outward with its vertex at (40, 40, 0) and is generally symmetrical about the plane X = 40 perpendicular to the X-O-R plane. When R remains constant, for the section where X ≤ 40, the fracture load F of the panel first decreases and then increases as X increases. The lowest point occurs at X = Xdual, the critical value for the bimodal load. This is because when XXdual, the secondary fracture load is greater than the primary fracture load; therefore, the secondary fracture load is selected as the overall fracture load of the panel. Since the secondary fracture load decreases with increasing X, the panel’s fracture load F decreases initially in this range. Conversely, when XXdual, the primary fracture load becomes greater than the secondary fracture load and is thus selected as the overall fracture load. The primary fracture load increases with increasing X, leading to an increase in the panel’s fracture load F for X ≥ Xdual. When X remains constant, the fracture load F decreases as the hole radius R increases. This is because a larger R reduces the cross-sectional area of the panel along the hole diameter direction, thereby decreasing its load-bearing capacity and consequently reducing the fracture load. When R = 40 mm, the cross-sectional area along the hole diameter becomes zero, resulting in a fracture load of zero. Overall, the maximum fracture load of the panel first decreases and then increases with increasing X, while it continuously decreases with increasing R.

5.3. Evaluation Methods for Fracture Load of Panel Structures

For the residual strength evaluation of metal panels containing smooth circular holes, the Net Section Yield Criterion [18] or the Net Section Failure Criterion [26,27] posits that the panel fails when the average stress on the cross-section at the smooth circular hole reaches the material’s yield strength σ s or the material’s ultimate strength σ b , as shown in Equation (8),where FR is the load evaluated by the net section fracture criterion and AR is the net cross-sectional area after damage. The evaluation results indicate that the Net Section Yield Criterion is more conservative, while the Net Section Failure Criterion is more hazardous.
F N = σ s A R or   F N = σ b A R
Taking the Net Section Failure Criterion as an example, the evaluation results under different hole radii were calculated and compared with simulation values to compute the error. It was found that for the assessment of the panel, the calculated evaluation results were identical across different hole locations and sizes. However, in reality, the fracture loads of the panel under different working conditions varied, and the error of this method increased as the hole moved closer to the two sides, reaching a maximum of even over 26%. This is because the Net Section Failure Criterion assumes that during the loading process of a panel with a hole, the metal material on both sides of the hole along the cross-section perpendicular to the load first enters the plastic zone and then hardens. The load is then borne by the metal material on the edge side that is still in the elastic stage until it too enters the plastic stage and hardens. The plastic zone expands from both sides of the hole towards the edges of the panel until all the metal on the cross-section perpendicular to the load enters the plastic stage, and the stress across the entire section reaches the material’s ultimate strength σ b , leading to simultaneous failure and destruction of the entire section. In judging the failure of the panel, this criterion assumes the average stress on this section equals the material’s ultimate strength σ b . However, for panels with eccentric holes, stress concentration and strain release cause an uneven stress distribution on the cross-section. The free side of the panel fails first, and the larger the eccentricity, the greater the distortion of the stress distribution, leading to lower assessment accuracy of the Net Section Failure Criterion
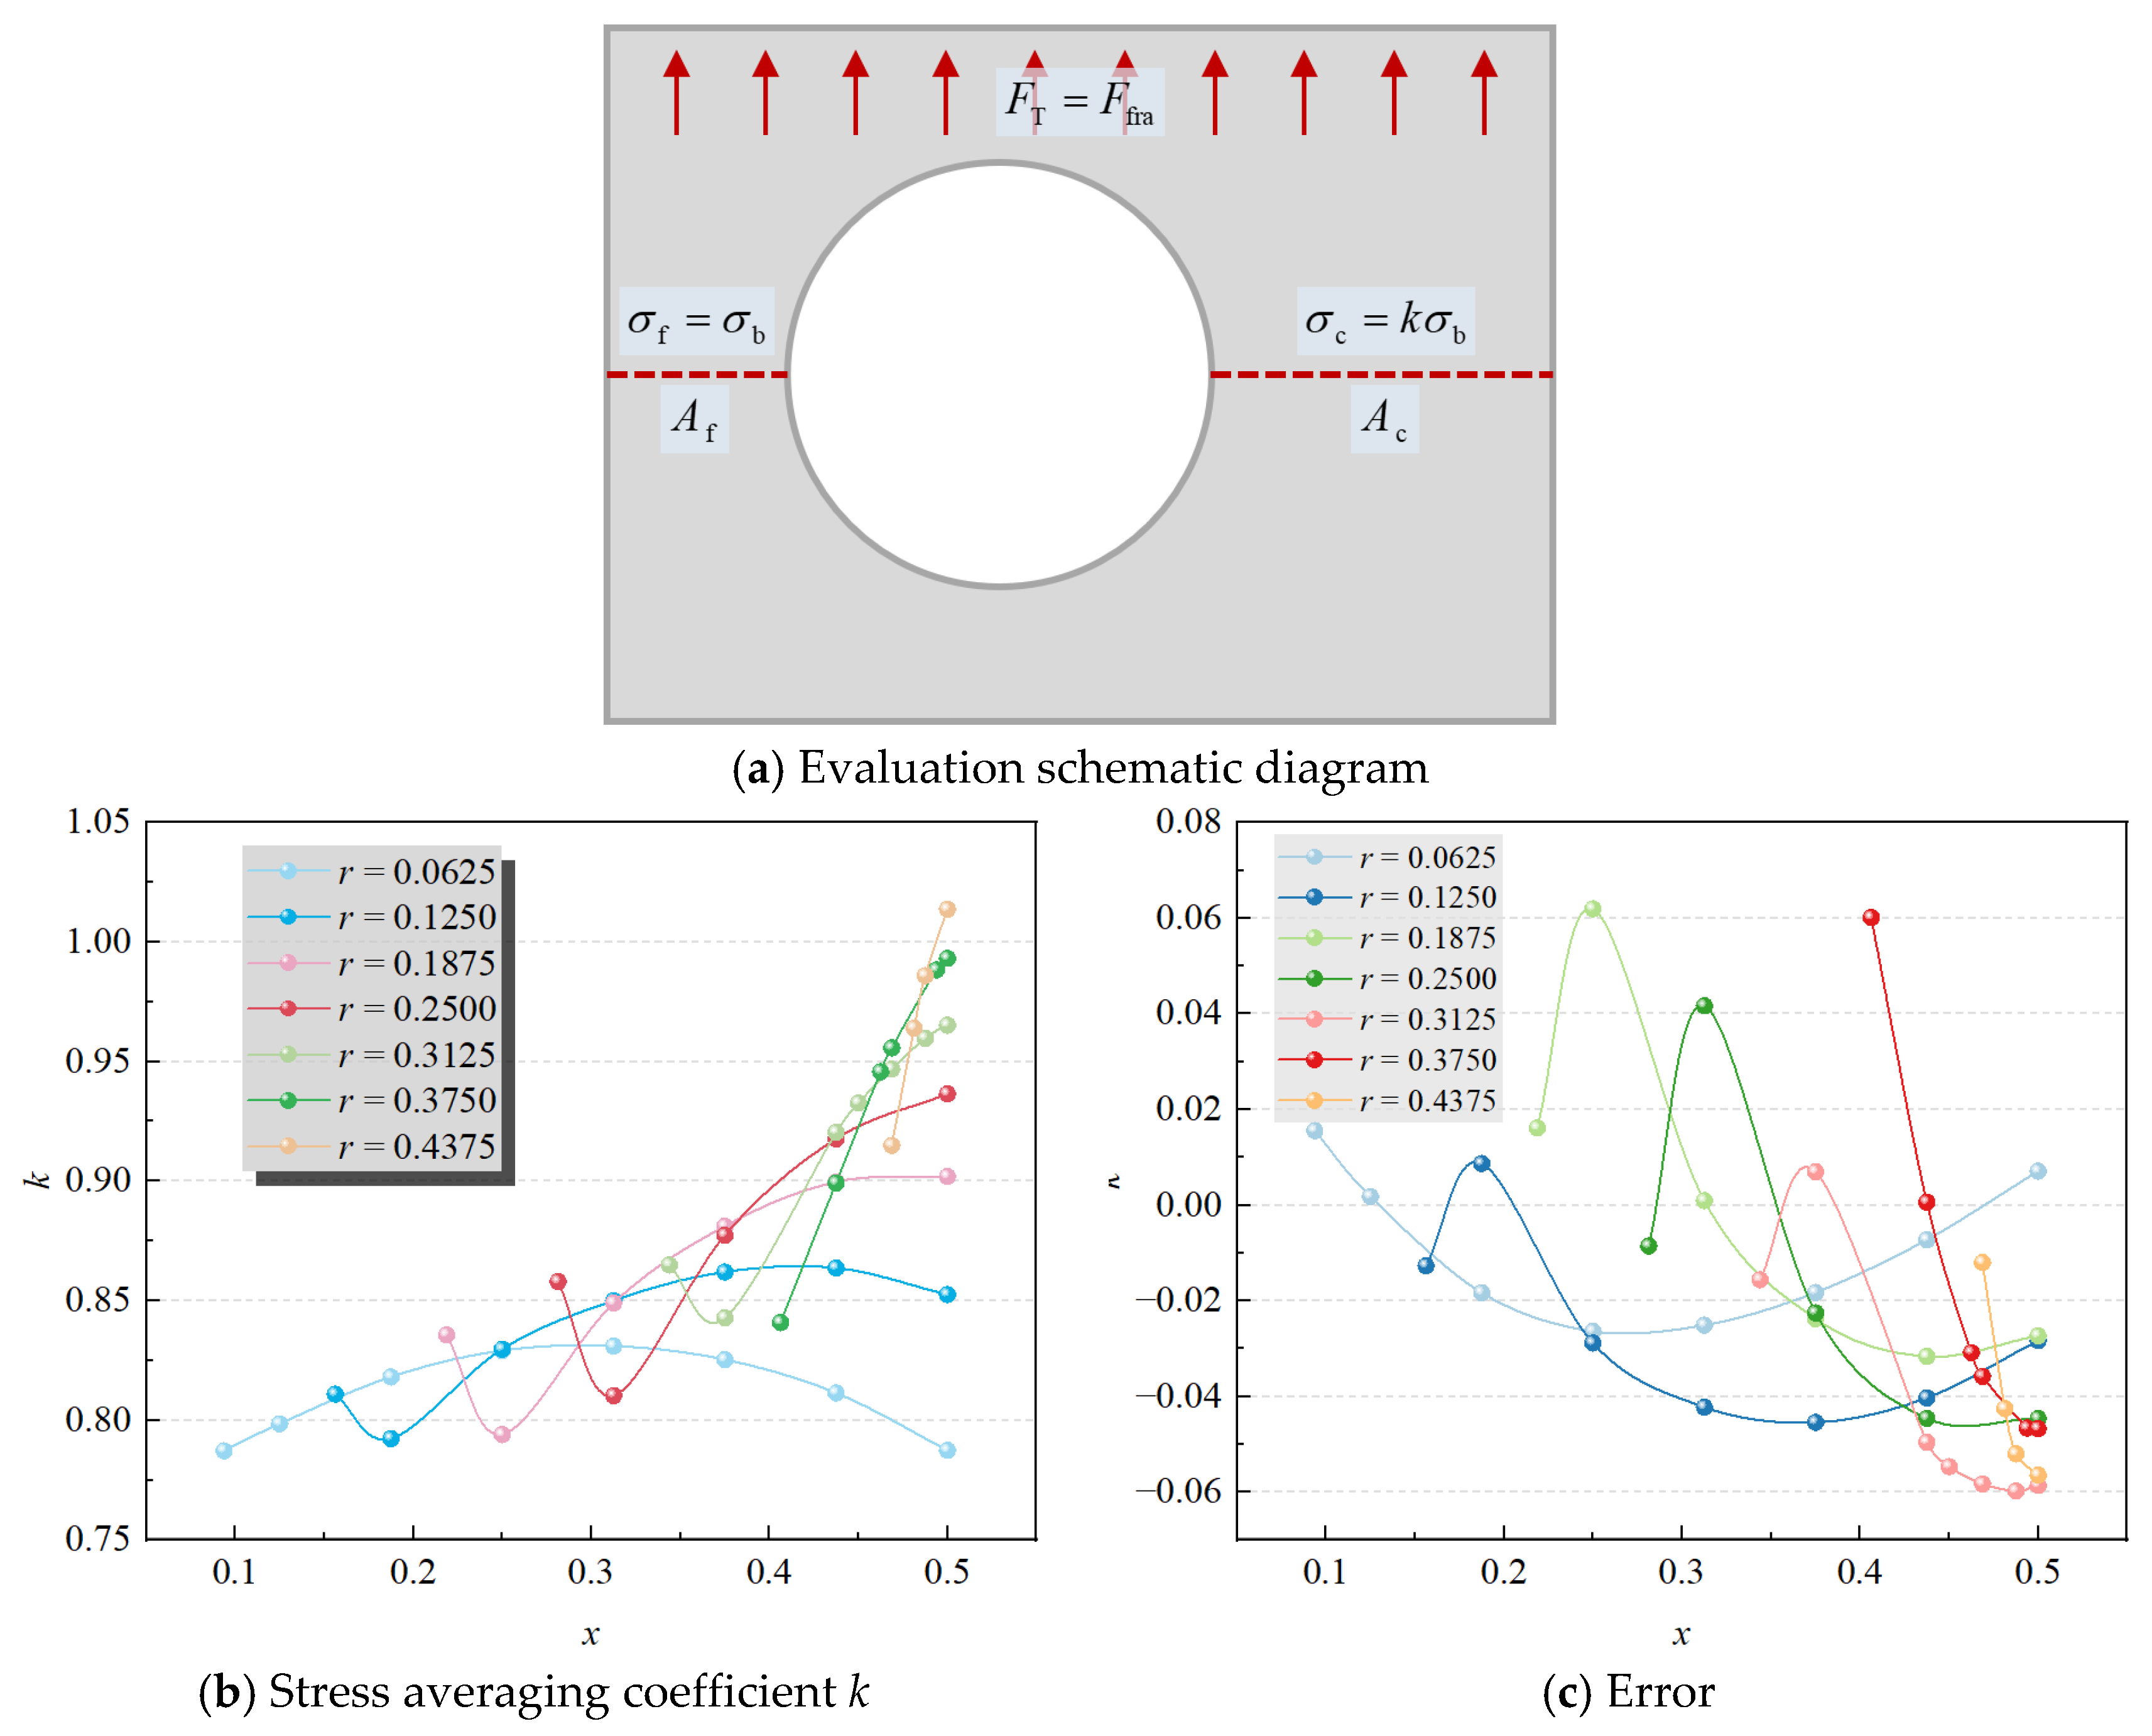
In Figure 12b, the influence of X on the panel’s fracture load is less significant than that of R. This allows for an overall assessment of the residual strength across different X values at a constant R. As analyzed in the previous section regarding the fracture mechanism, for panels with eccentric holes, the free side fractures first, followed by the constrained side. This occurs because the average stress on the free side cross-section reaches the material’s tensile strength first, while the average stress on the constrained side cross-section has not yet attained the tensile strength. The external load is generally equal to the sum of the loads borne by the free side and the constrained side, as expressed in Equation (9), where σ f is the average stress on the free side, Af is the cross-sectional area of the free side, σ c is the average stress on the constrained side, Ac is the cross-sectional area of the constrained side, and FT is the tensile load of the panel. A schematic diagram is shown in Figure 13a.
σ f A f + σ c A c = F T
The panel fractures when the average stress on the free side first reaches the material’s ultimate strength σ b . At this point, the tensile load on the panel is defined as the panel fracture load Ffra. A stress averaging coefficient k is introduced to characterize the degree of stress uniformity on both sides of the hole. A larger k value indicates a more balanced stress distribution across the hole sides. Theoretically, when k = 1, the average stresses on both sides of the hole are equal. By defining r = R/W and x = X/W, Equation (9) can be transformed into the following form:
σ b A f + k σ b A c = F fra
k = F fra σ b A f σ b A c = F fra σ b X R h σ b W X R h = F fra σ b W h x + r 1 x r
The stress averaging coefficient k was calculated under different working conditions, as shown in Figure 13b. Observation reveals that the stress averaging coefficient k generally exhibits an increasing trend with r, gradually approaching 1, while it first decreases and then increases with x. Although the analysis process assumes a uniform stress distribution across the cross-section, in reality, stress remains concentrated on both sides of the hole and decreases along the cross-sectional direction. As r increases, the material on both sides of the hole in the panel decreases, the cross-sectional area reduces, the stress distribution across the section becomes more balanced, and the stress averaging coefficient k also approaches 1 more closely. In the region where x < xdual, the secondary fracture load is practically selected as the maximum fracture load of the entire panel, whereas Equation (11) considers the primary fracture load to be the maximum fracture load of the panel. Since the secondary fracture load is greater than the primary fracture load, the overall stress averaging coefficient k is naturally larger. As x increases, the hole gradually approaches the center of the panel, and the stress distribution on both sides of the hole tends to become symmetrical and balanced, leading to an increase in the stress averaging coefficient k. However, under small r conditions, the stress averaging coefficient k decreases again as x approaches the center. The reason is that under small r, the stress distribution on both sides of the panel decreases along the hole’s cross-sectional direction. When the hole approaches the panel center, the stress gradient on the free side intensifies, and the average stress fails to reach the material’s ultimate strength, causing failure and fracture. This results in a decrease in σ f A f . Meanwhile, the cross-sectional area on the constrained side decreases, and the stress distribution tends to balance, leading to an increase in σ c A c . Under the combined influence of the free side and the constrained side, the effect of the constrained side gradually dominates, and the stress averaging coefficient k correspondingly decreases.
Different working conditions necessitate the use of different stress averaging coefficients k. While increasing the number of k values improves model accuracy, it also significantly increases the complexity of the assessment model. Therefore, the holes are categorized into three sizes—small, medium, and large—and a unified, simplified stress averaging coefficient k is selected for each category. For small holes, k is taken at the r value where the k curve begins to show a descending trend at its end. For medium holes, k is taken at the r value where the k curve exhibits a significant descending trend at the front (excluding the range defined for small holes). For large holes, k is taken at the remaining r values greater than those defined for medium holes.
According to the selection principle for the stress averaging coefficient k specified in Equation (12), substitute into Equation (10) to re-evaluate the fracture loads under various working conditions and compute the errors, as shown in Figure 13c. The errors are all within ±6.19%, effectively balancing the simplicity and effectiveness of the assessment method. For ductile metallic materials, the stress averaging coefficient k generally ranges between 0.8 and 1.0.
k = 0.80 0 < r 0.125 0.85 0.125 < r 0.3125 0.90 0.3125 < r < 0.5

5.4. Evaluation Methods for Fracture Load of Stiffened Panel Structures

Based on the residual strength assessment method established for plain panels, this method is extended to stiffened panel structures. The hole divides the cross-section of the perforated stiffened panel structure into multiple regions. Each region’s area contributes differently to the structural fracture process. Similarly, a stress averaging coefficient ki is used for each region to represent the average stress level in the other regions when the average stress in this specific region reaches the material’s ultimate strength. The externally applied load FT equals the sum of the loads borne by each region of the skin and the stiffener on this cross-section, where σ pi and σ si are the average stresses in the i-th region of the skin and stiffener, respectively, and Api and Asi are the corresponding areas of the i-th region in the skin and stiffener, respectively,
i σ pi A pi + i σ si A si = F T
When the fracture load Ffra is reached, the average stress coefficients for each region of the skin and the stiffener are denoted as kpi and ksi, respectively. Here, σ pb and σ sb represent the ultimate strengths of the skin and the stiffener, respectively,
i k pi σ pb A pi + i k si σ sb A si = F fra
The fracture sequence of the panel reflects the level at which the average stress in each region reaches the ultimate strength. Regions that fracture preferentially have an average stress closer to the material’s ultimate strength, and their stress averaging coefficient k is closer to 1. For the weakest region where the average stress has already reached the ultimate strength of the structure, ki = 1 is assigned. For the region that fractures last, the value is determined using Equation (12) based on the hole radius size. The remaining regions are assigned ki values following a gradient between the values of the aforementioned two regions. Taking specimen S-R05-X40 as an example, the cross-section containing the hole is shown in Figure 14. The fracture sequence of the specimen was stiffener-skin. For the stiffener, ks1 = ks2 = 1. For the skin, kp1 = kp2 = 0.8 was determined using Equation (12). Substituting these into Equation (14), the evaluated fracture load was calculated to be 88.26 kN, which has an error of 1.96% compared to the experimental value. The residual strength (fracture load) assessments for four groups of stiffened panels are presented in Table 3. The maximum error was 3.15%, demonstrating accurate evaluation of the fracture load for the stiffened panels

6. Conclusions

This paper conducts a numerical analysis of the fracture load (residual strength) of aluminum alloy panels (plain plates) and stiffened panels containing pre-fabricated holes, investigating the variation patterns of the fracture load with the radius and center coordinates of the pre-fabricated holes. A quasi-static tensile fracture test at a rate of 1 mm/min was applied to the aluminum alloy panel specimens with pre-fabricated holes using a loading module, imaging module, and illumination module. The fracture process and the changes in strain nephograms of the specimen results were analyzed, validating the effectiveness of the finite element model for simulating the tensile fracture of metallic panels. Based on numerical simulations, the damage and fracture analysis of the structure under various working conditions was extended, and the numerical analysis of fracture load and residual strength was also expanded. The assessment accuracy of the net-section failure criterion, as it varies with the hole position and radius, was refined based on experimental and simulation data. The following conclusions can be drawn from this study:
  • For the panel specimen with a central hole, fracture occurs simultaneously on both sides due to uniform loading. In contrast, for the panel specimen with an eccentric hole, asymmetric constraints lead to stress concentration and strain release on the free side, resulting in the free side fracturing first, followed by the constrained side
  • The load–displacement curve for the centrally perforated panel exhibits only a single load drop. However, the load–displacement curve for the eccentrically perforated panel shows two load drops due to the sequential fracture of the panel material on either side of the hole. The relationship between these two fracture loads exhibits a dual-peak critical value, Xdual.
  • The load–displacement curve for the stiffened panel specimen displays multiple load drops. Because the 7000-series aluminum alloy is more brittle than the 2000-series aluminum alloy, the stiffener fractures first under quasi-static tensile loading. Subsequently, the failure mode of the skin becomes consistent with that of the plain panel.
  • The stress distribution is uneven across the two sides of the hole in eccentrically perforated panels. The Net Section Failure Criterion shows significant evaluation errors for these panels. Introducing a stress averaging coefficient (k) to modify the relationship between the Net Section Failure Criterion and the hole’s location and size improve the evaluation accuracy of the residual strength for perforated panels, with the maximum error reduced to 6.19%.
  • The modified method of the Net Section Failure Criterion for plain panels was extended to stiffened panels. A stress averaging coefficient was introduced for each sectional region to account for the influence of hole location and size. After this modification across four test conditions, the maximum error was 3.15%
This evaluation method can effectively evaluate the residual strength of panels with circular holes, providing a rapid and practical approach for assessing the residual strength of both battle-damaged panels with circular perforations and panels that have been simply repaired into a circular hole configuration. This contributes to the advancement of battle damage assessment methodologies. However, this method is not suitable for structures containing cracks or for residual strength evaluation under dynamic loads. Furthermore, it may require modification for panels with multiple holes such as additional coefficients or a new effective cross-sectional area. Future research could focus on developing a simplified stress averaging coefficient for more complex structures and incorporating anisotropic corrections specifically for composite material panels.

Author Contributions

Methodology, A.R.; validation, T.Z.; investigation, Y.W. and L.M.; resources, T.A.; data curation, A.R.; writing—original draft preparation, A.R.; supervision, T.Z. and T.A. All authors have read and agreed to the published version of the manuscript.

Funding

This research received no external funding.

Data Availability Statement

The data presented in this study is available on request from the corresponding author. The data is not publicly available due to privacy.

Conflicts of Interest

The authors declare no conflict of interest.

References

  1. Wang, B.; Lv, J.; Dang, P. Research on the design factors and assessment for aircraft structures combat survivability. Adv. Aeronaut. Sci. Eng. 2022, 13, 50–58. [Google Scholar] [CrossRef]
  2. Zhang, X.; Dong, H.; Yu, K. Briefing on Military Aircraft Battle Damage System Assessment. Aviat. Maint. Eng. 2007, 1, 30–33. [Google Scholar] [CrossRef]
  3. Wang, Y.; Zhang, T.; Zhang, H. Damage Evaluation of Typical Aircraft Panel Structure Subjected to High-Speed Fragments. Aerospace 2025, 12, 354. [Google Scholar] [CrossRef]
  4. Li, Y.; Yang, B.; Cao, C. Analysis of Load-bearing Capacity of Aircraft Thin-wall Parts Damage before and after Riveting Repair. New Technol. New Process 2024, 9, 47–50. [Google Scholar] [CrossRef]
  5. Zu, G.; Pei, Y.; Hou, P. Review of aircraft battle damage assessment and repair estimation and design technology. Acta Aeronaut. Et Astronaut. Sin. 2020, 41, 87–108. [Google Scholar]
  6. Li, C.; Li, J.; Wu, Z.; Gao, Y.; Sun, X. Study on key technology requirements analysis for integrity maintenance of typical helicopters. Adv. Aeronaut. Sci. Eng. 2023, 14, 128–137. [Google Scholar]
  7. Li, S.; Hou, M.; Liu, J.; Li, S.; Liu, Y. Building of the Model Base in ASBDARDSS. J. Air Force Eng. Univ. (Nat. Sci. Ed.) 2006, 7, 3. [Google Scholar]
  8. Wang, Y.T.; He, Y.T.; Zhang, T.; Fan, X.H.; Zhang, T.Y. Damage analysis of typical structures of aircraft under high-velocity fragments impact. Alex. Eng. J. 2023, 62, 431–443. [Google Scholar] [CrossRef]
  9. Jia, L.; Yu, N. Research on Repair Process of Damaged Aircraft. Aviat. Maint. Eng. 2022, 10, 94–97. [Google Scholar] [CrossRef]
  10. Strąg, M.; Świderski, W. Non-destructive inspection of military-designated composite materials with the use of Terahertz imaging. Compos. Struct. 2023, 306, 116588. [Google Scholar] [CrossRef]
  11. Yao, X.; Zhao, B.; Xuan, S.; Xue, X.; Miao, C.; Yang, H.; Zhou, J. Development of Science and Engineering Technology of Aviation Composite Structural Repair. Aeronaut. Manuf. Technol. 2024, 67, 24–41. [Google Scholar] [CrossRef]
  12. Wang, Y.; Zhang, T.; Zhang, H.; He, Y.; Ma, L.; Ren, A. The Dynamic Response of Aluminum Alloy Plates Subjected to Multiple-Fragment Impacts Under Pre-Tensile Loading: A Numerical Study. Aerospace 2025, 12, 353. [Google Scholar] [CrossRef]
  13. He, Y.; Zhang, T.; Gou, B. Opinions on the development of military aircraft structural strength based on aircraft structural operational integrity. Adv. Aeronaut. Sci. Eng. 2023, 14, 1–7. [Google Scholar] [CrossRef]
  14. Yang, H.; Zhu, B.; Gao, Y.; Lei, Y. Effects of penetrating holes on tensile properties of titanium honeycomb core panels with variable cross-section. Aeronaut. Manuf. Technol. 2022, 65, 92–95. [Google Scholar] [CrossRef]
  15. He, W.; Wang, C.; Wang, S.; Yao, L.; Wu, J.; Xie, D. Tensile mechanical behavior and failure mechanisms of multihole fiber metal laminates—Experimental characterization and numerical prediction. J. Reinf. Plast. Compos. 2020, 39, 499–519. [Google Scholar] [CrossRef]
  16. Hou, R.; Zhang, J.; Zhou, P.; Tu, M. Residual Strength Analysis of Aircraft LY12 Structure Impacted by Projectile. Aeronaut. Manuf. Technol. 2005, 5, 91–92. [Google Scholar]
  17. Yao, W.W.; Zhou, P.; Hou, S.L.; Gao, Y.K. Investigation on Residual Strength of Airplane Plate with Smooth Circular Hole. Appl. Mech. Mater. 2013, 2454, 31–34. [Google Scholar] [CrossRef]
  18. Jia, B.; Liu, P.; Lu, X.; Geng, Y. Analysis and Assessment on Residual Strength of the Non-Collinear Multi-Crack Structures. Mech. Des. Manuf. 2024, 5, 229–233. [Google Scholar] [CrossRef]
  19. Wang, J.; Callinan, R. Residual strengths of composite structures subjected to ballistic impact. Compos. Struct. 2014, 117, 423–432. [Google Scholar] [CrossRef]
  20. Beygi, R.; Akhavan-Safar, A.; Carbas, R.; Barbosa, A.Q.; Marques, E.A.S.; da Silva, L.F.M. Utilizing a ductile damage criterion for fracture analysis of a dissimilar aluminum/steel joint made by friction stir welding. Eng. Fract. Mech. 2022, 274, 108775. [Google Scholar] [CrossRef]
  21. Li, F.; Yuan, H.; Liu, H. Implementation of metal ductile damage criteria in Abaqus FEA. J. Phys. Conf. Ser. 2021, 1906, 012058. [Google Scholar] [CrossRef]
  22. Chen, G.; Ren, C.; Zhang, P.; Cui, K.; Li, Y. Measurement and finite element simulation of micro-cutting temperatures of tool tip and workpiece. Int. J. Mach. Tools Manuf. 2013, 75, 16–26. [Google Scholar] [CrossRef]
  23. Liu, C.; Sun, Q.; Liu, Y. Numerical simulation of finite deformation and failure of 2A12 specimens under three-dimensional stress state. Chin. J. Nonferrous Met. 2014, 24, 10. [Google Scholar]
  24. Yang, J.; Zhang, T.; Kong, C.; Sun, B.; Zhu, R. Application of Python-Based Abaqus Secondary Development in Laser Shock Forming of Aluminum Alloy 6082-T6. Micromachines 2024, 15, 439. [Google Scholar] [CrossRef] [PubMed]
  25. Li, F.; Wang, A.; Wang, L.; Tan, T. Multi-pass roll bending process of asymmetric Z-section profiles based on ABAQUS secondary development. Forg. Stamp. Technol. 2023, 48, 152–161. [Google Scholar] [CrossRef]
  26. Salih, E.L.; Gardner, L.; Nethercot, D.A. Numerical investigation of net section failure in stainless steel bolted connections. J. Constr. Steel Res. 2010, 66, 1455–1466. [Google Scholar] [CrossRef]
  27. Jiang, K.; Zhao, O. Net section failure of S690 high-strength steel angle-to-plate connections. J. Struct. Eng. 2022, 148, 04022021. [Google Scholar] [CrossRef]
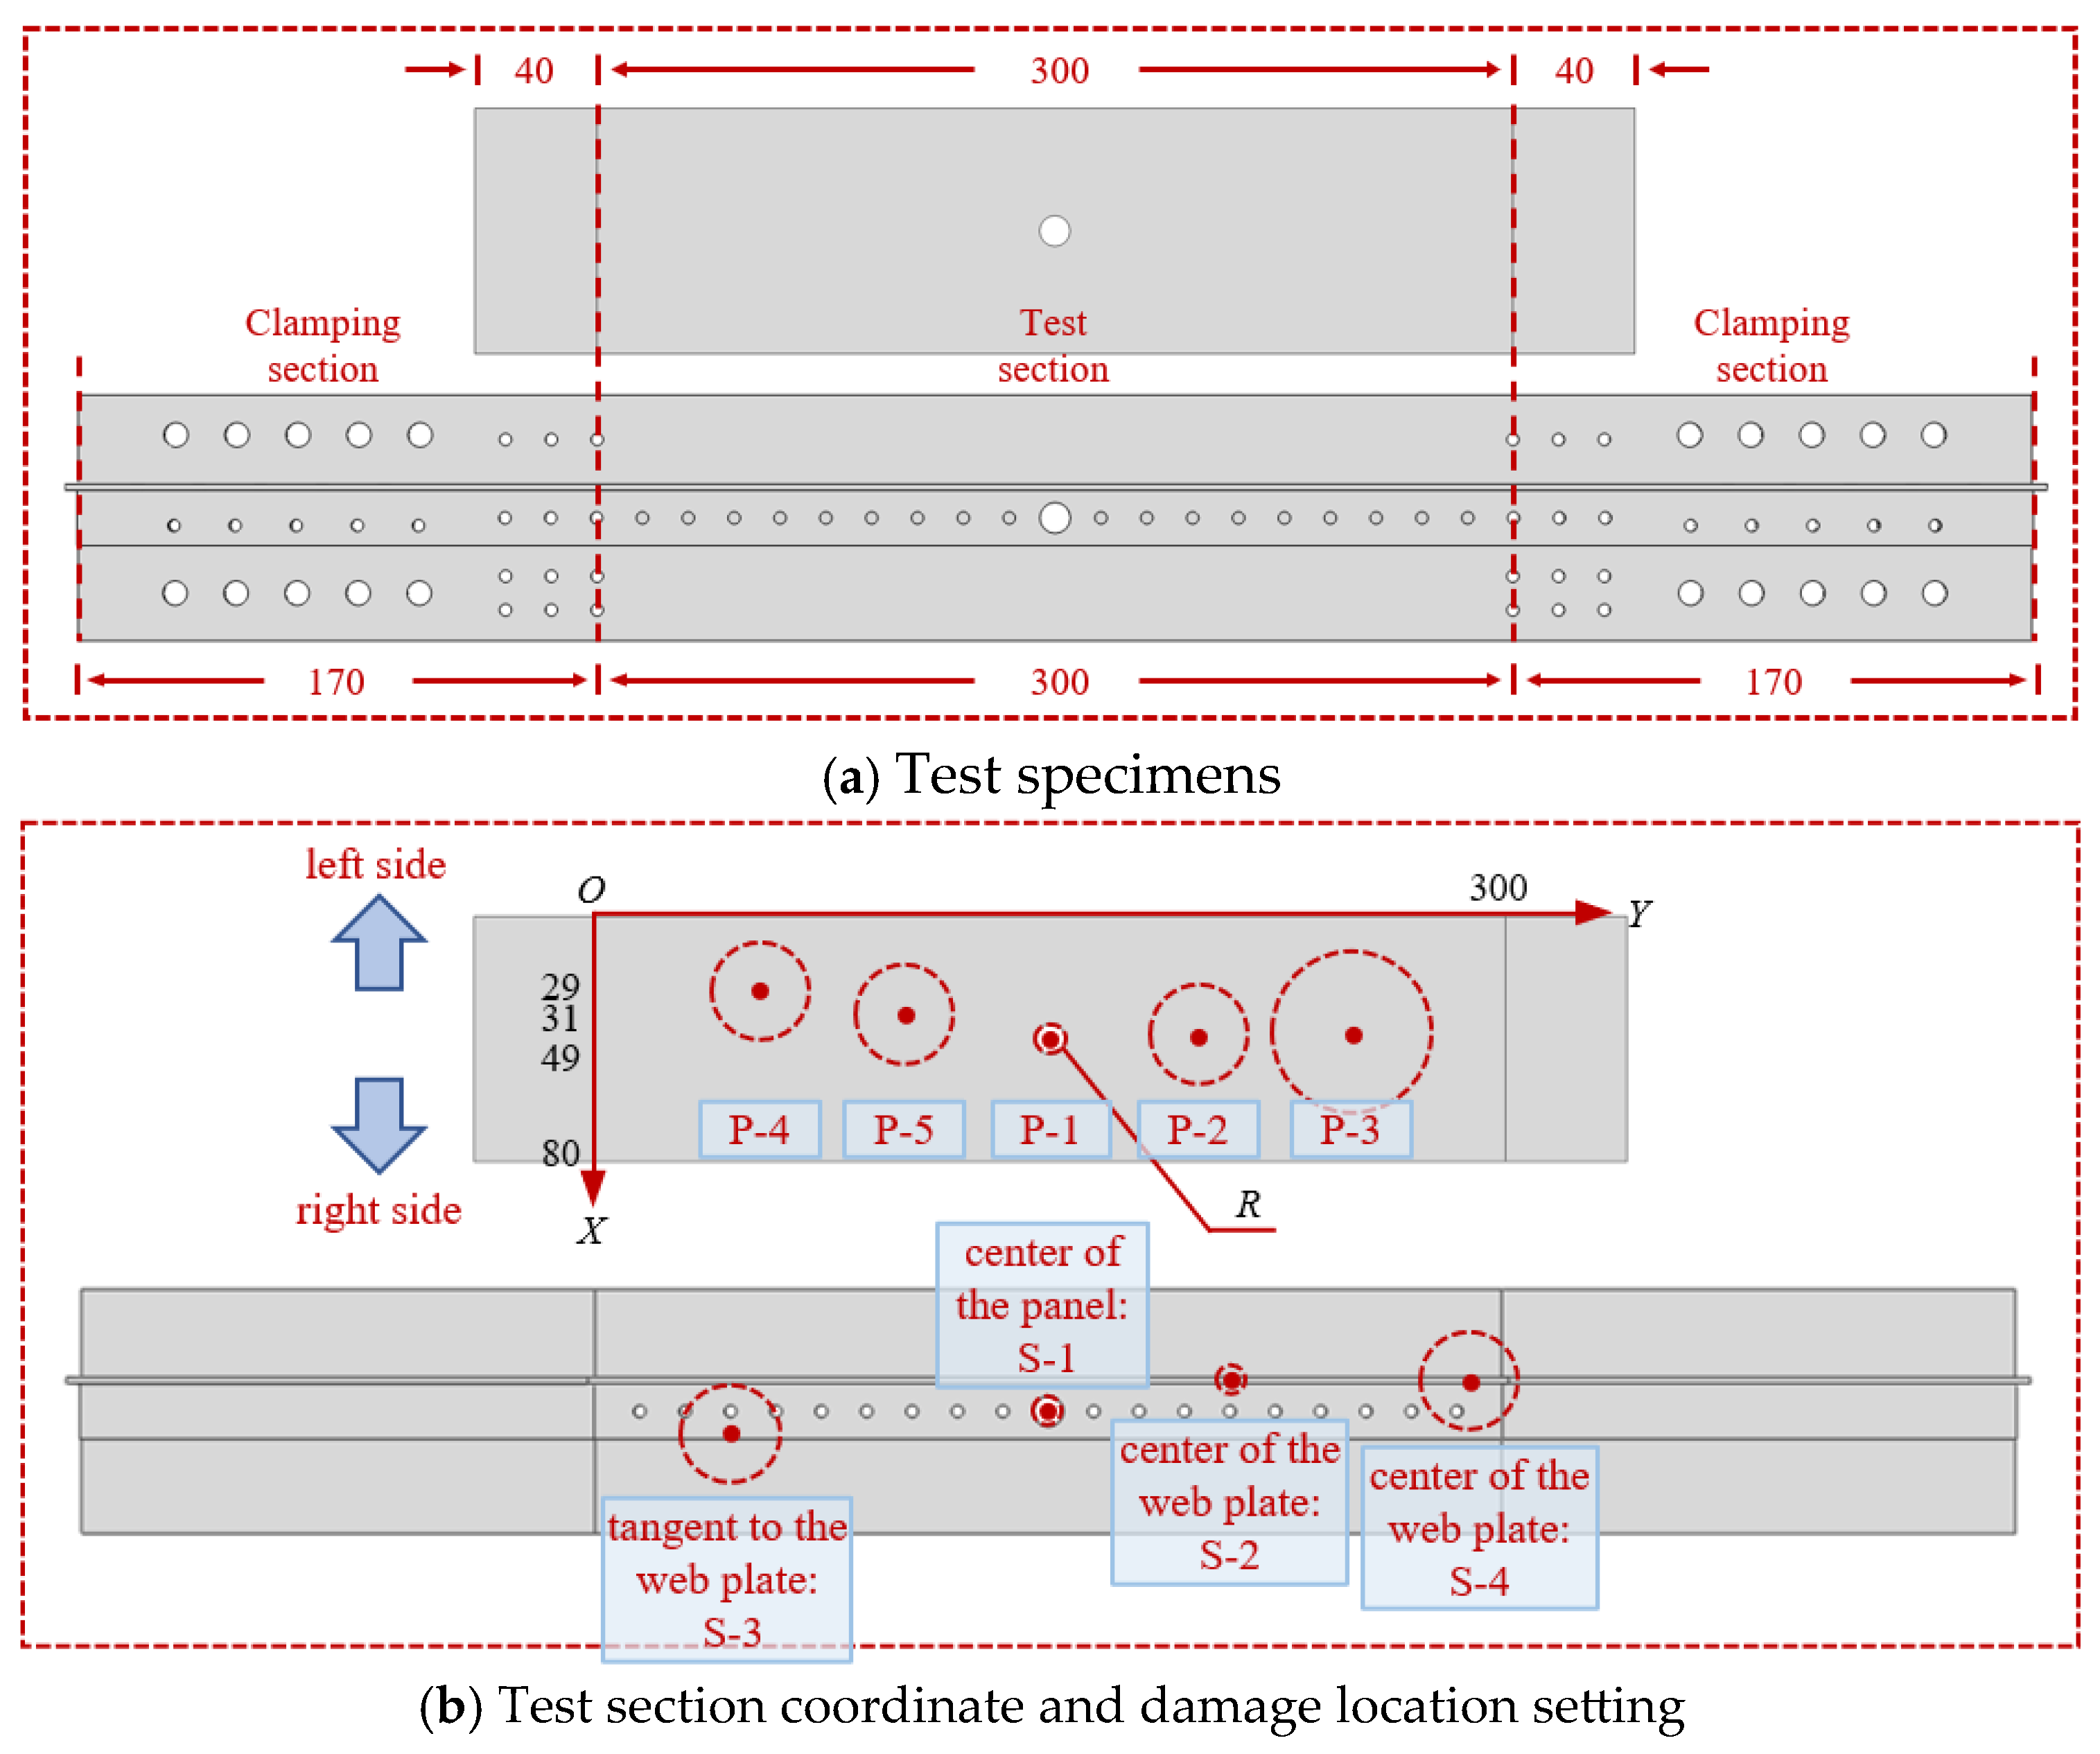
Figure 1. Test specimens and specimen design drawing.
Aerospace 12 00950 g001
Figure 2. Testing site.
Aerospace 12 00950 g002
Figure 3. Strain cloud diagram of plain panels.
Aerospace 12 00950 g003
Figure 4. Load–displacement curves.
Aerospace 12 00950 g004
Figure 5. Strain cloud diagram of stiffened panels.
Aerospace 12 00950 g005
Figure 6. Load–displacement curve of the parameter calibration specimens.
Aerospace 12 00950 g006
Figure 7. Finite element model setup.
Aerospace 12 00950 g007
Figure 8. Mesh validation test.
Aerospace 12 00950 g008
Figure 9. Comparison between DIC and FEM.
Aerospace 12 00950 g009
Figure 10. Load–displacement curves and fracture loads comparison of test specimens.
Aerospace 12 00950 g010
Figure 11. Fracture mechanism.
Aerospace 12 00950 g011
Figure 12. Fracture load envelope diagram of the panel.
Aerospace 12 00950 g012
Figure 13. Residual strength evaluation.
Aerospace 12 00950 g013
Figure 14. Residual strength evaluation of stiffened panels.
Aerospace 12 00950 g014
Table 1. Experimental design of pre-perforated aluminum alloy panels.
Test Specimen NumberingPanel TypesPerforation Radius R/mmPerforation Center Offset X/mmDamage Location
P-R05-X40plain540Figure 1b P-1
P-R15-X40plain1540Figure 1b P-2
P-R25-X40plain2540Figure 1b P-3
P-R15-X20plain1520Figure 1b P-4
P-R15-X30plain1530Figure 1b P-5
S-R05-X40stiffened540Figure 1b S-1
S-R05-X30stiffened530Figure 1b S-2
S-R15-X46stiffened1546Figure 1b S-3
S-R15-X30stiffened1530Figure 1b S-4
Table 2. Aluminum alloy materials parameters.
Aluminum AlloyElastic ModulusPoisson’s RatioFailure StrainTensile Strength
2A12-T469 GPa0.330.2481 MPa
7A04-T672 Gpa0.330.14614 MPa
Table 3. Residual strength (fracture load) evaluation of stiffened panels.
Specimen NumberFracture Load Test Value/kNFracture Load Evaluation Value/kNError/%
S-R05-X4086.5688.271.96
S-R05-X3061.0262.211.96
S-R15-X4666.2268.192.97
S-R15-X3045.1046.523.15
Disclaimer/Publisher’s Note: The statements, opinions and data contained in all publications are solely those of the individual author(s) and contributor(s) and not of MDPI and/or the editor(s). MDPI and/or the editor(s) disclaim responsibility for any injury to people or property resulting from any ideas, methods, instructions or products referred to in the content.