Article

Simulation and Experimental Study of Strain Distribution in Composite Materials Considering Impact Velocity and Impact Location

1
AVIC General Huanan Aircraft Industry Co., Ltd., Zhuhai 519040, China
2
School of Aeronautics, Northwestern Polytechnical University, Xi’an 710072, China
3
School of Civil Aviation, Northwestern Polytechnical University, Xi’an 710072, China
*
Author to whom correspondence should be addressed.
Aerospace 2025, 12(11), 1028; https://doi.org/10.3390/aerospace12111028
Submission received: 16 October 2025 / Revised: 14 November 2025 / Accepted: 16 November 2025 / Published: 20 November 2025

Abstract

Fiber-reinforced composite panels have become the primary load-bearing structures in aircraft due to their exceptional stiffness, specific strength, and mechanical properties. Owing to the high cost of experimental testing, numerical simulation is considered an effective method for rapidly modeling impact behavior and predicting complex internal failure mechanisms within composites. This study utilizes a combined approach of finite element simulation and experimental research to explore the low-velocity blunt-body impact behavior of composite laminates (CLs). The simulated peak impact force and pulse width demonstrated errors within 5.83% and 4.95% of the experimental results, respectively. This study provides effective support for investigations into the low-velocity blunt-body impact performance of CLs.

1. Introduction

Over the past decades, fiber-reinforced composite panels have emerged as the primary load-bearing structures in aircraft due to their exceptional stiffness, specific strength, and mechanical properties [1,2,3,4,5]. Composite structures may encounter various impact events during production, service, and maintenance, such as ice pellets from sudden weather changes, stones shattered on runways, or maintenance tools that have been dropped [6]. These impacts can cause irreversible damage patterns within the composites, including matrix cracks and interlaminar delamination, significantly reducing the structural strength and performance [7,8,9,10,11,12,13]. Due to the high cost of experimental testing, numerical simulation has become an effective method to rapidly model impact behavior and predict complex internal failure mechanisms within composites. Consequently, numerous researchers worldwide have employed finite element numerical simulations to investigate the impact response of composite laminates (CLs) under low-velocity impact loads [14,15,16,17].
The development of suitable constitutive models is critical for simulating the impact behavior of CLs effectively. Among the various numerical simulation techniques, the Progressive Damage Model (PDM), which simulates damage initiation and stiffness degradation processes, has increasingly been acknowledged as the most appropriate method [18]. For instance, Li et al. [19] assessed the suitability of various failure criteria and damage evolution methods in the finite element analysis of CLs under low-velocity impacts. Similarly, Zhou et al. [20] introduced a damage evolution model that incorporates stress in the thickness direction, based on the 3D Hashin failure criterion, to analyze the impact of model parameters on the predictive outcomes. Typically, researchers focus on failure criteria that assess fiber and matrix behaviors under tensile and compressive stresses. Once damage has occurred, the affected regions of the composite exhibit reduced local stiffness due to micro-crack propagation, progressively compromising their load-bearing capacity. At this stage, an advanced damage evolution model is essential to simulate the ongoing damage accumulation within the affected areas. Some scholars have integrated predefined constants into the stiffness matrix to dictate the stiffness degradation process [21,22]. However, this method, while effective for specific scenarios, lacks general applicability.
This study [23,24] presents the development of a three-dimensional finite element model within ABAQUS/Explicit for simulating and analyzing low-velocity impact damage in carbon fiber-reinforced CLs. The model integrates a damage criterion derived from the 3D Hashin failure criterion with a linear degradation scheme, employing the equivalent displacement method as the damage evolution model. To predict delamination damage, zero-thickness cohesive elements were strategically placed between the layers. Low-velocity drop-weight impact tests were executed on the laminate, adhering to predefined experimental constraints and applying an initial velocity to the impactor. These experiments validated the numerical model and provided an extensive analysis of the impact response of CLs under low-velocity impact loading. This study employed the same laminate to predict impact responses at nine distinct impact locations, summarizing the strain distribution patterns and damage evolution characteristics under varying impact positions and energies. It provides a solution pathway for strain reconstruction and damage prediction in composite laminates.

2. Methods

2.1. Finite Element Model

The ABAQUS/Explicit simulation software (2025) was utilized to construct the finite element model of the impact test. As illustrated in Figure 1, the model represents a carbon fiber epoxy resin matrix CL. The dimensions of the laminate are 150 mm in length, 150 mm in width, and an overall thickness of 2.0 mm, with each layer measuring 0.18 mm in thickness. The layup sequence is configured as [45/−45/0/0/90/90/0/0/−45/45], and the laminate was modeled using solid elements, with the layers distinctly delineated throughout the thickness. The impactor consists of a lower spherical section with a radius of 8 mm and an upper cylindrical section with a length of 16 mm, with an initial velocity directed along the negative z-axis. The support structure, measuring 150 mm in length, 150 mm in width, and 20 mm in thickness, features a central hollow region of 120 mm × 120 mm and is treated as a rigid body with fixed constraints. A general contact algorithm with a friction coefficient of 0.2 is used to simulate the interaction between the punch and the laminate.
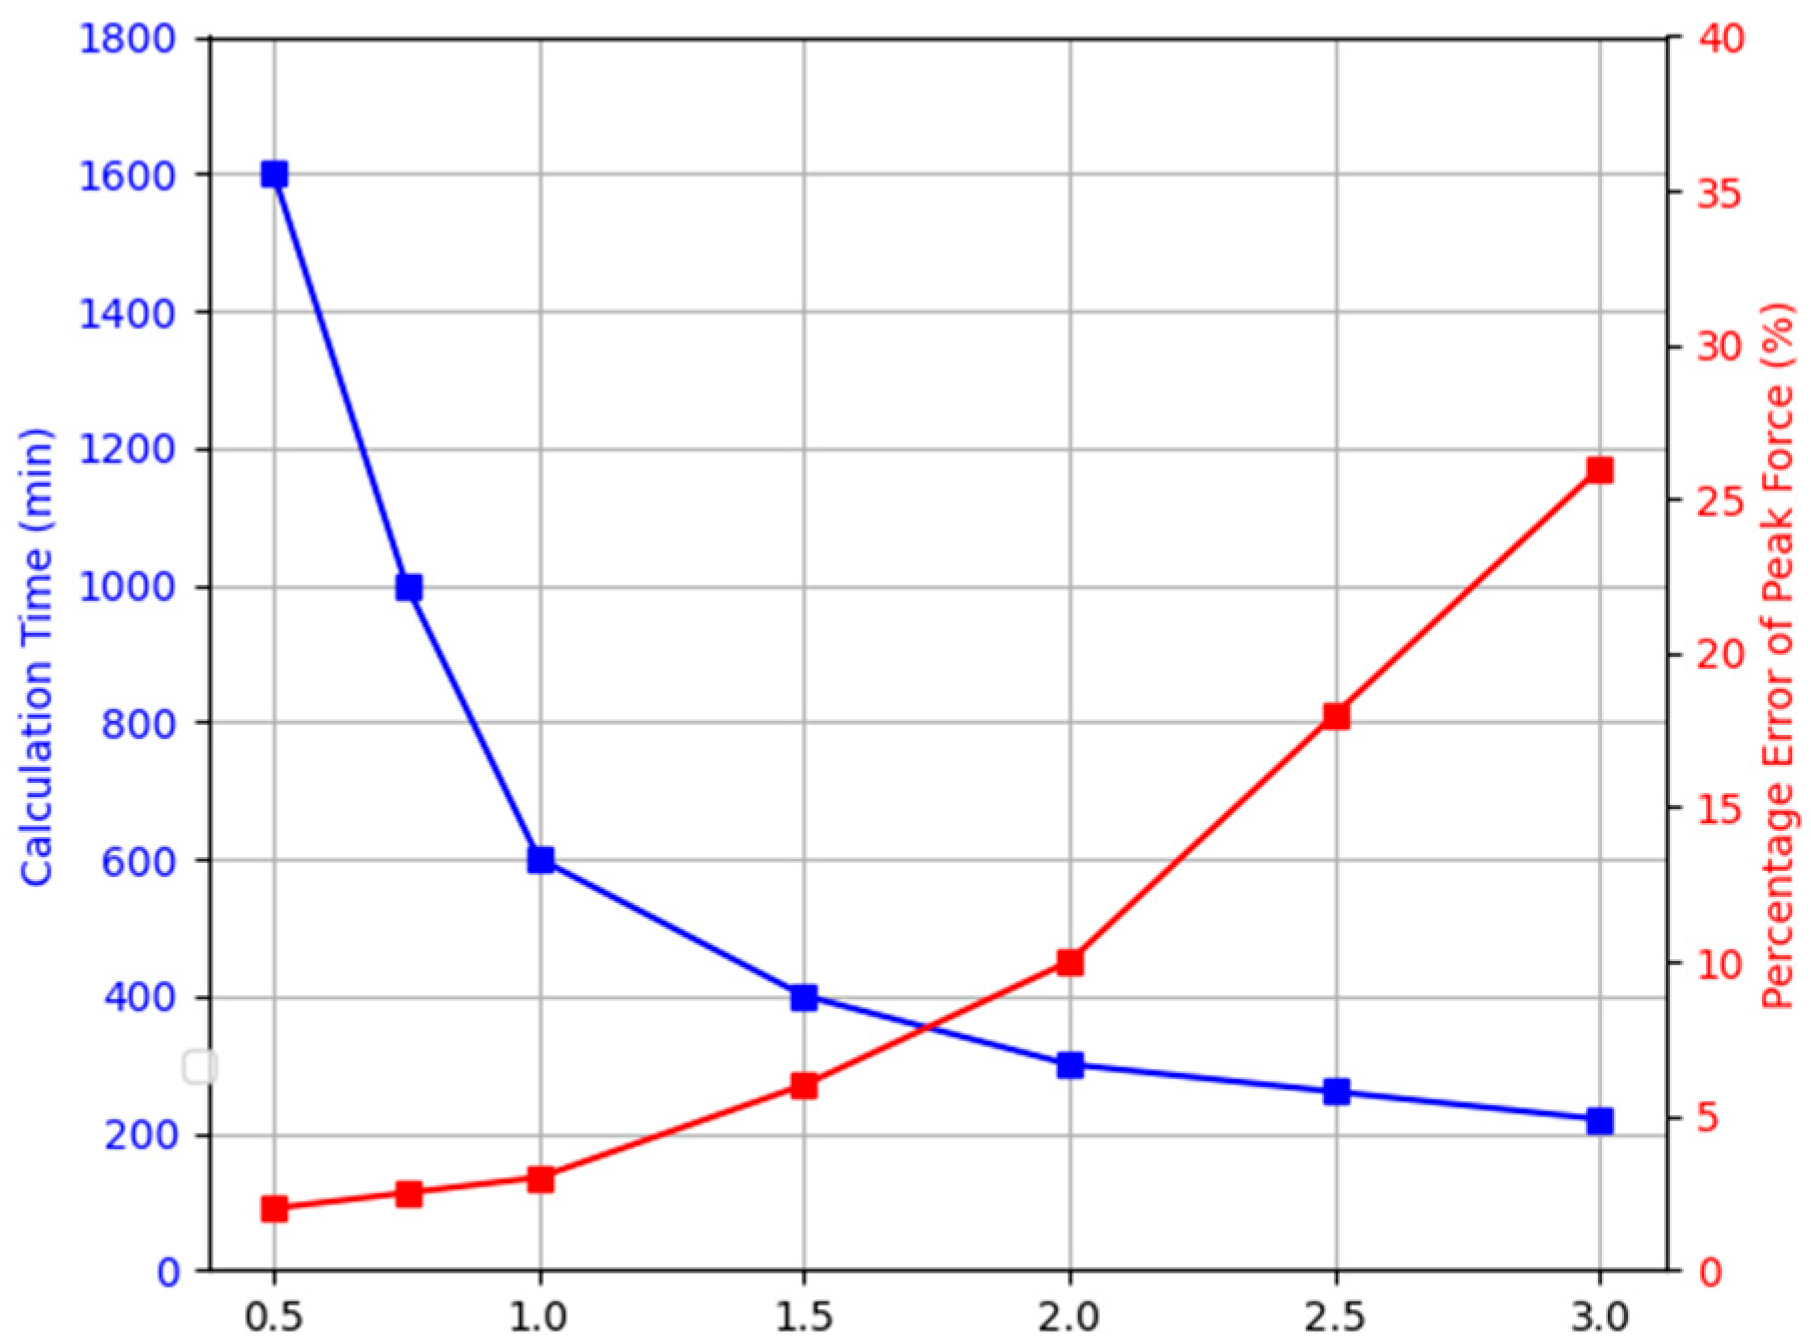
A mesh-convergence analysis was performed. The mesh sizes for the composite plate are set to 0.5 mm, 0.75 mm, 1 mm, 1.5 mm, 2 mm, 2.5 mm, and 3 mm, respectively. The impact force data obtained from simulation calculations were then compared with experimental data to determine the error. Simulation calculations were performed using a computer equipped with an Intel Xeon Gold 6144 @ 3.50 GHz processor. The results are shown in Figure 2. The computational error decreases as the mesh size is refined. To maintain the error below 5%, the mesh size must be less than 1 mm. Notably, computational time increases significantly as the mesh size decreases.
To achieve an optimal balance between computational efficiency and the precision of predictions, a mesh size of 1 mm by 1 mm was employed for the CL and punch. Both the support structure and the punch are modeled using solid elements to ensure an accurate representation of their interaction with the CL. The model encompasses 103,820 C3D8R solid elements. Additionally, eight-node cohesive elements (COH3D8) with zero thickness were inserted between each layer to simulate delamination damage. Encastre restraints were applied to the support structure. The simulation spanned a physical duration of 10.0 ms (0.01 s), with a stable time increment of 2.2 × 10⁻⁴ ms.

2.2. Material Models

The mechanical properties of the unidirectional CL and the inter-laminar interface properties are delineated in Table 1 and Table 2 [23], respectively. Similarly, the mechanical properties of the support structure and the punch are outlined in Table 3 [23].
In this investigation, the 3D Hashin criterion [25] was adopted as the initial damage criterion for fiber and matrix damage. The criterion is defined as follows:
Fiber tensile failure (σ11 ≥ 0)
F f t = σ 11 X t 2 + α σ 12 S 12 2 + α σ 13 S 13 2 1
Fiber compression failure (σ11 < 0)
F f c = σ 11 X c 2 1
Matrix tensile failure (σ22 ≥ 0)
F m t = σ 22 + σ 33 Y t 2 + τ 23 2 σ 22 σ 33 S t 2 + τ 12 2 + τ 13 2 S 1 2 = 1
Matrix compression failure (σ22 < 0)
F m c = Y c 2 S t 2 1 σ 22 + σ 33 Y c + σ 22 + σ 33 2 S t 2 + τ 23 2 σ 22 σ 33 S t 2 + τ 12 2 + τ 13 2 S 1 2 = 1
where σii, τij (i, j = 1, 2, 3) denote the components of the equivalent stress tensor of the composite material in all directions. Xt and Xc signify the longitudinal tensile and compressive strengths, respectively. Yt and Yc denote the transverse tensile and compressive strengths, respectively. St and Sl represent the transverse shear strength and longitudinal shear strength, respectively. Stiffness degradation is achieved by introducing damage factors for fiber tension, fiber compression, matrix tension, and matrix compression into the flexibility matrix.
Furthermore, Camanho’s quadratic stress criterion [26] was utilized to initiate interlayer damage, as illustrated:
t n 0 t n 2 + t s 0 t s 2 + t t 0 t t 2 = 1
where tn, ts, and tt represent the interface strengths in the three principal directions, respectively; tn0, ts0, and tt0 denote the corresponding stress components.

2.3. Simulation Conditions

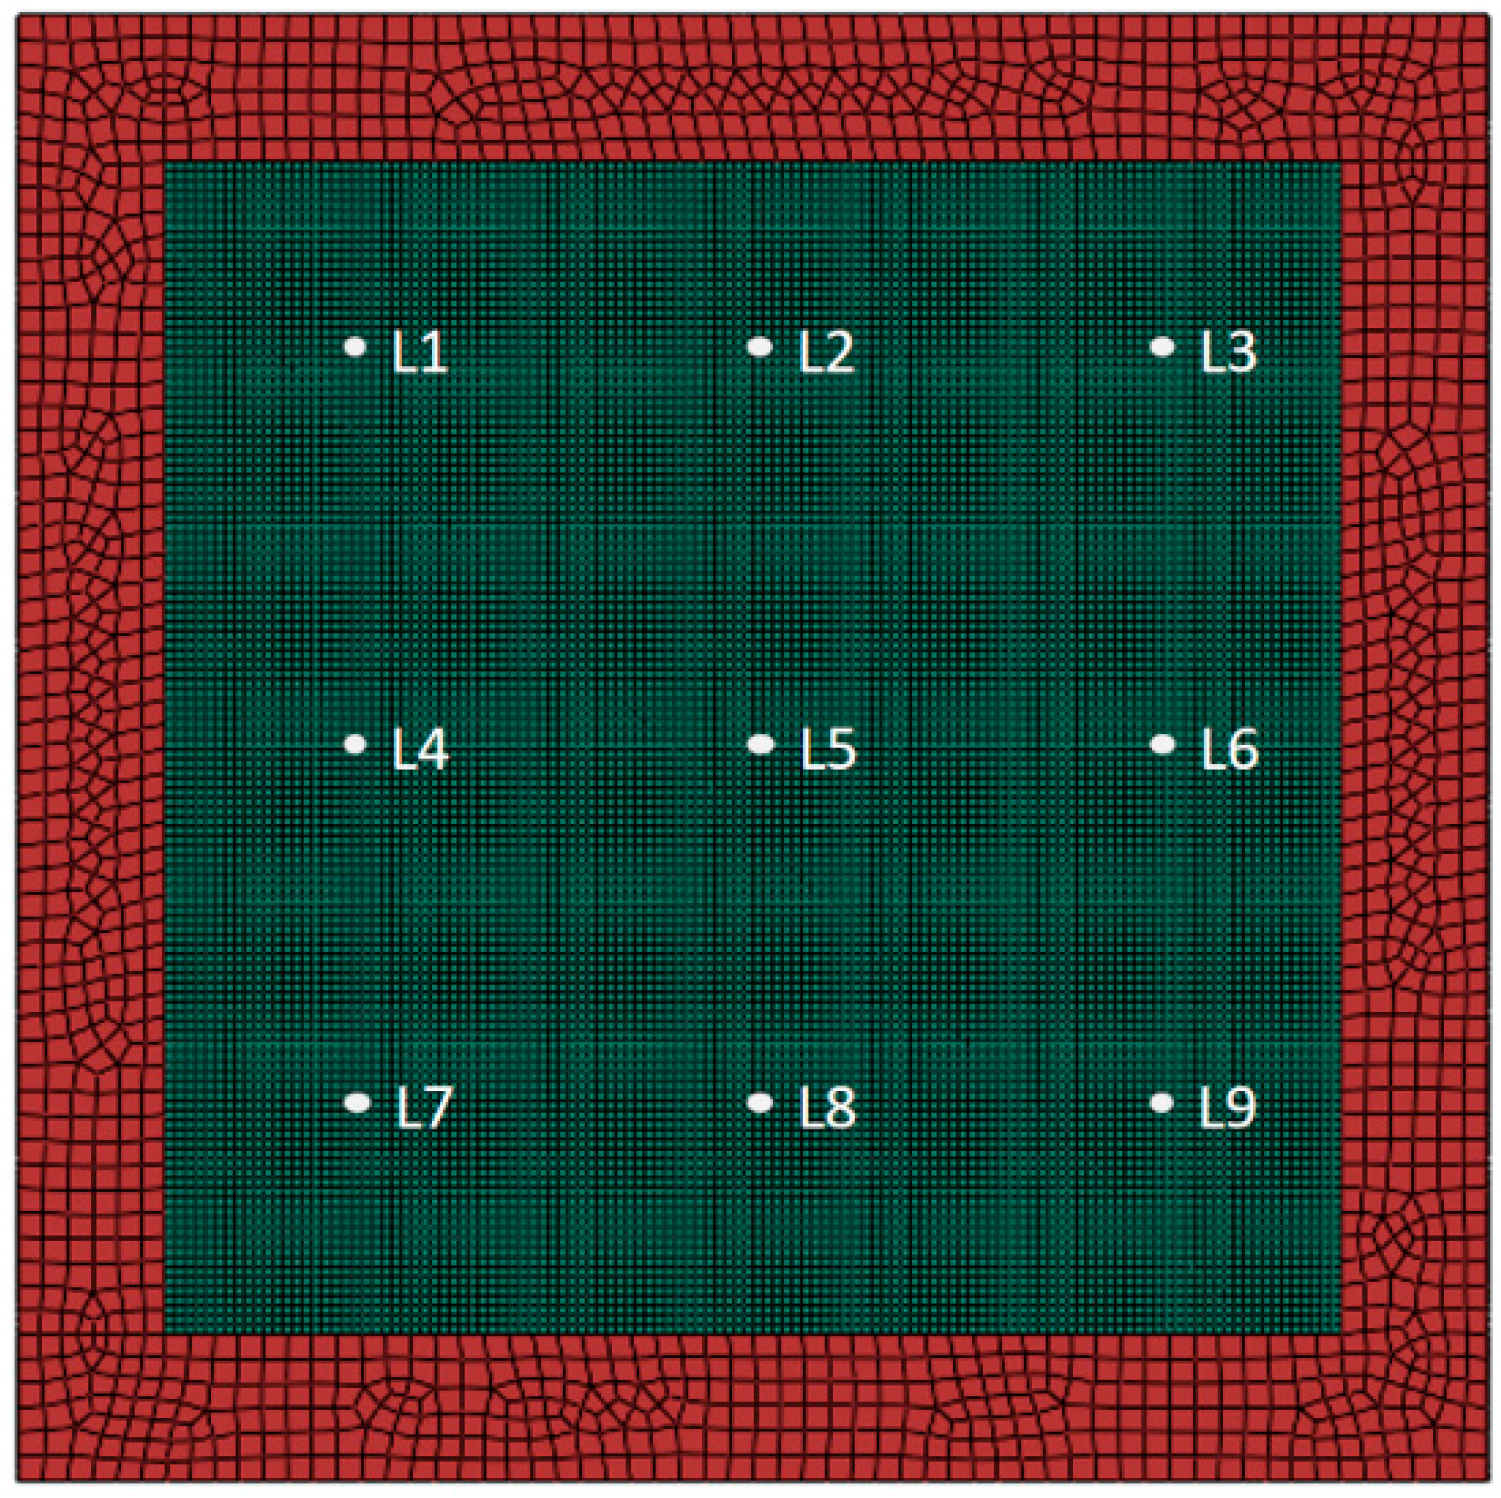
To simulate the impact responses under varying locations and energies, a matrix comprising nine sets with a total of 54 simulated conditions was established, as shown in Table 4. Impact locations L1 to L9 correspond to the centroids of nine squares on the CL, as depicted in the accompanying Figure 3. The impact velocities vary from 0.76 m/s to 1.764 m/s, with a punch mass of 4.5 kg, yielding impact energies (IEs) ranging from 1.3 J to 7.0 J.

3. Experiments

3.1. Specimens

In this study, CLs were fabricated using two high-performance carbon fiber-woven fabrics, HKF300B and HKF150U, provided by Jiangsu Hengshen Co., Ltd. (Danyang, China). HKF300B is characterized by its higher modulus and strength, whereas HKF150U is tailored for specific process performance or cost efficiency. These fabrics were combined with an EL306 epoxy resin matrix. Fiber volume fraction is 55% and resin volume fraction is 45%.
The layup sequence of the laminate was designed as [45/−45/0/0/90/90/0/0/−45/45], representing a typical CL layout. This design aims to impart near-isotropic in-plane mechanical properties such as stiffness and strength while preserving significant anisotropy in the thickness direction. The 0° plies primarily bear axial loads, the ±45° plies predominantly bear shear loads, and the 90° plies provide transverse stiffness and stability.
The CLs were fabricated using Vacuum-Assisted Resin Infusion (VARI). The VARI process utilizes vacuum pressure to draw resin into the sealed mold cavity containing dry fiber preforms. After curing, the laminates were cut into impact test specimens with specified dimensions according to standard requirements. The standard specimen dimensions comply with the Chinese aviation industry standard HB6739 [27], typically consisting of rectangular plates measuring 300 mm in length, 175 mm in width, and 2 mm in thickness.

3.2. Test System

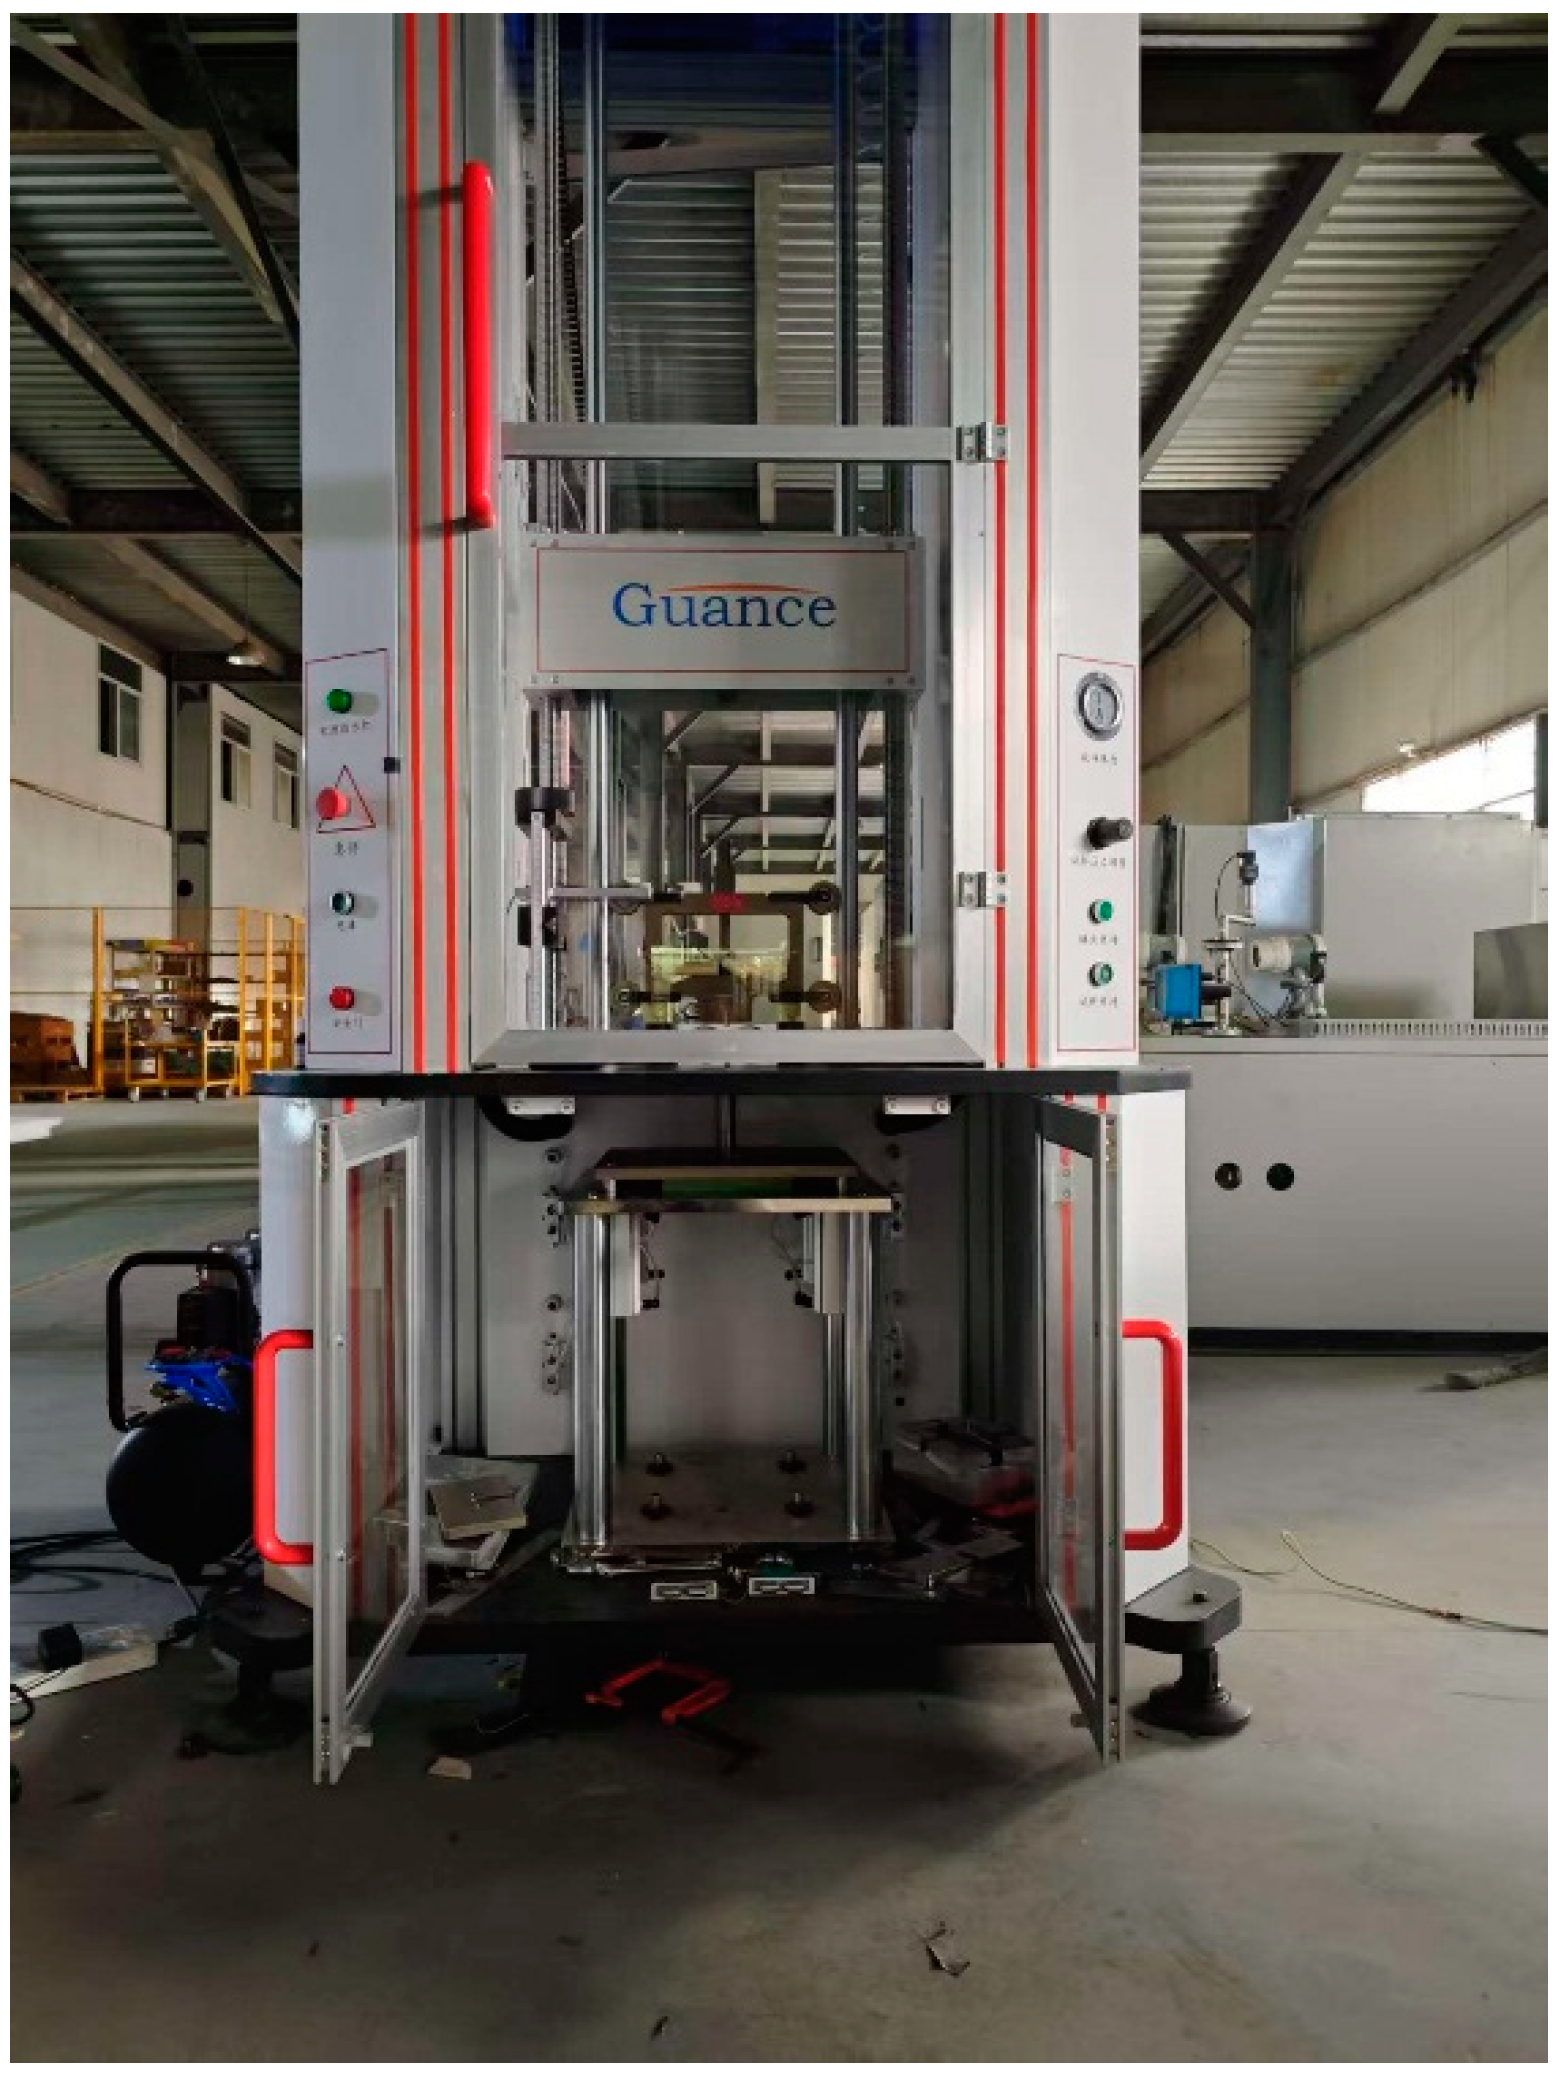
This test employs the CLC-AI type drop hammer impact testing machine produced by Beijing Guance Precision Instrument Equipment Co., Ltd. (Beijing, China). The device comprises three components: an impact loading unit, a high-velocity data acquisition system, and a data analysis system, as shown in Figure 4.
The essential element of the impact loading unit is an impact hammer that descends freely along precision guide rails. The mass of the hammer can be precisely modified by the addition or removal of standard weights, thereby allowing the adjustment of IE levels. The punch had a hemispherical head with a diameter of 16 mm. The high-velocity data acquisition system records the force-time curve that results from the contact between the impact head and the specimen. Concurrently, the data analysis system processes the raw signals in real time. The initial kinetic energy of the impact is calculated using the peak impact velocity, whereas the energy absorbed by the material is determined by analyzing the maximum rebound velocity.
For specimen fixation, a pair of 6061-T6 aluminum alloy clamping plates secure the specimen’s edges from both above and below. During the test, the fixture containing the pre-clamped specimen is carefully positioned at the designated impact site within the impact chamber. A pneumatic servo system operates the suspension mechanism, facilitating rapid and secure locking of the specimen, thereby ensuring that the boundary conditions remain stable at the moment of impact.

3.3. Impact Tests

The impact tests were conducted at a velocity of 0.76 m/s, using a punch with a mass of 4.5 kg, which produced IEs of approximately 1.3 J. The point of impact was consistently aligned with the center points of squares, as specified in Section 2.3. A series of experiments were conducted to investigate the relationship between the impact location and the resultant displacement and strain in the CL. The experimental design is outlined in Table 5.

4. Results and Discussion

4.1. Simulation Results Verification

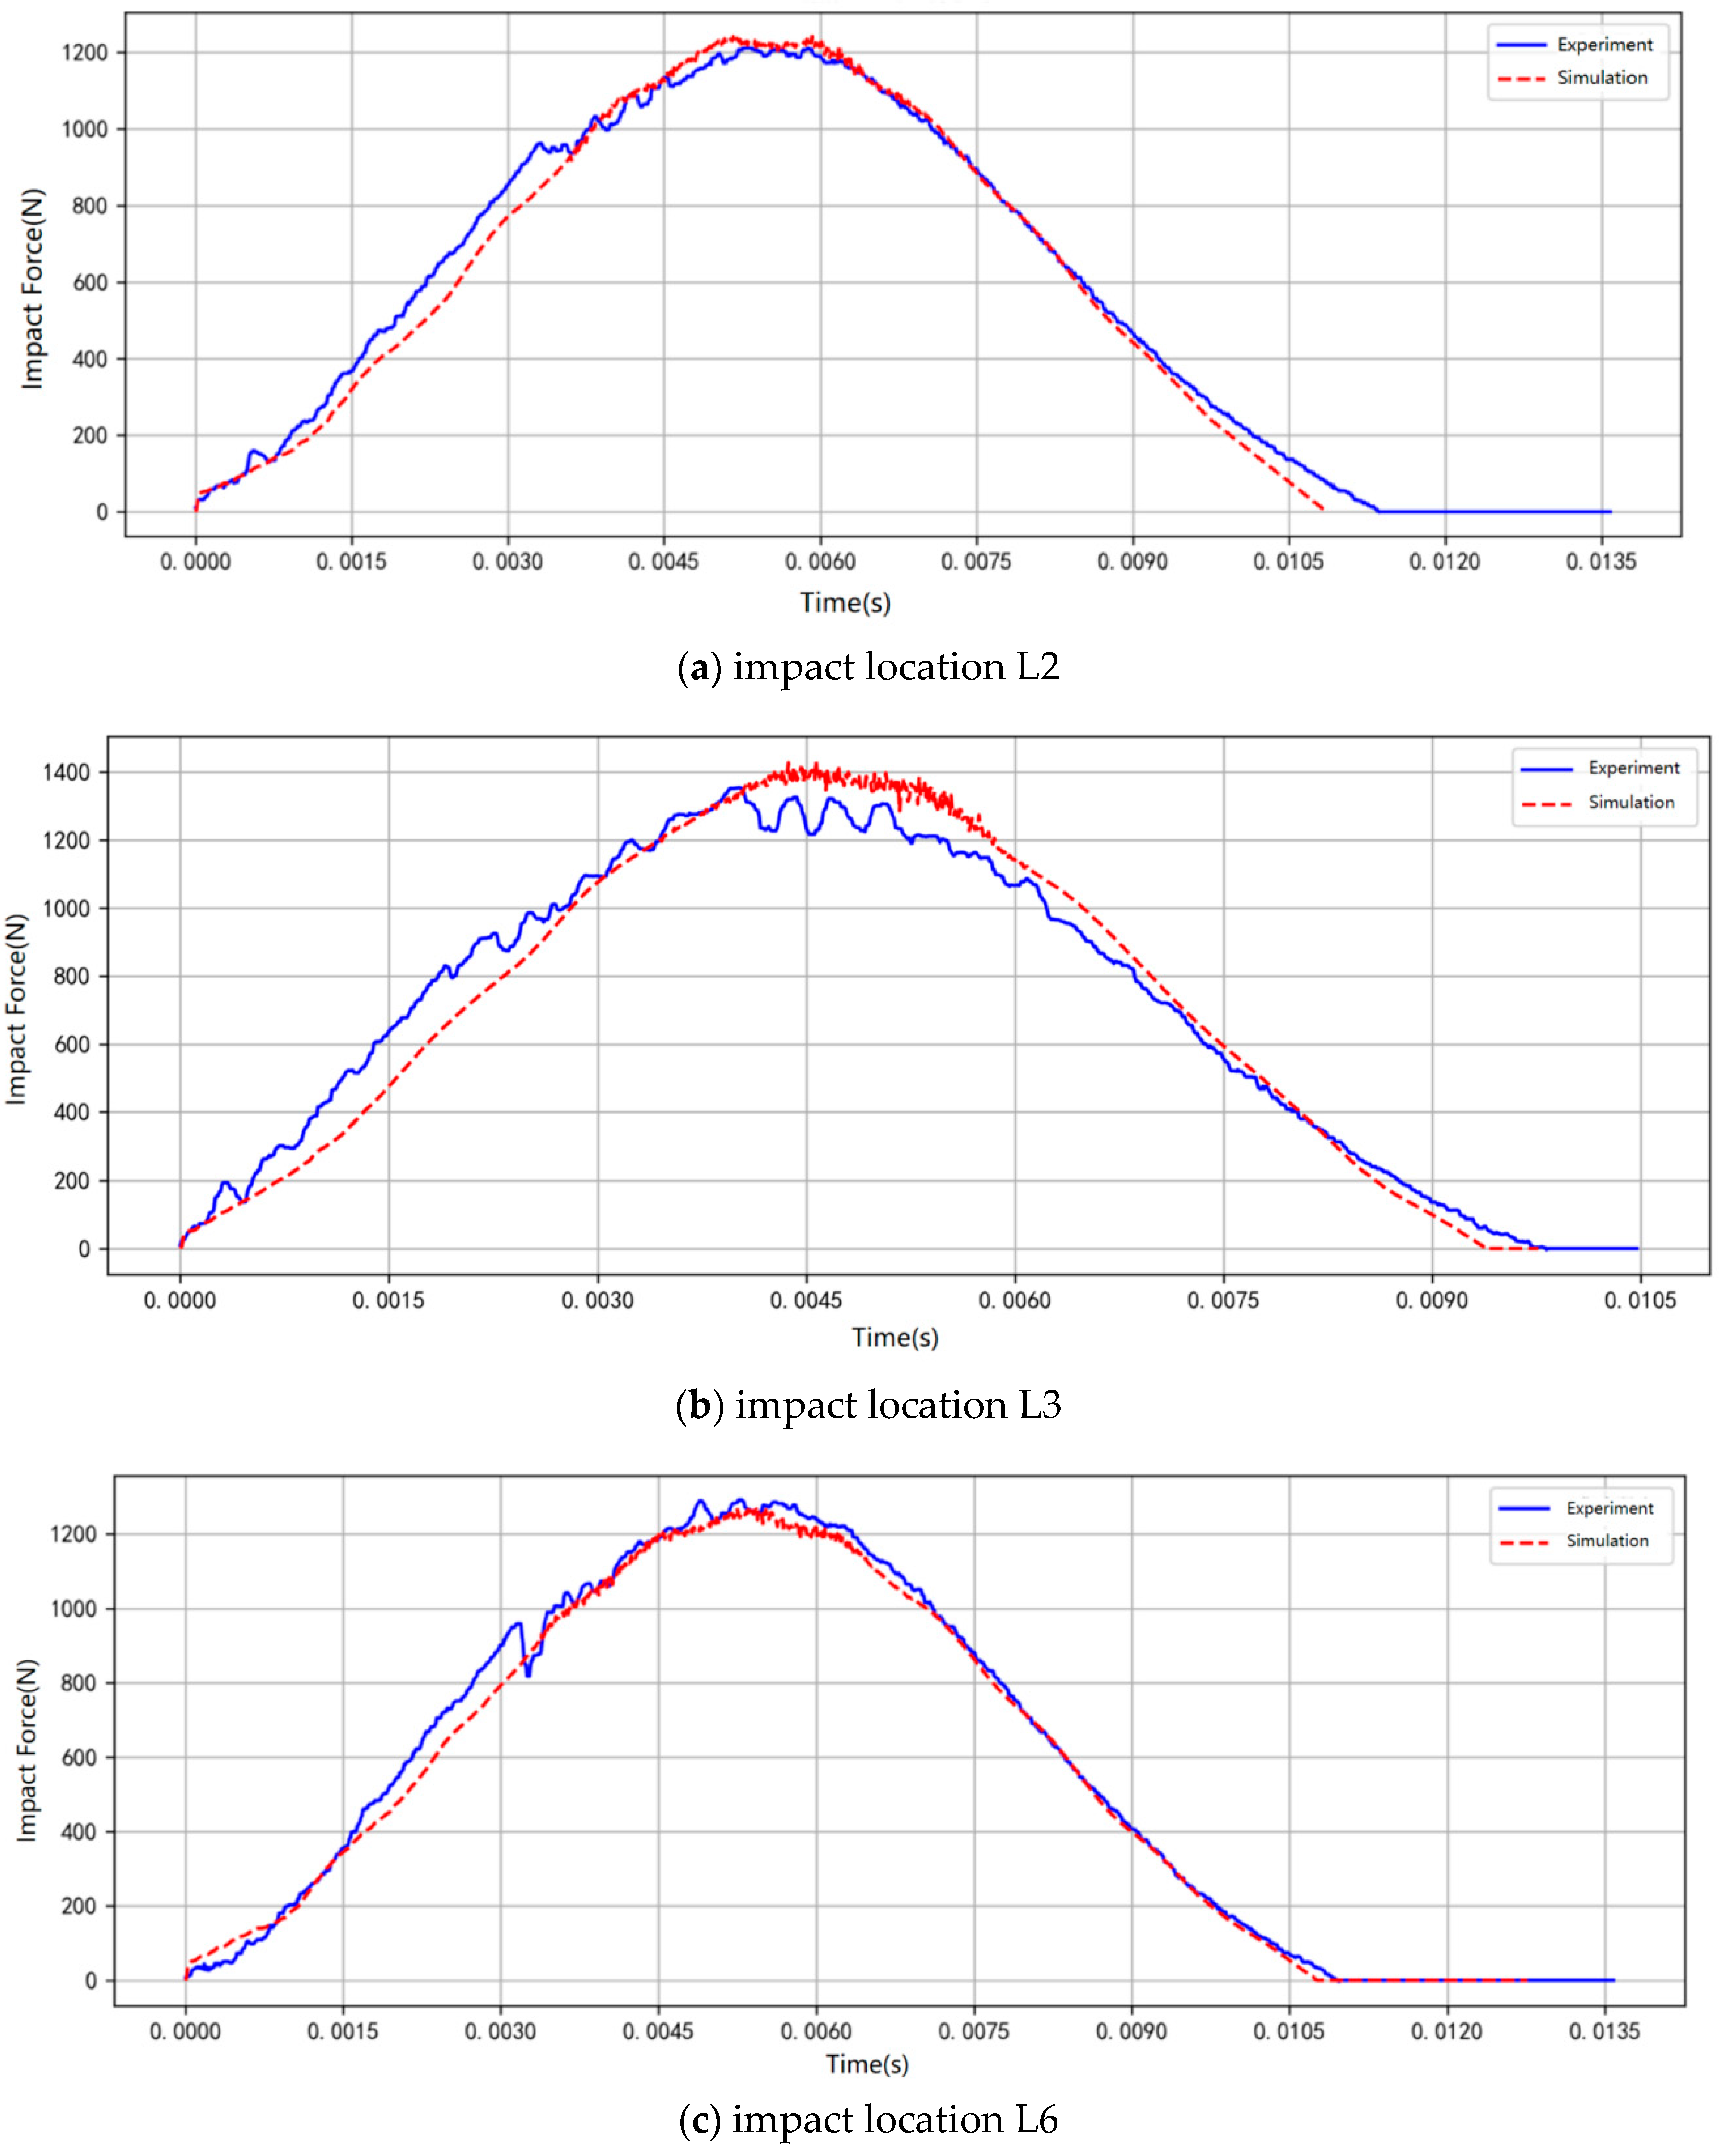
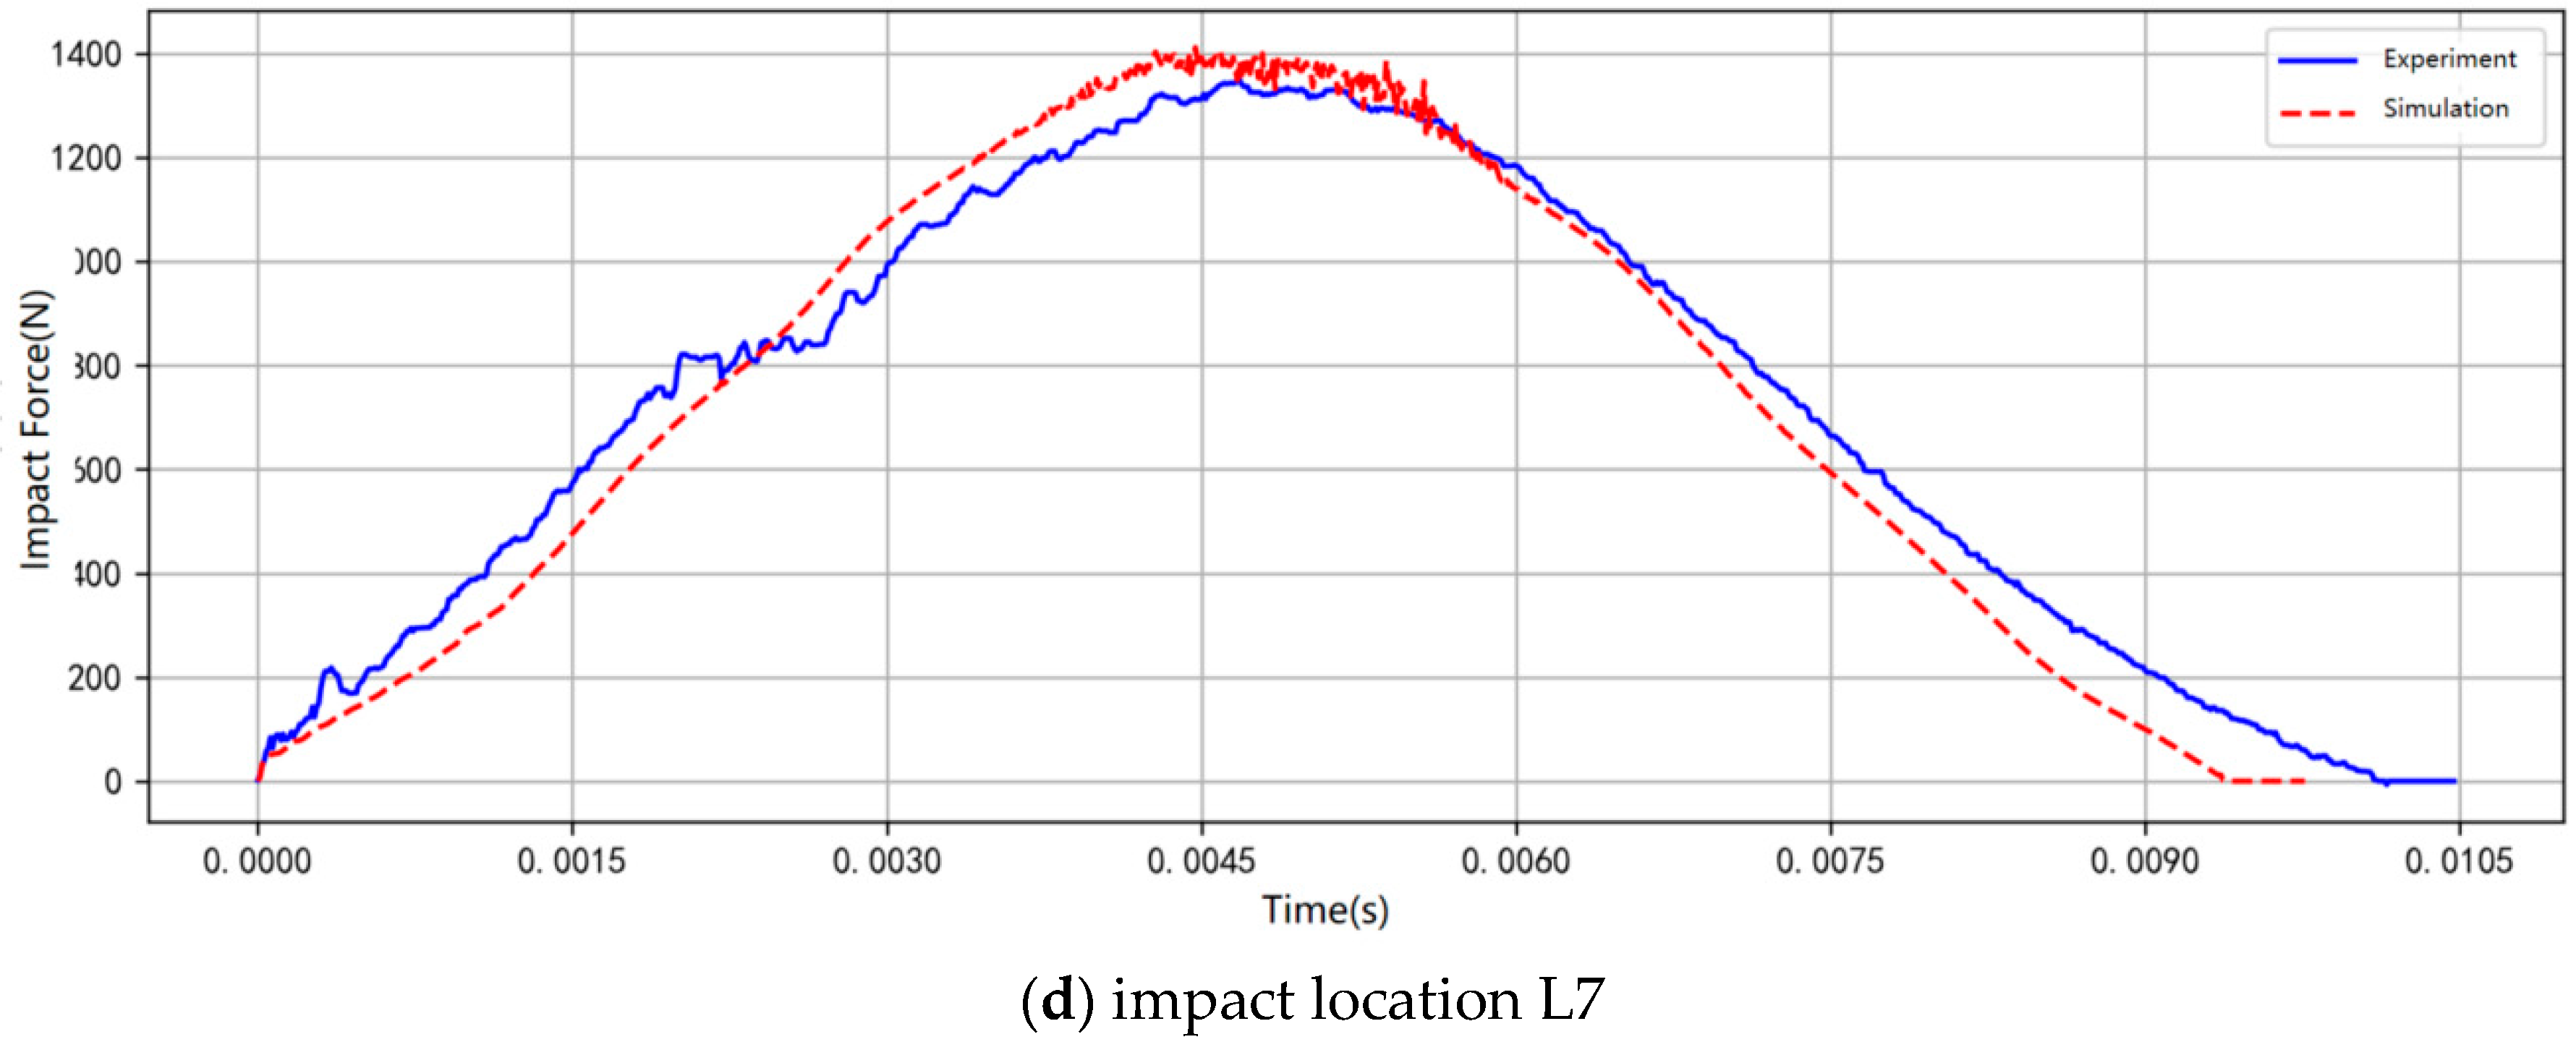
This section evaluates the computational precision of the simulation model by juxtaposing the impact forces recorded in both experimental and simulated scenarios. Test and simulation impact force-time curves are compared in Figure 5. The curves marked in blue represent the experimental results, whereas those in red depict the simulation outcomes. The peak impact force measured in the experimental data ranges from 1211 N to 1353 N, with pulse durations extending from 10.1 to 11.1 ms. Conversely, the simulated peak impact forces span from 1241 N to 1432 N, with pulse durations between 9.6 and 11.0 ms. Notably, the discrepancies in the peak impact force and pulse duration between the simulated and experimental results are confined within 5.83% and 4.95%, respectively. These comparative data are detailed in Table 6. During the initial phase of the impact, the force-time curve shows a consistent upward trajectory, indicating a gradual increase in contact force. Following the peak, the force begins to decline due to the rebound of the punch, characterized by high-frequency oscillations, and eventually tapers off to zero, signaling the complete disengagement of the punch from the CL surface.

4.2. Impact Response History Analysis

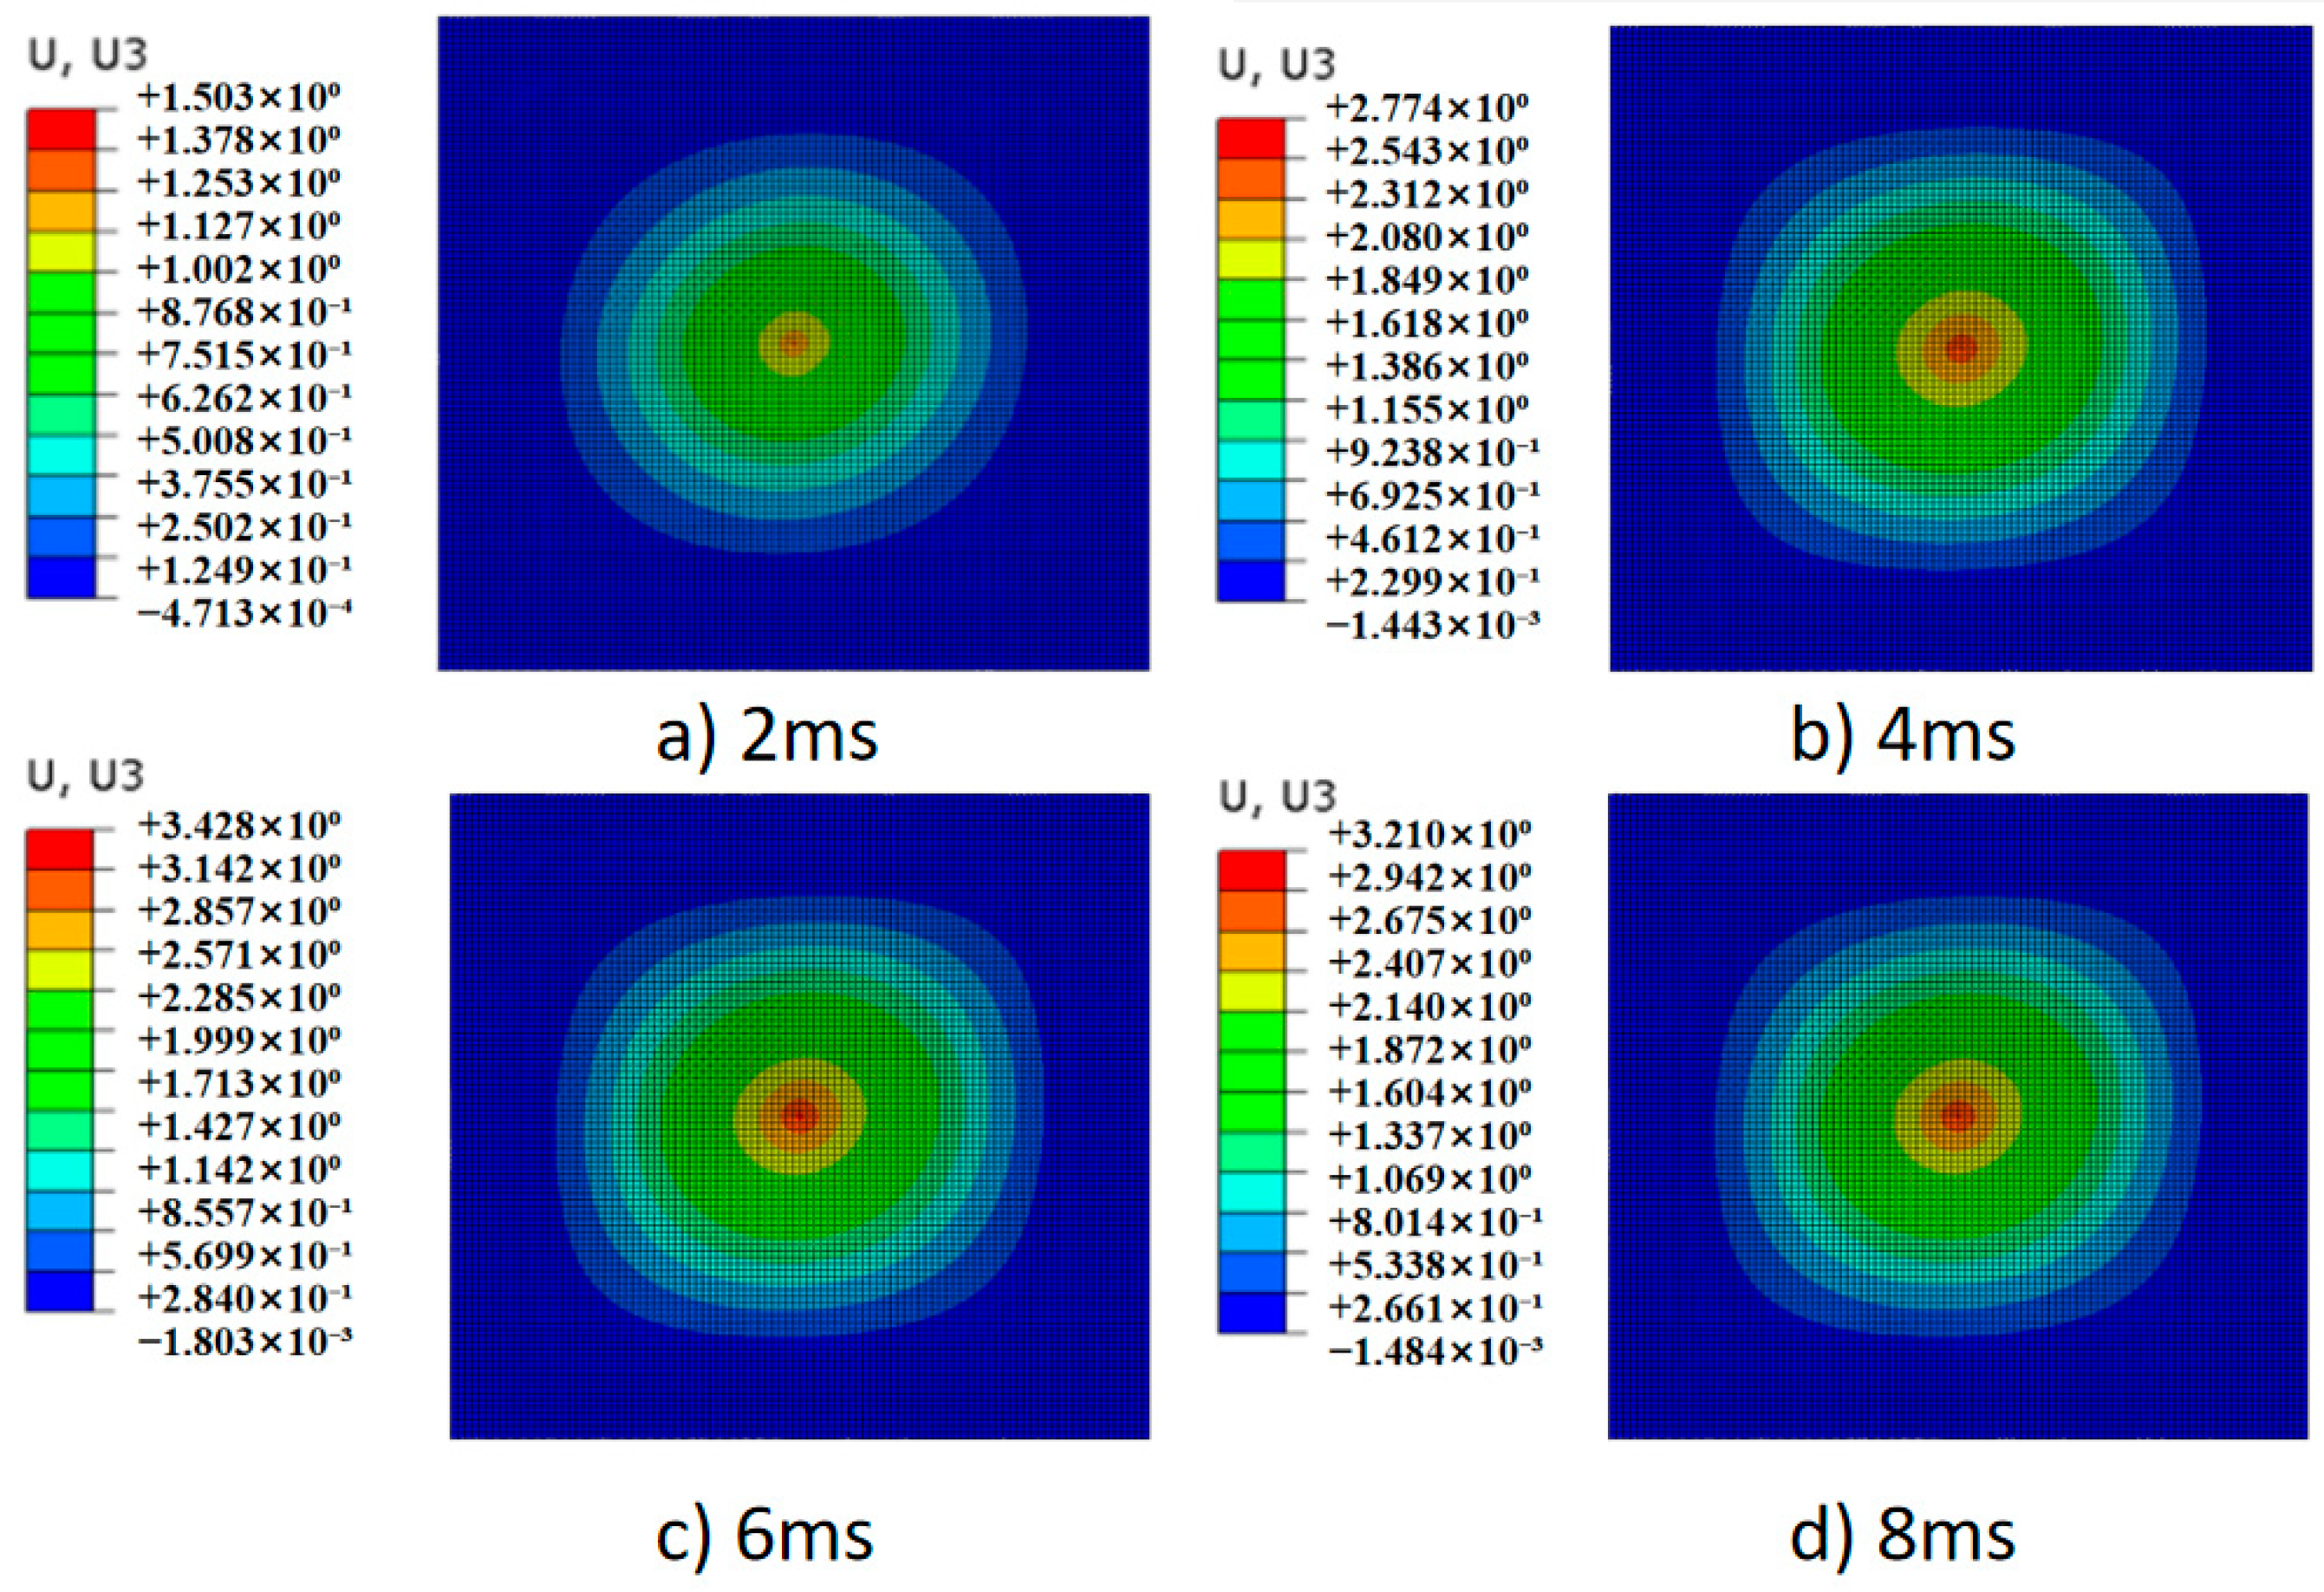
Figure 6 displays the displacement contour of the CL at impact location L5, subjected to an impact velocity of 0.760 m/s (IE of 1.3 J). The impact velocity was directed along the +Z axis. The displacement pattern of the CL was characterized by an initial increase followed by a subsequent decrease over time. In the initial 0 to 6 ms interval, the kinetic energy of the punch was transferred into both kinetic and potential energy within the CL. Starting from a stationary position, the laminate moved together with the punch, with its displacement progressively increasing to reach a peak of 3.42 mm at 6 ms. Following this peak, the elastic potential energy stored in the laminate began to dissipate, converting back into kinetic energy, which affects both the laminate and the punch. This energy conversion resulted in the laminate and punch moving in opposite directions, leading to a gradual reduction in the laminate’s displacement.
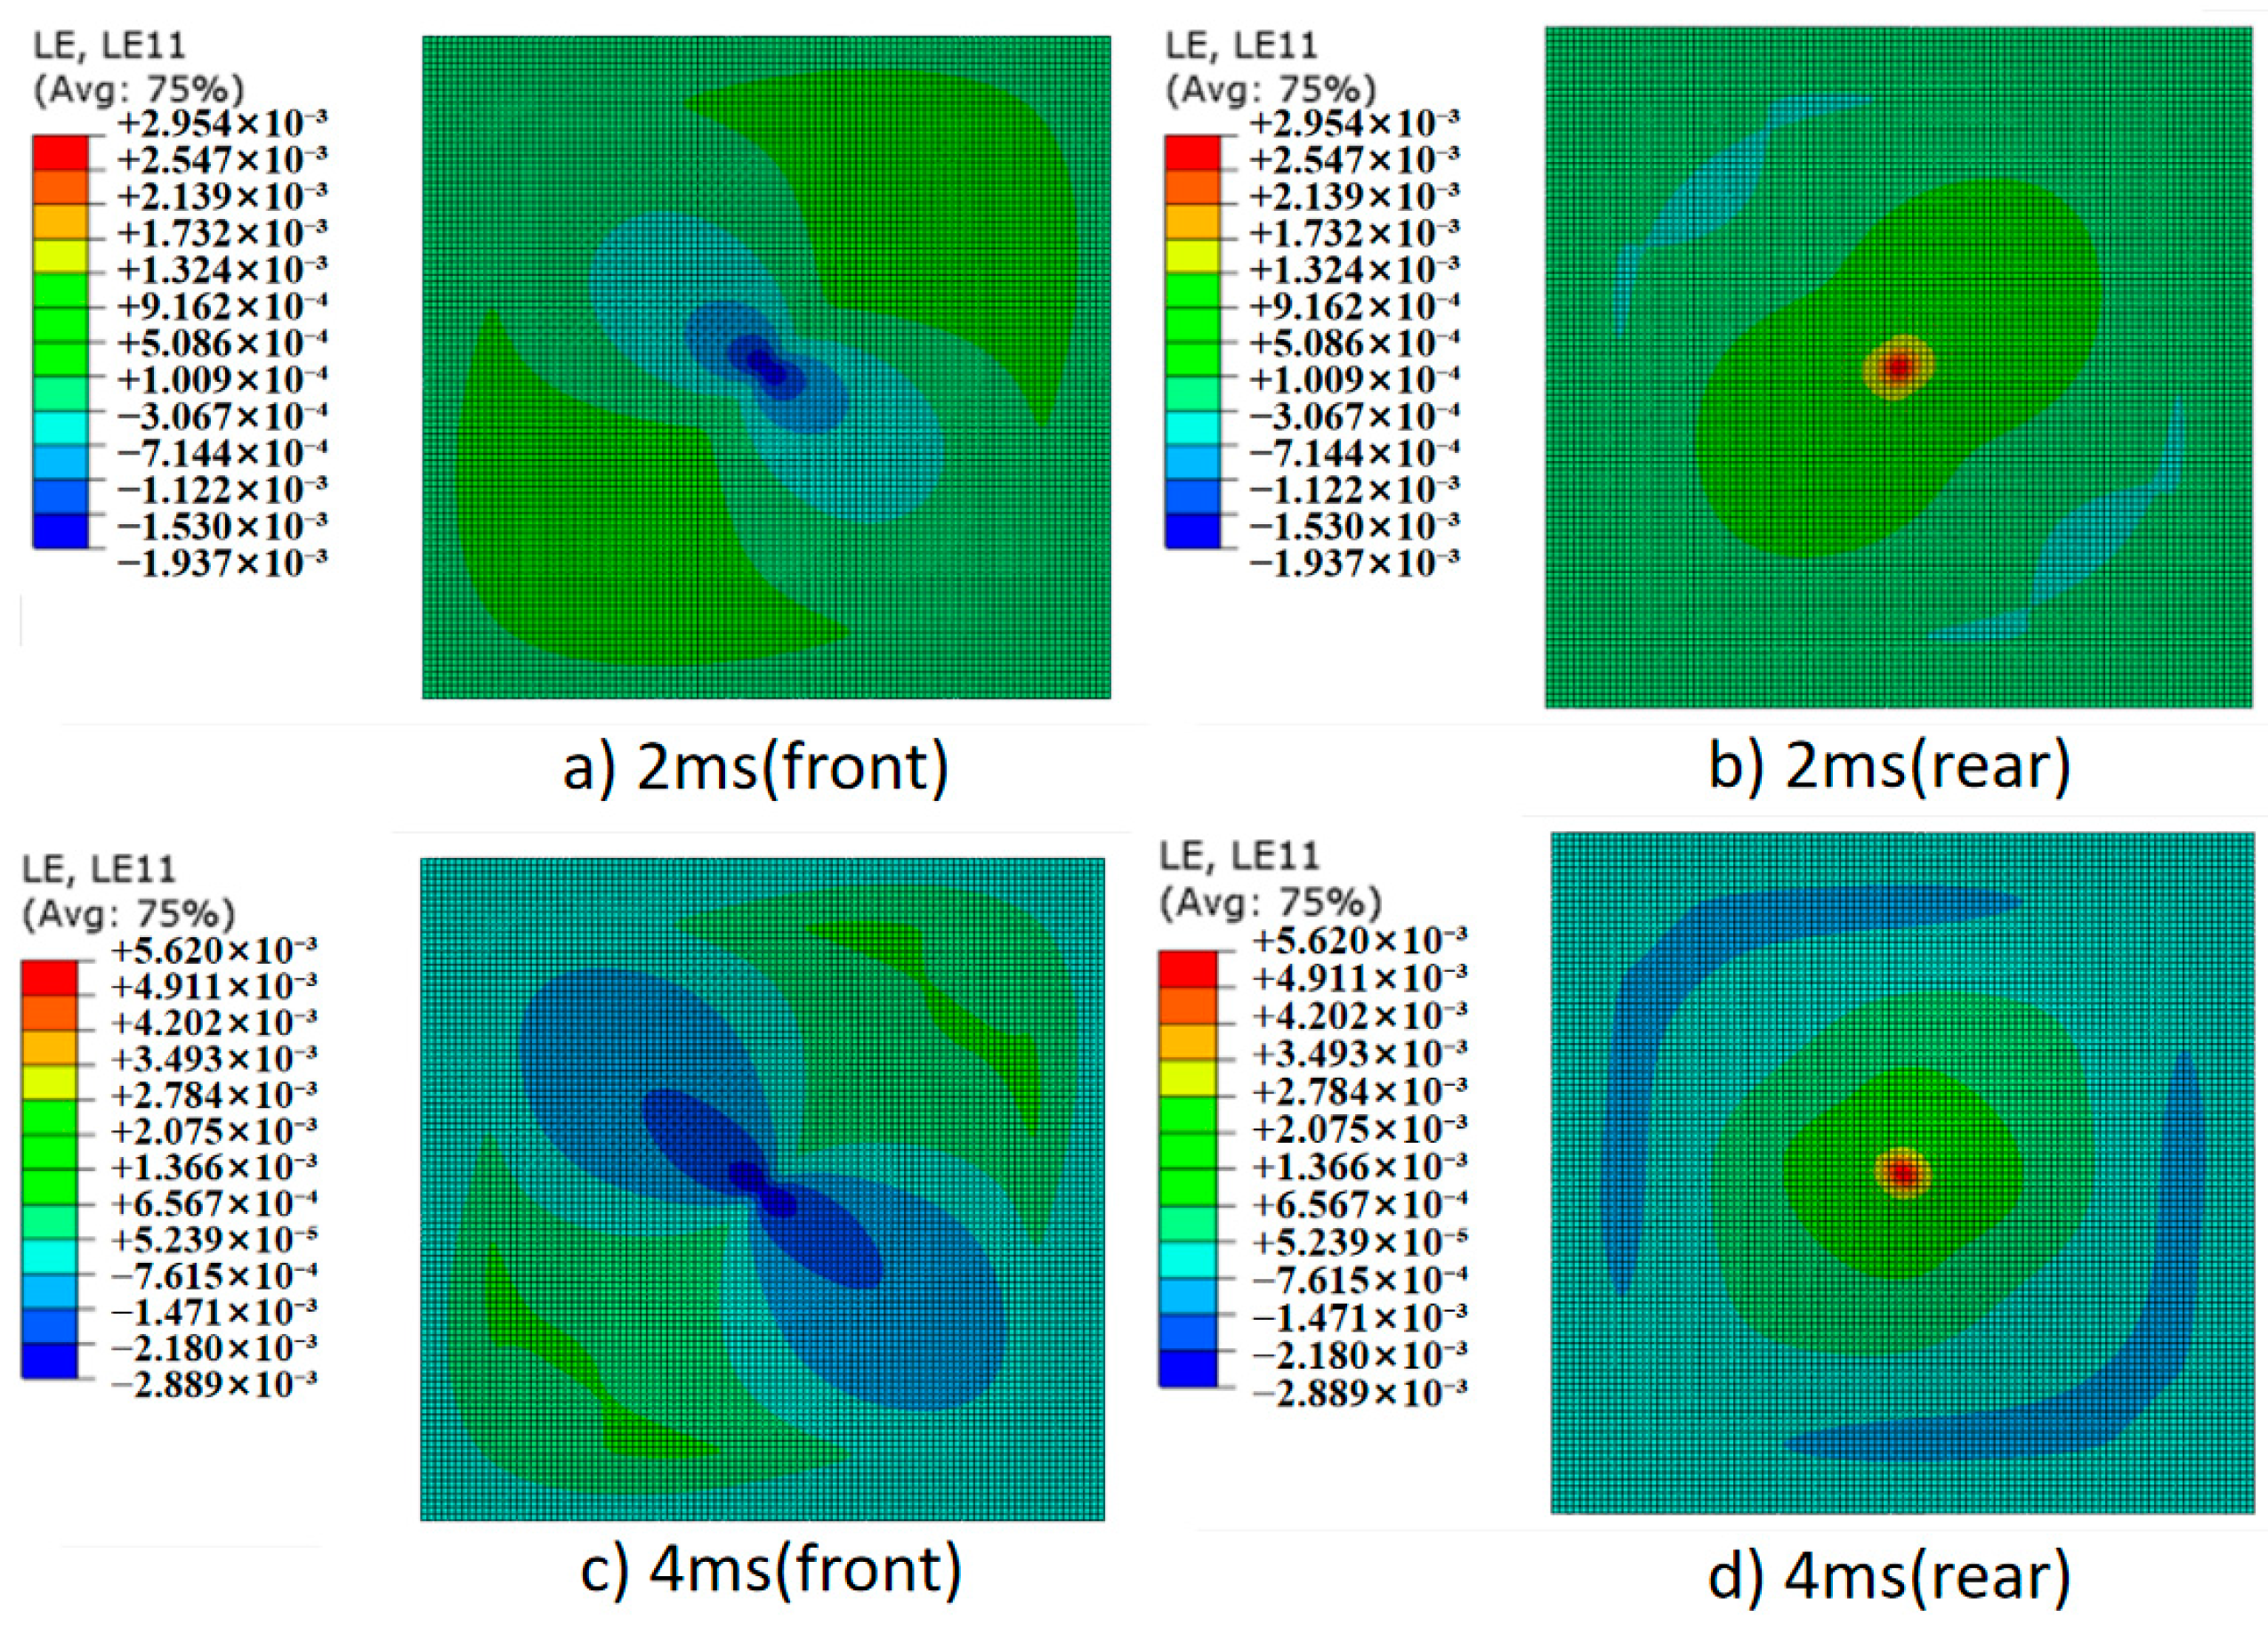
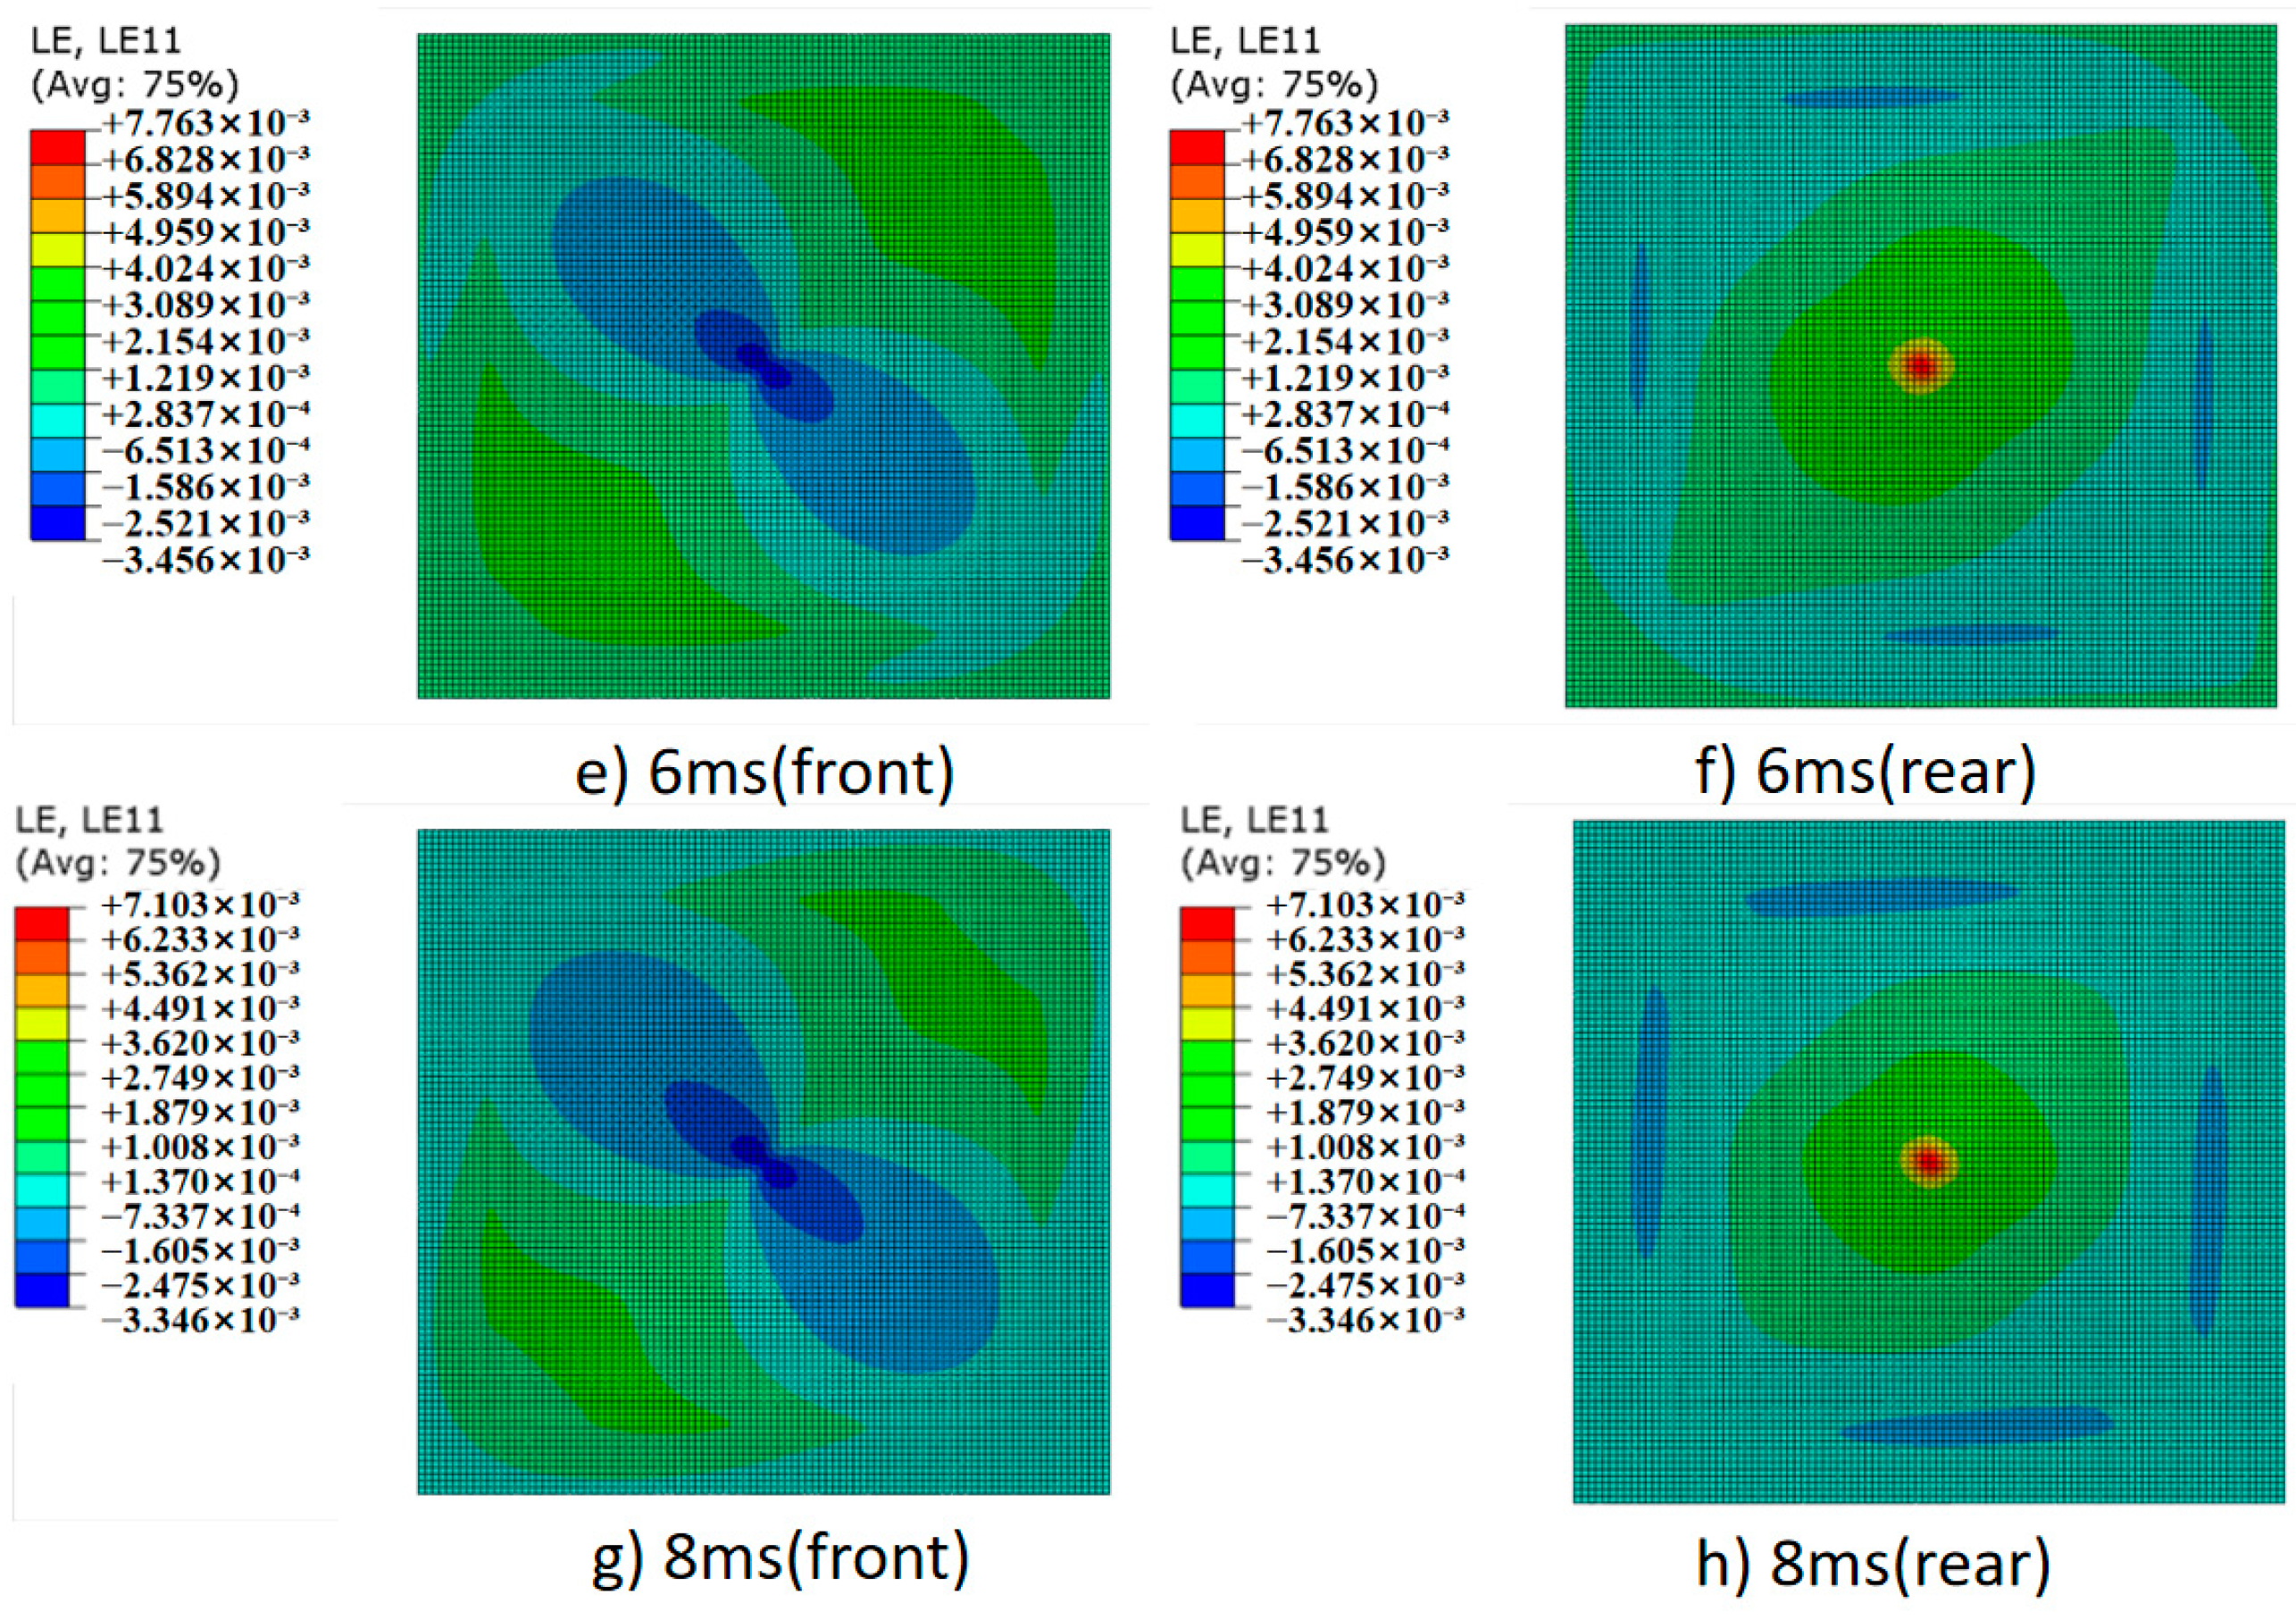
Figure 7 illustrates the longitudinal strain, LE11, of the CL subjected to an impact with an impact velocity of 0.760 m/s (IE of 1.3 J) at impact position 5. The strain in the CL initially increases and subsequently decreases over time. Within the 0 to 6 ms interval, the kinetic energy of the punch is transformed into both kinetic and potential energy of the CL, resulting in a gradual increase in the laminate strain. At the 6 ms mark, the strain peaks at values of 7763 μ and −3456 μ. Beyond this point, the elastic potential energy of the laminate was progressively released, converting back into kinetic energy for both the laminate and the punch, which led to a corresponding decrease in strain. A comparison of the strain distribution on the front and back surfaces shows compressive strain on the front and tensile strain on the back. The area exhibiting high compressive strain on the front was smaller than that showing high tensile strain on the back, suggesting that the back surface of the CL was under greater strain and, consequently, more prone to damage and failure.

4.3. Impact Response Analysis at Different Locations

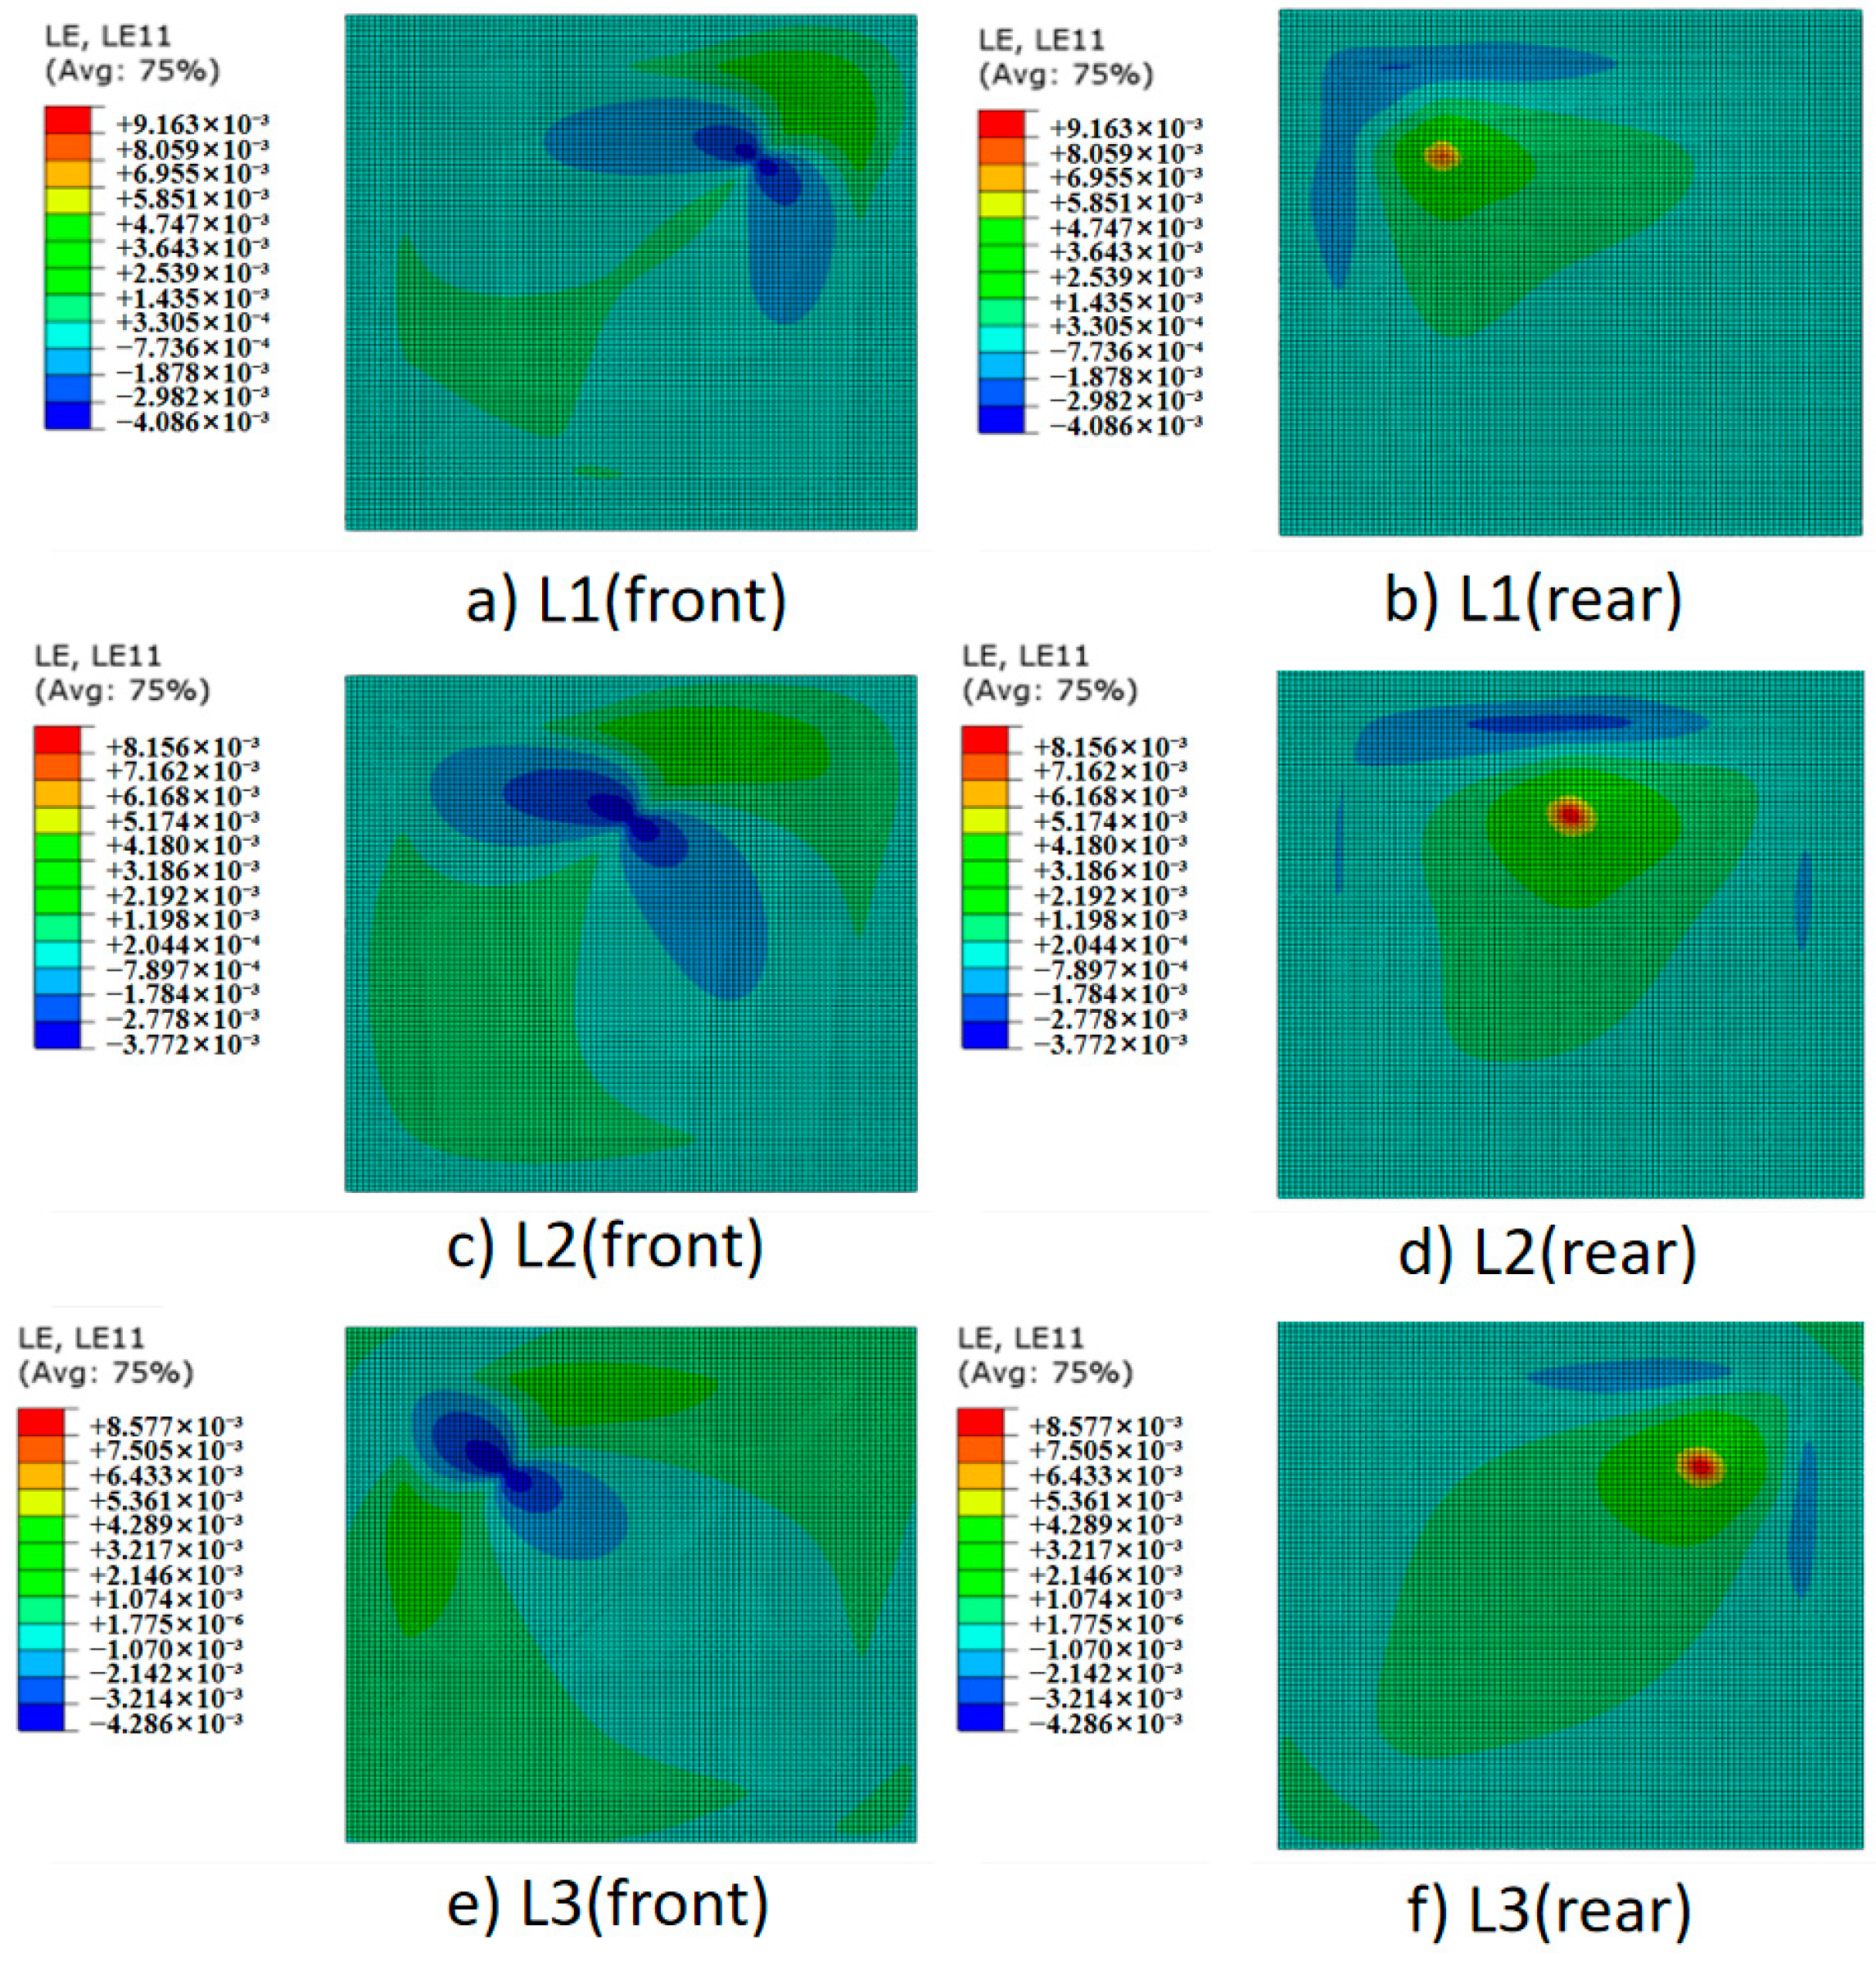
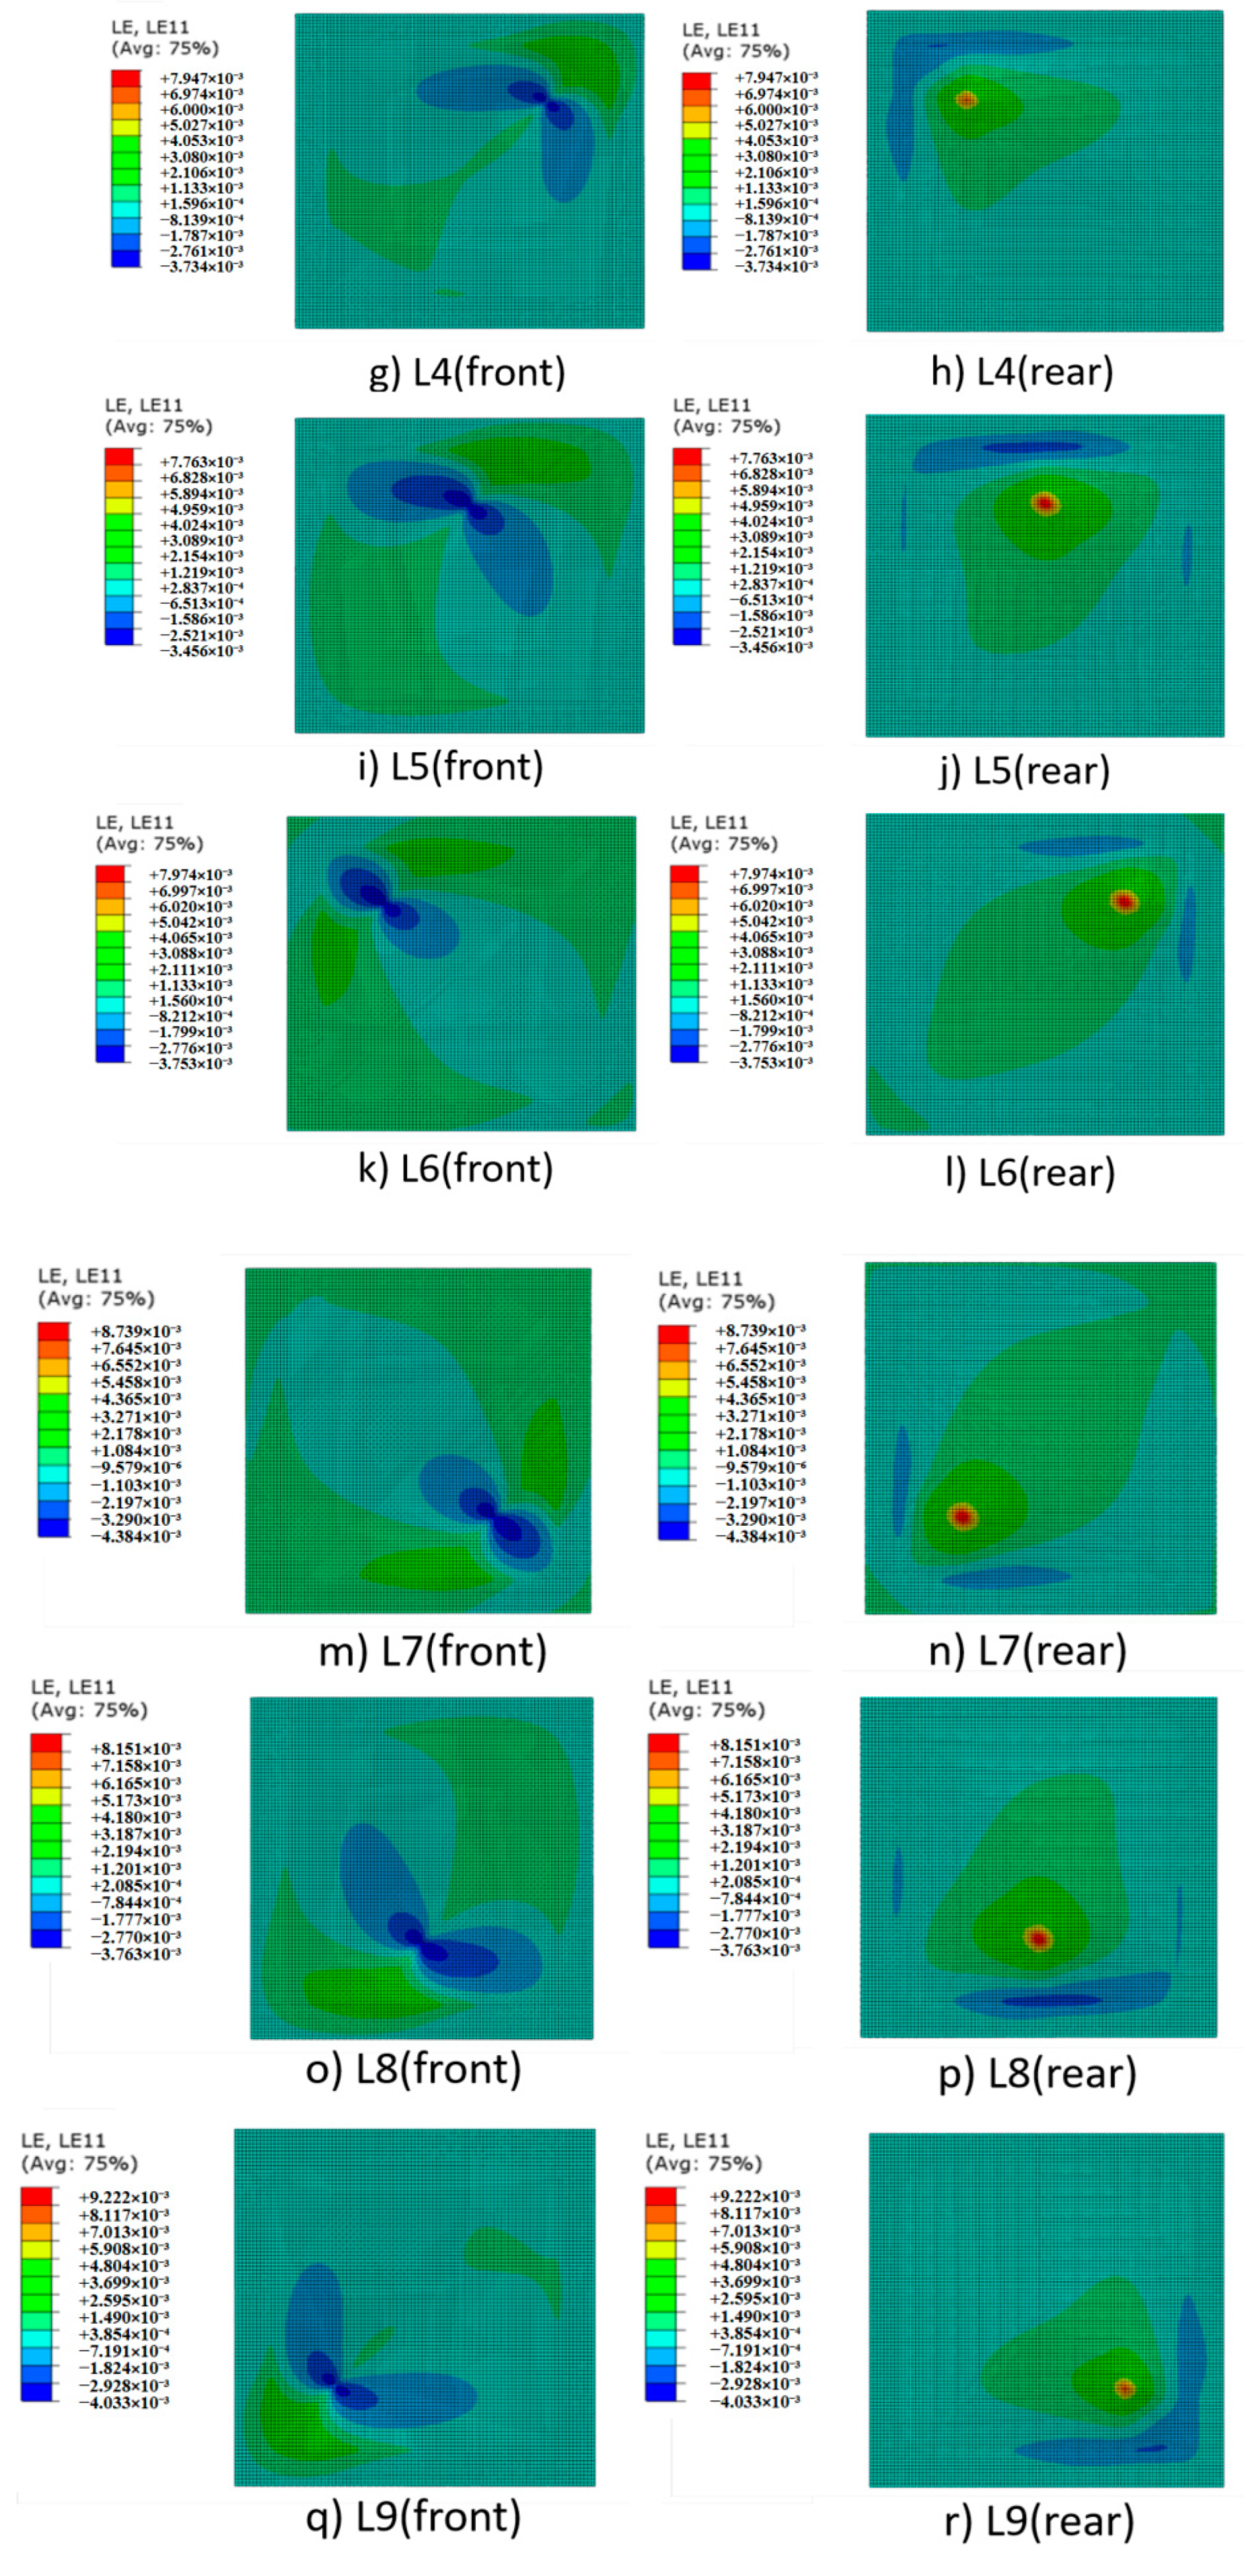
Figure 8 depicted the strain response of the composite material at various impact locations. It was evident that the strain response at the center point of the CL (impact location 5) is relatively minor, recorded at −3456 μ and 7763 μ. The strain responses at other locations are more substantial, with compressive strains ranging from −4384 μ to −3753 μ and tensile strains from 7947 μ to 9222 μ. A comparison of the strain distributions on the front and back surfaces indicated that the area of high compressive strain on the front was smaller than the area of high tensile strain on the back. This disparity suggested that the back surface of the CL undergoes greater deformation and is consequently more susceptible to damage and failure.

4.4. Impact Response Analysis at Different Energies

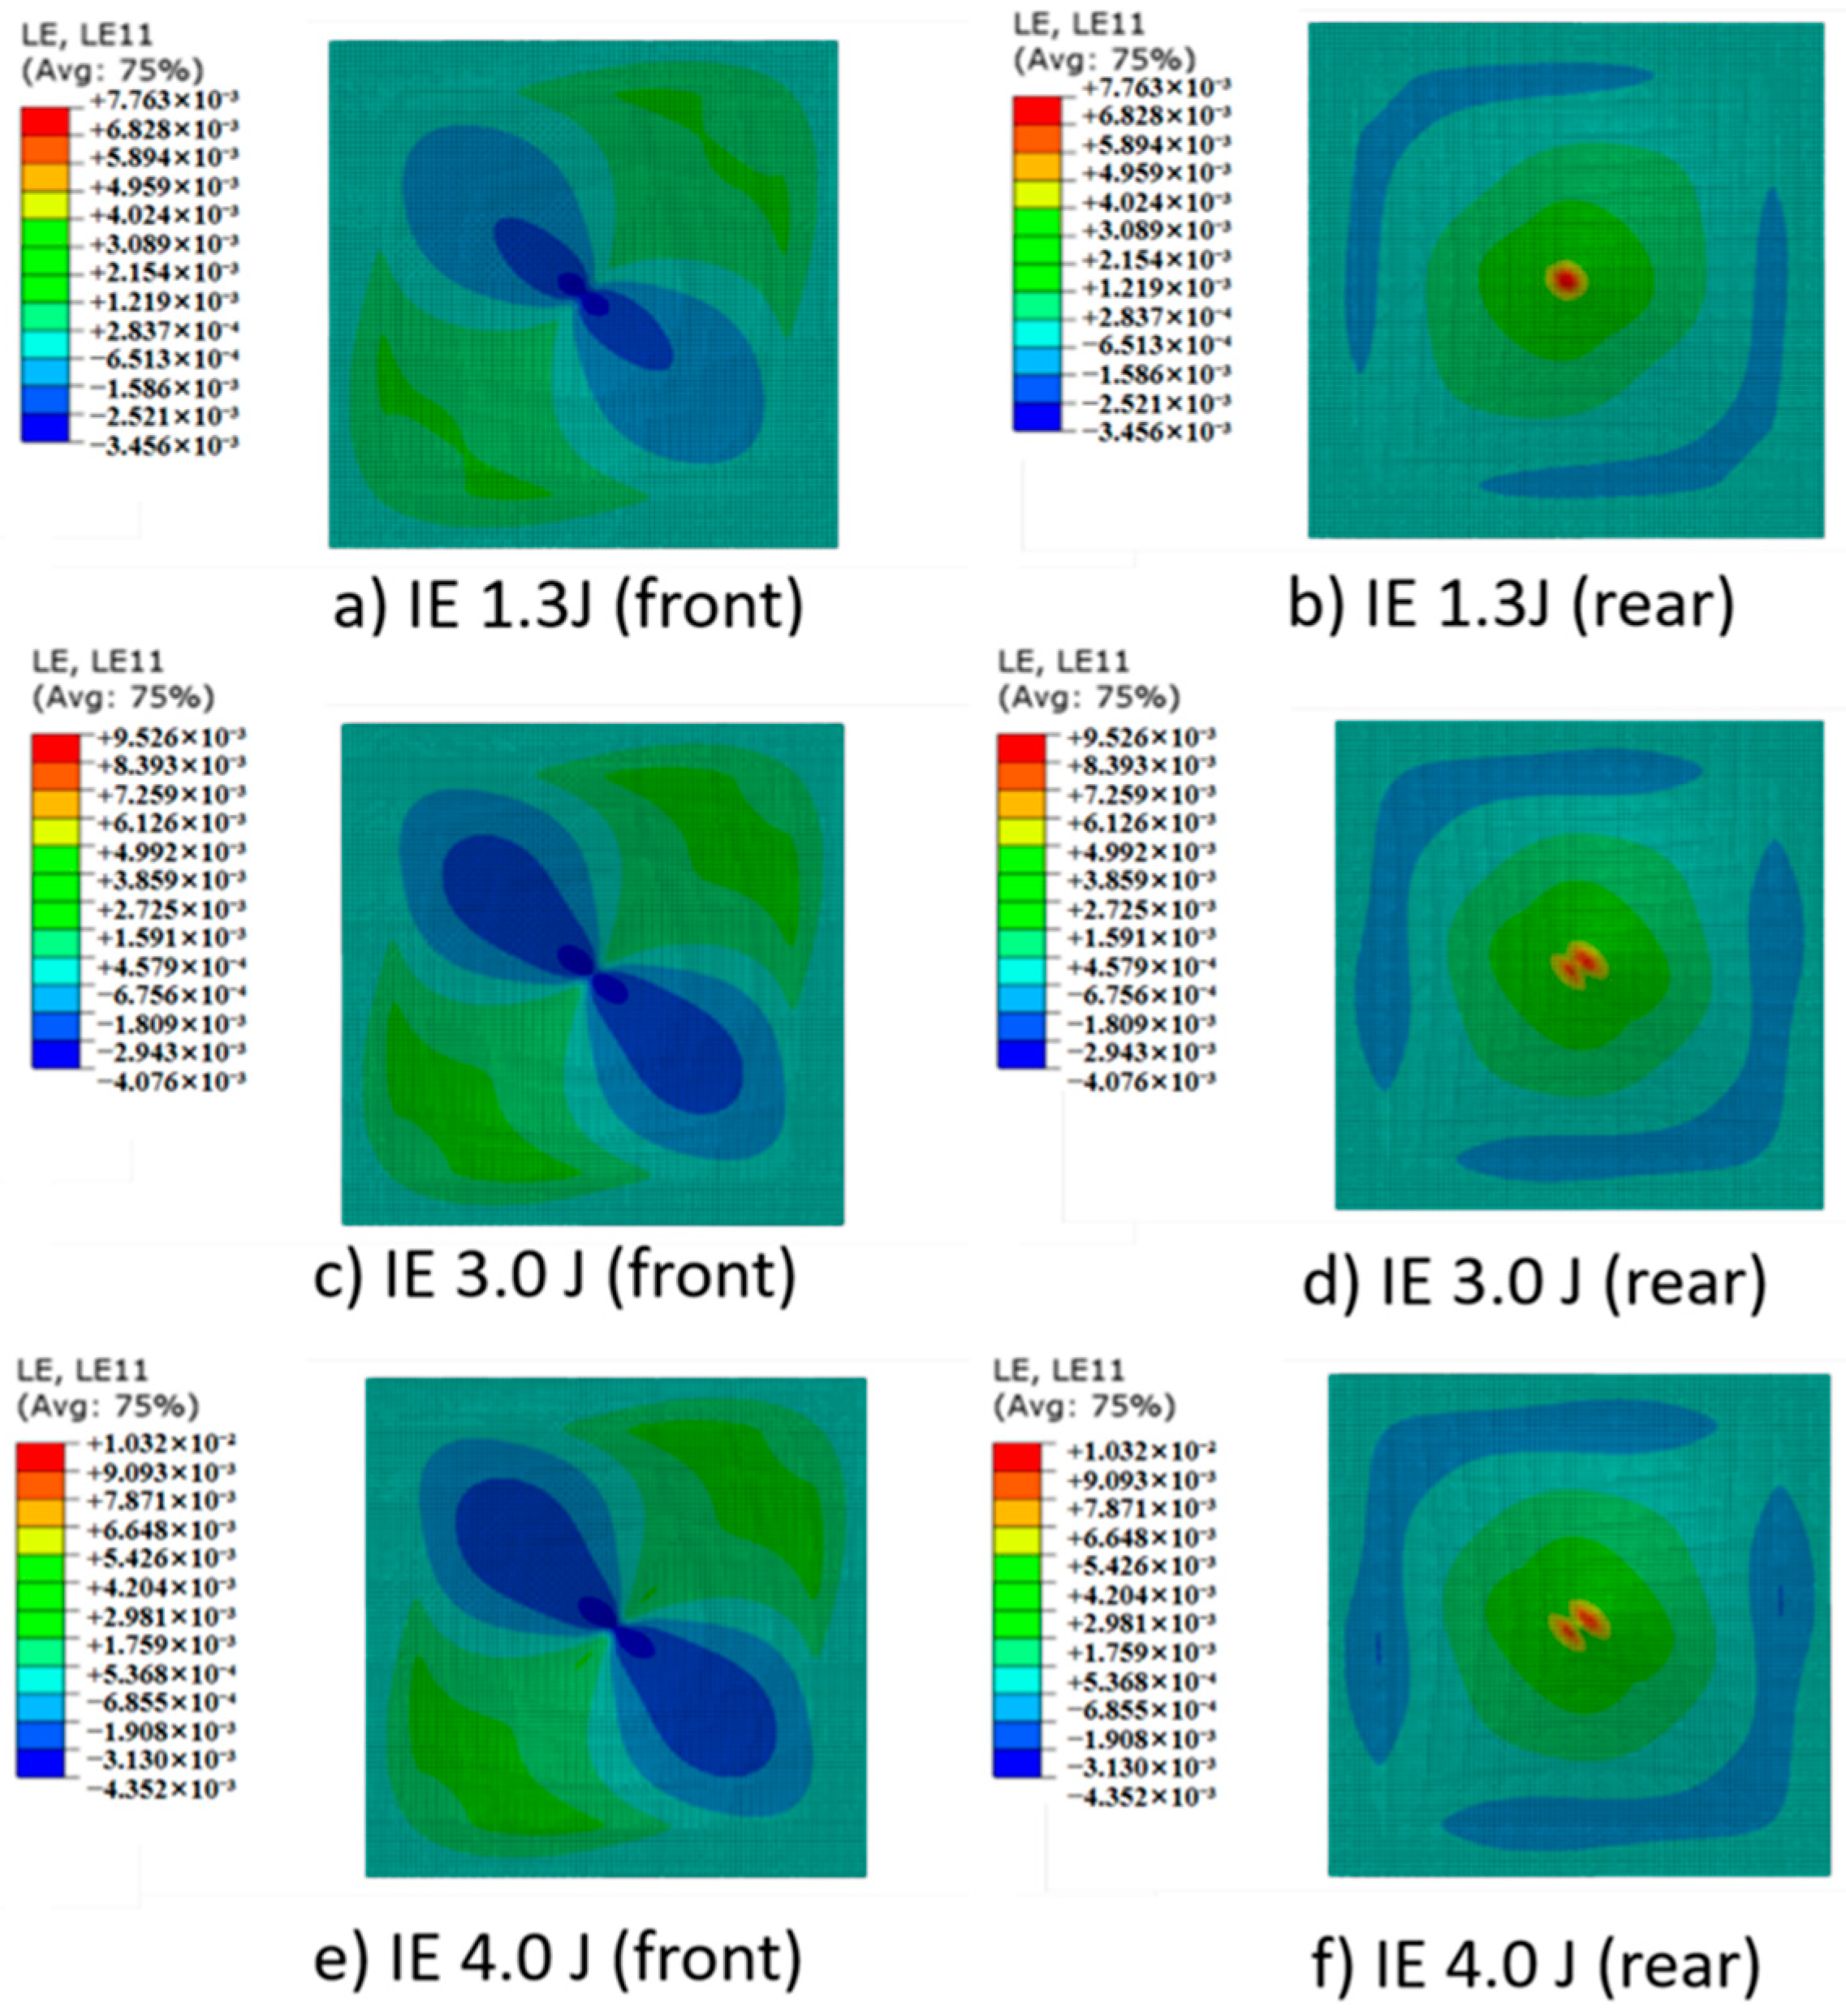
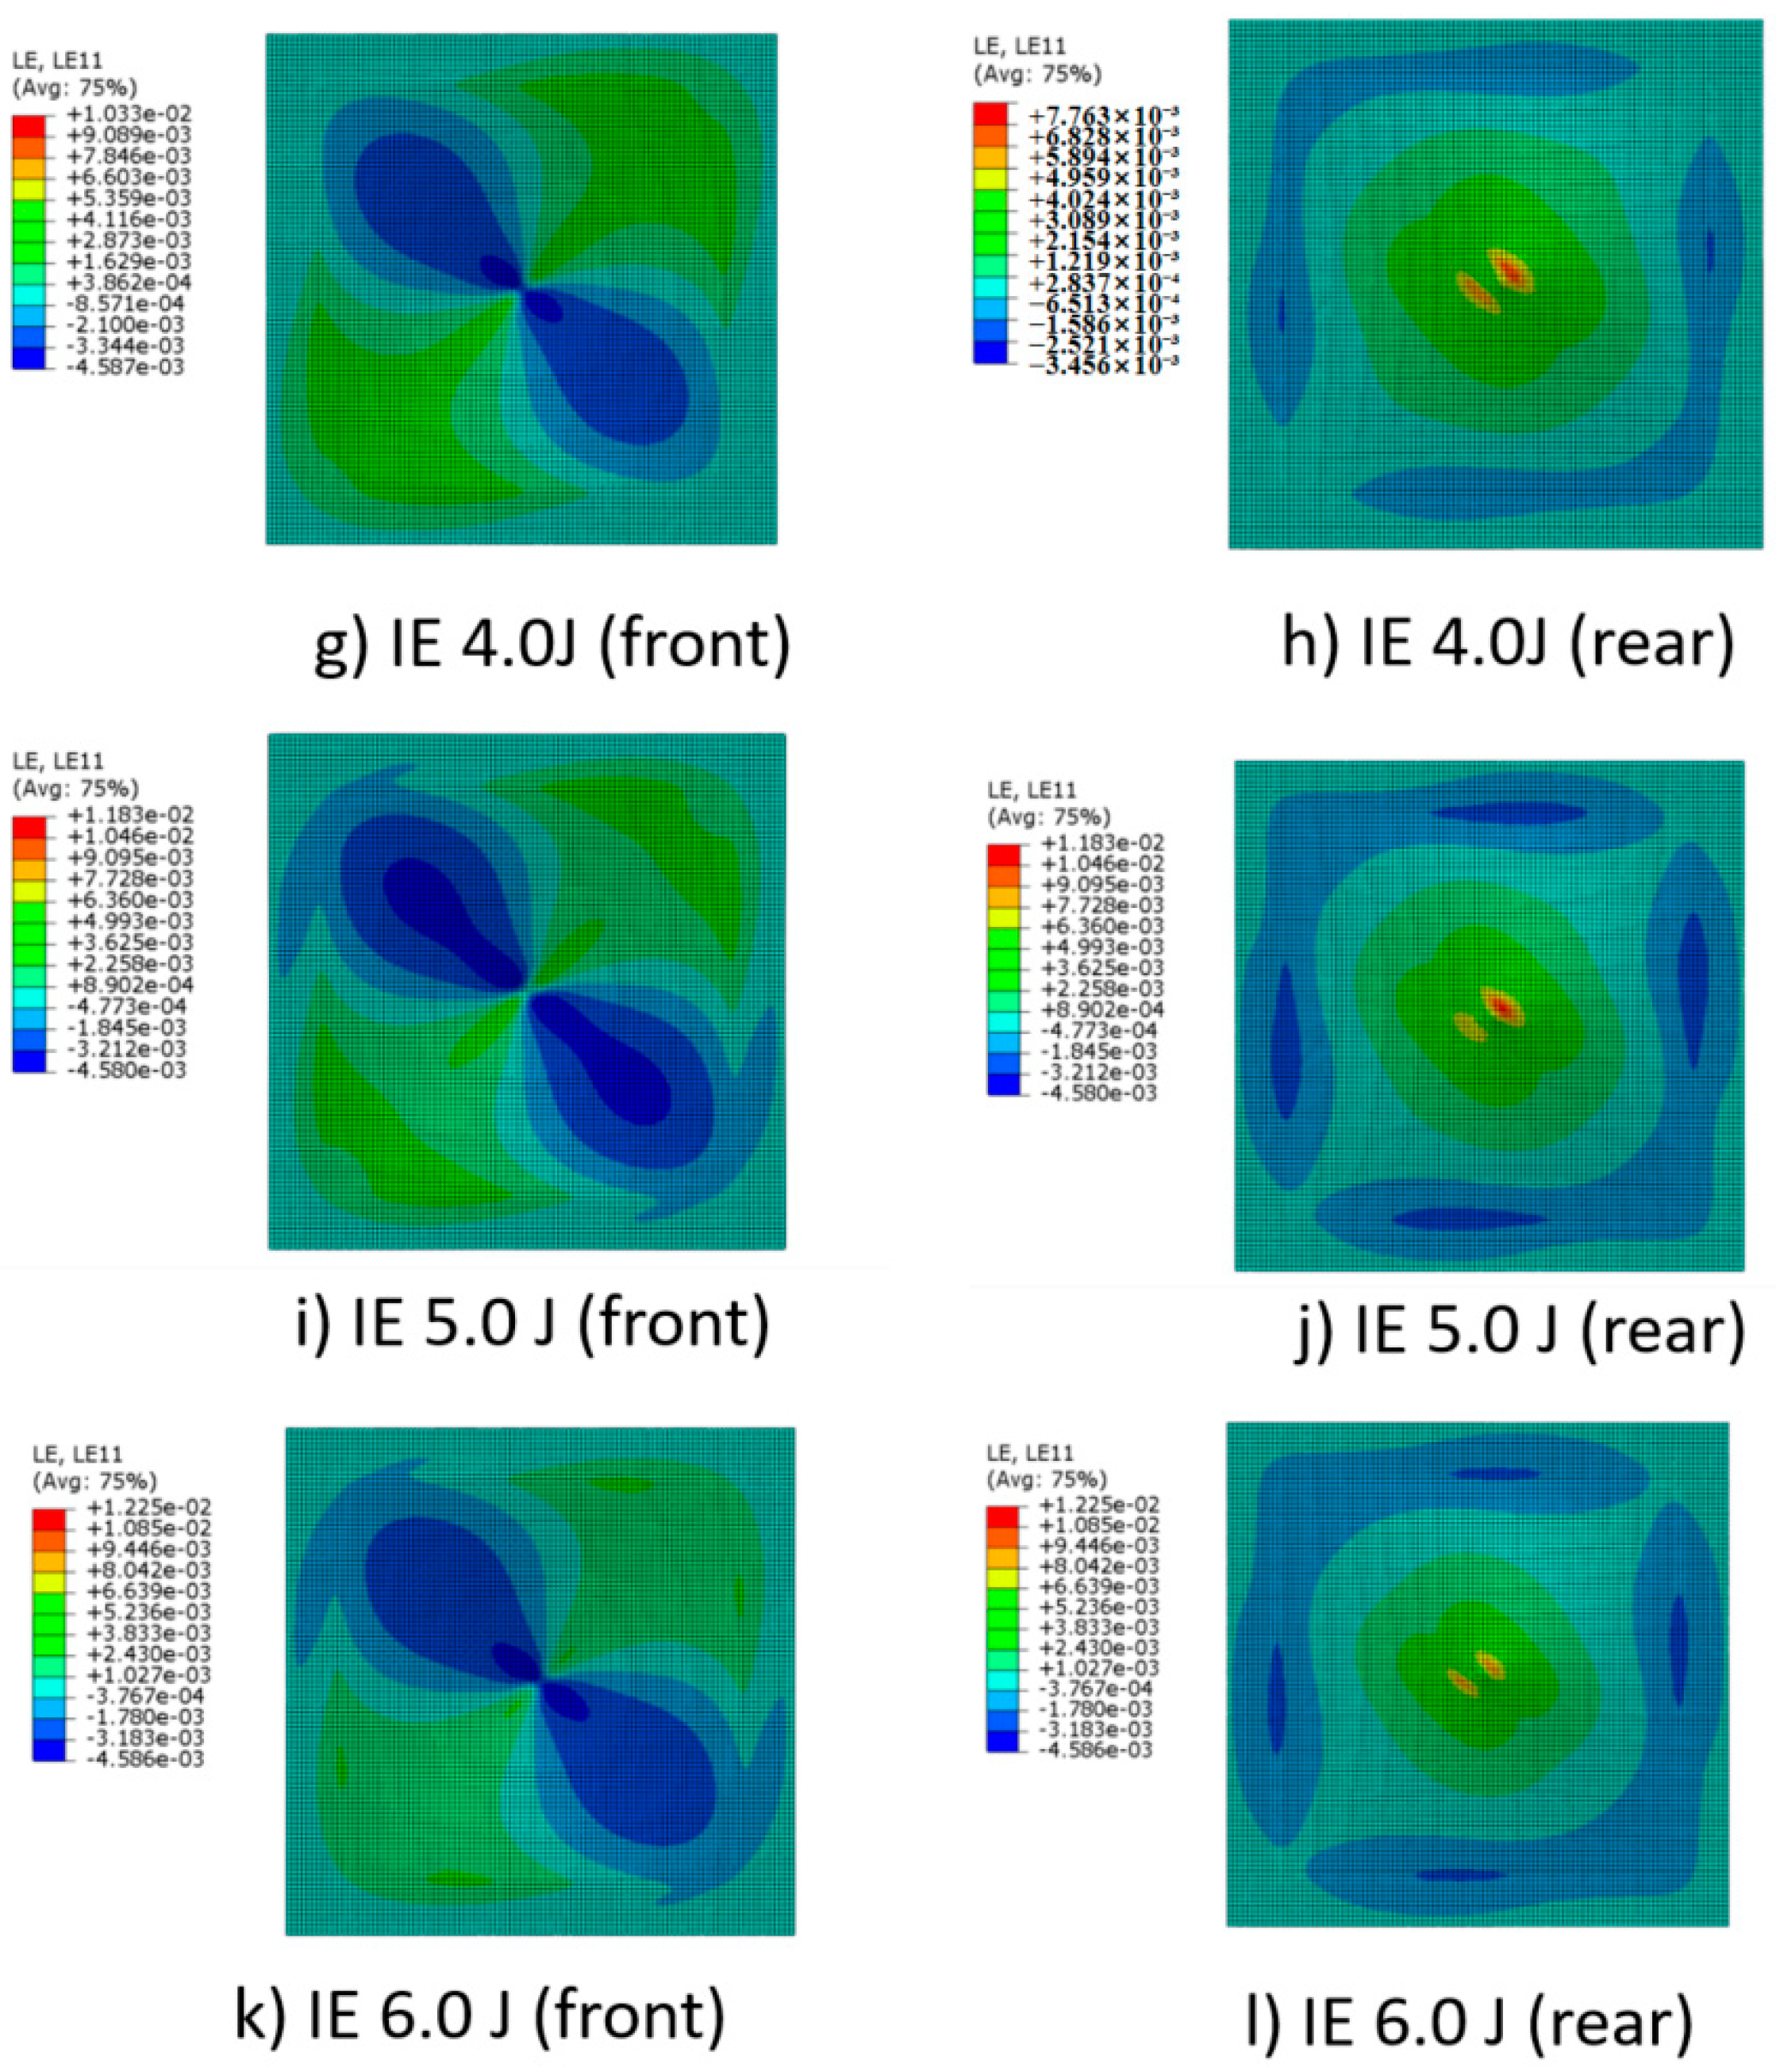
Figure 9 depicts the strain response of the composite material under varying IEs. It was observed that with an increase in IE, there was a corresponding gradual increase in the strain of the CL. At an IE of 1.30 J, the strain in the composite ranged from −3456 μ to 7763 μ. When the IE is elevated to 7.00 J, the strain extended from −4586 μ to 12,250 μ. Notably, the compression strain on the front side exhibited a smaller increase compared to the more significant increase in the tensile strain on the rear side. The patterns of strain distribution remained consistently similar across the various IEs.

4.5. Damage Analysis at Different Energies

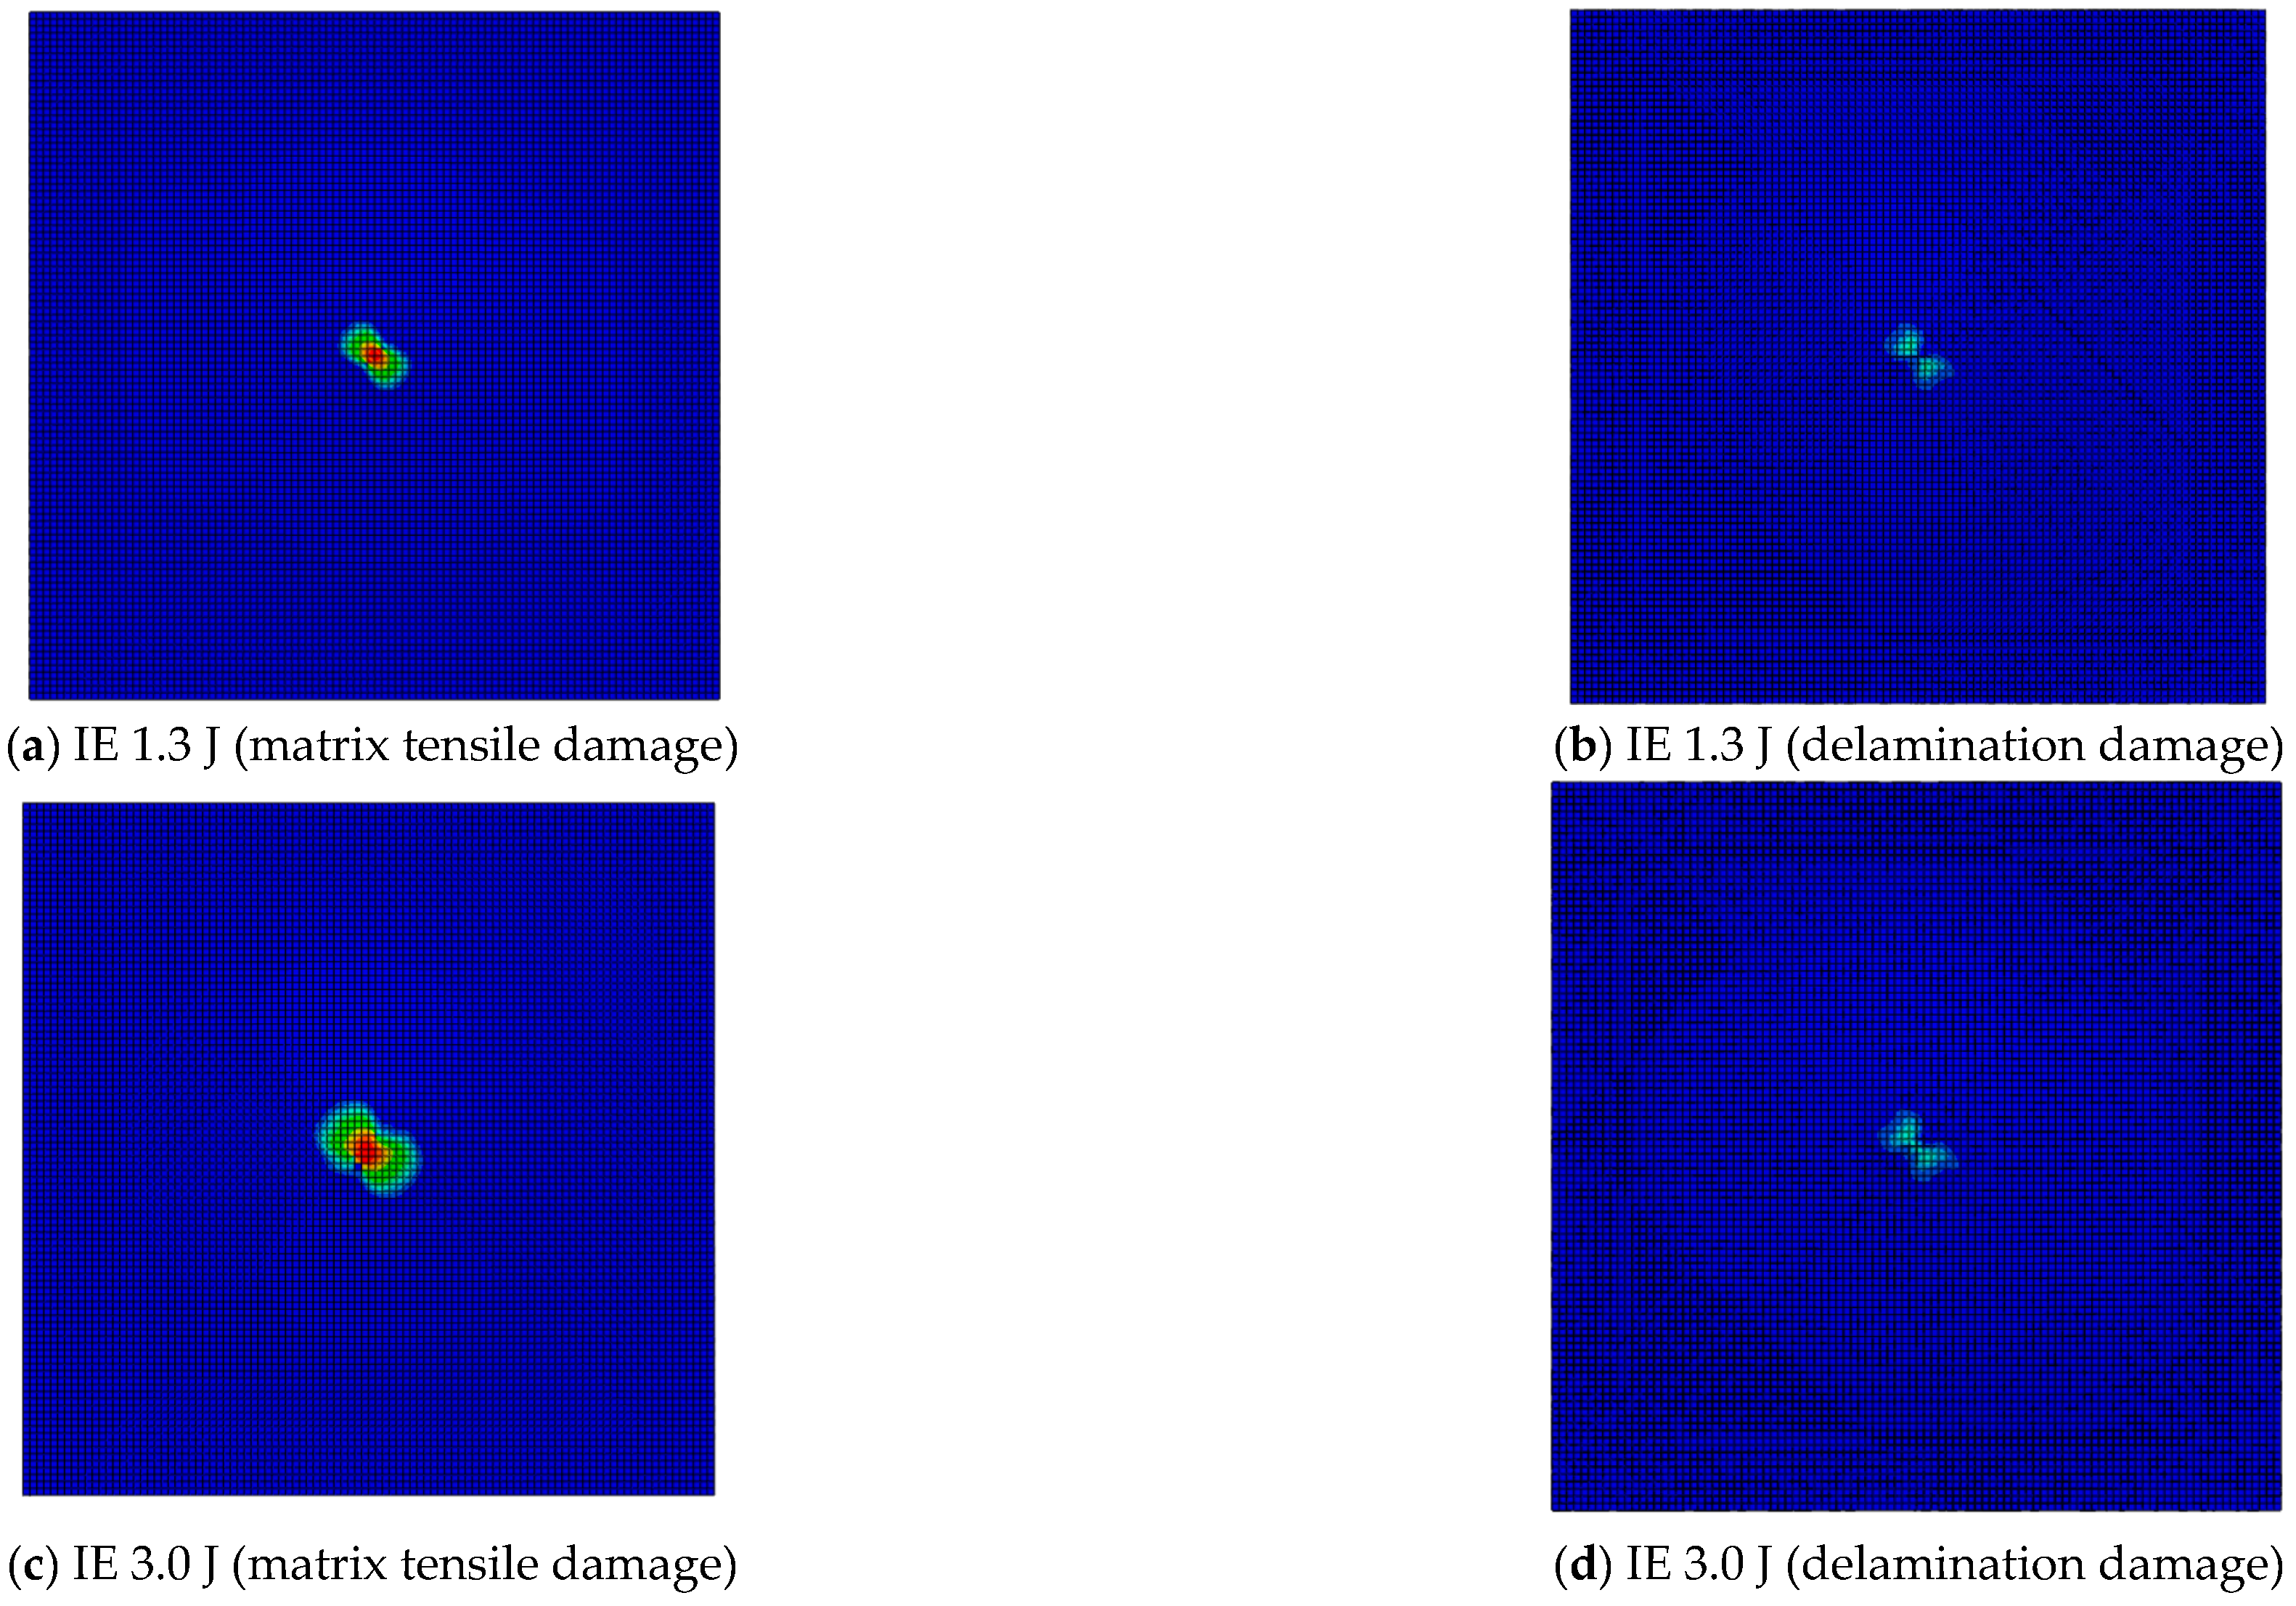
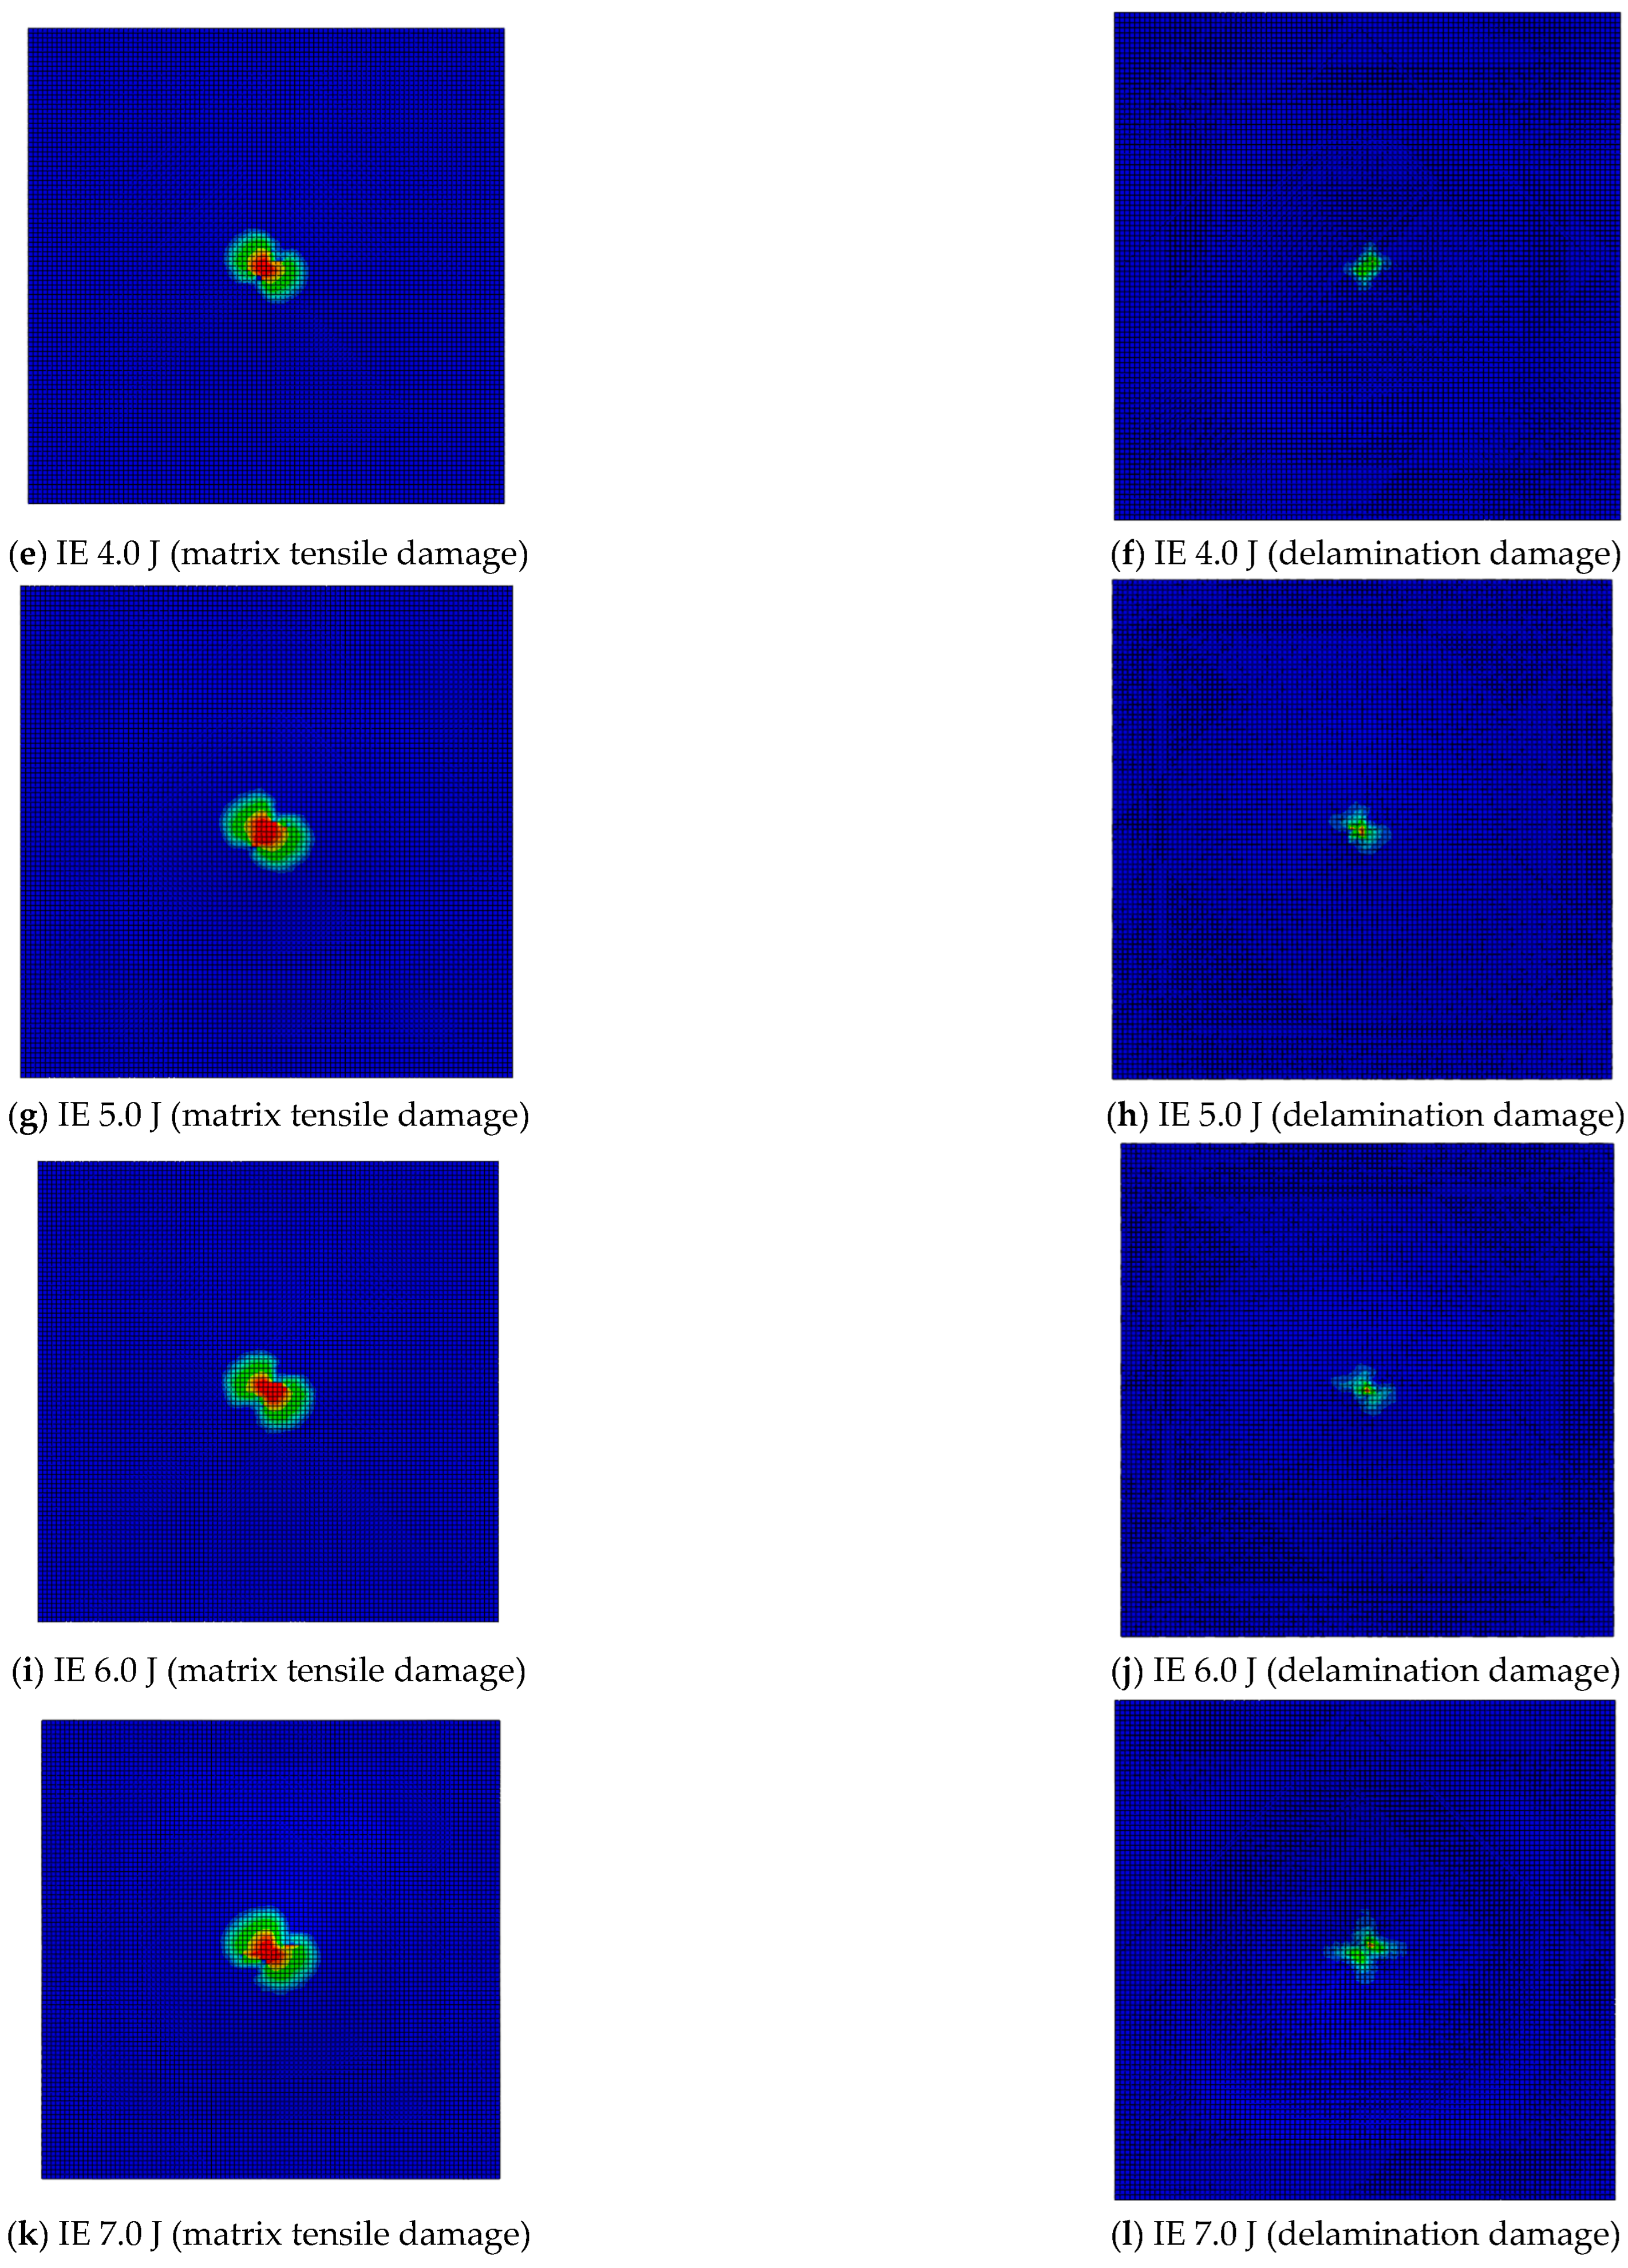
Figure 10 depicted the matrix tensile damage and delamination damage of the composite material under varying IEs. It was observed that the delamination damage of the CL increased with an increase in IE. At an IE of 1.30 J, the area of matrix tensile damage in the composite was zero. When the IE is elevated to 3.0 J, 4.0 J, 5.0 J, 6.0 J and 7.0 J, the area of matrix tensile damage in the composite extends to 24 mm2, 38 mm2, 84 mm2, 96 mm2 and 119 mm2. This indicated that when the impact energy was less than 1.3 J, no matrix damage occurred in the composite panel. When the impact energy exceeded 3.0 J, matrix tensile damage began to appear in the CL, with the damaged area increasing as the impact energy rise. While no delamination damage or fiber damage occurred in the CL when the impact energy ranged between 1.3 J and 7.0 J.
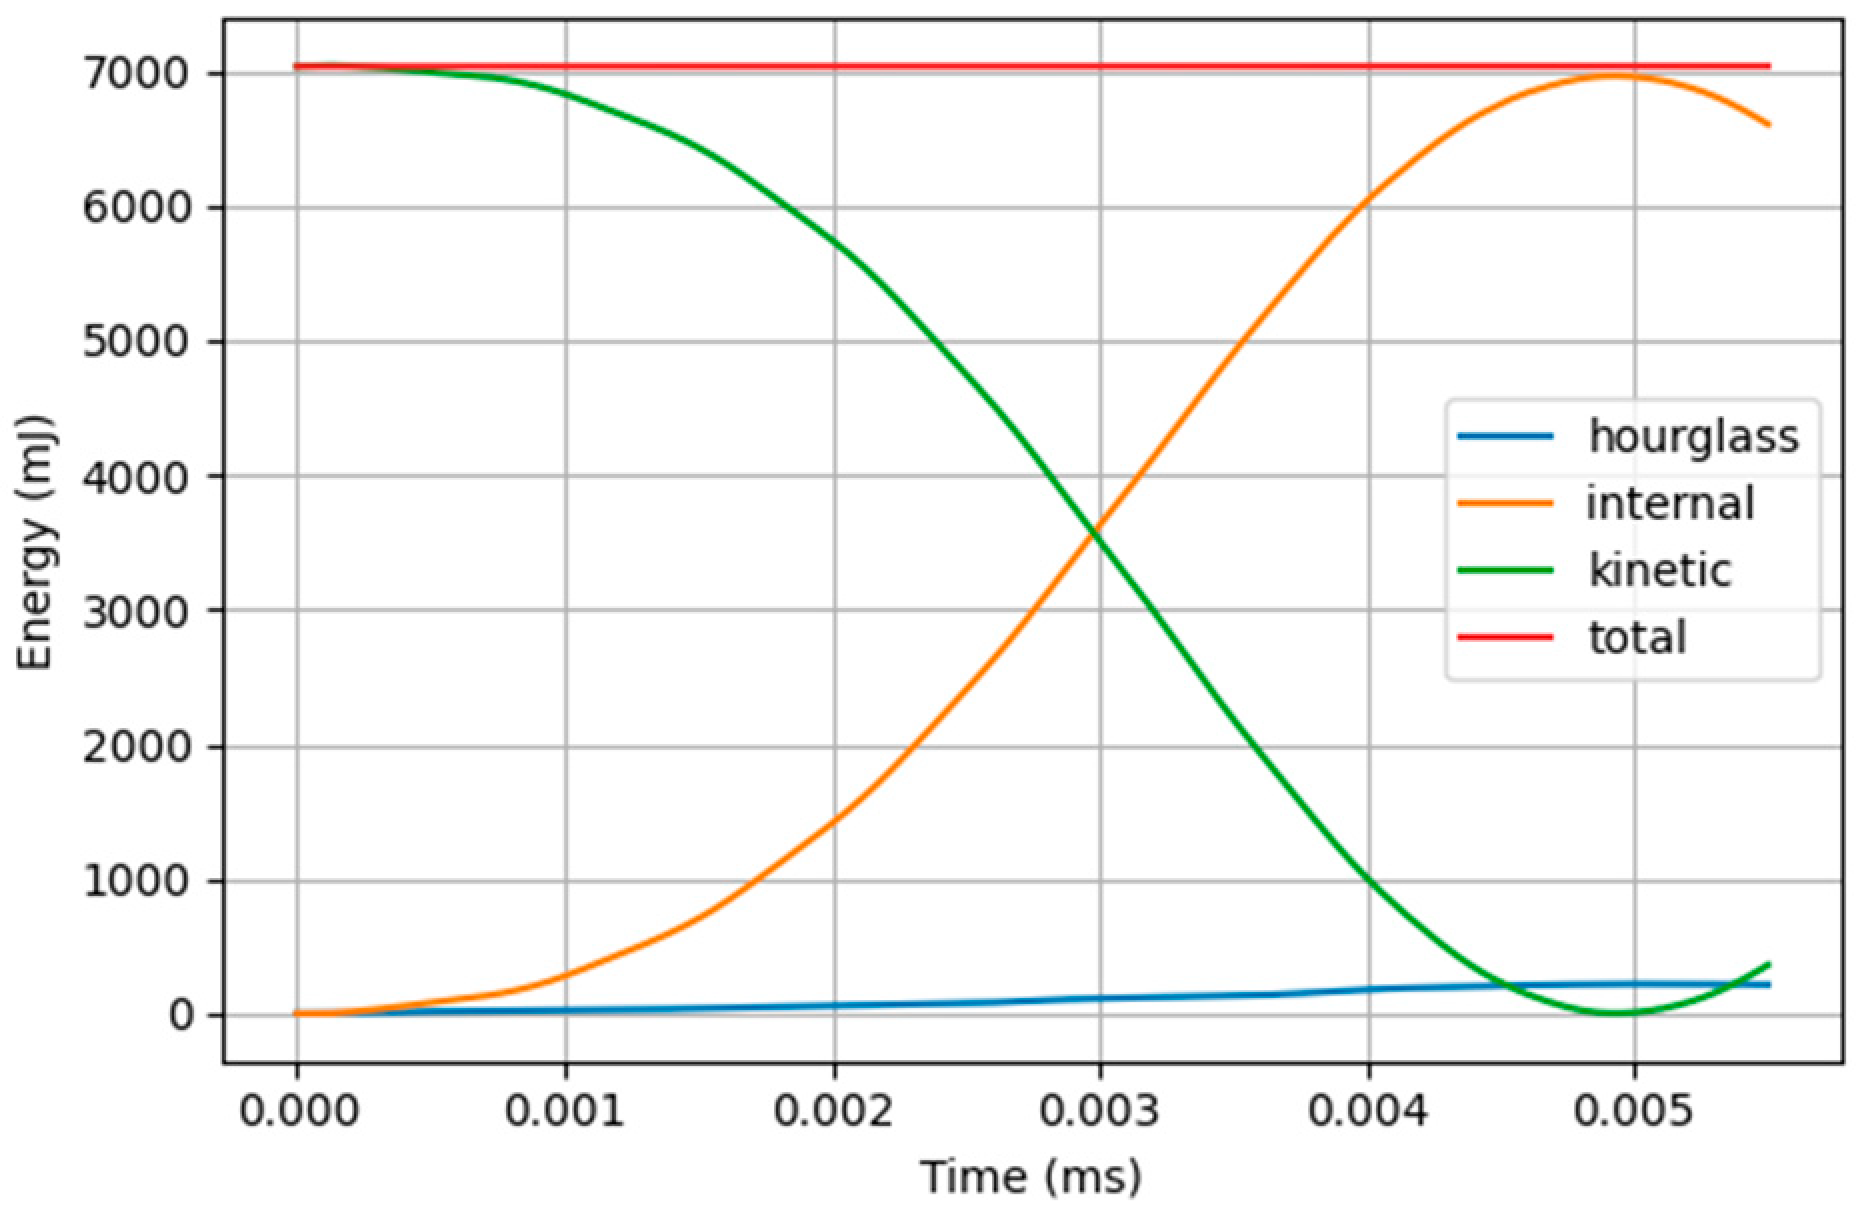
Figure 11 depicted the energy history plot of the composite material under IE = 7.0 J. It was observed that the total calculation time was 6 ms, and the total energy remains constant at 7 J. As time increased, kinetic energy gradually decreased while internal energy gradually increased. The hourglass energy was significantly smaller than the internal energy, indicating that the energy results from the simulation were reasonable and credible.

5. Conclusions

This study has developed a simulation modeling approach to analyze CLs, specifically focusing on their impact responses during low-velocity impacts. The correlations between impact responses and various parameters, including IE and location, have been methodically analyzed. Repeated low-velocity impact tests were conducted on CLs at different locations, recording the impact force responses, which were then compared with the outcomes from simulations. The key findings are as follows:
(1)
The proposed simulation modeling approach successfully predicts the impact responses of CLs under low-velocity impacts with high accuracy. The discrepancies between the simulated and experimental peak impact forces and pulse widths were within 5.83% and 4.95%, respectively.
(2)
Relative to other impact locations, the strain response at the central point of the CL (impact location 5) was found to be comparatively minimal. Upon impact, this location displayed a larger high-strain area on the rear surface of the laminate, indicating a higher susceptibility to damage and failure.
(3)
An increase in IE correlates with a gradual rise in the strain of the CL. The compression strain on the front side shows a less pronounced increase, while the tensile strain on the rear side demonstrates a more significant increase. The strain distribution patterns remain fundamentally consistent across different levels of IE.

Author Contributions

Writing—original draft preparation, A.Q.; writing—review and editing, H.D.; formal analysis, K.C.; supervision, Y.Z. All authors have read and agreed to the published version of the manuscript.

Funding

This research received no external funding.

Data Availability Statement

Dataset available on request from the authors.

Conflicts of Interest

Aibing Qian was employed by the AVIC General Huanan Aircraft Industry Co., Ltd. The remaining authors declare that the research was conducted in the absence of any commercial or financial relationships that could be construed as a potential conflict of interest.

References

  1. Li, L.; Liu, W.; Wang, Y.; Zhao, Z. Mechanical performance and damage monitoring of CFRP thermoplastic laminates with an open hole repaired by 3D printed patches. Compos. Struct. 2023, 303, 116308. [Google Scholar] [CrossRef]
  2. Barile, C.; Casavola, C.; Pappalettera, G.; Kannan, V.P. Damage monitoring of carbon fibre reinforced polymer composites using acoustic emission technique and deep learning. Compos. Struct. 2022, 292, 115629. [Google Scholar] [CrossRef]
  3. Zhang, X.; Chen, Y.; Hu, J. Recent advances in the development of aerospace materials. Prog. Aerosp. Sci. 2018, 97, 22–34. [Google Scholar] [CrossRef]
  4. Thorsson, S.I.; Sringeri, S.P.; Waas, A.M.; Justusson, B.P.; Rassaian, M. Experimental investigation of composite laminates subject to low-velocity edge-on impact and compression after impact. Compos. Struct. 2018, 186, 335–346. [Google Scholar] [CrossRef]
  5. Habibi, M.; Laperrière, L.; Hassanabadi, H.M. Influence of low-velocity impact on residual tensile properties of nonwoven flax/epoxy composite. Compos. Struct. 2018, 186, 175–182. [Google Scholar] [CrossRef]
  6. Richardson, M.O.W.; Wisheart, M.J. Review of low-velocity impact properties of composite materials. Compos. Part A Appl. Sci. Manuf. 1996, 27, 1123–1131. [Google Scholar] [CrossRef]
  7. Bogenfeld, R.; Kreikemeier, J.; Wille, T. Review and benchmark study on the analysis of low-velocity impact on composite laminates. Eng. Fail. Anal. 2018, 86, 72–99. [Google Scholar] [CrossRef]
  8. Rezasefat, M.; Gonzalez-Jimenez, A.; Giglio, M.; Manes, A. Numerical study on the dynamic progressive failure due to low-velocity repeated impacts in thin CFRP laminated composite plates. Thin Walled Struct. 2021, 167, 108220. [Google Scholar] [CrossRef]
  9. Aslan, Z.; Karakuzu, R.; Okutan, B. The response of laminated composite plates under low-velocity impact loading. Compos. Struct. 2003, 59, 119–127. [Google Scholar] [CrossRef]
  10. Zou, D.; Haack, C.; Bishop, P.; Bezabeh, A. Damage criticality and inspection concerns of composite-metallic aircraft structures under blunt impact. In Structural Health Monitoring and Inspection of Advanced Materials, Aerospace, and Civil Infrastructure 2015; SPIE: Bellingham, WA, USA, 2015; Volume 9437. [Google Scholar]
  11. Zhou, Z.; Sun, W.; Zheng, N.; Tang, L.-C. Experimental and numerical investigation of the energy absorption characteristics of carbon-basalt hybrid fiber reinforced polymer composites under ballistic impact. Compos. Struct. 2024, 335, 118000. [Google Scholar] [CrossRef]
  12. Thorsson, S.I.; Waas, A.M.; Rassaian, M. Numerical investigation of composite laminates subject to low-velocity edge-on impact and compression after impact. Compos. Struct. 2018, 203, 648–658. [Google Scholar] [CrossRef]
  13. Canale, G.; Kinawy, M.; Sathujoda, P.; Maligno, A.; Citarella, R.G. Moisture absorption in thick composite plates: Modelling and experiments. Multidiscip. Model. Mater. Struct. 2020, 16, 439–447. [Google Scholar] [CrossRef]
  14. Zhang, C.; Duodu, E.A.; Gu, J. Finite element modeling of damage development in cross-ply composite laminates subjected to low velocity impact. Compos. Struct. 2017, 173, 219–227. [Google Scholar] [CrossRef]
  15. Zhang, B.; Ge, J.; Li, B.; Liu, Z.; Liu, S.; Liang, J. A parametric modeling method for 3D woven composites considering realistic meso-structural characteristics. Compos. Sci. Technol. 2024, 257, 110828. [Google Scholar] [CrossRef]
  16. Xu, W.; Chen, J.; Cui, X.; Wang, D.; Pu, Y. Low-velocity impact analysis and multi-objective optimization of hybrid carbon/basalt fibre reinforced composite laminate. Compos. Struct. 2024, 343, 118305. [Google Scholar] [CrossRef]
  17. Zhang, J.; Zhang, X. Simulating low-velocity impact induced delamination in composites by a quasi-static load model with surface-based cohesive contact. Compos. Struct. 2015, 125, 51–57. [Google Scholar] [CrossRef]
  18. Zhang, J.; Zhang, X. An efficient approach for predicting low-velocity impact force and damage in composite laminates. Compos. Struct. 2015, 130, 85–94. [Google Scholar] [CrossRef]
  19. Li, X.; Ma, D.; Liu, H.; Tan, W.; Gong, X.; Zhang, C.; Li, Y. Assessment of failure criteria and damage evolution methods for composite laminates under low-velocity impact. Compos. Struct. 2019, 207, 727–739. [Google Scholar] [CrossRef]
  20. Zhou, J.; Wen, P.; Wang, S. Finite element analysis of a modified progressive damage model for composite laminates under low-velocity impact. Compos. Struct. 2019, 225, 111113. [Google Scholar] [CrossRef]
  21. Krueger, R. Virtual crack closure technique: History, approach, and applications. Appl. Mech. Rev. 2004, 57, 109–143. [Google Scholar] [CrossRef]
  22. Camanho, P.P.; Davila, C.G.; de Moura, M.F. Numerical simulation of mixed-mode progressive delamination in composite materials. J. Compos. Mater. 2003, 37, 1415–1438. [Google Scholar] [CrossRef]
  23. Zhang, Y.; Wang, S.; Guo, Y. Analysis of low-velocity impact response and damage characteristics of composite laminates with rigid/soft blunt objects. Polym. Compos. 2025, 46, S660–S677. [Google Scholar] [CrossRef]
  24. Zhou, J.; Wang, S. A progressive damage model of composite laminates under low-velocity impact. Xibei Gongye Daxue Xuebao/J. Northwest. Polytech. Univ. 2021, 39, 37–45. [Google Scholar] [CrossRef]
  25. Hashin, Z. Fatigue Failure Criteria for Unidirectional Fiber Composites. J. Appl. Mech. 1981, 48, 846–852. [Google Scholar] [CrossRef]
  26. Camanho, P.P.; Matthews, F.L. A progressive damage model for mechanically fastened joints in composite laminates. J. Compos. Mater. 1999, 33, 2248–2280. [Google Scholar] [CrossRef]
  27. HB6739; General Specifications for Carbon Fiber Prepreg. Aviation Industry Corporation of China (AVIC): Beijing, China, 2003.
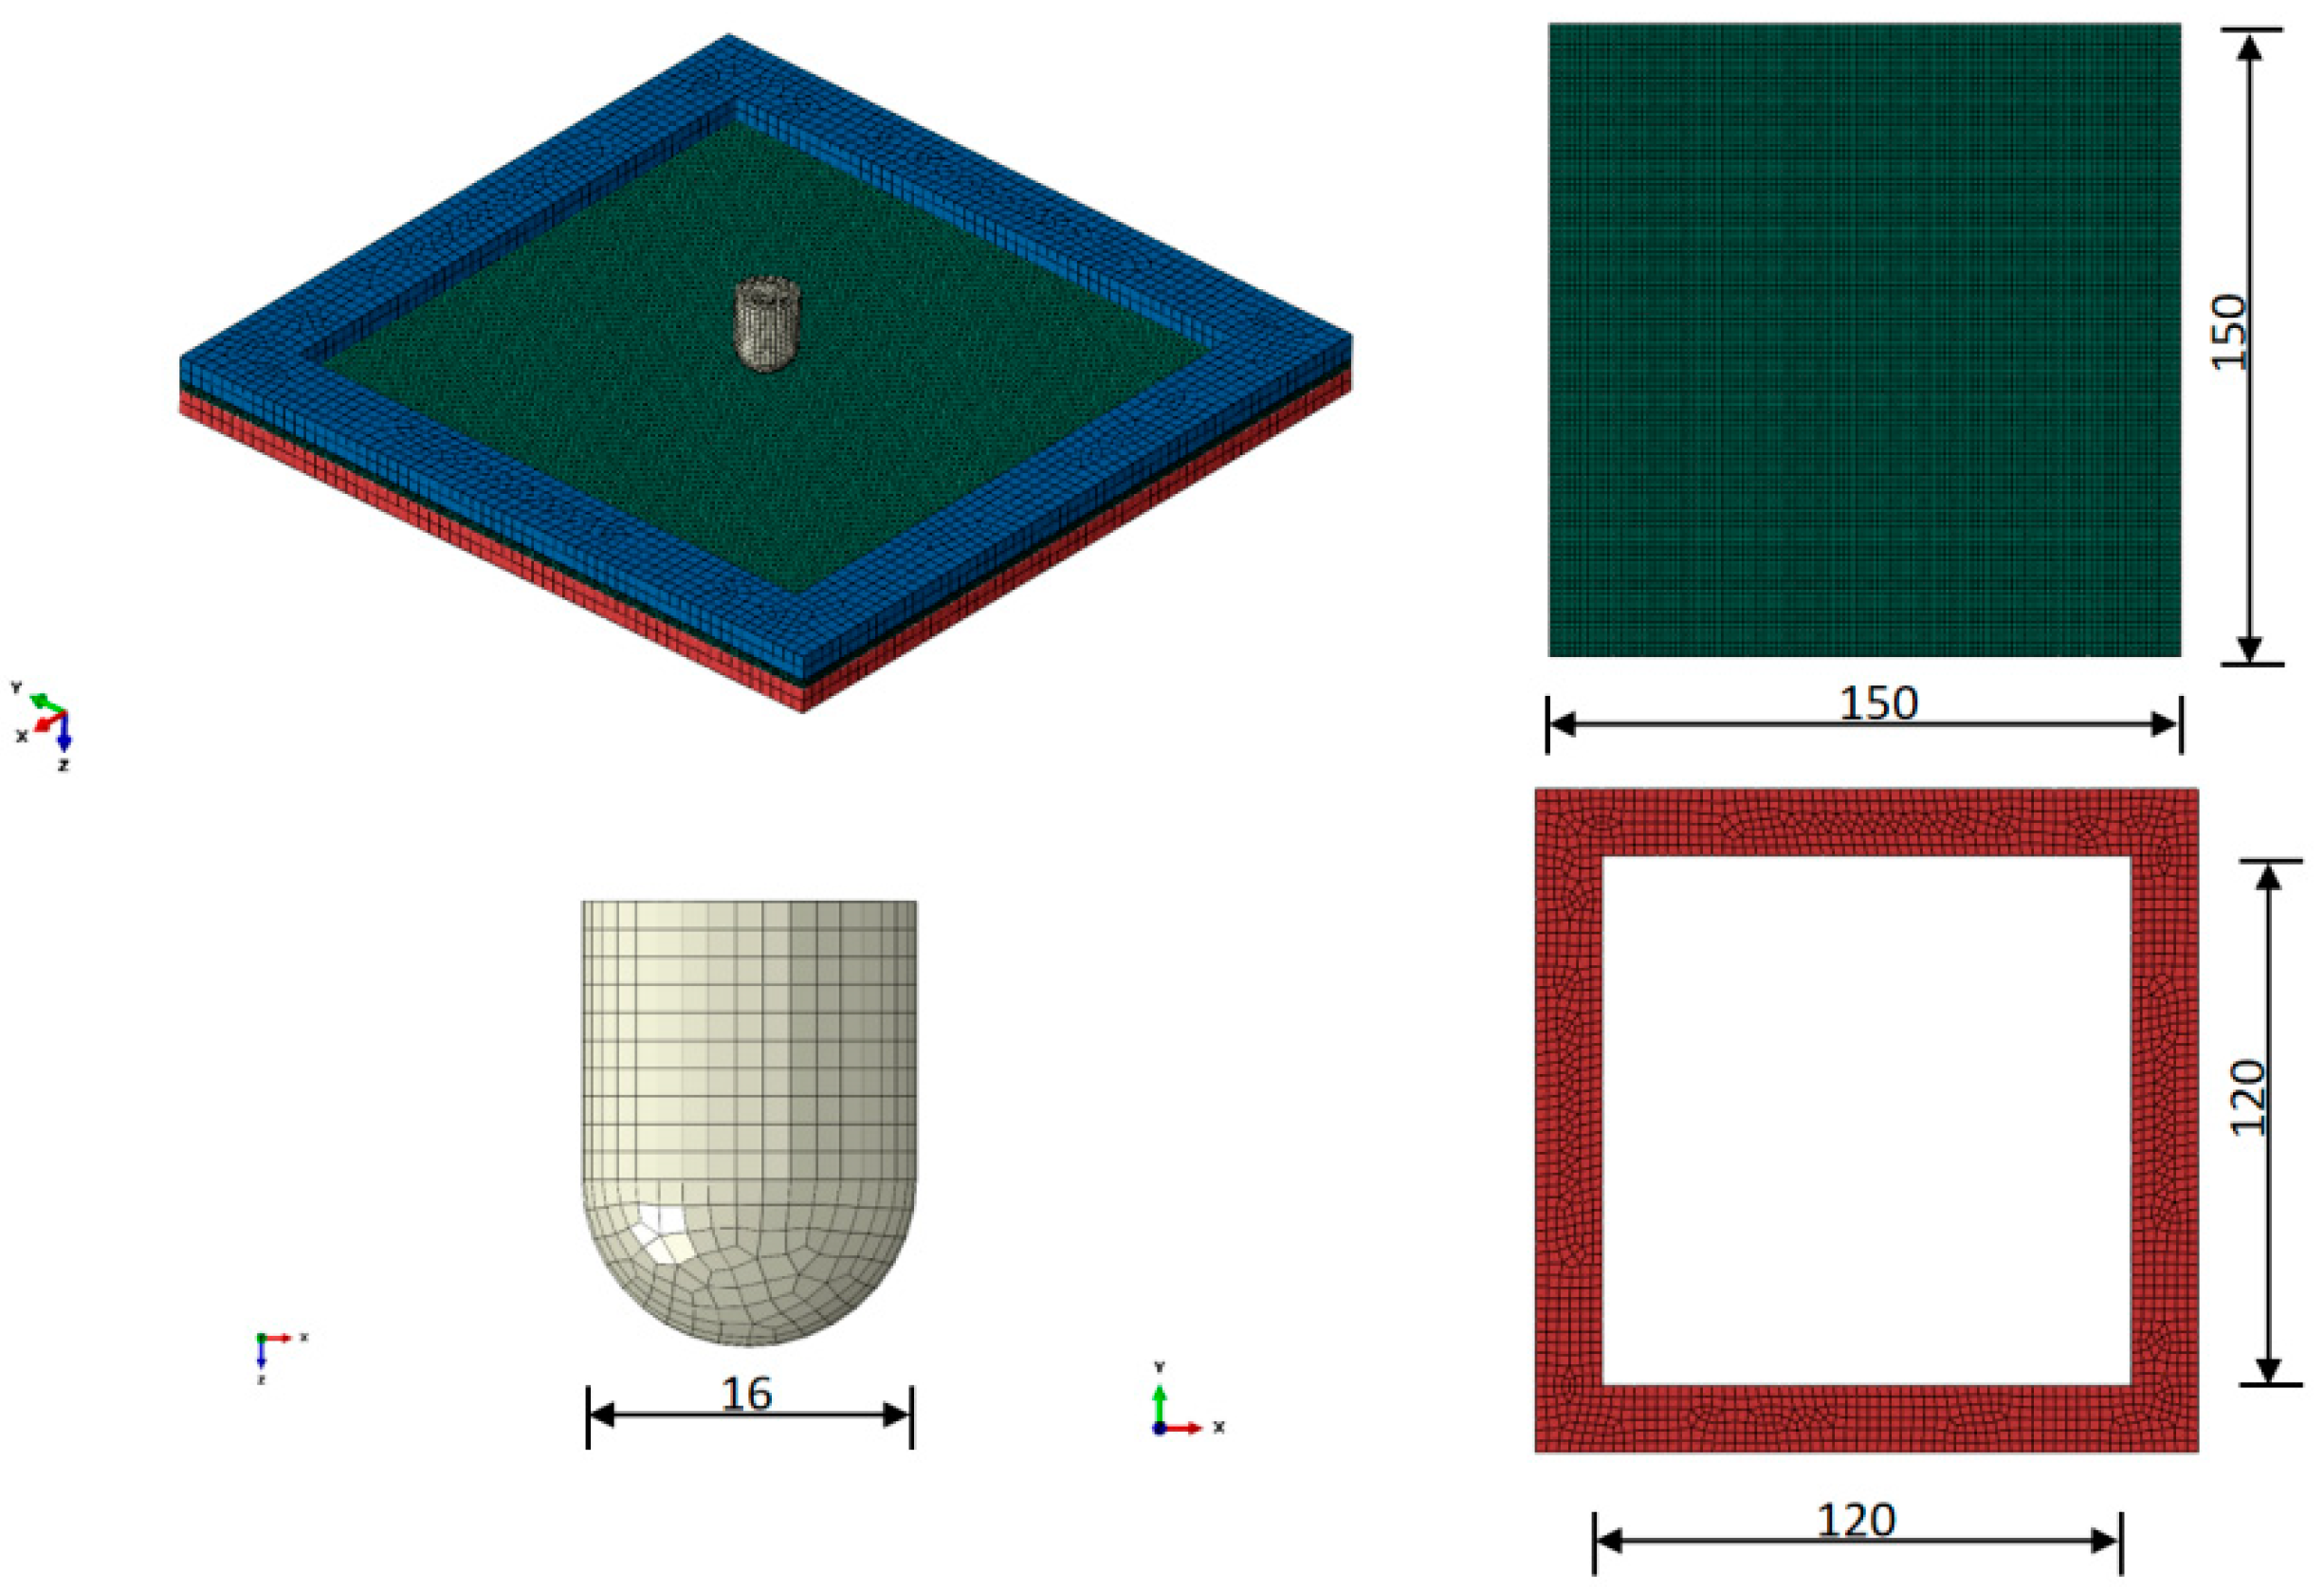
Figure 1. Simulation model.
Aerospace 12 01028 g001
Figure 2. Convergence analysis of simulation model.
Aerospace 12 01028 g002
Figure 3. Impact locations L1 to L9.
Aerospace 12 01028 g003
Figure 4. CLC-AI-type drop hammer impact testing machine.
Aerospace 12 01028 g004
Figure 5. Comparison of test and simulation impact force–time curves.
Aerospace 12 01028 g005aAerospace 12 01028 g005b
Figure 6. Displacement contour.
Aerospace 12 01028 g006
Figure 7. Longitudinal strain LE11 contour.
Aerospace 12 01028 g007aAerospace 12 01028 g007b
Figure 8. Strain response contours at different impact locations.
Aerospace 12 01028 g008aAerospace 12 01028 g008b
Figure 9. Strain response contours at different IEs.
Aerospace 12 01028 g009aAerospace 12 01028 g009b
Figure 10. Damage contours at different IEs.
Aerospace 12 01028 g010aAerospace 12 01028 g010b
Figure 11. Energy history plot.
Aerospace 12 01028 g011
Table 1. Mechanical properties of unidirectional CL [23].
ParameterValue
ρ/(g/cm3)1.792
E11/MPa121,000
E22/MPa9705
E33/MPa9705
ν120.245
ν130.245
ν230.3
G12/MPa4330
G13/MPa4330
G23/MPa3000
Xt/MPa1455.20
Xc/MPa739.20
Yt/MPa41.31
Yc/MPa96.80
S12/MPa43.92
S13/MPa43.92
S23/MPa43.92
Table 2. Mechanical properties of CL inter-laminar interface [23].
ParameterValue
E/GPa9.82
tn0/MPa20.87
ts0/MPa37
tt0/MPa37
GI/(N/mm)0.253
GII/(N/mm)1.035
GIII/(N/mm)1.035
Table 3. Mechanical properties of support structure and punch [23].
ParameterSupport StructurePunch
ρ/(g/cm3)2.807.83
ν0.330.27
E/GPa69193
Table 4. Simulation conditions.
Test NumberImpact LocationImpact Velocity (m/s)Punch Mass (kg)IE (J)
1L10.760, 1.155, 1.333,
1.491, 1.633, 1.764
4.501.30, 3.00, 4.00,
5.00, 6.00, 7.00
2L2
3L3
4L4
5L5
6L6
7L7
8L8
9L9
Table 5. Test conditions.
Test NumberImpact LocationImpact Velocity (m/s)Punch Mass (kg)IE (J)
1L20.7604.501.30
2L3
3L6
4L7
Table 6. Experiment results and simulation results.
Impact LocationExperiment ResultsSimulation ResultsError (%)
Impact Force/NPulse Widths/msImpact Force/NPulse Widths/msImpact Force/%Pulse Widths/%
L2121111.1124110.92.531.80%
L3135310.5143210.25.832.86%
L6129111.2126911.04.561.79%
L7135010.114119.64.554.95%
Disclaimer/Publisher’s Note: The statements, opinions and data contained in all publications are solely those of the individual author(s) and contributor(s) and not of MDPI and/or the editor(s). MDPI and/or the editor(s) disclaim responsibility for any injury to people or property resulting from any ideas, methods, instructions or products referred to in the content.