Abstract
In low-speed flow (Ma < 0.3), pressure-sensitive paint (PSP) technology encounters a significant bottleneck in micro-pressure measurements due to the coupled interference of light source instability, camera noise, and paint photodegradation. This study introduces a hardware–algorithm collaborative decoupling framework to address the light noise–degradation coupling issue. The framework integrates real-time light source fluctuation monitoring using a photomultiplier tube (PMT), a combined histogram–wavelet denoising algorithm, and a dynamic photodegradation compensation model. A high-precision static calibration system with a pressure control error of 3.4 Pa was constructed to validate the proposed framework. The experimental results indicate that light source fluctuations contribute an error of 42.61 Pa, accounting for 33% of the total error. After collaborative optimization, the PSP measurement error was reduced to below 50 Pa, representing a 50% improvement compared to previous results (100 Pa). This study provides reliable technical support for micro-pressure measurement applications, such as low-speed wind tunnel testing of aerospace vehicles and microfluidic diagnostics.
1. Introduction
In recent years, pressure-sensitive coating (PSP) has become the cornerstone of non-invasive full-field pressure measurement in experimental aerodynamics. Unlike MPX5010/MPXV5010G series (0.1% accuracy, 2 kHz sampling) and other point sensors, PSP provides high spatial resolution and complete surface visualization, which is an advantage of thin-load or high-load models (such as delta wings). In this case, it is impractical to use stick tape [1,2]. However, its application in low-speed and high-frequency unsteady flow is still hindered by temperature drift, illumination change, image registration error and paint photodegradation. Static correction strategies—such as witness point averaging or average image compensation—alleviate some problems, but when the model vibrates or the light field evolves, these strategies will fail. Frame-by-frame dynamic correction provides better adaptability without a predefined reference area, but system verification under low-speed and high-frequency excitation is still rare. Recent progress has greatly broadened the operating range of PSP. Wei et al. combined binocular photogrammetry with PSP on rotating blades, and achieved a displacement accuracy of 0.2 mm under pressure uncertainty of 700 Pa, demonstrating the real multi-physical ability [3]. Chen’s two-color PSP suppressed the temperature crosstalk in the impinging jet experiment [4], while Delgado used the fast response formula to capture the kilohertz pressure fluctuation on the IC3X aircraft with Mach number of 7.2 [5]. Under the condition of high subsonic speed, Huang and Chung drew an elliptic cavity flow diagram and quantified the influence of curvature on the pressure gradient [6]. Schubert et al. used phase-locked PSP/PIV to track the 500 Hz wake disturbance in the low-pressure turbine cascade and solved the unsteady pressure on the blade surface [7,8]. Despite these milestones, the gap still exists: most of the research studies described above focus on the experiments in unsteady or high-speed scenes, and no robust frame-by-frame error suppression method has been established specifically for low-speed and high-frequency conditions. The current work solves this demand. It is assumed that online image difference processing can reduce the error caused by illumination and vibration to less than 1% without a reference patch or static reference, thus extending the accuracy of PSP to low-speed and high-frequency areas. However, in the case of slight pressure fluctuation, in addition to the above reasons and regardless of temperature, the main error sources are also concentrated on the factors of noise and light attenuation of acquisition equipment.
However, in low-speed flows (Ma < 0.3), where pressure variations are minimal, the fluorescence intensity of PSP exhibits only small changes [9,10]. Under these conditions, four factors—temperature fluctuation, acquisition noise, unstable illumination, and paint photodegradation—significantly degrade PSP accuracy. While extensive research has been conducted on the mechanisms of temperature effects [11,12,13,14,15,16], the coupled quantification model for light source fluctuations, camera noise, and probe photodegradation remains unexplored. In low-speed flows, micro-pressure signals are easily masked by the combined interference of light-noise degradation, leading to PSP measurement errors exceeding 100 Pa [17]. Therefore, a thorough analysis of the factors affecting measurement accuracy and the implementation of effective measures to reduce measurement errors are fundamental and essential for enhancing the precision of PSP measurements in low-speed flow conditions.
In the existing research, Brown et al. [18,19] systematically sorted out the main error sources of pressure-sensitive paint (PSP) measurement in low-speed environments (with an incoming flow speed of <50 m/s), and accordingly implemented targeted improvement, raising the absolute accuracy to 70 Pa at 5 m/s. However, the error transmission mechanism and uncertainty components are not analyzed in its work. Bell et al. [20] focused on reducing the random and systematic errors in low-speed wind tunnel tests. By optimizing the experimental process and data processing methods, the systematic error was reduced from 0.06 Cp to 0.01 Cp, and the random error was reduced from 0.02 Cp to 0.005 Cp, which significantly improved the comprehensive accuracy of PSP measurement. Crafton et al. [9] further improved the excitation light source and imaging system from the hardware level, and suppressed the measurement deviation to about 100 Pa in the large wind tunnel.
In recent years, researchers have used modal decomposition to improve the quality of PSP data: Pastuhoff et al. [21] and Sugioka et al. [22] used POD/SVD for rank reduction and denoising of low-SNR images; Ali et al. [23] further separated the multi-frequency pressure field with DMD to verify its advantages in acoustic resonance measurement; Inoue and Matsuda et al. [24] used the combination of POD sparse reconstruction to realize the low-rank reconstruction of sub-kilopascal fluctuations in Carmen Vortex Street. However, all these works focus on dimensionality reduction or filtering of “back-end” image sequence, and do not suppress the coupling errors of “front-end” light source drift, camera noise, and dye bleaching in real time, which makes it difficult to break through the uncertainty of hectopascal level under micro-pressure conditions. The contribution of this paper is not to replace the above-described post-processing methods, but to build a complementary and necessary front-end and back-end integrated framework at the hardware–algorithm interface through the following steps: ① monitor the excitation light fluctuation in real time by PMT, and establish the error analysis of light source, gray level, and pressure; ② use histogram–wavelet joint denoising to suppress the camera and random noise in the image acquisition stage; ③ propose dynamic light degradation compensation based on attenuation ratio while the gray level of each frame is corrected frame by frame. Through the experiment of micro-pressure fluctuation, the total error of micro-pressure PSP is reduced from the traditional 100 Pa to 50 Pa. This study focuses on the PSP measurement front-end, hoping to solve the problem from the source and improve the measurement accuracy of PSP. Therefore, the method in this paper and the existing modal decomposition research are complementary to “upstream source treatment” and “downstream feature extraction”, and combining them is expected to further expand the application boundary of PSP at low speed, micro-pressure and unsteady flow.
Firstly, the instability of the light source introduces measurement errors, thereby affecting the accuracy of pressure measurements. Mendoza et al. [25] noted in their paper that an unstable light source can enhance interference factors such as background light and stray light, which in turn compromises the reliability of PSP measurements. Similarly, Wu et al. [26] found that light source stability significantly impacted the experimental results in their study of PC-PSP in low-pressure environments. Regarding acquisition device noise, Li et al. [27] analyzed the measurement deviations and pressure sensitivity of PSP technology and pointed out that the uncertainty in the luminescence efficiency of the probe molecules primarily depends on the camera’s resolution of gray-scale values. Additionally, the input–output relationship of a CCD camera is not linear, which can affect experimental results to some extent. Gao et al. [28] effectively mitigated the impact of camera non-linearity by collecting multiple images under each working condition and calculating their average values. Liao et al. [29] utilized deep learning networks to predict paint performance, thereby reducing measurement influences brought about by the calibration equipment itself. Since both light source stability and acquisition device noise contribute to changes in image gray-scale values [30], we monitored the light source stability using a PMT. Given that the light source’s inherent fluctuations make it difficult to quantify image gray-scale values, we employed a method of artificially amplifying these fluctuations to uncover underlying patterns and thus derive quantifiable data on measurement errors caused by light source fluctuations. To address image noise, we used a combined histogram-matching and wavelet transform-denoising approach. When it comes to precise measurements of small pressure variations, photodegradation can lead to significant deviations in measurement results. Li et al. [31] conducted a photodegradation analysis of domestic PSP during PSP calibration measurements and found a photodegradation rate of 4% per hour. In the case of minor pressure fluctuations, the subtle changes in gray-scale values can be masked or exacerbated by photodegradation, rendering pressure measurement results imprecise. To tackle this issue, this study proposes a new dynamic light compensation method based on the attenuation ratio, which can effectively reduce measurement errors and enhance measurement accuracy.
Therefore, we propose to analyze and improve the stability of the light source, acquisition device noise, and photodegradation through (1) real-time monitoring of light fluctuations using a photomultiplier tube (PMT); (2) combined histogram matching and wavelet denoising; (3) dynamic light compensation based on the attenuation ratio.
Compared with the existing research, the positioning and method of this paper in micro-pressure PSP measurement show differences and advantages. First of all, in the aspect of error coupling mechanism, this paper puts light source fluctuation, image noise, and light-induced attenuation into a unified framework and systematically analyzes their three main error sources, while the literature focuses on single-factor improvement and lacks multi-source interference collaborative modeling. Secondly, for light attenuation compensation, this paper proposes a frame-by-frame dynamic real-time compensation strategy based on attenuation rate, while the “witness film” method proposed by Lash et al. [32] and the unified correction method after static calibration by Zhu et al. [33] are not suitable for the change in light attenuation under micro-pressure conditions. Thirdly, in terms of hardware detection, this paper introduces photomultiplier tube (PMT) to monitor the fluctuation of light source in real time, and it is in strict synchronization with CCD image acquisition. Fourthly, in terms of calibration range, a high-precision static calibration platform with a system error of about 3.4 Pa can accurately control the change in micro-pressure, which is superior to the existing devices with large system error and with micro-pressure that is difficult to stably control. Finally, in the image denoising process, the joint algorithm of histogram matching and wavelet soft threshold is adopted to effectively suppress noise and keep the details complete. In this paper, the measurement error is controlled at 50 Pa in the range of 96–97 kPa and a room temperature of 50 Pa step. The photodegradation rate of 1.01% h−1 is calibrated to realize frame-by-frame attenuation proportional compensation, which provides ideas for improving the measurement accuracy of micro-pressure PSP.
Section 2 of this paper elucidates the theoretical equations for coupled error propagation and proposes a targeted photodegradation compensation model. Section 3 presents the experimental results of minor pressure fluctuations and illustrates the comparison before and after error reduction. Section 4 provides the conclusions.
2. Theoretical Methods
In the measurement of pressure-sensitive paint, the sensitivity of pressure-sensitive paint is defined as the change rate of relative fluorescence intensity caused by the change in unit pressure, which is used to measure its response ability and signal intensity. For experimental aerodynamics, the relationship between luminous intensity and air pressure can be described by a simple Stern–Volmer equation. The expressions of sensitivity and Stern–Volmer are as follows:
where represents the light intensity value of the reference image and represents the reference pressure; stands for image light forcing; and stands for measuring pressure [34]. represents the relative change in fluorescence intensity (that is, the change divided by the original intensity). represents the change in pressure.
2.1. Light-Noise Attenuation Coupled Error Propagation Equation
The total error adheres to the following relationship:
Given that is relatively small compared to the other quantities, it can be neglected. The temperature remains constant. Therefore, the aforementioned equation simplifies to:
The error is primarily attributable to three factors: light source fluctuation, equipment noise, and photodegradation. In the measurement of pressure-sensitive paint, a photomultiplier tube (PMT) is used to monitor the fluctuation of the light source, and the relationship between fluctuation and gray value is established. The fluctuation of the light source is the main cause of measurement error, but in practice it is difficult to determine the specific fluctuation based on observation alone. Therefore, this study uses PMT equipment to detect the light source, with the purpose of observing the fluctuation of the light source, analyzing its influence, and establishing the relationship between the fluctuation and the image gray value. In the experiment, PMT can collect the light source signal and output it in the form of voltage.
At the same time, when measuring PSP, the noise of the acquisition equipment will directly affect the PSP image, which will cause the gray value of the image to change randomly in a certain range and cause measurement errors. Therefore, the following relationship is used to describe the change, and the specific influence of equipment noise is evaluated through the change in gray value , in which the change in the camera’s gray value is described. At the same time, multiple images are collected under the same pressure for average processing, and histogram matching and wavelet transform are used in image post-processing to reduce the influence of equipment noise on PSP measurement.
In PSP measurement, the light attenuation of coatings is related to its own attenuation rate. The error between light attenuation and PSP pressure measurement can be described by Formula (8), where is the attenuation percentage, which will be described in detail below. Given that photodegradation cannot be overlooked in experiments involving minor pressure fluctuations, the photodegradation rate of the pressure-sensitive paint (PSP) is defined as the rate of change in luminous intensity under reference pressure, denoted as [34].
Herein, represents the reference pressure. Owing to the particularity of light compensation under minor pressure fluctuations, a detailed discussion is presented in the subsequent sections. To correct for the photodegradation phenomenon under minor pressure fluctuations, this study proposes a dynamic light compensation method based on the attenuation ratio, thereby enhancing the accuracy and consistency of measurements. We use a spatially unified light attenuation compensation method instead of pixel-by-pixel compensation. We generate an average image by regional pixel-level average of multiple images collected under the same pressure and calculate a uniform attenuation percentage based on the overall gray change in the image. Specifically, by comparing the changes in gray values measured before and after, we quantitatively analyze the influence of light attenuation, and then apply it to the whole image for compensation. The core concept of this compensation method is to precisely estimate the degree of photodegradation by calculating the percentage change in gray-scale values for each measurement image and to use this estimate as a correction factor. This factor is then applied to subsequent measurements by dynamically adjusting the gray-scale values of the current measurement images, thereby compensating for gray-scale fluctuations caused by attenuation. This method can effectively avoid the problem of local noise amplification that may be caused by pixel-by-pixel compensation while maintaining the overall consistency of the image, and is suitable for scenes with a high signal-to-noise ratio in their micro-pressure measurement. Specific instructions are as follows:
Let the mean gray-scale value of the current measurement reference image be denoted as ; for the subsequent image measurement, the mean gray-scale value of the reference image is denoted as :
Herein, represents the gray-scale value of the i-th pixel in the image; denotes the gray-scale value of the i-th pixel in the subsequent image; and is the total number of images. Based on the mean gray-scale values before and after the measurement, the attenuation percentage is calculated, which reflects the degree of gray-scale attenuation from the first measurement to the current measurement image. The attenuation percentage is employed as a correction factor to compensate for the gray-scale values in the next experimental image. The updated gray-scale value is given by
Herein, represents the mean gray-scale value of the current experimental image, while denotes the mean gray-scale value of the subsequent measurement experimental image. The overall experimental framework is illustrated in Figure 1.
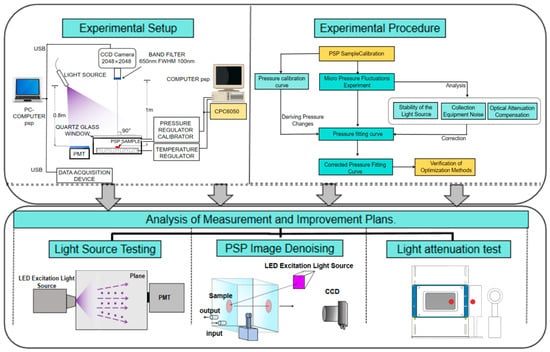
Figure 1.
Block diagram of micro-pressure fluctuation experiment.
2.2. Hardware–Software Collaborative Framework
In terms of experimental apparatus, the static calibration device constructed by ISSI Inc. in Santa Cruz, CA, the United States can achieve a relative error of 0.5% of the full scale within a wide pressure range (0 Pa–400 kPa) [35,36]. Shanghai Jiao Tong University expanded the pressure measurement range of the PSP static calibration system to 1 Pa–600 kPa [37], but the improvement in measurement accuracy was limited. For the aforementioned devices, although the pressure fluctuations can be controlled within a relatively small range, they still cannot effectively control minor pressure fluctuations. The hardware test system consists of a calibration chamber, a temperature regulation unit, a pressure regulation unit, a 16-bit scientific-grade CCD camera, a filter, and a measurement and control computer.
The calibration chamber measures 156 mm × 105 mm, with a semiconductor heating/cooling element on the outer side of the base plate and embedded temperature sensors to measure the temperature of the PSP sample. The chamber is equipped with gas pipelines connected to the outside, linked to a Kamoer pressure/vacuum pump to achieve internal pressure regulation and measurement, with a pressure regulation range of 9 kPa–251 kPa in absolute pressure. An optical viewport is designed on the calibration box for illumination by the excitation light source and collection of fluorescence images. The temperature regulation unit has a temperature control accuracy of 0.009 °C and a control range of 5–60 °C, meeting the strict temperature requirements for experimental environments. The principle of pressure control connection is shown in Figure 2. Pressure regulation is achieved through a relay controlling the air pump switch, manual directional valve, and high-pressure air provided by a gas storage tank, with the pressure sensor displaying the current pressure value. After incorporating a high-precision modular pressure controller (CPC6050), the control accuracy can reach 0.01% within the gauge pressure range of ±17 kPa, with the control accuracy for this experiment being approximately 3.4 Pa.
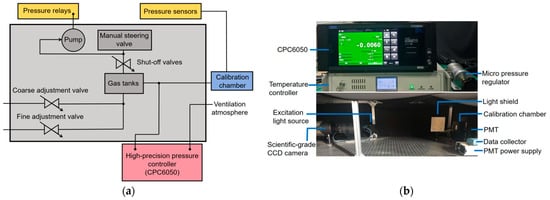
Figure 2.
(a) Pressure control schematic diagram; (b) Physical diagram of test equipment.
The software processing system includes sample calibration, image joint denoising, and dynamic photodegradation compensation. Sample calibration is based on the Stern–Volmer equation to convert changes in PSP image gray-scale values into pressure changes [38], comparing and analyzing the differences between PSP-measured pressure and sensor-displayed pressure. For image joint denoising, histogram matching adjusts the gray-scale distribution of the image to conform to a specific target gray-scale distribution, thereby enhancing the overall contrast and visual effect of the image [39]. Wavelet transform decomposes the image signal into different scales and frequencies, accurately identifying and removing noise components while preserving the key details and feature information of the image [40]. To address the photodegradation effect of the paint, a feasible dynamic photodegradation compensation strategy is studied and implemented. A mathematical model for photodegradation is established, and the luminescent characteristics of the paint are monitored in real time. Based on the model and monitoring data, relevant parameters in the image processing algorithm are dynamically adjusted to effectively compensate for measurement errors caused by photodegradation.
2.3. Experiment and Experimental Method of Micro-Pressure Fluctuation
To validate the light-noise attenuation coupled model, this study sequentially analyzed and proposed improvements for the light source, camera, and photodegradation. The enhancement effects before and after processing were compared, and the overall experimental scheme was verified. The pressure system connection diagram and the entire experimental setup are shown in Figure 2. Calibration tests were conducted on PSP samples using two constant PSP samples from the same batch. The samples used platinum (II) meso-tetra (pentafluorophenyl) porphyrin as the luminous molecule, with a polymer as the main component of the binder and dichloromethane as the main solvent. The temperature was controlled and kept at room temperature. The pressure scanning sequence was absolute pressure 50–75–100–125–150 kPa. Under different pressure conditions, a continuous and stable excitation light source was used to irradiate the PSP samples. The excitation light source was a high-precision stabilized LED placed approximately 1 m vertically from the calibration box to ensure uniform and stable excitation light on the sample surface. Nine images (with a 650 nm band-pass filter) were shot continuously with a scientific CCD camera. In the experiment, 100 kPa was selected as the reference pressure, and the corresponding gray value was selected as the reference gray value. The Stern–Volmer equation was used to fit the collected gray value and pressure value, and the sensitivity parameters were obtained. Simultaneously, a photomultiplier tube (PMT) was placed parallel to the calibration box to monitor the stability of the light source. During the experiment, both the PSP sample and the PMT were positioned at the center of the excitation light to avoid edge light collection by the PMT, thereby ensuring the accuracy of the measurement results [41]. A CCD camera was used to capture the luminescence intensity, with the camera fixed at an appropriate distance from the calibration box, at a 90° angle and along the central axis, to ensure the accuracy and consistency of the images.
During calibration, the system mainly included a pressure chamber, pressure controller (pressure pump-Kamoer, Shanghai, China, CPC6050-Wika, Frankfurt, Germany), temperature control module (semiconductor refrigeration chip-Anthone, Xiamen, China), light source (75% power; Prizmatix, Holon, Israel) and image acquisition (16-bit CCD camera-Princeton Instrument, Trenton, NJ, USA). The calibration process is as follows: A filter with a central wavelength of 650 nm was fixed at the front-end of the CCD camera lens via an adapter to filter out non-characteristic fluorescence and improve image quality. A total of five image gray-scale values were captured. The gray-scale value at 100 kPa was taken as the reference pressure, corresponding to the reference light intensity. Normalization was achieved by comparing the light intensity with that at the reference pressure, and the sensitivity of the PSP sample was ultimately obtained according to Equation (1). In the experiment of small pressure fluctuation, the pressure range is from 97 kPa to 96 kPa, and the step size is 50 Pa. In this range, 21 sets of data were collected. These data are randomly divided into a test set and a verification set. There are 13 data points in the test set and 8 data points in the verification set. This allocation method is based on the randomness of experiments and the availability of data. Firstly, if there are too few data points to fit the curve, it will introduce a large error, which will affect the accuracy of the fitted curve. If there are too many points to fit the curve, there will be too few points to verify the fitting curve, which is of little significance. Therefore, it is reasonable to adopt the principle of 1.5 times; that is, the fitting data points of the experimental set are about 1.5 times that of the verification set. In the test set, 96.45 kPa was selected as the reference pressure; in the validation set, 96.5 kPa was chosen as the reference pressure, with their corresponding gray-scale values serving as the reference light intensity. The measurement pressure was derived from the sensitivity of the PSP sample, and the difference between the measured pressure and the sensor-displayed pressure was observed. The main factors affecting measurement accuracy were analyzed and improved upon to reduce errors. Finally, the validation set was used to conduct repeatability tests on the optimized method.
3. Results
Figure 3 depicts the experimental image of the PSP sample at 50 kPa, with a focus on the central region of the sample. The sensitivity parameters of the PSP are obtained through calibration and fitting of this region. The right-hand image shows the gray-scale distribution of the central region, indicating that the gray-scale values are higher in the upper left, lower in the lower right, and relatively uniform in the middle within the yellow-framed area. Based on these characteristics, three representative locations were selected for in-depth analysis: Location 1 (upper left), Location 2 (middle), and Location 3 (lower right). The left-hand side of Figure 4 illustrates the changes in the average gray-scale values of the yellow-framed region under different pressures. The data were fitted using the Stern–Volmer equation, yielding the fitted curve shown in the right-hand image. The coefficient A in Stern–Volmer formula is 0.6510. The sensitivity of the sample was calculated to be 0.6510% per kPa. According to our calculations, the maximum absolute residual of linear residual of sensitivity is 0.01554, the maximum absolute relative residual is 2.35%, and the uncertainty of slope is . is about 0.9973. The specific test details are shown in Table 1.
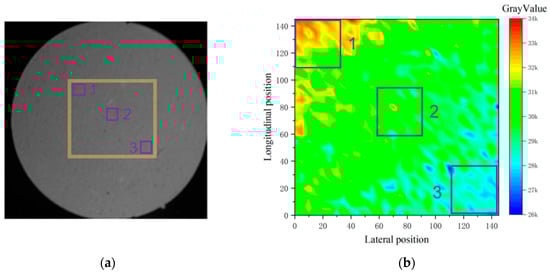
Figure 3.
(a) Local enlargement of sample; (b) Gray value map of corresponding area.
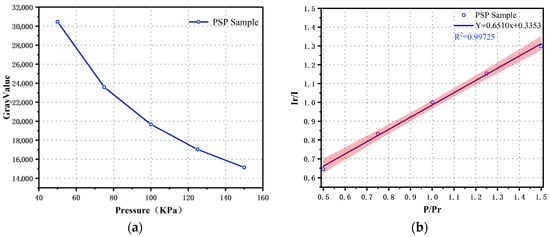
Figure 4.
(a) Gray value of PSP calibration test; (b) Calibration curve of PSP.

Table 1.
Calibration process.
In the minor pressure fluctuation test, the pressure was regulated from higher to lower values, with the core objective of differentiating between image intensity changes due to pressure variations and those resulting from the inherent photodegradation of the pressure-sensitive paint (PSP) [42]. Specifically, the pressure was decremented from 97 kPa to 96 kPa in steps of 50 Pa. During this process, once the pressure stabilized at each value, the pressure data recorded by the sensor were immediately captured, and nine consecutive, stable images were taken for analysis. After the normalization of the gray-scale values of the test set at different pressures, the results are shown in the left-hand side of Figure 5. The overall trend of the normalized gray-scale value curve aligns with theoretical expectations, but the linear correlation is weak, and there is a significant deviation from linearity. The right-hand side of Figure 5 presents the comparison curve between the PSP-measured pressure and the sensor-displayed pressure. The substantial discrepancy between the PSP-measured pressure values and the sensor-displayed pressure values indicates that the current PSP measurement error is relatively high, and the measurement accuracy requires further improvement.
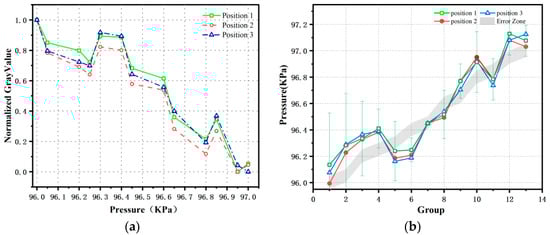
Figure 5.
(a) Normalized distribution of gray value of PSP image; (b) Fitting curve of measured pressure.
3.1. Minor Pressure Fluctuation Experiment
The PSP sample is excited by the light source, and fluctuations in the light source are directly reflected in the fluctuations of the image gray-scale values. Therefore, it is necessary to quantitatively analyze the changes in gray-scale values caused by light source fluctuations. Data collection of the UV light source after reaching thermal equilibrium is performed using a PMT to assess the stability of the light source.
In this study, the light source data were averaged over a specific period, with the duration of this process matched to the exposure time of the scientific-grade CCD camera [43]. The UV-LED excitation light source used in the experiment was positioned 1 m away from the PSP sample. Under thermal equilibrium conditions, the light source exhibited poor stability when operating at low power, which significantly impacted the fluctuations in the gray-scale values of the captured images, thus necessitating an analysis of light source fluctuations [44]. A PMT was employed to collect the light source signal and determine its maximum frequency. Using the PMT with a sampling frequency set at 1000 Hz, the light source signal was collected, with the results shown in Figure 6a. After applying median filtering, the variations in the signal became evident. The light source signal was then subjected to a fast Fourier transform (FFT). As can be seen from the Figure 6a, most of the energy is concentrated in the low-frequency region, particularly between 0 and 50 Hz. This indicates that the light source fluctuations are primarily composed of low-frequency components. With increasing frequency, the amplitude rapidly decreases, suggesting that high-frequency components are relatively scarce and that the maximum frequency of the light source is 8.3 Hz, which means that the sampling frequency can fully capture the light source signal. It can be seen from the experimental data in Figure 6c that the stability of the light source increases with the increase in the light source power. Especially in the range of increasing the power of the light source from 5% to 25%, the most remarkable enhancement of the stability of the light source is noticed. If the power exceeds 25%, the further increase in power will produce diminishing returns in terms of stability improvement. Although the closer to full power, the higher the stability, it can be seen from the data that 75% power is very close to 99% power stability, and in the case of 75% power, the gray value range of the image is more appropriate, and excessive light source power will lead to the gray value of the image in a higher area. Therefore, considering the safety and reliability of the experiment, follow-up research is carried out with a light source power of 75%.
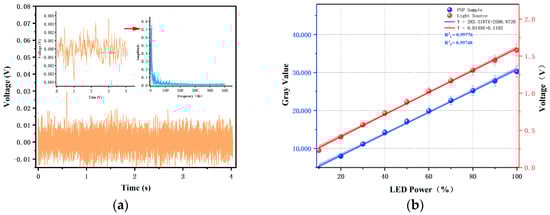
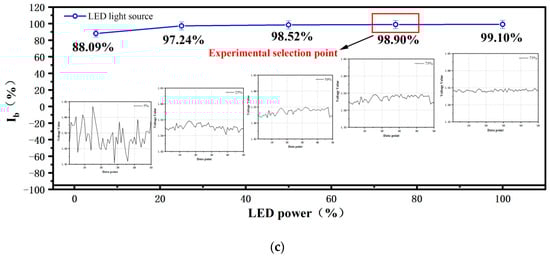
Figure 6.
(a) Light source signal acquisition and Fourier transform; (b) Relationship diagram between light source signal and power; (c) Stability under different power.
In order to analyze the light source and obtain specific data about the influence of light source on the image gray value and pressure error, this study manually adjusted the light source power from 10% to 100%, measured and recorded the gray-scale values of the samples under different powers, and plotted the fitted curve of gray-scale values versus light source intensity (see the right-hand side of Figure 6). Concurrently, by adjusting the light source power and capturing images, the gray-scale values of the images and the measurement data from the photomultiplier tube (PMT) were synchronously obtained (see the left-hand side of Figure 6). The purpose of this was to check the relationship between the gray value of the PSP sample and the PMT data. As can be seen from Figure 6b, there is a good linear relationship between the gray value of the sample and PMT data; that is, the fitting curve rises and falls at the same time, and from the PMT data, we can determine the change in the gray value of the sample caused by the light source.
As depicted in Figure 6c, with the increase in light source power, both the image gray-scale values and the voltage data collected by the PMT rise correspondingly. The slopes obtained from the linear fitting of the image data are 0.0149 and 283.3187. Given the brief illumination duration and minimal photodegradation throughout the process, these factors can be neglected. Because there is an obvious linear relationship between the PMT data of light source and the gray value of image in Figure 6b, a constant value can be obtained by comparing the two slopes, which has been used as a bridge to establish that PMT collects the fluctuation data of the light source and affects the gray value of the image. Through calculation, the constant value is about 1.9 W. In the image captured by the PSP sample’s tiny pressure fluctuation test, the difference between gray values is about 158.5 (equivalent to about 131.66 Pa). During this test, PMT is used to collect data when the light source reaches thermal balance. After analysis, the fluctuation range of the data is 0.0027 (Table 2), so the fluctuation of the gray value calculated according to the proportional relationship is about 51.3 (equivalent to 42.61 Pa). Therefore, the fluctuation of light source stability accounts for about one-third of the total gray value change. These data show that understanding the influence of light source power on its stability and the relationship between light source stability and gray value fluctuation can quantify the specific influence of the light source on the slight pressure change in PSP. In addition, in order to further reduce the measurement error, it is necessary to further optimize the image quality to reduce the measurement error in the low-speed flow field.
Table 2.
Gray value and PMT data fluctuation.
3.2. Analysis of the Impact of Image Noise
Figure 7 illustrates the noise in the captured images. Experimental observations reveal that there are fluctuations in the gray-scale values between adjacent images. These fluctuations inevitably introduce errors into the measurement process based on pressure-sensitive paint (PSP). Therefore, it is crucial to conduct an in-depth analysis of image noise and other related factors to reduce the amplitude of gray-scale value fluctuations and thereby minimize measurement errors, enhancing the accuracy and reliability of PSP-based measurements.
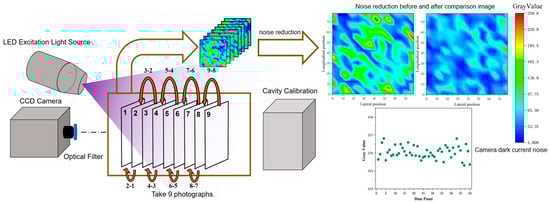
Figure 7.
PSP picture shooting and denoising and camera dark current noise.
During the PSP image acquisition process, camera noise is directly reflected in the fluctuations in the gray-scale values of the PSP images [45]. The presence of these noise sources causes the images to exhibit different gray-scale values at different time points, thereby affecting the precision and stability of the image data. This is particularly problematic in experiments requiring high-precision image analysis, where such fluctuations can directly interfere with the reliability of the experimental results. First, the dark current noise of the camera is assessed. As shown in the lower right of Figure 7, the dark current noise of the CCD camera itself is relatively small. One of the key steps in using PSP to measure pressure is to decode the pressure from the images, and fluctuations in gray-scale values may mask pressure fluctuations, especially in low-speed environments where pressure changes are minimal. The 16-bit CCD camera used in this study has a quantum efficiency of over 90% in the wavelength range of 500 nm to 650 nm.
Additionally, to further control the impact of exposure time on image quality, the camera’s exposure time was set to 220 ms. After setting a stable light source and exposure time, 50 consecutive images of the sample were captured under the same pressure conditions. According to the experimental results, the average gray-scale value of the images was approximately 1.76 W. Figure 8 shows the variations in gray-scale values among all images, reflecting the fluctuation trend of gray-scale values over time. It is evident from the figure that the overall gray-scale value curve exhibits an up-and-down fluctuation. Although the fluctuations between some adjacent images are small, the gray-scale values fluctuate significantly overall. This indicates that even under relatively stable light source and exposure conditions, noise still exists and has a significant impact on the stability and repeatability of the images. Therefore, it is necessary to further optimize the experimental data using noise reduction algorithms to minimize the interference of noise on the images and improve the reliability and stability of the experimental results. In the specific implementation, histogram matching and wavelet transform processing were successively applied to the original images.
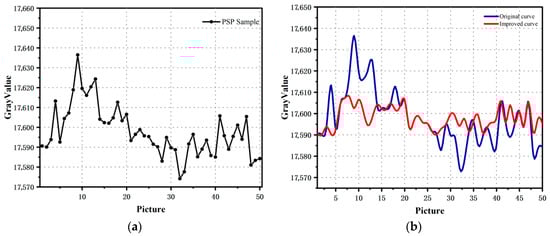
Figure 8.
(a) Gray value distribution of 50 images; (b) Contrast image before and after denoising.
To address the fluctuations in the images, histogram matching and wavelet transform were employed for denoising [46]. The gray-scale range of the captured images in this study spans from 1 to 65,536. The first image was used as the reference image, and the gray-scale histograms of the subsequent eight images were calculated in relation to the reference image. Through this approach, the gray-scale value distribution of the PSP images was adjusted, thereby reducing the gray-scale fluctuations between the original images. The wavelet transform was conducted using the sym4 wavelet type, with three levels of decomposition and a threshold of 0.2. High-frequency noise and unnecessary details in the images were effectively suppressed, while the main structural information of the images was preserved. Consequently, the gray-scale fluctuations between different images were further reduced, and the overall consistency of the images was enhanced. For the wavelet transform, nine captured images were selected as the processing objects, and the gray-scale distributions of eight of these images were transformed according to the characteristic pattern of the first image. The wavelet transform can separate the signal from the noise. Through processing at different scales, it can remove the noise components in the images to a certain extent, thereby stabilizing the gray-scale values of the images and providing a more reliable data basis for the subsequent pressure decoding based on the images.
Therefore, the combination of histogram matching and wavelet transform, leveraging the complementary strengths of both methods, further optimized the gray-scale consistency of the images. Specifically, histogram matching first adjusted the gray-scale distribution of the images to reduce the global gray-scale differences between them. The wavelet transform then further smoothed the high-frequency fluctuations and local inconsistencies in the images through multi-scale decomposition. The combination of these two methods more effectively eliminated the gray-scale fluctuations between the images. Applying the aforementioned methods to the images in the minor pressure fluctuation test experiment aimed to reduce the gray-scale fluctuations in the PSP images, thereby improving the quality of the images.
These methods effectively smoothed the noise in the images while preserving key image details. As can be clearly seen from the experimental results in Figure 9, the linearity of the processed images was significantly improved. If data with errors within 50 Pa are defined as valid points, the data validity rate increased from 10.26% to 38.26%. The improvement in linearity means that the relationship between the image gray-scale values and the actual pressure changes became more stable and consistent. The PSNR before and after processing was 46.02 dB, and the SSIM was 0.99. This improvement enhances the precise measurement of minor pressure changes. Additionally, the sensitivity of the PSP was further enhanced after image processing. This indicates that the PSP sample, after denoising, could more sensitively respond to minor pressure fluctuations.
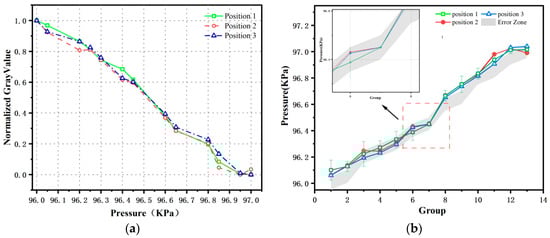
Figure 9.
(a) Normalized data of PSP samples after image denoising; (b) Fitting curve of measured pressure.
3.3. Analyzing the Effects of Light Attenuation
During the experimental process, a systematic photodegradation assessment of the PSP sample was conducted. The detailed examination of photodegradation characteristics aimed to obtain crucial data to provide a scientifically sound basis for attenuation compensation in subsequent measurements. In the experimental analysis stage, the photodegradation characteristics of PSP samples were deeply studied by controlling the pressure to be constant. The experimental results are as follows: in 0–10 min, the average gray value decreases by about 0.18%, the attenuation ratio C is about 0.0018, and the attenuation is slightly faster in the initial stage. From 0 to 0–30 min, the average gray value decreases by about 0.52%, and the attenuation ratio is about 0.0052, which is close to the linear segment. From 0 to 0–60 min, the average gray value decreases by about 1.01%, and the attenuation ratio is about 0.0101, which is a linear fitting slope. Figure 10 illustrates the state of the PSP sample during the photodegradation test, with a test duration set at 1 h and sample light intensity data collected every 5 min. Figure 11 clearly demonstrates the light intensity variation pattern of the sample under constant light source conditions (consistent with the light source intensity used in the minor pressure fluctuation test). It is evident from the Figure 11 that the PSP sample exhibits significant photodegradation characteristics, which display a certain linear relationship over a longer time scale. The right-hand side of Figure 11 indicates that the photodegradation rate of the PSP sample is approximately 1.01% per hour. Although Figure 11 depicts the PSP sample’s response to pressure changes, given that the total duration of this experiment was less than 1 h and considering the red-framed area in the left-hand Figure 11, it is clear that photodegradation does not strictly follow a linear pattern. Therefore, it is not appropriate to directly use this linear relationship for simplified compensation of photodegradation, as this could lead to deviations in the compensation results. In this study, the light compensation under pressure variation conditions was designed to correct the interference of photodegradation on the measurement results to a certain extent, thereby enhancing the accuracy and reliability of the measurement data and ensuring that the subsequent pressure analysis based on PSP measurements is more scientific and credible.
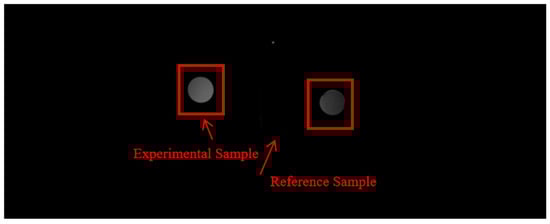
Figure 10.
PSP reference sample placement position.
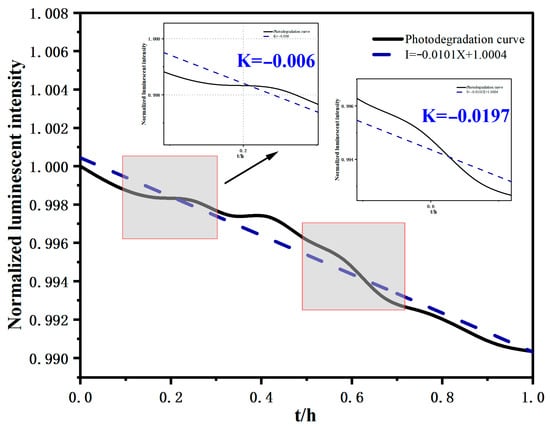
Figure 11.
Light attenuation rate curve.
It is noteworthy that even during the minor pressure fluctuation test experiment for PSP, where a light shield was employed to significantly reduce the exposure time of the sample to the light source, the photodegradation characteristics of the sample still had a pronounced impact on the PSP test results during the data acquisition phase. Therefore, in addition to the normal PSP pressure test samples, a reference PSP sample was also placed outside the calibration chamber. The changes in the gray-scale values of the reference sample, as illustrated in Figure 12, indicate that under the pressure variation range of 97 kPa to 96 kPa, the sample exhibited a significant photodegradation characteristic, with a gray-scale value decrease of approximately 0.2% over time. This phenomenon clearly demonstrates that photodegradation is a crucial factor affecting the accuracy of PSP test results, and its impact cannot be entirely avoided even with certain light shielding measures in place.
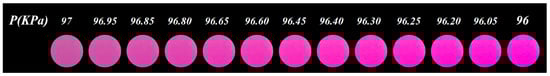
Figure 12.
PSP sample change chart.
To address the photodegradation characteristics during minor pressure fluctuations, a dynamic light compensation method based on the attenuation ratio was employed. This compensation method effectively minimizes the interference of photodegradation effects on the experimental results, allowing the gray-scale changes in the images to more accurately reflect pressure variations. Figure 13 illustrates the changes in the PSP sample. Figure 14 shows the comparison of the PSP image gray-scale values and pressure fitting curves before and after photodegradation compensation. The results indicate a significant improvement in the agreement between the compensated PSP-measured pressure data and the pressure data displayed by the sensor, demonstrating the effectiveness of the compensation measures. Additionally, the data show that during minor pressure fluctuation measurements, the measurement error of PSP was effectively controlled within 50 Pa.
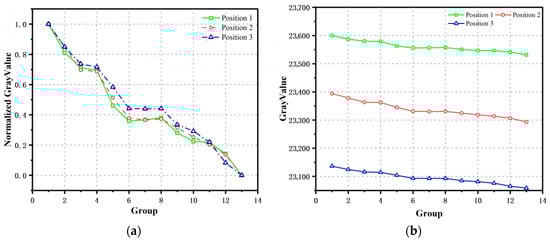
Figure 13.
(a) Normalized data of light attenuation of PSP reference samples; (b) Gray value of PSP reference sample.
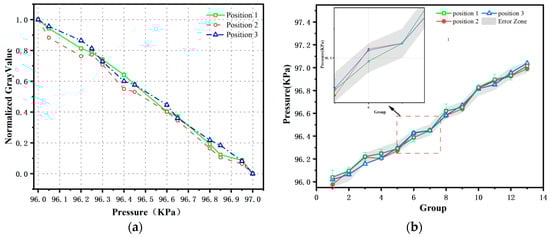
Figure 14.
(a) Normalized data of PSP samples after light attenuation compensation; (b) Fitting curve of measured pressure.
3.4. Verify the Result
To verify the repeatability of the aforementioned image processing methods and the accuracy of the light compensation measures, the images in the validation set were processed and analyzed. The validation set comprises eight groups of data. The left-hand side of Figure 15 illustrates the normalized gray-scale value curves corresponding to pressure changes, which exhibit good linearity and clearly reflect the trend of gray-scale values varying with pressure. Utilizing the Stern–Volmer equation, the gray-scale value data were converted into pressure data. The comparison between the calculated pressure data and the pressure data measured by the pressure sensor is shown in the right-hand side of Figure 15. The results indicate that the pressure error at all measurement points was controlled within 50 Pa, thereby fully validating the repeatability and accuracy of PSP measurements for minor pressure fluctuations.
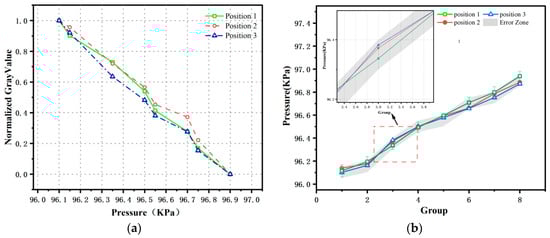
Figure 15.
(a) PSP sample normalized data; (b) Fitting curve of measured pressure.
The application of image denoising and photodegradation compensation progressively reduces the measurement errors, ultimately confining all errors within 50 Pa. This validation underscores the effectiveness of the denoising and photodegradation compensation measures.
4. Conclusions
This paper presents the development of a high-precision static calibration system for pressure-sensitive paint (PSP), capable of precisely regulating minor pressure fluctuations and conducting high-precision measurements. The focus of this study is to investigate the response characteristics of PSP to pressure changes under specific conditions and to conduct a detailed analysis of the PSP measurement process, including light source stability, noise interference during measurement, and photodegradation characteristics. An error model has been quantified, and the effects of light source stability and acquisition device noise have been decoupled to obtain specific numerical values of their impacts. Through a series of improvements and optimizations, the measurement accuracy of PSP in minor pressure fluctuations has been enhanced. The specific conclusions are as follows:
- Hardware level: The high-precision static calibration system enhances the control accuracy and stability of the equipment under minor pressure fluctuations. With a system pressure error of 3.4 Pa, it can precisely regulate minor pressure changes and simulate low-speed flow environments.
- Algorithm level: Fluctuations in image gray-scale values often have adverse effects on measurement outcomes. To address this issue, a combined denoising algorithm utilizing histogram matching and wavelet transform was proposed and applied. Through multiple processing techniques, the algorithm significantly reduced gray-scale value fluctuations in the images, thereby preventing noise interference from masking the PSP response. The study also introduced a feasible photodegradation compensation strategy, namely a dynamic light compensation method based on the attenuation ratio, which effectively minimized the interference of photodegradation on PSP measurement results and enhanced the reliability of the experiments.
- Quantification of light source fluctuation impact: A detailed analysis of the light source was conducted, and the impact of light source fluctuations was quantified using a combined measurement approach. The light source fluctuations were found to contribute an error of 42.61 Pa, accounting for 33% of the total error.
Ultimately, through quantitative analysis of influencing factors, refinement of measurement methodologies, and the implementation of image denoising and photodegradation compensation, the measurement error was effectively controlled within 50 Pa. This led to a significant enhancement in the resolution of steady-state pressure-sensitive paint (PSP) for minor pressure fluctuations. In future research endeavors, we will further investigate the relationship between temperature and the aforementioned sources of measurement error. Additionally, addressing the critical issues in the image processing segment of PSP measurements, we will introduce deep learning algorithms. By optimizing algorithm architectures and training strategies, we anticipate a substantial improvement in the efficiency and accuracy of image denoising. We plan to apply the aforementioned research findings to specific low-speed wind tunnel experiments, where we will further validate the practical effectiveness of the error correction model and deep learning algorithms in enhancing the accuracy of model surface pressure measurements. Further research on the attenuation of a light source can expand the measurement range and study its non-linear characteristics. The research on wind tunnel vibration and expanding the range of measuring light attenuation all need to be promoted in the follow-up work. At present, researchers are focused on studying the factors that affect PSP measurement under ideal conditions, and the limitations of a high-precision pressure controller: the experiments in this paper were all carried out under strict constant-temperature conditions (26 ± 0.009 °C). Our purpose was to study the coupling influence of light source fluctuation, camera noise, and photobleaching on the measurement accuracy of micro-pressure PSP under the premise of eliminating temperature interference, and to realize the source control of micro-pressure error. In this paper, pressure decoupling is not tried under the condition of temperature change, but is studied under a constant-temperature environment, and the temperature is fixed as the control variable, focusing on improving the signal-to-noise ratio and stability of PSP system in an ideal thermal environment. In practical engineering applications, the temperature field is often uneven and dynamic. At this time, it is necessary to introduce temperature-sensitive paint (TSP) or adopt a two-component PSP-TSP joint measurement scheme to realize the joint decoupling of temperature and pressure, so as to truly reach the application stage.
The improvement of this technology provides ideas for improving the application of PSP in a low-speed wind tunnel. In the field of microfluidics, it can provide a pressure measurement method without contact and full-field imaging. For PSP images, a real-time and uniform compensation method is proposed. This will lay a solid theoretical and practical foundation for the widespread application of PSP technology in aerospace, biological micro-pressure measurement [47] automobile industry and other fields.
Author Contributions
Experimental operation, K.C. and Q.L.; writing—original draft preparation, K.C.; data acquisition, Q.L.; data processing, C.W.; methodology, C.W.; Result verification, Y.B.; writing—review and editing, Y.B.; project administration, L.L.; supervision, L.L. All authors have read and agreed to the published version of the manuscript.
Funding
This research was supported by the National Natural Science Foundation of China under Grant, with the support number of [12202476].
Data Availability Statement
The data that support the findings of this study are available on request from the corresponding author, upon reasonable request.
Conflicts of Interest
The authors declare no conflicts of interest.
References
- Abdolahipour, S.; Mani, M.; Taleghani, A.S. Pressure Improvement on a Supercritical High-Lift Wing Using Simple and Modulated Pulse Jet Vortex Generator. Flow Turbul. Combust. 2022, 109, 65–100. [Google Scholar] [CrossRef]
- Shams Taleghani, A.; Ghajar, A. Aerodynamic characteristics of a delta wing aircraft under ground effect. Front. Mech. Eng. 2024, 10, 1355711. [Google Scholar] [CrossRef]
- Wei, C.; Zuo, C.; Liao, X.; Li, G.; Jiao, L.; Peng, D.; Liang, L. Simultaneous Pressure and Displacement Measurement on Helicopter Rotor Blades Using a Binocular Stereophotogrammetry PSP System. Aerospace 2022, 9, 292. [Google Scholar] [CrossRef]
- Chen, W.-C.; Huang, C.-Y.; Tan, K.-T.; Sakaue, H. The Development and Application of Two-Color Pressure-Sensitive Paint in Jet Impingement Experiments. Aerospace 2023, 10, 805. [Google Scholar] [CrossRef]
- Delgado Elizondo, V.; Dhanagopal, A.; Combs, C.S. Fast-Responding Pressure-Sensitive Paint Measurements of the IC3X at Mach 7.2. Aerospace 2023, 10, 890. [Google Scholar] [CrossRef]
- Huang, Y.-X.; Chung, K.-M. Global Surface Pressure Pattern for a Compressible Elliptical Cavity Flow Using Pressure-Sensitive Paint. Aerospace 2024, 11, 159. [Google Scholar] [CrossRef]
- Schubert, T.; Kožulović, D.; Bitter, M. Characterization of the endwall flow in a low-pressure turbine cascade perturbed by periodically incoming wakes, Part 1: Flow field investigations with phase-locked particle image velocimetry. Aerospace 2024, 11, 403. [Google Scholar] [CrossRef]
- Schubert, T.; Kožulović, D.; Bitter, M. Characterization of the Endwall Flow in a Low-Pressure Turbine Cascade Perturbed by Periodically Incoming Wakes, Part 2: Unsteady Blade Surface Measurements Using Pressure-Sensitive Paint. Aerospace 2024, 11, 404. [Google Scholar] [CrossRef]
- Crafton, J.; Fonov, S. Development of Pressure-Sensitive Paint Systems for Low Speed Flows and Large Wind Tunnels. In Proceedings of the 51st AIAA Aerospace Sciences Meeting, AIAA 2013-0078, Grapevine, TX, USA, 7–10 January 2013; American Institute of Aeronautics and Astronautics: Reston, VA, USA, 2013. [Google Scholar]
- Mitsuo, K.; Nakakita, K.; Kurita, M. Application of Pressure-Sensitive Paint to Low-Speed Wind Tunnel Testing at Japan Aerospace Exploration Agency. In Proceedings of the 24th International Congress of the Aeronautical Sciences, Yokohama, Japan, 29 August–3 September 2004. [Google Scholar]
- Schanze, K.S.; Carroll, B.F.; Korotkevitch, S.; Morriss, M.J. Temperature Dependence of Pressure Sensitive Paints. AIAA J. 1997, 35, 306–310. [Google Scholar] [CrossRef]
- Jiao, L.; Liu, X.; Shi, Z.; Zhang, W.; Liang, L.; Chen, X.; Zhao, Q.; Peng, D.; Liu, Y. A Two-Dimensional Temperature Correction Method for Pressure-Sensitive Paint Measurement on Helicopter Rotor Blades. Exp. Fluids 2020, 61, 104. [Google Scholar] [CrossRef]
- Qiao, P.; Wu, J.; Huang, H.; Li, G.; Li, D.; Du, H. Experimental Investigation on Temperature Effects of Cryogenic Pressure-Sensitive Paint. Aerospace 2025, 12, 329. [Google Scholar] [CrossRef]
- Egami, Y.; Fuji, K.; Takagi, T.; Matsuda, Y.; Yamaguchi, H.; Nimi, T. Reduction of Temperature Effects in Pressure-Sensitive Paint Measurements. AIAA J. 2013, 51, 1656–1660. [Google Scholar] [CrossRef]
- Kurihara, D.; Sakaue, H. Temperature Dependency Model in Pressure Measurement for the Motion-Capturing Pressure-Sensitive Paint Method. Sensors 2023, 23, 9714. [Google Scholar] [CrossRef] [PubMed]
- Peng, D.; Gu, F.; Zhong, Z.; Liu, Y. Thermal Stability Improvement of Sprayable Fast-Responding Pressure-Sensitive Paint for Measurement above 100 °C. Chin. J. Aeronaut. 2023, 36, 320–326. [Google Scholar] [CrossRef]
- Yamashita, T.; Sugiura, H.; Nagai, H.; Asai, K.; Ishida, K. Pressure-Sensitive Paint Measurement of the Flow around a Simplified Car Model. J. Vis. 2007, 10, 289–298. [Google Scholar] [CrossRef]
- Dong, Z.; Liang, L.; Zhang, W.G.; Jiao, L.; Peng, D.; Liu, Y. Simultaneous Pressure and Deformation Field Measurement on Helicopter Rotor Blades Using a Grid-Pattern Pressure-Sensitive Paint System. Measurement 2020, 152, 107359. [Google Scholar] [CrossRef]
- Brown, O.C. Low-Speed Pressure Measurements Using a Luminescent Coating System; NASA Technical Report TM-2000-209863; Stanford University: Stanford, CA, USA, 2000. [Google Scholar]
- Bell, J.; Mehta, R.; Schairer, E.; Hand, L.; Nixon, D. Low Speed PSP Testing in Production Wind Tunnels. In Proceedings of the 6th Annual Pressure Sensitive Paint Workshop, Washington, DC, USA, 6–8 October 1998. [Google Scholar]
- Pastuhoff, M.; Yorita, D.; Asai, K.; Alfredsson, P.H. Enhancing the signal-to-noise ratio of pressure-sensitive paint data by singular value decomposition. Exp. Fluids 2016, 57, 45. [Google Scholar] [CrossRef]
- Inoue, T.; Matsuda, Y.; Ikami, T.; Nonomura, T.; Egami, Y.; Nagai, H. Data-driven approach for noise reduction in pressure-sensitive paint data based on modal expansion and time-series data at optimally placed points. Phys. Fluids 2021, 33, 077105. [Google Scholar] [CrossRef]
- Ali, M.Y.; Pandey, A.; Gregory, J.W. Dynamic mode decomposition of fast pressure-sensitive paint data. Sensors 2016, 16, 862. [Google Scholar] [CrossRef]
- Inoue, T.; Ikami, T.; Egami, Y.; Nagai, H.; Naganuma, Y.; Kimura, K.; Matsuda, Y. Data-driven optimal sensor placement for high-dimensional system using annealing machine. Mech. Syst. Signal Process. 2023, 188, 109957. [Google Scholar] [CrossRef]
- Mendoza, D.R. Limiting Mach Number for Quantitative Pressure-Sensitive Paint Measurements. AIAA J. 2007, 45, 1053–1056. [Google Scholar]
- Wu, J.; Kong, D.; Zhang, P.; Huang, F.; Cai, G. Characterization of Pressure-Sensitive Paint Based on Mesoporous Silica Particles under Near-Vacuum Conditions. Sens. Actuators A 2021, 330, 112844. [Google Scholar] [CrossRef]
- Le Bourgeois, J.; Merienne, M.-C.; Sakaue, H. A Temperature-Corrected Ruthenium and Inorganic Phosphor-Based Fast-Responding Pressure Sensitive Paint. Sensors 2022, 22, 1386. [Google Scholar]
- Gao, L.; Ouyang, B.; Jiang, H.; Ge, N.; Li, R. Experimental Study on Cut-Off Frequency of Fast Response Pressure Sensitive Paint. Acta Aeronaut. Astronaut. Sin. 2023, 44, 27556. [Google Scholar]
- Liao, X.; Wei, C.; Zuo, C.; Gao, Z.; Jiang, H.; Liang, L.; Li, Z. Pressure Sensitivity Prediction and Pressure Measurement of Fast Response Pressure-Sensitive Paint Based on Artificial Neural Network. Sensors 2023, 23, 1362. [Google Scholar] [CrossRef]
- Furuya, T.; Sugioka, Y.; Numata, D.; Imai, M.; Kakimoto, T.; Kameda, M.; Machida, K.; Matsuda, M.; Taneda, Y. Measurement of Surface Pressure Field of Turbocharger Impeller Using Pressure and Temperature Sensitive Paints. Exp. Therm. Fluid Sci. 2023, 142, 110641. [Google Scholar]
- Claucherty, S.L.; Liu, T. Dynamic Characterization of Pyrene-Based Polymer/Ceramic Pressure-Sensitive Paint. Exp. Fluids 2020, 61, 169. [Google Scholar]
- Lash, E.L.; Roozeboom, N.; Murakami, D.D.; Shaw-Lecerf, M.; Li, J.; Califano, N.; Lyons, K.; Stremel, P.M.; Baerny, J.; Barreras, C.E.; et al. NASA’s Unsteady Pressure-Sensitive Paint Phase I Development Overview. In Proceedings of the AIAA SciTech Forum 2024, AIAA 2024-1341, Orlando, FL, USA, 8–12 January 2024; American Institute of Aeronautics and Astronautics: Reston, VA, USA, 2024. [Google Scholar]
- Zhu, Y.; Dong, Z.; Peng, S.; Liu, Y. Research on Static Calibration Method of Pressure-Sensitive Paint PSP in Wide Range (1–600 kPa). J. Exp. Fluid Mech. 2021, 35, 69–76. [Google Scholar]
- Li, G.S.; Zhou, Q.; Liu, X.; Jin, B.Q.; Gao, L.M.; Ma, H.S.; Xiong, J. Characteristics of Pressure-Sensitive Paint and Experiments on Its Calibration Technology. Acta Aeronaut. Astronaut. Sinica 2013, 34, 227–234. [Google Scholar]
- Murphree, B.; Crafton, J.; Fonov, S. Investigation of Single-Luminophore, Polymer-Ceramic Pressure Sensitive Paint for High-Speed Wind Tunnel Testing. AIAA 2024-1234. In Proceedings of the AIAA SciTech Forum 2024, Orlando, FL, USA, 8–12 January 2024; American Institute of Aeronautics and Astronautics: Reston, VA, USA, 2024. [Google Scholar]
- Yorita, D.; Henne, U.; Klein, C. Time-Resolved Pressure Sensitive Paint Measurements for Cryogenic Wind Tunnel Tests. CEAS Aeronaut. J. 2023, 15, 37–47. [Google Scholar] [CrossRef]
- Imai, M.; Konishi, K.; Ogura, K.; Nakakita, K.; Kameda, M. Time-Resolved Phase-Lock Pressure-Sensitive Paint Measurement of Trailing Edge Noise Dynamics. Exp. Fluids 2024, 65, 29. [Google Scholar] [CrossRef]
- Wei, C.; Tong, F.; Liao, X.; Chen, Z.; Liang, L.; Jiang, Y. A Temperature-Corrected PSP/TSP Coupled Measurement Method for Rotating Blade Flow. Meas. Sci. Technol. 2021, 32, 125301. [Google Scholar]
- Bottenus, N.; Byram, B.; Hyun, D. Histogram Matching for Visual Ultrasound Image Comparison. IEEE Trans. Ultrason. Ferroelectr. Freq. Control 2021, 68, 1487–1495. [Google Scholar] [CrossRef]
- Fayyaz, Z.; Platnick, D.; Fayyaz, H.; Farsad, N. Deep Unfolding for Iterative Stripe Noise Removal. In Proceedings of the International Joint Conference on Neural Networks (IJCNN), Padua, Italy, 18–23 July 2022; IEEE: Piscataway, NJ, USA, 2022; pp. 1–7. [Google Scholar]
- Lee, M.-J.; Karaca, U.; Kizilkan, E.; Bruschini, C.; Charbon, E. A 73% Peak PDP Single-Photon Avalanche Diode Implemented in 110 nm CIS Technology With Doping Compensation. IEEE J. Sel. Top. Quantum Electron. 2024, 30, 1–10. [Google Scholar] [CrossRef]
- Wang, Y.; Yu, Y.; Yang, W.; Guo, L.; Chau, L.-P.; Kot, A.C.; Wen, B. ExposureDiffusion: Learning to Expose for Low-Light Image Enhancement. In Proceedings of the IEEE/CVF International Conference on Computer Vision, Paris, France, 2–6 October 2023. [Google Scholar]
- Ma, L.; Ma, T.; Liu, R.; Fan, X.; Luo, Z. Toward Fast, Flexible, and Robust Low-Light Image Enhancement. In Proceedings of the IEEE/CVF Conference on Computer Vision and Pattern Recognition, New Orleans, LA, USA, 19–24 June 2022. [Google Scholar]
- Jiao, L.; Peng, D.; Liu, Y. Dynamic Response of Polymer-Ceramic Pressure-Sensitive Paint: Improved Model Considering Thickness Effect. AIAA J. 2020, 58, 2903–2906. [Google Scholar] [CrossRef]
- Kawakami, Y.; Hattori, T.; Rajapakse, R.P.C.J. Color Image Arrangement Using Histogram Matching. In Proceedings of the 2024 International Conference on Artificial Life and Robotics, Oita, Japan, 22–25 February 2024; Springer: Singapore, 2024; Volume 29, pp. 472–476. [Google Scholar]
- Sui, X.; Ishikawa, H.; Selesnick, I.W.; Wollstein, G.; Schuman, J.S. Speckle Noise Reduction in OCT and Projection Images Using Hybrid Wavelet Thresholding. In Proceedings of the IEEE Signal Processing in Medicine and Biology Symposium (SPMB), Philadelphia, PA, USA, 1 December 2018; IEEE: Piscataway, NJ, USA, 2018; pp. 1–6. [Google Scholar]
- Banik, S.K.; Fenley, A.T.; Kulkarni, R.V. A model for signal transduction during quorum sensing in Vibrio harveyi. Phys. Biol. 2009, 6, 046008. [Google Scholar] [CrossRef] [PubMed]
Disclaimer/Publisher’s Note: The statements, opinions and data contained in all publications are solely those of the individual author(s) and contributor(s) and not of MDPI and/or the editor(s). MDPI and/or the editor(s) disclaim responsibility for any injury to people or property resulting from any ideas, methods, instructions or products referred to in the content. |
© 2025 by the authors. Licensee MDPI, Basel, Switzerland. This article is an open access article distributed under the terms and conditions of the Creative Commons Attribution (CC BY) license (https://creativecommons.org/licenses/by/4.0/).