Article

An Interval Analysis Method for Uncertain Multi-Objective Optimization of Solid Propellant Formulations

National Key Laboratory of Solid Rocket Propulsion, Northwestern Polytechnical University, Xi’an 710072, China
*
Author to whom correspondence should be addressed.
Aerospace 2025, 12(10), 865; https://doi.org/10.3390/aerospace12100865
Submission received: 15 August 2025 / Revised: 22 September 2025 / Accepted: 23 September 2025 / Published: 25 September 2025
(This article belongs to the Section Astronautics & Space Science)

Abstract

To obtain propellant formulations with superior comprehensive and robustness performance, the study establishes a multi-objective optimization model that accounts for uncertainties. The model adopts a bi-layer structure. The inner layer computes performance bounds to construct uncertainty intervals, which are subsequently transformed into deterministic performance via interval order relations. The outer layer optimizes component mass fractions using MOEA/D (Multi-objective Evolutionary Algorithm Based on Decomposition) to maximize the deterministic performance. The study leverages Large Language Models (LLMs) as pre-trained optimizers to automate the operator design of MOEA/D. Designers can identify formulations that satisfy the performance requirements and robustness criteria by adjusting uncertainty levels and MOEA/D weight coefficients. The results on ZDTs and UFs demonstrate that MOEA/D-LLM achieves approximately a 4.0% improvement in hypervolume values compared to MOEA/D. Additionally, the NEPE propellant optimization case shows that MOEA/D-LLM improves the computational speed by about 13.05% and enhances hypervolume values by around 2.7% compared to MOEA/D. The specific impulse increases by 1.11%, the generation of aluminum oxide and hydrogen chloride decreases by approximately 18.43% and 16.40%, respectively, and the impact sensitivity is reduced by about 1.67%.

1. Introduction

Solid propellants are essential components of solid rocket motors. To ensure motor performance, propellant requirements must consider energy properties, mechanical characteristics, combustion behavior, and signature attributes. Solid propellants are required to exhibit low signature characteristics, which means that the combustion products contain no visible smoke and minimal infrared, ultraviolet, and visible-light emissions [1]. Current strategies for enhancing propellant performance primarily involve developing novel materials [2] and optimizing formulations [3]. Formulation design critically influences propellant performance, as adjustments in component proportions directly modify the key properties.

1.1. Traditional Methods for Formulation Optimization

Traditional methods for formulation optimization include computational graphical approaches, pattern search techniques and orthogonal experimental designs. The computational graphical method [4] employs ternary diagrams and multidimensional contour plots to visualize relationships between performance metrics (e.g., specific impulse) and component ratios. While enabling the visual identification of optimal formulations, this approach is limited to systems with no more than three optimization variables. Pattern search techniques address nonlinear programming problems through direct search [5], composite constraint algorithms, and hybrid discrete variable methods [6]. However, these techniques exhibit strong dependence on initial parameters, susceptibility to local optima, and incompatibility with multi-objective optimization. Orthogonal experimental design [7] iteratively evaluates component effects but relies on linear regression models that sacrifice prediction accuracy. Its computational cost also becomes prohibitive with exponential parameter growth.

1.2. Artificial Intelligence-Based Methods for Formulation Optimization

Recently, artificial intelligence-based optimization has gained prominence in propellant research. Machine learning models establish direct input-output mappings between formulation parameters and performance metrics (e.g., burning rate prediction [8,9]), eliminating explicit modeling requirements. Evolutionary algorithms such as genetic algorithms [10,11] and particle swarm optimization [12] demonstrate effectiveness in formulation optimization, outperforming pattern search methods in high-dimensional non-convex problems due to domain independence. Nevertheless, the current research predominantly focuses on single performance factors (e.g., specific impulse), neglecting conflicting relationships among multiple critical indicators. Although Yu et al. [7] addressed multi-objective optimization, their reliance on subjective weight assignments precluded obtaining complete Pareto fronts. For engineering applications, multi-objective optimization better reflects practical complexity than single-objective approaches [13,14], generating diverse non-dominated solution sets that support scientific decision-making [15,16,17,18].

1.3. MOEA/D and Large Language Models

MOEA/D is a decomposition-based multi-objective evolutionary algorithm [19] which is widely applied in engineering problems. However, the search operators of MOEA/D usually need to be carefully designed by experts, which could require a high amount of effort, especially in relation to dealing with new problems. To improve the traditional operators, researchers can either develop dynamic operators [20] or ensemble a diverse set of search operators to find diverse high-quality solutions [21]. However, designing novel operators always requires expert knowledge and much effort. Large Language Models (LLMs) currently have a major impact on a variety of fields [22]. For example, Thiago et al. [23] reported that ChatGPT 4 has the capability to assist in the selection and training of feasible data-driven models for performing surrogate-assisted optimization. Additionally, Hu et al. [24] demonstrated that the combination of LLMs with the hyperparameter optimization process can demonstrate comparable, or better, performance than conventional methods. Hameed et al. [25] proposed an LLM-enhanced PSO method to address the difficulties of efficiency and convergence, and the proposed method offers a very efficient and effective solution for optimizing deep learning models. Lange et al. [26] employed LLMs to serve as pre-trained black-box optimizers. These studies demonstrate that LLMs can help design and train models, so the paper will attempt to employ LLMs with prompts as the search operators for the MOEA/D’s subproblems.

1.4. Uncertainty Analysis Methods

Propellant formulation optimization is an engineering problem: uncertainties in various variables reduce the credibility of the numerical simulation results, so it may introduce potential risks. This emphasizes the critical importance of implementing uncertainty quantification in numerical simulation [27]. Specifically, during propellant optimization processes, deviations in the physicochemical parameters of propellant components (e.g., standard enthalpy) inevitably occur [28], propagating uncertainties into specific impulse calculations. Polynomial chaos expansion (PCE) is an uncertainty quantification technique. Its core goal is to represent the random output of a system with random inputs as a linear combination of a series of specific orthogonal polynomials. Essentially, it uses a polynomial surrogate model to approximate complex and computationally expensive stochastic systems [29,30,31,32]. However, this method requires probability distributions of variables, and the standard enthalpy lacks sufficient uncertainty information to determine them. In addition, the calculation of the performance of solid propellants in our paper is not a time-consuming process, so it is not advisable to establish a surrogate model. Interval analysis provides an effective solution by characterizing uncertain variables through their upper and lower bounds. It converts uncertain optimization problems into deterministic formulations using interval order relations [33]. The relations define the dominance relationships among the interval values. This method can effectively avoid the requirement for probability distributions and surrogate models.

1.5. Contributions and Highlights

In summary, there is a lack of optimization efforts targeting the multiple performance objectives of solid propellants, and no studies have addressed the uncertainty of physical parameters in solid propellant formulations. Therefore, this paper proposes a multi-objective optimization model based on interval uncertainty analysis. The interval uncertainty analysis method does not require prior knowledge of the probability distribution of uncertain variables nor the construction of computationally expensive surrogate models, making it well-suited for propellant formulation optimization problems. Additionally, LLMs are employed to assist in generating offspring solutions for subproblems in the MOEA/D framework, addressing the challenges with designing search operators. MOEA/D can obtain the Pareto fronts of optimization objectives, and designers can select propellant formulations along the Pareto fronts based on the requirements. The interval uncertain method provides quantifiable criteria for evaluating the reliability of optimization outcomes, thereby enabling decision-making under parameter uncertainty conditions.
The remaining part of this paper is organized thus: Section 2.1 presents the methods for calculating the performance of the formulations. Section 2.2 describes the solution method for uncertain multi-objective optimization problems and the application of LLM in MOEA/D. Section 2.3 establishes the uncertain multi-objective optimization model for solid propellants. Section 2.4 shows two case studies. Section 3 presents the discussions about the optimization results in Section 2.4, followed by concluding remarks in Section 4.

2. Methods

2.1. Calculation of Formulation Performance

In this section, the paper introduces the calculation methods of impact sensitivity, energy, and signature characteristics.
Impact sensitivity refers to the likelihood of explosives detonating or combusting when subjected to mechanical impact. Reducing the sensitivity of solid propellants is a critical requirement for the safety and survivability of rockets, missiles, and their launch platforms under external stimuli. Multiple approaches have been explored for predicting impact sensitivity in composite explosives. For example, the artificial neural network method is used to establish the relationship between explosive composition/formula and impact sensitivity, but these methods require a large amount of experimental data and show significant errors [34]. The correlation model based on explosive activity indices and impact sensitivity neglects molecular structural factors, so it demonstrates limited universality [35]. Morrison et al. [36] established a fully ab initio model based on phonon up-pumping, which ranks the relative impact sensitivity of energetic materials. Rice et al. [37] demonstrated that the impact sensitivity of CHNO explosives correlates with localized positive charge build up over covalent bonds, and predictive models based on electrostatic potentials and related parameters can effectively estimate this sensitivity. Mathieu et al. [38] integrated both thermodynamic and kinetic factors, leading to a linear relationship between high impact sensitivity and high detonation performance. This relationship is validated against experimental data for non-aromatic nitro compounds. Wang et al. [39] proposed a concept based on propellant impact sensitivity factors and component stability levels, employing a graded difference method similar to chemical stability evaluation to quantitatively compare impact sensitivity across formulations. The impact sensitivity factor F s e for propellants is defined as follows:
F s e = i = 1 n G s e i C i 100
where G s e i denotes the impact sensitivity factor of component i, and C i represents the mass fraction of component i.
As the energy source of the propulsion system, the energy characteristics of solid propellants are ultimately shown as specific impulse I s p . Additionally, propellant density ρ significantly influences energy performance. NASA-CEA is a computational code developed by NASA for the theoretical performance prediction of rocket and missile propellants. The paper uses it for the calculation of theoretical specific impulse and the density of solid propellant formulations.
The signature characteristics of formulations are quantified through the amount of aluminum oxide Al 2 O 3 generated and the amount of hydrogen chloride HCl generated of combustion products [7].

2.2. Transformation of Unconstrained Uncertain Multi-Objective Optimization Problems

As outlined in Section 2.1, the performance evaluation of a propellant formulation is a multi-objective optimization problem which encompasses theoretical specific impulse, propellant density, the amount of Al 2 O 3 generated, the amount of HCl generated, and the impact sensitivity factor. Furthermore, the uncertainties of standard enthalpy must be considered. Consequently, the optimization problem in this article is an uncertain and multi-objective optimization problem. The next section is about how to handle this problem.

2.2.1. Processing Methods for Unconstrained Uncertain Objective Functions

In general, an unconstrained multi-objective optimization problem is formulated as follows:
min f x = f 1 x , f 2 x , , f m x x = x 1 , x 2 , , x n T x i l x i x i u , i = 1 , 2 , , n
where x denotes the design variables; f x represents the objective functions; m is the number of objective functions; x i l , x i u correspond to the lower and upper bounds of the design variables, respectively; and n indicates the number of optimization variables.
The paper assumes that the uncertainty of a parameter can be perfectly characterized by known and fixed lower and upper bounds. All possible values are contained within this interval, with no information about likelihood. The interval variables are assumed to be independent. This means the value of one variable does not influence the value of another during calculations. Therefore, when uncertainties exist in certain variables within an optimization problem, they can be represented using uncertainty interval characterization as follows:
min f x , a = f 1 x , a , f 2 x , a , , f m x , a a i = a I = a i L , a i R , i = 1 , 2 , , q x = x 1 , x 2 , , x n T x i l x i x i u , i = 1 , 2 , , n
where a is a q-dimensional uncertain vector, v j L , v j R represents interval numbers, and L , R denotes the lower and upper bounds of the uncertainty interval I, respectively.
According to interval mathematics [40], an interval number is defined as an ordered pair of real numbers A I :
A I = A L , A R = x A L x A R , x R
Additionally, it can also be expressed as follows:
A I = A c , A w = x A c A w x A c + A w A c = A L + A R 2 A w = A R A L 2
where A c , A w represent the midpoint and radius of the interval, respectively.
The uncertainty level of the interval is defined as follows:
σ = A w A c
Interval numbers are different from real numbers, and the comparison of their advantages and disadvantages cannot be directly based on specific numerical values. The method of “interval order relationship” can be used to quantitatively describe whether one interval is better than another. Several commonly used interval order relationships can be found in reference [40]. Considering the improvement of the “average design performance” and reduction in the sensitivity of the objective function, this article selects the following interval order relationship, which expresses the decision-maker’s preference for the midpoint and radius of the interval [40]:
A I c w B I i f a n d o n l y i f A c B c a n d A w B w A I < c w B I i f a n d o n l y i f A I c w B I a n d A I B I
That is to say, it is necessary to find an optimal design vector that minimizes the midpoint and radius of the interval of the uncertain objective function. Therefore, the uncertain objective function can be transformed into a deterministic multi-objective optimization problem [40]:
min x f c x , f w x f c x = f L x + f R x 2 f w x = f R x f L x 2
It is necessary to calculate the midpoint and radius based on an uncertain function. Here, the interval of the uncertain objective function is solved through two optimization processes [40]:
f L x = min a f x , a f R x = max a f x , a a = a a i L a i a i R , i = 1 , 2 , , q
For the convenience of the subsequent solving process, a linear weighting method is used here to further transform the above equation into a single-objective optimization problem [40]:
min x 1 β f c x + β f w x
where β is the weight coefficient, 0 β 1 .

2.2.2. Processing Methods for Uncertain Multi-Objective Function

MOEA/D is a decomposition-based multi-objective evolutionary algorithm [19], the core idea of which lies in decomposition and collaboration. This method first randomly generates an initial population and initializes a set of weight vectors, before decomposing the multi-objective optimization problem into several single objective subproblems defined by these weight vectors. The subproblems are transformed into scalar optimization problems through aggregation functions. To optimize this set of single-objective subproblems, it is necessary to share information through neighborhood structures, co-evolve, and, ultimately, approach the Pareto front. This method is suitable for high-dimensional optimization, with fast convergence speed, good uniformity, and good diversity, and it is suitable for complex engineering problems.
The Weighted Sum Approach, Tchebycheff Approach, and Boundary Intersection Approach are three commonly used aggregation functions [19]. The Tchebycheff Approach is often preferred because it guarantees finding Pareto optimal solutions regardless of whether the true Pareto front is convex or non-convex [19]. Furthermore, it avoids the penalty parameter dependence in the Boundary Intersection Approach and offers robustness and simplicity, making it a reliable and efficient choice for most multi-objective optimization problems. Therefore, in this paper, the Tchebycheff Approach is used to transform the subproblems of a multi-objective optimization problem into a set of single objective optimization problems as shown in Equation (11) [19]. Different Pareto optimal solutions are obtained by changing the weight vector:
min g te x | λ , z * = min max 1 i m λ i f i x , a z i *
where z * = z 1 * , , z m * T is the reference point, z i * = min f i x , a x Ω .
Thus, uncertain multi-objective optimization problems can be written as follows:
min max 1 i m λ i f i x , a z i * f i x , a = min x 1 β f c x + β f w x
In terms of the co-evolution of subproblems, Yao et al. [41] proposed a MOEA/D framework based on an LLM (MOEA/D-LLM), using the LLM as a black-box search operator to generate new individuals for subproblems of multi-objective optimization decomposition. This method inputs l individuals for each subproblem. Each individual is selected from the neighborhood of the subproblem with neighborhood selection probability σ 3 and also from the entire population with a probability of 1 σ 3 (Figure 1). Due to the flexibility of the LLM, it can ensure that the selected individuals are scalable. Based on the aggregation function of the subproblem, the study calculates the fitness of these individuals, sorts them in descending order, and continuously updates the reference points and population to approach the Pareto front.
To effectively drive the generation of new individuals required for the LLM, appropriate prompts need to be provided. A prompt includes problem description, semantic samples, and expected output format. Figure 1 shows a prompt example.
To test the effectiveness of the MOEA/D-LLM model, the paper uses ZDTs and UFs to conduct a comparison between NSGA-II, MOEA/D, and MOEA/D-LLM. MOEA/D employs the genetic algorithm to generate new individuals for subproblems, while MOEA/D adopts the LLM. The settings for the MOEA/D and MOEA/D-LLM are shown in Table 1. The Hypervolume Indicator (HV) is a set quality indicator used in multi-objective optimization to assess the quality of a set of solutions. It quantifies the volume of the objective space dominated by the solutions in the set, providing a measure of both the spread and the closeness to the Pareto front. Table 2 lists the average HV, and the best one is highlighted in bold. MOEA/D-LLM obtains higher HV values than MOEA/D and NSGA-II in nine out of fourteen test functions, demonstrating its better convergence and diversity performance. Table 3 shows the average running time, and the shortest one is highlighted in bold. MOEA/D reduces the average computation time by about 25.74% compared to NSGA-II, and about 4.10% compared to MOEA/D, which illustrates the effectiveness of the MOEA/D-LLM.

2.3. Uncertain Multi-Objective Optimization Model for Solid Propellants

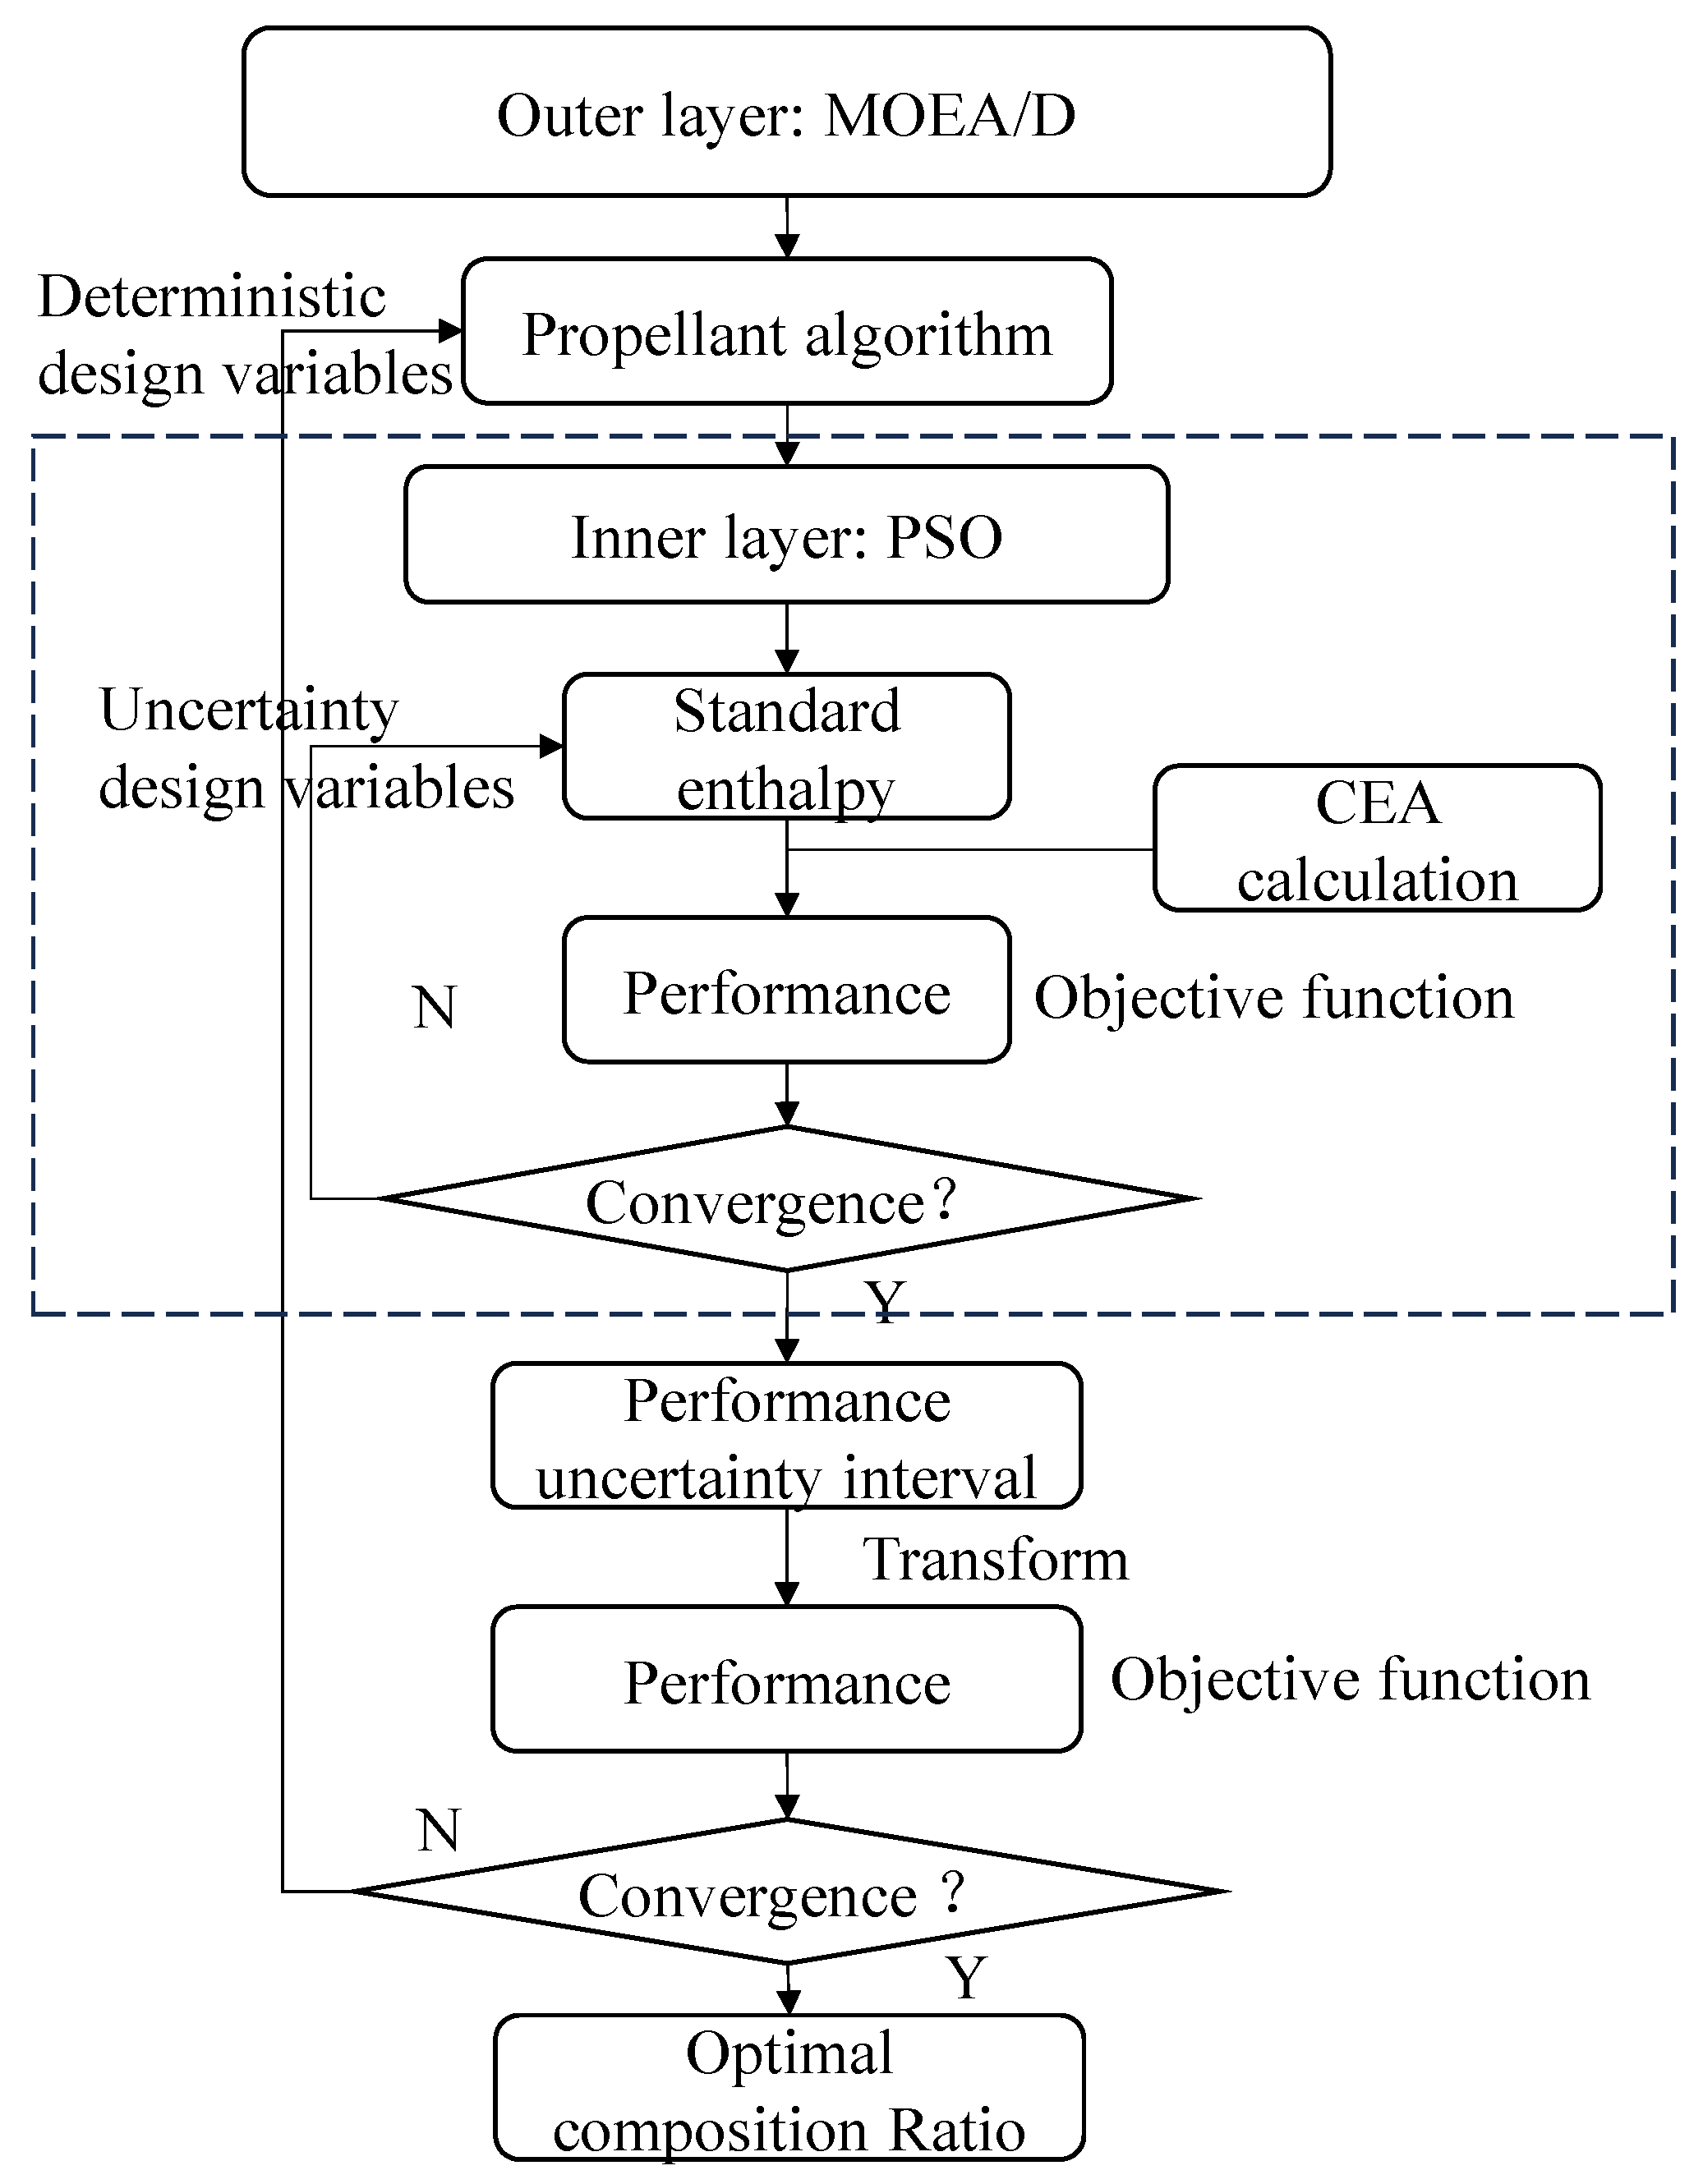
The uncertainty interval and MOEA/D-LLM model are established, respectively, and will be nested together according to the process in Figure 2. The following are the specific steps for implementing this process:
(1)
Randomly select the mass fraction of each propellant component, and carry out inner layer optimization under this component mass fraction.
(2)
In the inner layer, the design variable is the standard enthalpy, and the target is to find the best and the worst performance of the propellant under a fixed formulation. The performance of the propellant can be calculated using the RocketCEA 1.2.0. And the PSO algorithm is applied to obtain the best and the worst performance, respectively. The settings of PSO are shown in Table 4. The best and the worst values form the uncertainty interval of the performance.
(3)
The uncertainty interval will be transformed to deterministic performance using Equation (8).
(4)
In the outer layer, the design variable is the mass fraction of the component, and the target is to find the best deterministic performance using the MOEA/D-LLM algorithm. The settings of MOEA/D-LLM are shown in Table 5.
Here, the paper defines the number of variables, the number of objective functions, and the maximum number of iterations of the outer layer as D o u t , M o u t , and G m a x , o u t , respectively. Additionally, p, D i n , G m a x , i n , and t f , i n denote the number of particles, the number of variables, the maximum number of iterations, and the time cost for one evaluation of the inner layer, respectively. The computational complexity of the inner layer can be described as O i n = O ( p G m a x , i n D i n t f , i n ) , and the computational complexity of the outer layer can be calculated as O o u t = O ( N T ( D o u t + M o u t O i n ) ) ) .
Equation (13) shows the uncertain multi-objective optimization model of solid propellants. f 1 f 2 , f 3 , f 4 , f 5 represents the specific impulse I s p , the impact sensitivity factor F s e , the amount of A l 2 O 3 generated G A l 2 O 3 , the amount of H C l generated G H C l , and the density ρ , respectively; x represents the mass fraction of each component; and h represents the standard enthalpy of each component. Due to the optimization objectives of propellant specific impulse, impact sensitivity factor, and density being maximum values, these objective functions need to be transformed from maximizing to minimizing. These objective functions will subtract a value which is clearly greater than them. Therefore, three regularization factors φ 1 , φ 2 , φ 3 are introduced:
min x f 1 x , h , f 2 x , f 3 x , h , f 4 x , h , f 5 x f 1 x , h = 1 β φ 1 I s p c + β I s p w I s p c = 1 2 min h I s p x , h + max h I s p x , h I s p w = 1 2 max h I s p x , h min h I s p x , h f 2 x = φ 2 F s e x f 3 x , h = 1 β G A l 2 O 3 c + β G A l 2 O 3 w G A l 2 O 3 c = 1 2 min h G A l 2 O 3 x , h + max h G A l 2 O 3 x , h G A l 2 O 3 w = 1 2 max h G A l 2 O 3 x , h min h G A l 2 O 3 x , h f 4 x , h = 1 β G H C l c + β G H C l w G H C l c = 1 2 min h G H C l x , h + max h G H C l x , h G H C l w = 1 2 max h G H C l x , h min h G H C l x , h f 5 x = φ 3 ρ x
It should be noted that, during the selection process of sample points, there may be cases where the sum of the mass fraction of each component is not 100%. At this point, it is necessary to process according to Equation (15) so that the sum of the contents of each component is 100%:
x i = x i x i / 100 % , x i > 100 % 100 % x i / x i , x i < 100 %

2.4. Case Study on Solid Propellant Optimization

This paper will adopt the established optimization model to optimize the formulation of three propellants: nitrate ester plasticized polyether propellant (NEPE), and hydroxy-terminated polybutadiene propellant (HTPB).
The theoretical formulation of the NEPE solid propellant includes seven components: polyethylene glycol (PEG), nitroglycerin (NG), 1,2,4-butanetriol trinitrate (BTTN), ammonium perchlorate (AP), aluminum (Al), cyclotetramethylenetetranitramine (HMX), and triphenyl bismuth (TPB). Their density, impact sensitivity factor, and standard enthalpy values are shown in Table 6.
The composition of the HTPB solid propellant mainly includes HTPB, AP, Al, and Fe 2 O 3 . The density, impact sensitivity factor, and mass fraction range of various components are shown in Table 7.
In addition, the paper conducts experiments for NEPE propellant to verify the effectiveness of the optimization results. The experimental steps are listed below.
  • The preparation of the NEPE propellant:
    Firstly, place AP in a vacuum drying oven at 60 °C with a vacuum of 0.06 MPa for 4 h. Place the metal fuel in the same vacuum oven for 2 h. Place HTPB, PEG, and NG in a vacuum drying oven at 105 °C for dehydration for 10 h. The dried reagents are stored in sealed containers.
    Secondly, weigh out the required masses of the three liquid reagents (HTPB, PEG, and NG) according to the component ratios. Pour the liquid reagents into a beaker and place the beaker in a water bath at 50 °C. The resulting mixture was stirred with a high shear homogenizer HG-15D (Daihan Scientific, Seoul, Republic of Korea) at 5000 rpm for 30 min.
    After thorough mixing, place the mixture into a 50 °C vacuum drying oven and allow it to stand for 1 h to defoam.
    Thirdly, mix curing agents, adhesives, and additives evenly. Add aluminum powder, AP, and HMX in sequence for mixing. For each solid filler, it needs to be mixed evenly before adding another one, and repeat the above steps until all raw materials are added. Mix and stir the propellant for another 30 min. At this stage, the mixture appears as a dark gray, opaque slurry with a certain degree of fluidity.
    Fourthly, remove the beaker from the 50 °C water bath and place it in a 50 °C vacuum drying oven. Allow it to stand for 4 h to eliminate bubbles from the propellant slurry. Pour the propellant slurry into a PTFE mold coated with release agent. Place the PTFE mold in a drying oven at 50 °C with a vacuum of 0.06 MPa. Dry for 7 days until the sample solidifies into a cylindrical solid. At this stage, the propellant sample has a compact structure with good elasticity. Demold the propellant from the PTFE mold using a glass rod.
    Finally, use a ceramic knife to cut it into a flake with a diameter of 10 mm and a thickness of 1 mm.
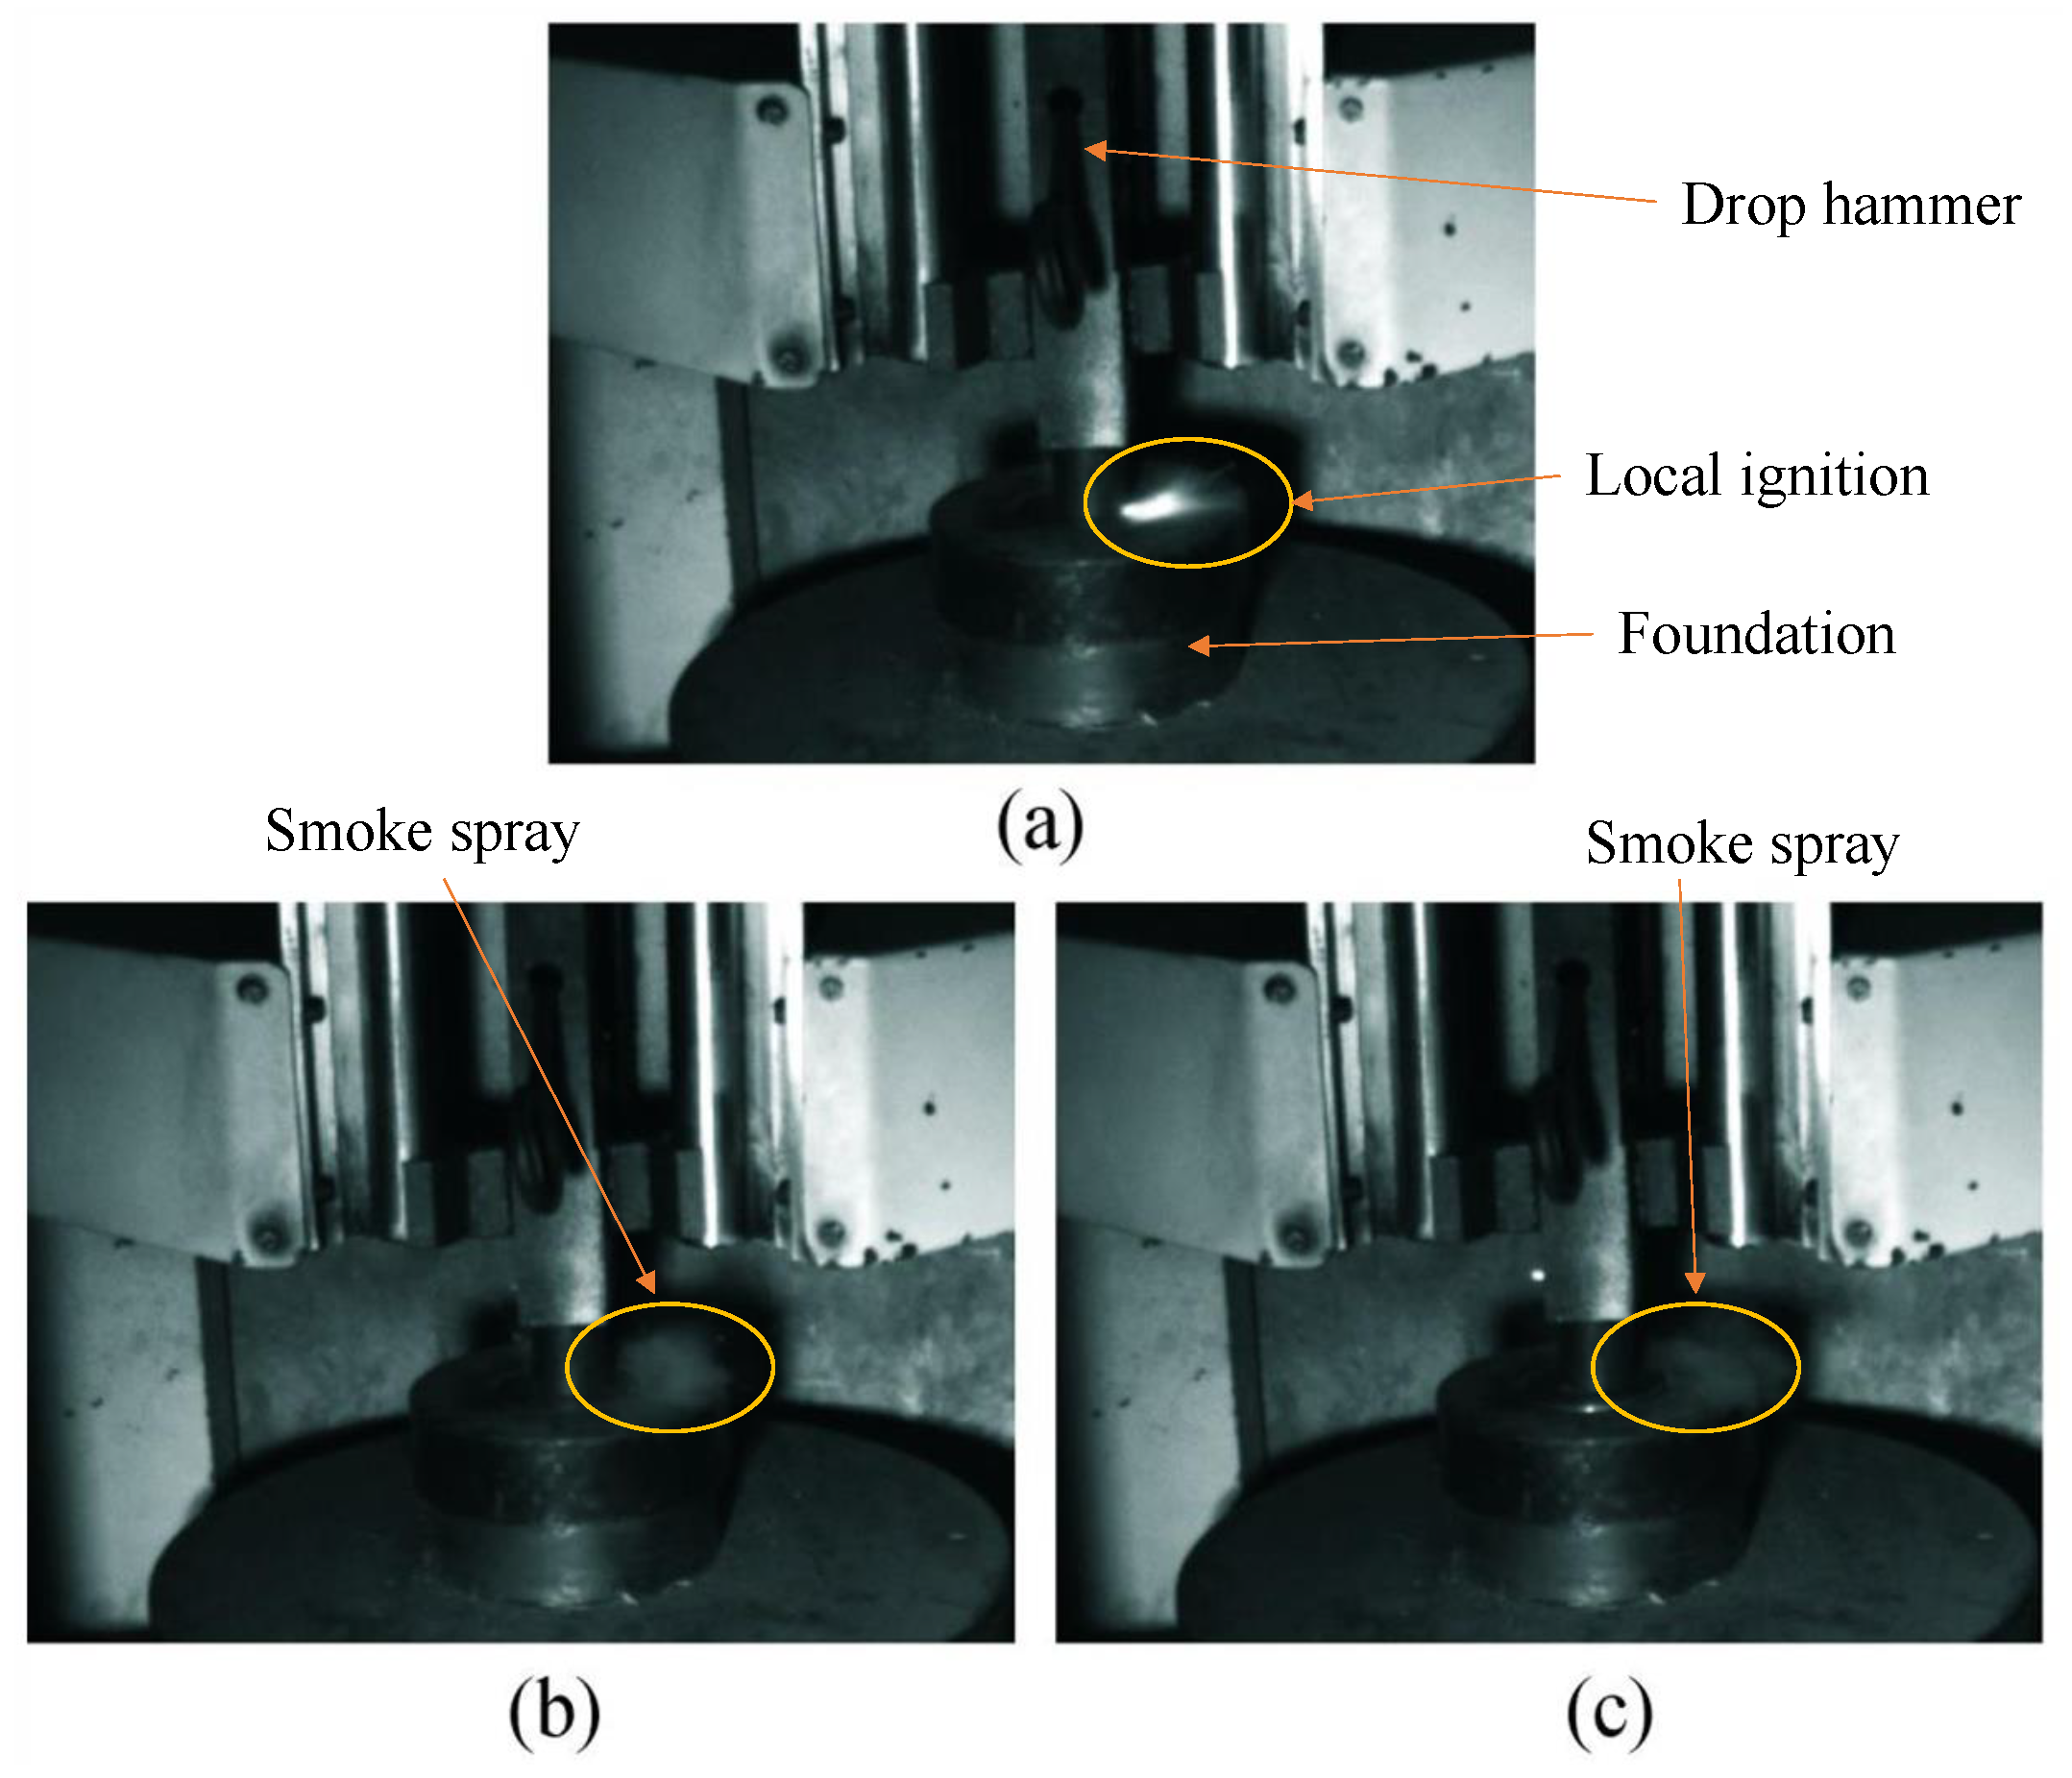
  • The impact sensitivity test: The impact sensitivity test is a safety procedure that assesses the mechanical sensitivity of solid rocket propellants. It typically involves a drop-weight test, where a known weight is dropped from varying heights onto a sample. The goal is to determine the critical impact energy required to cause ignition or explosion. The standard is based on the “Test method for drop weight impact sensitivity of composite solid propellants (QJ3039-1998)” [42]. If decomposition, combustion, or explosion occurs in the solid propellant, it is judged as explosion; otherwise, it is judged as a non-explosion. For example, in Figure 3a, localized ignition occurs within the circled area, while in Figure 3b,c, visible smoke is ejected outward from the circled area. These two phenomena can indicate that the sample has exploded.
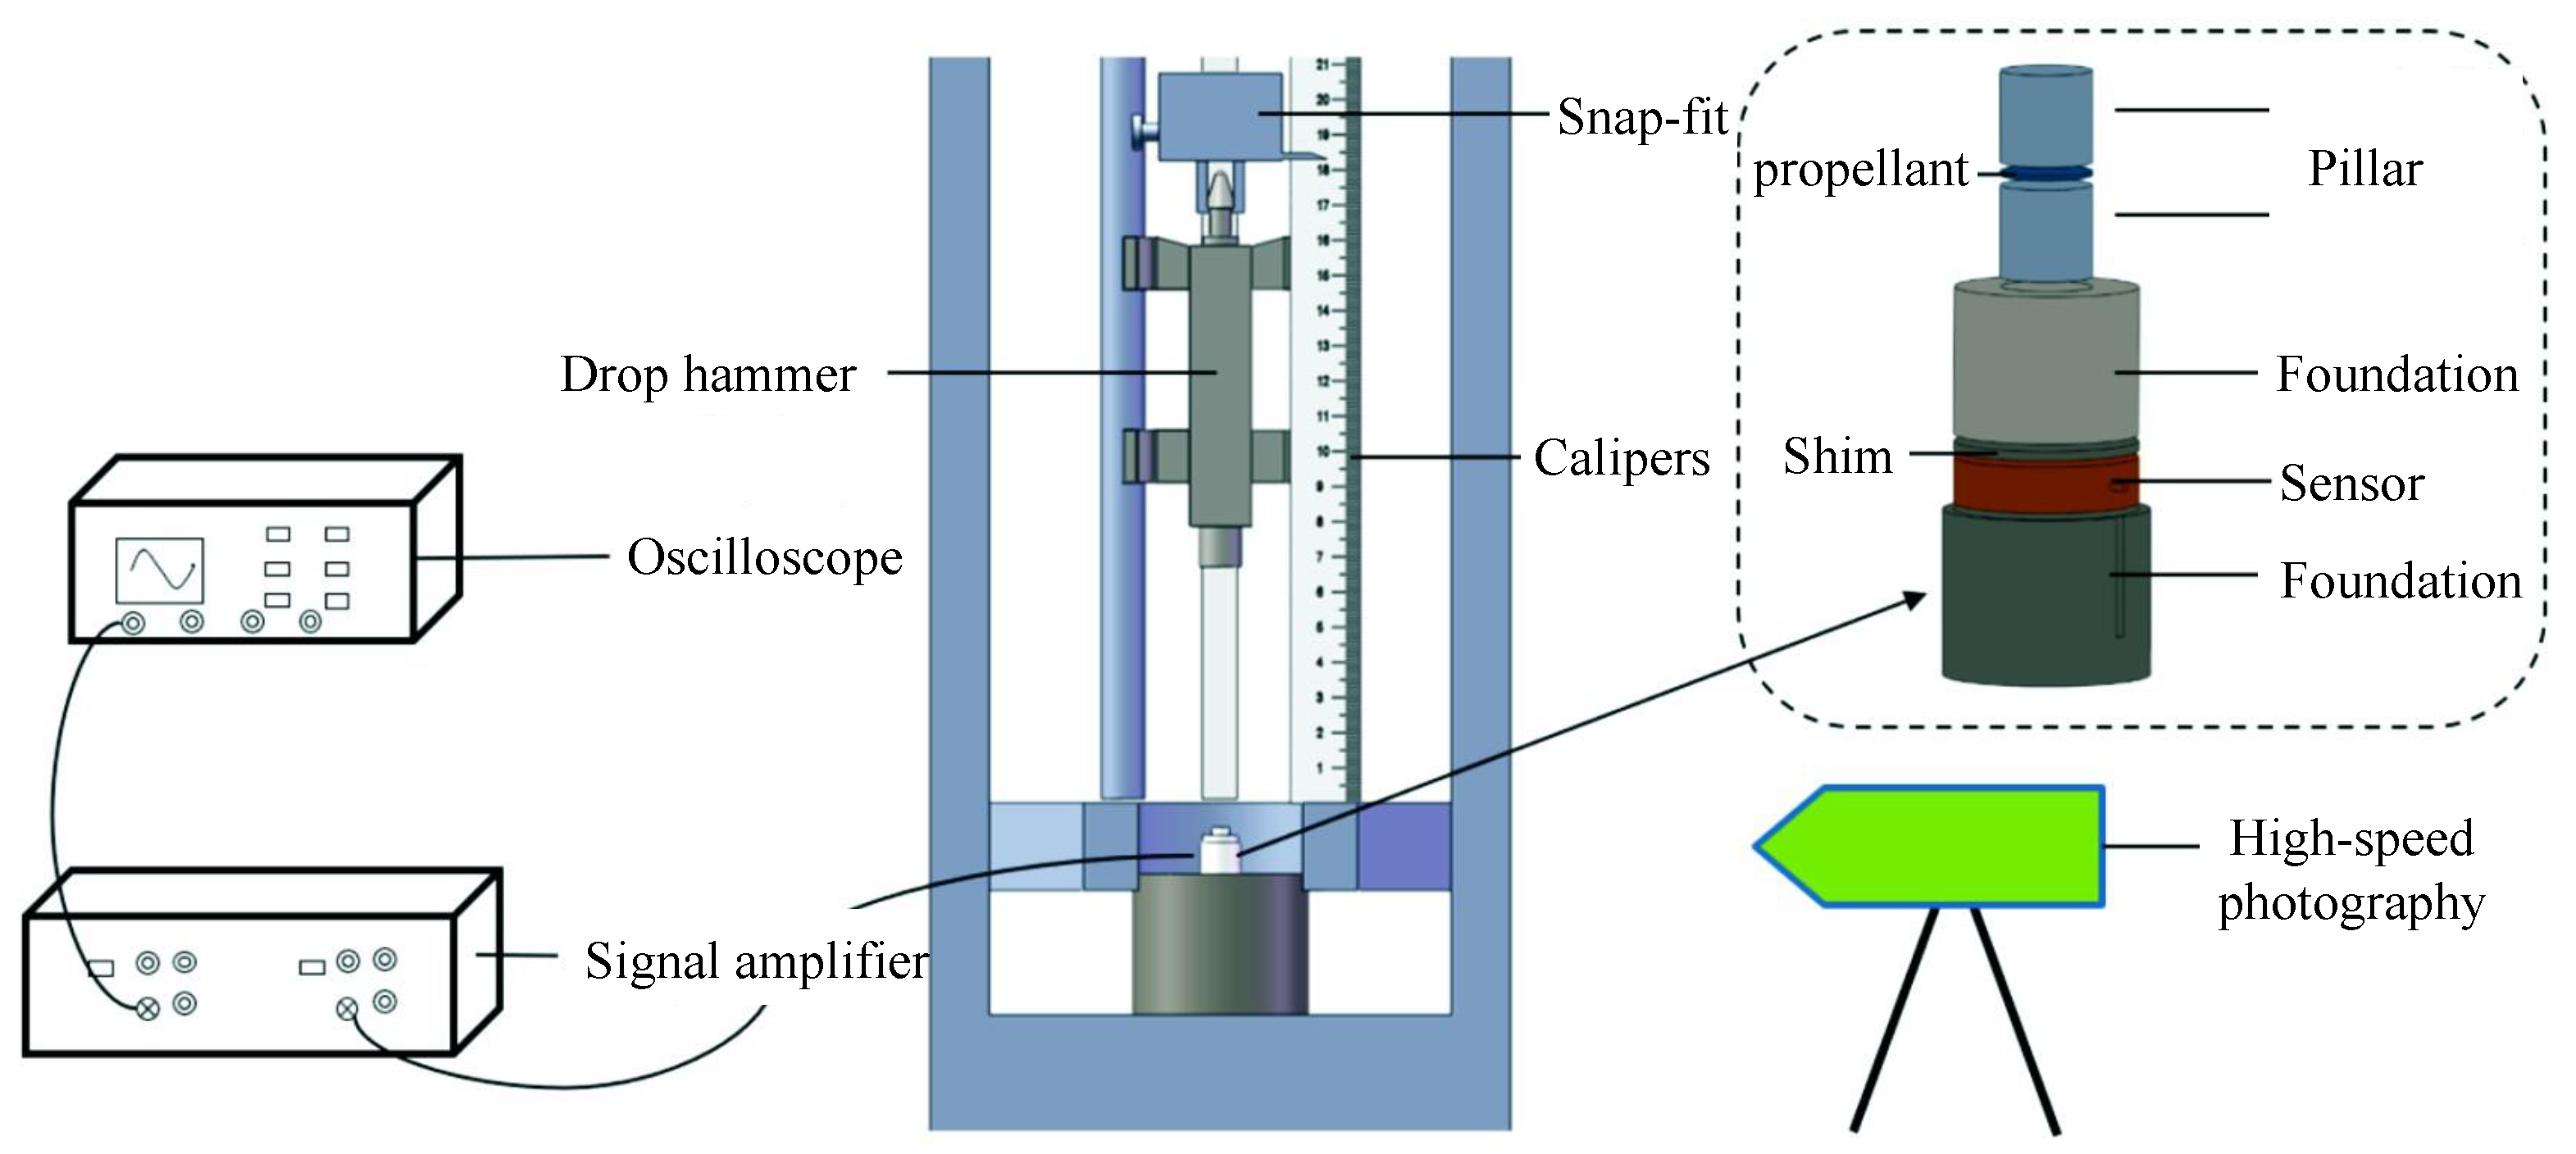
    In this paper, the impact sensitivity of the NEPE propellant is based on the characteristic drop height values under a 2 kg drop hammer. The drop hammer device is shown in Figure 4. The entire impact process of the propellant is recorded using a high-speed camera.
    First, select an appropriate step size (0.05 logarithmic units of drop height) to calculate the height increment/decrement.
    Second, determine the initial drop height by the Drop-Weight Impact Test. Adjust the drop hammer height after each test based on whether ignition occurs.
    Finally, conduct 25 experiments per sample group and record the explosion/non-explosion in each trial.
  • Ground hot-fire test: To calculate the specific impulse of the experiment, a ground hot-fire test of an end-burning solid rocket motor was conducted. The parameters of the solid rocket motor used in the test are provided in Table 8.
  • G A l 2 O 3 and G H C l from the combustion gas of the NEPE propellant is tested via the EDTA titration method and acid–base titration [43].
    Firstly, weigh the m = 0.2 g sample and fuse with sodium carbonate. Dissolve the melt in hydrochloric acid and dilute to 250 mL. Transfer 25 mL aliquot, add excess EDTA standard solution (0.05 mol/L), and boil for 3 min to complex A l 3 + .
    After cooling, adjust the aliquot to pH 5.5 using an acetate-ammonium buffer, add a PAN indicator, and titrate with zinc acetate standard solution ( c Z n = 0.025 mol/L) to purple endpoint (record as V 1 ).
    Add 10 mL potassium fluoride solution (200 g/L), boil for 2 min to release Al-EDTA complex, and back-titrate at 80 °C with zinc acetate until purple reappears (record as V 2 ). G A l 2 O 3 can be calculated by Equation (15).
    In acid–base titration for HCl, the sample ( V s a m p l e = 10 mL) is added with phenolphthalein, then titrated with NaOH solution ( c N a O H = 0.1 mol/L) to the endpoint (phenolphthalein: colorless to pink at pH 8.3). G H C l can be calculated by Equation (16).
    G A l 2 O 3 = ( V 2 V 1 ) c Z n 0.05098 / m 100 %
    G H C l = c N a O H V N a O H V s a m p l e

3. Results and Discussions

3.1. NEPE Solid Propellant

3.1.1. Validation for the Impact Sensitivity Factor Model

To ensure accuracy in evaluating the impact sensitivity factor, the paper uses experimental data from [44] for verification purposes. Table 9 shows a comparison of the impact sensitivity factor. The first seven columns show the mass fractions of each component in the formulation, while the last two columns represent the calculated values from this paper and the experimental values from [44], respectively. The average relative error of is about 1.27%, which illustrates that Equation (1) is effective for calculating the impact sensitivity factor.
In terms of the model for calculating I s p , G A l 2 O 3 , and G H C l , the article used data from [45] for verification purposes. The mass fractions of each component are as follows: PEG, 8.0%; NG, 3.50%; BTTN, 3.5%; AP, 30.00%; Al, 15.00%; HMX, 40.00%. Table 10 shows a comparison of the above performance. The relative errors of I s p , G A l 2 O 3 , and G H C l are about 0.008%, 0.807% and 0.071%, respectively, which demonstrates that the model for calculating I s p , G A l 2 O 3 , and G H C l , described in Section 2.1, is also effective.
The verification results listed above confirm that the performance calculation model described in Section 2.1 is applicable to the NEPE propellant. Next, the paper will perform uncertain optimization for the NEPE propellant.

3.1.2. Validation for the MOEA/D-LLM

The standard enthalpy is considered an uncertain variable, with uncertainty levels of 5%, 10%, and 15% taken into account in the calculation. The standard enthalpy of aluminum is 0, so it is not analyzed as an uncertain variable. The values of φ 1 , φ 2 , φ 3 in Equation (13) are taken as 3000 N·s·kg−1, 8, and 2100 kg/m3, respectively. Table 5 shows the parameter settings for the MOEA/D algorithm. The generation number of the particle swarm optimization algorithm for the inner layer is set to 200.
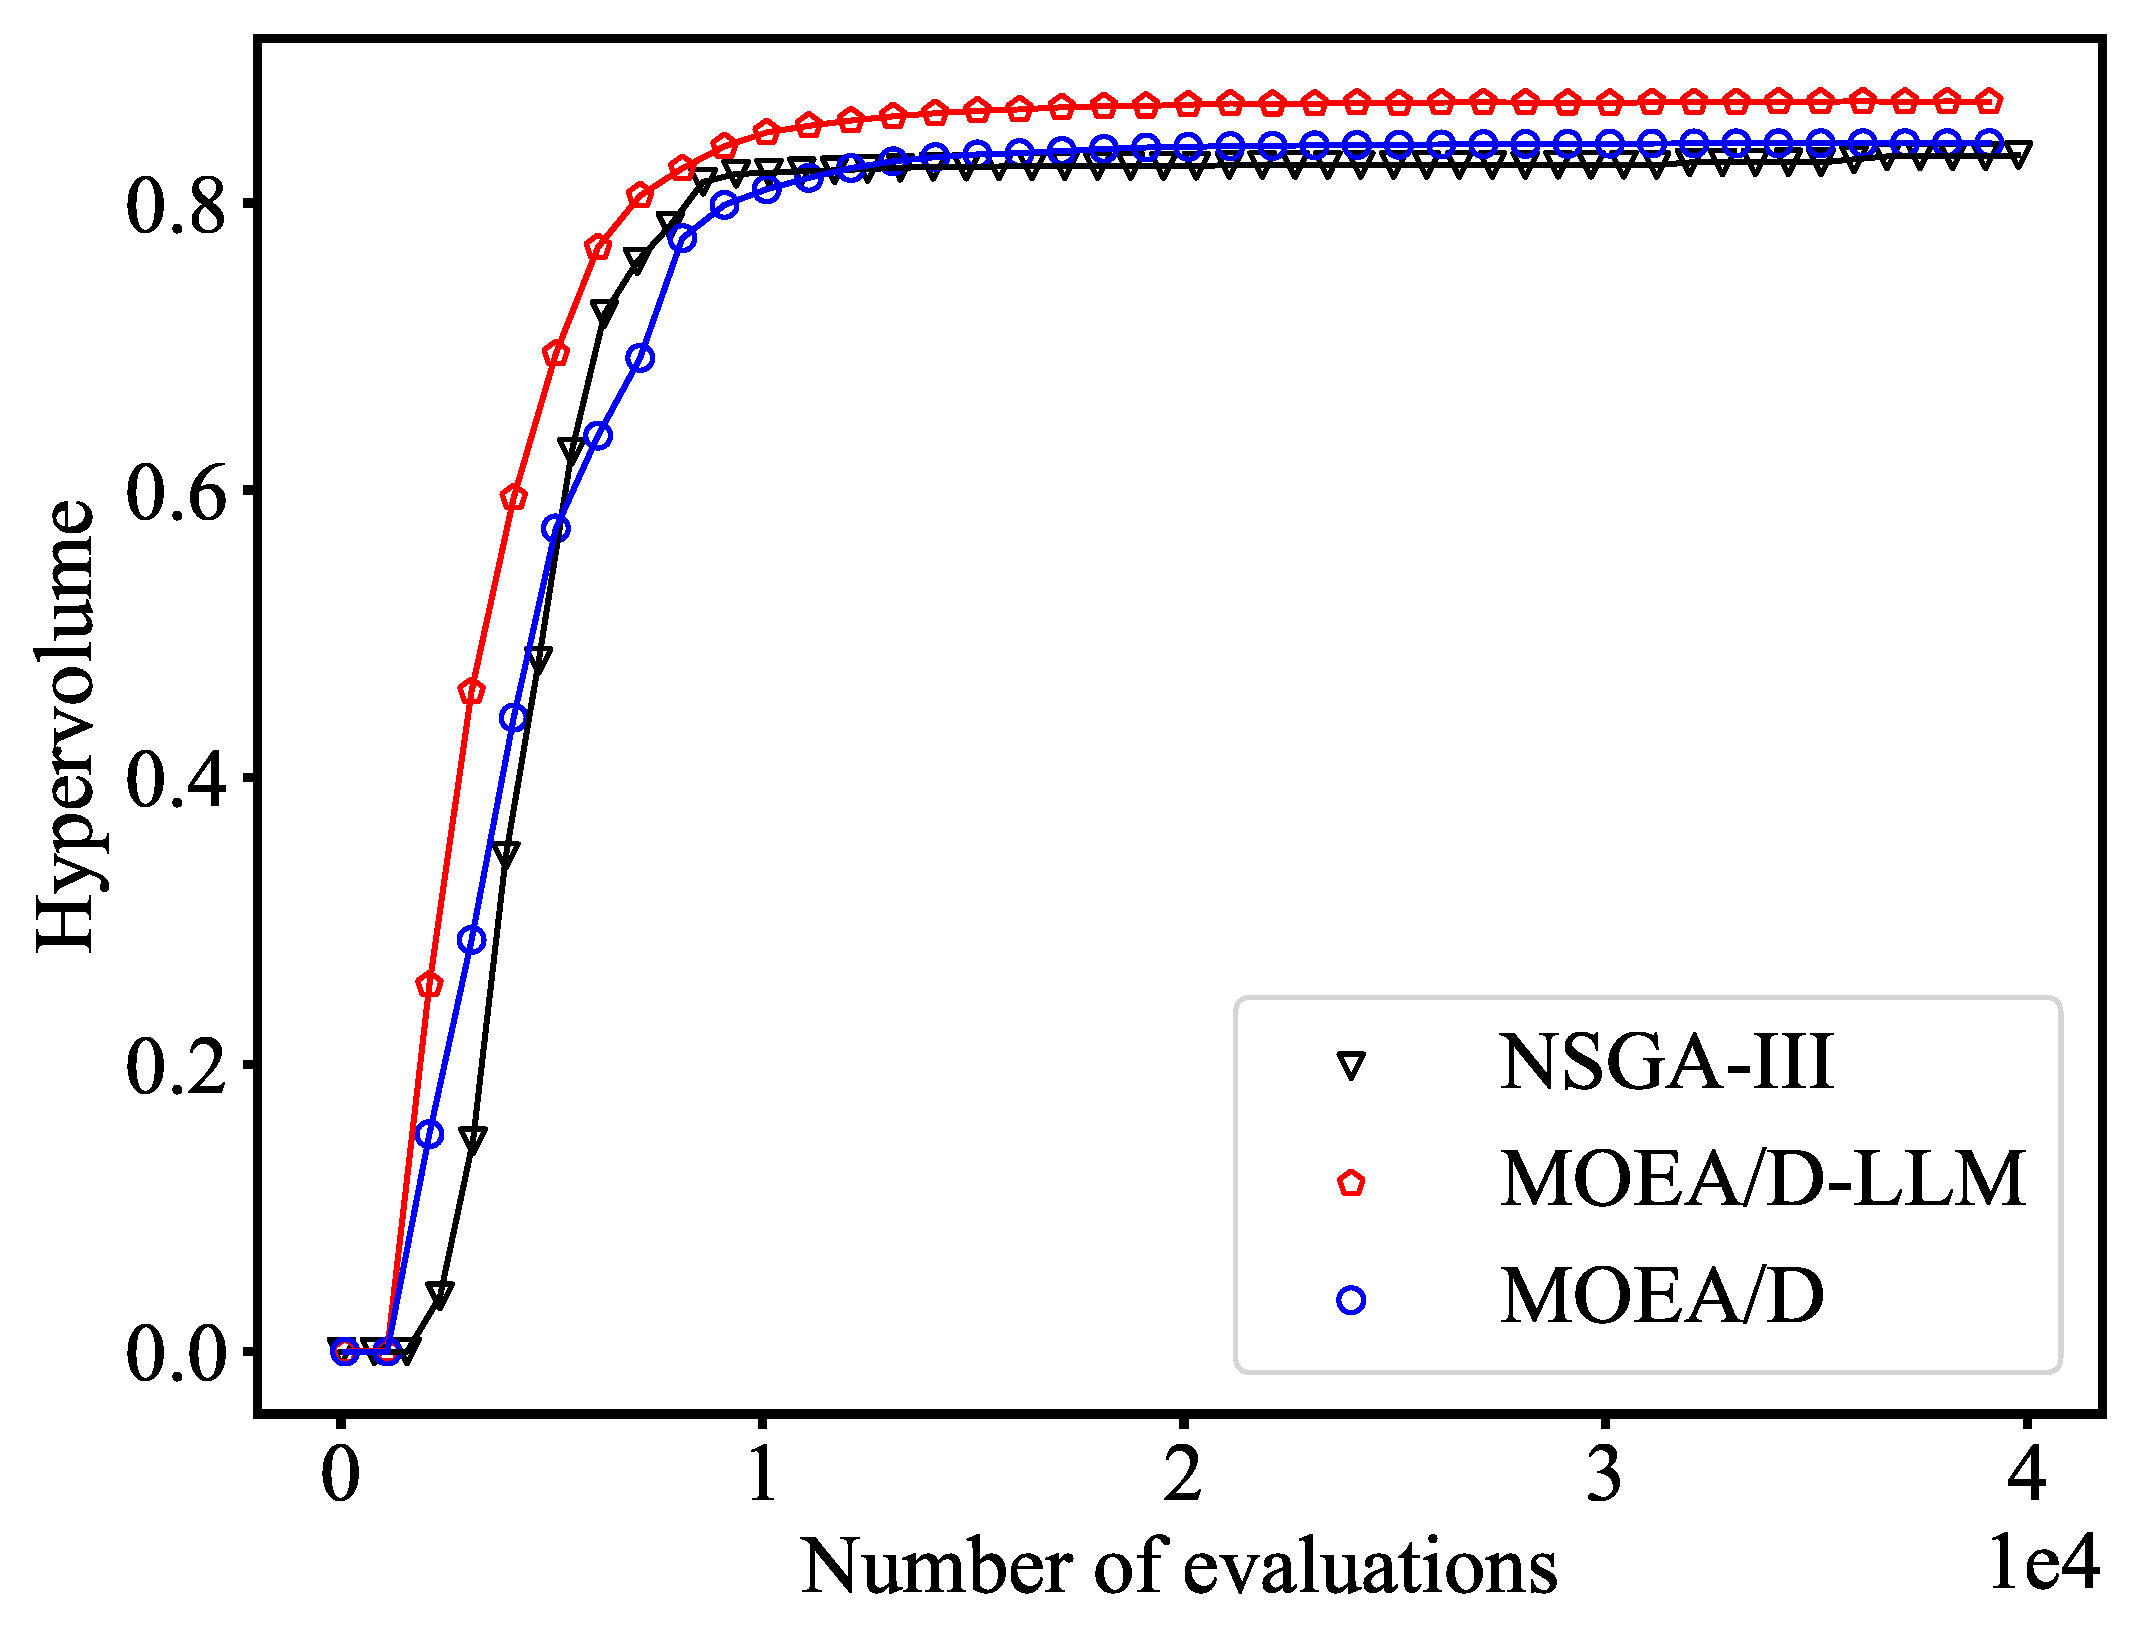
Set the value of the weight coefficient and the uncertainty levels of the standard enthalpy to 0.5 and 5%, respectively. In order to justify the effectiveness of the MOEA/D, the paper performs uncertain multi-objective optimization via NSGA-III, MOEA, and MOEA/D-LLM. The hypervolume values that change with the number of evaluations are shown in Figure 5. As for NSGA-III, the number of convergence evaluations is about 11,000; for MOEA/D-LLM, the number is about 15,000, and for MOEA/D, the number is about 20,000. Although the number of evaluations of MOEA/D-LLM is larger than NSGA-III, the hypervolume value of the former (0.845) is bigger than the latter (0.823), which confirms that MOEA/D-LLM is the closest to the Pareto front.
Each algorithm is independently executed 30 times, and the HV value for each run is recorded. The Shapiro–Wilk test is first employed, revealing that the HV data does not fully conform to a normal distribution (p < 0.05). Therefore, the non-parametric Wilcoxon rank-sum test is selected to compare the distribution of HV values between the two algorithms. The statistical tests demonstrate that there are significant differences in the HV distributions between MOEA/D-LLM and both MOEA/D and NSGA-III. The average HV value of MOEA/D-LLM shows improvements of 3.04% and 3.93% compared to MOEA/D and NSGA-III, respectively (Table 11).
The running time of MOEA/D-LLM is approximately 13,583 s, while the running times of MOEA/D are approximately 15621 s. The speed of MOEA/D-LLM has increased by 13.05% compared to MOEA/D. Therefore, the results show that MOEA/D-LLM performs better than NSGA-III and MOEA/D.

3.1.3. Validation for the Interval Uncertain Method

In order to make a comparison with other uncertainty handling methods, the paper tests an example of the NEPE propellant based on uncertain intervals and polynomial chaos expansion (PCE). The paper sets the propellant formulation as follows: PEG: 7.05%, NG: 8.62%, BTTN: 9.84%, AP: 14.36%, Al: 20.25%, HMX: 39.61%, and TPB: 0.54%. The standard enthalpy is considered an uncertain variable. The standard enthalpy of each component is based on the values listed in Table 6, with a fluctuation of 5%. Then, try to find the maximum values of I s p .
For the PCE method, it is necessary to establish a surrogate model. We assume that each uncertain variable follows a uniform distribution. The sampling method adopts Latin hypercube sampling, and the calculation method of the coefficients is “quadrature”. Then, use PSO to find the maximum value of the surrogate model and set the number of maximum iterations to 300. The results are shown in Table 12. When the polynomial chaos expansion (PCE) orders are 4, 5, and 6, the required number of samples are 1820, 6188, and 18,563, respectively, the actual optimal values are 2643.17 N·s·kg−1, 2644.88 N·s·kg−1, and 2645.12 N·s·kg−1, respectively, and the relative errors between the optimized results and true values are 0.1228%, 0.0087%, and 0.0064%, respectively. As the PCE order increases, the total number of required samples increases, indicating higher computational cost. However, the relative error between the optimized results and the actual values decreases.
For the interval uncertain method, the paper also uses PSO to obtain the maximum value of I s p , and the number of maximum iterations is also set to 300. The optimal result is 2645.55 N·s·kg−1, which is a better value than the PCE method. Furthermore, when the total number of samples reaches nearly 20,000, the optimal results of the PCE method cannot yet achieve the effect of the interval uncertain method (2645.12 N·s·kg−1). The interval uncertain method also avoids wasting a lot of time in establishing a surrogate model. In summary, the interval uncertain method has better calculation accuracy and efficiency than the PCE method.

3.1.4. Optimization Results of NEPE Propellant

When the uncertainty levels of the standard enthalpy for each component are set to ±5%, ±10%, and ±15%, respectively, the maximum uncertain intervals of the performance indicators are as shown in Table 13. The maximum intervals of I s p are [2635.74, 2639.11], [2628.34, 2635.75], and [2625.66, 2637.86], respectively. For G A l 2 O 3 , they are [4.26, 4.39], [3.93, 4.03] and [3.85, 3.91], respectively. For G H C l , they are [0.2406, 0.2458], [0.2553, 0.2625] and [0.2542, 0.2656], respectively. According to Equation (8), the uncertainty interval radii of I s p are 1.685, 3.705, and 6.100, respectively. For G A l 2 O 3 , they are 0.065, 0.050, and 0.030, respectively. For G H C l , they are 0.0026, 0.0036, and 0.0057, respectively. It can be seen that when the uncertainty level increases, the standard enthalpy uncertainty increases, which, in turn, increases the uncertain radius of I s p , G A l 2 O 3 , and G H C l .
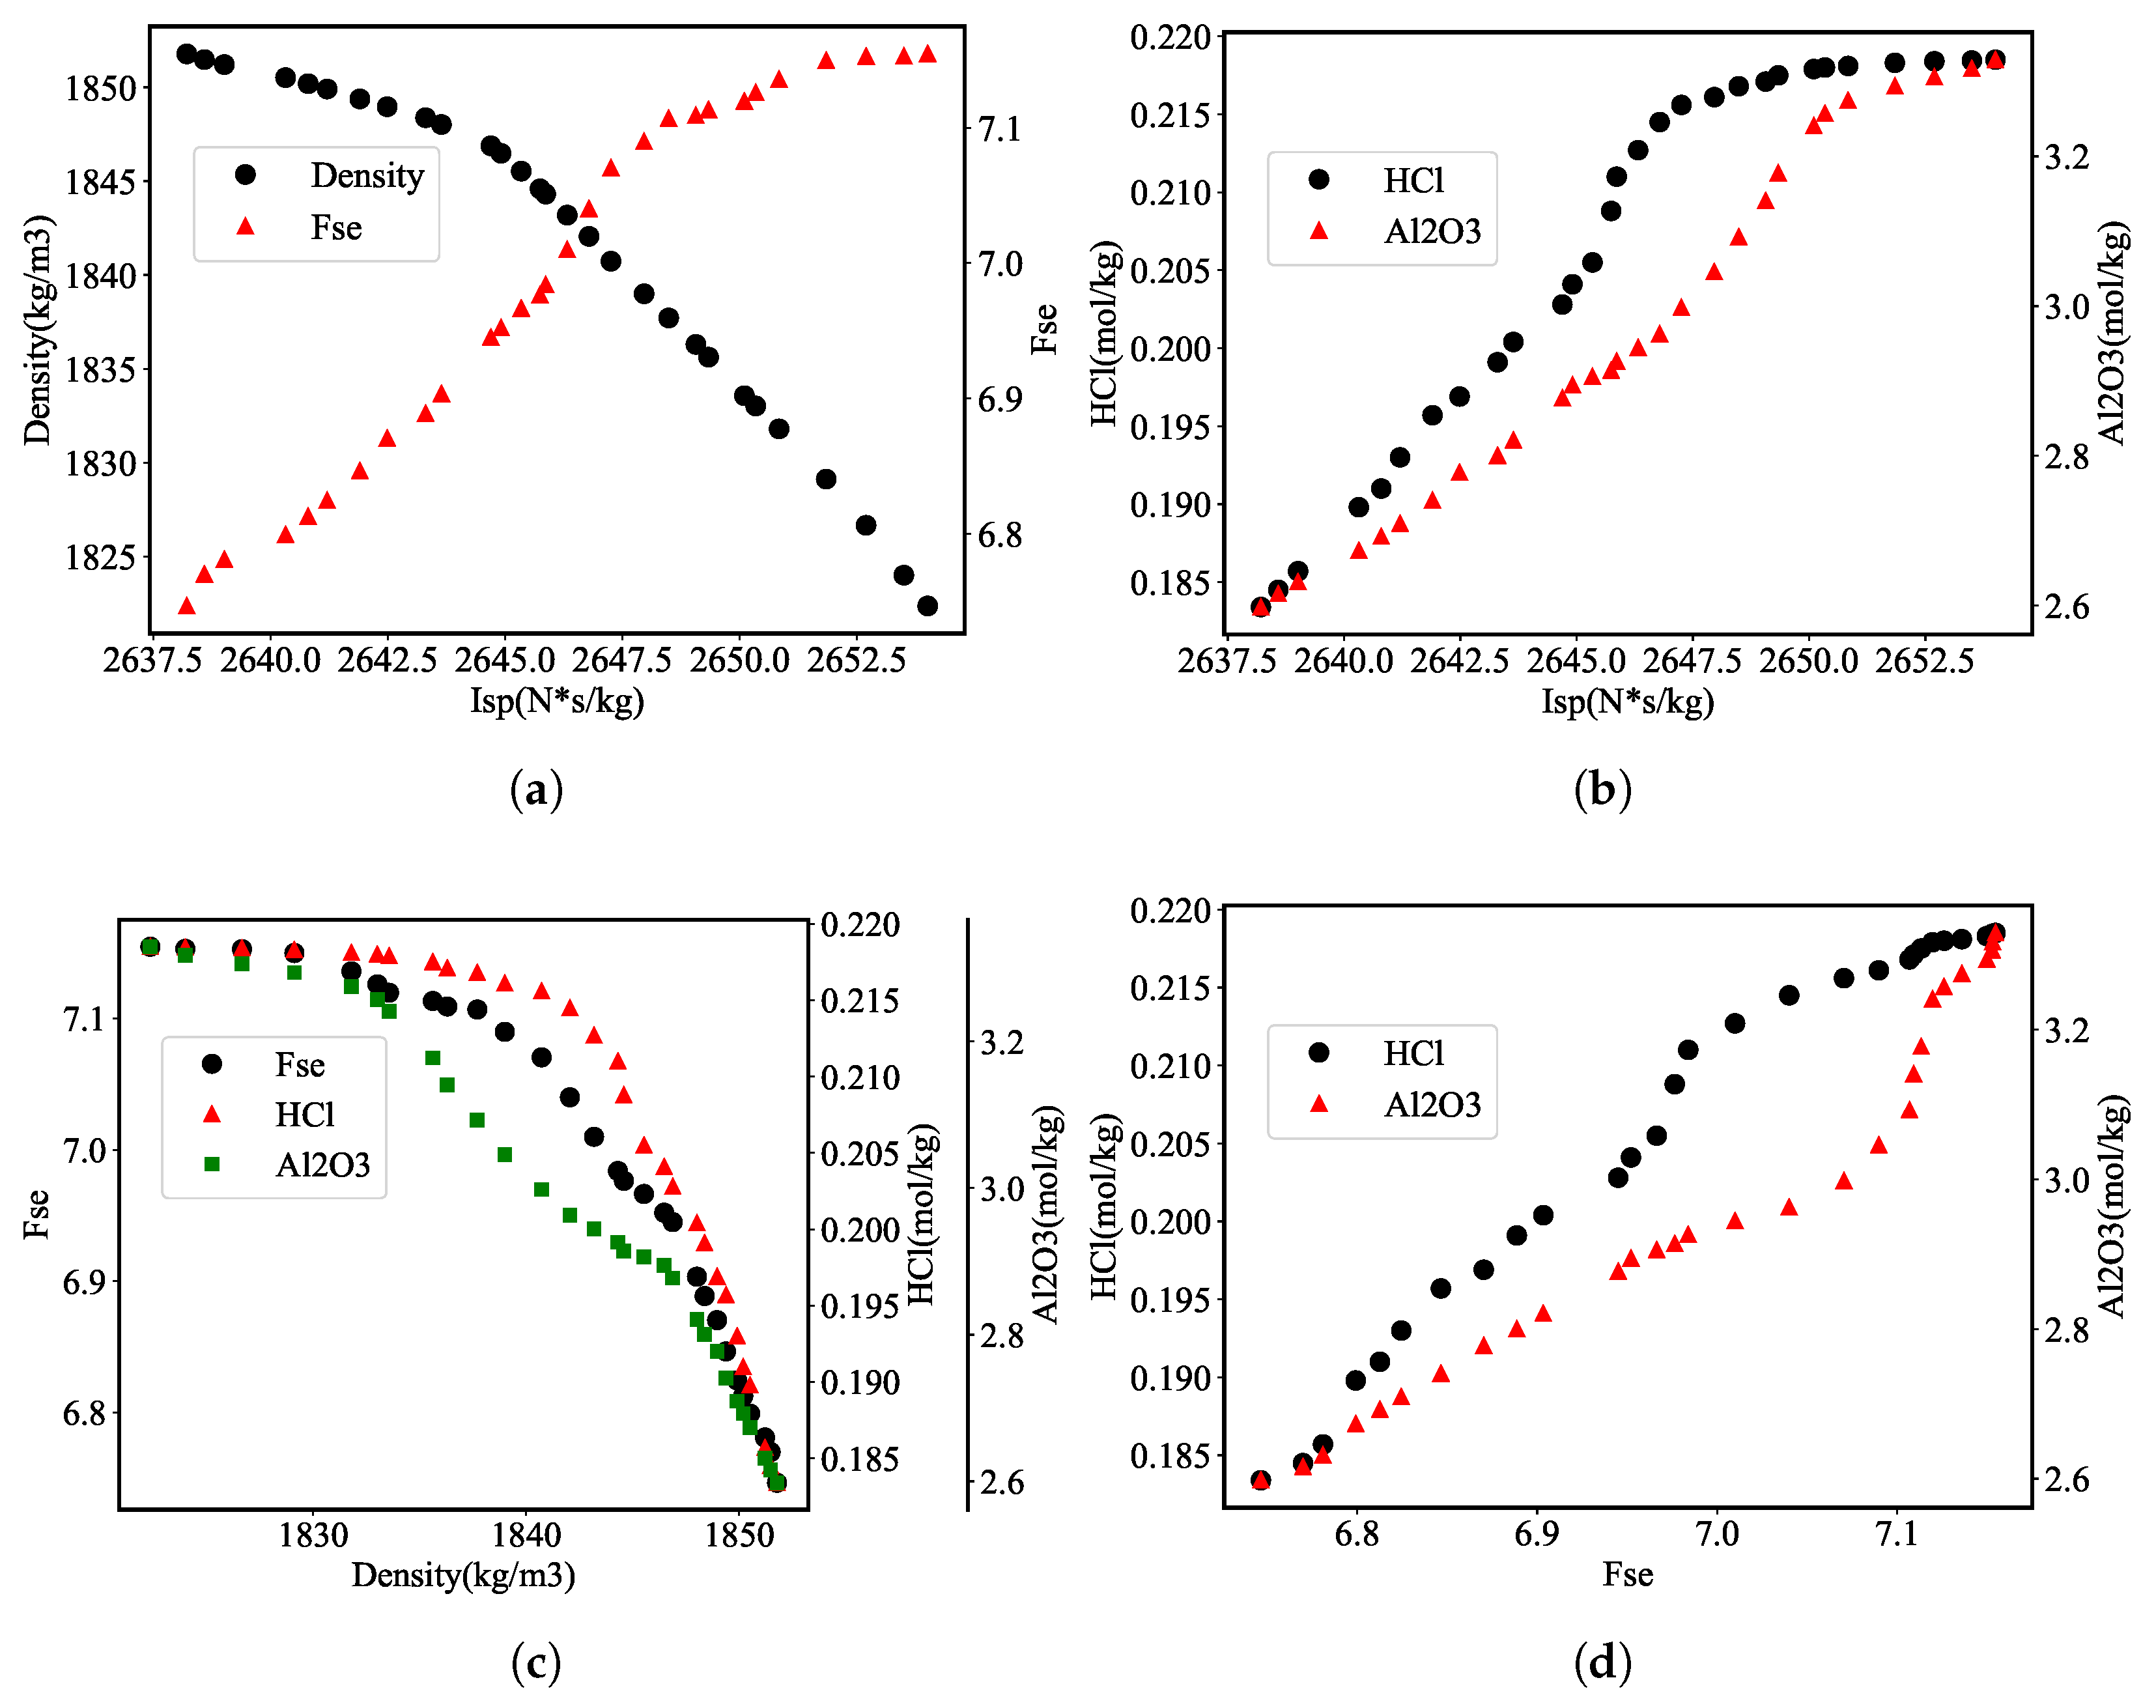
Figure 6 shows the Pareto front of the NEPE propellant. The values show the best propellant performance. When the uncertainty level of the standard enthalpy is ±10%, the maximum I s p is 2654.01 N·s·kg−1, while the values of ρ , G H C l , and G A l 2 O 3 are 1822.36 kg/m3, 0.219 mol/kg, and 4.95 mol/kg, respectively. The minimum I s p is 2638.21 N·s·kg−1, while ρ , G H C l , and G A l 2 O 3 are 1851.78 kg/m3, 0.183 mol/kg, and 4.55 mol/kg, respectively. In addition, as the optimal value of I s p increases, the corresponding ρ optimal value tends to decrease, while the optimal values of F s e , G H C l , and G A l 2 O 3 tend to increase.
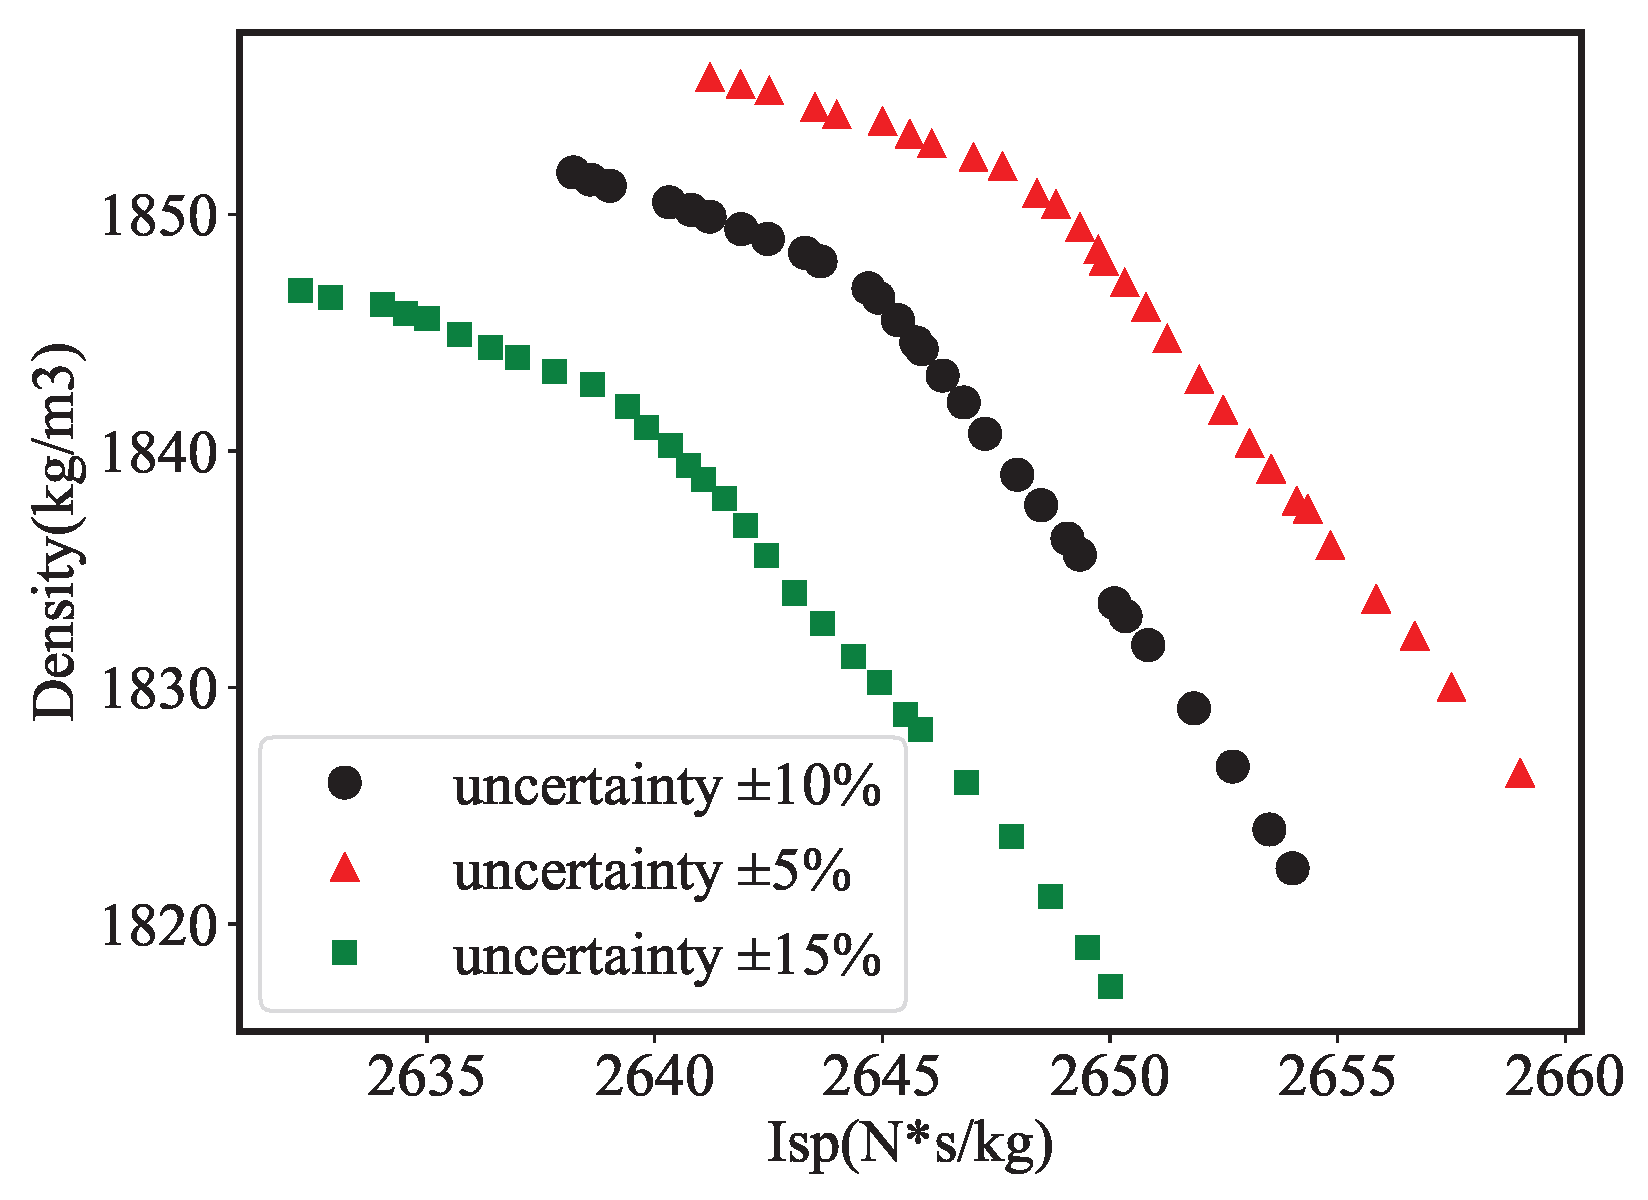
Figure 7 shows the Pareto front when the weight coefficient value is 0.5 and the uncertainty levels of the standard enthalpy are ±5%, ±10%, and ±15%, respectively. When the uncertainty level of the standard enthalpy decreases from ±15% to ±5%, the Pareto front of I s p ρ gradually expands towards the outer layer. This is because the decrease in uncertainty level reduces the radius of the objective function, resulting in an upward trend at the midpoint of the objective function; on the contrary, an increase in uncertainty level will lead to an increase in the radius of the objective function, weakening the ability to increase the midpoint of the objective function, and causing the Pareto front to gradually contract towards the inner layer.
When the uncertainty level is ±10% and the weight coefficients are 0, 0.25, 0.5, 0.75, and 1, the maximum intervals of the performances are shown in Table 14. The maximum intervals of I s p are [2649.44, 2658.41], [2645.21, 2652.08], [2643.47, 2648.88], [2640.95, 2644.69] and [2638.03, 2640.52], respectively. For G A l 2 O 3 , they are [4.68, 5.21], [4.62, 4.86], [4.60, 4.75], [4.56, 4.66] and [4.50, 4.61], respectively. For G H C l , they are [0.195, 0.241], [0.190, 0.224], [0.189, 0.213], [0.187, 0.196] and [0.182, 0.188], respectively. The uncertainty interval radii of I s p are 4.485, 3.435, 2.705, 1.870, and 1.245, respectively. For G A l 2 O 3 , they are 0.265, 0.120, 0.075, 0.050, and 0.055, respectively. For G H C l , they are 0.023, 0.017, 0.012, 0.0045, and 0.003, respectively. The midpoints of the maximum intervals of I s p are 2653.92, 2648.64, 2646.17, 2642.82, and 2639.27 N·s·kg−1, respectively. For G A l 2 O 3 , they are 4.945, 4.740, 4.675, 4.610, and 4.555 mol/kg, respectively. For G H C l , they are 0.218, 0.207, 0.201, 0.191, and 0.185 mol/kg, respectively. It can be seen that as the weight coefficient increases, the uncertainty interval radius of each performance indicator gradually decreases, and the midpoint also gradually decreases. This is because an increase in weight coefficient represents an increase in preference for the uncertain radius of the objective function, while, at the same time, showing a reducing preference for the midpoint of the objective function. Therefore, the optimal design will result in a smaller radius and midpoint of the objective function.
The maximum uncertainty levels of I s p are 0.169%, 0.130%, 0.102%, 0.071% and 0.047%, respectively. For G A l 2 O 3 , they are 5.36%, 2.53%, 1.60%, 1.08%, and 1.21%, respectively. For G H C l , they are 10.55%, 8.21%, 5.97%, 2.35%, and 1.62%, respectively. It can be seen that, as the weight coefficient increases, the maximum uncertainty increases. Therefore, if designers want more robust optimization results, they can appropriately increase the weight coefficients; on the contrary, if there are high requirements for the performance of the propellants, the weight coefficients can be appropriately reduced.
Table 15 shows some non-dominated propellant formulations when the weight coefficient is 0.5 and the uncertainty level is ±10%. Users can choose a set of solutions as the optimal propellant formulation based on their own preferences and design experience.
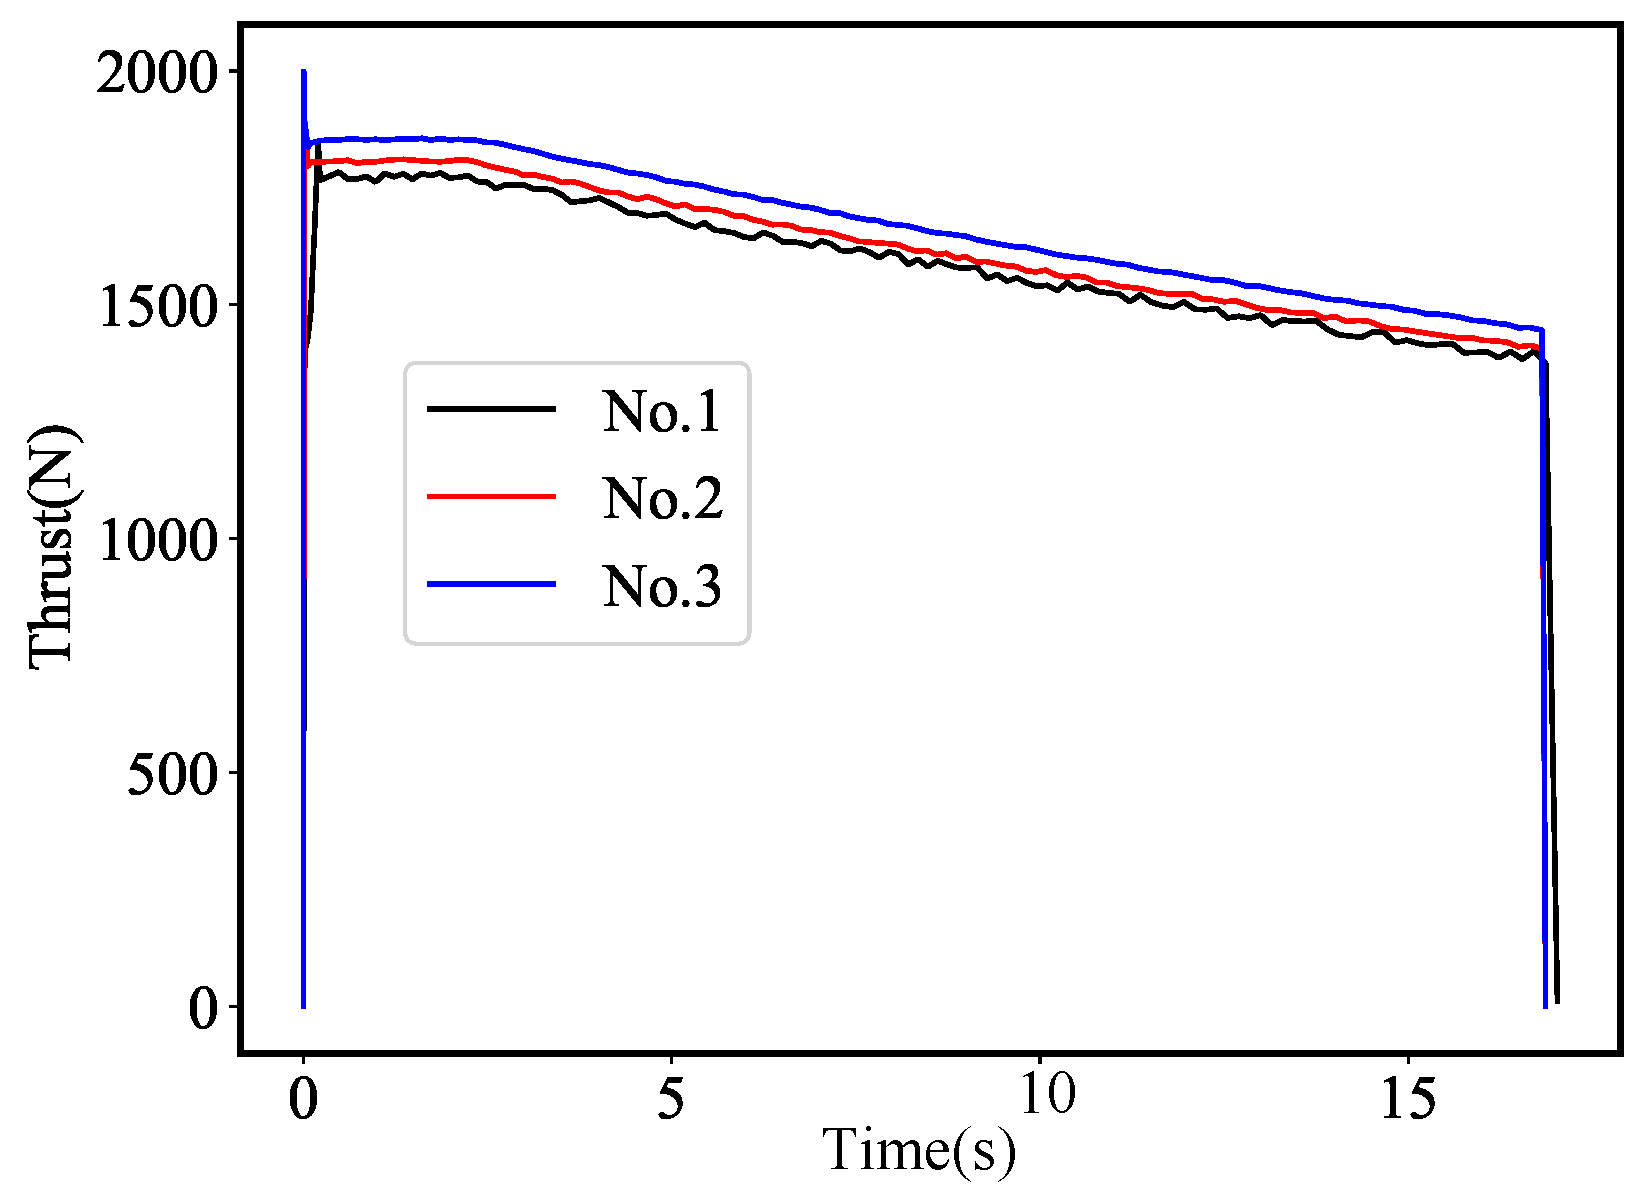
This paper selects the NO.1–NO.3 formulations in Table 15 as the experimental objects. The impact sensitivity tests show that the impact sensitivities of the NO.1–NO.3 propellants are about 6.289 J, 6.146 J, and 6.149 J, respectively. The thrust curves from the ground hot-fire tests are shown in Figure 8. The actual total impulse can be obtained by calculating the area enclosed by the curve, and the values are 26,709 N·s, 26,844 N·s, and 26,993 N·s for the NO.1–NO.3 propellants, respectively. Therefore, the actual specific impulse values are 2610.33 N·s/kg, 2624.05 N·s/kg, and 2638.67 N·s/kg, respectively. Due to the fact that the actual specific impulse can be influenced by nozzle losses, the actual specific impulse will be lower than the theoretical specific impulse. In order to facilitate a comparison between the theoretical and experimental values, both of them are normalized in [0, 1] (Table 16). The EDTA titration method and acid–base titration show that G A l 2 O 3 of the three propellant formulations are 2.591, 2.892, and 3.290 mol/kg, respectively.
The performance results of the NO.1–NO.3 propellants are shown in Table 16. The values in parentheses are normalized values. The normalized simulation values of I s p for the NO.1–NO.3 propellants are 0.000, 0.483, and 1.00, respectively, while the normalized experiment values are 0.000, 0.484, and 1.000. The simulation values of F s e for the NO.1–NO.3 propellants are 7.340 J, 7.281 J, and 7.222 J, respectively, while the experiment values are 7.289 J, 7.146 J, and 7.149 J, respectively. The Pearson correlation coefficients between the simulated and experimental data of I s p and F s e are 0.999 and 0.857, respectively, indicating a strong positive linear relationship. This shows that the simulation model effectively captures the trends and variations observed in the experimental measurements.
The simulation values of ρ for the three propellant formulations are 1851.92, 1849.05, and 1840.92 kg/m3, respectively, while the experimental values are 1851.00, 1849.00, and 1841.00 kg/m3. The average relative error is below 0.02%, and the Pearson correlation coefficient is 0.989. The simulation values of G A l 2 O 3 are 2.601, 2.883, and 3.273 mol/kg respectively, while the experimental values are 2.591, 2.892, and 3.290 mol/kg. The average relative error is 0.40%, and the Pearson correlation coefficient is 0.978. The simulation values of G H C l are 0.183, 0.198, and 0.216 mol/kg, respectively, compared to experimental values of 0.177, 0.203, and 0.209 mol/kg. The average relative error is 3.06%, while the Pearson correlation coefficient is 0.986. The above analysis confirms that the simulation model accurately calculates ρ , G A l 2 O 3 , and G H C l .
Compared with the experimental values of [45], I s p of the three propellant formulations shows increases of 0.02%, 0.55%, and 1.11%, respectively. G A l 2 O 3 of the NO.1 propellant decreases by 6.73%, while the NO.2 and NO.3 exhibit increases of 4.11% and 18.43%, respectively. For G H C l , NO.1 to NO.3 show reductions of 29.2%, 18.8%, and 16.4%, whereas F s e increases by 9.35%, 7.68%, and 1.67%, respectively. Although ρ exhibits reductions (<1.39%), the overall performance of the three formulations demonstrates a significant improvement over the formulation in [45]. This illustrates the effectiveness of the optimization method described in our study.

3.2. HTPB Solid Propellant

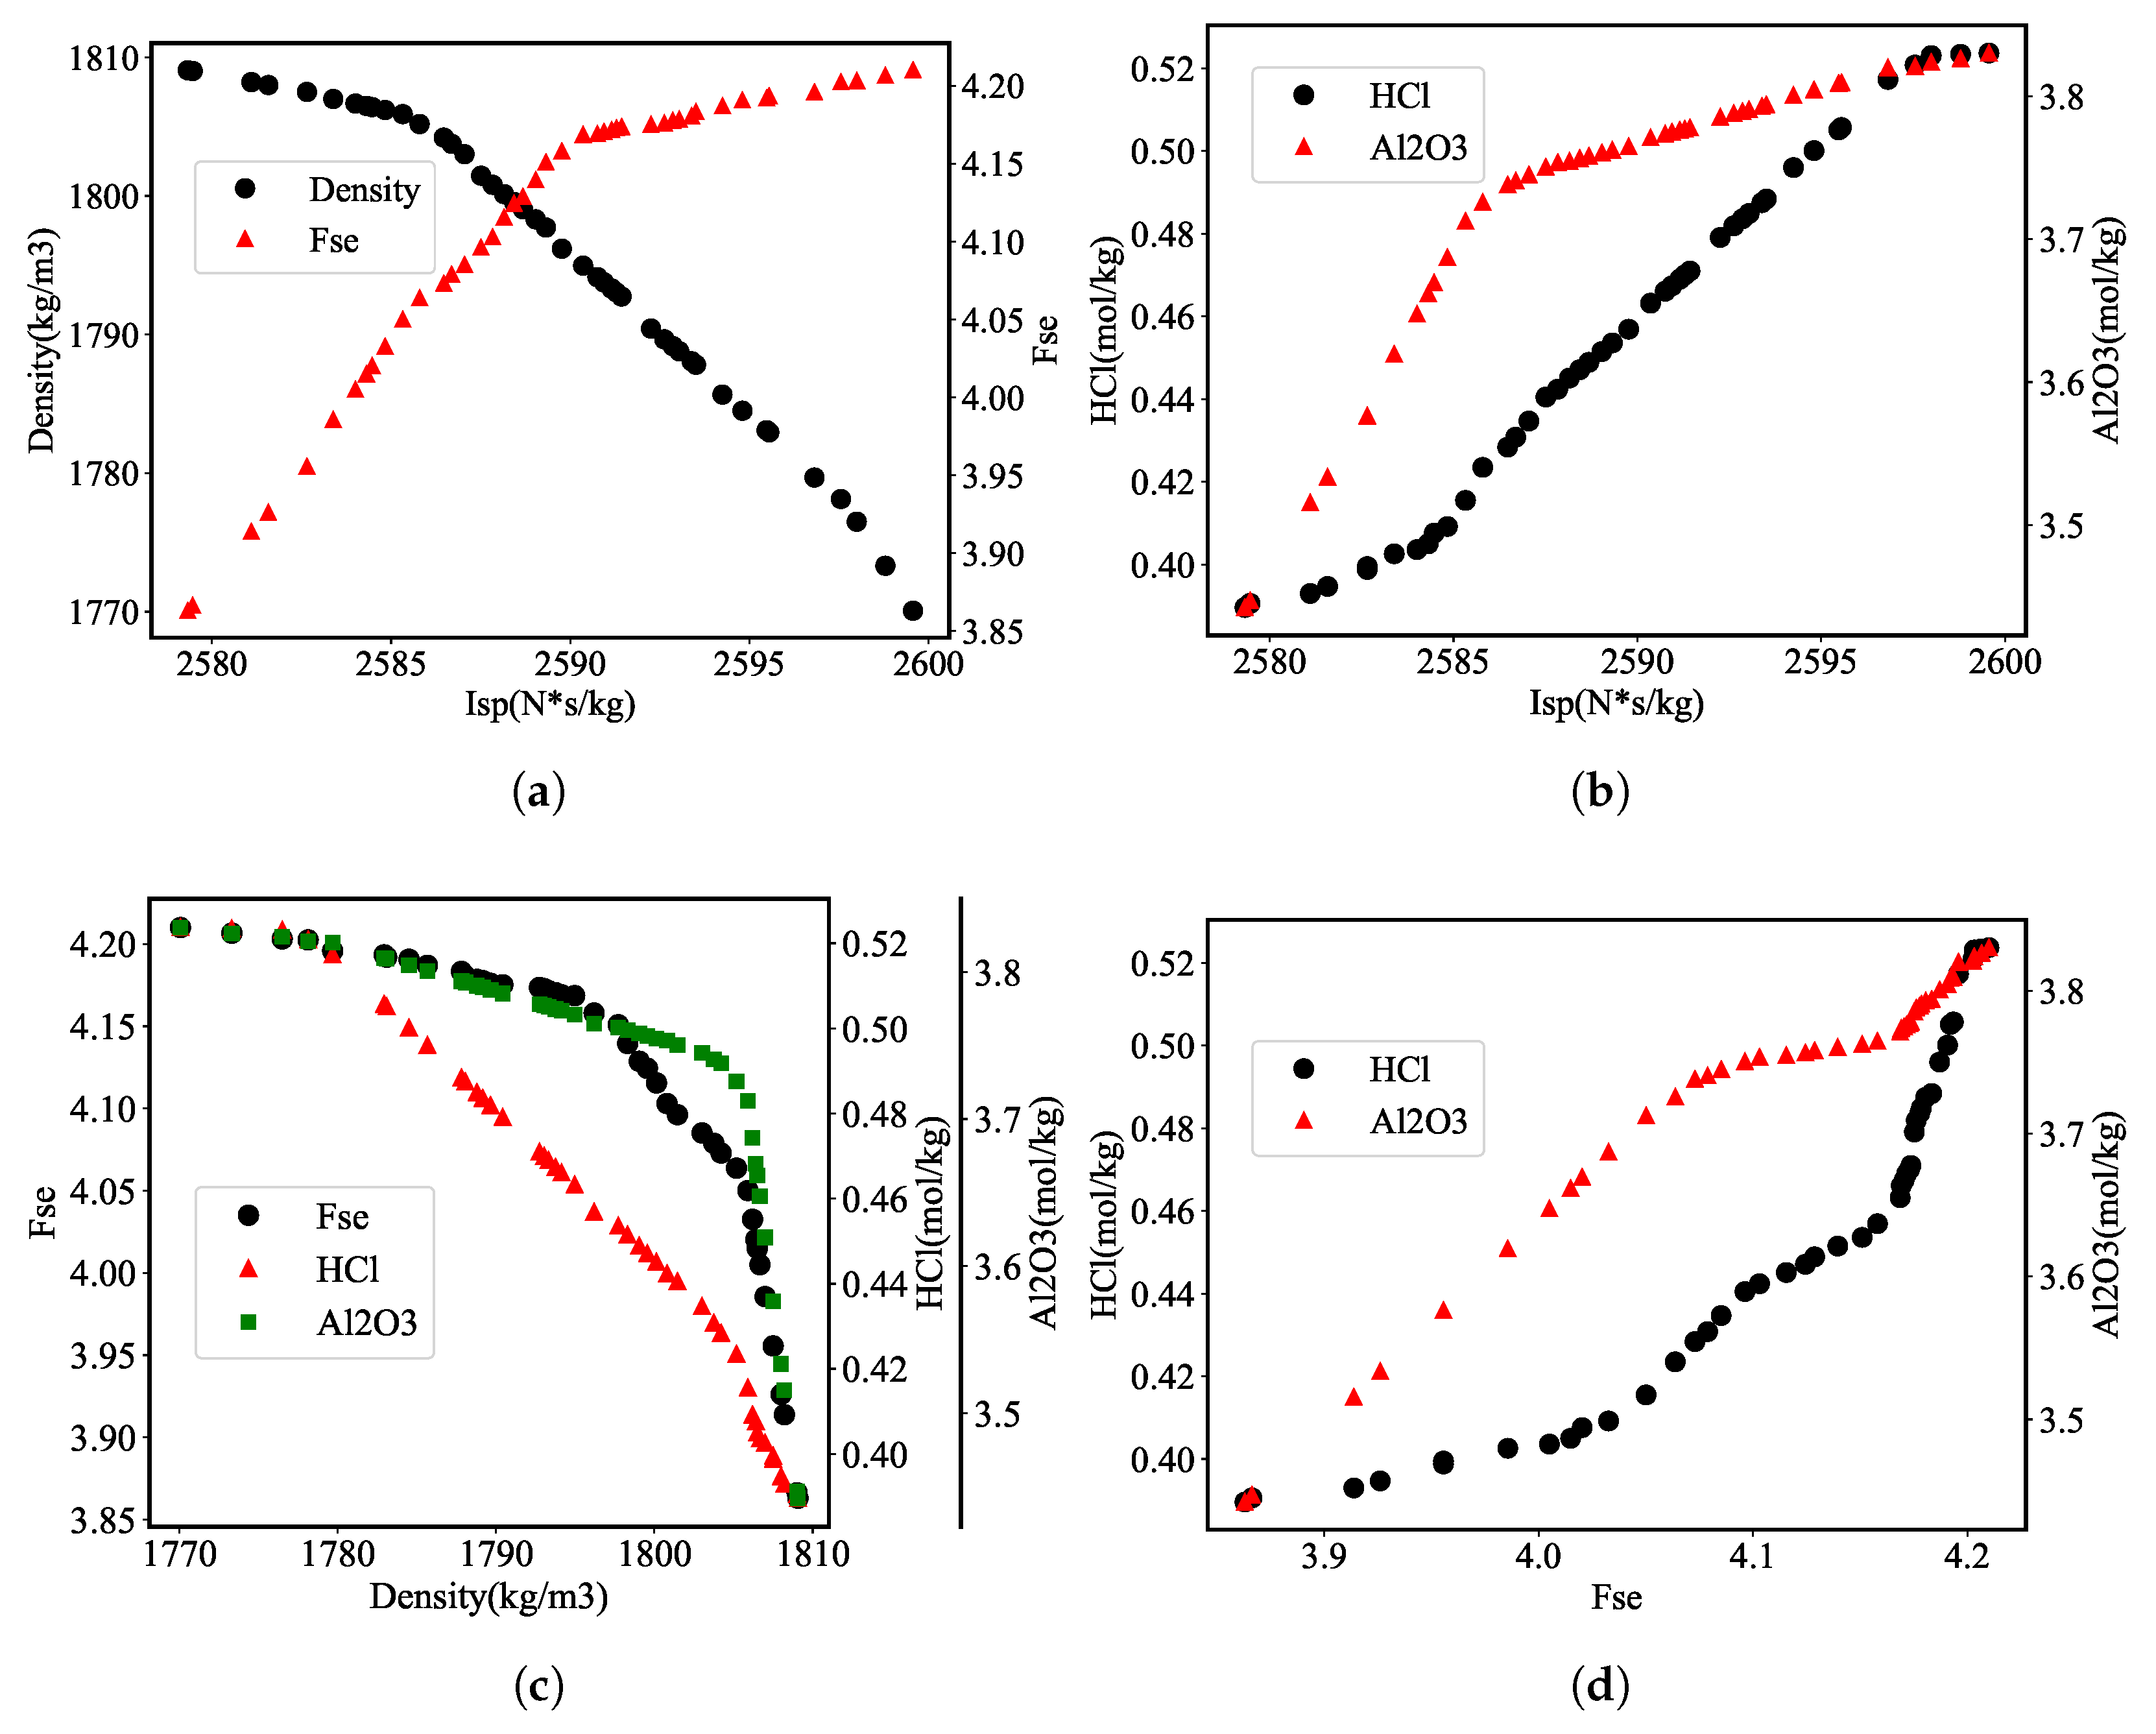
Figure 9 shows the Pareto front of the HTPB solid propellant when the uncertainty level is ±10%. The maximum I s p is 2599.56 N·s·kg−1, while the values of ρ , G H C l , and G A l 2 O 3 are 1770.01 kg/m3, 0.42 mol/kg, and 3.81 mol/kg, respectively. The minimum I s p is 2578.79 N·s·kg−1, while ρ , G H C l , and G A l 2 O 3 are 1808.82 kg/m3, 0.47 mol/kg, and 3.29 mol/kg, respectively. Similarly to the NEPE propellant, the optimal value of I s p is inversely proportional to the optimal value of ρ and is proportional to the optimal value of F s e , G H C l , and G A l 2 O 3 . An increase in the optimal value of ρ will lead to a decrease in the optimal value of F s e , G H C l , and G A l 2 O 3 ; the optimal value of F s e increases with the increase in the optimal value of G H C l and G A l 2 O 3 .
Table 17 and Table 18 give details on the HTPB formulations and the performance of some non-dominated solutions, respectively. It can be observed that, with an increase in the Al mass fraction from 13.78% to 17.01%, I s p increases from 2578.79 N·s·kg−1 to 2599.56 N·s·kg−1, accompanied by an increase in G A l 2 O 3 (3.29 mol/kg to 3.81 mol/kg). As the mass fraction of HTPB increases from 11.43% to 12.51%, the propellant density also decreases from 1808.82 kg/m3 to 1770.01 kg/m3. A decrease in the mass fraction of AP (71.87% to 70.05%) leads to a decrease in G H C l (0.47 mol/kg to 0.42 mol/kg).
When the weight coefficient is set to 0.5, and the uncertainty levels of standard enthalpy for each substance are set to ±5%, ±10%, and ±15% respectively, and the maximum uncertainty intervals between the performance indicators of the HTPB propellant are as shown in Table 19. The maximum uncertainty levels of I s p are 0.0782%, 0.1004%, and 0.1994%, respectively. For G A l 2 O 3 , they are 0.8621%, 0.9371%, and 2.9677%, respectively. For G H C l , they are 0.6635%, 0.7678%, and 1.0186%, respectively. Similarly to NEPE, as the uncertainty levels of standard enthalpy increases, the maximum uncertainty of the performance results increases.
To confirm the effectiveness of the formulation optimization method, the paper compares the propellant performance calculated by our method and experiment values from [46], and the results are shown in Table 20 and Table 21. Compared with the formulation from [46], our optimized formulation demonstrates comprehensive performance enhancements: G H C l is reduced by 20.54% (from 9.100 to 7.231 mol/kg), while G A l 2 O 3 decreases by 5.07% (from 6.800 to 6.455 mol/kg). Concurrently, I s p increases by 0.61% (2572.50 to 2588.17 (N·s·kg−1)), ρ improves by 1.48% (1776.38 to 1802.75 kg/m3), and F s e rises by 1.82% (3.83 to 3.90). All indicators show a slight improvement, which illustrates that the comprehensive performance is better after using the optimization method described in our paper.

4. Conclusions

In this study, an uncertain multi-objective optimization model for propellant performance calculation named MOEA/D-LLM was established by using a MOEA/D multi-objective optimization algorithm and interval order relationship. The model considers the influence of performance factors related to the solid propellant, such as energy, insensitivity, signature characteristics, and the uncertainty of the standard enthalpy of the propellant components. Based on the model, three types of propellants were optimized, and the corresponding Pareto front curves of the propellant formulation and performance were given. The following conclusions can be drawn from the analysis of the results:
(1)
The optimization results of ZDTs and UFs show that MOEA/D-LLM has the best HV value and the fasted convergence speed compared to NSGA-II and MOEA/D. MOEA/D-LLM achieves approximately a 4.0% improvement in hypervolume values compared to MOEA/D. For the NEPE propellant optimization case, MOEA/D-LLM reduces the computational time by about 13.05% and enhances hypervolume values by around 2.7% compared to MOEA/D.
(2)
The interval uncertain method avoids establishing a surrogate model compared to PCE, and it has better calculation accuracy than the PCE method.
(3)
The performance of the NEPE and HTPB propellant is improved using the optimization model we proposed. For NEPE, the specific impulse increases by 1.11%, the generation of aluminum oxide and hydrogen chloride decreases by approximately 18.43% and 16.40%, respectively, and the impact sensitivity is reduced by about 1.67%. For HTPB, the generation of aluminum oxide and hydrogen chloride is reduced by 20.54% and 5.07%, respectively. The specific impulse increases by 0.61%, the density improves by 1.48%, and the impact sensitivity is reduced by 1.82%.
(4)
When the optimal specific impulse value is raised, there is a trend of the optimal density value decreasing and the optimal impact sensitivity factor value, A l 2 O 3 , and H C l , production increasing. Designers can choose the appropriate propellant ratio according to experience and demand.
(5)
When the uncertainty level of the standard heat of formation of each propellant component is increased, the uncertainty interval radius of each performance index gradually increases. When the weight coefficient in the MOEA/D algorithm is increased, the uncertainty interval radius of each performance index gradually decreases, but at the same time, the performance will also decline. Designers can adjust the weight coefficient and uncertainty level of the MOEA/D algorithm according to the actual optimization robustness requirements. When more emphasis is placed on the robustness of propellant performance, designers should appropriately increase the uncertainty level of the propellant property parameters and decrease the weighting coefficient of MOEA/D. In contrast, if higher performance propellants are desired, it is necessary to reduce the level of uncertainty and increase the weight coefficient of MOEA/D while ensuring minimal propellant losses.
Due to the fact that the optimization objective in this article only involves three aspects—energy, signature characteristics, and impact sensitivity—it does not take into account more propellant performance indicators, such as cost, mechanical properties, combustion performance, etc. Furthermore, a more effective mathematical model needs to be established to characterize the performance of propellants in the future. In addition, the experiment for impact sensitivity takes no account of ingredient properties or homogeneity. In future work, we will conduct experiments to consider the relationship between homogeneity and sensitivity.

Author Contributions

Conceptualization, F.B.; formal analysis, J.R.; investigation, R.W.; data curation, J.R.; writing—original draft preparation, J.R.; writing—review and editing, F.B.; supervision, X.H. All authors have read and agreed to the published version of the manuscript.

Funding

This research was funded by the National Natural Science Foundation of China (NSFC) (grant number: 52302479).

Data Availability Statement

The original contributions presented in this study are included in the article. Further inquiries can be directed to the corresponding author.

Conflicts of Interest

The authors declare no conflicts of interest.

References

  1. Pang, A.; Wu, J.; Xu, H.; Wu, F. Development of Advanced Low Signature Characteristics Propellant. Chin. J. Solid Mech. 2003, 26, 43–50. [Google Scholar] [CrossRef]
  2. Wang, Z.; Pang, A.; He, J.; Lei, Q. Application and Development of Energetic Compounds in Solid Propellant. J. Solid Rocket Technol. 2025, 48, 1–8. [Google Scholar] [CrossRef]
  3. Dong, W.; Zhao, H.; Geng, G.; Li, M. Computer-aided Conceptual Design Method of Double-base Solid Propellant Formulation. Chin. J. Energetic Mater. 2017, 25, 1018–1024. [Google Scholar] [CrossRef]
  4. Tian, D. Graphical Method for Calculating the Performance of Smokeless Propellant. Acta Armam. 1980, 4, 11. [Google Scholar]
  5. Swaminathan, V.; Madhavan, N.; Chacko, C. A Penalty Function Approach to the Optimization of Chemical Propellant Systems using the fletcher-powell algorithm. Propellants Explos. Pyrotech. 1982, 7, 96–99. [Google Scholar] [CrossRef]
  6. Tian, D. Optimization and Design of Solid Propellant Formulations, 3rd ed.; National Defense Industry Press: Beijing, China, 2013; pp. 1–95. [Google Scholar]
  7. Yu, Z.; Yao, W.; Fu, X.; Wei, H.; Tan, G. Theoretical Study on Formulation Optimization for Multi-Index Solid Propellant. Trans. Beijing Inst. Technol. 2017, 37, 1310–1314. [Google Scholar] [CrossRef]
  8. Guo, Y.; Wu, Y.; Zhao, F. Intelligent Design for the Burning Rate of MDB Propellants Containing RDX. Chin. J. Explos. Propell. 2022, 45, 814–820. [Google Scholar] [CrossRef]
  9. Klinger, D.; Casey, A.; Manship, T.; Son, S. Prediction of Solid Propellant Burning Rate Characteristics Using Machine Learning Techniques. Propellants Explos. Pyrotech. 2023, 48, e202200267. [Google Scholar] [CrossRef]
  10. Tian, D. Optimization Design Method of Solid Propellant Formulation and Its Software System. Chin. J. Explos. Propell. 2014, 37, 1–23. [Google Scholar] [CrossRef]
  11. Fan, L.; Pan, G.; Ou, Y.; Chen, X.; Feng, G. Application of Genetic Algorithm-Support Vector Machine in Formula Optimization of Mg/PTFE Fuel Rich Propellant. J. Propul. Technol. 2012, 33, 620–624. [Google Scholar] [CrossRef]
  12. Zhao, J.; Zhang, W. Improved Particle Swarm Algorithm to Lower Signature Characteristics of Solid Propellant. Comput. Eng. Appl. 2017, 53, 136–141. [Google Scholar] [CrossRef]
  13. Hao, Y.; Zhao, C.; Zhang, Y.; Cao, Y.; Li, Z. Constrained Multi-objective Optimization Problems: Methodologies, Algorithms and Applications. Knowl.-Based Syst. 2024, 299, 11198. [Google Scholar] [CrossRef]
  14. Zhou, W.; Liu, B.; Zhang, Y.; Ma, Y.; Wang, X. Multi-objective Optimization for HTPB Propellant Breaking Process by Submerged Cavitating Water Jet. Chin. J. Explos. Propell. 2022, 45, 227–284. [Google Scholar] [CrossRef]
  15. Liu, C.; Wang, B.; Ma, Y. Multi-objective Optimization Design of High-rise Diagrid Structure Based on Non-dominated Sorting Genetic Algorithm II. J. Build. Eng. 2025, 108, 112801. [Google Scholar] [CrossRef]
  16. Li, Y.; Lei, J.; Ren, S. Multi-objective Optimization and Machine Learning for the Temperature Distribution Measurement Using Acoustic Tomography. Appl. Therm. Eng. 2025, 277, 127113. [Google Scholar] [CrossRef]
  17. Nishi, Y.; Konno, K. Multi-objective Optimization Design Method for Single-blade Centrifugal Pump Impellers to Improve Performance and Reduce Radial Thrust. Eur. J. Mech. B-Fluids 2025, 114, 204311. [Google Scholar] [CrossRef]
  18. Ma, Y.; Li, M.; Wang, M. Improve Thermal Efficiency And Reduce NOx Emission of Circulating Fluidized Bed Boiler Based on Multi-objective Optimization Framework. Therm. Sci. Eng. Prog. 2025, 64, 103753. [Google Scholar] [CrossRef]
  19. Peng, W.; Zhang, Q. A Decomposition-based Multi-objective Particle Swarm Optimization Algorithm for Continuous Optimization Problems. In Proceedings of the 2008 IEEE International Conference on Granular Computing, Hangzhou, China, 26–28 August 2008. [Google Scholar] [CrossRef]
  20. Xue, Y.; Cai, X.; Neri, F. A multi-objective evolutionary algorithm with interval based initialization and self-adaptive crossover operator for large-scale feature selection in classification. Appl. Soft Comput. 2022, 127, 109420. [Google Scholar] [CrossRef]
  21. Lin, A.; Yu, P.; Cheng, S.; Xing, L. One-to-one ensemble mechanism for decomposition-based multi-Objective optimization. Swarm Evol. Comput. 2022, 68, 101007. [Google Scholar] [CrossRef]
  22. Katharine, S. GPT-4 is Here: What Scientists Think. Nature 2023, 615, 773. [Google Scholar] [CrossRef]
  23. Thiago, R.; Felix, L.; Stefan, M. Large Language Model-assisted Surrogate Modelling for Engineering Optimization. In Proceedings of the 2nd IEEE Conference on Artificial Intelligence, Marina Bay Sands, Singapore, 25–27 June 2024. [Google Scholar] [CrossRef]
  24. Hu, Y.; Wang, Q. Hyperparameter Optimization of Object Detection Networks Based on Large Language Models. In Proceedings of the 50th Annual Conference of the IEEE Industrial Electronics Society, Chicago, IL, USA, 3–6 November 2024. [Google Scholar] [CrossRef]
  25. Hameed, S.; Qolomany, B.; Belhaouari, S.B.; Abdallah, M.; Qadir, J.; Al-Fuqaha, A. Large Language Model Enhanced Particle Swarm Optimization for Hyperparameter Tuning for Deep Learning Models. IEEE Open J. Comput. Soc. 2025, 6, 574–585. [Google Scholar] [CrossRef]
  26. Lange, R.; Schaul, T.; Chen, Y.; Zahavy, T.; Dalibard, V.; Lu, C.; Singh, S.; Flennerhag, S. Discovering Evolution Strategies via Meta-Black-Box Optimization. In Proceedings of the Companion Conference on Genetic and Evolutionary Computation, New York, NY, USA, 29–30 July 2023. [Google Scholar] [CrossRef]
  27. Xiong, F.; Li, Z.; Liu, Y.; Xia, H. A Review of Characterization Methods for Parameter Uncertainty in Engineering Design Based on Numerical Simulation. Acta Aeronaut. Astronaut. Sin. 2023, 44, 92–123. [Google Scholar] [CrossRef]
  28. Li, M.; Zhao, F.; Xu, S.; Gao, X.; Yi, J. Comparison of Three Kinds of Energy Calculation Programs in Formulation Design of Solid Propellants. Chin. J. Explos. Propell. 2013, 36, 73–77. [Google Scholar] [CrossRef]
  29. Liu, J.; Yang, G.; Wang, L.; Xue, L. Interval Uncertainty Analysis of Ultra-light Artillery Firing Process Based on Polynomial Chaos Expansion. J. Vib. Shock 2025, 44, 132–139. [Google Scholar] [CrossRef]
  30. Mahmoud, H.; Sharaf, M.; El-Meligy, M. An Adaptive Robust Optimization Model for Transmission Expansion Planning Considering Uncertain Intervals. Int. J. Electr. Power Energy Syst. 2024, 157, 109821. [Google Scholar] [CrossRef]
  31. Yao, X.; Wang, F.; Yuan, J.; Wang, X. Path Planning for Autonomous Underwater Vehicles Based on Interval Optimization in Uncertain Flow Fields. Ocean Eng. 2021, 234, 108675. [Google Scholar] [CrossRef]
  32. Chen, Y.; Zhong, R.; Wang, Q.; Chen, L.; Qin, B. Free Vibration Analysis and Multi-objective Robust Optimization of Three-dimensional Pyramidal Rruss Core Sandwich Plates with Interval Uncertain Parameters. Eur. J. Mech. A-Solids 2024, 108, 105401. [Google Scholar] [CrossRef]
  33. Moore, R. Methods and Applications of Interval Analysis, 3rd ed.; Prentice-Hall Inc.: London, UK, 1979; pp. 1–50. [Google Scholar]
  34. Gao, S. Theoretical Prediction of Sensitivity of Mixed Explosives. Master’s Thesis, North University of China, Taiyuan, China, 2011. [Google Scholar]
  35. Huang, S. Research on Mechanical Sensitivity Prediction Model of Composite Explosives. Master’s Thesis, North University of China, Taiyuan, China, 2013. [Google Scholar]
  36. Michalchuk, A.; Hemingway, J.; Morrison, C. Predicting the impact sensitivities of energetic materials through zone-center phonon up-pumping. J. Chem. Phys. 2021, 154, 064105. [Google Scholar] [CrossRef] [PubMed]
  37. Rice, B.; Hare, J. A Quantum Mechanical Investigation of the Relation between Impact Sensitivity and the Charge Distribution in Energetic Molecules. J. Phys. Chem. 2002, 106, 1770–1783. [Google Scholar] [CrossRef]
  38. Mathieu, D. Sensitivity of Energetic Materials: Theoretical Relationships to Detonation Performance and Molecular Structure. Ind. Eng. Chem. Res. 2017, 56, 8191–8201. [Google Scholar] [CrossRef]
  39. Wang, S. An Approach for Predicting Propellant Stability and Sensitivity to Impact ETC Based on Propellant Compositions. J. East China Inst. Technol. 1993, 1, 64–69. [Google Scholar]
  40. Jiang, C.; Han, X.; Liu, G.; Liu, G. A Nonlinear Interval Number Programming Method for Uncertain Optimization Problems. Eur. J. Oper. Res. 2008, 188, 1–13. [Google Scholar] [CrossRef]
  41. Yao, S.; Liu, F.; Lin, X.; Lu, Z.; Wang, Z.; Zhang, Q. Multi-Objective Evolution of Heuristic Using Large Language Model. In Proceedings of the 9th Annual AAAI Conference on Artificial Intelligence, Philadelphia, PA, USA, 25 February–4 March 2025. [Google Scholar] [CrossRef]
  42. QJ 3039-1998; Test Method for Drop Weight Impact Sensitivity of Composite Solid Propellants. Industry Standard-Aerospace: Beijing, China, 1997.
  43. Li, X.; Cao, L.; Peng, W.; Zhao, S.; Liu, M. A Study on Diffusion of HCl and Al2O3 in solid rocket motor combustion-gas. J. Propul. Technol. 1994, 1, 45–51. [Google Scholar] [CrossRef]
  44. Cheng, X.; Zhao, X.; Li, J. Effect of Al on Sensitivity of NEPE Propellant. Chin. J. Energet. Mater. 2013, 21, 61–63. [Google Scholar] [CrossRef]
  45. Xie, W.; Zhao, Y.; Zhang, W.; Liu, Y.; Fan, X. Sensitivity and Stability Improvements of NEPE Propellantsby Inclusion of FOX-7. J. Explos. Propell. 2018, 43, 308–314. [Google Scholar] [CrossRef]
  46. Song, X.; Gao, X.; Kou, Y.; Yu, Z.; Wang, Y.; An, C.; Li, F. Thermolysis and sensitivities of solid propellants using characterized nano oxidizers involving energy performance evaluation. FirePhysChem 2022, 2, 323–333. [Google Scholar] [CrossRef]
Figure 1. MOEA/D-LLM framework and a prompt example.
Aerospace 12 00865 g001
Figure 2. Two-layer nested optimization.
Aerospace 12 00865 g002
Figure 3. Ignition process of solid propellant flake. (a) Localized ignition occurs within the circled area. (b,c) Visible smoke is ejected outward from the circled area.
Aerospace 12 00865 g003
Figure 4. Schematic diagram of the drop hammer device.
Aerospace 12 00865 g004
Figure 5. Hypervolume values vs. number of evaluations of NSGA-III, MOEA/D, and MOEA/D-LLM.
Aerospace 12 00865 g005
Figure 6. The Pareto front of I s p and other performance metrics for the NEPE propellant (uncertainty level ±10%). (a) The Pareto front of I s p ρ and I s p F s e . (b) The Pareto front of I s p G A l 2 O 3 and I s p G H C l . (c) The Pareto front of ρ G A l 2 O 3 and ρ G H C l . (d) The Pareto front of F s e G A l 2 O 3 and F s e G H C l .
Aerospace 12 00865 g006
Figure 7. The Pareto front of specific impulse and density under different uncertainty levels.
Aerospace 12 00865 g007
Figure 8. The thrust curves of the NEPE propellant.
Aerospace 12 00865 g008
Figure 9. The Pareto front of I s p and other performance metrics for HTPB propellant (uncertainty level ±10%). (a) The Pareto front of I s p ρ and I s p F s e . (b) The Pareto front of I s p G A l 2 O 3 and I s p G H C l . (c) The Pareto front of ρ G A l 2 O 3 and ρ G H C l . (d) The Pareto front of F s e G A l 2 O 3 and F s e G H C l .
Aerospace 12 00865 g009
Table 1. Parameter settings of MOEA/D and MOEA/D-LLM.
Parameter NameValue
Number of subproblems (N)200 for bi-objective, 300 for tri-objective
Number of weight vectors in neighborhood (T)N/10
Maximum number of evaluations ( N m a x )200,000 for ZDT, 300,000 for UF
Crossover probability ( σ 1 )1.0
Mutation probability ( σ 2 )0.9
Neighborhood selection probability ( σ 3 )0.9
Number of individuals (l)10
Number of new individuals (s)2
LLMGPT-4o
Table 2. A comparison of results on ZDT and UF instances in terms of HV.
ProblemNSGA-IIMOEA/DMOEA/D-LLM
ZDT10.72200.72240.7222
ZDT20.44660.44700.4468
ZDT30.60040.59960.5996
ZDT40.71920.71910.7207
ZDT60.38990.39010.3901
UF10.60870.55340.7201
UF20.69160.68490.7136
UF30.46110.37130.7111
UF40.39120.36500.4023
UF50.26470.15700.2690
UF60.34910.18950.3132
UF70.49800.28550.5785
UF80.31430.38910.4681
UF90.59880.59320.6751
The best one is highlighted in bold.
Table 3. A comparison of running time on ZDT and UF instances.
ProblemNSGA-IIMOEA/DMOEA/D-LLM
ZDT1172.03 s128.88 s132.45 s
ZDT2175.67 s129.92 s131.62 s
ZDT3179.48 s140.51 s140.38 s
ZDT4165.45 s123.21 s114.72 s
ZDT6164.82 s124.44 s115.60 s
UF1185.88 s152.20 s140.56 s
UF2180.63 s146.86 s139.22 s
UF3176.19 s138.21 s130.32 s
UF4178.89 s138.32 s128.03 s
UF5175.55 s140.53 s131.17 s
UF6180.72 s134.45 s135.68 s
UF7171.39 s129.95 s121.14 s
UF8169.94 s132.46 s127.32 s
UF9178.92 s134.66 s122.67 s
The best one is highlighted in bold.
Table 4. Parameter settings of PSO.
Parameter NameValue
Number of particles ( N p )100
Maximum number of evaluations ( N m a x )200
Initial inertia weight ( w i n i t i a l )0.9
Final inertia weight ( w f i n a l )0.1
Cognitive factor ( c 1 )1.5
Social factor ( c 2 )1.5
Max velocity ( v m a x )2
Table 5. Parameter settings of MOEA/D-LLM.
Parameter NameValue
Number of weight vectors in neighborhood (T)10
Maximum number of evaluations ( N m a x )40,000
Crossover probability ( σ 1 )1.0
Mutation probability ( σ 2 )0.9
Neighborhood selection probability ( σ 3 )0.9
Number of individuals (l)10
Number of new individuals (s)2
Table 6. Physical property parameters of NEPE propellant.
ComponentDensity
/(kg/m3)
Impact Sensitivity FactorMass Fraction BoundaryStandard Enthalpy
/(kcal/mol)
PEG113010[5%, 10%]−109.89
NG16001[7%, 11%]−64.65
BTTN15204.5[7%, 11%]−98.90
AP19501.5[10%, 20%]−69.36
Al27009[10%, 20%]-
HMX19003[35%, 45%]17.87
TPB159010[0%, 3%]112.04
Table 7. Physical property parameters of HTPB propellant.
ComponentDensity/(kg/m3)Impact Sensitivity FactorMass Fraction BoundaryStandard Enthalpy
/(kcal/mol)
HTPB0.9210[8%, 15%]−4.06
AP1.951.5[60%, 80%]−69.36
Al2.709[12%, 18%]-
Fe 2 O 3 1.5910[0%, 3%]−197.00
Table 8. The parameters of the solid rocket motor.
Name of the ParametersValue
Throat diameter of the nozzle0.014 m
Nozzle expansion ratio13
Throat ablation rate0.2 mm/s
The initiation time of nozzle ablation2 s
The mass of the propellant10.23 kg
Table 9. Comparison of the impact sensitivity factor between ours and experiments from [44].
PEG/%NG/%BTTN/%AP/%Al/%HMX/%TPB/%Ours/JExperiment/J
9.209.6010.6016.006.0048.000.606.236.31
9.209.6010.6016.0016.0038.000.606.936.78
9.209.6010.6016.0024.0030.000.607.257.41
Table 10. Comparison of I s p , G A l 2 O 3 , and G H C l between ours and experiments from [45].
I sp /(N·s·kg−1) G Al 2 O 3 /% G HCl /%
Ours2639.597.4414.01
Reference [45]2639.807.5014.00
Table 11. The statistical test results of hypervolumes of three algorithms.
Algorithm NameMean HV ± StdBest HVWorst HV
NSGA-III0.815 ± 0.0320.8620.760
MOEA/D0.822 ± 0.0280.8680.765
MOEA/D-LLM0.847 ± 0.0190.8800.800
Table 12. The optimal result of PCE.
The Order of PCEThe Total Number of SamplesPrediction/
(N·s·kg−1)
Actual Value/
(N·s·kg−1)
Relative Error
418202646.422643.170.1228%
561882644.652644.880.0087%
618,5632645.292645.120.0064%
Table 13. Maximum intervals of performance under different uncertainty levels of standard enthalpy.
Uncertain LevelMaximum Interval of I sp /(N·s·kg−1)Maximum Interval of G Al 2 O 3 /(mol/kg)Maximum Interval of G HCl /(mol/kg)
±5%[2635.74, 2639.11][4.26, 4.39][0.2406, 0.2458]
±10%[2628.34, 2635.75][3.93, 4.03][0.2553, 0.2625]
±15%[2625.66, 2637.86][3.85, 3.91][0.2542, 0.2656]
Table 14. Maximum intervals of performances under different weights of MOEA/D.
WeightMaximum Interval of I sp /(N·s·kg−1)Maximum Interval of G Al 2 O 3 /(mol/kg)Maximum Interval of G HCl /(mol/kg)
0[2649.44, 2658.41][4.68, 5.21][0.195, 0.241]
0.25[2645.21, 2652.08][4.62, 4.86][0.190, 0.224]
0.5[2643.47, 2648.88][4.60, 4.75][0.189, 0.213]
0.75[2640.95, 2644.69][4.56, 4.66][0.187, 0.196]
1[2638.03, 2640.52][4.50, 4.61][0.182, 0.188]
Table 15. The propellant formulation corresponding to some non-dominated solutions.
Index12345
PEG6.89%6.69%7.21%6.87%7.55%
NG8.52%10.61%9.84%8.14%10.58%
BTTN9.84%6.94%7.04%7.36%8.36%
AP14.36%13.38%16.79%15.13%14.69%
Al20.25%18.54%18.34%19.29%21.01%
HMX39.61%41.14%40.21%40.77%37.34%
TPB0.54%2.71%0.48%2.43%0.47%
Table 16. A comparison of the performance metrics of the NO.1–NO.3 formulation (shown in Table 15). Simulation and experimental values are shown.
Formulation I sp /(N·s·kg−1) ρ /(kg/m3) G Al 2 O 3 /mol/kg G HCl /mol/kg F se
NO.1 Exp.2610.33 (0.000)1851.002.5910.1777.289 J
NO.1 Sim.2638.10 (0.000)1851.922.6010.1837.340 J
NO.2 Exp.2624.05 (0.484)1849.002.8920.2037.146 J
NO.2 Sim.2642.50 (0.483)1849.052.8830.1987.281 J
NO.3 Exp.2638.67 (1.000)1841.003.2900.2097.149 J
NO.3 Sim.2647.20 (1.000)1840.923.2730.2167.222 J
[45] Exp.2609.801866.972.7780.2506.990 J
Table 17. The propellant formulations of some non-dominated solutions.
IndexHTPBAPAl Fe 2 O 3
111.43%71.87%13.78%2.92%
211.98%71.02%15.11%1.91%
312.44%71.00%15.66%0.86%
412.84%70.31%15.98%1.86%
512.51%70.05%17.01%0.43%
Table 18. The performance of some non-dominated solutions.
Scheme I sp /(N·s·kg−1) F se /J G Al 2 O 3 /(mol/kg) G HCl /(mol/kg) ρ /(kg/m3)
12578.793.763.290.471808.82
22585.784.063.730.431805.62
32586.884.053.740.431803.78
42588.174.053.750.441802.75
52599.563.953.810.421770.01
Table 19. HTPB propellant performance ranges with different standard enthalpy uncertainty levels.
Uncertainty LevelMaximum Interval of I sp /(N·s·kg−1)Maximum Interval of G Al 2 O 3 /(mol/kg)Maximum Interval of G HCl /(mol/kg)
±5%[2594.74, 2605.11][3.76, 3.99][0.4956, 0.5058]
±10%[2690.34, 2695.75][3.70, 3.77][0.4653, 0.4725]
±15%[2684.66, 2688.86][3.45, 3.51][0.4042, 0.4096]
Table 20. Performance comparison between our method and that in [46].
Formulation I sp /(N·s·kg−1) ρ /kg/m3 G Al 2 O 3 /(mol/kg) G HCl /(mol/kg) F se /J
Reference [46]2572.501776.386.8009.1003.83
Ours2588.171802.756.4557.2313.90
Table 21. Formulation comparison between our paper and [46].
FormulationHTPB/%AP/%Al/% Fe 2 O 3 /%
Reference [46]15.0066.0018.001.00
Ours12.8470.3115.981.86
Disclaimer/Publisher’s Note: The statements, opinions and data contained in all publications are solely those of the individual author(s) and contributor(s) and not of MDPI and/or the editor(s). MDPI and/or the editor(s) disclaim responsibility for any injury to people or property resulting from any ideas, methods, instructions or products referred to in the content.