Article

Research on Congestion Situation Relief in Terminal Area Based on Flight Path Adjustment

Air Traffic Control and Navigation School, Air Force Engineering University, Xi’an 710051, China
*
Author to whom correspondence should be addressed.
Aerospace 2025, 12(10), 856; https://doi.org/10.3390/aerospace12100856
Submission received: 6 August 2025 / Revised: 19 September 2025 / Accepted: 22 September 2025 / Published: 23 September 2025
(This article belongs to the Section Air Traffic and Transportation)

Abstract

With the continuous growth of air transportation demand, air traffic congestion in the Terminal Area has become increasingly serious. In order to assist controllers in efficiently alleviating the traffic congestion situation in the Terminal Area, this paper takes aircraft trajectory adjustment and flow control from the perspective of the Terminal Area as a starting point and proposes a congestion relief strategy based on a complex network and multi-objective optimization theory. First, a Terminal Area traffic network model is established with the approach point, departure point, waypoint, and navigation station as nodes and the flight path as edges. Next, a multi-objective optimization model that takes into account both congestion relief and reduced operating costs is constructed. Finally, an improved ant colony optimization is proposed to solve this optimization model and provide a unified approach to path planning for multiple aircraft. Finally, simulation experiments were conducted based on the airspace structure and operation of the Beijing Terminal Area. At the same time, ablation experiments were designed to compare the method in this paper with other ant colony optimizations. The experimental results show that the path planning results of the improved ant colony optimization can better alleviate the traffic congestion situation in the Terminal Area, converge faster, and reduce the risk of falling into a local optimum.

1. Introduction

With the gradual opening of low-altitude airspace and the continuous upgrading of aircraft performance and communication, navigation, and surveillance equipment, global air transportation demand has shown a rapid growth trend, making airspace resource coordination and aircraft scheduling more difficult. Against this backdrop, as a congested area and a key hub connecting flight routes and airport takeoffs and landings, the operational efficiency of the Terminal Area directly affects the smooth flow and safety of the entire air traffic system. Therefore, understanding how to relieve the air traffic congestion situation in the Terminal Area while taking into account the economic efficiency of aircraft operations has become an important issue that needs to be addressed urgently in the field of air traffic control.
Air traffic congestion situation refers to the phenomenon of flight delays and increased airspace traffic complexity caused by aircraft flow exceeding airspace capacity within a certain time and space range, as shown in Formula (1):
A = R 1 C
In Formula (1), R 1 represents aircraft flow, C represents airspace capacity, and when A > 1 , it means there is air traffic congestion. At present, methods for air traffic congestion relief in the Terminal Area mainly focus on optimizing approach and departure sequencing and flight flow control. Among them, the optimization of approach and departure sequencing usually aims at the shortest delay time [1], the highest landing efficiency [2], or the smoothest aircraft operation [3], and uses a mixed integer programming method to allocate appropriate runways or arrival sequences for aircraft, so as to alleviate traffic congestion. However, sequencing only for approaching and outgoing aircraft can not well adjust the congestion of the entire Terminal Area, and it mainly depends on controllers to control the flight flow.
In terms of flight flow control, it is usually based on the optimization model by setting goals such as minimizing the impact of aircraft on the environment [4], minimizing fuel consumption costs [5], and minimizing flight time [6]. The non-dominated sorting genetic algorithm II (NSGA-II) [5,6,7], particle swarm optimization algorithm [8], route optimization capability (ORC) [9,10], mixed integer linear programming [11], and other methods are used to construct the approach and departure path of the aircraft or optimize the flight trajectory of the aircraft.
However, the above flow control methods only give the approach and departure path optimization methods for a single aircraft, and there are still some difficulties in solving the problem of multiple aircraft collaborative planning approach and departure path. Secondly, the above method can only control the flow of a single congested route or a single congested airspace, so it can not effectively alleviate the congestion situation in the whole Terminal Area. In recent years, with the application of spatial grid [12], macro basic maps [3,13], complex network [14,15,16], and other theories in the field of air traffic, more scholars have gained a further understanding of the complexity and overall situation of air traffic congestion in the Terminal Area. They can alleviate the congestion situation in the Terminal Area from the perspective of the overall congestion situation in the Terminal Area and the collaborative optimization of multiple aircraft.
Therefore, this paper first uses complex network theory to construct a traffic structure network model for the Terminal Area. Then, based on multi-objective optimization theory, a congestion relief model for the Terminal Area is established. Finally, an improved ant colony optimization is used to plan the optimal approach paths for multiple aircraft.

2. Congestion Relief Methods in Terminal Area

This section proposes a complete set of congestion relief methods for Terminal Areas. The methodology framework includes three core steps:
First, we use the complex network theory to abstract the physical structure and traffic flow dynamics of the Terminal Area into a weighted directed network model. This model is the basis of all subsequent analysis. Secondly, based on the multi-objective optimization theory, we build a mathematical model of congestion mitigation. The model includes an objective function to minimize the total congestion cost and a series of constraints to ensure flight safety. Finally, we propose an improved ant colony optimization algorithm (I-ACO) to solve the above optimization problems efficiently. The goal of the algorithm is to plan a group of optimal approach paths for multiple aircraft.

2.1. Establish a Transportation Network Model for the Terminal Area

2.1.1. Advantages Analysis of Constructing Terminal Area Traffic Network by Using Complex Network

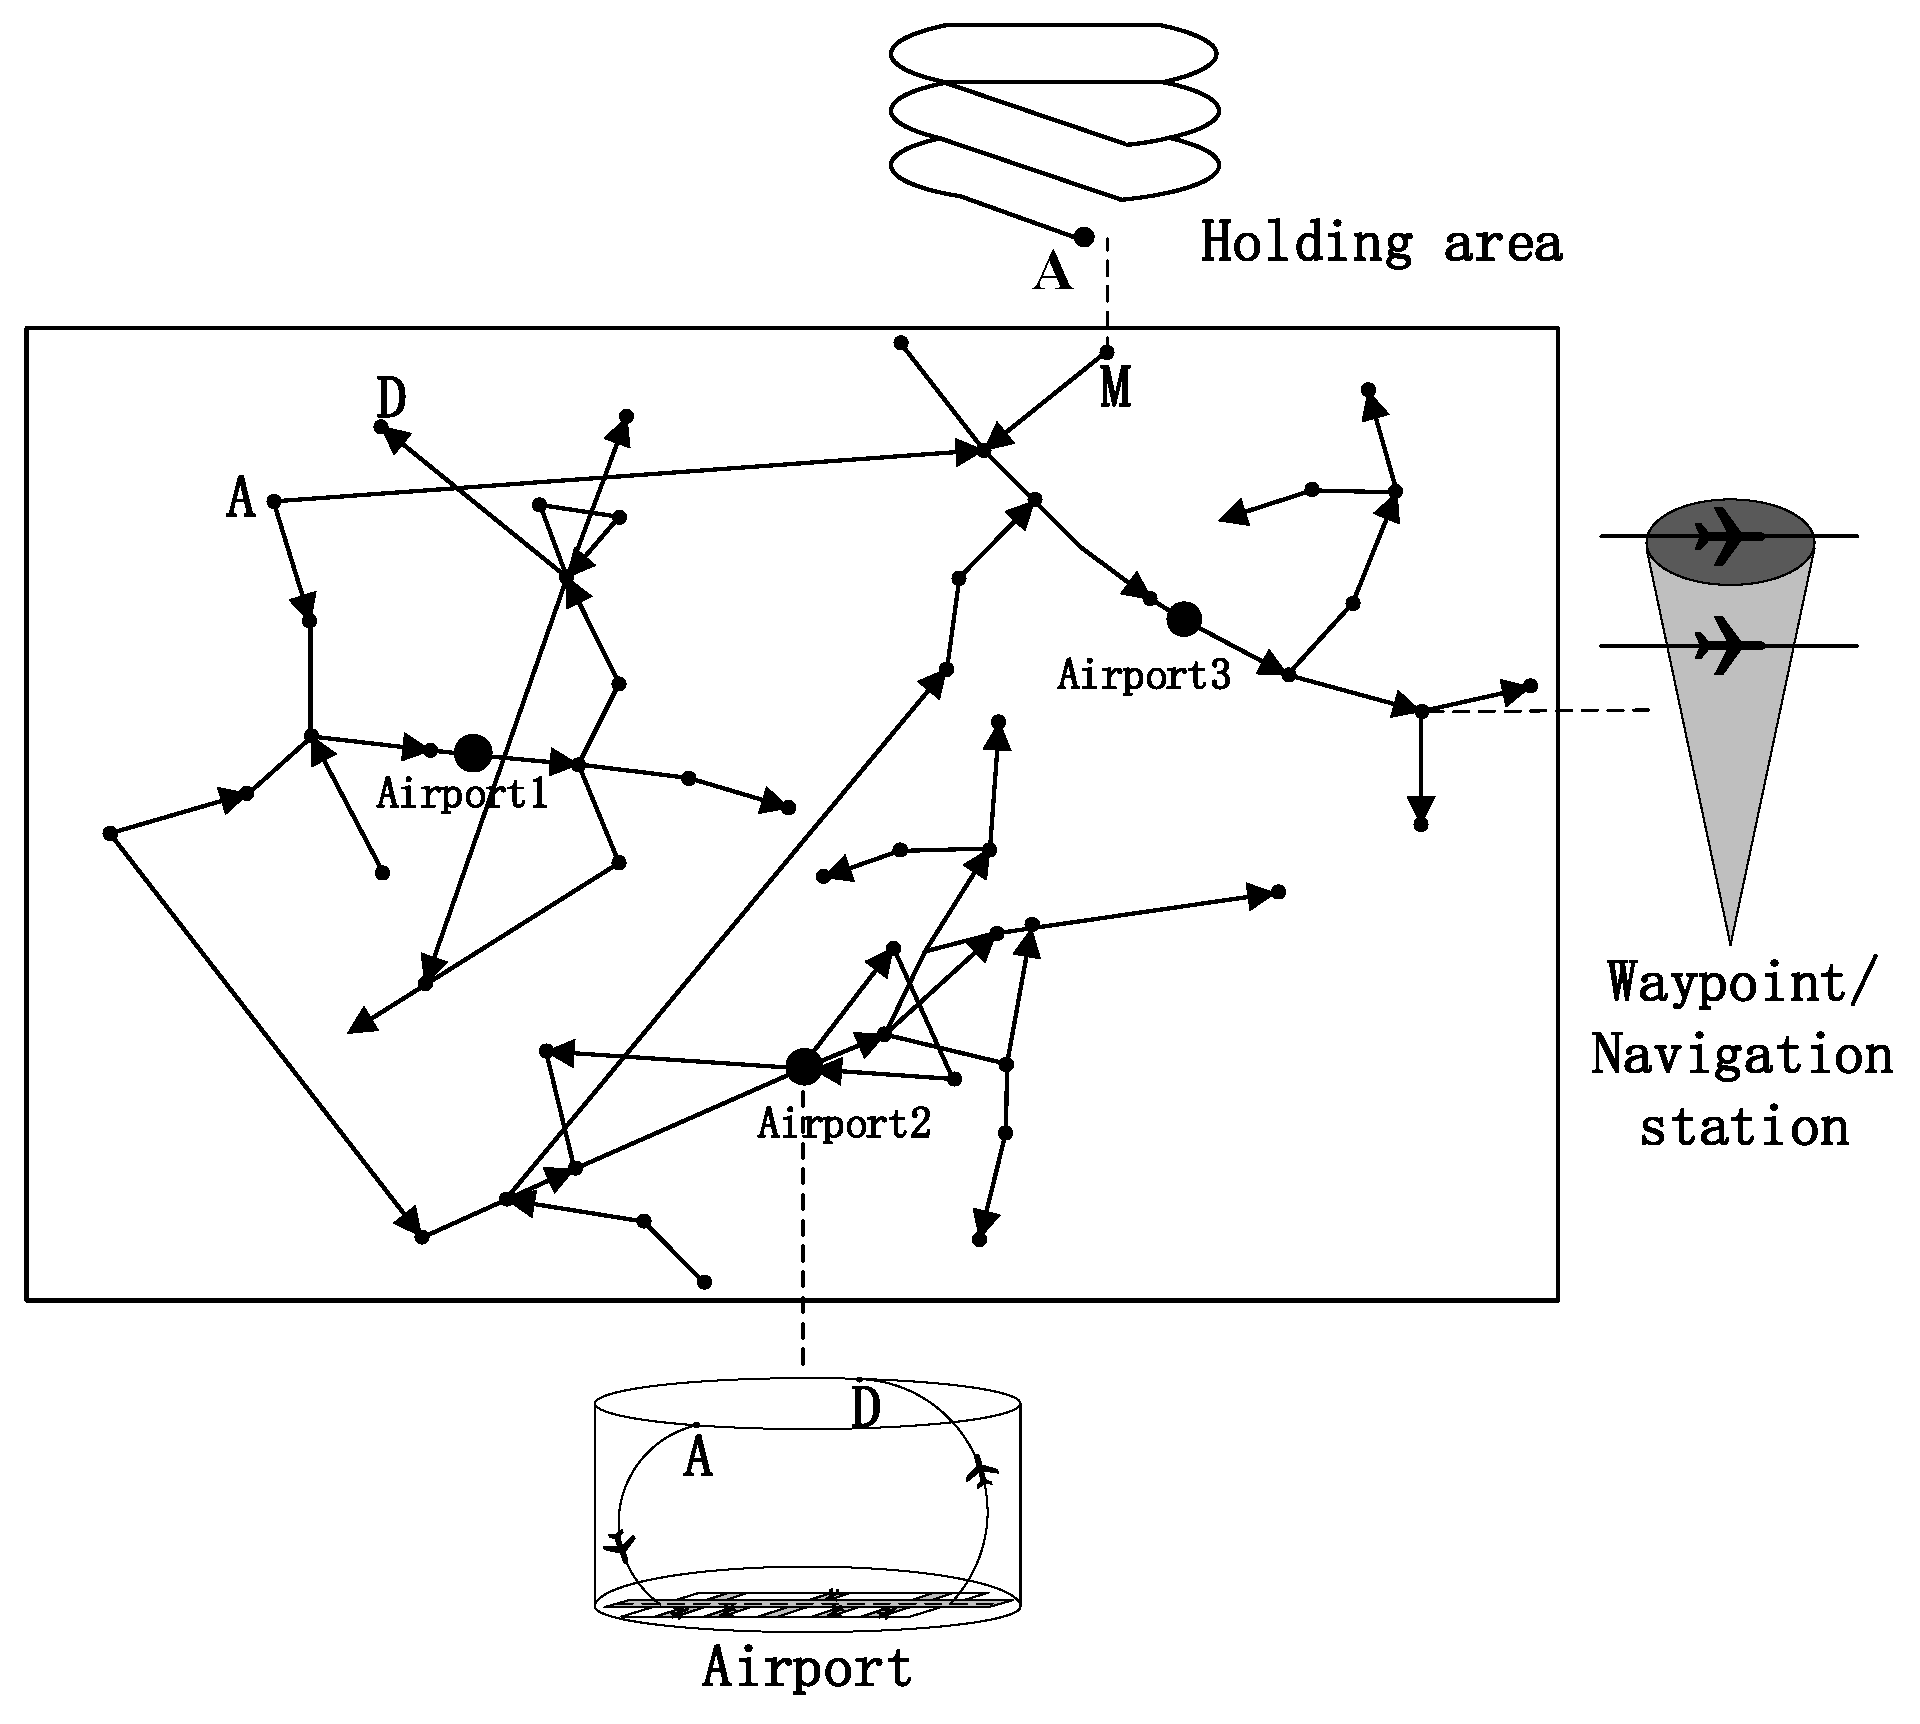
The Terminal Area refers to the control area located at the intersection of air traffic service routes near two or more airports [17]. As shown in Figure 1, the Terminal Area contains three airports, with A as the approach point, D as the departure point, and the remaining points as waypoints and important navigation stations. M is the holding area. The solid lines in the figure represent the approach routes of aircraft, and the dotted lines represent the departure routes.
The Terminal Area is an important area for aircraft in the route and airport operation conversion, with a large number of arrival and departure points, waypoints, flight paths, and so on. And the congestion changes rapidly, and each aircraft influences the others.
In order to deal with the high complexity of traffic operation in the Terminal Area, complex network theory provides an innovative and top-down analysis perspective. The core idea of this theory is to abstract the complex real system into a network composed of nodes and edges. By analyzing the topology and dynamic process of the network, we can reveal the congestion law of the system at the macro level.
Compared with traditional methods such as queuing theory, hydrodynamics, or multi-agent simulation, the complex network model has significant advantages. It can effectively abstract all kinds of interrelated elements (such as waypoints and routes) in the Terminal Area into nodes and edges in the network. This abstraction enables us to conduct quantitative analysis of the system from a global perspective, so as to more accurately identify the overall traffic congestion situation.
Therefore, we choose the complex network theory to build the Terminal Area traffic network model. This not only conforms to the essence of networked operation in the Terminal Area in form, but also provides the most appropriate analysis tool for solving the core problem of congestion relief in function.

2.1.2. Formal Definition of Terminal Area Traffic Network

In order to quantitatively analyze the congestion factors in the Terminal Area, we need to formally define the traffic operation network. We define the network model as a weighted digraph g (T) varying with time t, as shown in Formula (2).
G t = V * , E * , ω t
where V * is the node set, E * is the edge set, and ω t is the weight set over time.
  • Node set ( V * )
Node set V * represents the static geographical entity with navigation or hub function in the Terminal Area. The position of these nodes does not change with time. V * consists of the following three subsets:
V * = V * A P V * I F V * W P
where V * A P represents the airport node set. Each large multi-runway airport is simplified as a central node, representing its overall takeoff and landing capacity. In the case of Beijing Terminal Area in this paper, it includes three airport nodes: ZBAA, ZBAD, and ZBTJ. V * I F represents the node set of arrival and departure points. These nodes are the connection points between the Terminal Area and the external route network. This paper includes 18 arrival and departure points planned for Beijing Terminal Area. V * W P represents the set of waypoint nodes. These nodes include most of the important navigation stations and waypoints planned in the region.
  • Edge set ( E * )
The edge set E * represents the directed leg of the connecting node pair v i ,   v j . The construction of the edge is based on two data sources: one is from the standard instrument arrival and departure diagram published in the aeronautical information compilation (AIP) of the Civil Aviation Administration of China. The second is to extract the high-frequency non-standard radar guidance path through clustering analysis of a large number of historical radar track data. We combine the two paths to make the model closer to the real operation. A directed edge e i j in the network exists if and only if there is a standard leg or preferred path from node v i to v j . Since the arrival and departure routes are usually unidirectional, the network is directed, and the existence of e i j does not mean the existence of e j i . To facilitate subsequent analysis, we assign a unique number e i to each edge, e i E * .
  • Weight set ( ω t )
The weight set ω t is the core of the model. It introduces dynamic characteristics to the static network topology and reflects the traffic operation state in different periods. In the time period t 0 ,   t 1 , each edge e i is given a weight ω i , ω i ω t . The weight ω i is a dimensionless congestion index, which is comprehensively calculated by multiple microscopic traffic indicators (such as route traffic density, traffic flow ratio, etc.). By analyzing the change in weight over time, we can intuitively identify the evolution of key congested routes and how busy they are. This laid the foundation for the subsequent construction of the relief objective function based on the “minimum congestion cost”.
Through the above formal definitions of nodes, edges, and weights, we can build a Terminal Area traffic operation network for a single time period (as shown in Figure 2), where M is the holding area, A is the approach point, and D is the departure point. By repeating this process for all time periods, we can finally obtain a time series composed of a weighted directed network graph G t 1 ,   G t 2 , ,   G ( t n ) . This sequence can completely record the dynamic evolution process of the traffic congestion situation in the Terminal Area.

2.2. Establish a Congestion Relief Model for the Terminal Area

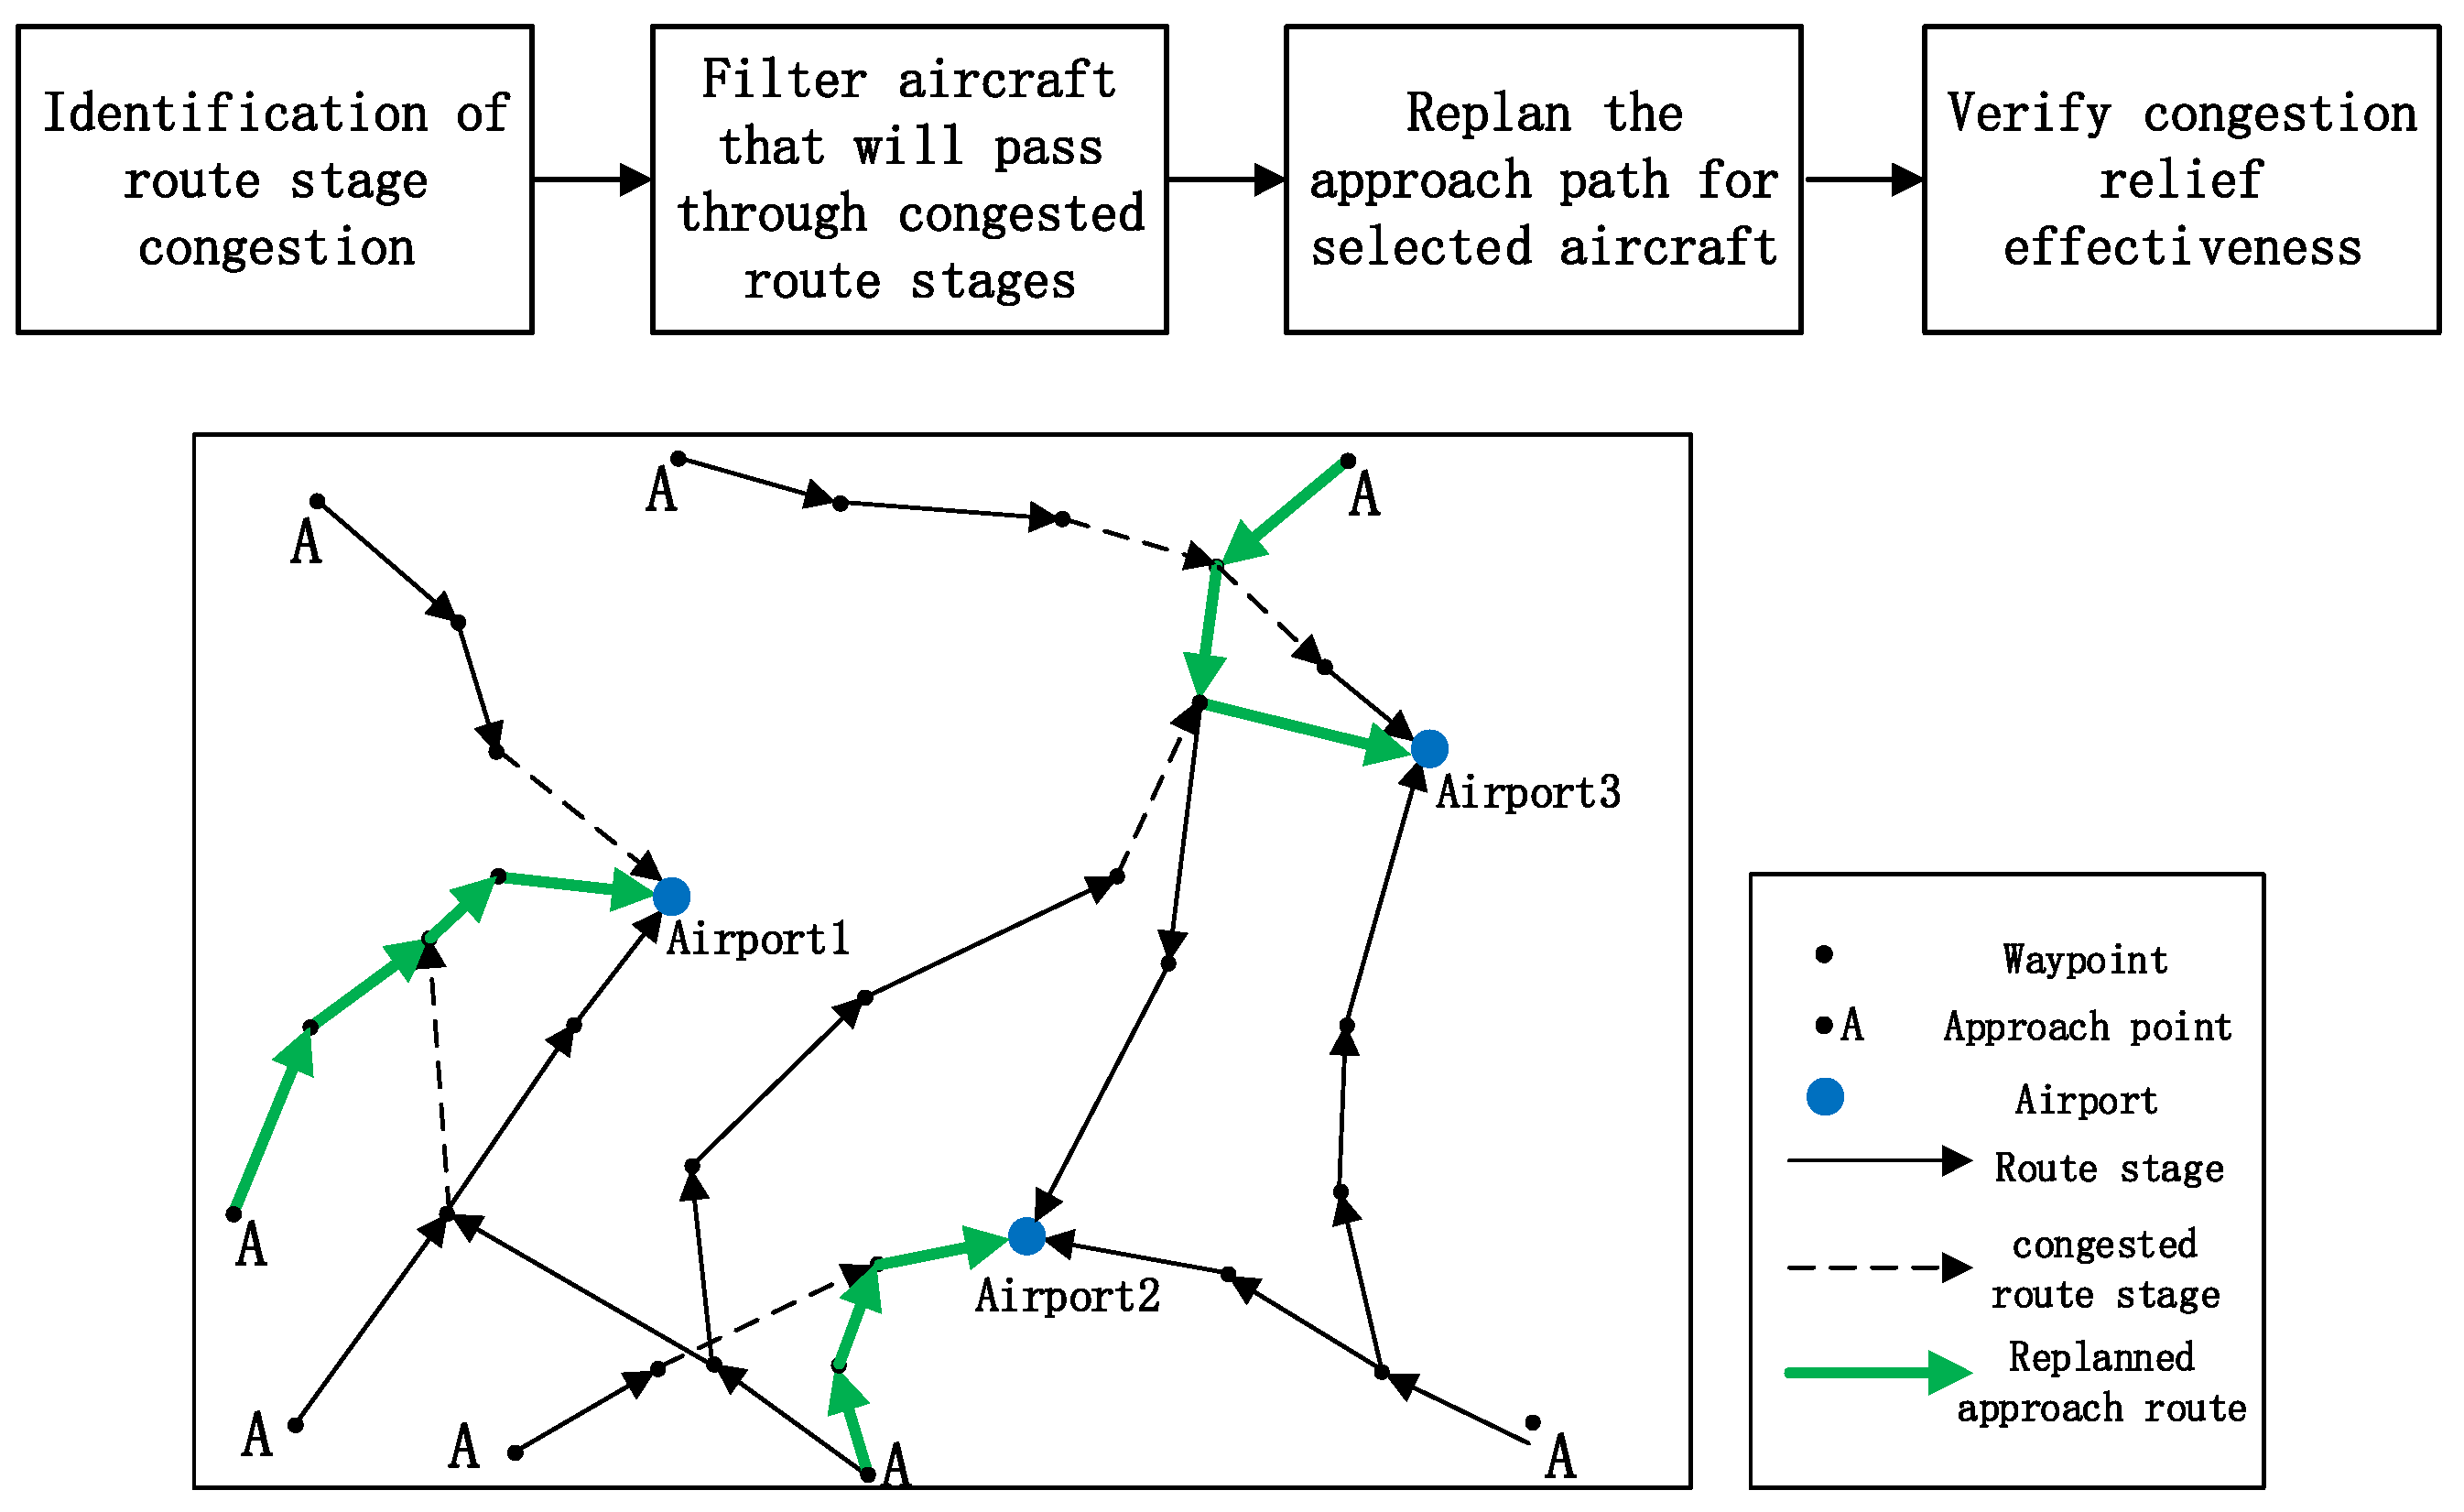
Under normal circumstances, departure congestion is mainly concentrated in the airport area, and departing aircraft quickly climb away from the Terminal Area to leave space for approaching aircraft, so there is generally no congestion problem. Therefore, this paper mainly studies how to optimize flight path selection for approaching aircraft to relieve the air traffic congestion situation in the Terminal Area while taking into account operating costs. The congestion relief strategy is shown in Figure 3. When the overall air traffic congestion situation in the Terminal Area is identified as poor during a certain period of time. First, identify the route stages with high busyness during the current period (dashed lines in Figure 3). Second, all aircraft that will approach these congested route stages in the next period are screened out. Finally, the approach paths for the screened-out aircraft are reselected (green route stages in Figure 3) according to certain objective functions and constraints to alleviate the overall congestion situation in the Terminal Area in the next period, and ensure that operating costs are as low as possible within an acceptable range. If there is no suitable flight path change plan, other alternatives such as air waiting or cancellation of the plan will be selected. The choice of alternative is left to the discretion of the controller and is not discussed in this paper. After that, the overall air traffic congestion situation in the Terminal Area for the next period, after the re-planning of the approach route, is identified again to determine the effectiveness of congestion relief.

2.2.1. Set the Objective Function

Based on the above assumptions, multi-objective optimization theory is used to set the objective function as minimizing congestion and minimizing operating costs, where operating costs include delay costs and fuel consumption costs; the length unit is kilometers and the time unit is minutes.
M i n F = W 1 + W 2
W 1 = ω 1 K i = 1 K B i
W 2 = ω 2 P j = 1 P t j a 2 t j p 2 + c j · x j a
In Formula (1), W 1 represents the overall congestion level of the Terminal Area, W 2 represents the overall operating cost of the Terminal Area, and congestion level W 1 is expressed as the average busyness level of the route stage (edge), where B i is the busyness level of edge i [18], reflecting both the density and traffic flow of the route stage. In Formula (2), ω 1 is the weight of congestion in the objective function, and K is the total number of edges. In Formula (3), ω 2 is the weight of operating costs in the objective function, and P is the total number of aircraft. t j a 2 is the arrival time of aircraft j after re-planning the approach path (to simplify the calculation, it is assumed that the speed of the aircraft remains unchanged after approach). c j is the fuel consumption rate per route stage of aircraft j , calculated as fuel consumption per kilometer. The fuel consumption rate is related to actual operating conditions, and x j a is the length of the approach route after re-planning.
B i = 1 / 2 ( D i ^ + R i ^ )
D i ^ = D i D m i n D m a x D m i n   ,   R i ^ = R i R m i n R m a x R m i n
D i = 1 M n = 1 M ( N n L i j = 1 N n k = j + 1 N n 1 d j k n γ )
R i = n i N i ¯ ( t t 0 )
t j a 2 = t j a 1 + x j p t j p 2 t j p 1 x j p
D i ^ and R i ^ are the normalized values of density D i and flow ratio R i , which are scaled to the range [0, 1] to facilitate comparison of route stage busyness B i . Here, density D i refers to the ratio of the number of aircraft with “following” characteristics in the edge during the time period from t 0 to t 1 to the length of the edge. The larger the ratio, the greater the density. At the same time, consider the effect of the distance between aircraft noses on density. The greater the distance between aircraft noses, the lower the density. Divide the time period t 0 to t 1 into M unit time intervals. N n is the number of aircraft on edge i in unit time interval n . d j k n is the aircraft nose distance between aircraft j and k with “following” characteristics on the edge i of unit time interval n . For edges with only one aircraft, the density is usually smaller than that of edges with multiple aircraft, so d j k n can be set as a fixed large value for comparison. L i represents the length of edge i , and γ is the control weight parameter. The larger the value of γ , the more significant the impact of aircraft nose distance on density. The flow ratio R i refers to the ratio of the flow on the edge during a certain period to the historical average flow during the same period. The larger the ratio, the greater the busyness on the edge during that period. n represents the number of aircraft passing through edge i during the period from t 0 to t 1 , and N i ¯ represents the average flow on the same edge during the same historical period. In Formula (8), t j a 1 is the approach time of the aircraft j after re-planning the approach route, x j p is the planned approach route length, t j p 2 and t j p 1 are the planned approach time and planned arrival time of aircraft j .

2.2.2. Set Constraints

After setting the objective function, continue to set the constraints as follows:
B p B m a x , i 1,2 , , K
P p P m a x ,   i 1,2 , , K
d j = d j p   , j 1,2 , , P
t j a 2 t j p 2 t m a x , j 1,2 , , P
c j · x j a δ · c j · x j p
Formula (9) indicates that the busyness level B p of each route does not exceed B m a x , where B p is the average busyness level of all route stages that comprise the route. Formula (10) indicates that, in order to avoid aircraft collisions, the number of aircraft P p passing through route p during a unit time period does not exceed P m a x . Formula (11) ensures that the destination d j of the aircraft after route replanning is consistent with the original destination d j p . Formula (12) indicates that the delay time t j a 2 t j p 2 of each aircraft does not exceed a certain threshold t m a x . Formula (13) indicates that the fuel consumption cost c j · x j a of each aircraft does not exceed δ times the fuel consumption cost c j · x j p of the original flight route.

2.3. Solving the Congestion Relief Model for the Terminal Area

The multi-aircraft cooperative path planning problem in the Terminal Area studied in this paper is essentially a large-scale combinatorial optimization problem. It aims to find a path combination for multiple aircraft that minimizes the overall air traffic congestion situation and operating costs in the Terminal Area, rather than finding the optimal path for a single aircraft. In view of the characteristics of this problem, this paper chooses the ant colony optimization (ACO) as the solution framework, mainly based on the following three considerations:
First, the algorithm mechanism is highly consistent with the nature of the problem. The Terminal Area can be abstracted as a complex traffic network, which naturally matches the background of ACO in finding the optimal path in graph theory. The distributed behavior of ant colonies communicating and cooperating through pheromones can effectively reflect the collaborative decision-making process of multiple aircraft under unified airspace rules, which is particularly suitable for solving combinatorial optimization problems with network structure features. Compared with NSGA-II, PSO, and other algorithms, the search mechanism of ACO is more consistent with the graph structure of the problem, avoiding complex encoding and decoding and infeasible solution repair processes, making the model more concise and efficient. Second, the solution construction method is more in line with actual control. ACO uses an incremental path construction method, which is more guiding and structured, and is consistent with the actual operation of controllers in selecting paths for aircraft in a given route network. In contrast, the “crossing” operation of NSGA-II or the “particle position update” of PSO are less interpretable at the physical level and are somewhat disconnected from control practice. Third, the algorithm framework has excellent plasticity. The flexible framework of ACO facilitates the integration of targeted improvement strategies. For example, the “parent–child relationship inheritance pheromone” mechanism designed in this paper to solve the multi-agent coordination problem can effectively handle path dependencies and conflicts between multiple aircraft, thereby planning a combination of independent and coordinated approach paths.

2.3.1. Principles of Improving the Ant Colony Optimization

Ant colony optimization (ACO) is a heuristic optimization algorithm that simulates the foraging behavior of ants in nature. It was first proposed by Marco Dorigo in 1992 [19]. The main principle is to learn from the way ants share pheromones in the process of searching for food to guide the search to the optimal solution set. It is widely used in combinatorial optimization problems such as the traveling salesman problem (TSP), the shortest path problem, and the scheduling problem. In traditional ant colony optimization, there are no differences between ants; each generation of pheromones is shared, and ultimately, only one optimal path is obtained [20,21]. In order to plan paths for multiple aircraft within a certain period of time and achieve the goal of alleviating the overall air traffic congestion situation in the Terminal Area, two improvements were made to the ant colony optimization:
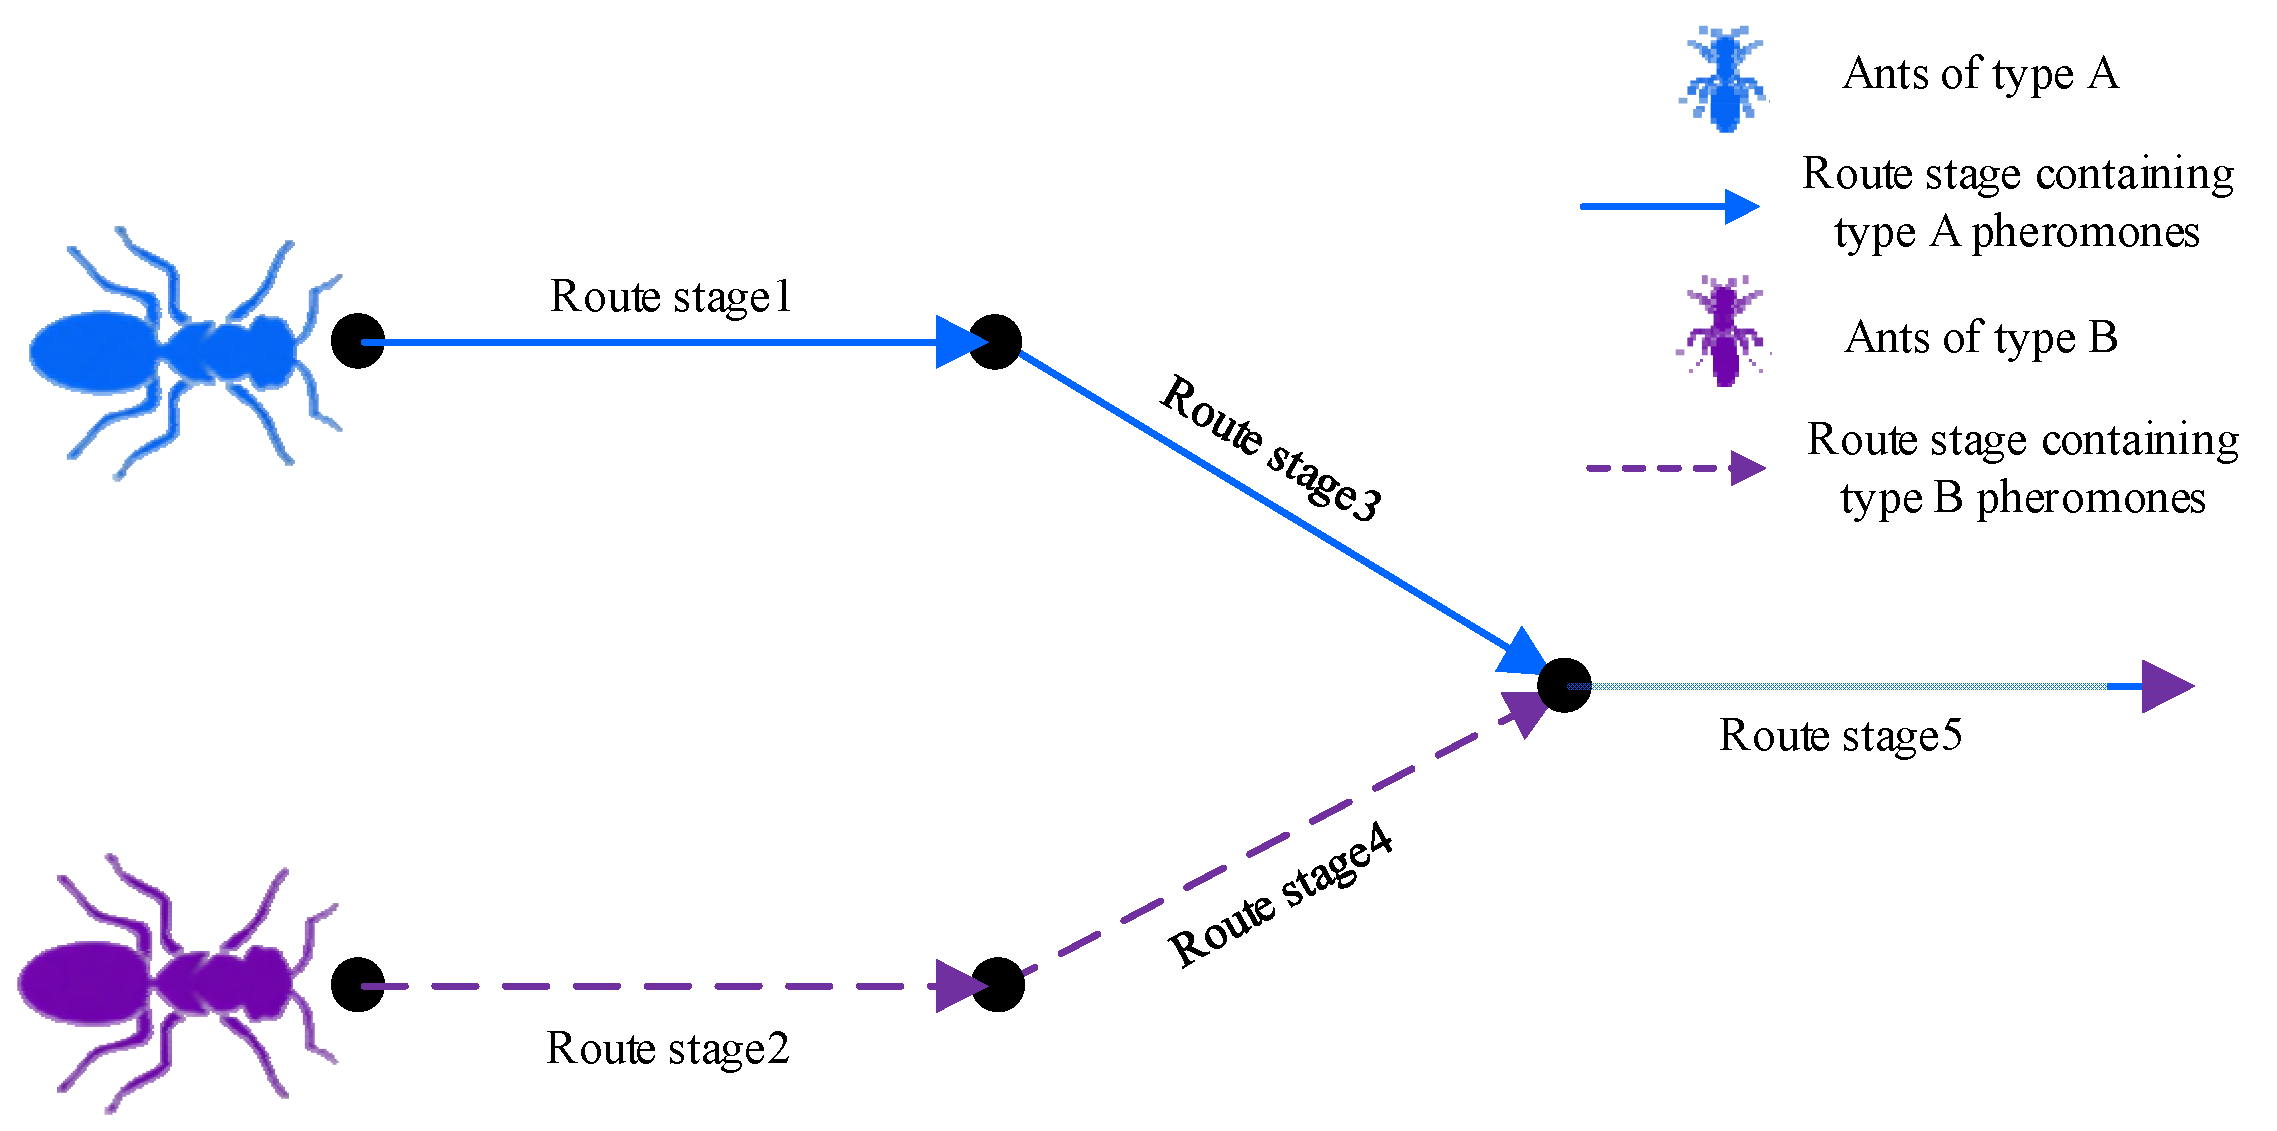
First, add a “parent–child relationship inheritance pheromone” mechanism. In traditional ACO, all ants share pheromones, which causes all ants (aircraft) to rush to the same “optimal” path, potentially causing new congestion and failing to comply with actual control requirements. To overcome the “herd effect” of traditional ACO, each aircraft to be planned can be assigned a dedicated first-generation ant with its own pheromone type. During the iteration process, the offspring ants only inherit and identify the same type of pheromone left by their “parents.” As shown in Figure 4, Class A ants can only perceive Class A pheromones on the path, and are thus guided to the path explored by their “parents.” Similarly, Class B ants follow Class B pheromones. For shared route stages where multiple pheromones exist simultaneously (such as route stage 5), all types of ants can be identified. Through this mechanism, each aircraft represented by a type of ant has a unique pheromone trajectory, which allows them to explore their respective path spaces independently while evaluating the plan through a unified Terminal Area overall objective function, ultimately achieving the goal of “independent optimization and global coordination.”
Second, balance the relationship between “exploration” and “exploitation.” Set the pheromone weight and the inspiration function weight as functions that change dynamically with the number of iterations. In the early stages of the algorithm, there is insufficient pheromone accumulation, so the inspiration function should be given a higher weight to allow the initial generation of ants to focus on exploring more possible path combinations. As the iteration proceeds, the concentration of pheromones on high-quality paths gradually increases. At this point, the weight of pheromones should be increased to guide the ants to make more use of existing high-quality experiences and gradually reduce the behavior of exploring new paths. This dynamic adjustment strategy can effectively balance the exploration and utilization capabilities of the algorithm, thereby improving convergence efficiency and reducing the risk of falling into a local optimum.
Through the above two improvements, the improved ACO is more in line with the actual regulatory work and enhances its algorithm performance, thereby achieving the objectives of optimizing route selection and improving route planning efficiency. The main planning ideas are as follows:
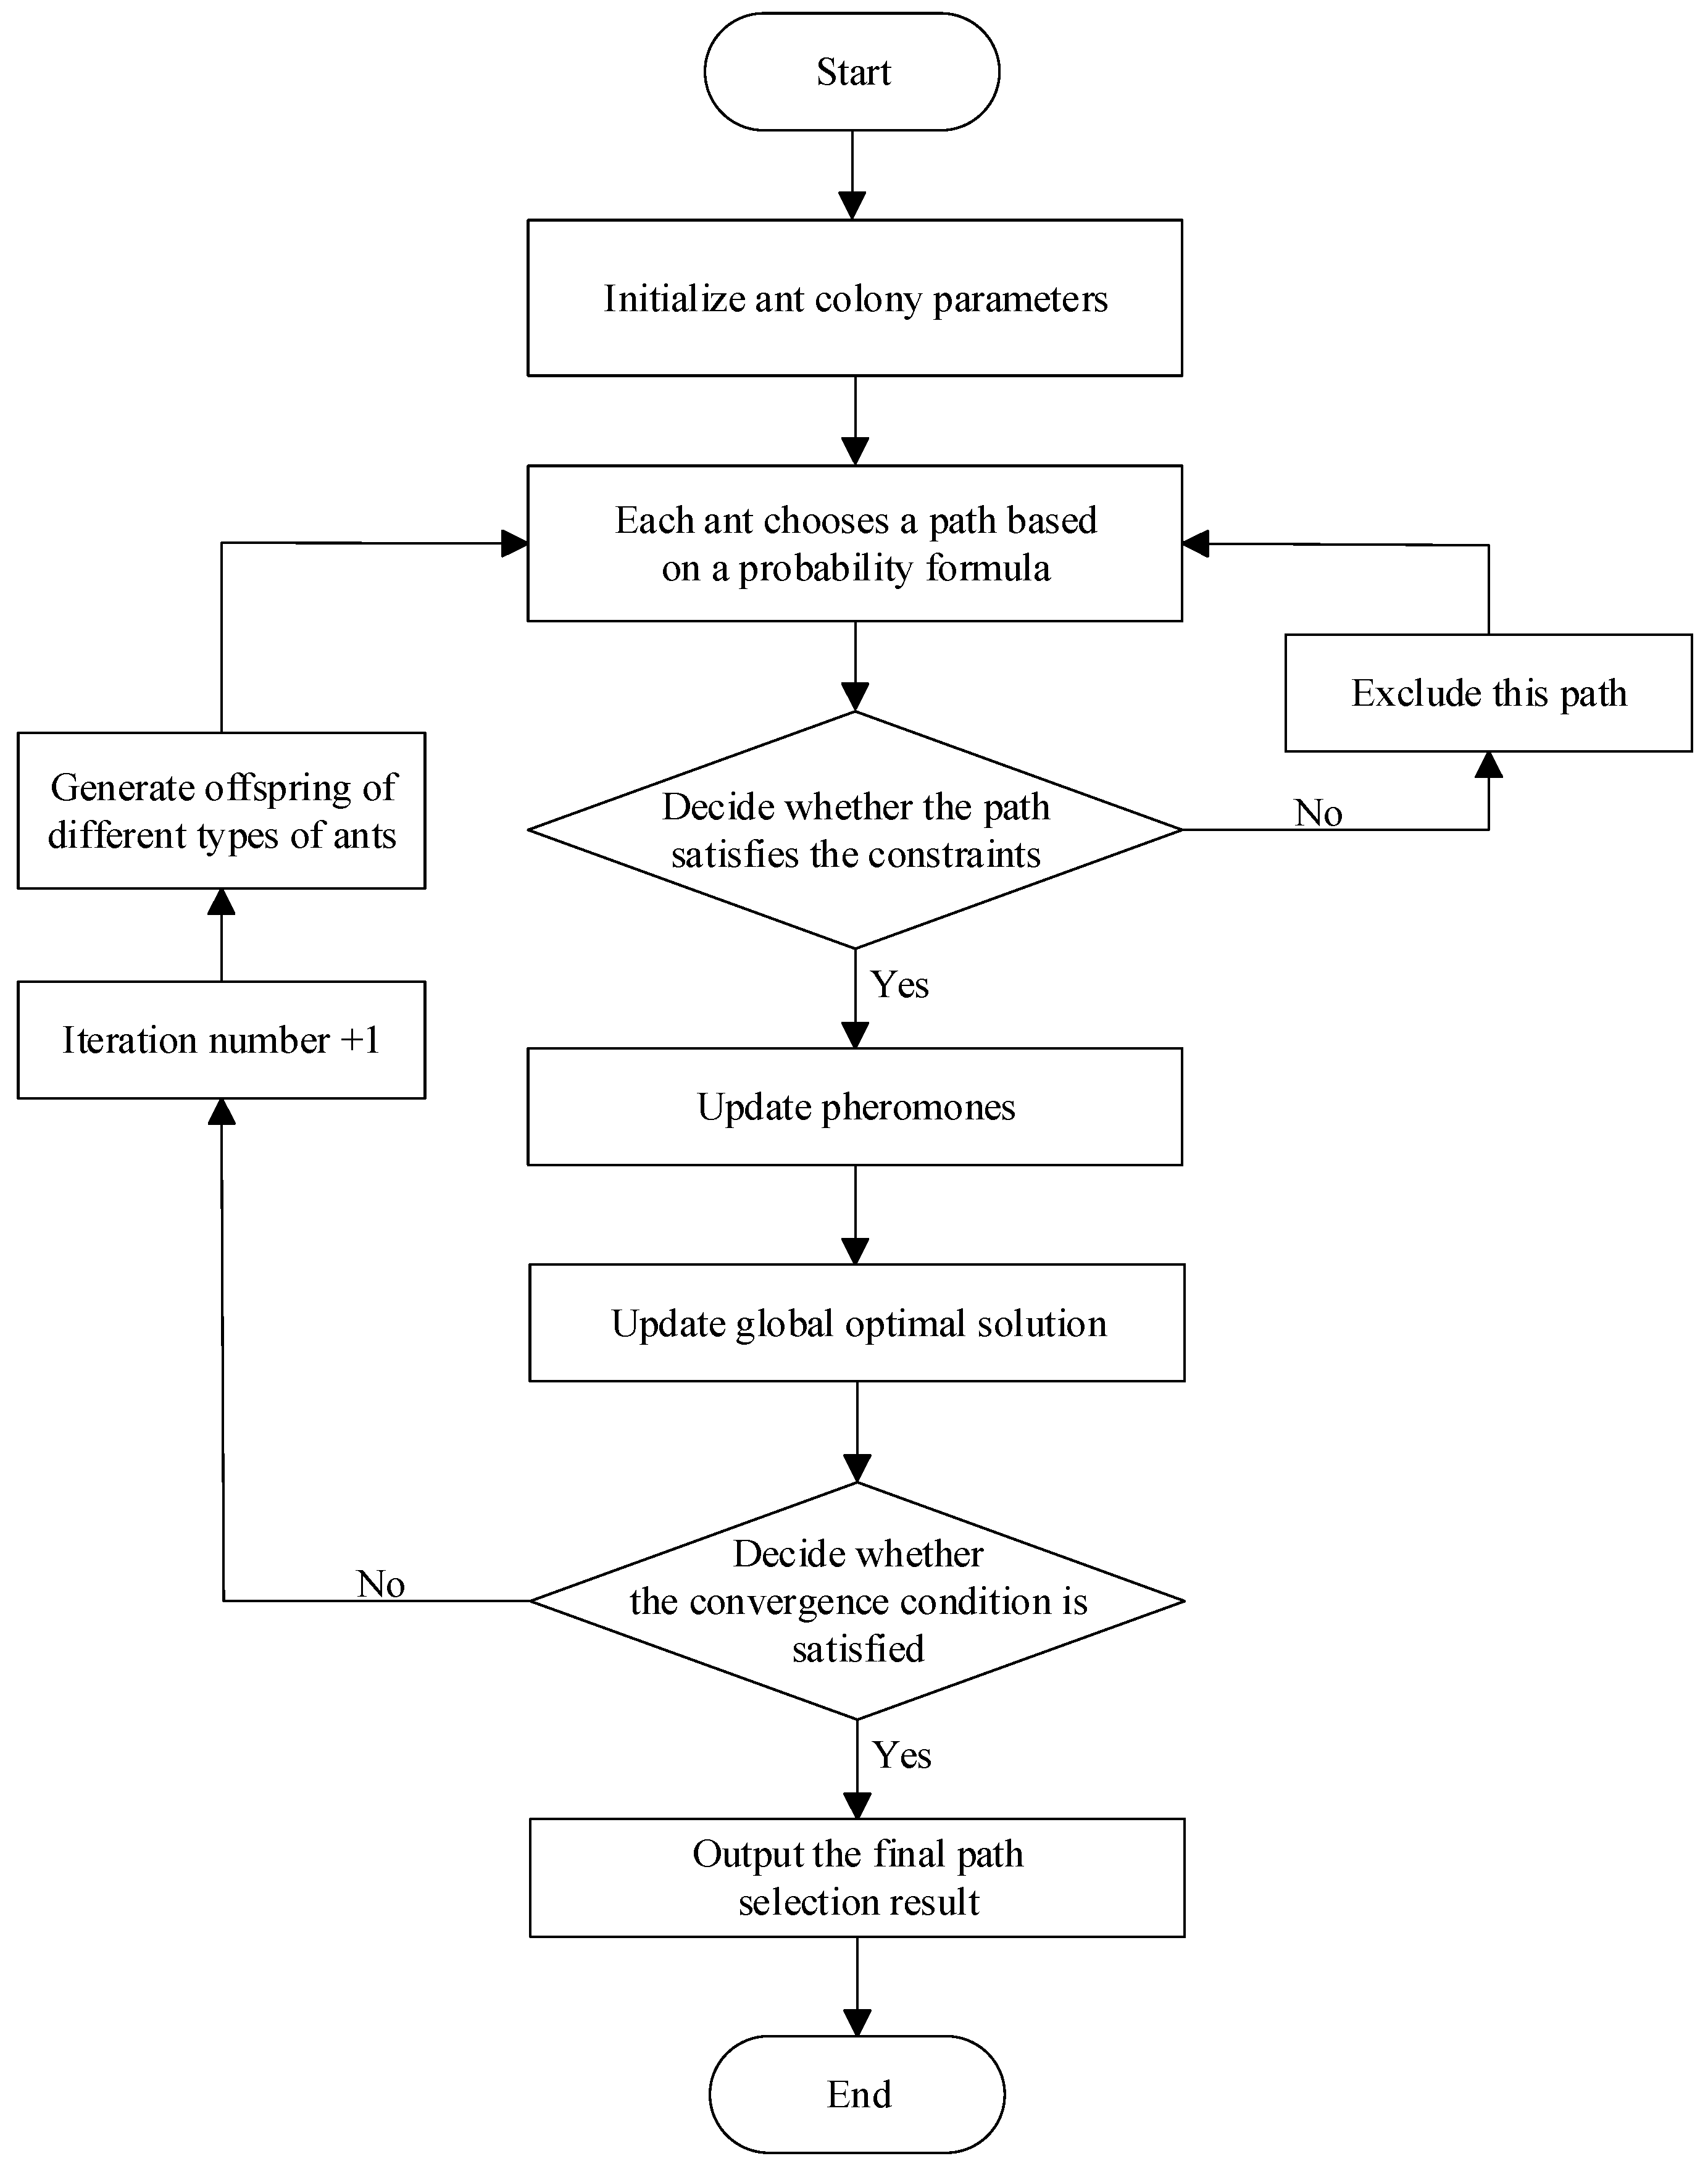
First, screen out aircraft scheduled to approach congested route stages during a certain time period, assign each ant to represent one aircraft, and define the range of approach points available to each aircraft based on the aircraft’s approach direction. Next, a “parent–child relationship” is established between the next generation of ants and the previous generation, so that the next generation of ants is only affected by the pheromones of the previous generation with which it has a “parent–child relationship” (there may be different pheromones on the same route stage). The combination of path choices made by each generation of ants represents a solution to the path planning problem. After that, each generation of ants will select a path according to a probability formula, which consists of path pheromones and an inspiration function. At the same time, the ants will determine the path quality based on the objective function value and update the pheromone concentration on the path accordingly, so that the next generation of ants can find the optimal path more quickly. The flowchart of the improved ACO algorithm for solving the optimal path is shown in Figure 5.

2.3.2. Implementation of Improved Ant Colony Optimization

1.
Initialize ant colony parameters;
Including ant colonies, pheromones, convergence conditions, etc., each ant in each generation represents an aircraft, and each ant is assigned a selectable approach point based on the aircraft’s approach direction. The initial values of all types of pheromones on each path are roughly equal, with only a slight disturbance (±5%) related to the busyness level of the route stage, in order to increase the diversity of the initial solution and enhance the early exploration ability. The convergence condition is that the maximum number of iterations is reached and the change in the optimal objective function value within n consecutive rounds is within m .
2.
Select path;
Each ant represents an aircraft choosing between paths, and the solution space is the permutation and combination of the paths chosen by each aircraft. In each iteration, each ant chooses a path according to the path selection probability formula, and the path selection probability P q p of q -class ants is obtained by Formula (14).
P q p = T p q α η p β q T p q α η p β
η p = 1 B p + x p
α s = α m i n + α m a x α m i n · s s m a x k
β s = β m a x β m a x β m i n · s s m a x k
Among them, T p q is the pheromone concentration of q -class ants on path p , η p is the inspiration information of the path, and the lower the value, the more attractive the path is to the ant colony. B p represents the overall busyness level of path p , which is the average busyness level of all route stages that make up the path, and x p is the length of path p . α and β are the weight parameters of the pheromone and inspiration function, respectively, and s and s m a x represent the current number of iterations and the total number of iterations. k is the parameter that controls nonlinear growth.
3.
Determine whether the constraints are satisfied;
Remove paths that do not comply with the constraints and reselect paths, ensuring that each ant selects a path.
4.
Update pheromones;
From Formulas (18) and (19), after one generation of ants completes a path selection, the quality of the path combination, i.e., the value of the objective function, is calculated. If the quality of the path combination is good (the objective function value is low), the concentration of the relevant pheromones in the path combination is increased. The increase is proportional to the quality of the path. Paths with better quality will attract more ants, thereby accelerating the convergence of global optimization. At the same time, the pheromones on each path will decay over time to simulate the phenomenon of ants forgetting paths in nature.
T p q s + 1 = 1 ρ · T p q s + T p q s
T p q s = Q M i n F
5.
Iterate the cycle and determine convergence;
After each generation of ants finishes searching, the current solution is evaluated based on the objective function value to determine whether it is optimal, and the global optimal solution is updated. Then, it is determined whether the convergence condition is reached. If the convergence condition is not reached, the next generation of ants continues the search. The next generation of ants is only influenced by the pheromones of their “parents”.
6.
Output the final path selection result.

3. Simulation Experiment

This section aims to verify the effectiveness of our proposed method through simulation experiments. We conducted a series of congestion mitigation simulations using the real operation data of the Beijing Terminal Area. The experiment consists of two parts. In the first part, we apply the complete method proposed above to carry out collaborative path planning for a group of real incoming aircraft and show its congestion mitigation effect. In the second part, we designed a series of comparative experiments and an ablation study. The purpose of these experiments is to strictly evaluate the performance of our improved ant colony optimization (I-ACO) compared with other algorithms and to prove its superiority in solving the problem of multi-aircraft cooperative path planning.

3.1. Identification of Congested Route Stages and Initialization of Ant Colonies

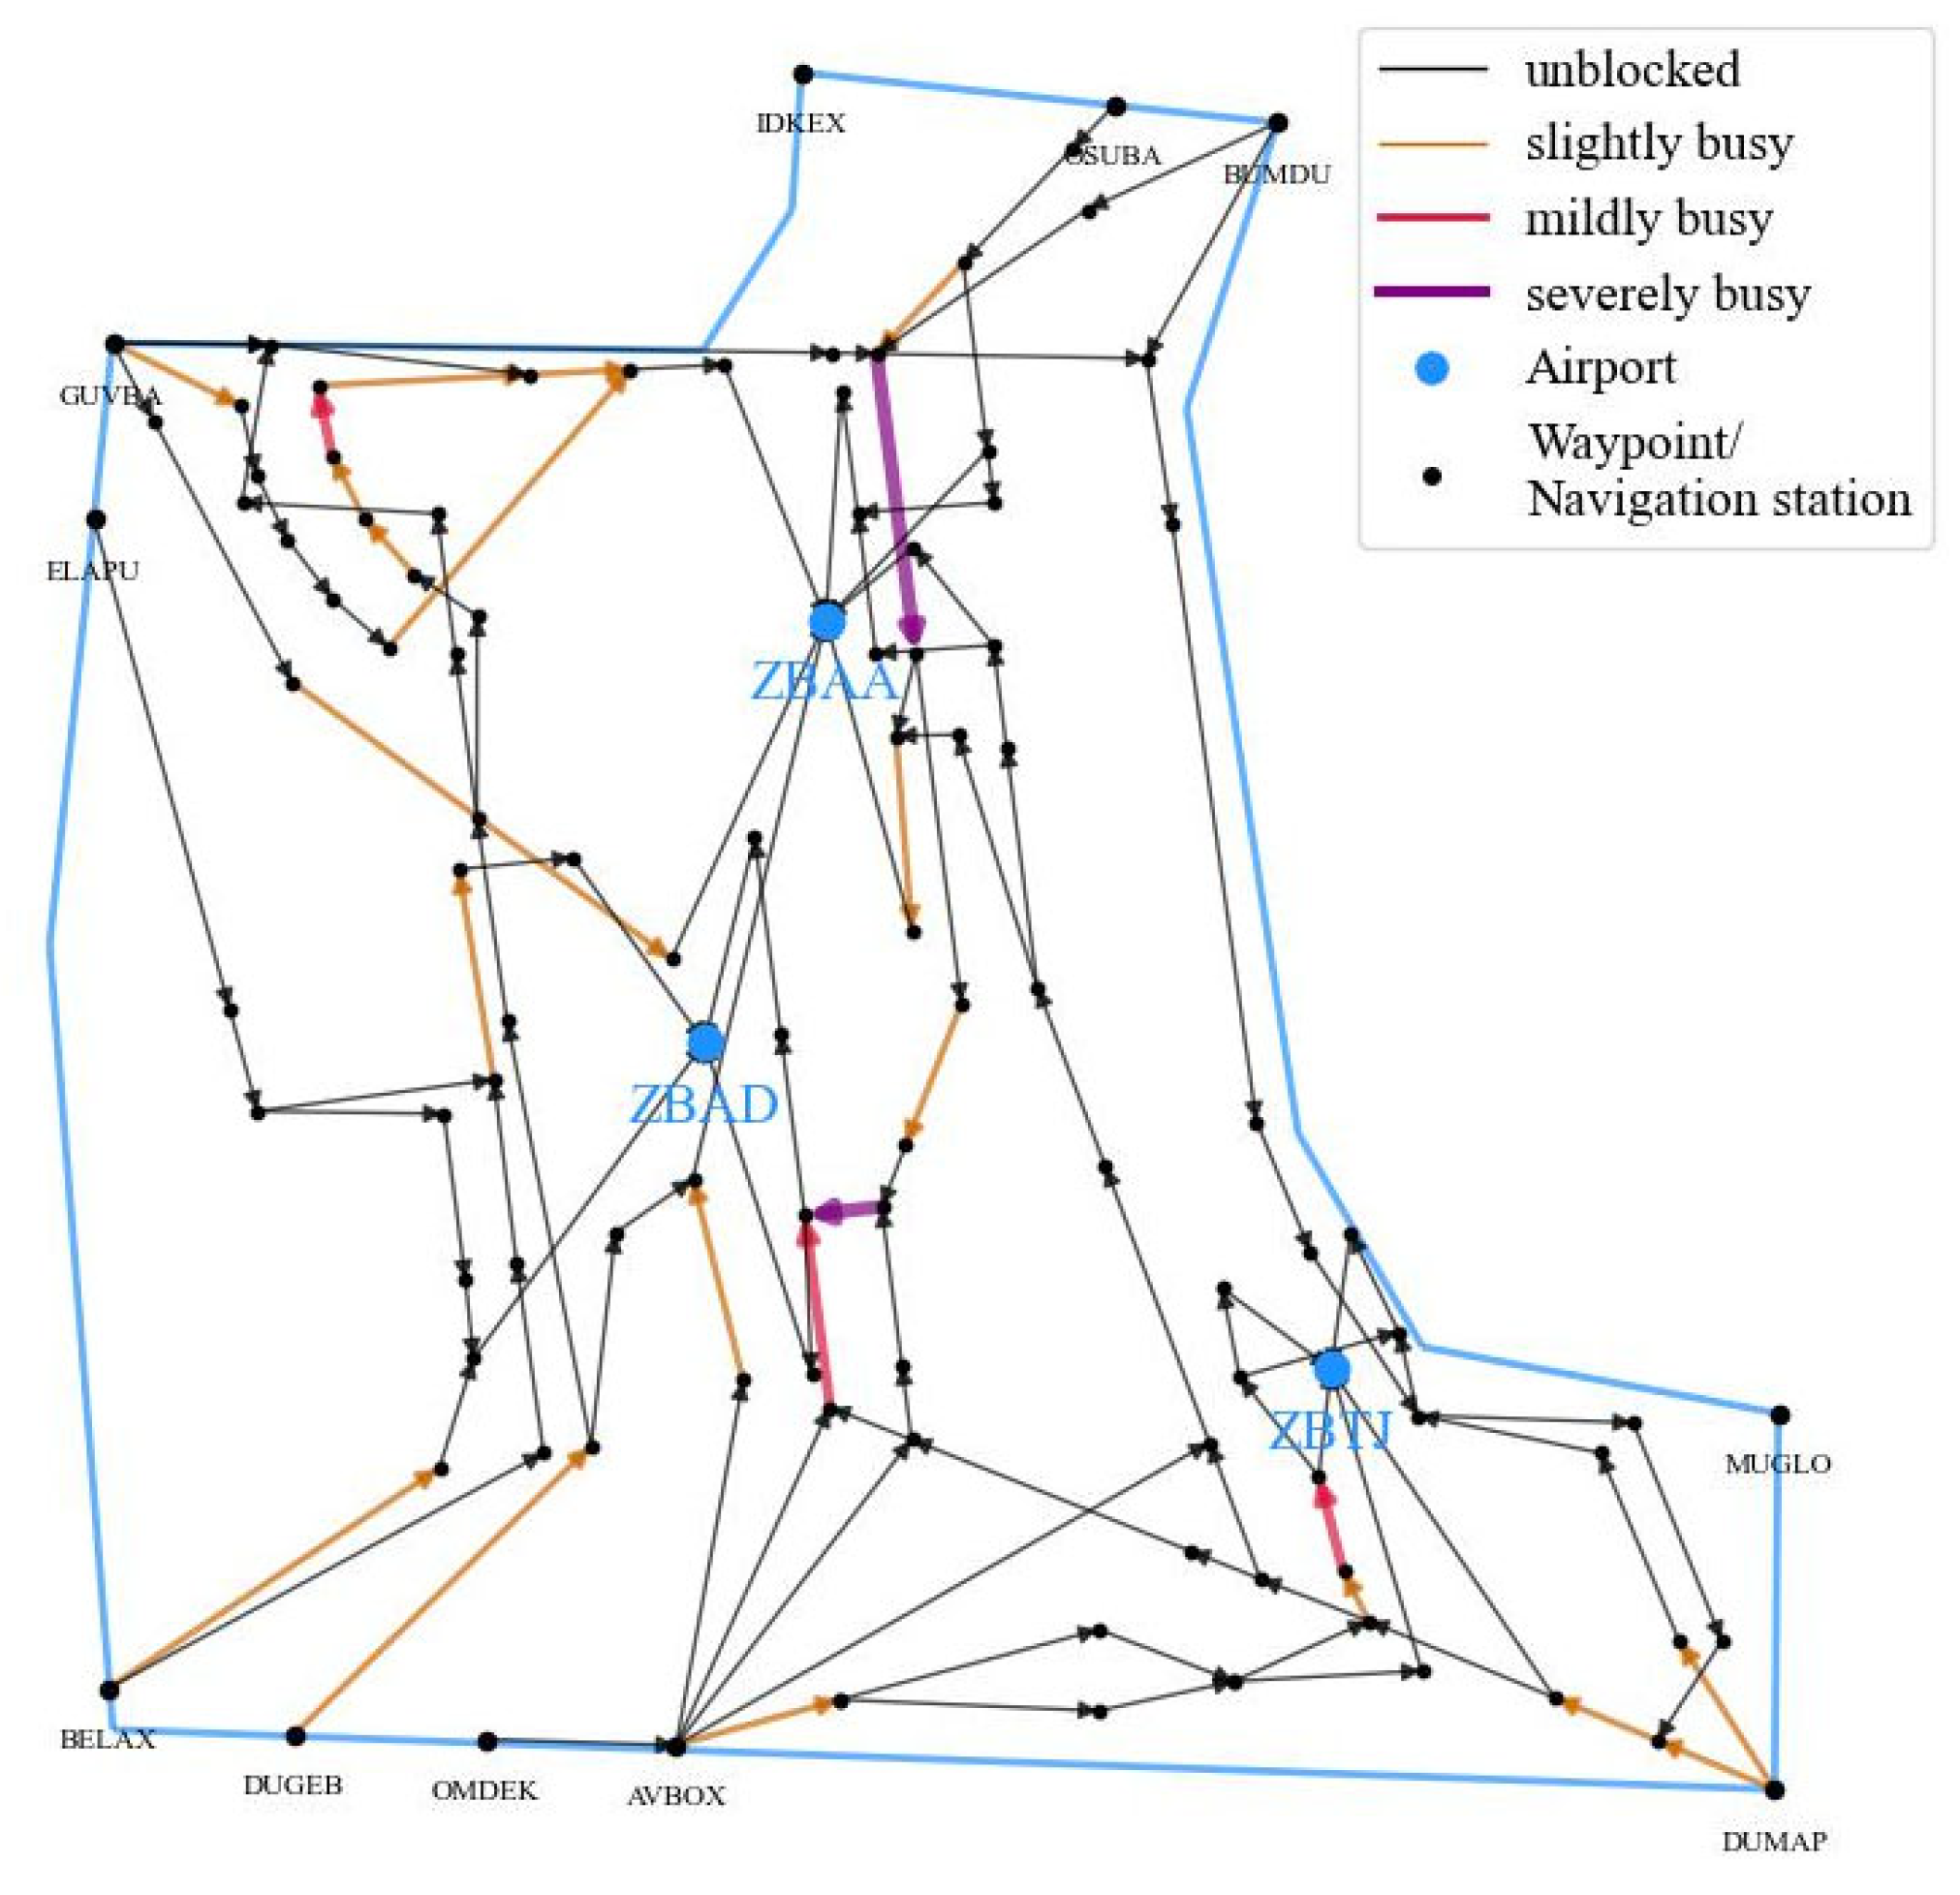
This paper uses the airspace structure and operation of the Beijing Terminal Area (including ZBAA, ZBAD, and ZBTJ airports) as an example for simulation analysis. Python (v3.13.5) is used to construct a Terminal Area approach path model, where blue nodes represent airports, Terminal Area edge nodes represent approach points and departure points, and the remaining nodes represent waypoints or navigation stations. The edges represent the approximate historical flight paths of aircraft under radar control.
Since aircraft move at a speed of approximately 5 to 15 km per minute in the Terminal Area, the congestion situation generally changes every 10 min in the Terminal Area. Therefore, a unit time of 2 min and a time period of 10 min are set. Extract the flight operation data of the Beijing Terminal Area on 1 November 2024, and use the method in research [18] to identify the time periods with poor congestion situations. Take this time period as an example, identify the busy route stages using the B i method mentioned in Section 2.1, set the parameter d j k n to 10, and γ is set to 1. B i values between 0 and 0.1 (inclusive) indicate an unblocked situation, B i values between 0.1 and 0.3 (inclusive) indicate slight busyness, B i values between 0.3 and 0.5 (inclusive) indicate medium busyness, and B i values of 0.5 and above indicate severe busyness. The identification results are shown in Figure 6, with a rating of medium congestion.
Count the number of aircraft that will pass through route stages with medium busyness (including) or higher in the next time period and assign the first-generation ants to select paths for them, as shown in Table 1. Then, initialize the preconditions and ant colony parameters based on the number of paths, the number of aircraft, the aircraft approach direction, and the actual operating conditions of the Beijing Terminal Area: Set the aircraft to select paths from specific approach points based on the approach direction. To focus on congestion relief, combine expert opinions and set the weights ω 1 and ω 2 of congestion and operating costs in the objective function to 60% and 40%. The aircraft fuel consumption rate c j was taken as the average fuel consumption rate of narrow-body aircraft, 2.5 kg/km. Based on the actual operating conditions of the Beijing Terminal Area, the average value of the nose distance d j k n was taken as 8 km. The minimum and maximum values of the pheromone weight α m i n and α m a x were 1 and 5, the minimum and maximum values of the inspired information weight β m i n and β m a x were also 1 and 5, and the pheromone update constant Q was 200. The pheromone evaporation factor ρ is 0.15, the maximum number of iterations s m a x is 50, the parameter k is 2, and the convergence condition is that the optimal objective function value change is within 0.05 after reaching the maximum number of iterations and at least five consecutive iterations.

3.2. Select Approach Path

Based on the actual operating conditions of the Beijing Terminal Area and expert opinions, the following constraints were set: B m a x = 0.8, P m a x = 5, δ = 150%. Since the speed of aircraft varies during actual operation, the delay time after diversion calculated based on the average speed may be slightly longer than the actual delay time. Therefore, a larger aircraft delay time threshold t m a x = 5 than usual was set.
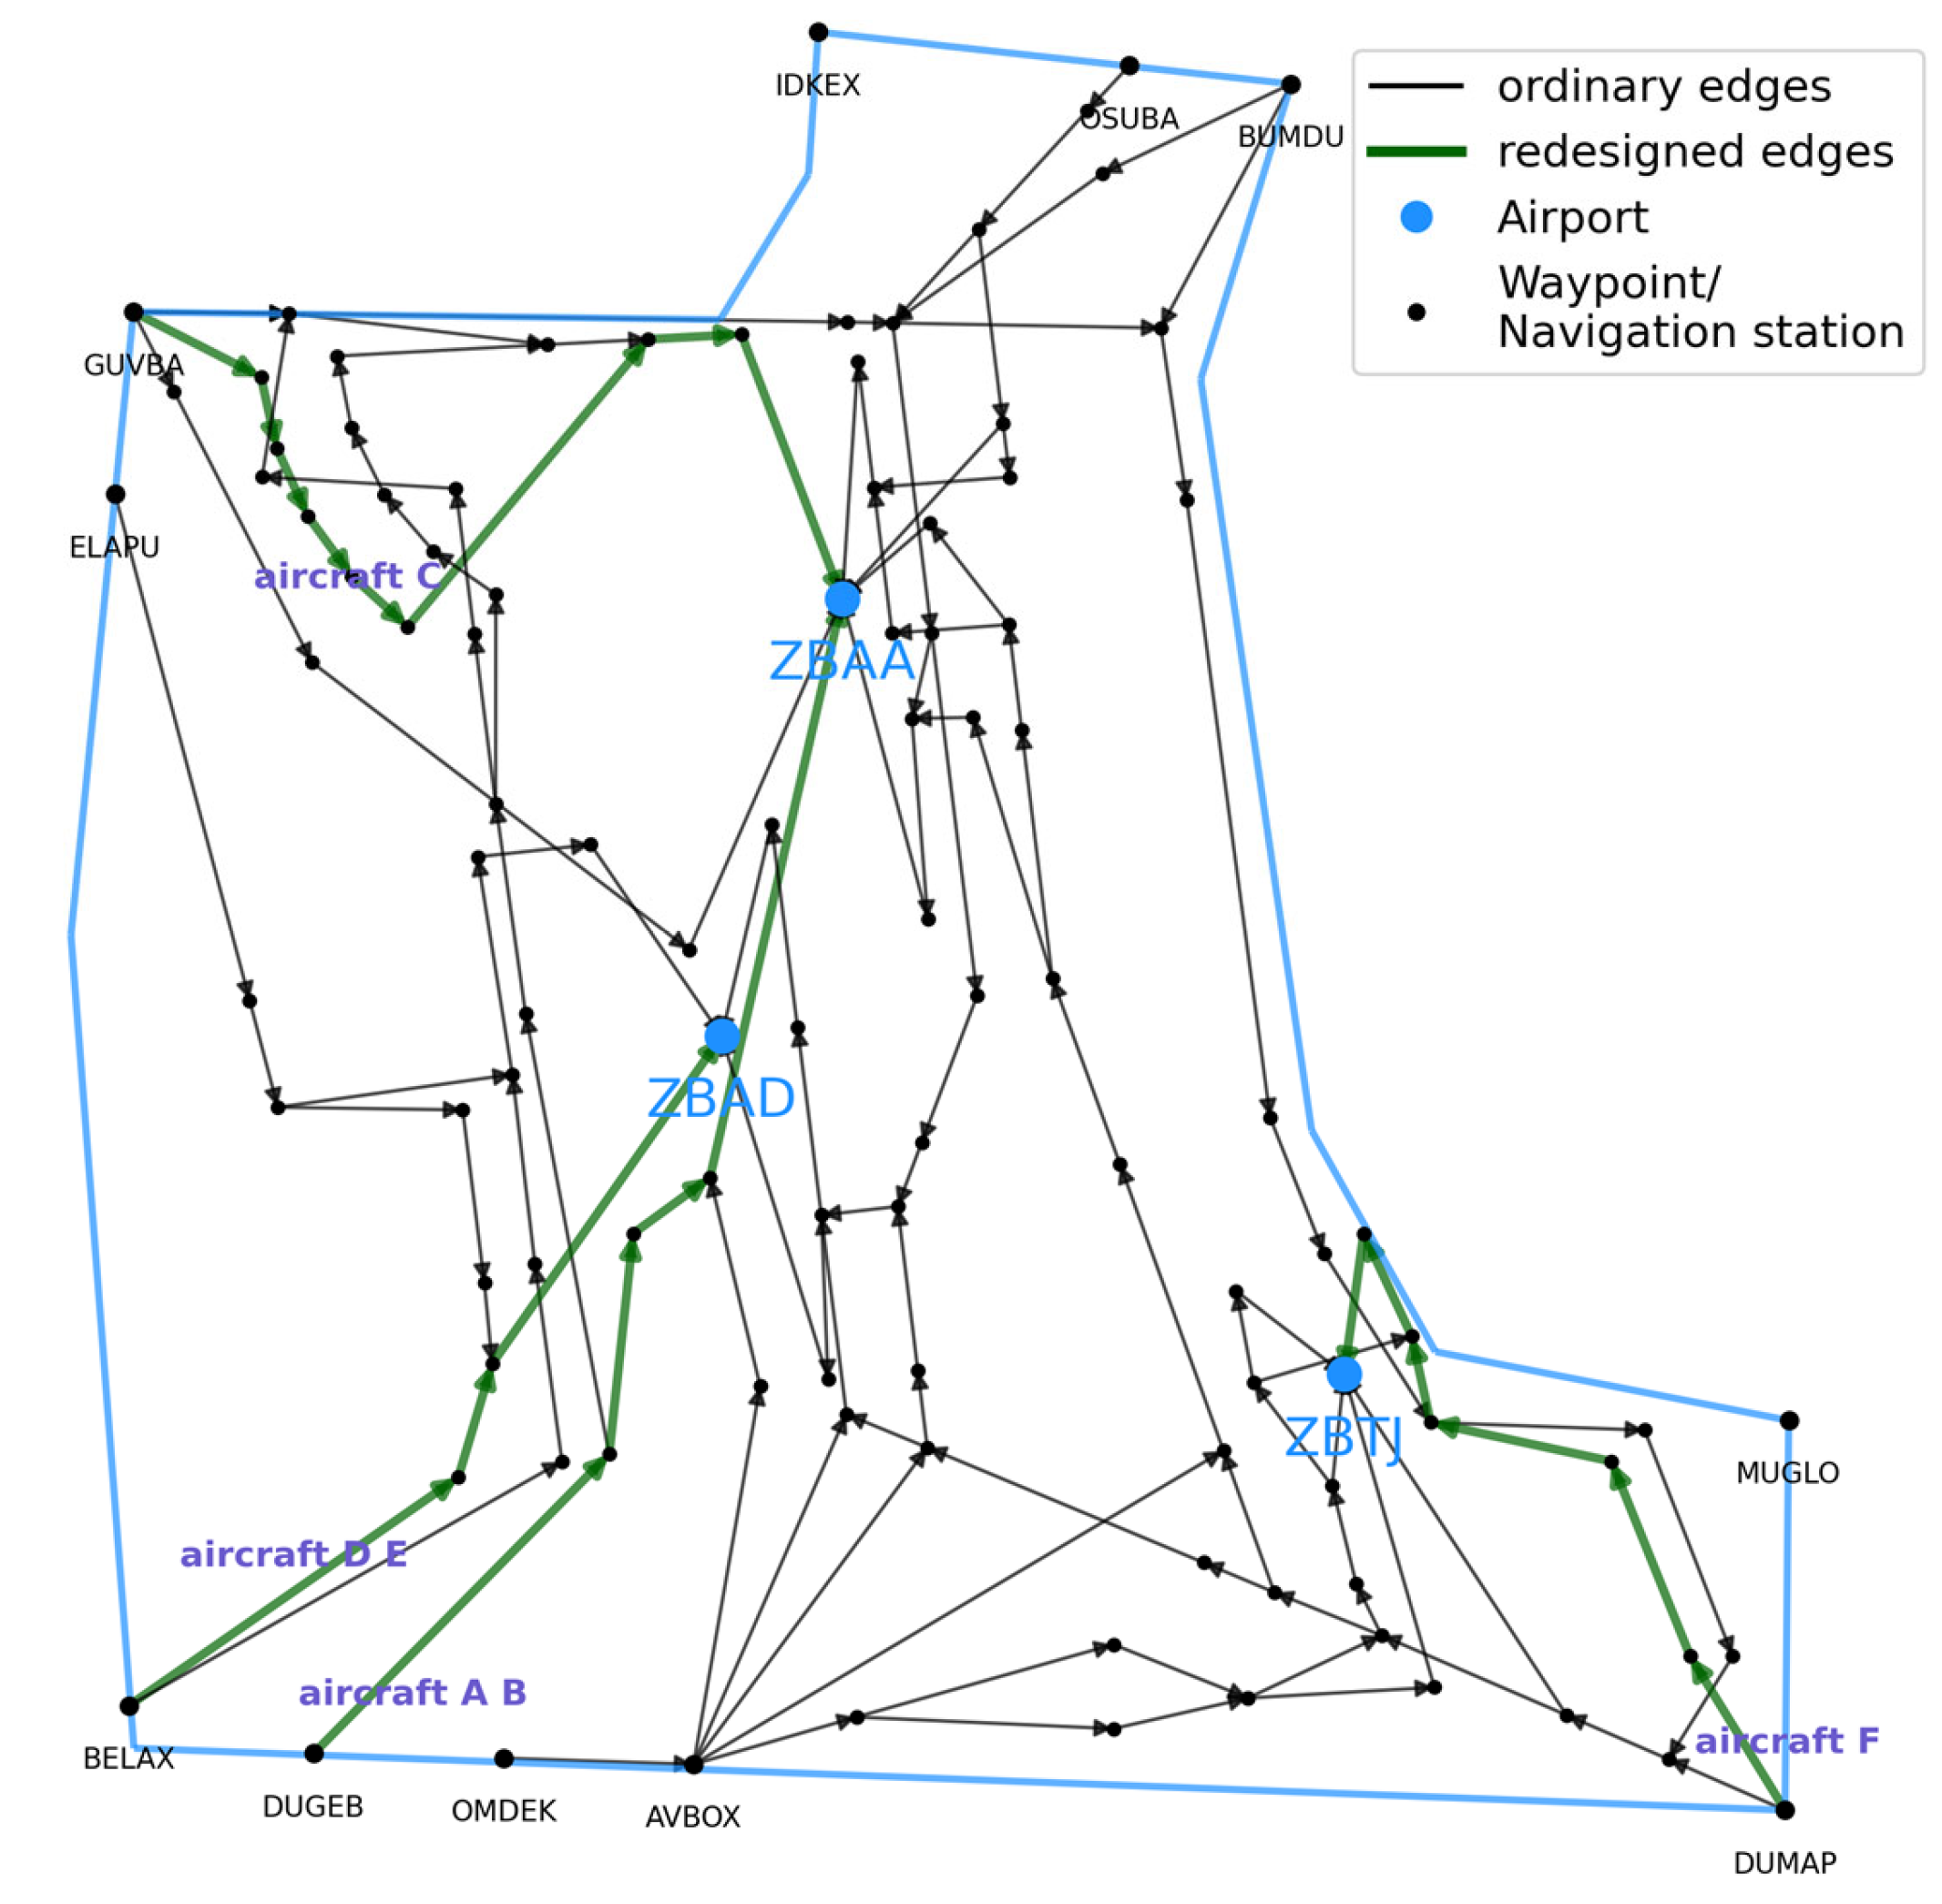
Ants A, B, C, D, E, F, and their offspring determine the range of approach path options based on the destination airport and the aircraft approach direction. The initial pheromone concentration of each path is set to 1 K i = 1 K B i , where 1 K i = 1 K B i refers to the average busyness of all route stages included in the path p . Then, according to the improved ACO algorithm in Section 3, the optimal approach path combination that minimizes the objective function is selected for all aircraft. For comparison, the congestion and operating costs are standardized and then added together (Formulas (20) and (21)). To avoid randomness, 30 trials were conducted, and the results of the trial with the minimum objective function value and the fastest convergence speed were used as the final path selection results, as shown in Figure 7. Partial experimental data slices are shown in Table 2 and Table 3.
W 1 ^ = W 1 W 1 ( m i n ) W 1 ( m a x ) W 1 ( m i n )
W 2 ^ = W 2 W 2 ( m i n ) W 2 ( m a x ) W 2 ( m i n )
W 1 ( m a x ) , W 1 ( m i n ) , W 2 ( m i a x ) , W 2 ( m i n ) represent the maximum and minimum values of W 1 and W 2 .
Figure 7. Improve ACO algorithm path planning results.
Aerospace 12 00856 g007
Table 2. The best experimental data slice from the 30 experiments.
Number of
Iterations
W 1 ^ (* 60%) W 2 ^ (* 40%) M i n F
10.2770.2360.513
20.1570.2310.388
30.2310.1870.418
40.2430.1360.379
……………………
90.1030.1060.209
100.0680.1460.214
110.0440.1400.184
120.0440.1400.184
*: multiplication.
Table 3. Comparison of objective function values and number of iterations for 30 experiments.
Number of
Experiments
Optimal MinFNumber of
Occurrences
Number of
Iterations at Fastest Convergence
10.388214
30.418117
40.215414
70.1841711
160.412113
230.365319
270.322215
The experimental results show that the improved ACO algorithm ultimately planned four different approach paths for six aircraft (as shown in Figure 7). Among them, two paths were planned specifically for aircraft approaching ZBAA airport, sharing the traffic that would subsequently pass through busy route stages and land at ZBAA and ZBAD airports. In terms of algorithm performance (as shown in Table 2 and Table 3), in 30 independent repeated experiments, the optimal function value obtained was 0.184. In the first 50 iterations, the optimal function values varied significantly and then quickly stabilized in the later stages. This was mainly due to the design of a mechanism in which the weights of the inspiration function and pheromone changed dynamically with the number of iterations, making the ant colony more exploratory in the early stages and the search trajectories more diverse. With the advancement of iterations, the algorithm quickly converged using the accumulated pheromones, with the final convergence number of generations mostly within 20 generations, and the fastest only requiring 11 generations. After 30 repeated experiments, it was found that the optimal function value appeared 17 times, accounting for a significant proportion, indicating that the improved ACO algorithm has good robustness, rarely gets stuck in local optima, and can stably converge to high-quality solutions, with the obtained path planning schemes not being random.

3.3. Comparison of 4 Algorithms Based on Ablation Experiments

In order to verify the effectiveness of the improved ACO algorithm proposed in this paper for overall congestion relief in the Terminal Area, and to conduct a comprehensive comparison with the traditional ACO algorithm, this section designs an ablation experiment comparing four algorithms. By using the ACO algorithm with key improvements removed to perform path planning, we analyze the contribution of the improvements to the overall performance of the algorithm. At the same time, the planning results of all algorithms are applied to the identification of the air traffic congestion situation in the Terminal Area in the next period, and the performance of the four algorithms and the effectiveness of congestion relief are evaluated from the two dimensions of objective function optimization and actual congestion relief effect. The four algorithms are as follows:
1.
Traditional Ant Colony Optimization (T-ACO);
Using the traditional Ant Colony Optimization as the benchmark algorithm, no inspiration function and pheromone weight change mechanism based on the number of iterations is set, nor is a “parent–child relationship inheritance pheromone” mechanism set. The quality of the path is judged solely by the busyness of a single path and the operating costs of each aircraft, and the objective function value is then calculated. According to the principle of traditional ant colony optimization, the algorithm can only be run 30 times for each of the three airports to plan the optimal path for each airport, and theoretically does not have the ability to optimize the overall coordination.
2.
The improved Ant Colony Optimization in this paper (I-ACO);
That is, the complete improved ant colony optimization proposed in this paper includes the “parent–child relationship inheritance pheromone” mechanism and the inspiration function and pheromone weight change mechanism with the number of iterations.
3.
Ablation Algorithm I (I-ACO-D);
Based on I-ACO, the dynamic weight adjustment strategy is removed, i.e., the pheromone weight α and the inspiration function weight β are fixed values throughout the iteration process, both taken as 1, to verify the effect of weight changes on algorithm performance.
4.
Ablation Algorithm Ⅱ (I-ACO-P).
Based on I-ACO, the “parent–child relationship inheritance pheromone” mechanism is removed, and all ants share the same global pheromone in each iteration, with the objective function remaining unchanged. This algorithm is used to verify the key role of the independent pheromone mechanism in achieving multi-aircraft path planning coordination, improving convergence speed, and avoiding new congestion problems caused by multiple aircraft selecting the same path.
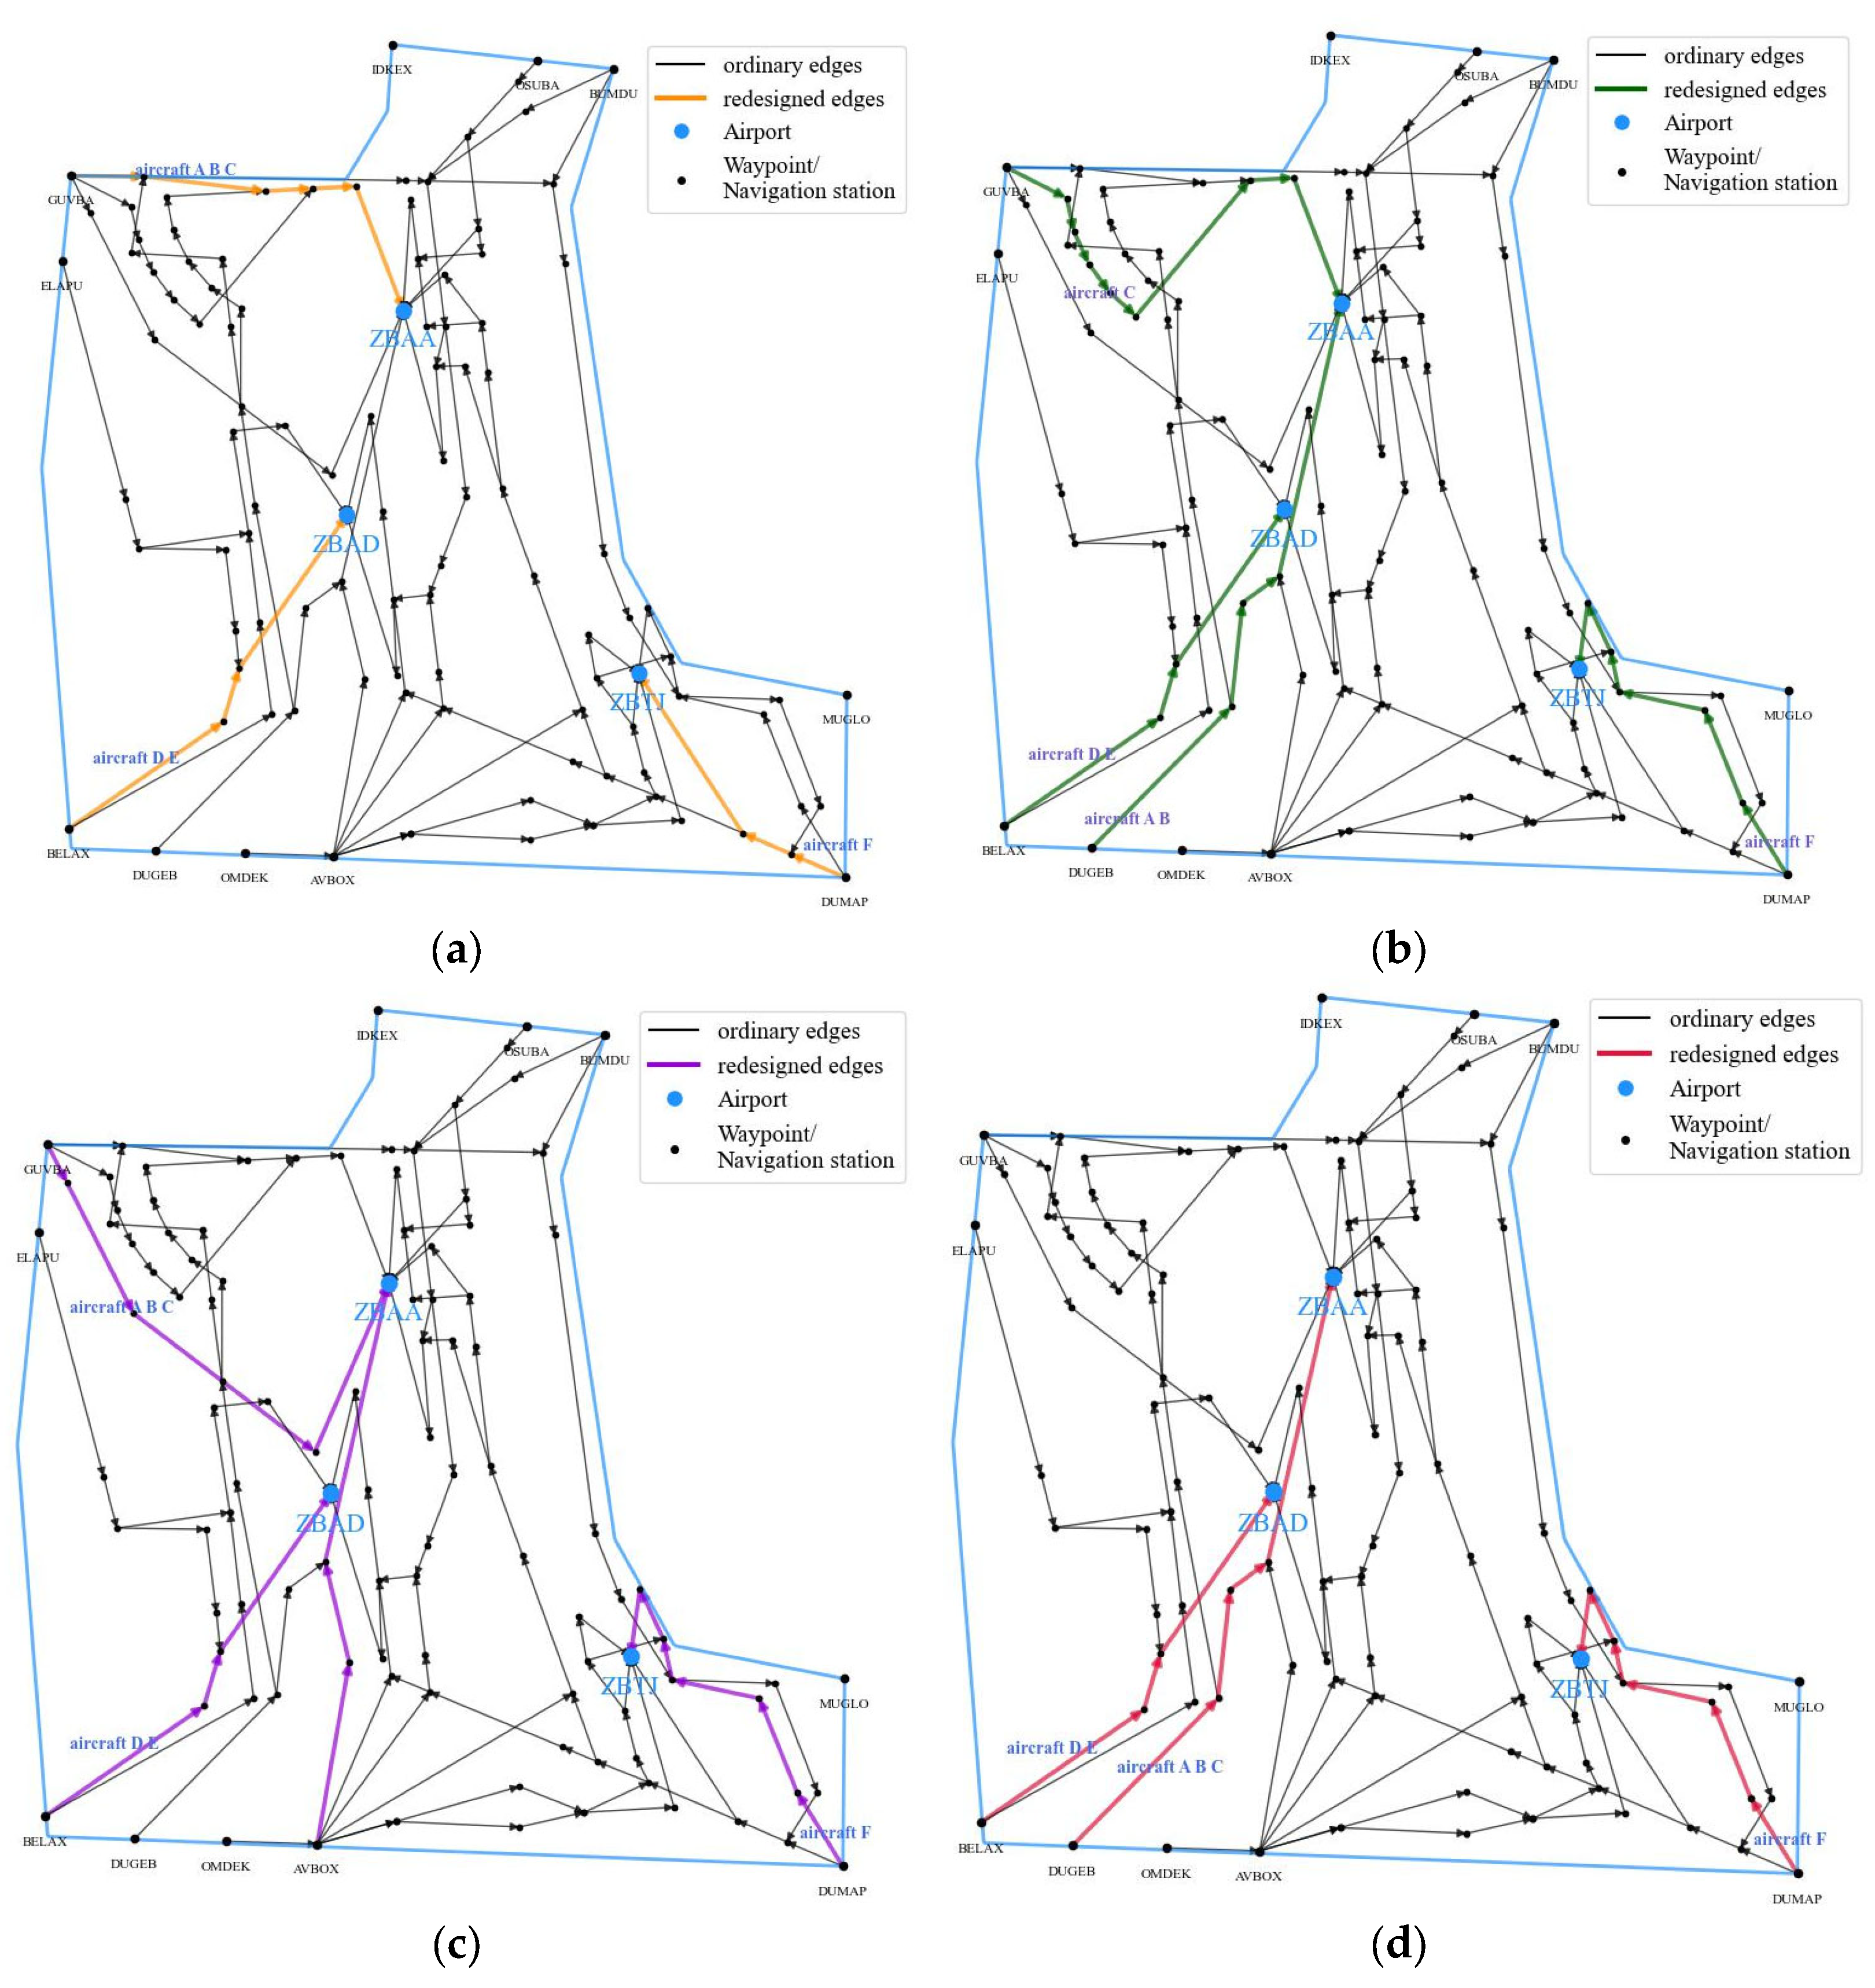
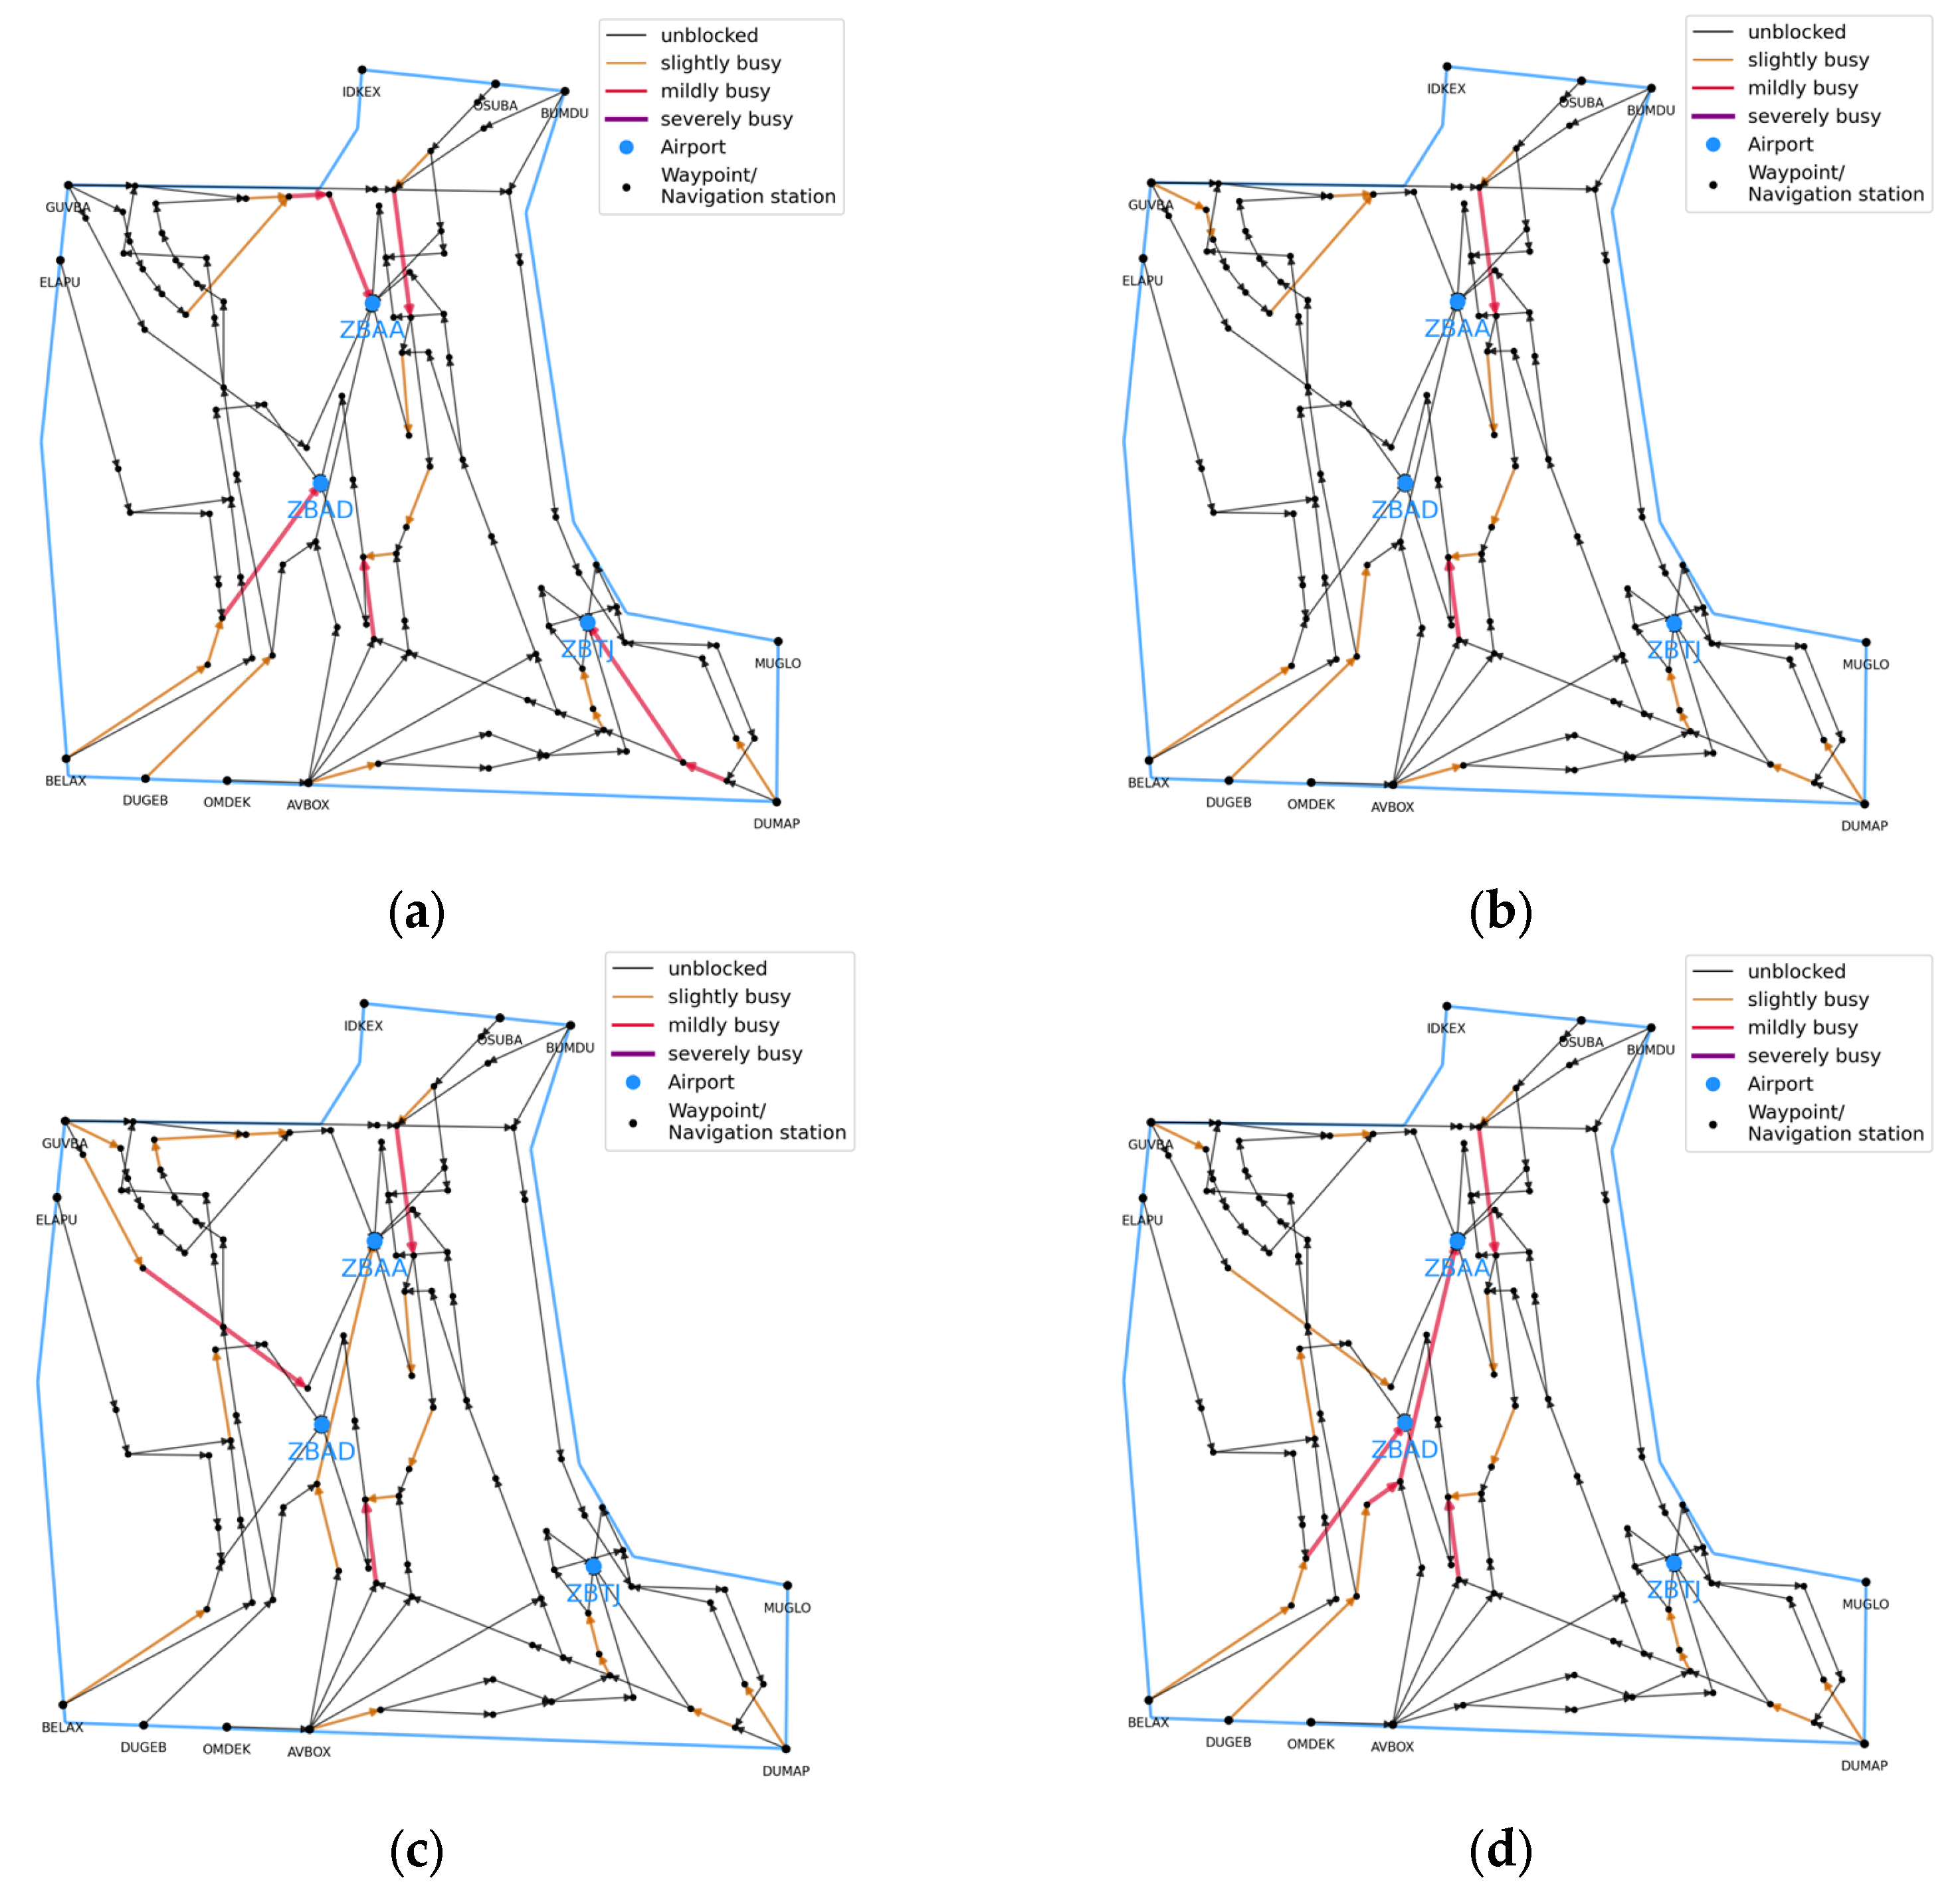
The ablation experiment was conducted 30 times, and the final path selection result was based on the experiment with the smallest objective function value and the fastest convergence speed. The path planning results of the four algorithms are shown in Figure 8.
First, from the intuitive results of path planning (Figure 8), the four algorithms show significant differences. The T-ACO algorithm and the I-ACO-P algorithm only planned three approach paths. Since the T-ACO algorithm only considers the operating costs of a single aircraft and the congestion of a single path, it tends to choose a single path with a shorter distance, less congestion, and lower operating costs. Although the I-ACO-P algorithm uses the overall congestion and operating costs of the Terminal Area as its objective function, it does not distinguish between “parent–child” pheromones between ant colonies, which may cause aircraft with the same destination airport to select the same path, resulting in less than ideal congestion relief in subsequent verification.
In contrast, the I-ACO-D and I-ACO algorithms, which have a “parent–child relationship” mechanism, both plan four paths, allowing different approach paths to share the traffic. For the I-ACO-D algorithm, due to the existence of the “parent–child relationship inheritance pheromone” mechanism, it is similar to the I-ACO algorithm and plans a total of four approach paths, but these are not completely identical to the paths planned by the I-ACO algorithm. This may be due to differences in algorithm performance and output results caused by the fixed pheromone weights and inspiration function weights.
Second, we compared the size of the objective function, algorithm performance, and congestion relief effects to verify the necessity of each improved module for improving model performance and optimizing output results. The comparison results are shown in Table 4, Figure 9 and Figure 10.

3.3.1. Comparison of Objective Functions

From the perspective of multi-objective optimization, I-ACO performs better than T-ACO and I-ACO-D in both sub-objectives (congestion and operating costs), so the solution of I-ACO strictly dominates the solutions of the latter two in the Pareto sense. For I-ACO-P, although its final operating cost (0.131) is slightly lower than that of I-ACO (0.140), its congestion (0.102) is much higher than that of I-ACO (0.044), resulting in a weighted total objective function value (0.233) that is significantly worse than that of I-ACO (0.184). This shows that the solutions of I-ACO and I-ACO-P do not dominate each other, but I-ACO has a huge advantage in the core objective of congestion relief and achieves a significant improvement in overall performance at an acceptable small cost increase, which is more in line with the original intention of this study to relieve the air traffic congestion situation in the Terminal Area.

3.3.2. Comparison of Algorithm Performance

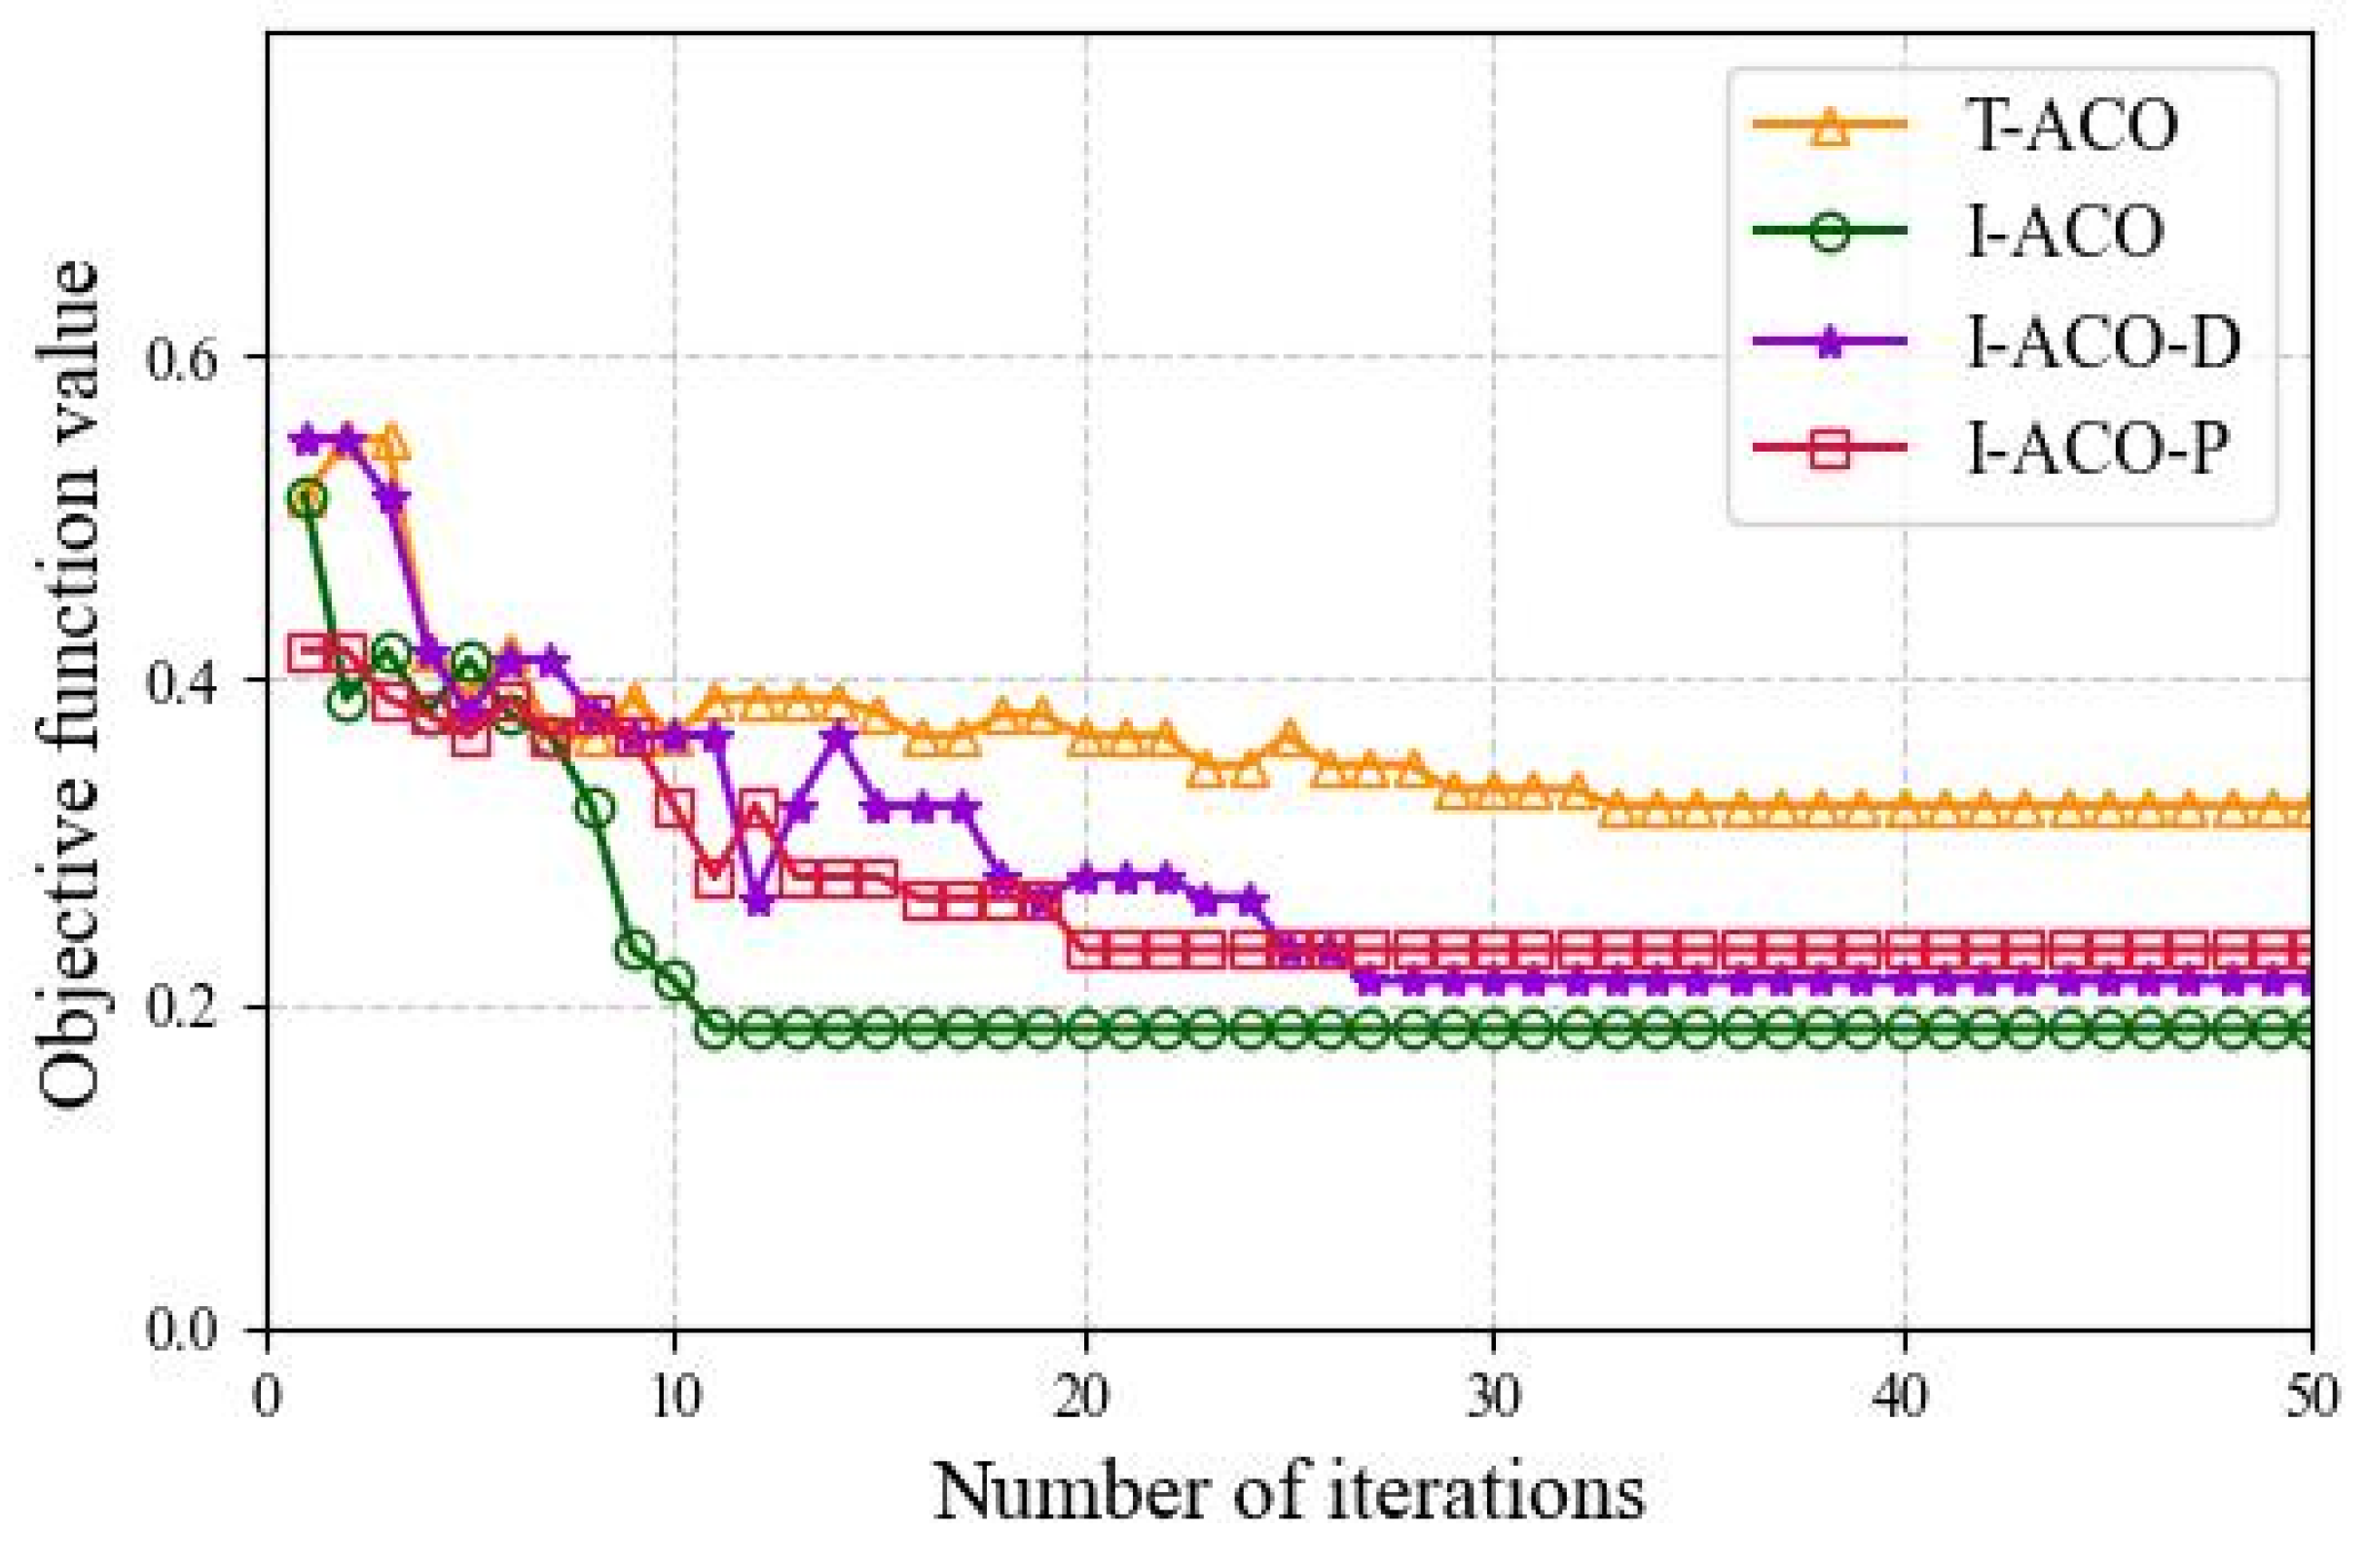
The convergence orders of T-ACO, I-ACO, I-ACO-D, and I-ACO-P are 29, 11, 27, and 20, respectively. As can be seen from Figure 9, the I-ACO algorithm and the I-ACO-P algorithm, which set the inspiration function and the pheromone weight to change dynamically with the number of iterations, both converge quickly. The I-ACO algorithm converged in the 11th generation, while the I-ACO-P algorithm converged in the 20th generation. Furthermore, because I-ACO conducted more “exploration” of the available paths in the early stages, it obtained more undesirable results, resulting in greater fluctuations in the objective function value in the early stages. However, this also accelerated the optimization speed of the subsequent ant colonies, thereby improving the optimization ability and robustness of the algorithm. The remaining T-ACO algorithm and I-ACO-D algorithm, which removed the inspiration function and the mechanism of dynamic changes in pheromone weights with the number of iterations, did not have strong exploratory capabilities in the early stages, so the function values did not fluctuate much in the early stages, but they were prone to local optima and often converged too slowly when obtaining the optimal solution.

3.3.3. Comparison of Congestion Relief Effects

After planning new approach paths for aircraft scheduled to approach congested route stages in the next period, the operations of all aircraft in the next period were simulated again, assuming that controllers could ensure safe separation between aircraft and that the separation between newly added aircraft and aircraft originally scheduled to pass through the route stage was 8 km. Using the identification method in reference [18], the congestion relief effects of the two methods on the overall air traffic congestion situation in the Terminal Area in the next period were compared. The results are shown in Table 5 and Figure 10.
First, comparing the congestion stage identification results of the previous period in Figure 6, except for T-ACO, after the other algorithms planned new routes for the aircraft, the overall air traffic congestion situation in the Terminal Area during this period was significantly relieved, and the number of slight busyness and above stages decreased significantly. According to the congestion relief results of the Terminal Area after T-ACO, although the number of severe busyness route stages decreased to 0, the number of medium busyness route stages increased significantly, resulting in the congestion situation level remaining at “medium.” From a macro perspective, congestion relief was not achieved. For I-ACO, the number of route stages with slight busyness and above is lower than that of other algorithms, and the congestion situation level improvement is the highest, which obviously plays a role in congestion relief and has the same effect as other algorithms. Second, comparing the congestion relief effects of the I-ACO-D and I-ACO-P algorithms, the two have the same situation level. Although the number of slight busyness route stages obtained by I-ACO-P is slightly higher than that obtained by I-ACO-D, the number of medium busyness route stages obtained by I-ACO-P is higher than that obtained by I-ACO-D and second only to T-ACO. Combined with the aforementioned congestion value comparison, it can be concluded that the congestion relief effect of I-ACO-D is slightly better than that of I-ACO-P.
Ablation experiments and comparative analysis fully prove the effectiveness of the improvement strategy proposed in this paper. The traditional ACO algorithm only plans approach paths for individual aircraft. Although each selected path is optimal for a single aircraft, it cannot take into account the overall congestion relief effect and the operating cost minimization of the Terminal Area. Adding “parent–child relationship inheritance pheromone” and dynamic weight adjustment mechanisms can achieve the goals of multi-aircraft path coordination and global congestion relief, while effectively improving the optimization efficiency of the algorithm and its ability to escape local optima. The combination of these two features gives the improved ACO a clear advantage over traditional algorithms and single-improvement algorithms in solving congestion relief problems in the Terminal Area.
In order to quantify the significance of the performance differences between the above four algorithms, we perform a nonparametric Mann–Whitney U test to measure whether the performance differences between other algorithms and the I-ACO algorithm in this paper are statistically significant by calculating the p-value. In addition, the performance and congestion mitigation effect of the algorithm are comprehensively compared, and the results are shown in Table 6.
The test results showed that the p-values of all control groups were far less than 0.001. This shows that the performance improvement of I-ACO algorithm compared with T-ACO, I-ACO-D and I-ACO-P algorithms is highly significant in statistics, not caused by accidental factors.
Through the appeal analysis, it can be seen that the improved ACO algorithm proposed in this paper is superior to other ACO algorithms in terms of function optimization, congestion relief, convergence speed, risk of getting stuck in local optimal solutions, and algorithm robustness. This shows that the model can search for paths that better balance congestion relief and operating costs than other ACO algorithms.

4. Discussion

4.1. Application Value of Congestion Relief Model

At the theoretical level, the core contribution of this study is to promote the innovation of the air traffic management mode. Specifically, the model supports the transformation from the regulation mode relying on human experience to the intelligent and data-driven regulation mode. This change conforms to the development trend of air traffic management to apply “machine intelligence”, and it provides a theoretical reference for the future more autonomous air traffic management system.
In practical application, the model provides core technical support for the development of an advanced controller-aided decision-making system. The system can intuitively present the congested and busy routes identified by the model and the optimal flight path scheme after planning on the controller’s monitoring screen. This brings two key advantages: First, it may improve the safety of aircraft operation by enabling controllers to respond quickly to potential congestion. The system may effectively reduce the probability of loss of separation between aircraft by collaborative optimization of the approach aircraft paths in the next period, so as to significantly improve the overall operation safety of the Terminal Area. Second, it may improve the work efficiency of controllers and reduce the workload. The model can automatically analyze the complex congestion situation and generate relief schemes. This may reduce the workload and psychological pressure of controllers in the process of monitoring, judgment, and deployment. The controller can quickly make the final decision on the basis of the recommended scheme of the model and the actual situation. This may not only improve the quality of aircraft deployment, but also improve the system efficiency of the whole control work.
Based on the above ideas, the integration of congestion relief methods in Terminal Areas proposed in this study in actual air traffic management needs more research.

4.2. Prospect of Congestion Relief Model

First, the evolution from a two-dimensional network to a three-dimensional space-time network. The traffic network constructed in the current study is based on a two-dimensional topology, which simplifies the complex interaction in the vertical dimension. Future research can expand the model into a three-dimensional network and give height attributes to nodes and edges. This will help to more accurately simulate the climb and descent profiles of aircraft, as well as the crossing and convergence behavior at different altitudes. Finally, this will provide a solid model basis for formulating a more three-dimensional congestion relief strategy based on a 4D trajectory.
Second, relief strategies are developing towards integration and refinement. The strategy of this paper mainly focuses on Collaborative path planning. However, more refined traffic flow management needs to integrate various measures such as sequencing and metering. Future research can build a path to sequencing time-integrated collaborative control framework. The framework will allocate reasonable routes, sequences, and times for aircraft at the same time, so as to realize the comprehensive optimization of traffic flow and maximize the efficiency of airspace utilization.
Thirdly, the adaptive mitigation method based on machine learning is explored. This research model performs well under normal conditions, but its effectiveness may be limited when dealing with emergencies such as bad weather or runway closure. Therefore, advanced machine learning technologies such as reinforcement learning can be explored in the future. These technologies enable the model to learn the optimal mitigation strategy through interaction with the environment, so as to dynamically adapt to various unexpected scenarios. This will significantly enhance the robustness and emergency response ability of the system, which is the only way to achieve high-level intelligent autonomous air traffic management.

5. Conclusions

The main work of this paper is to construct a traffic network model for the Terminal Area based on a complex network, and then use an improved ACO algorithm to solve the optimal approach path that can alleviate the air traffic congestion situation in the Terminal Area, and verify the effectiveness of the path planning results. The research results show that:
  • A traffic network model for the Terminal Area was constructed using a complex network, which can fit the actual situation in the Terminal Area and grasp the overall congestion situation in the Terminal Area from a global perspective.
  • This paper proposes a congestion relief strategy model. The optimal objective function value obtained by the model is 0.184, which is significantly lower than other algorithms. At the same time, it can converge in the 11th generation, and the convergence speed is faster than other algorithms. The congestion mitigation effect is also the best.
  • The feasibility of integrating a congestion relief model into the air traffic control system is preliminarily conceived in this paper

Author Contributions

Conceptualization: Y.J. and F.Y.; methodology: Y.J.; software: Y.J.; validation: Y.J.; formal analysis: Y.J., F.Y. and Y.P.; investigation: Y.J. and Y.P.; resources: F.Y. and D.S.; data curation: Y.J. and Y.P.; writing—original draft preparation: Y.J.; writing—review and editing: D.S., F.Y. and Y.P.; visualization: Y.J.; supervision: F.Y. and D.S.; project administration: F.Y. and D.S.; funding acquisition: F.Y. and D.S. All authors have read and agreed to the published version of the manuscript.

Funding

This research received no external funding.

Data Availability Statement

The data presented in this study are available on request from the corresponding author.

Conflicts of Interest

The authors declare no conflict of interest.

References

  1. Wei, M.; Wu, W.; Sun, B. An Optimization Model for Inbound and Outbound Flight Scheduling with Consideration of Potential Risk Levels and Priorities. Ind. Eng. Manag. 2022, 27, 40–45. [Google Scholar]
  2. Lw, M.L.; Wu, X.S.; Hu, Y.M. Arrival flights optimal sequencing with multi-path selection based on rolling horizon control. J. Beijing Univ. Aeronaut. Astronaut. 2023, 49, 3222–3229. [Google Scholar]
  3. Yang, L. Studies on Complex Dynamics & Congestion Mitigation Methods of Air Traffic Flow in Terminal Airspace. Doctoral Dissertation, Nanjing University of Aeronautics and Astronautics, Nanjing, China, 2018. [Google Scholar]
  4. Chen, D.; Tang, C.; Zhang, H.; Ma, Y.; Xu, H. Fine Modeling of Aviation Emissions and Green Trajectory Optimization of Complex En-route Networks. J. Transp. Syst. Eng. Inf. Technol. 2024, 24, 318–326. [Google Scholar]
  5. Zhu, Y.F.; Sun, Y.; Zhen, Z.Y. Optimization of vertical profile for civil aircraft climbing phase based on improved NSGA-II. Flight Dyn. 2025, 1–7. [Google Scholar] [CrossRef]
  6. Yang, X.S.; Zhang, C.; Zhu, C.Y. Research on multi-objective optimization of four-dimensional trajectory in the flexible airspace structure. Flight Dyn. 2025, 43, 83–89. [Google Scholar]
  7. Yang, S.S. Research on Rerouting Strategy Based on Multi-objective Optimization. Master’s Thesis, Nanjing University of Aeronautics and Astronautics, Nanjing, China, 2013. [Google Scholar]
  8. Hao, E.L. Research on Rerouting Tactics in Terminal Area Based on Task Complexity of ATC. Master’s Thesis, Nanjing University of Aeronautics and Astronautics, Nanjing, China, 2017. [Google Scholar]
  9. Zelinski, S.; Xue, M.; Bassett, P. Optimized Route Capability Intelligent Offloading of Congested Arrival Routes; AIAA Aviation: Washington, DC, USA, 2016. [Google Scholar]
  10. Xue, M.; Zelinski, S. Route Optimization for Offloading Congested Meter Fix. In Proceedings of the 35th Digital Avionics Systems Conference, Sacramento, CA, USA, 25–29 September 2016. [Google Scholar]
  11. Chen, H.; Zhao, Y.J. Sequential Dynamic Strategies for Real-Time Scheduling of Terminal Traffic. J. Aircr. 2012, 49, 237–249. [Google Scholar] [CrossRef]
  12. Xiang, Z.; He, Y.Y.; Quan, Z.W. A Rerouting Path Planning Based on Q-Learning Algorithm in Traffic Congestion Airspace. Sci. Technol. Eng. 2022, 22, 14494–14501. [Google Scholar]
  13. Daganzo, C.F. Urban gridlock: Macroscopic modeling and mitigation approaches. Transp. Res. PART B-Methodol. 2007, 41, 49–62. [Google Scholar] [CrossRef]
  14. Wu, M.G.; Ye, Z.L.; Wen, X.X.; Jiang, X.R. Air traffic complexity recognition method based on complex networks. J. Beijing Univ. Aeronaut. Astronaut. 2020, 46, 839–850. [Google Scholar]
  15. Heng, Y.M.; Wu, M.G.; Wen, X.X.; Lin, F.G.; Yang, T. Controller Workload Evaluation Based on Complex Network. J. Xihua Univ. (Nat. Sci. Ed.) 2022, 41, 52–58. [Google Scholar]
  16. Peng, Y.T.; Wen, X.X.; Wu, M.G.; Zhu, D.S.; Ding, L. Complex network-based air traffic complexity analysis in TBO. J. Beijing Univ. Aeronaut. Astronaut. 2023, 42, 435–445. [Google Scholar]
  17. Li, Y.F. Research on Key Techniques of Complex Airport Terminal Airspace Resources Allocation. Ph.D. Thesis, Nanjing University of Aeronautics and Astronautics, Nanjing, China, 2016. [Google Scholar]
  18. Ji, Y.R.; Yu, F.P.; Shen, D.; Peng, Y.T. Study on the Identification of Terminal Area Traffic Congestion Situation Based on Symmetrical Random Forest. Symmetry 2025, 17, 96. [Google Scholar] [CrossRef]
  19. Dorigo, M.; Maniezzo, V.; Colorni, A. Ant system: Optimization by a colony of cooperating agents. IEEE Trans. Syst. Man Cybern. Part B (Cybern.) 1996, 26, 29–41. [Google Scholar] [CrossRef] [PubMed]
  20. Zhang, S.C.; Pu, J.X.; Si, Y.N.; Sun, L.F. Survey on Application of Ant Colony Algorithm in Path Planning of Mobile Robot. Comput. Eng. Appl. 2020, 56, 10–19. [Google Scholar]
  21. Xiao, J.Z.; Yu, X.L.; Zhou, G.; Shun, K.K.; Zhou, Z. An improved ant colony algorithm for indoor AGV path planning. Chin. J. Sci. Instrum. 2022, 43, 277–285. [Google Scholar]
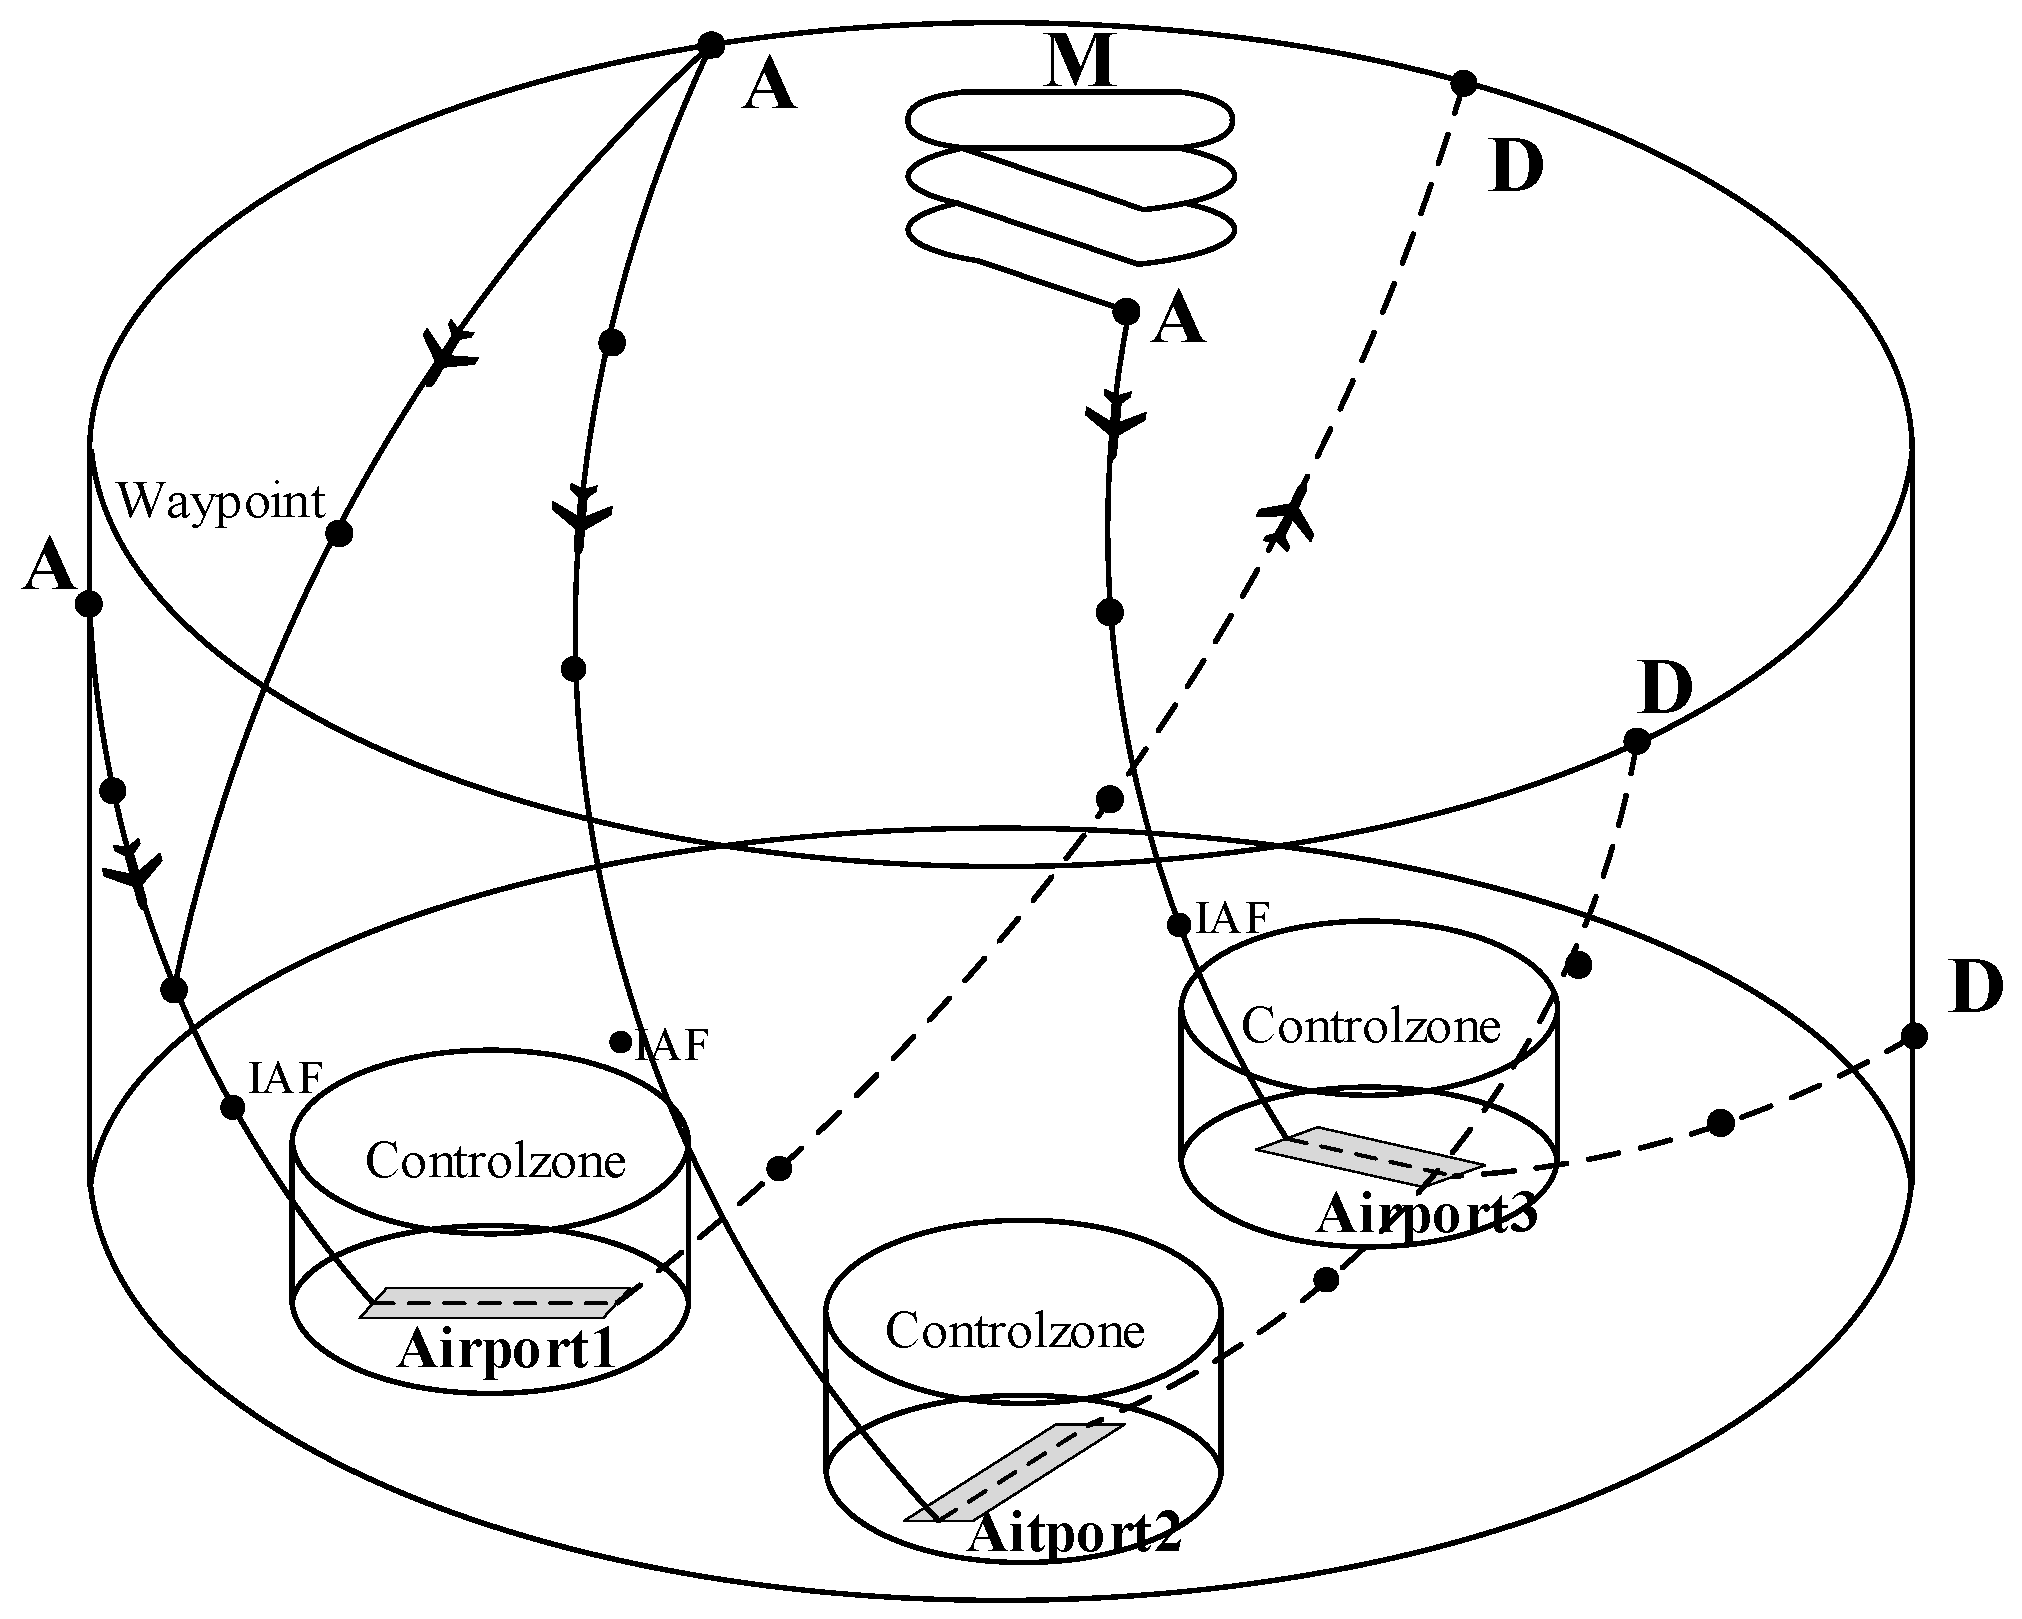
Figure 1. Terminal Area structure.
Aerospace 12 00856 g001
Figure 2. Transportation network of Terminal Area.
Aerospace 12 00856 g002
Figure 3. Congestion relief strategies.
Aerospace 12 00856 g003
Figure 4. “Parent–child relationship inheritance pheromone” mechanism.
Aerospace 12 00856 g004
Figure 5. Flowchart of ACO for solving optimal paths.
Aerospace 12 00856 g005
Figure 6. Identification of congested route stage at a given time period.
Aerospace 12 00856 g006
Figure 8. Comparison of four algorithm path planning results. (a) is the route planning result of T-ACO. (b) is the route planning result of I-ACO. (c) is the route planning result of I-ACO-D. (d) is the route planning result of I-ACO-P.
Aerospace 12 00856 g008
Figure 9. Comparison of convergence results of 4 algorithms.
Aerospace 12 00856 g009
Figure 10. Identification results for the next period of congestion for the 4 algorithm. (a) is identification results for the next period of congestion of T-ACO. (b) is identification results for the next period of congestion of I-ACO. (c) is identification results for the next period of congestion of I-ACO-D. (d) is identification results for the next period of congestion of I-ACO-P.
Aerospace 12 00856 g010
Table 1. Aircraft corresponding Ant number and range of approach point options.
Aircraft NumberApproach DirectionAnt Type NumberApproach Point
Selection Range
aircraft Asouthwestant ABELAX; DUGEB; OMDEK; AVBOX
aircraft Bsouthwestant BBELAX; DUGEB; OMDEK; AVBOX
aircraft Cwestant CGUVBA; ELAPU;
BELAX; DUGEB; OMDEK; AVBOX
aircraft Dsouthwestant DBELAX; DUGEB; OMDEK; AVBOX
aircraft Esouthwestant EBELAX; DUGEB; OMDEK; AVBOX
aircraft Fsoutheastant FDUMAP; MUGLO
Table 4. Comparison of the best experimental data from 30 experiments.
Types of Algorithms W 1 ^
(* 60%)
W 2 ^
(* 40%)
Optimal MinFNumber of
Occurrences of the
Optimal MinF
T-ACO0.1650.1570.3228
I-ACO0.0440.1400.18417
I-ACO-D0.0680.1460.2149
I-ACO-P0.1020.1310.23314
*: multiplication.
Table 5. Comparison of congestion relief effects.
Types of AlgorithmsCongestion Situation LevelNumber of Route Stages with Slight
Busyness
Number of Route Stages with Medium
Busyness
Number of Route Stages with Severe
Busyness
T-ACOmedium congestion157 0
I-ACOunblocked situation1620
I-ACO-Dslight congestion1830
I-ACO-Pslight congestion1640
Congestion in the
previous period
medium congestion1932
Table 6. Comprehensive comparison of 4 algorithms.
Types of
Algorithms
Optimal MinFConvergence
Iteration Number
Number of
Occurrences
of the
Optimal MinF
Congestion
Situation Level for the Next
Period
p-Value (vs. I-ACO)
T-ACO0.322298medium congestion<0.001
I-ACO0.184 1117unblocked situation
I-ACO-D0.214279slight congestion<0.001
I-ACO-P0.233 2014slight congestion<0.001
Disclaimer/Publisher’s Note: The statements, opinions and data contained in all publications are solely those of the individual author(s) and contributor(s) and not of MDPI and/or the editor(s). MDPI and/or the editor(s) disclaim responsibility for any injury to people or property resulting from any ideas, methods, instructions or products referred to in the content.