Abstract
Rubble-pile asteroids may be the type of near-Earth object most likely to threaten Earth in a future collision event. Small-scale impact experiments and numerical simulations for large-scale impacts were conducted to clarify the size ratio of the boulder/projectile diameter effects on ejecta size–velocity distribution. A series of small-scale impact cratering experiments were performed on porous gypsum–basalt targets at velocities of 2.3 to 5.5 km·s−1. Three successive ejection processes were observed by high-speed and ultra-high-speed cameras. The momentum transfer coefficient and cratering size were measured. A three-dimensional numerical model reflecting the random distribution of the interior boulders of the rubble-pile structure asteroid is established. The size ratio (length to diameter) of the boulder size inside the asteroid to the projectile diameter changed from 0.25 to 1.7. We conducted a smoothed particle hydrodynamics numerical simulation in the AUTODYN software to study the boulder size effect on the ejecta size–velocity distribution. Simulation results suggest that the microscopic porosity on regolith affects the propagation of shock waves and reduces the velocity of ejecta. Experiments and numerical simulation results suggest that both excavation flow and spalling ejection mechanism can eject boulders (0.12–0.72 m) out of the rubble-pile asteroid. These experiments and simulation results help us select the potential impact site in a planetary defense scenario and reduce deflection risk. are comprised primarily of boulders of a range of sizes.
1. Introduction
As the frequency of near-Earth object (NEO) discoveries increases, so does the probability of asteroids colliding with Earth [1]. The larger the size (and smaller the number) of the asteroid, the lower the probability of asteroid impact on Earth, but the greater the harm [2,3,4]. Asteroids broke up as they passed through the atmosphere, creating an airburst [5], causing extensive ground damage [6], and forming craters [7]. Therefore, it is necessary to detect [8], warn [9], and defend against potentially hazardous asteroids in advance [9,10]. Kinetic energy impact deflecting is currently a relatively simple and reliable method of deflecting asteroids [11]. The Double Asteroid Redirection Test (DART) impactor succeeded in reducing the orbital instantaneous velocity component of Dimorphos by 2.70 ± 0.10 mm·s−1 and the orbital period 33.0 ± 1.0 min via kinetic impact strategy, respectively [12,13]. China has announced that it will conduct its first kinetic impact NEO defense demonstration mission in 2030 [14]. The impact target may be a 20–90 m rubble-pile asteroid [14]. Dimorphos is a small rubble-pile asteroid with a surface covered with boulders [12]. Rubble-pile asteroids may be the type of near-Earth object most likely to threaten Earth in a future collision event [15,16]. Rubble-pile asteroids are comprised primarily of boulders of a range of sizes, often covered with fine-grained regolith on the surface [17].
Boulders and regolith in rubble-pile asteroids affect the efficiency of cratering and momentum transfer [15,17,18,19]. is an important index to evaluate the deflection efficiency of kinetic impact deflecting the asteroids [20,21]:
where , , , is the momentum change in the asteroid after the impact, the mass of the impactor, the speed of the impactor deflecting the asteroid, and the ejecta momentum of escaping the asteroid, respectively. The is larger than the for the production of ejecta. Yasui et al. [22] conducted cratering experiments on glass beads with different size distributions and the crater radius increased with the increase in the size ratio of the projectile to the glass bead target. Ormö et al. [15] performed low-velocity impact on sand targets and experimental results show that the presence of projectile-size boulders will reduce the crater efficiency and reduce the value compared to a homogeneous target. Walker et al. [23] performed an impact experiment on a stone–cement target at 5.44 km·s−1, the value is close to the DART impact result. These experimental results are from small-scale impacts. The scale involved in impact deflecting the asteroid is far greater than that achieved in laboratory impact experiments. Based on iSALE software (www.isalecode.de, 26 July 2024), Nicole et al. [24] studied the effect of the internal porosity on the internal shock pressure distribution of rubble-pile asteroids. The iSALE shock physics code includes two-dimensional and three-dimensional versions [25], based on the arbitrary Lagrangian–Eulerian (ALE) method [21], and allows multiple materials and multiple rheologies [25,26]. The ALE method combines the advantages of the Lagrange and Euler methods and is widely used in numerical simulations of the asteroid-deflection-scale impact [25,26], and laboratory-scale impact [21,27,28]. The mass and velocity of ejected material are analyzed with the help of Lagrangian tracer particles that are initially distributed uniformly across the high-resolution domain [27]. The iSALE shock physics code was developed within the scientific community and is not fully open source and it can only be used with permission [25,26]. Kinetic energy impact deflection of asteroids involves the cratering process of hypervelocity and large deformation [29]. Compared with the mesh-based method, the smooth particle hydrodynamics (SPH) method can simulate the cratering problem of hypervelocity impact not only to avoid mesh distortion [30] but also to track the mass and velocity of the particles ejected during the cratering process [31]. The SPH method was integrated into commercial software like AUTODYN [31] or software developed by the scientific community, like Bern SPH [32] and adaptive SPH code [17]. Jiao et al. [33] based on the hybrid architecture numerical simulation method of SPH and discrete element method, studied the evolution of the DART impact on the Dimorphos asteroid and successfully reproduced the main observations of momentum transfer and ejecta. Raducan et al. [32] derived the physical properties of Dimorphos from the DART impact using the Bern SPH shock physics code. Grainger et al. [17] used adaptive SPH code to simulate hypervelocity impacts on rubble-pile structures in regolith-dominated impacts, which affects the efficiency of momentum transfer. Understanding the formation and ejection process of impact rubble-pile asteroids is helpful for us to understand microgravity [25] effects on ejecta, select impact locations and design impact deflection strategies [34]. However, the influence of boulder size and distribution in rubble-pile asteroids on the ejecta size–velocity is unclear.
The porous gypsum–basalt (GB) targets with smaller than projectile-size basalt pebbles embedded in a porous gypsum matrix were prepared to simulate rubble-pile asteroid surface regolith in Section 2. Impact experiments using Al2024 projectiles have been conducted on porous gypsum–basalt targets. The successive ejecta processes were observed by high-speed and ultra-high-speed cameras. The magnitude variation of and crater size with projectile velocity was presented. In Section 3, a finite element model with high similarity to the actual rubble-pile structure is established by using the P language algorithm to randomly generate different sizes of three-dimensional convex polyhedra. The SPH numerical simulation method in AUTODYN 16.0 software is used to analyze the effect of the size and distribution of boulders on the ejecta size velocity. Combining experimental and simulation results, the formation process of DRAT impacting Dimorphos ejecta is analyzed.
2. Experimental Materials and Methods
2.1. Projectile and Target Materials
The projectiles were Al2024 spheres, with a diameter of 6 mm, mass of 0.31 g, and density of 2.785 g·cm−3. Four different kinds of porosity homogeneous porous gypsum targets were used as an analog for asteroids. The commercial CaSO4 powder is about 7.5 μm. Basalt pebbles are irregular in size, ranging from 0.6 mm to 1 mm with a density of 2.876 ± 0.004 g·cm−3 (see Figure 1a). The size ratio of basalt pebbles to the projectile diameter changed from 0.1 to 0.17. Porous gypsum–basalt targets were prepared to simulate rubble-pile asteroid surface regolith. Porous gypsum–basalt targets were prepared: the mass ratio (basalt pebbles/anhydrite powder) = (0.8/0.2) was mechanically mixed evenly. Tap water was added, and mechanically stirred for 1 min to obtain the mixed slurry, and the mixed slurry was put into the cylindrical mold. The diameters of the three cylindrical molds are 150, 50, and 50 mm, respectively, and the heights of the three cylindrical molds are 150, 100, and 50 mm, respectively. After 10 min, the slurry is consolidated, and the mold is removed. The consolidated target was dried in an electricity heat drum wind drying oven at 95 °C for 24 h to complete the cementing and hardened and removed essentially all the non-bound water (see Figure 1b) and microscopic pores were formed inside the target. Figure 1c shows a scanning electron microscope (SEM) image of a gypsum–basalt fragment. The internal structure of porous gypsum–basalt is coherent aggregate, and the void space in GB is smaller than the size scale of the anhydrite powder, that is microporosity, similar to the micropores observed in chondrites [35,36]. The bulk density before and after drying of GB targets was determined by weighing samples and measuring their volume. The GB target bulk density before drying is 1.991 ± 0.024 g·cm−3. The GB target bulk density after drying is 1.502 ± 0.013 g·cm−3. The porous GB targets with a porosity of about 32.5% were created.

Figure 1.
Photographs and SEM of porous gypsum–basalt targets. (a) Anhydrite powder and basalt pebbles. (b) Photographs of targets. (c) SEM image of targets.
As shown in Figure 2, the compressive and tensile strength of the specimen were measured by uniaxial compression and Brazilian tests at a strain rate of 1 × 10⁻⁴ s−1. Three compressive and Brazilian tests were performed for each sample (Figure 3). The calculation formula of compressive strength σc is Equation (2).
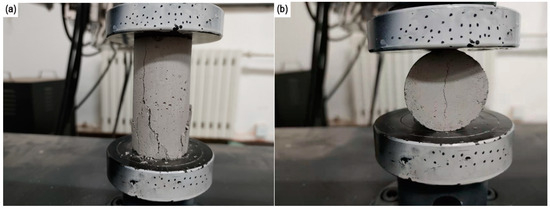
Figure 2.
Experimental devices for specimen compression. (a) Uniaxial compressive specimen with diameter and height 50 and 100 mm, respectively. (b) Brazilian test specimens with diameter and height are both 50 mm.
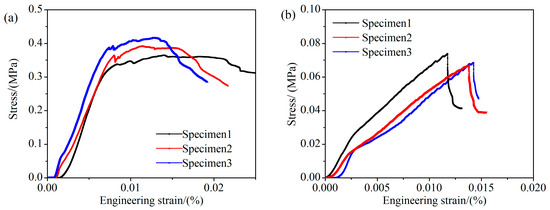
Figure 3.
Compressive engineering stress-strain curves of the GB at a strain rate of 1 × 10⁻⁴ s−1 at room temperature. (a) Uniaxial compressive; and (b) Brazilian test.
The tensile strength (MPa) is described as follows:
where F is the maximum compressive load during the measurement in N. d and h are the diameter and the height of the specimen in mm. The GB compressive and tensile strength are 0.392 ± 0.022 MPa and 0.066 ± 0.002 MPa, respectively.
2.2. Experiment Setup and Apparatuses
As shown in Figure 4, the two-stage light gas gun at the Beijing Institute of Spacecraft Environment Engineering (BISEE) was used to accelerate the 6 mm Al2024 sphere impact GB target. The sabot is separated by aerodynamic force with 10 kPa nitrogen and intercepted by a pre-perforated steel baffle in the target chamber. The Al2024 sphere impacts the GB target through the center hole of the steel baffle. The cylindrical GB target was suspended in the target chamber by two nylon ropes to form a ballistic pendulum to measure the target momentum change. The projectile speed was measured using a KIRANA 5M ultrahigh-speed camera (Specialised Imaging, Pitstone, UK) positioned outside the window of the target chamber. The resolution of the ultrahigh-speed camera was 924 × 768 pixels with one million frames/s. The pendulum maximum horizontal displacement and the motion process of the ejecta were recorded with an i-SPEED 7 high-speed camera (IX Cameras, Rochford, UK) at a frame rate of 40,000 frames/s. An LED and flash lamp are used to illuminate the target.

Figure 4.
Schematic figures of hypervelocity impact momentum transfer tests.
The i-SPEED 7 high-speed camera views of each shot were used to analyze the pendulum recoil motion. The high-speed camera image shows that the ballistic pendulum does not move in the shot without a projectile, indicating that the gas in the pump tube does not transfer significant momentum to the ballistic pendulum. The image scale of each shot is independently measured on 5 cm bars placed near the target within the camera field of view. As shown in Figure 5, according to the geometric relationship of the ballistic pendulum, the maximum swing angle and the rise height of the ballistic pendulum can be calculated by Equations (4) and (5).
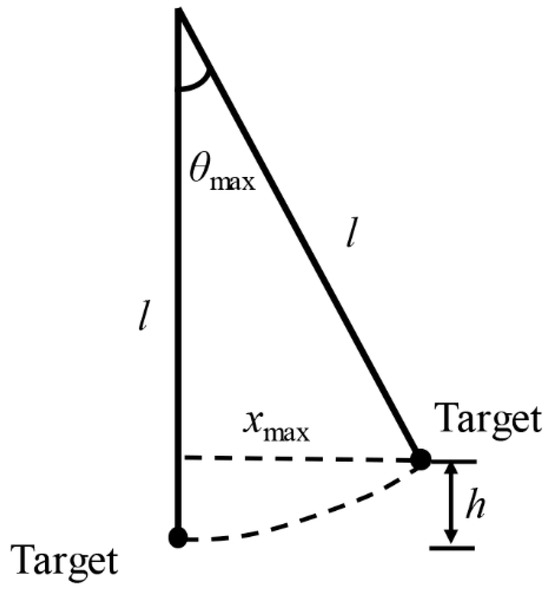
Figure 5.
Geometric diagram of ballistic pendulum motion.
From the conservation of energy, the velocity increment of the target is
Therefore,
where is the target mass after impact, is the projectile mass, is the impact speed, is gravitational acceleration, and is the length of the pendulum wire rope. The from each shot are presented in Table 1.

Table 1.
The impact conditions and calculated β values of each shot.
2.3. Experimental Results and Discussion
2.3.1. Crater Morphologies
As illustrated in Figure 6, porous GB target cratering results are the same under different velocities. A small central bowl-shaped crater is formed on the target and a large shallow spalling area surrounds the crater. The white dashed circles in Figure 6 are the boundary and transition between the bowl-shaped central crater and the shallow spalling area. For high-pore and low-strength GB materials, crater volume is in part due to the compaction of pore space, and partly due to the excavation of cratering flow. Spallation still dominates the results of craters, and the spalling increases the crater volume. As shown in Figure 7, the cavity is filled with silica gel, and the surface of the cavity is covered with a layer of plastic wrap for demolding after 24 h. As shown in Figure 7, we measured the crater area and the depth of the cavities for quantitative analysis. The is the depth of the deepest point from the pre-impact surface. The average diameter is , . As shown in Figure 8, the depth-to-diameter ratio of porous gypsum–basalt targets was measured to be around 0.5. The speed of test 1 is 2.1 km·s−1, which is lower than the sound speed of basalt 2.4 km·s−1 and belongs to high-speed collision. The velocity of tests 2–5 is greater than the sound velocity of basalt, which belongs to hypervelocity collision. The depth-to-diameter ratio of test 1 is smaller than that of tests 2–5. The depth-to-diameter ratio of impact rock targets is usually around 0.20 [31,37,38]. Compared with the impact chamber homogeneous rock target, the crater depth of the impact porous heterogeneous GB target is deeper, and the diameter is larger. You can find the the experimental parameters and cratering results in Table 2.
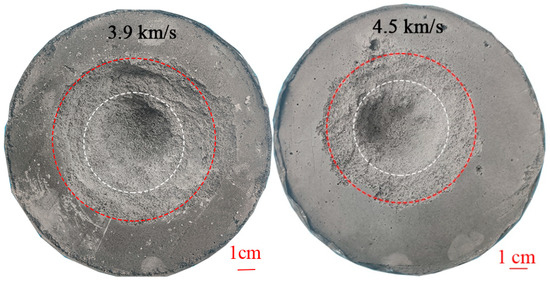
Figure 6.
Impact craters formed in GB at different velocities.
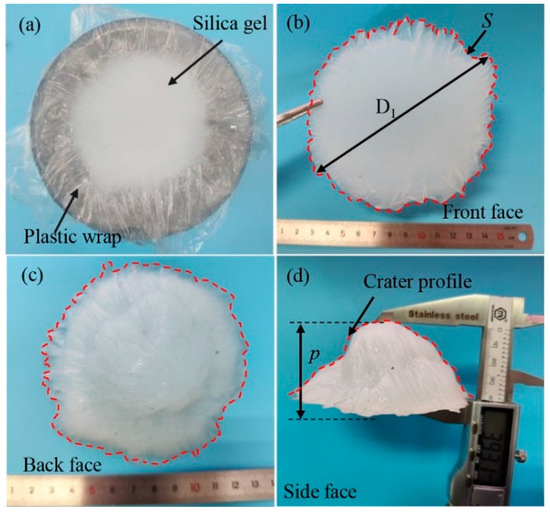
Figure 7.
Silicone mold and release after the crater. (a) Filling silica gel. (b) Front face. (c) Back face. (d) Side face.
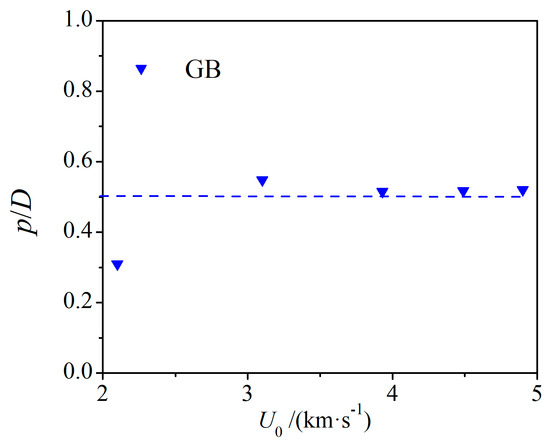
Figure 8.
p/D at different impact velocities.

Table 2.
The experimental parameters and cratering results.
2.3.2. Ejecta
As shown in Figure 9 and Figure 10, combined with the image of ejecta motion recorded by the KIRANA 5M ultra-high-speed camera (STFC, Wiltshire, UK) and the i-SPEED 7 high-speed camera, the formation of ejecta is divided into three successive stages. The ejection process and stages are consistent with DART impact ejecta spreading images taken by the Harper Space Telescope (HST) [39] and the Light Italian CubeSat (LICIACube) [40]. First, a high-speed jet is formed. There is fine dust inside the ejecta, which is caused by the vaporization of the projectile or target material caused by the hypervelocity impact. The jet duration is related to the projectile impact speed in theory [41]. The jet lasts for a short time (tens of μs) and is followed by an ejection composed of very fine particles. The fine particle ejecta cone is formed on the target surface with an angle is about 45°. The ejecta cone lasted about 1 ms. As shown in Figure 10, the bottom part of the ejected cone has an increasing inclination angle relative to the target surface and eventually transforms into a round tube. The ejecta is ejected directly backward and perpendicular to the surface of the target at a low speed. The tubular ejecta lasts a relatively long time (hundreds of ms), which can explain the HST image of DART impacting Dimorphos so that the lowest-speed ejecta dispersed through a sustained tail [39].
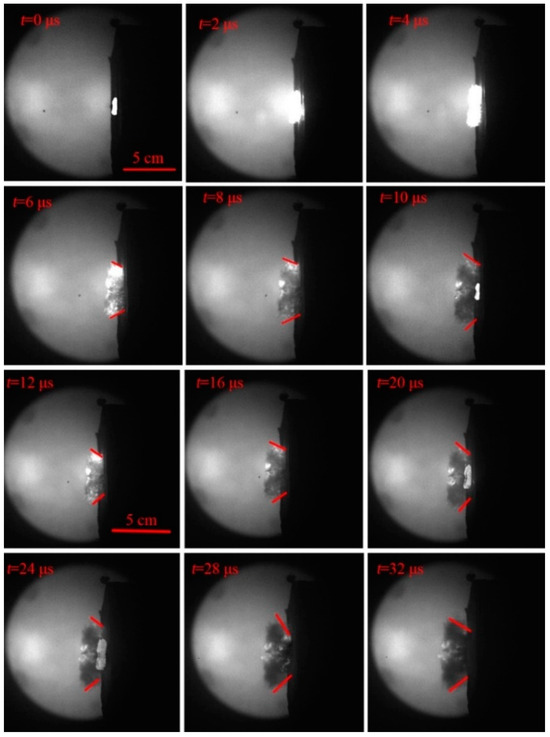
Figure 9.
Ejecta from Shot 10 by 6 mm projectile impacting on GB at 4.9 km·s−1. The projectile incidence direction is perpendicular to the surface of the target.
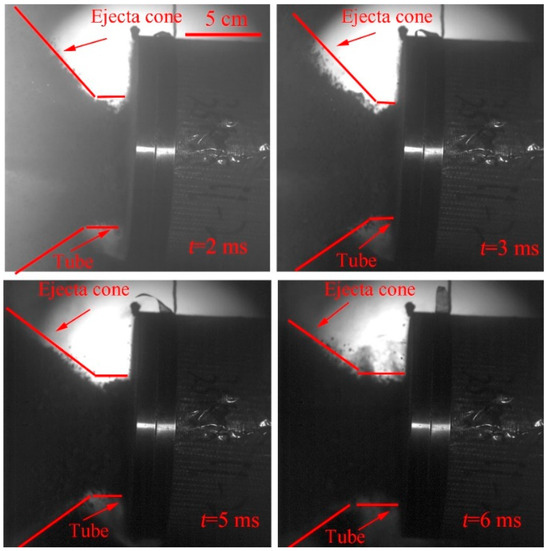
Figure 10.
Typical motion evolution progress of the ejecta by 6 mm projectile impacting on GB at 4.5 km·s−1.
It can be seen from Figure 11 that the ejecta produced by impacting the porous GB is composed of gypsum powder and basalt pebbles, and the gypsum powder attached to the surface of the basalt pebbles after ejecta (see Figure 11b). The size of the ejecta is in the millimeter to submicron. Basalt is 100 times stronger than gypsum [42]. Therefore, during the crushing process, the crushing crack mainly propagates in the low-strength gypsum matrix, and the expanding crack will stop or change direction when encountering the basalt pebbles. The boundary between the gypsum matrix and the basalt pebble is a surface conducive to crack formation.

Figure 11.
Collected ejection at Shot 4. (a) Photographs of ejecta; and (b) SEM image of ejecta.
2.3.3. Momentum Enhancement
Compared with the impact basalt target, the value of the impact GB target is lower at the same impact velocity. The uniaxial compressive strength of basalt is 145.5 MPa and the porosity is close to 0% [31]. The compressive strength of GB is 0.392 MPa and the porosity is about 32.5%. A large number of experimental and numerical simulation results show that the decreases with the increase in the porosity of the target and increases with the decrease in the strength of the target [27,43]. For porous GB, the inhibition effect of porosity on is greater than the enhancement effect of decreasing target strength. As is shown in Figure 12.
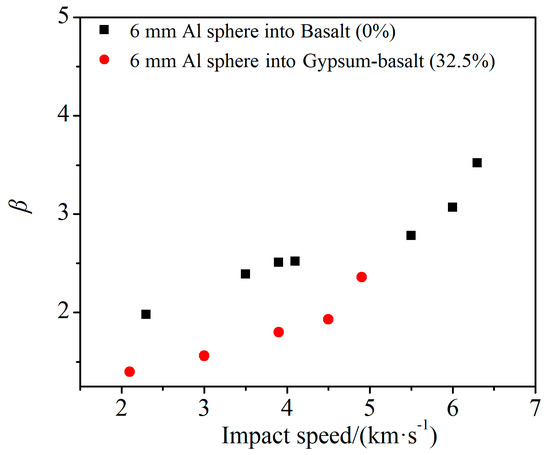
Figure 12.
Momentum enhancement vs. impact velocity for target with porosity. The 6 mm projectile into basalts from Liu et al. [31] and Gault et al. [44].
3. Numerical Model Set-Up
ANSYS AUTODYN 16.0 software was used to simulate the asteroid/comet hypervelocity impact on the Earth [45,46], asteroid-deflection-scale impact [47], and small-scale hypervelocity impact experiment [31,48]. AUTODYN software has been validated against laboratory small-scale impact into basalt and pumice [31] and other numerical software for cratering morphology, and impact pressure [29]. AUTODYN-2D software is used in two-dimensional axisymmetric geometric simulation to quantify the effect of target porosity on jet formation time and velocity at the laboratory scale. We used AUTODYN software to model in 3D DART scale impacts on the asteroid, simulating the different stages of ejecta formation and the influence of the size of the boulder inside the asteroid on crater size, and ejecta in three dimensions. Targets are modeled as half spaces in all simulations. The projectiles are made of Al2024 with a sphere shape and modeled with the Mie–Grüneisen equation of state (EOS) and Steinberg–Guinan strength model. In all simulations, the impact speed is consistent with the DART impact speed, at 6.15 km·s−1 [12].
3.1. Two-Dimensional FEM Model
As shown in Figure 13, 20 particles per unit radius (CPPR) are used for calculating the crater and ejecta. The model’s total calculation time is set to 1 ms. The projectile impact speed is along the y-axis. The center 9 cm × 9 cm of the target was modeled with smoothed particle hydrodynamics (SPH), and the finite element method (FEM) was used for modeling in other regions. The FEM-SPH coupled method [49] and 2D axisymmetric are used in the AUTODYN software to save computing cost and time. To simulate the formation process of the high-speed jet, 400 (CPPR) of the projectiles are taken to simulate the formation process of the jet [50]. The target was 6 mm thick and 12 mm wide. Because the jet can only form early in the collision, the model’s total calculation time is set to 5 μs.
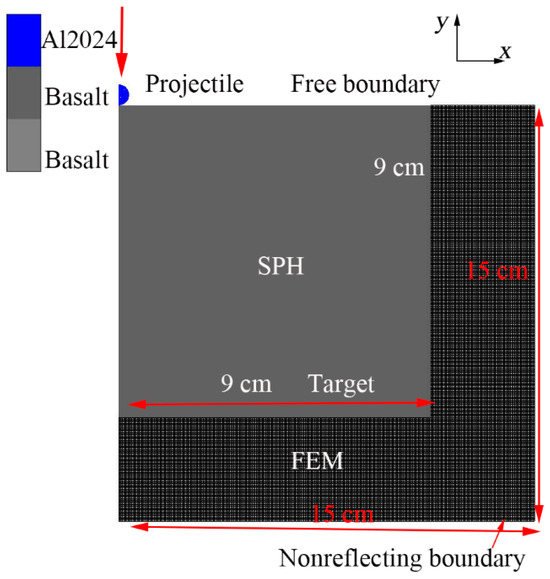
Figure 13.
Al2024 sphere projectile impact basalt in 2D axial symmetry model.
3.2. Three-Dimensional Rubble-Pile Asteroids FEM Model
Most of the boulders in the asteroid are convex polyhedra, their spatial positions are disordered, and they are separate from each other. The spaces between the boulders are filled by regolith. To accurately characterize the above characteristics, the P language algorithm was used to define the size and number of boulders, and the programmed subroutine was embedded in the ABAQUS 6.14-4 simulation software to generate three-dimensional random convex polyhedra [51] to simulate boulders in the rubble-pile asteroid. According to the diameter and number of boulders, a block area filled with boulders of different sizes is generated in the 6 m × 6 m × 6 m area (Figure 14). The boulder sizes are 0.18 m, 0.72 m, and 1.2 m, respectively.

Figure 14.
Random filling model of different size boulders: (a) 0.18 m; (b) 0.72 m; and (c) 1.2 m.
A geometric model of the regolith was established, and the grid was divided (Figure 15a). According to the center coordinates and radius of the boulder, the regolith mesh is projected to the block area (Figure 15b), and the excess mesh is deleted to obtain the finite element mesh of the boulder (Figure 15c). An FEM model composed of regolith and boulder is obtained by merging boulder and regolith grids and deleting the repeated meshes (Figure 15d).

Figure 15.
FEM of the boulder and regolith: (a) FEM of the regolith; (b) boulder area; (c) FEM of the boulder; and (d) FEM of the boulder and regolith.
The FEM model of the boulder and regolith part is introduced AUTODYN. The FEM element is transformed into SPH particles (Figure 16), and the SPH particle size is 0.06 m. The small deformation area is modeled by conventional FEM mesh. The FEM mesh size is doubled to 0.12 m. The size of the target is as follows: length 12 m, width 12 m, height 9 m. Basalt was used to simulate boulders in the block area. The regolith is made of porous basalt or pumice. The P-alpha model was used for porous to simulate microscopic pores in the regolith. The projectile is a sphere with a diameter of 0.72 m and a unit radius of 6 particles. Al2024 was used for the projectile. To increase computational efficiency and save computing costs, only one-quarter of the geometries were modeled. The transmitting boundaries are set at the bottom and sides of the target to simulate a semi-infinite target.
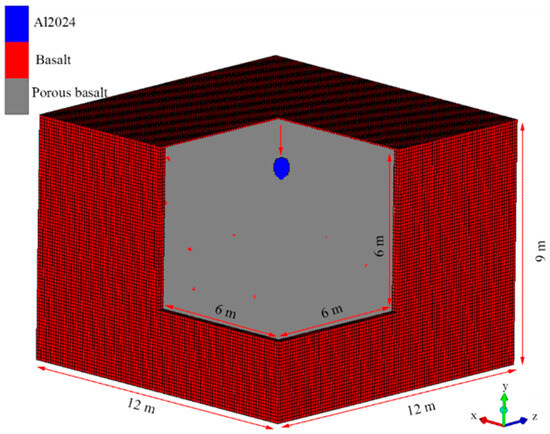
Figure 16.
Calculation model of 1/4 symmetry.
3.3. Material Parameters
3.3.1. P-alpha Model
The porosity P-alpha model can be used to characterize the porosity of materials in numerical simulation. The P-alpha model [52] divides the volume compression of porous materials into two parts: the compression of pores and the compression of the matrix [53].
The expansion parameter in the P-alpha model is defined as
where is the bulk density of the porous material, corresponds to the density of the solid matrix, and is the initial expansion parameter. Using this relationship, the expansion parameter can be converted to material porosity .
The general form of the EOS for porous materials can be obtained by using the expansion parameter .
where is pressure, is internal energy, is density.
Carroll and Holt [54] wrote the EOS of porous materials in display form:
where is the pressure at which all pores are compacted, and the expansion parameters correspond .
The expansion parameter is only a function of pressure .
where is the pressure at which a transition occurs between the elastic and plastic states of the material and the expansion parameters correspond to . is compaction exponent. The P-alpha model parameters of porous basalt and pumice are given in Table 3.

Table 3.
The P-alpha model parameters of porous basalt and pumice [55].
3.3.2. EOS Parameters
The empirical relationship between the shock wave speed and particle speed was linear over a wide range of pressures [56]
where is the shock wave speed, is particle speed, s is a material constant, and is the speed of sound.
Mie–Gruneisen EOS form based on the shock Hugoniot is:
where
and
where and is the initial density and the current density, respectively. and . and is pressure and internal energy along the Hugoniot curve, respectively. and is the pressure and internal energy of the compressed solid material, respectively. is Mie–Grüneisen constant. The Mie–Grüneisen EOS is used for Al2024, basalt, and pumice are given in Table 4.

Table 4.
Mie–Grüneisen EOS for different materials [57,58].
3.3.3. Strength Model
Drucker–Prager is the strength model for soil and rock [59]. The model introduces a linear relationship between yield strength and pressure.
where is yield strength, is the initial yield strength, is the pressure, and is the material coefficient of friction. The coefficient of friction of basalt and pumice is 0.6 [27]. The of basalt, porous basalt, and pumice is 145.5 MPa, 1 MPa, and 1 MPa, respectively. The maximum tensile pressure failure model to simulate tensile failure and the spallation. The A2024, basalt, porous basalt, and pumice failure tensile pressure are 2.5 GPa, 75 MPa, 0.5 MPa, and 0.5 MPa, respectively [55]. The Steinberg–Guinan strength model was used for Al2024. The parameters of the Steinberg–Guinan model are given in Table 5.

Table 5.
Al 2024 material parameters used in the Steinberg–Guinan model [60].
3.4. Simulation Results and Discussion
3.4.1. The Formation Process of Ejecta from AUTODYN-2D Simulations
The cratering process is accompanied by the production of ejecta. The first is the formation of a high-speed jet observed in experiments (Figure 17a). The jet velocity exceeds the projectile impact velocity. However the mass of this part of the jetting material only accounts for a few percent of the projectile mass, and the simulation of this part of the jetting formation process requires extremely high resolution [50], so the formation of jets is analyzed with high-resolution simulation in the next section. The downward hemispherical shock wave moves the target material. The shock wave intersects with the ground, generating a rarefaction wave, and then propagates downward into the target. Due to the action of rarefaction waves, the particles produce an upward ejection velocity. The excavation flow field is driven by the residual velocity, and the upward flowing material overcomes the material strength and is ejected outside the edge of the transient cavity to form the ejecta. Then, a fine-grained ejecta cone is formed on the surface of the target through shear excavation. When the rarefaction wave exceeds the tensile strength of the target material, the large spalling size fragments are ejected. The spalling fragments have a large mass and a low velocity and are ejected backward almost at 90° (Figure 17c).

Figure 17.
The ejection velocity (left column) and pressure (right column) distribution at different times of aluminum projectile impact on homogeneous basalt at 6.15 km·s−1: (a) 0.002 ms; (b) 0.02 ms; and (c) 0.2 ms.
3.4.2. Jet Formation from AUTODYN-2D Simulations
As shown in Figure 18 shows the velocity and pressure cloud map of the 6 mm Al sphere impacting targets with different porosity at 6.15 km·s−1. DART impact [61] results show that the velocity of the ejecta generated in the early stage is more than 10 km·s−1. In our numerical simulation, ejecta particles with velocities exceeding 10 km·s−1 also appear (Figure 18). The jet stage produces ejecta accompanied by bright luminous features on DART mages. The DART impact on the asteroid [62,63] and the Deep Impactor impact on Comet Tempel 1 [64] produced flashes in the early stages of the impact, and the early images taken by the observation spacecraft were covered by the flashes produced by the impact, affecting the observation of the ejecta produced in the early impact. Most of the material in the ejecta comes from the target material from numerical simulation. Hence, the impact flash intensity and spectral content are mainly functions of target materials [65]. The time of the initial formation of the jets in the basalt, porous basalt, and pumice targets is 0.11, 0.12, and 0.25 μs, respectively. The porosity of the pumice is 70%, and no ejecta particles are produced at speeds greater than 10 km·s−1. With the increase in the porosity of the target, the mass and velocity of the jet decrease. Compared with the size of the ejecta formed in the crater and spalling stages, the ejecta formed at this stage are particularly small in size.
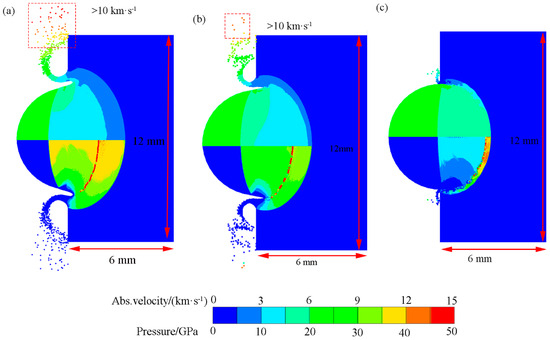
Figure 18.
Velocity (the upper part) and pressure (the lower part) cloud diagram aluminum sphere impact targets with different porosity at 6.15 km·s−1. (a) Basalt with 0% porosity. (b) Porous basalt with 30% porosity.(c) Pumice with 70% porosity.
3.4.3. Pressure and Velocity Distribution from AUTODYN-3D Simulations
Figure 19 shows the cloud maps of pressure and velocity distribution at different times of impact on homogeneous and porous heterogeneous targets. As shown in Figure 19, the process of cratering ejection by impacting a porous heterogeneous target is consistent with the process of cratering ejection by impacting a homogeneous target. However, different from the impact homogeneous target, there are boulders and regolith in the heterogeneous target, and the wave impedance difference between them is large, which will affect the propagation of shock waves and the distribution of ejecta. The pumice and porous basalt used the P-alpha model to simulate the microscopic pores. We set the porous basalt or pumice strength to be the same, with the EOS and porosity of the two materials being different. The porosity of the porous basalt is set to 30% while the pumice is 70%. The velocity of shock wave propagation in porous heterogeneous targets is lower than that in dense basalt. The porous regolith has lower wave impedance, the shock wave pressure is smaller, and the shock wave pressure attenuation is faster. The velocity of the ejecta generated by impacting the porous material is lower. The larger the difference in wave impedance between boulders and regolith, the more obvious this phenomenon is.
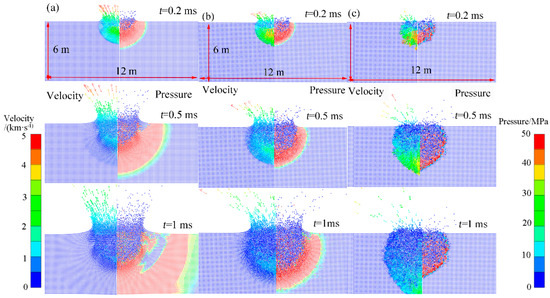
Figure 19.
Velocity (left column) and pressure (right column) cloud diagram (front view). (a) Homogeneous asteroid with basalt. (b) Rubble-pile asteroid with porous basalt regolith where the boulder size is 0.18 m. (c) Rubble-pile asteroid with pumice regolith where boulder size is 0.18 m.
To better observe the propagation of shock waves between boulders in C heterogeneous targets, we choose to hide the regolith SPH particles. In the contact compression and cratering stage, impact compression makes discrete boulders contact with each other, and the shock wave propagates rapidly along the boulder path, which can expand the influence range of the shock wave. The compression depends on the distribution of boulder size and the proportion of boulder volume. The smaller the boulder size and the larger the boulder volume fraction, the more it is to contact each other under the action of shock wave and cratering flow caused by the impact (see Figure 20).

Figure 20.
Pressure cloud diagram impact rubble-pile asteroid with porous basalt regolith containing different sizes of boulder. (Top view, t = 1 ms). (a) Boulder size is 0.18 m. (b) Boulder size is 0.72 m. (c) Boulder size is 1.2 m.
3.4.4. Influence of Boulder Size on Ejecta Size from AUTODYN-3D Simulations
Figure 21 shows the distribution of ejecta that impact a rubble-pile asteroid containing different sizes of boulders. Because the number of particles is too large to see the distribution of boulders in the ejecta, the regolith SPH particles are hidden and only the boulder SPH particles are given. The ejecta cone formed by the impact heterogeneous rubble-pile asteroid is asymmetrical, and the ejecta contains boulders. The boulders and regolith located within the range of the transient crater are highly fractured. Consistent with the DART impact results [61] and small-scale experiment results [15], boulders outside the direct impact range of the impactor can be ejected under the action of the crater flow without complete breaking (Figure 21a,b). Under the action of cratering flow, the fracture cracks mainly spread in the low-strength regolith. When the crack encounters the basalt block, the propagation crack will stop or change direction. The smaller the size and lower the mass of the block, the easier it is to leave the target in the action of cratering flow. When the size of the block is large enough, the crater flow is not enough to move the block, and the block will limit the crater expansion and reduce the crater formation efficiency [15] (see Figure 21c). When conducting near-Earth asteroid defense, it is necessary to consider the large boulders created by the impact to avoid posing a secondary threat.
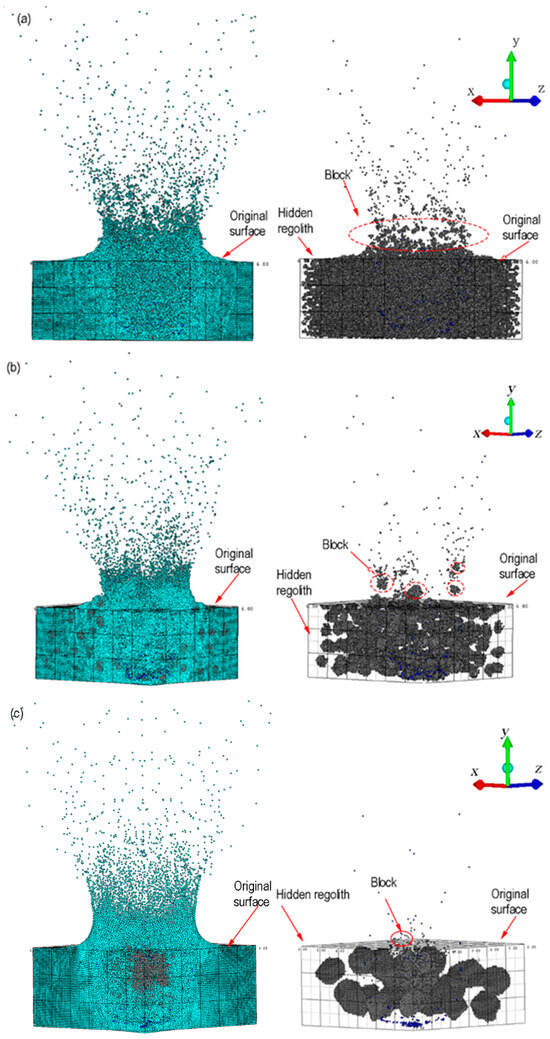
Figure 21.
The ejection distribution after impacting the rubble-pile asteroid with different size boulders at 0.01 s, light green is regolith particles, black is boulder particles. (a) Boulder size is 0.18 m. (b) Boulder size is 0.72 m. (c) Boulder size is 1.2 m.
4. Conclusions
To investigate the effects of boulder size on ejecta size and velocity, small-scale impact cratering experiments were performed on high-porosity gypsum–basalt targets at speeds of 2.3 to 5.5 km·s−1. Gypsum–basalt targets have some features of a rubble-pile, and the strength of the gypsum–basalt target is higher than the rubble-pile asteroid. Based on the experimental and 2D simulation results, the formation mechanism and characteristics of ejecta at different stages of DART impact are explained. The increase in the porosity of the target reduces the formation time and velocity of the jet. Impacting a homogeneous asteroid, the spalling mechanism can produce large boulders. The 3D numerical simulation results show that the boulder size of the rubble-pile asteroid affects the size of the ejecta. Both excavation flow and spallation ejection mechanisms can eject boulders away from rubble-pile asteroids. When conducting near-Earth asteroid defense, it is necessary to consider the large boulders created by the impact to avoid posing a secondary threat. These experimental and simulation results help us select potential impact sites in planetary defense scenarios and reduce deflection risk. In our future research, hypervelocity impact cratering experiments and numerical simulations will be conducted on rubble-pile asteroids with different boulder size distributions and volume ratios. The influence of boulder size distribution and volume ratios on momentum enhancement will be analyzed in more detail.
Author Contributions
Methodology, W.L. and R.L.; Software, W.L. and J.R.; Validation, J.L.; Formal analysis, R.L.; Investigation, S.R.; Resources, R.L.; Data curation, J.R., J.L., Q.W. and S.R.; Writing—original draft, W.L.; Writing—review & editing, Q.Z.; Supervision, Q.Z.; Project administration, Q.Z., Z.G. and Q.W.; Funding acquisition, Z.G. All authors have read and agreed to the published version of the manuscript.
Funding
This work was supported by the National Natural Science Foundation of China (62227901, 12202068).
Data Availability Statement
The original contributions presented in the study are included in the article, further inquiries can be directed to the corresponding author.
Conflicts of Interest
The authors declare no conflict of interest.
References
- Buys, M.; Squirini, R.M.; Wilson, C.M.; Gabriel, J.L.; Salehuddin, H.; Zimmerman, G.K.; Barbee, B.W. THEO & MUFN: Defending Earth against the 2023 PDC hypothetical asteroid impact. Acta Astronaut. 2024, 215, 217–233. [Google Scholar]
- Pelton, J.N.; Allahdadi, F. Handbook of Cosmic Hazards and Planetary Defense; Springer: London, UK, 2015; pp. 5–13. [Google Scholar]
- Board, S.S. Defending Planet Earth: Near-Earth-Object Surveys and Hazard Mitigation Strategies; The National Academies Press: Washington, DC, USA, 2010; pp. 1–134. [Google Scholar]
- Gallant, J.; Gladman, B.; Ćuk, M. Current bombardment of the Earth–Moon system: Emphasis on cratering asymmetries. Icarus 2009, 202, 371–382. [Google Scholar] [CrossRef]
- Kereszturi, Á.; Barta, V.; Bondár, I.; Czanik, C.; Igaz, A.; Mónus, P.; Rezes, D.; Szabados, L.; Pál, B.D. Review of synergic meteor observations: Linking the results from cameras, ionosondes, infrasound and seismic detectors. Mon. Not. R. Astron. Soc. 2021, 506, 3629–3640. [Google Scholar] [CrossRef]
- Brown, P.G.; Assink, J.D.; Astiz, L.; Blaauw, R.; Boslough, M.B.; Borovička, J.; Brachet, N.; Brown, D.; Campbell-Brown, M.; Ceranna, L.; et al. A 500-kiloton airburst over Chelyabinsk and an enhanced hazard from small impactors. Nature 2013, 503, 238–241. [Google Scholar] [CrossRef]
- Wang, K.D.; Zhou, Q.; Liu, Y.D.; Li, M.; Wang, Y. Research on space-based kinetic impactor disrupting small-sized asteroids under short warning time conditions. Acta Astronaut. 2024, 219, 291–299. [Google Scholar] [CrossRef]
- Bowles, N.E.; Snodgrass, C.; Gibbings, A.; Sanchez, J.P.; Arnold, J.A.; Eccleston, P.; Andert, T.; Probst, A.; Naletto, G.; Vandaele, A.C. CASTAway: An asteroid main belt tour and survey. Adv. Space Res. 2018, 62, 1998–2025. [Google Scholar] [CrossRef]
- Lay, O.; Masiero, J.; Grav, T.; Mainzer, A.; Masci, F.; Wright, E. Asteroid impact hazard warning from the Near-Earth Object surveyor mission. Planet. Sci. J. 2024, 5, 149. [Google Scholar] [CrossRef]
- Schmidt, N. Planetary defense governance: Thirty years of development and the multilateral future. Acta Astronaut. 2024, 214, 343–355. [Google Scholar] [CrossRef]
- Barbee, B.W.; Syal, M.B.; Dearborn, D.; Gisler, G.; Greenaugh, K.; Howley, K.M.; Leung, R.; Lyzhoft, J.; Miller, P.L.; Nuth, J.A.; et al. Options and uncertainties in planetary defense: Mission planning and vehicle design for flexible response. Acta Astronaut. 2018, 143, 37–61. [Google Scholar] [CrossRef]
- Daly, R.T.; Ernst, C.M.; Barnouin, O.S.; Chabot, N.L.; Rivkin, A.S.; Cheng, A.F.; Adams, E.Y.; Agrusa, H.F.; Abel, E.D.; Alford, A.L.; et al. Successful kinetic impact into an asteroid for planetary defense. Nature 2023, 616, 443–447. [Google Scholar] [CrossRef]
- Thomas, C.A.; Naidu, S.P.; Scheirich, P.; Moskovitz, N.A.; Pravec, P.; Chesley, S.R.; Rivkin, A.S.; Osip, D.J.; Lister, T.A.; Benner, L.A.; et al. Orbital period change of dimorphos due to the DART Kinetic Impact. Nature 2023, 616, 448–451. [Google Scholar] [CrossRef]
- Wang, K.D.; Li, M.T.; Zhou, Q.; Wang, Y. Targets selection and mission optimization of kinetic impact deflection test mission for small size asteroids. Adv. Space Res. 2023, 72, 3477–3498. [Google Scholar] [CrossRef]
- Ormö, J.; Raducan, S.D.; Jutzi, M.; Herreros, M.I.; Luther, R.; Collins, G.S.; Wünnemann, K.; Mora-Rueda, M.; Hamann, C. Boulder exhumation and segregation by impacts on rubble-pile asteroids. Earth Planet. Sci. Lett. 2022, 594, 117713. [Google Scholar] [CrossRef]
- Popova, O.; Borovcka, J.; Hartmann, W.K.; Spurný, P.; Gnos, E.; Nemtchinov, I.; Trigo-Rodríguez, J.M. Very low strengths of interplanetary meteoroids and small asteroids. Meteorit. Planet. Sci. 2011, 46, 1525–1550. [Google Scholar] [CrossRef]
- Graninger, D.; Stickle, A.; Owen, J.M.; Syal, M. Simulating hypervelocity impacts into rubble pile structures for planetary defense. Int. J. Impact Eng. 2023, 180, 104670. [Google Scholar] [CrossRef]
- Tatsumi, E.; Sugita, S. Cratering efficiency on coarse-grain targets: Implications for the dynamical evolution of asteroid 25143 Itokawa. Icarus 2018, 300, 227–248. [Google Scholar] [CrossRef]
- Leliwa-Kopystynski, J.; Arakawa, M. Impacts experiments onto heterogeneous targets simulating impact breccia: Implications for impact strength of asteroids and formation of the asteroid families. Icarus 2014, 235, 147–155. [Google Scholar] [CrossRef]
- Rainey ES, G.; Stickle, A.M.; Cheng, A.F.; Rivkin, A.S.; Chabot, N.L.; Barnouin, O.S.; Ernst, C.M. AIDA/DART Impact Simulation Working Group Impact modeling for the Double Asteroid Redirection Test (DART) mission. Int. J. Impact Eng. 2020, 142, 103528. [Google Scholar] [CrossRef]
- Stickle, A.M.; Syal, M.B.; Cheng, A.F.; Collins, G.S.; Davison, T.M.; Gisler, G.; Güldemeister, N.; Heberling, T.; Luther, R.; Michel, P.; et al. Benchmarking impact hydrocodes in the strength regime: Implications for modeling deflection by a kinetic impactor. Icarus 2020, 338, 113446. [Google Scholar] [CrossRef]
- Yasui, M.; Arakawa, M.; Okawa, H.; Hasegawa, S. Cratering experiments on granular targets with a variety of particle sizes: Implications for craters on rubble-pile asteroids. J. Geophys. Res. Planets 2022, 127, 1–15. [Google Scholar] [CrossRef]
- Walker, J.D.; Chocron, S.; Grosch, D.J.; Marchi, S.; Alexander, A.M. Momentum enhancement from a 3 cm diameter aluminum sphere striking a small boulder assembly at 5.4 km s−1. Planet. Sci. J. 2022, 3, 215. [Google Scholar] [CrossRef]
- Güldemeister, N.; Moreau, J.; Kohout, T.; Luther, R.; Wünnemann, K. Insight into the distribution of high-pressure shock metamorphism in Rubble-pile asteroids. Planet. Sci. J. 2022, 3, 198. [Google Scholar] [CrossRef]
- Raducan, S.D.; Davison, T.M.; Collins, G.S. Ejecta distribution and momentum transfer from oblique impacts on asteroid surfaces. Icarus 2022, 374, 114793. [Google Scholar] [CrossRef]
- Raducan, S.D.; Jutzi, M.; Davison, T.M.; DeCoster, M.E.; Graninger, D.M.; Owen, J.M.; Stickle, A.M.; Collins, G.S. Influence of the projectile geometry on the momentum transfer from a kinetic impactor and implications for the DART mission. Int. J. Impact Eng. 2022, 162, 104147. [Google Scholar] [CrossRef]
- Raducan, S.D.; Davison, T.M.; Luther, R.; Collins, G.S. The role of asteroid strength, porosity and internal friction in impact momentum transfer. Icarus 2019, 329, 282–295. [Google Scholar] [CrossRef]
- Luther, R.; Zhu, M.; Collins, G.; Wünnemann, K. Effect of target properties and impact velocity on ejection dynamics and ejecta deposition. Planet. Space Sci. 2018, 53, 1705–1732. [Google Scholar] [CrossRef]
- Pierazzo, E.; Artemieva, N.; Asphaug, E.; Baldwin, E.C.; Cazamias, J.; Coker, R.; Collins, G.S.; Crawford, D.A.; Davison, T.; Elbeshausen, D.; et al. Validation of numerical codes for impact and explosion cratering: Impacts on strengthless and metal targets. Meteorit. Planet. Sci. 2008, 43, 1917–1938. [Google Scholar] [CrossRef]
- Libersky, L.D.; Petschek, A.G.; Carney, T.C.; Hipp, J.R.; Allahdadi, F.A. High Strain Lagrangian Hydrodynamics: A Three-Dimensional SPH Code for Dynamic Material Response. J. Comput. Phys. 1993, 109, 67–75. [Google Scholar] [CrossRef]
- Liu, W.; Zhang, Q.; Long, R.; Gong, Z.; Jiankang, R.; Hu, X.; Ren, S.; Wu, Q.; Song, G. Effects of projectile parameters on the momentum transfer and projectile melting during hypervelocity impact. Def. Technol. 2024, 32, 89–103. [Google Scholar] [CrossRef]
- Raducan, S.D.; Jutzi, M.; Cheng, A.F.; Zhang, Y.; Barnouin, O.; Collins, G.S.; Daly, R.T.; Davison, T.M.; Ernst, C.M.; Farnham, T.L.; et al. Physical properties of asteroid Dimorphos as derived from the DART impact. Nat. Astron. 2024, 8, 445–455. [Google Scholar] [CrossRef]
- Jiao, Y.; Yan, X.; Cheng, B.; Baoyin, H. SPH–DEM modelling of hypervelocity impacts on rubble-pile asteroids. Mon. Not. R. Astron. Soc. 2024, 527, 10348–10357. [Google Scholar] [CrossRef]
- Kereszturi, A. Surface processes in microgravity for landing and sampling site selection of asteroid missions—Suggestions for MarcoPolo-R. Planet. Space Sci. 2014, 101, 65–76. [Google Scholar] [CrossRef]
- Fujii, Y.; Nakamura, A.M. Compaction and fragmentation of porous gypsum targets from low-velocity impacts. Icarus 2009, 201, 795–801. [Google Scholar] [CrossRef]
- Nakamura, A.M.; Hiraoka, K.; Yamashita, Y.; Machii, N. Collisional disruption experiments of porous targets. Planet. Space Sci. 2009, 57, 111–118. [Google Scholar] [CrossRef][Green Version]
- Spray, J.G.; Gores PA, S.; Kenkmann, T.; Poelchau, M.H. Experimental hypervelocity impact of sedimentary and metamorphic rocks: Reconstruction of crater shapes and volumes. Int. J. Impact Eng. 2024, 190, 104965. [Google Scholar] [CrossRef]
- Kenkmann, T.; Deutsch, A.; Thoma, K.; Ebert, M.; Poelchau, M.H.; Buhl, E.; Carl, E.R.; Danilewsky, A.N.; Dresen, G.; Dufresne, A.; et al. Experimental impact cratering: A summary of the major results of the MEMIN research unit. Meteorit. Planet. Sci. 2018, 53, 1543–1568. [Google Scholar] [CrossRef]
- Li, J.; Hirabayashi, M.; Farnham, T.L.; Sunshine, J.M.; Knight, M.M.; Tancredi, G.; Moreno, F.; Murphy, B.; Opitom, C.; Chesley, S.; et al. Ejecta from the DART-produced active asteroid Dimorphos. Nature 2023, 616, 452–456. [Google Scholar] [CrossRef]
- Rivkin, A.S.; Cheng, A.F. Planetary defense with the Double Asteroid Redirection Test (DART) mission and prospects. Nat. Commun. 2023, 14, 1003. [Google Scholar] [CrossRef]
- Melosh, H.J. Impact Cratering: A Geologic Process; Oxford University Press: New York, NY, USA, 1989; pp. 1–240. [Google Scholar]
- Yasui, M.; Arakawa, M. Impact experiments of porous gypsum-glass bead mixtures simulating parent bodies of ordinary chondrites: Implications for re-accumulation processes related to rubble-pile formation. Icarus 2011, 214, 754–765. [Google Scholar] [CrossRef]
- Flynn, G.J.; Durda, D.D.; Molesky, M.J.; May, B.A.; Congram, S.N.; Loftus, C.L.; Reagan, J.R.; Strait, M.M.; Macke, R.J. Momentum transfer in hypervelocity cratering of meteorites and meteorite analogs: Implications for orbital evolution and kinetic impact deflection of asteroids. Int. J. Impact Eng. 2020, 136, 103437. [Google Scholar] [CrossRef]
- Gault, D.E.; Shoemaker, M.E.; Moore, H.J. Spray Ejected from the Lunar Surface by Meteoroid Impact; National Aeronautics and Space Administration: Washington, DC, USA, 1963. [Google Scholar]
- Saito, T.; Kaiho, K.; Abe, A.; Katayama, M.; Takayama, K. Hypervelocity impact of asteroid/comet on the oceanic crust of the earth. Int. J. Impact Eng. 2008, 35, 1770–1777. [Google Scholar] [CrossRef]
- Saito, T.; Kaiho, K.; Abe, A.; Katayama, M.; Takayama, K. Numerical simulations of hypervelocity impact of asteroid/comet on the Earth. Int. J. Impact Eng. 2006, 33, 713–722. [Google Scholar] [CrossRef]
- Wakatsuki, Y.; Akahoshi, Y.; Koura, T.; Takahara, H. Study of the effects of projectile strength and density in the asteroid deflection by hypervelocity impact. Int. J. Impact Eng. 2023, 180, 104710. [Google Scholar] [CrossRef]
- Wen, K.; Chen, X. Failure evolution in hypervelocity impact of Al spheres onto thin Al plates. Int. J. Impact Eng. 2021, 147, 103727. [Google Scholar] [CrossRef]
- Wang, Z.L.; Huang, Y.P.; Li, S.Y.; Xiong, F. SPH-FEM coupling simulation of rock blast damage based on the determination and optimization of the RHT model parameters. IOP conference series. Earth Environ. Sci. 2020, 570, 42035. [Google Scholar]
- Johnson, B.C.; Bowling, T.J.; Melosh, H.J. Jetting during vertical impacts of spherical projectiles. Icarus 2014, 238, 13–22. [Google Scholar] [CrossRef]
- Fang, Q.; Zhang, J. 3D numerical modeling of projectile penetration into rock-rubble overlays accounting for random distribution of rock-rubble. Int. J. Impact Eng. 2014, 63, 118–128. [Google Scholar] [CrossRef]
- Herrmann, W. Constitutive equation for the dynamic compaction of ductile porous materials. J. Appl. Phys. 1969, 40, 2490–2499. [Google Scholar] [CrossRef]
- Jutzi, M.; Benz, W.; Michel, P. Numerical simulations of impacts involving porous bodies I. Implementing sub-resolution porosity in a 3D SPH hydrocode. Icarus 2008, 198, 242–255. [Google Scholar] [CrossRef]
- Carroll, M.M.; Holt, A.C. Suggested modification of the P–α model for porous materials. J. Appl. Phys. 1972, 43, 759–761. [Google Scholar] [CrossRef]
- Jutzi, M.; Michel, P.; Hiraoka, K.; Nakamura, A.M.; Benz, W. Numerical simulations of impacts involving porous bodies II. Comparison with laboratory experiments. Icarus 2009, 201, 802–813. [Google Scholar] [CrossRef]
- Arthur, L.R. Linear shock-velocity-particle-velocity relationship. J. Appl. Phys. 1967, 38, 4976–4980. [Google Scholar]
- Ahrens, T.J.; Johnson, M.L. Shock Wave Data for Rocks; American Geophysical Union: Washington, DC, USA, 1995; p. 35. [Google Scholar]
- Stanley, P.M. LASL Shock Hugoniot Data; University of California Press: Berkley, CA, USA, 1980; pp. 1–653. [Google Scholar]
- Holsapple, K.A. On the “strength” of the small bodies of the solar system: A review of strength theories and their implementation for analyses of impact disruptions. Planet. Space Sci. 2009, 57, 127–141. [Google Scholar] [CrossRef]
- Steinberg, D.J.; Cochran, S.G.; Guinan, M.W. A constitutive model for metals applicable at high-strain rate. J. Appl. Phys. 1980, 51, 1498–1504. [Google Scholar] [CrossRef]
- Dotto, E.; Zinzi, A. Impact observations of asteroid Dimorphos via Light Italian CubeSat for imaging of asteroids (LICIACube). Nat. Commun. 2023, 14, 3055. [Google Scholar] [CrossRef] [PubMed]
- Graykowski, A.; Lambert, R.A.; Marchis, F.; Cazeneuve, D.; Dalba, P.A.; Esposito, T.M.; O’Conner Peluso, D.; Sgro, L.A.; Blaclard, G.; Borot, A.; et al. Light curves and colors of the ejecta from dimorphos after the DART impact. Nature 2023, 616, 461–464. [Google Scholar] [CrossRef] [PubMed]
- Cheng, A.F.; Agrusa, H.F.; Barbee, B.W.; Meyer, A.J.; Farnham, T.L.; Raducan, S.D.; Richardson, D.C.; Dotto, E.; Zinzi, A.; Della Corte, V.; et al. Momentum transfer from the DART mission kinetic impact on asteroid dimorphos. Nature 2023, 616, 457–460. [Google Scholar] [CrossRef] [PubMed]
- A’Hearn, M.F.; Belton, M.; Delamere, W.A.; Kissel, J.; Klaasen, K.; McFadden, L.A.; Meech, K.J.; Melosh, H.J.; Schultz, P.H.; Sunshine, J.M.; et al. Deep impact: Excavating Comet Tempel 1. Science 2005, 310, 258–264. [Google Scholar] [CrossRef]
- Walsh, J.M.; Shreffler, R.G.; Willig, F.J. Limiting conditions for jet formation in high velocity collisions. J. Appl. Phys. 1953, 24, 349–359. [Google Scholar] [CrossRef]
Disclaimer/Publisher’s Note: The statements, opinions and data contained in all publications are solely those of the individual author(s) and contributor(s) and not of MDPI and/or the editor(s). MDPI and/or the editor(s) disclaim responsibility for any injury to people or property resulting from any ideas, methods, instructions or products referred to in the content. |
© 2024 by the authors. Licensee MDPI, Basel, Switzerland. This article is an open access article distributed under the terms and conditions of the Creative Commons Attribution (CC BY) license (https://creativecommons.org/licenses/by/4.0/).