Abstract
Aircraft sequencing has the potential to decrease flight delays and improve operational efficiency at airports. This paper presents the aircraft sequencing problem (ASP) on multiple runways with complex interactions by allocating flights on runways and optimizing landing times, take-off times, and crossing times simultaneously in a uniform framework. The problem was formulated as a mixed-integer program considering realistic operational constraints, including runway assignment preferences based on the entry/exit fixes of the terminal maneuvering area (TMA), minimum runway separation, time window, and arrival crossing rules. Variable-fixing strategies were applied, to strengthen the formulation. A first-come-first-served (FCFS) heuristic was proposed for comparison. Various instances from the literature and from realistic data sets were tested. Our computational study showed that the solution approach optimizes runway schedules, to achieve significantly fewer flight delays, taking runway assignment preferences and arrival crossings into account.
1. Introduction
With the expected rapid growth in air traffic, major airports have become capacity-constrained, which has resulted in excessive flight delays. Flight delays happen for various reasons, such as aircraft rotation, air traffic control restriction, etc. [1,2], and, consequently, they have an impact on sustainability, for example, fuel consumption and greenhouse gas emission [3,4]. The runway is seen as the bottleneck of the airport. The efficient planning and management of runway operations is crucial to increasing traffic throughput and reducing flight delays while preserving safety.
The aircraft sequencing problem (ASP) [5] aims to schedule runway usage times for arrivals and departures while ensuring operational constraints. Aircraft are divided into three wake turbulence categories (i.e., Heavy, Medium, or Light) [6] based on the maximum certificated take-off mass. Separation norm modifications are also initiated and assessed by classifying aircraft into six categories, termed RECAT (wake turbulence re-categorization), to increase airport capacity [7,8]. Minimum runway separation must be respected, due to the wake vortex generated by the leading aircraft. The separation depends on the categories of leading and following aircraft. In addition, each aircraft is associated with a time window defined by the earliest and the latest times to use the runway, based on the slot management of airports, aircraft-related characteristics, such as speed and fuel considerations, and controller actions. In practice, controllers sequence the flights in a first-come-first-served (FCFS) order for the purpose of equity and simplicity, but this is not the optimal solution, in terms of increasing runway throughput and minimizing flight delays. A number of decision support tools are available to assist controllers, including arrival manager (AMAN) and departure manager (DMAN) [9,10]. The basic single-runway ASP consists of sequencing and scheduling flights to minimize flight delays with regard to the minimum wake turbulence separation and time window constraints.
Previous research has considered the single-runway [11,12,13] ASP and the multiple-runway [14,15,16,17] ASP. The problem can be further divided into the aircraft landing problem (ALP) [11,12,13,14,18,19,20,21,22] and the aircraft take-off problem (ATP) [23,24,25,26]. In addition to the aforementioned time window and minimum wake turbulence separation requirements, which are two common constraints in both the ALP and the ATP, other operational aspects are taken into account in the literature: constrained position shift (to prevent large deviations of position from an FCFS order) [27], holding patterns [28] for the ALP, runway crossings [29] for the ATP, winter operations [30], point merge [31] for the ALP, departure metering [32] for the ATP, etc. The most commonly used objective function is to minimize deviations from target times [26,30,33,34]. Other objectives include maximizing runway throughput [35], minimizing makespan [12], fuel savings [18], etc. Gupta et al. [24] observed that minimizing flight delays provides benefits in throughput, whereas maximizing throughput may result in large flight delays. A comprehensive literature review of the ASP can be found in [5,10].
Solution approaches can be grouped into exact and stochastic methods. Mixed-integer linear programming (MILP) and dynamic programming (DP) are mainly used for exact methods. Beasley et al. [14] proposed a time-continuous MILP model for the single- and multiple-runway ASP. This formulation is the most cited for the MILP approach and is adapted and enhanced in the literature [12,19,30,33]. Furini et al. [33] presented a second MILP formulation, for which the main difference was the definition of decision variables by modeling the position of the aircraft in the sequence. Their results showed that the time-continuous model of Beasley et al. [14] outperformed the position-based model of Furini et al. [33]. Malik et al. [25] presented a MILP planner for the ATP, considering runway crossings and the specific layout of Charlotte airport. As for the DP approach, Balakrishnan and Chandran [36] presented DP algorithms by taking into account various operational constraints. Bennell et al. [11] proposed a multi-objective DP approach considering different stakeholders. The resolution of DP for multiple-runway cases needs additional restrictions to reduce the search space. MILP appears to be more flexible in incorporating operational constraints [10]. Among stochastic methods, tabu search [33], simulated annealing [26,37], greedy algorithms [16], and hybrid meta-heuristics [20] have been used in the literature. Recent work has proposed machine learning techniques for aircraft landing scheduling problems [22]. Heuristics and metaheuristics with reasonable local-search design provide high-quality solutions in short computation times.
While various approaches have been proposed to allocating a runway and a time slot to each aircraft for the ASP, there are still some operational constraints that need to be modeled. One operational factor that is rarely considered in the literature for the ASP is the TMA entry/exit fixes that flights use when allocating runways to flights. Another aspect worth mentioning is the arrival crossing problem. For a typical layout of parallel runways at busy airports, crossing decisions need to be made in a very short time after landings, due to the high traffic demand of arrivals and the restrictions imposed by the layout of the flight holding area before crossing. In the previous works [25,26,29] that have incorporated arrival crossings in the departure sequencing problem, landing times for arrivals were given as input data and could not be changed. Our previous work [26] focused on the single-runway ATP incorporating crossings. This work addresses the multiple-runway case by investigating the effect of optimizing simultaneously the ALP and the ATP with runway assignment preference, considering arrival crossings, which could bring more potential benefits, since the runway crossing time is closely related to the optimization of landing sequences.
With these motivations in mind, the main contribution of this research is to model the complex interactions of runway operations—including runway assignment and aircraft sequencing and scheduling for landings, take-offs, and arrival crossings—simultaneously in a uniform framework, taking into account the runway allocation preferences. These operational factors are modeled either by constraints or via objective functions in an MILP model, to obtain optimal solutions. The integration of scheduling and air traffic control, considering runway assignment preferences and the impact of crossings in the multiple-runway ASP, would be helpful for decision making at big airports during high-density periods, in practice. Our proposed methodology shows significant benefits in runway balancing and flight delay reductions in reasonable computation times.
The remainder of this paper is organized as follows: Section 2 gives the problem explanation. In Section 3, we present an MILP formulation for the ASP in a multiple-runway case with active crossings, and then we explain the techniques to enhance the MILP model. Section 4 describes an FCFS heuristic algorithm and compares it with the optimized results, using a random instance. In Section 5, our detailed computational results with various traffic scenarios are presented and discussed. Section 6 summarizes this work and suggests future extensions.
2. Problem Explanation
The runway assignment problem consists of deciding the landing/take-off runways for each aircraft with respect to the operation mode (segregated or mixed runway) and runway capacity. Figure 1 illustrates the flight operations in the TMA with a runway configuration of four parallel runways. In the operational context, arrival flights transfer from the en-route phase and start descending to enter the TMA. Flights from different TMA entry points are merged and sequenced to land on the runway. For departures, after pushback and taxi to the take-off runway threshold, flights wait for clearance from controllers, take off, and climb, following the standard departure routes until the TMA exit points. In this paper, while considering the classic ASP, we would like to address two important operational factors, as indicated in red in Figure 1. First, runway crossings: in big airports with parallel runways the outer runways are used for landings and the inner runways are used for take-offs. It is mandatory for arrivals to cross the take-off runway to reach the terminals after landing. Second, flight interactions in the TMA: considering the TMA entry/exit points of flights, a flight coming from the north might land on the southern runway, which could result in trajectory interactions with a flight coming from the south and using the northern runway. This issue should be taken into account when allocating flights to runways.
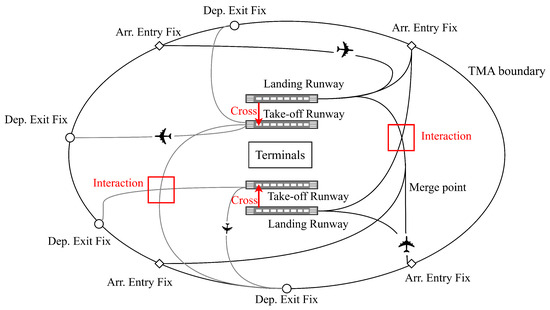
Figure 1.
General description of arrival/departure operations with parallel runways in the TMA.
Let us take the example of Paris Charles de Gaulle (CDG) airport and its TMA structure, as shown in Figure 2. The waypoints of the arrival/departure routes were derived from the Aeronautical Information Publication [38]. CDG has four parallel runways. In this paper, the west-flow (26L,27R|26R,27L) configuration is considered: 26L and 27R are for landings; 26R and 27L are for take-offs. Flights landing on runway 27R (26L) need to cross runway 27L (26R) to reach the terminals, respectively. Table 1 shows the runway assignment preference based on the TMA entry points at CDG. The entry points MOPAR and LORNI are located to the north. According to airspace surveillance data from CDG, one can observe that 76% of flights on a typical day from these two entry points land on runway 27R, which is the runway in the northern area. Similar preference can be observed for the southern entry points, OKIPA, BANOX, and runway 26L. For take-off runways and their TMA exit points, as indicated in Table 2, 78% of the flights directing to northern exit points to leave the TMA use northern take-off runway 27L. Likewise, 72% percent of flights take off on runway 26R and leave the TMA via exit fixes BEKOS, DOPAP, and RBT. This is a key operational preference for runway assignment, since this type of allocation can reduce the interactions among flights in the TMA, thus reducing controller workload. The preference of runway assignment considering the TMA entry/exit points is taken into account in this work. CDG operates under two broad runway configurations: west-flow and east-flow. The west-flow configuration is more frequently used (75% of operations according to [39]). In this paper, the runway configuration remains the same throughout the day.
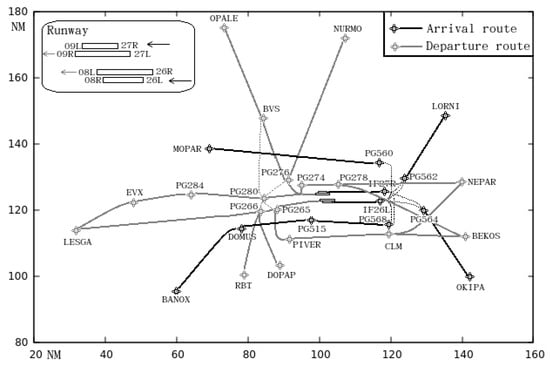
Figure 2.
Arrival/departure route network in the TMA at CDG in west configuration in [40].

Table 1.
Percentage of flights landing on 27R/26L using the northern and the southern TMA entry points at CDG for a typical day.

Table 2.
Percentage of flights taking off on 27L/26R using the northern and the southern TMA exit points at CDG for a typical day.
3. Optimization Model
This section describes the mathematical formulation for the ASP problem. In [10], three MILP models from the literature [14,20,33] were compared. Based on the tests on different benchmarks, our mathematical formulation was built upon the MILP model in Beasley et al. [14]. It has been adapted to consider also runway crossings and the preference for runway assignments.
Notations The sets and parameters are defined in Table 3. Given sets of flights and runways for landings or take-offs, each flight i has a given time window for take-off or landing. Flights are assumed to use the runway at the scheduled times. The maximum landing delay , the maximum take-off delay , and the maximum holding time before crossing are defined. The aircraft characteristics, such as runway occupancy time and wake turbulence category, are also specified. The minimum wake turbulence separation for two arrivals and for two departures is presented in Table 4.

Table 3.
Mathematical notations.

Table 4.
Single-runway separation requirements for arrivals and departures (in seconds).
In this paper, we simplify the problem by considering only one crossing queue for each of the landing–take-off paired runways. According to [29], the minimum separation for arrivals to cross the runway after take-off is 40 s. If the leading flight is crossing, and the following flight is a departure, the minimum time separation is 25 s. For two consecutive arrivals crossing the same holding point, the minimum separation between them is 40 s.
Decision Variables
: takes 1 if i uses runway before j and, otherwise, 0 for .
: takes 1 if i is assigned to runway r and, otherwise, 0 for .
: takes 1 if i and j are assigned to the same runway and, otherwise, 0 for .
: landing time for or take-off time for .
: runway crossing time for .
: runway holding time before crossing for .
Objective Function Our objective function is a weighted sum of flight delays and metrics of runway assignment preference. The sum of deviations from scheduled time and the sum of holding delays is defined as follows:
We take into account also the runway assignment preference by incorporating it in the objective function:
where . Note that the preference is mainly based on the relative position between the runway and the TMA fix. A preferred runway for flight i is defined as the runway that is close to the entry/exit fix that flight i uses in the TMA. If flight i is allocated to runway r following the runway assignment preference, then . The objective is to minimize the number of flights that are not allocated to their preferred runway based on the TMA entry/exit fixes. Thus, the objective function is
where is the weighting coefficient for runway assignment preferences. The model could also take into account more the arrival delay by adding a weighting coefficient separately in the objective function.
Constraints The constraints of our problem are as follows:
Constraint (4) ensures that all flights are scheduled within their allowed time windows. Constraint (5) states the maximum holding time before crossing the take-off runway. Constraint (6) decides the precedence relationship between flights. For any two flights i and j, either flight i takes off/lands before flight j or vice versa. Constraints (7) and (8) ensure that each flight takes off/lands on exactly one runway, respectively. Constraint (9) requires that arrival flight i uses landing runway r and its paired take-off runway s for crossing after landing. Constraint (10) represents the symmetry of i and j. Constraint (11) links binary variables , , and , to determine if i and j are allocated to the same runway r. Constraint (12) ensures the minimum runway separation with regard to the wake turbulence categories for all arrivals and all departures. Likewise, Constraints (13)–(15) guarantee the minimum separation for crossing–take-offs, take-offs–crossing and for two crossings. Note that once the landing order for two arrivals is fixed, the crossing order remains the same for these two arrivals, since and are used in both constraints (12) and (15), which implies the FCFS order for crossings. Constraint (16) links the landing time, runway occupancy time, and the crossing time. An arrival is assumed to be ready to cross the take-off runway after it vacates the landing runway. Constraint (17) ensures that the decision variables are binary.
Improvement of the Model
Several problem-specific strategies are presented to strengthen the formulation: first, the so-called Big-M values are used in the formulation, a large value is chosen to model logical constraints in the classical way [10], and we set M as small as possible by tailoring M for each constraint. For example, in Constraint (12), . Secondly, the variable-fixing strategy (VFS), which consists of fixing the values of variables, using optimality properties such as aircraft of the same category, can be scheduled in non-decreasing lexicographic order [21]. As we know the runway configuration and the operation type of each flight for a departure i, it can only be allocated to runways for take-off. We can fix the following variables:
In [30], two pruning rules were proposed, to decrease the solution space. We apply these two rules by considering also the runway crossings: each flight has a time window for landings or take-offs. If the latest runway usage time of flight i is earlier than the scheduled runway usage time of flight j, i.e., then flight i is scheduled before flight j:
Likewise, if the latest time that flight crosses the take-off runway is earlier than the scheduled time of flight , as shown in Figure 3, then flight i uses the take-off runway before j:

Figure 3.
Time window comparison for a previous crossing and a following departure.
If the latest take-off time of flight is earlier than the scheduled crossing time of flight , as shown in Figure 4, then flight i can use the take-off runway before j:

Figure 4.
Time window comparison for a previous departure and a following crossing.
If the wake turbulence categories of flight i and j are the same and the time window of flight i is earlier than that of flight j then we can fix . Otherwise, if j uses the runway before i it increases the total flight delay:
4. The FCFS Heuristics
In this section, a heuristic is built to set an FCFS sequence as a baseline, considering the scheduled time to take off/land on the runway as shown in Algorithm 1. For our problem of runway assignment and the ASP, considering runway crossings, a typical runway configuration and operation types of four parallel runways are used: two runways for only landings, , and two runways for only take-offs, , are assumed. and represent two runway pairs for active runway crossings.
| Algorithm 1 The FCFS heuristic |
/*Initialization:
|
The heuristic computes runway sequences by sorting scheduled times in ascending order, then allocates the flights by balancing equally the runways and determines the runway usage time, taking into account the minimum wake turbulence separation for every two consecutive flights. After building the initial sequence and determining the schedules, the crossing time is also computed, and the crossing flights are inserted into the departure sequence accordingly. Note that in the FCFS sequence, we assume that the arrivals have priority over the departures to cross the runway because arrivals need to land on the runway and vacate immediately while departures can wait on the ground. Thus, after a crossing operation, the schedules of the following departures need to be updated by checking the minimum separation between crossings and take-offs.
To better understand how the FCFS heuristic works and the difference compared to the optimization model, we illustrate with a small instance. Table 5 shows a random instance of six arrivals and six departures with their wake turbulence categories and the scheduled times. Figure 5 illustrates the results of the FCFS sequence and the optimized sequence. , i.e., after landing on runway (), flights cross runway (), respectively. In the FCFS sequence, arrivals A1, A3, A5 are allocated to ; arrivals A2, A4, A6 are allocated to . Their schedules are established based on the scheduled times and the minimum wake turbulence categories. Likewise, departure schedules are set for and , respectively. Then, by comparing s and s, there is not enough separation (<40 s) between departure and crossing, as shown in red in Figure 5. In the FCFS sequence, the runway crossing time is assumed to be fixed, since arrivals have more priority than departures to vacate the runway. Thus, flight D1 is shifted to the position following A1, with respect to the minimum separation of 25 s between crossing and departure. Similarly, we observe that the position of D5 is fixed at the last position of the sequence, due to insufficient separation with crossings.

Table 5.
Example of a random instance of six arrivals and six departures. The wake turbulence category () and the scheduled operation time () for each flight i are presented. A and D refer to Arrival and Departure, H and M refer to Heavy and Medium, respectively.
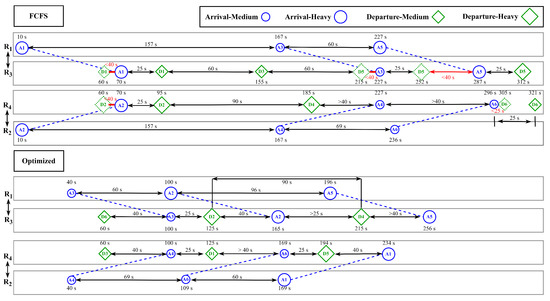
Figure 5.
Comparison of FCFS sequence and optimized sequence for a random instance. .
In the optimized sequence, the number of flights assigned to each runway is the same, while the orders are changed. Medium flights land/take off first, to reduce the category-dependent separations. The slight holding time of arrival crossings can achieve less departure delays. The total flight delay is reduced from 1380s in the FCFS case to 843s in the optimized case.
5. Results
In this section, the computational results for benchmark instances from the literature [33] and the realistic data set from Paris CDG airport [41] are presented, to illustrate the applicability of our approach. The overall process was run on an Intel i7-9850H with 2.6 GHz and 16 GB RAM, using the Java programming language of Gurobi 11.0 [42]. The maximum landing delay for arrivals and the maximum take-off delay for departures were both fixed at 20 min. Due to the restrictions imposed by the layout of the holding area, we assumed that the maximum holding time before crossing was 3 min. The runway occupancy time was 1 min for all aircraft, and it could be easily associated with the wake turbulence categories of the aircraft in our model. The runway configuration was assumed to remain the same as the one used for the FCFS case.
5.1. Computational Results for Benchmark Instances
We first applied our algorithm to instances introduced in [33] that are available online from OR-group Bologna: http://or.dei.unibo.it/ (accessed on 1 March 2024). The instances contain callsign, wake turbulence category, operation type (arrival or departure), and scheduled time for using runway. For other benchmark instances used in the literature, the operation type of each flight is not specified. Therefore, we started with instances FPT01–12, to see the impact of runway crossings. The formulation of Beasley et al. [14] and the formulation proposed in this paper were compared. The main difference was the new decision variables of runway crossings and the related constraints. The formulation of Beasley et al. referred to the MIP as defined by (4), (6)–(8), (10)–(12), (17); we denoted it as Model A. The model with crossing decisions referred to the complete formulation defined by (4)–(17); we denoted it as Model B. The objective function was set to be . All instances could be resolved in 0.1 s, since the number of aircraft per hour was not large (60 aircraft for periods of 2.5 h), and the wake turbulence categories were Light and Medium, which resulted in a smaller time separation compared to a Light aircraft following a Heavy one.
Figure 6 illustrates the results of flight delays in three cases: FCFS, Model A, and Model B. Firstly, the FCFS heuristics generated a good-quality solution, in terms of flight delays. For Model A and Model B, the total delay remained similar in several instances (FPT01–03, FPT06–08) and increased for some of them in Model B (FPT04–05, FPT09–12). This was reasonable, since the departure scheduling needed to take into account arrival crossings, thus increasing slightly the total delay. Figure 7 shows the number of flights allocated to each runway for the two models. With the incorporation of runway crossings, the differences in the number of flights between two runways of the same operation type decreased. For example, in FPT11, the numbers of flights landing on and were 12 and 25 in Model A and 19 and 18 in Model B; for departures in FPT02, the numbers of flights taking off on and were 12 and 18 in Model A and 15 and 15 in Model B. Similar trends were observed for other instances, which indicates that the runway assignments were more balanced, especially for take-offs.
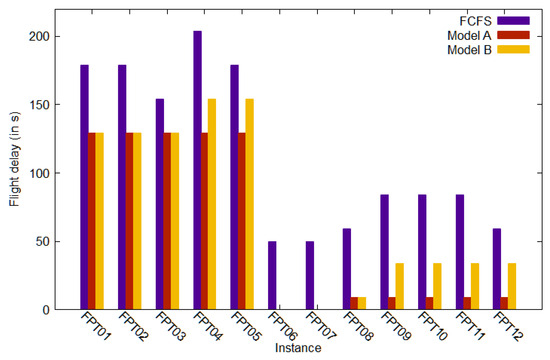
Figure 6.
Comparison of flight delays for the FCFS case: Model A and Model B.
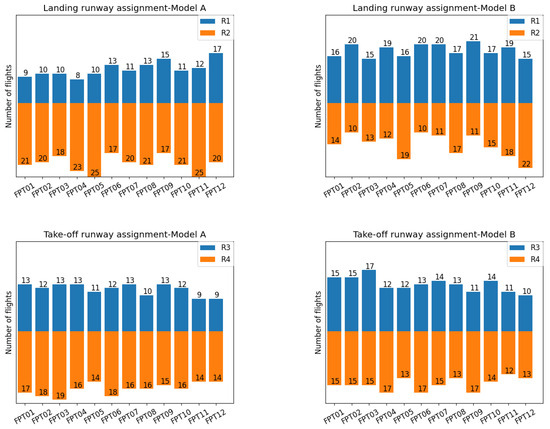
Figure 7.
Number of flights assigned to each landing runway (, ) and each take-off runway (, ) for Model A and Model B.
5.2. Computational Results for Realistic Instances
To demonstrate that our approach is suitable for realistic problems, the methodology was applied to realistic data sets of Paris CDG airport. The historical airspace surveillance data from CDG airport include relevant information, such as entry/exit point in the TMA, aircraft type, and aircraft take-off/landing times; 15 instances of flight sets were selected, and the number of flights range from 40 to 54 for periods of 30 min, which represented large-scale instances in congested periods.
5.2.1. Flight Delays Reduction
Figure 8 presents the comparative results of the FCFS sequence and the optimized sequence of Model B. The objective was the total flight delays , which was the sum of the arrival delays (magenta dashed line) and the departure delays (green dashed line) in the FCFS case, and the sum of the arrival delays (magenta solid line), the departure delays (green solid line), and the crossing delays (orange solid line) in the optimized case for all instances. The departure delays accounted for the majority of total delays, taking into account the impact of runway crossings. Small deviations in crossing time could greatly reduce the total departure delays, thus reducing the total flight delays. Arrival delays were reduced mainly by reordering aircraft to minimize wake turbulence separations for each of two consecutive arrivals.
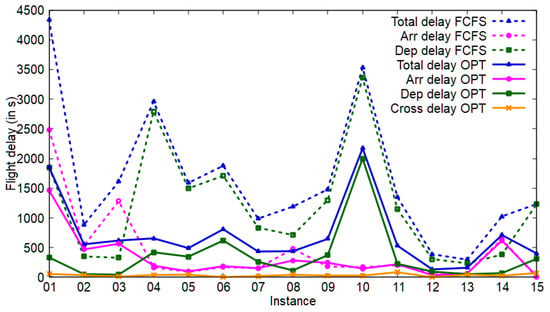
Figure 8.
Flight delay comparison of the FCFS sequence and the optimized sequence.
The computation times of Model B with and without the variable-fixing strategy are compared in Table 6. Each computation time was averaged over 10 runs. The results show that fixing the values of some variables helped strengthen the formulation, thus significantly shortening the runtime for most instances. For instances 09–10, the model runtime with VFS was still high. We set a runtime limit of 20 s to solve these two instances in a heuristic way; the results show that within 20 s, instance 09 reached optimality quickly. For instance 10, the gap from the optimal solution was less than 9%, which is suitable for operational application. This indicates that the solver finds near-optimal solutions within a short time limit, but has difficulty proving the optimality when the traffic scenario is dense.

Table 6.
Comparison of computation times (in seconds). VFS refers to variable-fixing strategy. Each computation time is averaged over 10 times.
5.2.2. Reducing Flight Delays, Considering Runway Assignment Preference
To investigate the effect on flight delays, considering runway allocation preference, we took into account the runway assignment preference by incorporating it into the objective function. Thus, for this section, the objective function was set to , where was the weighting coefficient for runway assignment preferences.
Figure 9 presents the effect of the weighting coefficient in the objective functions. The blue line represents the objective function and the magenta line represents the objective function . With the increase of , did not change for ; it increased slightly for ; and it increased significantly for . kept decreasing with the increase of for all instances.
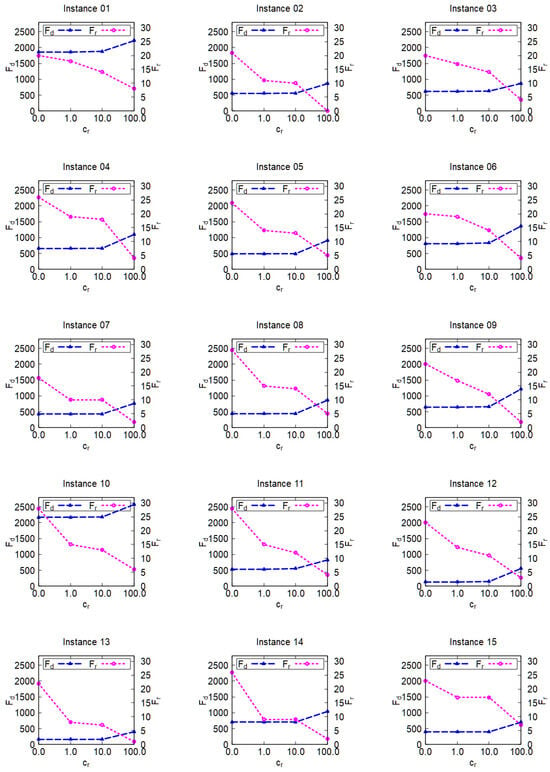
Figure 9.
Effect of including the runway assignment preference indicator in the optimization model. The blue/magenta line represents flight delay /runway assignment metric , respectively.
Table 7 illustrates the percentage of deviations from the objective function when only minimizing flight delays. is defined as the percentage of difference for objective function compared to the case with . The higher was, the more flight delays occurred. is defined as divided by the total number of flights. The lower was, the more aircraft were allocated to their preferred runways. When , we aimed to minimize flight delays, but around half of the runway preferences were not met. For , the flight delays for all instances remained the same, and the number of flights with undesired runway assignments decreased. For , more flights were assigned to their preferred runway: for example, in instance 09, 78% of the flights were allocated to their preferred runways, with an increase of 2% of flight delays. When , most flights were assigned to their preferred runways. However, the flight delays increased: for example, in instance 02, all aircraft were assigned to their preferred runways, with the cost of a 55% increase in flight delays compared to the case of and . Note that for instance 12, even was larger than for the other instances; the total delay values were relatively low: s with compared to 132s with . A similar situation occurred for instance 13.

Table 7.
Comparison for flight delays and runway preferences for different values of . is defined as the percentage of difference for objective function compared to the one with . is defined as divided by the total number of flights.
The proper running of can allocate flights, considering their TMA entry/exit points without increasing dramatically the flight delays, thus providing trade-off solutions to assist aircraft sequencing and scheduling for daily operations. The schedule with provides a good trade-off solution, since in real operations around 70–80% of flights are allocated to their preferred runways, as shown in Table 1 and Table 2, at the cost of an increase of 1% in flight delays for most cases.
5.3. Managerial Remarks
Our case studies show that an aircraft sequencing model that considers runway assignment preferences and crossings improves flight delays compared to FCFS rules that sequence flights according to target runway usage times. The results could be used to integrate AMAN and DMAN for airports with parallel runways and complex interactions between landing runways and take-off runways. In addition, terminal airspace information, i.e., entry/exit waypoints, is incorporated, to better guide decision making, potentially reducing controller workload. The model aims to provide a tactical planning tool to support the departure and arrival schedule for local controllers. In real-world operations, controllers give clearances of speed, altitude, and headings based on these decision support tools. In our model, AMAN is combined with DMAN, taking into account runway assignment preferences and crossings, both of which increase pressure on controllers and require appropriate recommendations. In fact, more advanced tools are needed, with interfaces for controllers to merge and sequence aircraft, which could be combined with our model by inputting information for controllers. The system could also be extended to include airline preferences.
6. Conclusions
In this paper, we presented an optimization model of the aircraft sequencing problem, considering scheduling simultaneously landing/take-off/crossing times in a multiple-runway case, taking into account runway assignment preferences. The resolution process was accelerated by the variable-fixing strategy, to be utilized in practice. Additionally, we derived FCFS heuristics, to compare different strategies for allocating flights to runways and sequencing. The numerical experiments showed significant benefits in runway balancing and flight delay reductions. For the instances in the literature, the importance of incorporating runway crossings in the multiple-runway system was addressed as the landing runway assignment, and the following schedules of landing and crossing strongly interacted with departure schedulings. The benchmark instances from the literature were easily solved by the current solvers, as stated in [10], with a very short computation time. It was still useful to test these instances, to compare the effect of including runway crossings in the multi-runway assignment and aircraft sequencing problem. The runway crossings affected the number of flights assigned to each runway as well as the departure delays. The runways were assigned and balanced considering the runway crossings because the crossing operation connected the landing and the take-off runways. The total delays were slightly increased by the crossing operations. For realistic cases, firstly, it can be concluded that problem-specific rules with VFS help to speed up the solution of the MILP model. Secondly, the optimized solution outperforms the FCFS solution, in terms of flight delays. A proper adjustment of crossing times can significantly reduce departure delays. Finally, the relative positions between the runway and the TMA entry/exit point are important factors that determine runway assignment. If more aircraft are assigned to their preferred runway, there will be fewer potential interactions in the airspace and, thus, less controller workload. However, this may result in more flight delays. By properly balancing these two objectives, fewer flight delays can be achieved, with a satisfactory percentage of preferred runway assignment.
Some potential future research directions may be addressed. The model could be integrated with the rolling horizon approaches in [40], to investigate the dynamic features of the ASP. These approaches are also able to take into account other factors, such as bad weather and air traffic management restrictions on runways. In addition, planning the evening schedule in the morning is useless. Fuel-efficient trajectories and more sustainable approaches can be integrated into the current tactical support tools. Comparative studies for different airports in the EU and in China with similar runway configurations could provide new insights into the impact of the ASP on delay reduction. Heuristics or meta-heuristics are encouraged to be implemented, to accelerate the solution process tackling larger instances.
Author Contributions
Conceptualization, J.M., D.D. and M.L.; methodology, J.M., D.D. and M.L.; software, J.M.; validation, J.M., D.D. and M.L.; formal analysis, J.M.; investigation, M.L.; writing—original draft preparation, J.M.; writing—review and editing, J.M., D.D. and M.L.; visualization, J.M.; funding acquisition, J.M. All authors have read and agreed to the published version of the manuscript.
Funding
This research was funded by the National Natural Science Foundation of China under Grant 52302421, by the Diversified Investment Fund of Tianjin under Grant 23JCQNJC00210, and by the CAUC Research Fund under Grant 3122024PT27.
Institutional Review Board Statement
Not applicable.
Informed Consent Statement
Not applicable.
Data Availability Statement
The data from OR-group Bologna presented in this study are available at http://or.dei.unibo.it/. The authors do not have permission to share data from Paris CDG Airport.
Conflicts of Interest
The authors declare no conflicts of interest.
References
- Khan, W.A.; Chung, S.H.; Eltoukhy, A.E.; Khurshid, F. A novel parallel series data-driven model for IATA-coded flight delays prediction and features analysis. J. Air Transp. Manag. 2024, 114, 102488. [Google Scholar] [CrossRef]
- Khan, W.A.; Ma, H.L.; Chung, S.H.; Wen, X. Hierarchical integrated machine learning model for predicting flight departure delays and duration in series. Transp. Res. Part C Emerg. Technol. 2021, 129, 103225. [Google Scholar] [CrossRef]
- Khan, W.A.; Ma, H.L.; Ouyang, X.; Mo, D.Y. Prediction of aircraft trajectory and the associated fuel consumption using covariance bidirectional extreme learning machines. Transp. Res. Part E Logist. Transp. Rev. 2021, 145, 102189. [Google Scholar] [CrossRef]
- Wen, X.; Chung, S.H.; Ma, H.L.; Khan, W.A. Airline crew scheduling with sustainability enhancement by data analytics under circular economy. Ann. Oper. Res. 2023. [Google Scholar] [CrossRef]
- Bennell, J.A.; Mesgarpour, M.; Potts, C.N. Airport runway scheduling. 4OR 2011, 9, 115. [Google Scholar] [CrossRef]
- Eurocontrol. European Wake Turbulence Categorisation and Separation Minima on Approach and Departure; Eurocontrol Headquarter: Brussels, Belgium, 2018. [Google Scholar]
- Holzäpfel, F.; Strauss, L.; Schwarz, C. Assessment of dynamic pairwise wake vortex separations for approach and landing at Vienna airport. Aerosp. Sci. Technol. 2021, 112, 106618. [Google Scholar] [CrossRef]
- Sekine, K.; Kato, F.; Kageyama, K.; Itoh, E. Data-Driven Simulation for Evaluating the Impact of Lower Arrival Aircraft Separation on Available Airspace and Runway Capacity at Tokyo International Airport. Aerospace 2021, 8, 165. [Google Scholar] [CrossRef]
- Ahrenhold, N.; Stasicka, I.; Abdellaoui, R.; Mühlhausen, T.; Temme, M.M. Enabling Green Approaches by FMS-AMAN Coordination. Aerospace 2023, 10, 278. [Google Scholar] [CrossRef]
- Ikli, S.; Mancel, C.; Mongeau, M.; Olive, X.; Rachelson, E. The aircraft runway scheduling problem: A survey. Comput. Oper. Res. 2021, 132, 105336. [Google Scholar] [CrossRef]
- Bennell, J.A.; Mesgarpour, M.; Potts, C.N. Dynamic scheduling of aircraft landings. Eur. J. Oper. Res. 2017, 258, 315–327. [Google Scholar] [CrossRef]
- Prakash, R.; Piplani, R.; Desai, J. An optimal data-splitting algorithm for aircraft scheduling on a single runway to maximize throughput. Transp. Res. Part C Emerg. Technol. 2018, 95, 570–581. [Google Scholar] [CrossRef]
- Ikli, S.; Mancel, C.; Mongeau, M.; Olive, X.; Rachelson, E. An Optimistic Planning Approach for the Aircraft Landing Problem. In Proceedings of the Air Traffic Management and Systems IV, Tokyo, Japan, 24 October 2019; Springer: Singapore, 2021; pp. 173–188. [Google Scholar]
- Beasley, J.E.; Krishnamoorthy, M.; Sharaiha, Y.M.; Abramson, D. Scheduling Aircraft Landings—The Static Case. Transp. Sci. 2000, 34, 180–197. [Google Scholar] [CrossRef]
- Lieder, A.; Stolletz, R. Scheduling aircraft take-offs and landings on interdependent and heterogeneous runways. Transp. Res. Part E Logist. Transp. Rev. 2016, 88, 167–188. [Google Scholar] [CrossRef]
- Hancerliogullari, G.; Rabadi, G.; Al-Salem, A.H.; Kharbeche, M. Greedy algorithms and metaheuristics for a multiple runway combined arrival-departure aircraft sequencing problem. J. Air Transp. Manag. 2013, 32, 39–48. [Google Scholar] [CrossRef]
- Ahmed, M.S.; Alam, S.; Barlow, M. A Cooperative Co-Evolutionary Optimisation Model for Best-Fit Aircraft Sequence and Feasible Runway Configuration in a Multi-Runway Airport. Aerospace 2018, 5, 85. [Google Scholar] [CrossRef]
- Andreeva-Mori, A.; Suzuki, S.; Itoh, E. Rule deviation for arrival aircraft sequencing. Aerosp. Sci. Technol. 2013, 30, 200–209. [Google Scholar] [CrossRef]
- Faye, A. Solving the Aircraft Landing Problem with time discretization approach. Eur. J. Oper. Res. 2015, 242, 1028–1038. [Google Scholar] [CrossRef]
- Salehipour, A.; Modarres, M.; Moslemi Naeni, L. An efficient hybrid meta-heuristic for aircraft landing problem. Comput. Oper. Res. 2013, 40, 207–213. [Google Scholar] [CrossRef]
- Briskorn, D.; Stolletz, R. Aircraft landing problems with aircraft classes. J. Sched. 2014, 17, 31–45. [Google Scholar] [CrossRef]
- Pang, Y.; Zhao, P.; Hu, J.; Liu, Y. Machine learning-enhanced aircraft landing scheduling under uncertainties. Transp. Res. Part C Emerg. Technol. 2024, 158, 104444. [Google Scholar] [CrossRef]
- Atkin, J.A.; Burke, E.K.; Greenwood, J.S.; Reeson, D. Hybrid metaheuristics to aid runway scheduling at London Heathrow airport. Transp. Sci. 2007, 41, 90–106. [Google Scholar] [CrossRef]
- Gupta, G.; Malik, W.; Jung, Y. A mixed integer linear program for airport departure scheduling. In Proceedings of the 9th AIAA Aviation Technology, Integration, and Operations Conference (ATIO) and Aircraft Noise and Emissions Reduction Symposium (ANERS), Hilton Head, SC, USA, 21–23 September 2009; p. 6933. [Google Scholar]
- Malik, W.; Lee, H.; Jung, Y.C. Runway Scheduling for Charlotte Douglas International Airport. In Proceedings of the 16th AIAA Aviation Technology, Integration, and Operations Conference, Washington, DC, USA, 13–17 June 2016. [Google Scholar] [CrossRef]
- Ma, J.; Sbihi, M.; Delahaye, D. Optimization of departure runway scheduling incorporating arrival crossings. Int. Trans. Oper. Res. 2021, 28, 615–637. [Google Scholar] [CrossRef]
- Dear, R.G. The Dynamic Scheduling of Aircraft in the Near Terminal Area; Technical Report; Flight Transportation Laboratory, Massachusetts Institute of Technology: Cambridge, MA, USA, 1976. [Google Scholar]
- Artiouchine, K.; Baptiste, P.; Dürr, C. Runway sequencing with holding patterns. Eur. J. Oper. Res. 2008, 189, 1254–1266. [Google Scholar] [CrossRef][Green Version]
- Gupta, G.; Malik, W.; Jung, Y. Incorporating Active Runway Crossings in Airport Departure Scheduling. In Proceedings of the AIAA Guidance, Navigation, and Control Conference, Toronto, ON, Canada, 2–5 August 2010. [Google Scholar] [CrossRef]
- Pohl, M.; Kolisch, R.; Schiffer, M. Runway scheduling during winter operations. Omega 2021, 102, 102325. [Google Scholar] [CrossRef]
- Liang, M.; Delahaye, D.; Marechal, P. Conflict-free arrival and departure trajectory planning for parallel runway with advanced point-merge system. Transp. Res. Part C Emerg. Technol. 2018, 95, 207–227. [Google Scholar] [CrossRef]
- Murça, M.C.R. A robust optimization approach for airport departure metering under uncertain taxi-out time predictions. Aerosp. Sci. Technol. 2017, 68, 269–277. [Google Scholar] [CrossRef]
- Furini, F.; Kidd, M.P.; Persiani, C.A.; Toth, P. Improved rolling horizon approaches to the aircraft sequencing problem. J. Sched. 2015, 18, 435–447. [Google Scholar] [CrossRef]
- Faye, A. A quadratic time algorithm for computing the optimal landing times of a fixed sequence of planes. Eur. J. Oper. Res. 2018, 270, 1148–1157. [Google Scholar] [CrossRef]
- Montoya, J.; Rathinam, S.; Wood, Z. Multiobjective departure runway scheduling using dynamic programming. IEEE Trans. Intell. Transp. Syst. 2014, 15, 399–413. [Google Scholar] [CrossRef]
- Balakrishnan, H.; Chandran, B.G. Algorithms for scheduling runway operations under constrained position shifting. Oper. Res. 2010, 58, 1650–1665. [Google Scholar] [CrossRef]
- Scala, P.; Mujica Mota, M.; Delahaye, D. Air Traffic Management during Rare Events Such as a Pandemic: Paris Charles de Gaulle Case Study. Aerospace 2021, 8, 155. [Google Scholar] [CrossRef]
- Publication eAIP. Available online: https://www.sia.aviation-civile.gouv.fr/ (accessed on 1 March 2024).
- Badrinath, S.; Balakrishnan, H.; Ma, J.; Delahaye, D. Comparative Analysis of Departure Metering at United States and European Airports. J. Air Transp. 2020, 28, 93–104. [Google Scholar] [CrossRef]
- Ma, J.; Delahaye, D.; Sbihi, M.; Scala, P.; Mota, M.A.M. Integrated optimization of terminal maneuvering area and airport at the macroscopic level. Transp. Res. Part C Emerg. Technol. 2019, 98, 338–357. [Google Scholar] [CrossRef]
- Ma, J. Optimisation du Trafic aéRien Dans de Grands aéRoports. Ph.D. Thesis, Université Paul Sabatier (Toulouse 3), Toulouse, France, 2019. [Google Scholar]
- Gurobi Optimization, LLC. Gurobi Optimizer Reference Manual; Gurobi Optimization, LLC.: Beaverton, OR, USA, 2023. [Google Scholar]
Disclaimer/Publisher’s Note: The statements, opinions and data contained in all publications are solely those of the individual author(s) and contributor(s) and not of MDPI and/or the editor(s). MDPI and/or the editor(s) disclaim responsibility for any injury to people or property resulting from any ideas, methods, instructions or products referred to in the content. |
© 2024 by the authors. Licensee MDPI, Basel, Switzerland. This article is an open access article distributed under the terms and conditions of the Creative Commons Attribution (CC BY) license (https://creativecommons.org/licenses/by/4.0/).