Abstract
This research presents the design and development of a near-space picosatellite platform intended to operate at high altitudes between 20–40 km above sea level. These picosatellites function similarly to orbital satellites but float and travel with the wind in the atmosphere instead of orbiting the Earth. The platform utilizes a super-pressure balloon to provide buoyancy, allowing the picosatellite to remain airborne and operational for several days to months, capable of flying around the world multiple times. This study focuses on the cost-effective design of high-altitude platforms, telecommunication systems, and energy consumption for the picosatellite, enabling it to communicate with ground stations from anywhere in the world while consuming low power. The use of common COTS (Commercial Off-The-Shelf) equipment aims to enhance accessibility for educational applications. This research gathered data from our previous studies for over 20 high-altitude platform flights, analyzed the necessary factors for whole system design, and developed a new prototype that has been successfully built and tested.
1. Introduction
Space projects involve launching experiments or inventions into space, either to orbit the Earth or explore beyond it, for scientific purposes and to develop solutions. They also aim to build human resources in technology fields, such as telecommunications engineers and embedded systems researchers. Beyond satellite knowledge, this expertise can spin off into other areas, such as medical technology [1] and smartphones, similar to how the Apollo program generated extensive knowledge from its lunar missions.
Space exploration inspires young people to pursue education in space technology [2]. With current technology, building satellites is no longer difficult, but a significant pain point remains the budget. Constructing a small satellite weighing just 5 kg can cost as much as USD 300k [3], which is prohibitively expensive for developing countries. This creates a technology gap, depriving these countries of the opportunity to develop space technology knowledge and related personnel.
The goal of this paper is to simulate a space project by creating and launching an invention to circumnavigate or fly around the Earth at near-space altitude with a low budget, operating for several days to several months. This approach provides a similar experience to launching an invention into orbit but with a budget of less than USD 190. The near-space picosatellite platform will operate at an altitude of over 20 km. The system can report status information, platform position, and telemetry of student experiments remotely to a ground receiver, providing real-time status updates.
Figure 1 shows examples of our previous experiments on high-altitude platforms (HAP) in near space for educational and research purposes. This research paper presents data analyzed from more than 20 previous near-space flights, which will be used to design a suitable near-space picosatellite platform for long-term use.
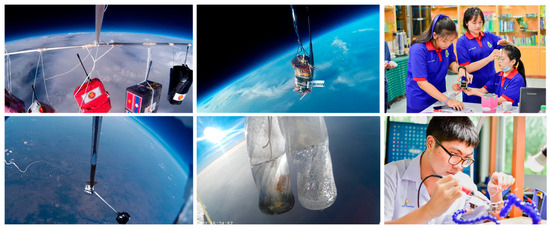
Figure 1.
Our experiments in near space.
2. High Altitude Platform & Near-Space Environment
2.1. Buoyancy Platform
A buoyancy platform is a type of platform that utilizes buoyant forces to remain airborne at high altitudes. It can take the form of an aircraft, UAV, or balloon that operates in the atmosphere for extended periods. For this research, which focuses on low-budget solutions, a lighter-than-air balloon, as shown in Figure 2, was chosen. It uses helium or hydrogen to generate lift. There are various types of balloons with different travel characteristics, as shown in Figure 3. Initially, the gas is filled to less than the balloon’s maximum volume (point 1), causing the balloon to appear flattened. This allows the gas to expand as the balloon ascends to higher altitudes with lower air density (point 2). The balloons then travel differently depending on their type, as follows.
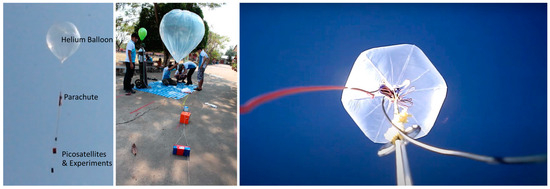
Figure 2.
Lighter-than-air balloon.
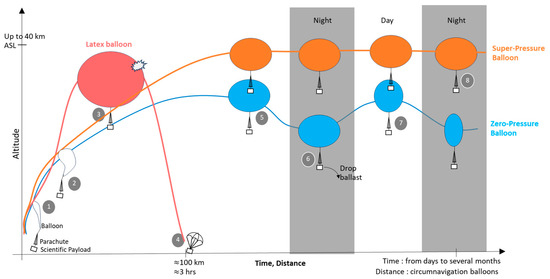
Figure 3.
The travel characteristics of each balloon type.
- Latex balloon: Made from natural rubber, which is highly elastic. This elasticity causes the balloon’s density to decrease as it ascends by expanding its volume. When it expands to its maximum volume, the rubber of the balloon will burst (point 3). Generally, the balloon can reach an altitude of 18–40 km [4]. The remaining payload will then fall back to the ground (point 4). The entire duration of the balloon’s operation is no more than three hours. These balloons are inexpensive and easy to obtain.
- Zero-pressure balloon: Made from low-density polyethylene plastic (LDPE) or laminated LDPE. This type of balloon can adjust its internal pressure to match the external atmosphere through an exhaust valve, allowing it to remain at the designated altitude [5] (point 5), preventing stress on the balloon film. However, the balloon may expand or contract with temperature changes, causing the platform to descend at night as the temperature drops. To maintain altitude, the platform’s weight needs to be reduced by jettisoning ballast (point 6). When sunrise returns, the balloon gas is vented out due to the increase in the temperature of the balloon gas (point 7). As a result of this iteration, the loading capacity of the ballast may constrict the flight duration of the balloon [6].
- Super-pressure balloons: Designed to maintain a constant altitude, with their volume remaining unchanged despite temperature variations. These balloons do not vent gas, ensuring that the internal pressure is always higher than the external, allowing them to stay at the same altitude both day and night while retaining the contained gas. This enables long-duration missions (point 8). However, designing such balloons is challenging as they require thin materials to minimize weight while being durable enough to withstand high pressure [6]. These balloons are commonly used in research and can operate for several months, up to 1.5 years [7].
To operate long-term space projects at high altitudes, either zero-pressure or super-pressure balloons can be used. However, this research opted for super-pressure balloons because they are less complex, do not require the installation of valves or ballast, and can maintain altitude for extended periods.
2.2. Super-Pressure Balloon: Numerical and Actual Flight Data
The calculation for creating a super-pressure balloon [8] is shown in (1)–(8). The result of the calculation is , which indicates the atmospheric pressure in Pascals (PA) at the float altitude, which can translate to the altitude in kilometers with the ISA model [9]. indicates the pressure of the balloon at float altitude, representing the difference between the internal gas pressure and the external air pressure. This difference is a critical factor to consider in the design to prevent excessive pressure.
when , , , and are gas mass, balloon mass, payload mass, and free lift in the unit of (kg) respectively. is the gas constant in which = 287.05 J/(kg∙K), = 2077 J/(kg∙K) and = 4124 J/(kg∙K). is the temperature in Kelvin (K), of which , are the gas temperature and air temperature at floating point, respectively. In this calculation, and are assumed to be equal, with their values changing according to altitude, which can be calculated following the ISA model [9]; is the air temperature at ground point, which is set to 15 °C in this calculation. is volume, of which is the balloon maximum volume and is the gas volume when filling at the beginning. is the air pressure at ground point, which is a constant equal to 101,325 Pa, and is the density, of which is the air density.
To find the value of , the lift force from the balloon, and , the total weight of the platform in Newtons (N), the following Equations (5)–(8) can be used:
From the Equations (1)–(8), when calculated by setting the free lift () constant at 1.1 kg or 10.79 N for every flight and using helium gas to generate buoyancy force, the balloon weighs 605 g with a volume of 3.5 m3. The weight increases with the surface area of the larger size. In this calculation, the balloon volume () is set to 3.5 and 4.5 m3. As the balloon volume increases, the float altitude also increases for the same payload weight, as shown in the graph in Figure 4a.

Figure 4.
(a) Float altitude and helium volume with different payload masses by calculation. (b) Altitude data from the actual flight.
Regarding the amount of gas to be filled at the initial launch, it is often filled to less than the balloon’s actual volume, causing the balloon to appear deflated during the early stages. Furthermore, it is evident that an increase in the size of the payload will directly affect the float altitude. Therefore, the development of payloads to be installed on HAP should aim to be as small and light as possible, allowing the platform to reach its maximum altitude or providing the option to use a smaller balloon with a reduced gas volume.
In one of our previous experiments, we designed and launched a super-pressure balloon to ascend and maintain a specific altitude. For this experiment, a balloon with a volume of 3.5 m3 and a weight of 0.605 kg was used, along with a payload mass of 1.1 kg. The balloon was filled with helium gas. Before launching the balloon, we measured the free lift as 1.1 kg. Using Equations (1)–(8) to calculate the data, we found that the HAP would have a float altitude of 6618 m. Comparing this with the actual experiment, as shown in Figure 4b, which depicts the altitude of the HAP over time from launch until it stabilizes at a certain altitude, the HAP maintained an altitude between 6456 and 6629 m, which is close to the calculated value. Additionally, when evaluating the average ascent rate of the balloon from minute 0 to minute 20, we found an average ascent rate of 3.94 m/s.
2.3. Near-Space Flight Path and Suitable Altitude
The movement characteristics of balloons allow them to fly around the world multiple times as shown in Figure 5a. Data from such balloon missions have been collected and documented [10]. They travel according to the direction and speed of winds at different altitudes in the atmosphere.

Figure 5.
(a) The balloon’s path fly around the world [10]; (b) HAP contact duration in different altitude.
Balloons can remain in the atmosphere for several hours to several months. Their functionality is similar to satellites in orbit, as they can travel around the world, but they have a better link margin for communication due to their closer proximity to Earth. However, unlike satellites, balloons cannot precisely schedule their visibility in the long term. Despite this, their movement can be predicted using the NOAA HYSPLIT Model (Hybrid Single-Particle Lagrangian Integrated Trajectory), a system developed by the National Oceanic and Atmospheric Administration (NOAA) for computing and visualizing air parcel trajectories. It is widely used in atmospheric research, environmental monitoring, and emergency response planning. The HYSPLIT model integrates data from various sources, including wind field data, atmospheric databases, and geographical information, to simulate the movement of particles in the atmosphere [11].
From our previous studies on wind speed across various seasons [12], we collected statistical data from weather balloons over Thailand’s airspace for 5 years and compared them with our flights from HAPs. We found that wind speeds varied across seasons but followed a similar trend: wind speed gradually increased with altitude, peaking at around 15 km. When assessing communication time with a ground receiver at different altitudes, as shown in Figure 5b, we found that the platform operates for the longest periods at altitudes of 7 km and 20 km. This is because these altitudes offer the best balance between communication coverage and wind speed.
2.4. Environment in Near Space
To better understand the environment that the picosatellite must endure, one of our HAP flight experiments from previous research collected data on high-altitude conditions above Thailand. This included information on air pressure and temperature, which were recorded throughout the flight from the initial launch to a maximum altitude of 30 km, as depicted in Figure 6. Air pressure decreases continuously as altitude increases, similar to temperature. Temperature data were collected at two points: outside the module (air temperature) and inside the module, which was contained within a 1-inch EPS (Expanded Polystyrene) insulation. It was observed that the temperature inside the module changed more slowly compared to the outside.
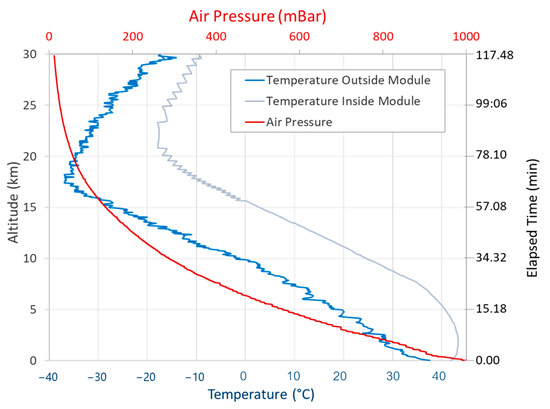
Figure 6.
The environmental data in near space.
The collected data align with the International Standard Atmosphere (ISA) model [9], indicating that atmospheric pressure decreases with increasing altitude, reaching almost no air at around 30 km. According to the ISA model, temperature decreases rapidly from the ground up to approximately 11 km, reaching a minimum of −56.5 °C, and then tends to increase after 20 km. When compared to the data collected above Thailand, the lowest temperature recorded was −37 °C, with the temperature transition point from decreasing to increasing occurring around 17 km. Overall, the temperatures above Thailand are slightly warmer but follow a similar trend.
3. Telecommunication System
The challenge of near-space picosatellites is their journey around the globe, which can span thousands of kilometers away from their owners. Meanwhile, only a few watts of energy are available for communication. Therefore, it is necessary to consider wireless communication technology that can be utilized in this context.
3.1. Low-Power, Wide-Area Network
For near-space flights, where power sources are limited and distances are vast, Low-Power, Wide-Area communication technologies are suitable as they allow for communication over long distances with minimal energy usage. The communication can be either point-to-point or networked to cover wide areas. Currently, there are various Low-Power, Wide-Area communication technologies available. A summary comparing each of these technologies currently in use is presented in Table 1.

Table 1.
Low-Power, Wide-Area communication.
3.2. Communication System for Near-Space Picosatellite
From the data reviewed in Section 3.1, it is found that WSPR, a long-range amateur radio communication system operating in the HF band, can communicate beyond the line of sight. It offers the greatest global coverage capabilities when considering budget and energy factors. However, this system has significant limitations in terms of data rate, protocol, and simplex data transmission. Additionally, it requires a licensed transmitter, which is not accessible to everyone, and it is vulnerable to weather affecting radio wave propagation. Therefore, it is not suitable for further development in this research project, which requires experimental data transmission.
For satellite networks, Iridium SBD and SWARM are the most globally covered and reliable networks. They cover all areas of the Earth, both on land and at sea. However, due to their high energy requirements and development costs, which are more than 10 times those of other systems, they are not suitable for this project, which focuses on low-cost systems.
The APRS system can communicate globally within the coverage area of ground stations, but the transmitter must use high power due to the system’s lower sensitivity. This requires a large telecommunication system, making it unsuitable for research projects that focus on developing small-sized systems utilizing small buoyancy platforms. Additionally, the system operates in simplex mode and requires a licensed transmitter, which is difficult to access.
Therefore, this research utilizes LoRa, which is currently popular and widespread. It can be used with various open-source LoRaWAN systems without needing a radio frequency license, such as The Things Network (TTN) [18], which focuses on receiving signals in IoT systems. These systems can also receive signals from the sky and space. Additionally, there is a network specifically designed for receiving satellite or airborne signals, called TinyGS [15]. These networks consist of ground stations that receive LoRa signals and immediately upload them to the internet, allowing for global tracking of the HAPs status, except in oceanic areas, as it requires ground-based stations. Furthermore, these systems can instantly report HAPs data and location through websites and social communities such as Telegram [18].
3.3. Maximum Distance for Communication
This section analyzes the maximum communication distance between the picosatellite and the ground receiver. We aim to determine the maximum achievable coverage area by considering picosatellites at various altitudes in near space, ensuring the communication distance extends as far as possible within the line-of-sight range. Calculations will be based on the following Equation (9):
when is distance between the picosatellite and ground station, represents the radius of the Earth (6378 km), H denotes the altitude of the picosatellite (in kilometers), and represents the elevation angle between the ground station and picosatellite [19].
When comparing the distance against the elevation angle for different values of altitude H as shown in graph Figure 7, it is observed that the communication distance is maximized when the elevation angle is 0° and minimized when the picosatellite is directly overhead, with an elevation angle of 90°. As altitude H increases, the distance also increases accordingly.
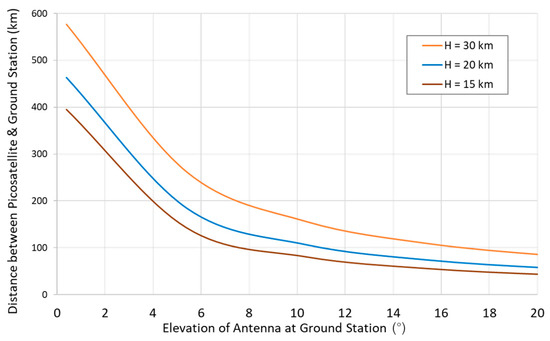
Figure 7.
Distance between the picosatellite and ground station at different elevations.
3.4. Radio Communication Path Loss
Our previous study [20] deployed HAP to measure the Receiving Signal Strength Indicator (RSSI) and compare it with the free space path loss calculated from theory to design a suitable link margin for the system. In theory, path loss () depends on the distance and the communication frequency, and it can be calculated by Equation (10).
When is the distance from the ground receiver to HAP (km), is the frequency of communication (Hz), and is speed of light in a vacuum (m/s). In [20], the communication was conducted at a frequency of 433 MHz with a transmission power of +10 dBm. Both the transmitter and receiver systems utilized the same type of antenna, a quarter-wave monopole, which is an omnidirectional antenna. RSSI data were collected from the launch until the HAP reached its maximum altitude, as shown in Figure 8.
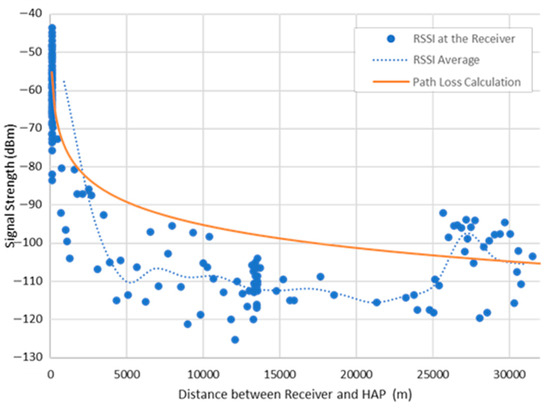
Figure 8.
Signal strength at receiver, comparing path loss calculations and RSSI.
From the data, it can be observed that the RSSI exhibits significant fluctuations even at the same distance. This is likely due to the antenna rotating and swinging, which affects signal stability. On average, the RSSI was up to 15 dB lower than the theoretical values. Based on the conclusions from this experiment, to ensure successful communication throughout the mission, a link margin of an additional 15 dB should be included in the system. This can be achieved by increasing the gain at the transmitter or receiver to meet the system requirements.
3.5. LoRa’s Receiving Sensitivity
LoRa’s receiving sensitivity refers to the receiver’s ability to indicate the minimum signal strength required. Better sensitivity (a low value) means the receiver can detect weaker signals. Theoretically, we can calculate the data rate and sensitivity of LoRa communication [14] as shown in Equations (11) and (12).
When is the data rate (bps), is the spreading factor (a parameter used to control the spreading of the signal in LoRa modulation, ranging from 7 to 12), is the bandwidth (Hz), and is the code rate (used to control the forward error correction, FEC, ranging from 4/5 to 4/8). A higher code rate means more redundancy. is sensitivity, is the thermal noise power density in LoRa communication, set to −174 dBm/Hz, is the noise figure in the transmitter-receiver system, and is the Signal to Noise Ratio, which varies depending on the selected Spreading Factor (SF). The values are as follows: SF 7 = −7.5 dB, SF 8 = −10 dB, SF 9 = −12.5 dB, SF 10 = −15 dB, SF 11 = −17.5 dB, and SF 12 = −20 dB. The constant value of −174 represents the thermal noise in a 1 Hz bandwidth, which can change according to the receiver’s temperature.
LoRa presents a trade-off between sensitivity and the data rate, as shown Figure 9. When using the LoRaWAN network, the minimum configuration required is SF 12 and BW 125 kHz, which provides a data rate of at least 292 bps and the best sensitivity of −137 dBm. If a point-to-point LoRa network is used, where a dedicated receiver station is set up, the bandwidth can be reduced, resulting in improved sensitivity of up to −149 dBm at a data rate of 18.3 bps.
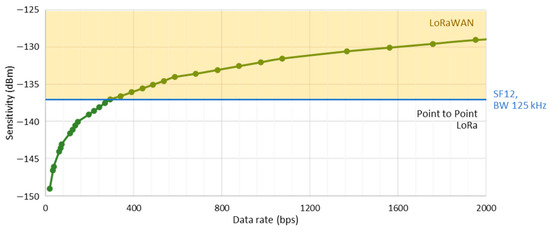
Figure 9.
Sensitivity compared to data rate in LoRa communication.
In this research, the sensitivity of LoRa was tested to validate the calculations. The testing was conducted in a laboratory setting as shown in Figure 10a, with the receiver and transmitter configured using SX1278 modules. Different bandwidths and SF settings were used, and an adjustable attenuator was employed to vary the transmission power. The signal was then split using a splitter, directing one output to a spectrum analyzer to measure the output power and the other output to radiate the signal.

Figure 10.
Sensitivity measurement (a); the schematic of testing (b); the result of sensitivity with different bandwidths and SF.
From the test with a code rate of 4/5, the results are shown in the graph in Figure 10b. The sensitivity is measured as the lowest (best) value where the package error rate (PER) does not exceed 1% at the receiver. This test was conducted with six different bandwidth settings: 7.8 kHz, 15.6 kHz, 31.25 kHz, 62.5 kHz, 125 kHz, and 250 kHz. The spreading factor (SF) varied from 7 to 12. When comparing the measured results with the calculated values, it was found that they were closely aligned.
3.6. Frequency and EIRP in LoRa Communication
LoRa modules mainly use the unlicensed 433 MHz, 868 MHz, and 915 MHz industrial, scientific, and medical (ISM) radio bands, which do not require a license to operate in the sub-gigahertz range [21]. However, it is important to consider the allocated frequency channels and different permitted EIRP levels, which vary by region. Therefore, for a picosatellite traveling around the world, frequency modules for all regions should be installed, and it must comply with each country’s regulations as it passes through.
3.7. Feasibility of Near-Space Picosatellite Communication
The link budget represents the signal strength at the receiving end. This research will compute the link budget as shown in Equation (13). It comprises the values of as the received power, (Effective Isotropic Radiated Power), representing the power and gain of the transmitter of the picosatellite; is the gain of the receiving antenna, , derived from Equation (10), and serves as a buffer for proper communication within the system. Each parameter in this equation is measured in dB or dBm.
From Equation (13), when comparing the link budget with the distance, it shows that as the distance increases, the link budget decreases due to increased path loss. Referring to the data from the graph in Figure 9, when transmitting at lower data rates, communication can occur over longer distances. Conversely, when transmitting at higher frequencies, the achievable distance decreases accordingly.
If we compare the communication range achievable with the link budget for frequencies in the 433 MHz and 915 MHz bands, with setup parameters as specified in Table 2, the result is shown in Figure 11. The EIRP for the 915 MHz frequency is set to +20 dBm, as it is a frequency band where high transmission power can be used. Meanwhile, the 433 MHz frequency band often has restricted transmission power, so the EIRP is set to +10 dBm. Both systems also have a receiver gain of +5 dBi. Additionally, the systems have a link margin deduction, as concluded in Section 3.4, to ensure proper communication with a 15 dB margin.

Table 2.
Parameters setup for LoRa communication.
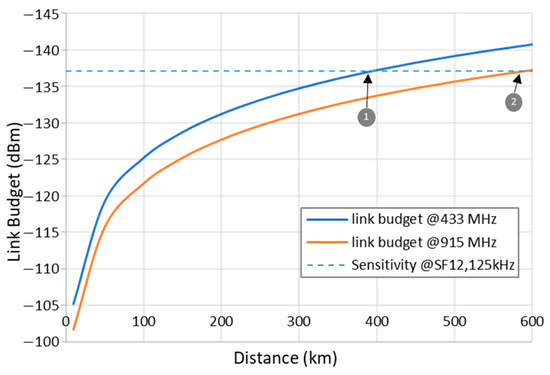
Figure 11.
Link budget of LoRa communication in different distance and frequency bands.
The dashed lines in Figure 11 represent the sensitivity at SF12, BW 125 kHz, which are the lowest settings for LoRaWAN, to evaluate the achievable communication distance. At a frequency of 433 MHz using the LoRaWAN, the maximum communication distance is 390 km (point 1). At a frequency of 915 MHz, the communication distance extends to 590 km (point 2).
From the graph in Figure 7, if the platform operates at an altitude of 20 km (H = 20 km), it provides a line of sight at 0 degrees up to a distance of 505 km. Therefore, using a frequency of 915 MHz to communicate with the picosatellite at this altitude would allow full utilization of the ground receiver’s capabilities from the moment the platform enters and exits visibility.
3.8. LoRaWAN Ground Stations Network
Currently, there is a network capable of receiving signals from LoRa transmitters distributed worldwide. This system can immediately upload data to the internet. Figure 12 shows the ground stations network of TTN [18]. When a near-space picosatellite moves over a ground station, it can maintain contact for several hours per ground station [12]. However, ocean areas still lack network coverage, which may result in a loss of contact during those periods. The system would need to wait to reestablish contact with ground stations, similar to LEO satellites when they are over the ocean.
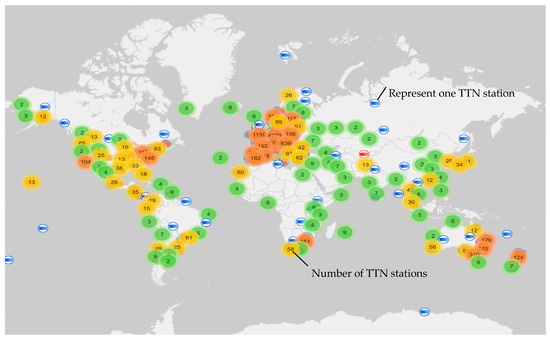
Figure 12.
The Things Network (TTN) station [18].
4. Near-Space Picosatellite Platform Design & Development
Based on the analysis of the requirements for near-space operations, this section will focus on the design and development of a picosatellite for operating in such an environment. The platform will be able to report its position status and transmit data from the experiments installed on it.
4.1. Diagram Design
The near-space picosatellite platform, as shown in the diagram in Figure 13, consists of a main system that acts as a crucial component for connecting to student projects, which can include more than one project. The main system is divided into three subsystems: the RF sector, the EPS sector, and the Sensor sector.
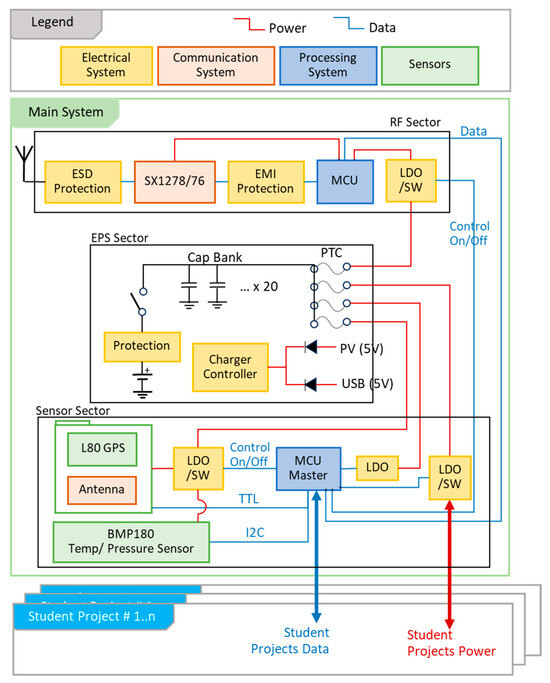
Figure 13.
Diagram of a near-space picosatellite.
- The Sensor sector includes a microcontroller unit (MCU) responsible for interfacing with various sensors, such as the GPS and temperature and air pressure sensors. It collects data from these sensors, analyzes them, and selects relevant information to transmit to the RF sector. Additionally, the MCU facilitates communication with student projects, which have predefined communication protocols for sending data to this system.
- The RF sector (Radio Frequency) has an MCU that controls data communication. This MCU communicates with the MCU of the Sensor sector to gather the collected data and transmit it via RF using the LoRa communication module SX1278/76. The system also incorporates EMI protection to prevent electromagnetic interference affecting the board and ESD protection to guard against damage from static electricity that may occur during operation.
- The EPS sector (Electrical Power System) is responsible for power management. The system is designed to receive power from both PV (photovoltaic) and USB battery chargers. It includes a battery protection circuit to prevent overcurrent and a capacitor bank to enhance output voltage stability. Additionally, it acts as a small backup battery using either multilayer ceramic chip capacitors or super capacitors with the highest possible capacity to compensate in cases where the battery may not perform optimally at low temperatures.
4.2. Printed Circuit Board
From the design of the system diagram, we developed Printed Circuit Boards (PCBs) as shown in Figure 14. Each device is described in Table 3. The PCB is designed as multiple boards connected by connectors to enable communication or power supply. On the first board, the GPS module is placed on top to allow the sensor’s antenna to receive signals from GPS satellites optimally. Each board is stacked on top of the other, working together as a system as shown in Figure 14D.
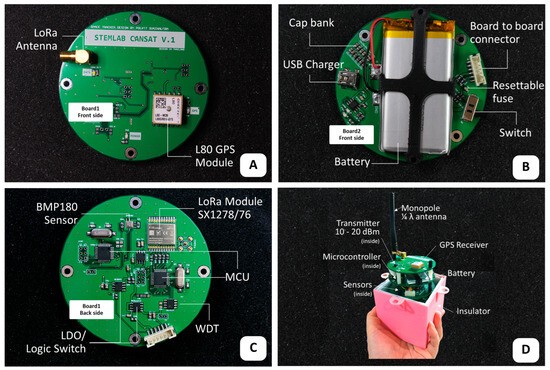
Figure 14.
The PCB boards of a near-space picosatellite (A) Front side of board1. (B) Front side of board2. (C) Back side of board1 (D) Assembly of PCBs into a near-space picosatellite.

Table 3.
Equipment on a near-space picosatellite.
For student projects, sensors can be installed directly on the stripboard PCB if they are not too large. For larger experiments, the design can include ports for connecting to the main board to transmit data, enabling data collection for the experiment as well.
4.3. Data Transmission
For the data transmission from this platform, there is a schedule that can be adjusted using a program. It consists of two parts:
- Beacon Data: These data report the ID and status of the platform’s location, including latitude, longitude, and altitude, along with other programmable statuses such as temperature and atmospheric pressure. These data are limited to a quota of 50 bytes or 50 characters and are sent every 5 min during the daytime and every 20 min during the nighttime to conserve energy.
- Data from Student Projects: These data have a quota of 100 bytes or 100 characters, which students can manage themselves. They are sent every 10 min during the daytime and every 20 min during the nighttime.
5. Power Analysis
The energy used for the near-space picosatellite platform is generated from solar power, which is harnessed through photovoltaic cells. Larger cells can generate more energy, but they also add significant weight, necessitating a larger buoyancy platform to lift it into near space. Therefore, calculating the power consumption of each subsystem of the platform allows for determining the appropriate size of the PV cells needed to generate sufficient energy. This calculation also helps in determining the size of the battery required to store energy for use during periods without sunlight.
5.1. Power Consumption
The design of both the hardware and data transmission in Section 4 allows for the analysis of the energy consumption of each device, as shown in the Table 4. This can be broken down into energy usage during daytime and nighttime, as illustrated in Figure 15. For the communication system on the platform that uses LoRa technology, the communication time depends on the amount of data, SF (Spreading Factor) settings, bandwidth, and code rate selection. This can be calculated based on the module’s specifications [14] (p. 31).

Table 4.
Power consumption on a near-space picosatellite.
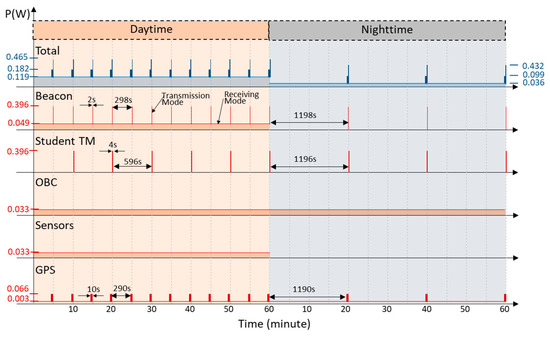
Figure 15.
Power consumption on a near-space picosatellite.
During the daytime, the platform operates by transmitting status reports of its location every 5 min. Before transmitting, the GPS system is activated to determine the position, which takes about 10 s. Then, it sends a 50-byte beacon, which takes 2 s to transmit on SF12, BW 125 kHz. Every 10 min, the platform also transmits 100 bytes of telemetry data from students, sent right after the beacon data, taking 4 s. Outside these times, the communication system remains in receiving mode. The sensor and microcontroller systems operate continuously to receive data and manage operations with other systems.
During nighttime, the system is designed to transmit signals at only one-third the rate of daytime and does not activate the receiving mode, which means it cannot receive commands from the ground. The sensor system will be turned off, but the GPS system must remain operational to provide location data for selecting the transmission frequency according to the area’s regulations. However, if the energy reserves are insufficient, the system will shut down completely and will only restart when the PV cells can generate power from sunlight.
According to Table 4, during the daytime, the system consumes 125.51 mWh, while at nighttime it consumes 38.80 mWh. However, this energy consumption design does not include the energy required to heat the battery, which is a crucial factor if a lithium battery is used. Research [23] shows that to charge a battery, it must be done at temperatures no lower than 0 °C; otherwise, it may cause permanent damage to the battery. Additionally, the capacity gradually decreases when operating at low temperatures, dropping to only 66% when the external temperature falls to −20 °C. An alternative option might be an Electric Double Layer Capacitor (EDLC), which can replace a battery for energy storage. Though heavier, EDLCs perform well at low temperatures.
The energy used to heat the battery, based on research [23], involves a heater plate wrapped around the battery, consisting of a 14.4-ohm resistor supplied with 8 V, consuming 4.44 W of power. It operates to keep the temperature from falling below −3 °C, cycling on and off between −3 °C and 0 °C. Therefore, if a battery is to be installed on the near-space picosatellite platform, the cost-effectiveness must be considered, as it would necessitate enlarging the PV and buoyancy platforms. However, the advantage is that it allows energy storage for use during nighttime.
5.2. Solar Power Generation
Although near space has solar irradiation similar to outer space, at 1361 W/m2, several factors affect the amount of energy produced by photovoltaic (PV) cells. These include the efficiency of the PV cells, the altitude at which the platform operates, the season and the duration of sunlight exposure per day, and the angle at which the sun hits the PV cells. These factors contribute to the reduction of the generated electrical energy. Considering the altitude at which the platform operates, research [24] has compared the solar density measured from actual experiments with the values calculated using the ASHRAE model [25,26], as shown in Equation (14).
When is the angle between sun and PV, coefficient is the ratio between the direct normal radiation calculated with the average value of local water vapor on a clear day and the same quantity calculated with the standard profile of water vapor in the atmosphere, is the air pressure, is the standard pressure at sea level (101,325 Pa), is solar irradiation just beyond the atmosphere, and is the coefficient that represents the total value of the entire spectrum of the atmospheric attenuation coefficient for air base (the average value is 0.171583).
From research [24], it was concluded that at altitudes below 7 km, the measured solar irradiance was less than the calculated values, possibly due to cloud cover. At altitudes above 7 km, the system was able to measure solar irradiance more efficiently, reaching up to 1300 W/m2. However, the measured values still fluctuated, as shown in the graph in Figure 16a, due to the installation of the platform as shown in Figure 16b, causing the payload to swing from the wind. Therefore, this research recommends deploying the near-space picosatellite at altitudes above 7 km, where solar radiation can be around 1300 W/m2.
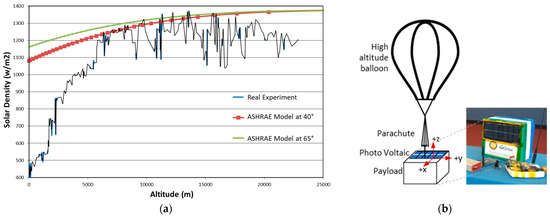
Figure 16.
(a) Solar irradiation at different altitudes compared between the calculation model and actual flight. (b) Experimental module setup.
Considering the next issue, which is the duration of sunlight exposure per day and the angle of the sun’s incidence on the PV cells, research [27] found that the number of sunlight hours per day for an HAP at an altitude of 20 km depends on the latitude. The further from the Equator, the more significant the variation in sunlight hours per season. In this study, an annual average is used, which approximates 12 h of daylight and 12 h of nighttime.
Moreover, the radiation intensity of the sun varies with the incidence angle on the PV cells. According to research [27], when the PV cells are perpendicular to the sun (0°), the radiation intensity is 100%. When the elevation angle is 60°, the intensity drops to only 5%. Therefore, this study uses data on daily solar irradiation measured in kWh/m2/day. For a platform located at the Equator, where the daytime and nighttime hours are equal, the values range from 7 to 11 kWh/m2/day, which translates to 291.67–458.33 Wh/m2.
Furthermore, there is also research [28] conducted on solar-powered airplanes flying over a 24-h period, to collect data on solar radiation. The average solar power calculated over the entire 24 h was approximately 260 W/m2. In this study, these average values will be used as the basis for calculating the PV size requirement going forward.
5.3. Minimum Size of Photo Voltaic Panels
For this research, monocrystalline PV panels with an efficiency of 25% [29] were selected to supply all systems on the near-space picosatellite. The PV panels had to generate at least 164.31 mWh of energy, which was sufficient for daytime usage of 125.51 mWh and nighttime storage of 38.80 mWh, as calculated in Section 5.1.
When considering the minimum solar irradiation values, which are 260 W/m2, it was determined that PV panels should have an area of at least 25.28 cm2 to generate enough power. From the selected PV panels in this research, which have surface dimensions of 23 mm × 42 mm (or approximately 9.66 cm2) with a weight of 2 g/piece, at least three panels were needed to meet the energy requirements.
6. Budget Analysis
Due to the design and development of the near-space picosatellite platform in this research, it can be mass-produced for activities or testing in near-space conditions. The estimated budget required is around USD 190 per unit, as detailed in Table 5. This budget is relatively low compared to actual space launches of a similar weight.

Table 5.
Budget for a near-space picosatellite.
However, launching a near-space picosatellite may require obtaining permission according to the laws and regulations of each country. Overall, conducting experiments in near space is less costly and involves less complexity compared to launching payloads to outer space, where compliance with guidelines set by rocket providers is necessary.
7. Conclusions
This research aims to create a near-space picosatellite platform operating at high altitudes and capable of flying around the world, collaborating with a wireless network receiver on the ground. Section 2 and Section 3 analyze the experimental results and data collection from previous study with HAPs, which are used to design the near-space picosatellite as described in Section 4, Section 5 and Section 6. The conclusions for the platform development are as follows:
It recommends using a super-pressure balloon as a buoyancy platform because it can operate at high altitudes from a day to several months. The picosatellite should be developed to be as lightweight and energy efficient as possible, allowing the smallest balloon to operate at high altitude.
The operational altitude for the picosatellite should be approximately 20 km or higher. This altitude is optimal because it experiences calm winds, receives full solar irradiation, allows for prolonged communication with the platform, and is above standard flight altitudes.
For the communication system, this research utilizes LoRa technology due to its high cost-effectiveness and suitability for long-distance communication. Additionally, there is an existing network of ground stations supporting IoT for signal reception. The dual-band frequencies 915/868 MHz are selected because they allow for high EIRP adjustment.
The near-space picosatellite can operate with the TTN, a LoRaWAN system. If the minimum communication settings are configured to LoRa SF12, BW 125 kHz, with a path loss of −137.03 dB, it can communicate with a picosatellite at an altitude of 20 km, providing a line of sight of 505 km. This communication will be maintained within visibility, with the picosatellite having an EIRP of +20 dBm and the ground receiver having a gain of +5 dB, with a link margin of 15 dB.
For energy design, the PV system must generate a minimum of 164.31 mWh, usable during the day and stored for nighttime. This requires a 25.28 cm2 PV panel with 25% efficiency. This research opted for small, lightweight monocrystalline PV panels. Using three of these panels meets the aforementioned requirement.
The system proposed in this research includes a design that incorporates lithium batteries. However, lithium batteries do not perform well at low temperatures, so one possible solution is to install a heater on the batteries. Another alternative is to use supercapacitors, which perform well at low temperatures but are much heavier than batteries of the same capacity.
To extend the communication duration, an Inter-HAP system could be implemented in the future, facilitating communication between HAPs. This option enables HAPs to relay data until they reach the connection to the ground receiver.
Launching experiments to near space is significantly cheaper than launching them to actual space, reducing costs from tens of thousands to just hundreds of USD.
Author Contributions
Methodology, P.S.; Resources, N.W. and S.K.; Writing—original draft, P.T. and P.S.; Writing—review & editing, P.T. and P.S.; Supervision, P.S.; Project administration, P.T. All authors have read and agreed to the published version of the manuscript.
Funding
This work was financially supported by King Mongkut’s Institute of Technology Ladkrabang (KMITL) [grant number 2567-02-18-001].
Data Availability Statement
The original contributions presented in the study are included in the article, further inquiries can be directed to the corresponding author.
Acknowledgments
We express our gratitude to KMITL for their funding and support. We also appreciate the collaboration of our team members, Wallop Thongdon-ngaw, Aniwat Plodpai, Jakkrit Iamsawat, and Chinorost Booncherm, who contributed to multiple HAP flights and the collection of valuable information presented in this paper.
Conflicts of Interest
Author Natthapong Wongphuangfuthaworn and Sureepon Kiyapaet are employed by the company Project Innovation Company Limited. The remaining authors declare that the research was conducted in the absence of any commercial or financial relationships that could be construed as a potential conflict of interest.
References
- Barbarick, C. A Look at How Technologies Devised for Space Have Revolutionized Healthcare; Space Foundation: Colorado Springs, CO, USA, 2024; Available online: https://www.spacefoundation.org/2020/03/26/a-look-at-how-technologies-devised-for-space-have-revolutionized-healthcare (accessed on 25 April 2024).
- Twiggs, R.J. The Next Generation of Innovative Space Engineers: University Students are Now Getting a Taste of Space Experience Building, Launching and Operating their Own Space Experiments with Low-Cost Picosatellites. In Proceedings of the 5th ESA International Conference on Spacecraft Guidance, Navigation and Control Systems, Frascati, Italy, 22–25 October 2002; Fletcher, K., Harris, R.A., Eds.; ESA SP-516. European Space Agency: Paris, France, 2003; p. 409. [Google Scholar]
- Bouwmeester, J.; Radu, S.; Uludağ, M.; Chronas, N.; Speretta, S.; Menicucci, A.; Gill, E. Utility and constraints of PocketQubes. CEAS Space J. 2020, 12, 573–586. [Google Scholar] [CrossRef]
- Gemignani, M.; Marcuccio, S. Dynamic Characterization of a High-Altitude Balloon during a Flight Campaign for the Detection of ISM Radio Background in the Stratosphere. Aerospace 2021, 8, 21. [Google Scholar] [CrossRef]
- Tang, J.; Pu, S.; Yu, P.; Xie, W.; Li, Y.; Hu, B. Research on Trajectory Prediction of a High-Altitude Zero-Pressure Balloon System to Assist Rapid Recovery. Aerospace 2022, 9, 622. [Google Scholar] [CrossRef]
- Akita, D.; Saito, Y.; Goto, K.; Nakashino, K.; Matsuo, T.; Matsushima, K.; Hashimoto, H.; Shimadu, S. Development of a New Super-Pressure Balloon with a Net for High-Altitude and Long-Duration Flights. Trans. Jpn. Soc. Aeronaut. Space Sci. Aerosp. Technol. Jpn. 2018, 16, 470–475. [Google Scholar] [CrossRef]
- North, G.R.; Pyle, J.A.; Zhang, F. (Eds.) Encyclopedia of Atmospheric Sciences; Elsevier: Amsterdam, The Netherlands, 2014; ISBN 978-0-12-382225-3. [Google Scholar]
- Grass, L.A. Superpressure Balloon for Constant Level Flight; Instrumentation for Geophysics and Astrophysics No. 21; Air Force Cambridge Research Laboratories, Office of Aerospace Research, United States Air Force: Hanscom Field, MA, USA, 1962. [Google Scholar]
- ISO 2533:1975; Standard Atmosphere. ISO: Geneva, Switzerland, 1975.
- QRP Labs. VE3KCL Balloon Circumnavigators. Available online: https://www.qrp-labs.com/ultimate3/ve3kcl-balloons/circumnavigators.html (accessed on 20 May 2024).
- National Oceanic and Atmospheric Administration (NOAA). HYSPLIT—Hybrid Single Particle Lagrangian Integrated Trajectory Model. Available online: https://www.ready.noaa.gov/HYSPLIT.php (accessed on 10 May 2024).
- Techavijit, P.; Chivapreecha, S.; Sukchalerm, P.; Wongphuangfuthaworn, N. Suitable altitude for long-operated communication high altitude balloon with experimental flights. In Proceedings of the 2016 8th International Conference on Knowledge and Smart Technology (KST), Chiang Mai, Thailand, 3–6 February 2016; pp. 169–174. [Google Scholar]
- Taylor, J.; Walker, B. K1JT: WSPRing Around the World. Amateur Radio, 30 November 2010; 30–32. [Google Scholar]
- Semtech Corporation. SX1276/77/78/79: Low Power Long Range Transceiver. Available online: https://cdn-shop.adafruit.com/product-files/3179/sx1276_77_78_79.pdf (accessed on 10 May 2024).
- TinyGS. Available online: https://tinygs.com/ (accessed on 10 May 2024).
- The APRS Working Group. APRS Protocol Reference. Document Version: 1.0.13; Tucson Amateur Packet Radio Corp: Tucson, AZ, USA, 29 August 2000; ISBN 0-9644707-6-4. [Google Scholar]
- Nootropic Design. Swarm vs. Iridium for Satellite IoT. Available online: https://nootropicdesign.com/projectlab/2022/07/30/swarm-vs-iridium-for-satellite-iot/ (accessed on 10 May 2024).
- The Things Network. Available online: https://www.thethingsnetwork.org/ (accessed on 10 May 2024).
- Cakaj, S.; Kamo, B.; Kolici, V.; Shurdi, O. The Range and Horizon Plane Simulation for Ground Stations of Low Earth Orbiting (LEO) Satellites. Int. J. Commun. Netw. Syst. Sci. 2011, 4, 585–589. [Google Scholar] [CrossRef]
- Techavijit, P.; Sukchalerm, P. Communication Link Margin Design for Picosatellite operating on HAP. In Proceedings of the 2024 10th International Conference on Applied System Innovation (ICASI), Kyoto, Japan, 17–21 April 2024; pp. 259–261. [Google Scholar]
- Bobkov, I.; Rolich, A.; Denisova, M.; Voskov, L. Study of LoRa Performance at 433 MHz and 868 MHz Bands Inside a Multistory Building. In Proceedings of the 2020 Moscow Workshop on Electronic and Networking Technologies (MWENT), Moscow, Russia, 11–13 March 2020; pp. 1–6. [Google Scholar]
- Semtech Corporation. LoRa Technology: Proven and Growing. 2023. Available online: https://www.semtech.fr/uploads/design-support/SEMTECH_LORA_PG_2023.pdf (accessed on 14 May 2024).
- Techavijit, P.; Sukchalerm, P.; Wongphuangfuthaworn, N.; Iamsawat, J. Power Requirements for Battery Maintenance and Temperature Profile on High Altitude Platform. In Proceedings of the 2024 10th International Conference on Applied System Innovation (ICASI), Kyoto, Japan, 17–21 April 2024; pp. 1–3. [Google Scholar]
- Techavijit, P.; Wongphuangfuthaworn, N.; Sukchalerm, P.; Plodpai, A. Potential of Photovoltaic on Small Stratospheric Satellite in Real-World Experiment. In Proceedings of the 2023 17th International Conference on Engineering of Modern Electric Systems (EMES), Oradea, Romania, 9–10 June 2023; pp. 1–4. [Google Scholar]
- ASHRAE. ASHRAE Handbook of Fundamentals; American Society of Heating Refrigeration and Air Conditioning Engineers, Inc.: Peachtree Corners, GA, USA, 1985; Volume 42, pp. 1–27. [Google Scholar]
- Dumas, A.; Anzillotti, S.; Madonia, M.; Trancossi, M. Effects of Altitude on Photovoltaic Production of hydrogen. Conf. Energy Sustain. 2011, 54686, 1365–1374. [Google Scholar]
- Arum, S.C.; Grace, D.; Mitchell, P.D.; Zakaria, M.D.; Morozs, N. Energy Management of Solar-Powered Aircraft-Based High Altitude Platform for Wireless Communications. Electronics 2020, 9, 179. [Google Scholar] [CrossRef]
- Ross, H. Fly Around the World with a Solar Powered Airplane. In Proceedings of the 26th Congress of ICAS and 8th AIAA ATIO, Anchorage, AK, USA, 14–19 September 2008. [Google Scholar]
- Anysolar. KXOB201K04TF IXOLAR High Efficiency SolarBIT Data Sheet. 2021. Available online: https://waf-e.dubudisk.com/anysolar.dubuplus.com/techsupport@anysolar.biz/O18Azeg/DubuDisk/www/Gen3/KXOB201K04TF%20%20DATA%20SHEET%2020210127.pdf (accessed on 7 May 2024).
Disclaimer/Publisher’s Note: The statements, opinions and data contained in all publications are solely those of the individual author(s) and contributor(s) and not of MDPI and/or the editor(s). MDPI and/or the editor(s) disclaim responsibility for any injury to people or property resulting from any ideas, methods, instructions or products referred to in the content. |
© 2024 by the authors. Licensee MDPI, Basel, Switzerland. This article is an open access article distributed under the terms and conditions of the Creative Commons Attribution (CC BY) license (https://creativecommons.org/licenses/by/4.0/).