Abstract
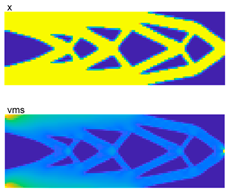
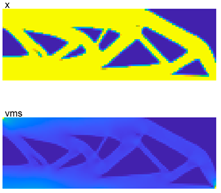
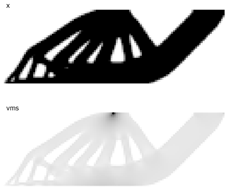
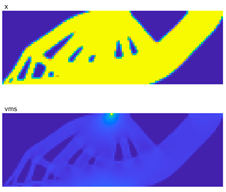
This research proposes an efficient technique for reliability-based topology optimization (RBTO), which deals with uncertainty and employs proportional topology optimization (PTO) to achieve the optimal reliability structure. The recent technique, called proportional topology optimization for reliability (PTOr), uses Latin hypercube sampling (LHS) for uncertainty quantification. The difficulty of the double-loop nested problem in uncertainty quantification (UQ) with LHS can be alleviated by the power of PTO, enabling RBTO to be performed easily. The rigorous advantage of PTOr is its ability to accomplish topology optimization (TO) without gradient information, making it faster than TO with evolutionary algorithms. Particularly, for reliability-based topology design, evolutionary techniques often fail to achieve satisfactory results compared to gradient-based techniques. Unlike recent PTOr advancement, which enhances the RBTO performance, this achievement was previously unattainable. Test problems, including an aircraft pylon, reveal its performances. Furthermore, the proposed efficient framework facilitates easy integration with other uncertainty quantification techniques, increasing its performance in uncertainty quantification. Lastly, this research provides computer programs for the newcomer studying cutting-edge knowledge in engineering design, including UQ, TO, and RBTO, in a simple manner.
1. Introduction
Topology optimization (TO) is an efficient design tool for a variety of engineering applications. It has been applied in the synthesis of compliance mechanisms []. Much research has been conducted related to this design technology, as mentioned in []. The design process has been carried out using an optimization algorithm to solve the problem and finite element (FE) analysis for function evaluation. The most well-known approaches for topology optimization are solid isotropic material with penalization (SIMP) [], the homogenization method [], and the ground structure approach [,,]. The method based on ground structure approach separates the design domain into many small elements, including truss, frame, and panel, and uses the optimizer for discarding or retaining each element. The most preferable optimizers for the topological design problem are gradient-based topology optimization (GBTO), such as the optimality criteria method (OCM) [], the method of moving asymptotes (MMA) [], and sequential linear programming (SLP) []. There have been attempts to use evolutionary algorithms (EAs) for this type of optimization problem [], and it was found that their search performances are incomparable to the gradient-based methods. It is called non-gradient based topology optimization (NGBTO). The cause may be that in topology optimization problems, there are a great many design variables. Since the EAs base their searching strategies partially on randomization, they are not powerful enough when trying to solve such a large-scale design problem. As a result, a number of numerical strategies have been developed and employed so that the search performance of EAs for both single- and multi-objective topology optimizations (MOTO) is improved, as shown in some studies [,,,]. An approximate density distribution (ADD) technique, as presented in [,], was found to have enough power and was effective for single objective design cases. This method is based on the ground structure approach. This technique also gave very good results when solving a multi-objective problem []. The researchers used a simple idea for reducing a number of design variables while only slightly affecting the topological design domain. This technique has also been used for the suppression of checkerboard patterns on the results of topologies. From various numerical investigations [,,], it has been shown that the mutation-based optimization methods such as simulated annealing (SA) [] are more efficient than other EAs when solving large-scale topological design problems with single objective functions. Furthermore, it has been found that multi-objective population-based incremental learning is more effective than other MOEAs (multi-objective evolution algorithms) when solving MOTO problems []. A multi-grid ground element is an alternative technique to improve the TO results []. The results obtained from using such methods can increase comparably to the optimum results from the gradient-based approaches, although they still require more function evaluations.
The performance of NGBTO is comparable to the GBTO, as initiated by the work of Guirguis and Aly []. This technique is within a group of non-gradient level-set methods for solving structural topology problems, expected to solve the checkerboard pattern and avoid dependence on the objective value, similar to other techniques in the same group. Moreover, the multi-objective TO, called the graphics processing unit (GPU), has been proposed to address infeasible structures []. Work by the same author [] has been extended to solve coarse meshing [,]. Later, the upcoming moving morphable component (MMC) method, part of the low-dimensional explicit-based TO group, was subjected to comparative studies with almost variant MMCs, as seen in []. Very recent work in the non-gradient-based field has proposed to improve the checkerboard problem by checking the connectivity of neighboring elements and penalizing it []. A new TO named proportional topology optimization (PTO) has been proposed to increase its performance, making it more comparable to GBTO []. Its experimental results provide comparable efficiency and accuracy with the GBTO, but it is simpler. The variants of this technique have been extended to increase its performance, and applications can be seen more in [,,].
From the previous literature review, uncertainty due to uncertain load and integrity of material needs to be considered in TO, which can make it less feasible in practice []. In solving, it has two main strategies to combine uncertainties into TO: reliability-based topology optimization (RBTO) [,] and robust topology optimization (RTO) []. The first technique is expected to test the performance functions (constraints in optimization problems) to find the failure probability or reliability of the system. The reliability test will be performed until reaching the optimum result, and expected reliability can be achieved [,]. It can be performed in single- [,] and multi-objective optimization []. The second technique has the goal of optimum design with less variation when withstanding uncertainties simultaneously. Such system design is called the robustness design []. Both methods are based on uncertainty quantification (UQ), which can be divided into two groups: probabilistic (PUQ) [] or non-probabilistic (NPUQ) models [,,,]. Both techniques have advantages and disadvantages. The probabilistic method requires statistical calculation; otherwise, the second one operates without statistical analysis. One of the most famous probabilistic techniques, called Monte Carlo simulation (MCS) [,], is computationally intensive and widely applied to handle various kinds of uncertainty, including large random variables, different distribution types, and highly nonlinear systems [,,]. Subsequently, the first-order reliability method (FORM) and the second-order reliability method (SORM) were developed to reduce computational time by approximating the performance function to the first order and the second moment, respectively. Very recently, an improvement of the technique called the active kriging algorithm with conjugate first-order reliability method (AK-CFORM) has been developed to enhance the robustness of FORM []. The former represents progress, but it needs more computation time (requires higher precision) in the analysis of the statistical distribution of uncertainties. In opposition, the latter is expected to increase computation performance due to non-statistic calculation. Unfortunately, such well-known techniques in this group, like anti-optimization [] and the fuzzy set method [,,,], can yield moderate conservative solutions with a computational time burden. The fuzzy set model is an alternative choice to collect the uncertainties into RBTO by using a level set to softly separate between the members and nonmembers of the set. An acceptable solution can be found from this technique. Unfortunately, RBTO with this technique is rather complex in analysis due to the combination causing a triple-loop nested problem, including the optimization loop and the double loop nested from UQ. Later, the target performance-based design approach was proposed to alleviate the triple loop, which would be reduced to the double-loop nested problem [,]. This technique brings hope in regard to solving RBTO with less time consumption []. A disadvantage is that this technique needs expert opinions to select the level cut or membership level into RBTO. From the literature review, RBTO needed more choices for alleviating the complexity in analysis in both TO and UQ, especially for a new edge of additive manufacturing (AM) [,]. At present, TO design can reach the production phase with AM technology, but uncertainties from manufacturing factors, such as random defects, voids [], local damage [], etc., must be included in the design. Local damage failure and a robust worst-case approach bring fail-safe topology optimization (FSTO) []. The FSTO can be conducted with the level set method (LSM) [] and moving morphable components (MMCs) [,]. A question may occur for the combination of GBTO and PUQ or NPUQ due to its high computation time consumption and complexity. The alternative choice in solving is the implementation of NGBTO (PTO) with PUQ, as mentioned in the truss structure under load uncertainty []. Using the gradient-free PTO with the even complexity of UQ, the RBDO of the truss structure can be solved efficiently without complexity.
Unfortunately, RBTO with PTO and PUQ is not available for newcomers to access its code worldwide, which is our expectation of the presented research. This paper proposes an efficient technique for reliability-based topology optimization (RBTO), driven by uncertainty (LHS) and proportional topology optimization (PTO), to achieve the reliability optimum structure. The recent technique is called proportional topology optimization for reliability (PTOr). The performances of this technique are tested with the test problems and validated with MCS. The computer codes are provided in this paper for the newcomer to enter this area and extend their knowledge to your field in the future.
The entirety of this paper is divided into four sections: the topology optimization problem, proportional topology optimization (PTO), and proportional topology optimization for reliability (PTOr) with uncertainty quantification (UQ), numerical examples and results, and conclusions. The methodology is outlined in two sections. Section 2 presents all the background theories, including the topology optimization problem. In Section 3, PTO, novel PTOr, and UQ techniques are proposed. Numerical examples, results, and validation results are presented in Section 4, while conclusions are drawn in the final section of the paper.
2. Topology Optimization Problem
Topology design is an important part of the design process and is often referred to as the conceptual design stage. Initial data from the user, such as loads, surroundings, original schemes, and developments from the past to the present, are prepared for the designer to compare in decision-making. TO design becomes a tool for a designer with less experience in sketching possible shapes of the product. This technique derives from mathematics rather than skill, which can help newcomers who have less experience make decisions in design without mistakes. The original topology optimization problem can be formulated as a mathematical problem, aiming to search for an optimal structural scheme within a pre-specified domain []. The structure is drawn from presented elements (solid = 1) from the discrete design domain, while the removed element (empty = 0) is void in the structure. The single-objective TO problem can be adapted from the multi-objective topology optimization problem, as shown below:
Min fi (ρ) i = 1,…,M
Subject to
where i > 1 is used for a multiobjective problem, while i = 1 is used for a single objective one, and ρ is the thickness of finite elements ranging between the lower limit (ρl) and the upper limit (ρu). [ρl,ρu] = [0.001, 1], 0.001 is used instead of 0 to avoid the singularity of global stiffness K. K, U, and F are the global stiffness, displacement vector, and force vector applied to the structure, respectively, which derive from the finite element method (FEM). In the engineering design of solid mechanics, the previous problem needs an additional constraint for stress [,,,]. The single TO with a stress constraint can be changed to:
KU = F
gj(ρ) ≤ 0 j = 1, 2,…, N
0 <ρl ≤ ρ ≤ ρu
gj(ρ) ≤ 0 j = 1, 2,…, N
0 <ρl ≤ ρ ≤ ρu
Min f(ρ)
Subject to
where σ is the stress of each element, and σa is the allowable stress. In engineering design, the allowable stress must be derived from ultimate stress/yield stress divided by the safety factor. The safety factor (SF) is used to compensate for unknowns of the designer to uncertain conditions in the design problem. It depends on the load type, material, experience of the decision-maker, etc. The use of a high SF causes over-safety and a high price, which must be considered in a compromise. Those problems lead to uncertainty quantification (UQ) for testing the reliability of the system rather than using SF, as found in the past. The UQ has been used for testing mechanical components, as shown in [], and the computer code is provided for newcomers, as presented in []. The reasons causing the problem (2) to be rearranged to an RBTO problem are:
KU = F
g1(ρ) = σ − σa ≤ 0
0 < ρl ≤ ρ ≤ ρu
g1(ρ) = σ − σa ≤ 0
0 < ρl ≤ ρ ≤ ρu
Min f(ρ,a)
Subject to
where Prb is the probability, a is the random uncertainty vector, and pf is the probability of failure. The TO problem with a stress constraint is more sensitive to material properties [] and load as mentioned in []. The probability Equation in (3) is used to guarantee that the probability of stress constraint must fail less than the probability of failure due to the uncertainty. To avoid structure failure due to stress in the case of the plane stress problem, in this study, the equivalent stress is presented in the form of Von Mises equivalent stress [], expressed as:
where are the stress components in the x and y directions, respectively, and is the shear stress.
KU = F
Prb(g1 (ρ, a) > 0) ≤ pf
0 < ρ l ≤ ρ ≤ ρ u
Prb(g1 (ρ, a) > 0) ≤ pf
0 < ρ l ≤ ρ ≤ ρ u
3. Proportional Topology Optimization for Reliability (PTOr)
Proportional topology optimization (PTO) is the idea of forming a structure by removing and adding materials corresponding to stress or compliance []. In the first part, the diagram and details of the original PTO will be presented to provide the background. The highlight is in the rear part for the details of the new PTO, which is driven with reliability (PTOr). The TO problem is presented in (2); it expects to the minimize volume fraction or materials subject to the stress constraint. The limit of stress is the allowable stress that has been detailed in the previous part. The PTO has a flow diagram, as presented in Figure 1. The first step, problem setups, starts with the discretization of the design domain, preparing the FEA, load, boundary condition, density filter, and assembles. All the initial data is prepared only once and used all along the process except some random variables (uncertainties), which will appear in the part of PTOr as shown in Figure 2. The experiment examples are dependent on the adaptation of load and boundary conditions, which will be assigned at this stage. The optimizer performs to find the most optimum structure for the iteration; the Young’s modulus (E) of each element is calculated through its density (ρ) with the SIMP method [] as follows:
where E0 is the Young’s modulus, Emin is the avoidance singularity Young’s modulus (10−9), and p = 3 is assigned for the penalty coefficient. To protect against checkerboard and mesh-dependence problems in the TO result, the density filter is used to tackle that []. The density (ρ) of each element is calculated as follows:
where rij is the distance between elements i and j, wij is the filtering weight of elements i and j, and r0 is the filter radius. In this study, the filter radius is assigned to 1.5, which is expected to include enough neighboring background elements. After the setup is completed, the iteration step will be started. First, if the force vector F and the global stiffness K are known, the displacement U can be solved. Then, the stress and strain relation can be found using Hooke’s law relation. In the TO problem, the constraint is in the form of the maximum von Misses stress (σvms), which can be derived using (Equation (4)). Then, the satisfaction with the constraint is tested. The analysis will be terminated when the difference of the convergence criterion (σvms−σa) is less than 0.01. Otherwise, the analysis for adding and removing material from the design domain is performed. The addition is in the sense of σvms > σa, while removing is in the sense of the opposite sign, as shown here:
where TM is the target material, CM is the current material, and MM is the material move. In this paper, MM is assigned to 0.001 times the number of background elements. Next, the TM is iteratively distributed on the design domain, which is proportionally distributed to each element according to its σvms:
where is the optimum element density, RM = TM − AM is the remaining material, AM = is the actual material, n is the all element number, and q is the proportional exponent. In this loop, the termination criterion is RM < 0.001. Inside of this loop, the new density is a linear combination between in the present step and in the previous step. The update scheme is:
where α is the weighting coefficient, and 0.5 is used for the weighting.
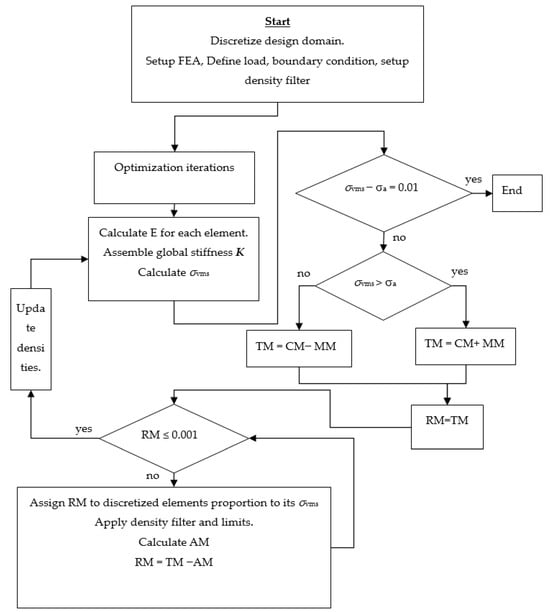
Figure 1.
Diagram for the original PTOs.
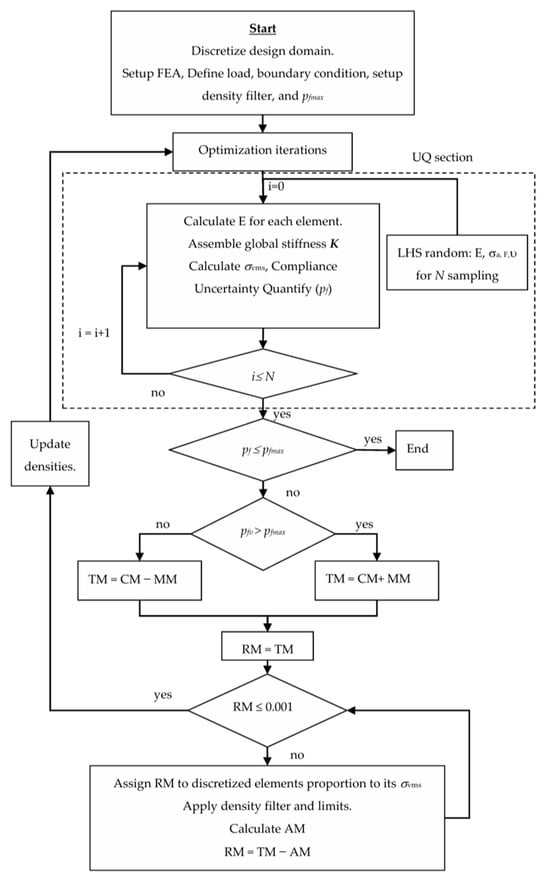
Figure 2.
Diagram of PTOr.
3.1. Uncertainty Quantification with Latin Hypercube Sampling (LHS)
Uncertainty can disrupt all optimum TO results, making it impractical to use. That is why uncertainty quantification is necessary to include in TO design. Uncertainty can be categorized as variation caused by an unknown factor resulting from a lack of knowledge (epistemic) or inherent randomness in nature (aleatory). In the past, engineers attempted to manage uncertainty by incorporating it into a safety factor (SF) that requires assessment, knowledge, and experience. Choosing SF values can pose difficulties for novice engineers who lack experience. One alternative choice is exploring the replacement of the SF with reliability assurance. Reliability values (R) can be derived from probability distributions. The relationship between SF and R has been demonstrated by Mischke [] as an improvement [,]. Additionally, the SF technique has been proposed for reliability-based design optimization to reduce the complexity involved in reliability analysis []. Over-designed products can arise when engineers choose excessively high safety factors. This is why reliability analysis is needed. UQ can be classified into two groups, but the difficulty due to the triple-loop nested problem makes the probabilistic group more popular than the non-probabilistic group. In general, the probabilistic group is the most important and serves as the fundamental basis for newcomers. Although the probabilistic group requires more precise data compared to the second group, it provides a solid foundation for understanding other UQ techniques such as the Monte Carlo simulation (MCS), the first-order reliability method (FORM), the second-order reliability method (SORM), and the first order and second-moment (FOSM) [,]. Furthermore, Latin hypercube sampling (LHS) and its adaptation have been introduced to enhance the performance of the MCS technique [,]. The traditional efficiency LHS is one choice to incorporate into high-performance PTOs to unveil the reliability analysis. The prior UQ entails subprocesses such as sampling random variables and conducting numerical experiments. Subsequently, the statistical analysis and output are performed. This difficulty often acts as an obstacle for newcomers who are trying to understand the underlying principles. All knowledge will appear in Figure 3 alongside a very well-compact MATLAB code (Appendix A).
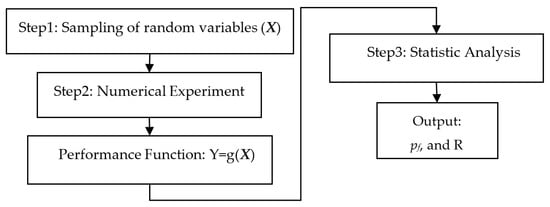
Figure 3.
Flow diagram of the LHS technique.
For the first step, the large number of random sampling variables (X) required by MCS, at least 104 for each variable, leads to inefficient computational time consumption. To address this issue without compromising efficiency in uncertainty quantification, an efficient technique called LHS is employed. LHS uses stratified random sampling instead of the traditional sampling methods used in MCS. The main expectation of LHS is to reduce spurious correlations that may result in unnecessary random variables in MCS []. This technique ensures that all portions of the sample space are adequately sampled, meaning that random variables are distributed across all intervals. The random sampling required by LHS has been proven []; at least 103 for each variable makes it more efficient than MCS. The algorithm is presented in Table 1, with this process allowing for the construction of a vector of random variables. LHS works by supplying random variables to the UQ part as shown in Figure 2.

Table 1.
Pseudo-Code of LHS.
In the second step of numerical experiments, stress calculation still performs iteratively N times for testing the performance function g1 in (2). This process adds a loop, causing the PTOr to become a double-loop nested problem. It can be expected that will result in increased computational time burden in case of TO based on gradient. Otherwise, PTO can alleviate the problem due to its lower complexity.
3.2. PTOr
The main addition part of PTOr has been presented in the previous section and Figure 2. The UQ requires additional steps before the statistical analysis. Typically, failure can be predicted through the performance function g. Simple statistical analyses such as probability of failure and reliability are derived from the output Y obtained in the previous step. In general, the failure condition is defined as g > 0. The probability of failure pf can be expressed as:
where a is the random variable vector.
pf = Prb(g1(ρ, a) > 0)
The probability of failure can be approximated as:
where Nf is the number of failures, and N is the total number of output Y.
Hence, I represents the failure indicator as specified below:
The probability of failure can be used to calculate the reliability (R) by:
The same TO problem constraint is in form of the maximum von Misses stress (σvms) can be changed to the probability of failure using (11). Then, the analysis will be terminated when it satisfies the termination criterion (pf ≤ pfmax). Otherwise, analysis for adding and removing material from the design domain is performed. Addition occurs when pfv > pfmax, while removal occurs when the opposite sign condition is met. The remaining loop is similar to the original PTOs. The new PTOr is driven by the probability of failure, which can preserve the aspect reliability and the efficiency of the original PTO.
4. Numerical Examples
4.1. MATLAB Programs
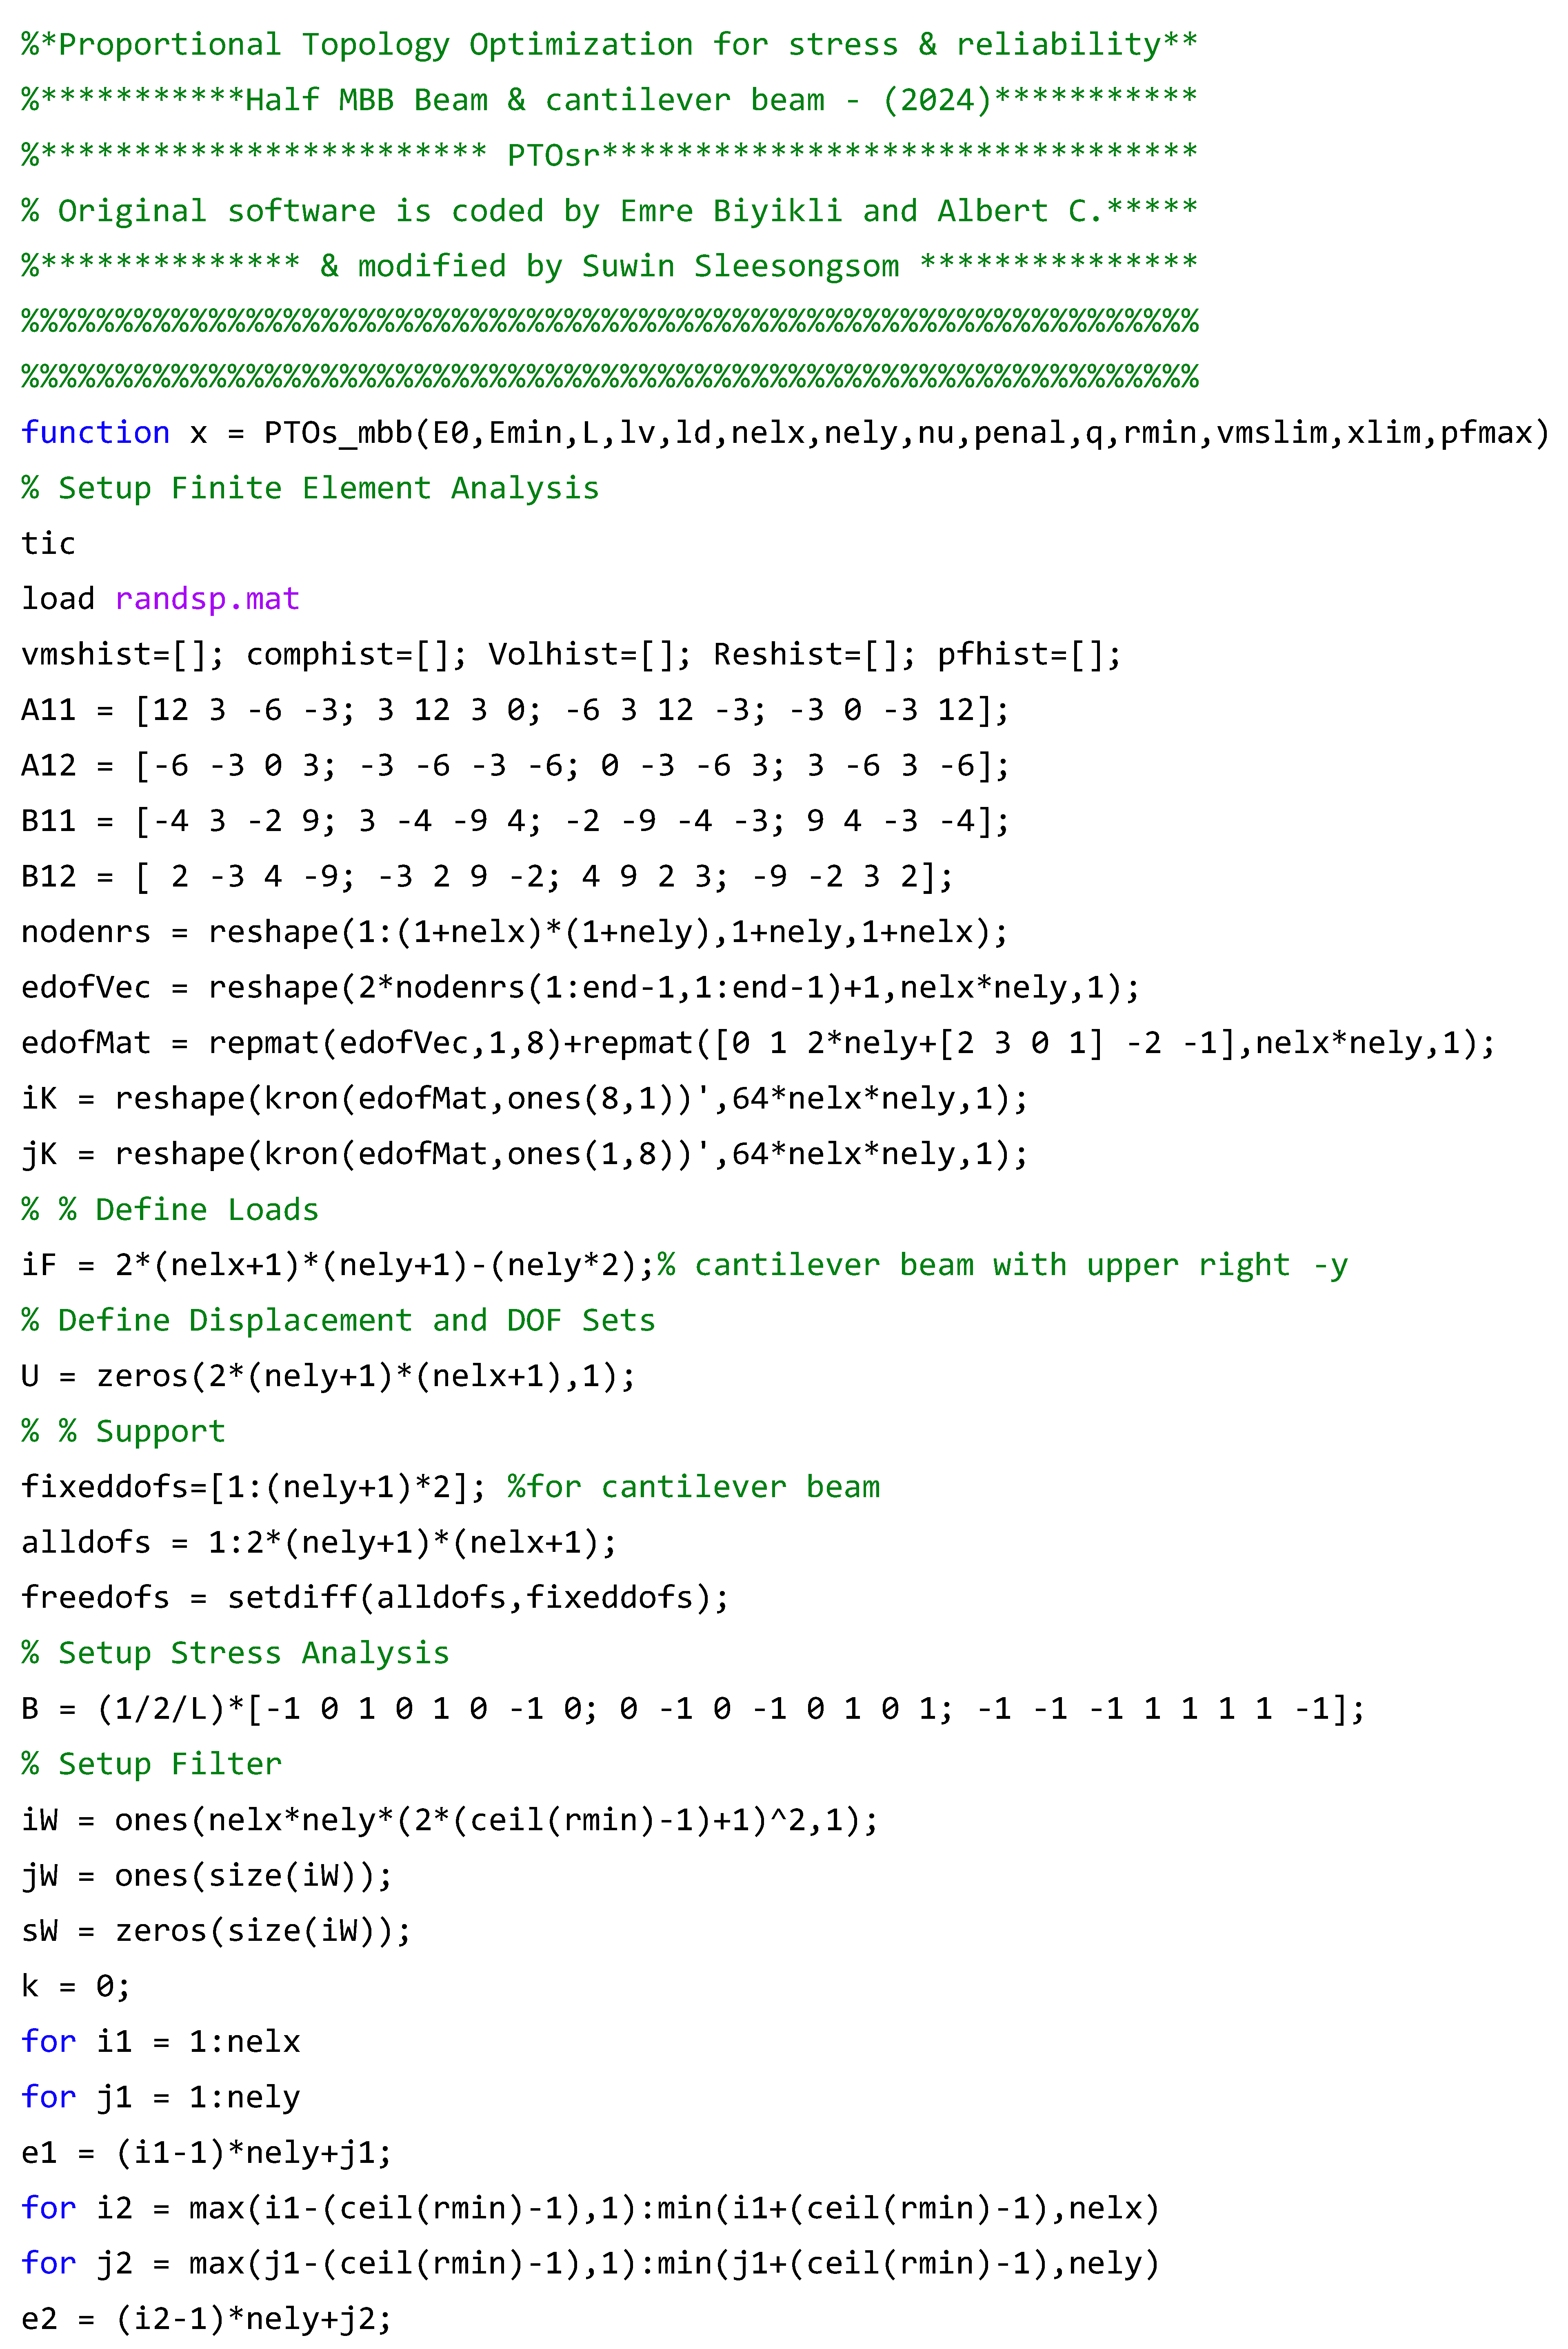
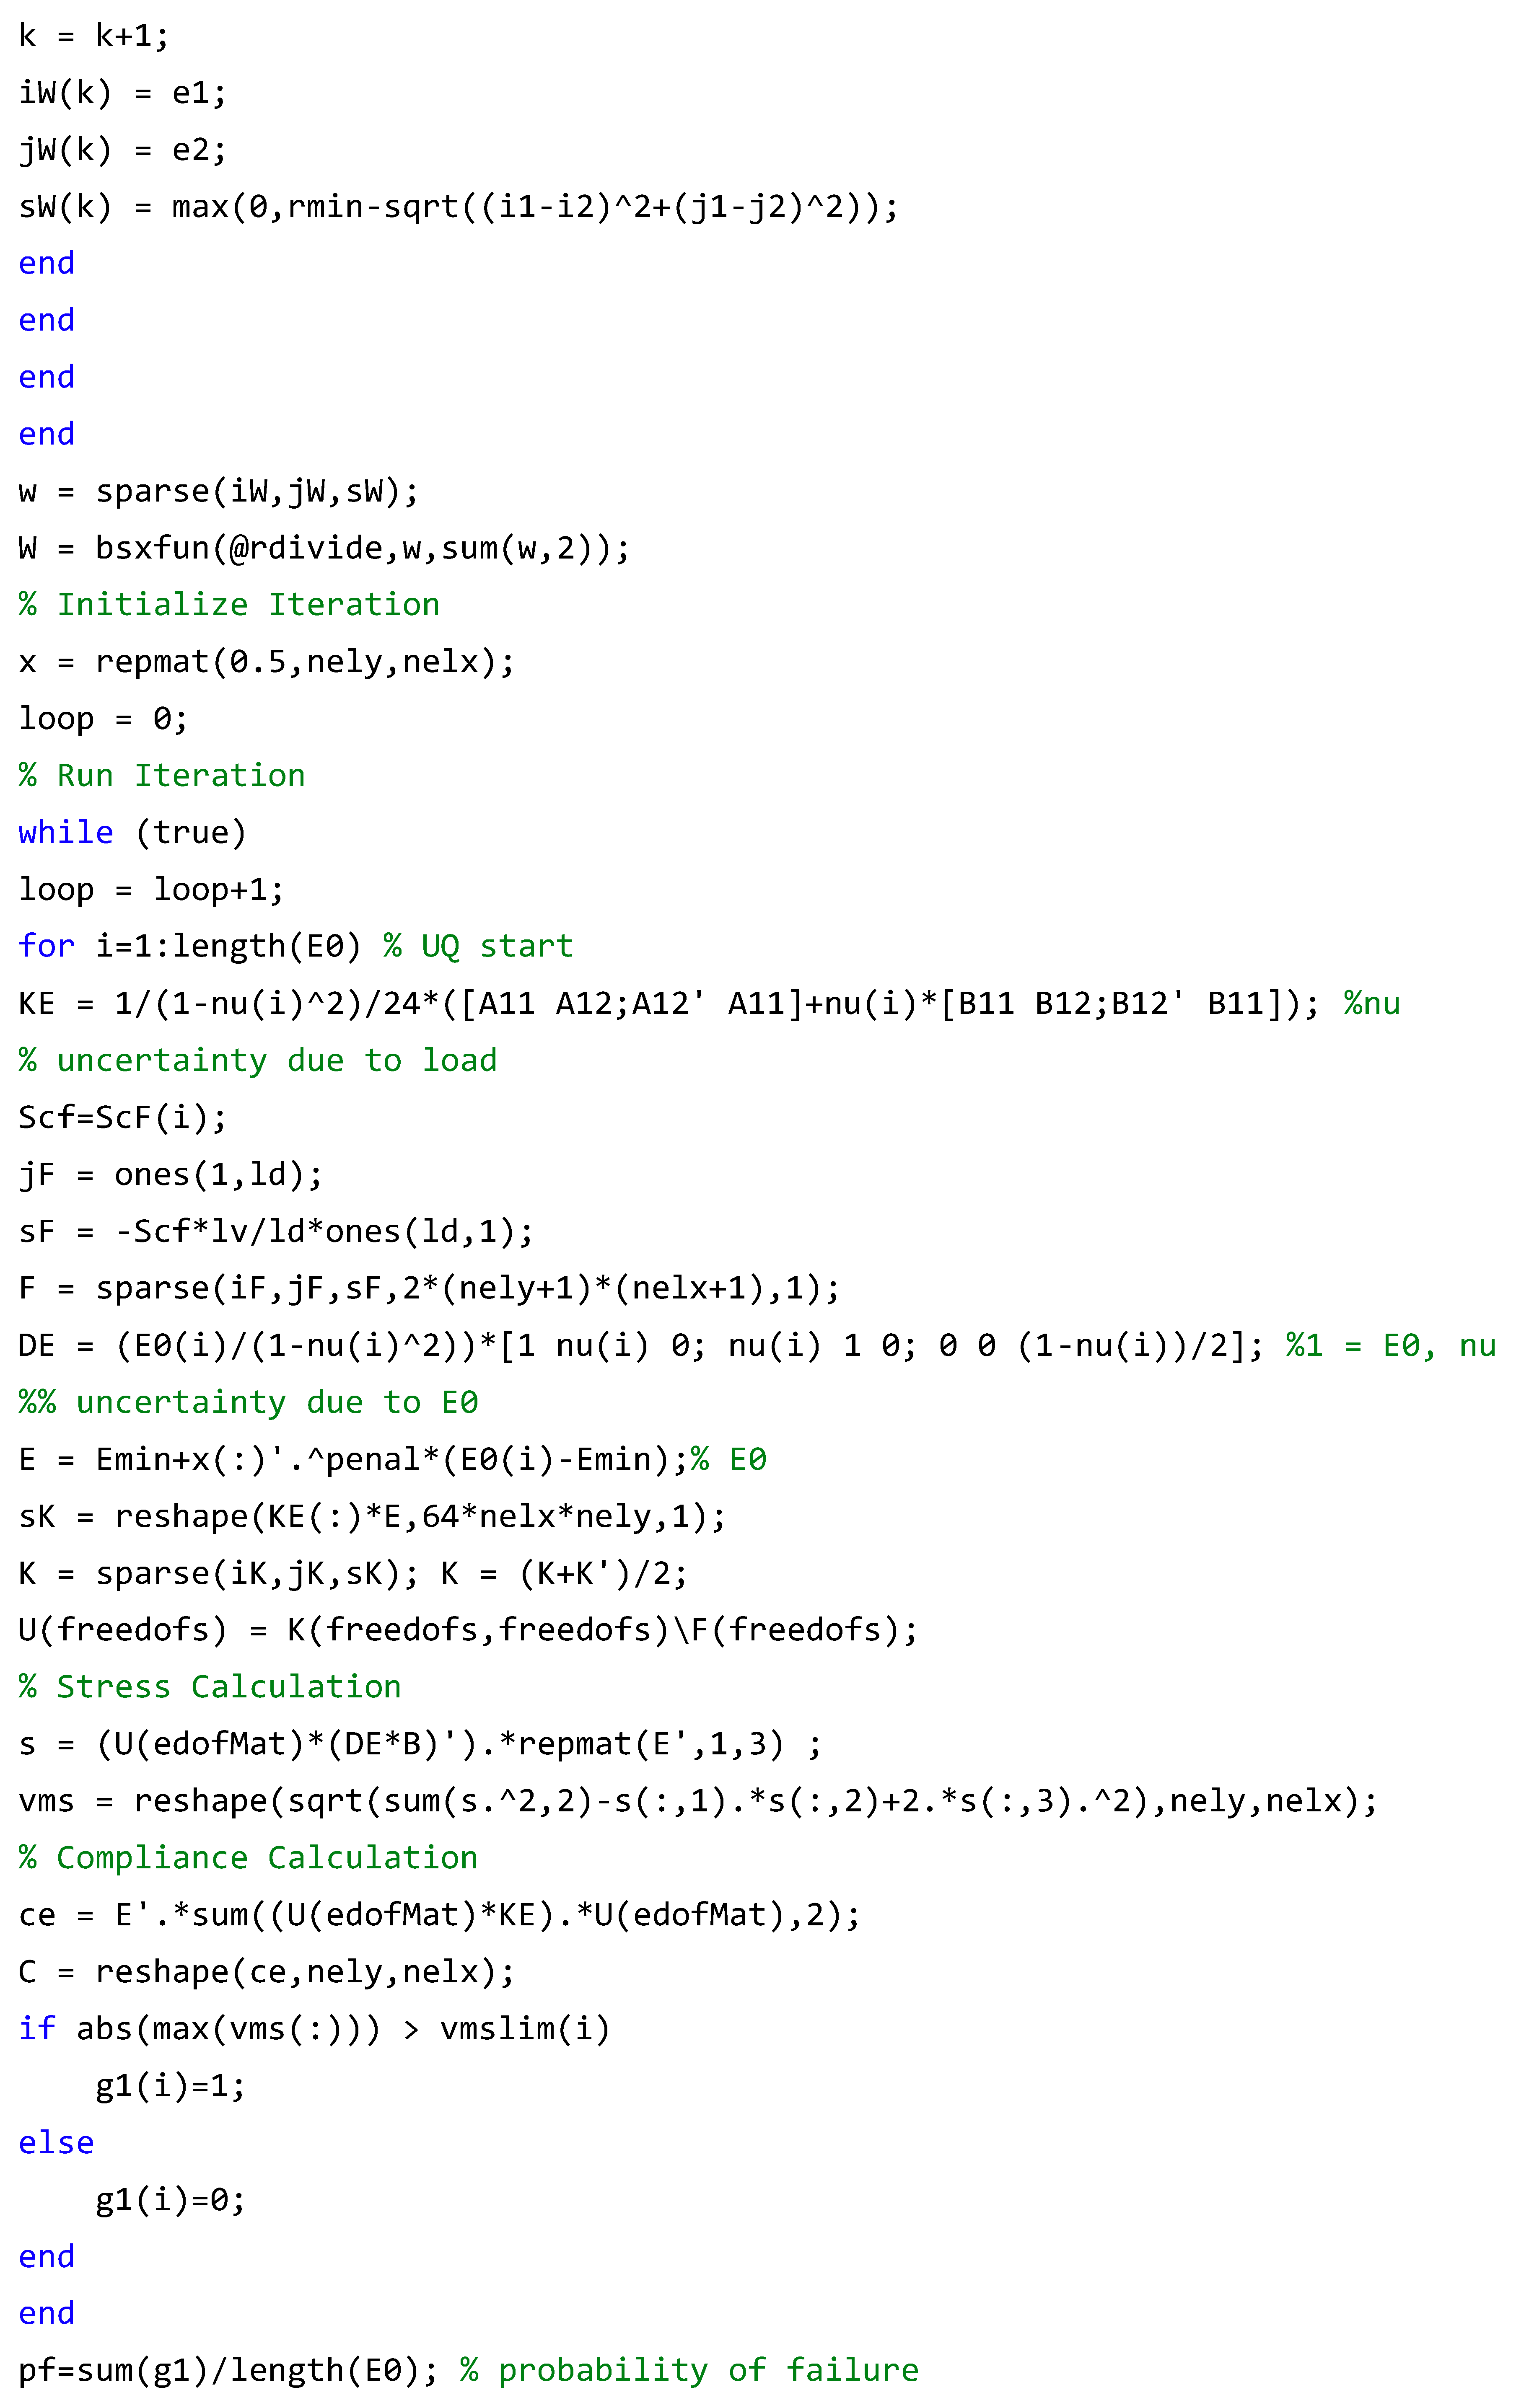
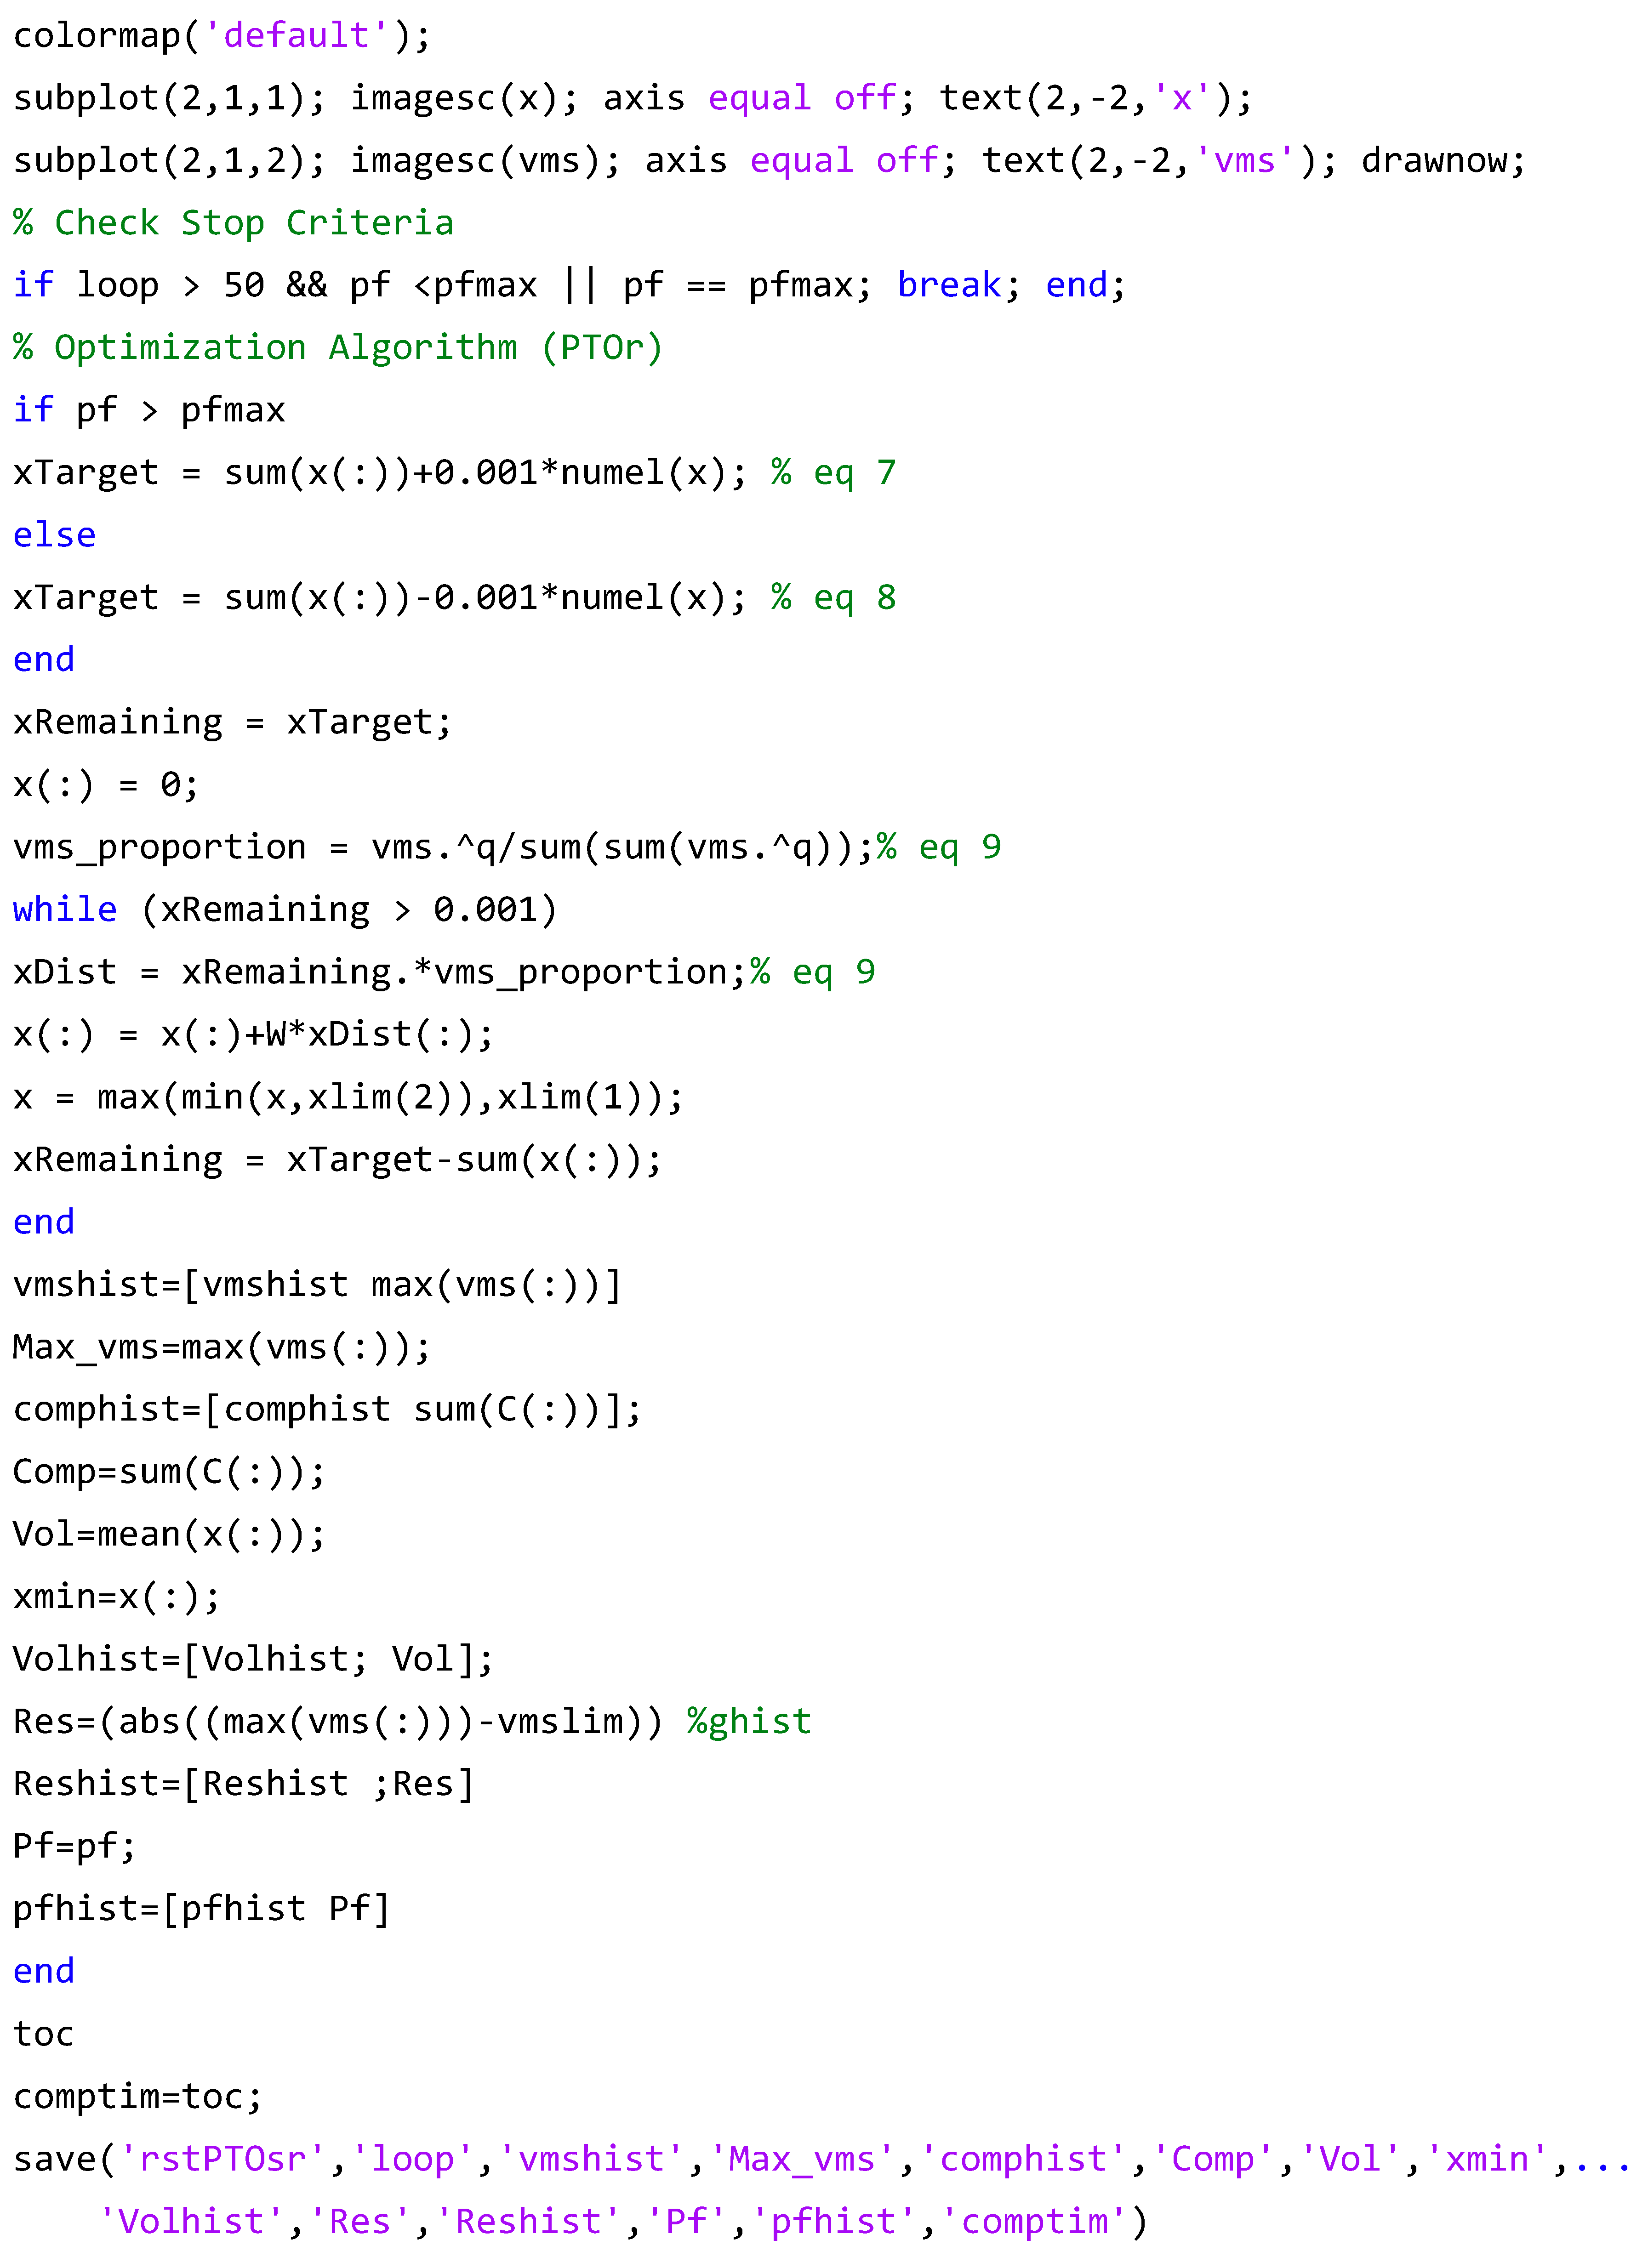
The MATLAB codes provided in this research are presented to facilitate the implementation of combined UQ. They require the modification of boundaries and loads according to the test problems (five cases). The test cases are divided into three groups: cantilever beam, MBB beam, and aircraft pylon. All the provided code is adapted from Biyikli and To [] by incorporating the UQ part, as presented in the previous section. The computer code explanation presents step-by-step instructions for using the code. The difference in explanation from the previous section follows the UQ process, which starts with LHS and then progresses to RBTO with PTOr. Readers can extend the provided example codes to other test cases and their own work with a basic background in MATLAB programming. Each program can be executed using the menu bar to run the program.
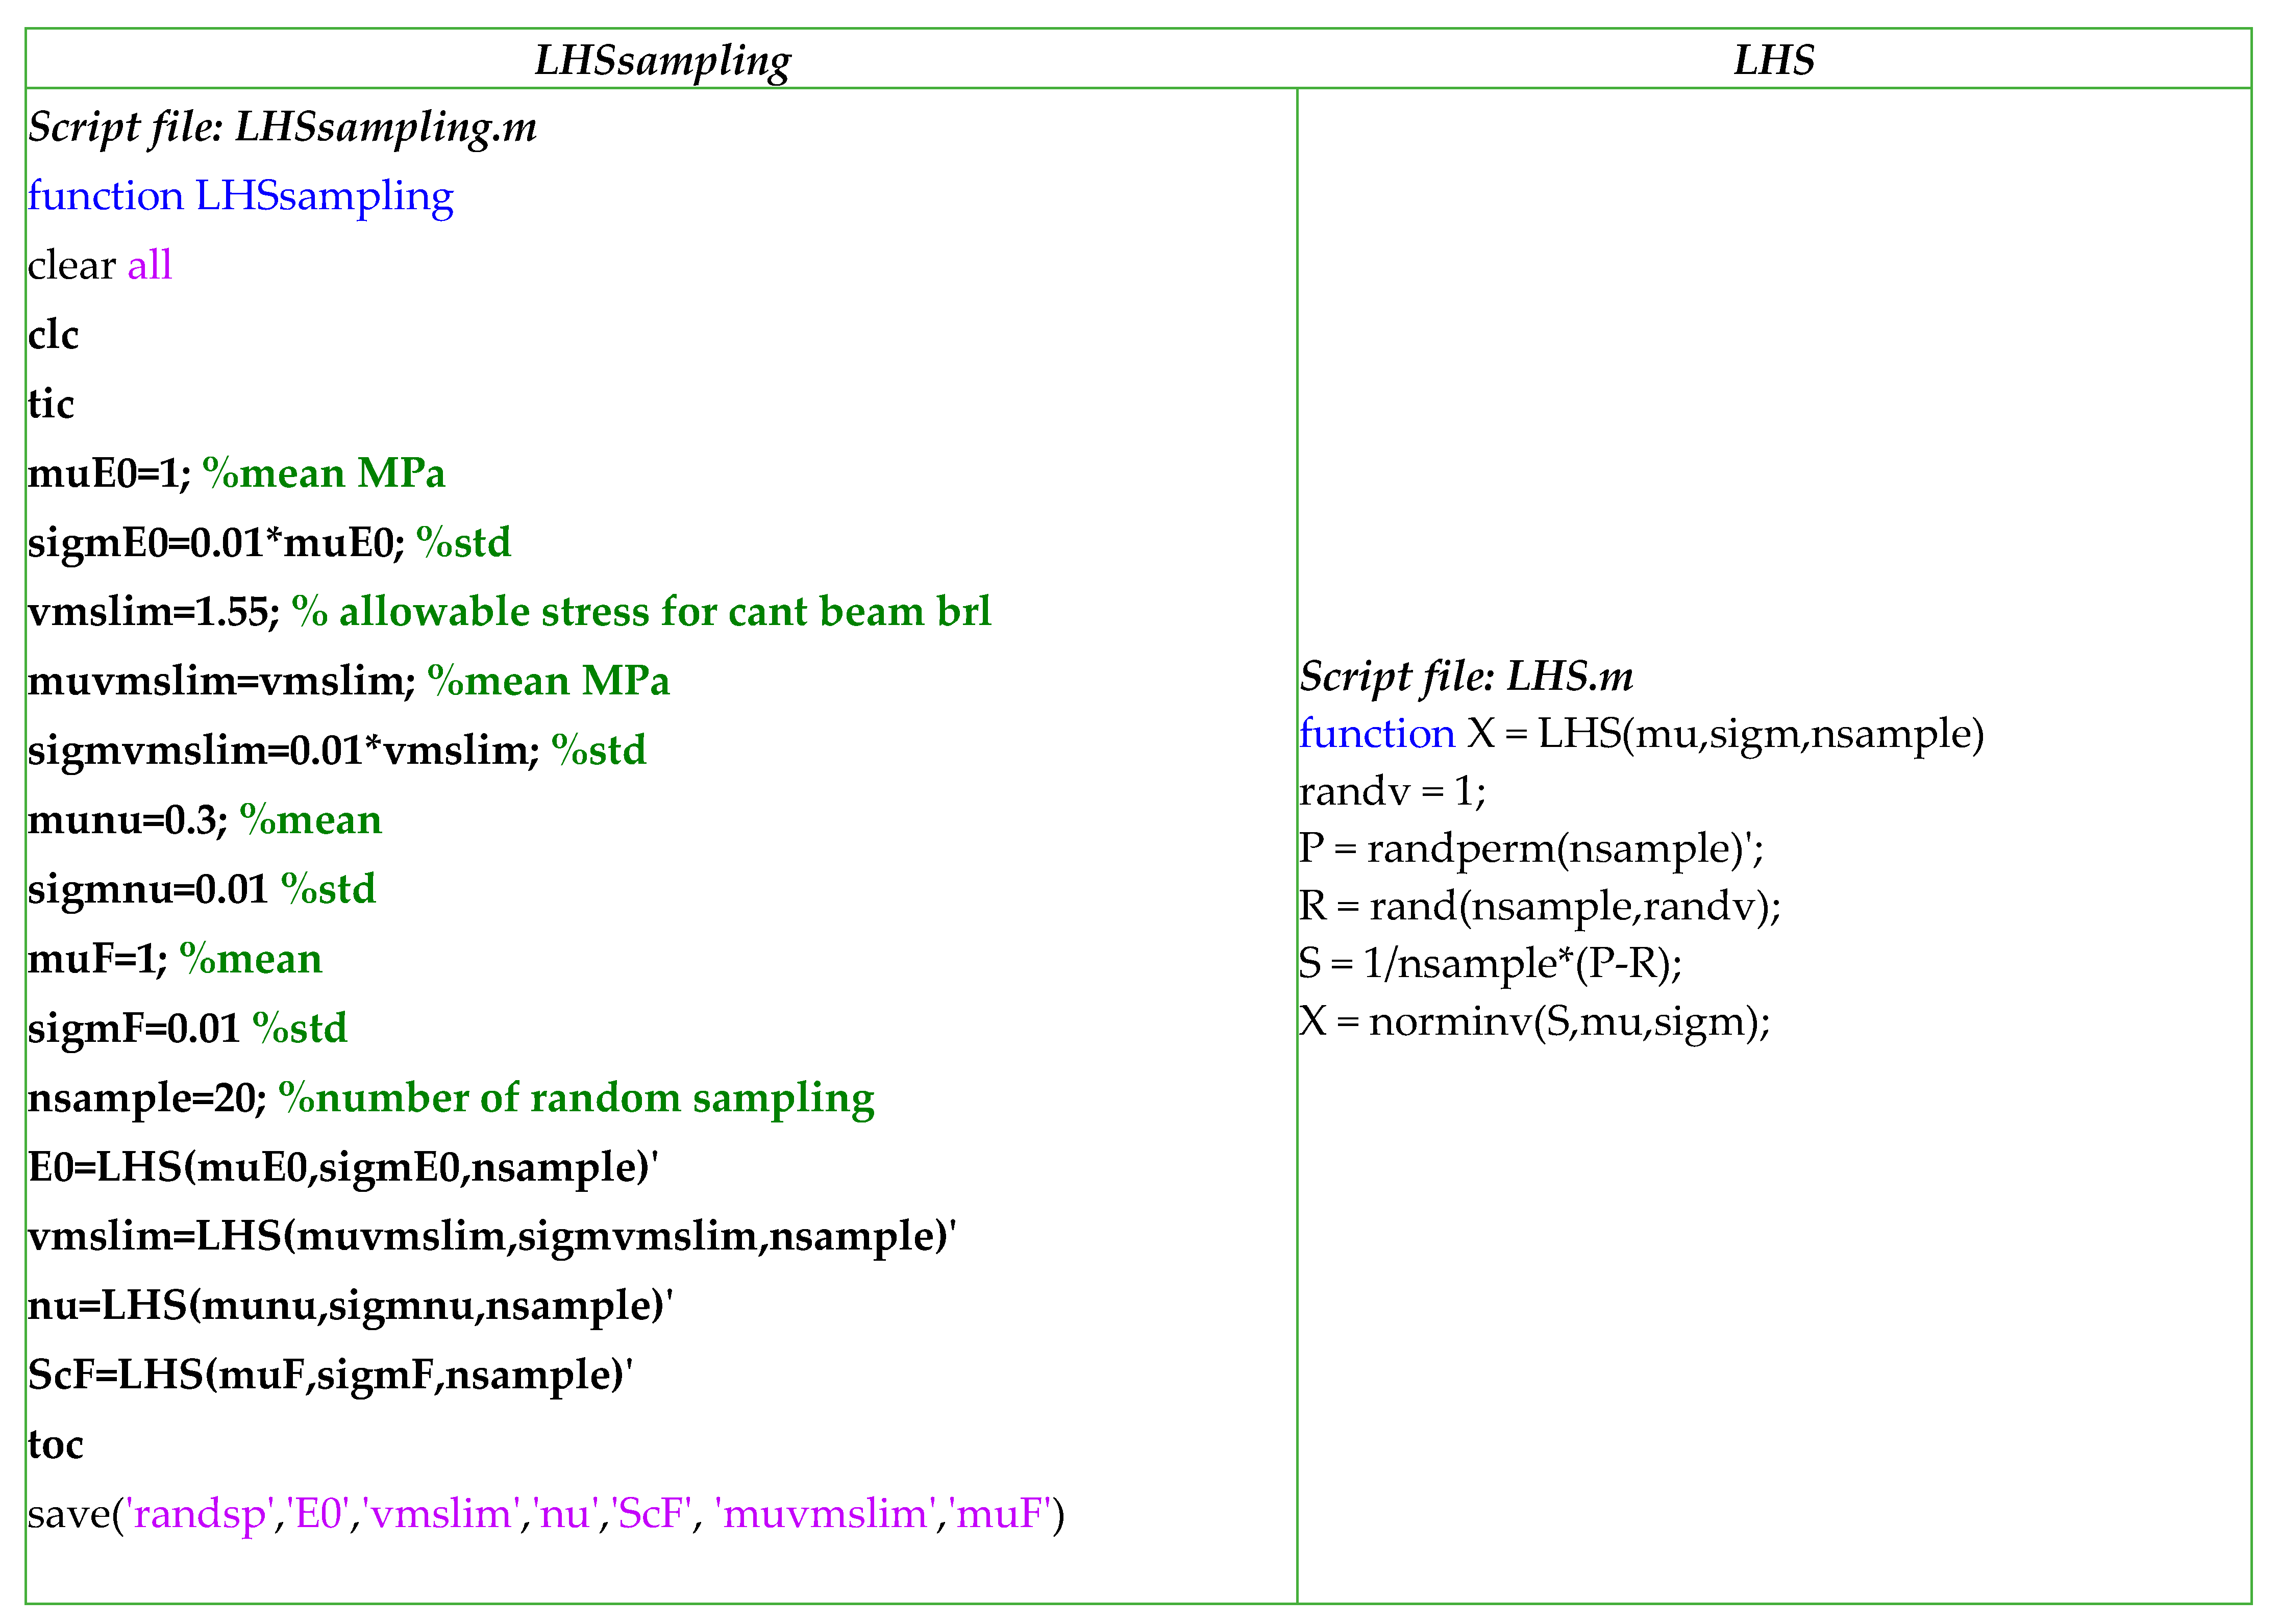
The LHS code (Appendix A.1) consists of two script files: LHSsampling.m and an additional function called LHS(mu,sigm,nsample). The PTOr program consists of two script files: runPTOsr.m (Appendix A.2) and the main PTOsr_MBB.m (Appendix A.3) script file. All the codes are presented in Appendix A.1, Appendix A.2 and Appendix A.3. The main script (Appendix A.3) is used to perform numerical experiments and collect all outputs. Typically, the outputs of interest are objective functions (optimum design variables, volume fractions, maximum von Mises stress, compliance, iteration, computational time, the probability of failure (pf), and search histories). The number of samples (N) of the random variables is defined in the first script. In our testing, we use N = [20, 102, 103]. The testing starts from the minimum number to the maximum number, allowing us to test the code and make refinements. The sampling number refinement helps determine the appropriate number of samples, which can be presented in tabular format. The number of random variables is defined as k = 4 for all test problems, which are E, σa, F, andυ. The LHS requires the mean (μ) and standard deviation (σ) to be defined in the first script (LHSsampling.m). The outputs (random variables, X) from the first script are saved in a mat file named randsp.
4.2. Test Problems
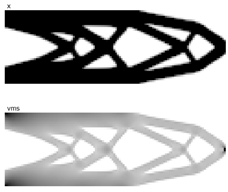
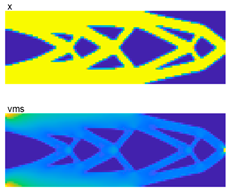
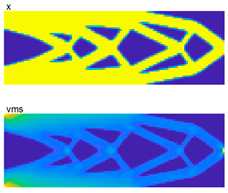
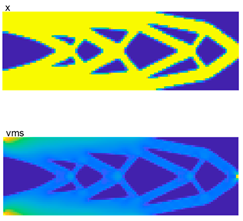
Two-dimensional RBTO examples are presented in this section case by case to demonstrate the efficiency and simplicity of the proposed PTOr. The first four examples include the cantilever beam (CTB) with various load positions and the MBB beam. The last example shows its application to an aircraft pylon by adapting load and boundary conditions with a simple discretized design domain. All first four examples are presented in Figure 4.
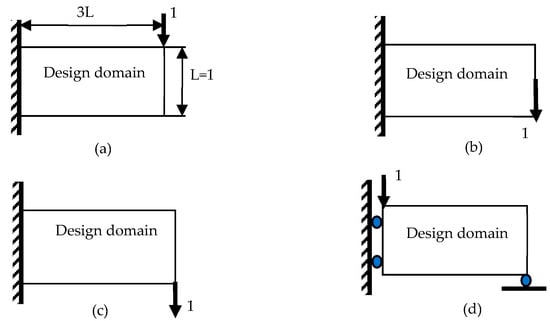
Figure 4.
Examples (a) CTB with upper-right load (b) CTB with middle-right load (c) CTB with bottom-right load (d) MBB beam.
The script runPTOsr.m is used for calling and running PTOsr_MBB.m and reading input from the randsp.m to prepare the random variables. The script run* needs to assign pfmax or pfmax, σa or vsmlim in the following form:
where E0 is the Young’s modulus (default = 1), Emin is the avoidance singularity Young’s modulus (10−9), l is the element edge length (1), lv is the load value (1), ld is the number of elements that the displacement and force load are distributed on (1), nelx is the number of elements in the x-direction (120), nely is the number of elements in the y-direction (40), nu is Poisson’s ratio (0.3), penal is the penalization factor (3), q is the proportional exponent (2), rmin is the filter radius (1.5), vmslim is the allowable stress (assigned case by case for each example), xlim is the density limit [0,1], and pfmax is the maximum probability of failure (assigned case by case for each example). An example of all the assigned parameters in the function is presented here:
PTOsr_mbb(E0,Emin,l,lv,ld,nelx,nely,nu,penal,q,rmin,vmslim,xlim,pfmax)
PTOsr_mbb(1,1e-9,1,1,1,120,40,0.3,3,2,1.5,vmslim,[0,1],pfmax)
The PTOsr_MBB.m script is called by executing runPTOsr.m. The working procedure inside the code still follows the original code by Biyikli and To []. The additional section for UQ starts from the comment line “UQ start” and ends the section at the “probability of failure”. The output of this section is pf, which is used to check the termination of the problem when it satisfies the termination criterion (pf ≤ pfmax). Conversely, an analysis for adding and removing materials from the design domain is performed by adding them if its sense is pfv > pfmax, while removing them if its sense is the opposite sign. The outputs are displayed graphically for the optimal structural shape by the von Mises stress (vms) and density variables.
4.2.1. Cantilever Beam with Upper-Right Load
The first test problem is a cantilever beam with various loads, starting with the upper-right load, as shown in Figure 4a. The main input parameters are E0 = 1, Emin =10−9, nu = 0.3, p = 3, q = 2, rmin = 1.5, vmslim = 1.55, and pfmax = 0.01. The comparative results of PTOs and PTOr are presented in Table 2, and the search histories are presented in Figure 4. The PTOs represent the deterministic TO (DTO) design, while the PTOr is used for designing the RBTO problem.

Table 2.
Optimal topology design of CTB with upper-right load.
From the comparative results, it can be concluded that the optimal topology under different sampling numbers yields a structure different from those yielded by the DTO, as shown in the right column of Table 2. The proposed approach can generate a safer topology with a higher volume fraction and lower stress and compliance, satisfying the desired pf = 0. Additionally, the results from the sampling number refinement show that the best sampling is 102, which is in accordance with the history of stresses (Figure 5c), in which lower is safer. Furthermore, the time consumption comparison between PTOs and PTOr shows that the time spent by PTOr is higher by more than 10 times due to the double-loop nested problem.
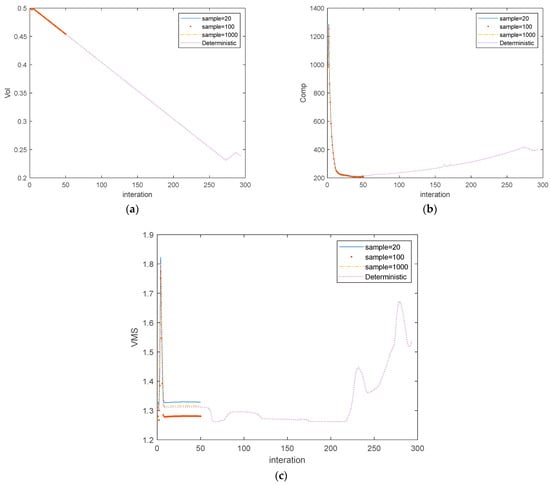
Figure 5.
Search histories of CTB with upper-right load (a) volume fraction, (b) compliance, (c) max stress (vms).
4.2.2. Cantilever Beam with Middle-Right Load
The second test problem is a cantilever beam with a middle-right load, as shown in Figure 4b. The main input parameters are E0 = 1, Emin =10−9, nu = 0.3, p = 3, q = 2, rmin = 1.5, vmslim = 0.7, and pfmax = 0.05. The comparative results of PTOs and PTOr are presented in Table 3, and the search histories are presented in Figure 6. The PTOs represent the deterministic TO (DTO) design, while the PTOr is used for designing the RBTO problem.

Table 3.
Optimal topology design of CTB with middle-right load.
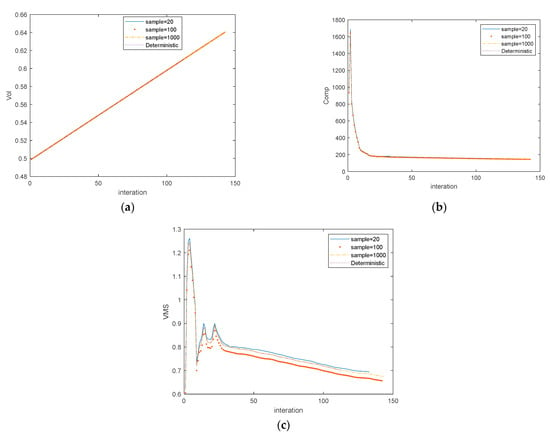
Figure 6.
Search histories of CTB with middle-right load: (a) volume fraction, (b) compliance, (c) max stress (vms).
From the comparative results, it can be concluded that the optimal topology under different sampling numbers yields a structure similar to those yielded by the DTO, as shown in the right column of Table 3. Specifically, the details in the table confirm that the proposed approach can generate a safer topology with a higher volume fraction and lower stress and compliance, satisfying the desired pf = 0.02. Additionally, the results from the sampling number refinement show that the best sampling is 102, which is in accordance with the history of stresses (Figure 6c) in which lower is safer. Although the pf is higher at 103, it is more time-saving. Furthermore, the time consumption comparison between PTOs and PTOr shows that the time spent by PTOr is significantly higher due to the double-loop nested problem.
4.2.3. Cantilever Beam with Bottom-Right Load
The third test problem is a cantilever beam with a bottom-right load, as shown in Figure 4c. The main input parameters are E0 = 1, Emin =10−9, nu = 0.3, p = 3, q = 2, rmin = 1.5, vmslim = 1.55, and pfmax = 0.01. The comparative results of PTOs and PTOr are presented in Table 4, and the search histories are presented in Figure 7. The PTOs represent the deterministic TO (DTO) design, while the PTOr is used for designing the RBTO problem.

Table 4.
Optimal topology design of CTB with bottom-right load.
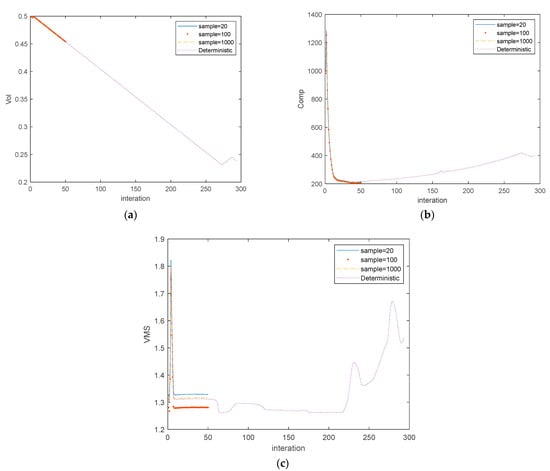
Figure 7.
Search histories of CTB with bottom-right load (a) volume fraction, (b) compliance, (c) max stress (vms).
From the comparative results, it can be concluded that the optimal topology under different sampling numbers yields a significantly different structure from those yielded by the DTO, as shown in the right column of Table 4. The proposed approach can generate a safer topology with a higher volume fraction and lower stress and compliance, satisfying the desired pf = 0. Additionally, the results from the sampling number refinement show that the best sampling is 102, which is in accordance with the history of stresses (Figure 7c), in which lower is safer. Furthermore, the time consumption comparison between PTOs and PTOr shows that the time spent by PTOr is approximately six times higher due to the double-loop nested problem.
4.2.4. MBB Beam
The fourth test problem is the MBB beam, as shown in Figure 4d. The main input parameters are E0 = 1, Emin = 10−9, nu = 0.3, p = 3, q = 2, rmin = 1.5, vmslim = 1.4, and pfmax = 0.05. The comparative results of PTOs and PTOr are presented in Table 5, and the search histories are presented in Figure 8. The PTOs represent the deterministic TO (DTO) design, while the PTOr is used for designing the RBTO problem.

Table 5.
Optimal topology design of MBB beam.
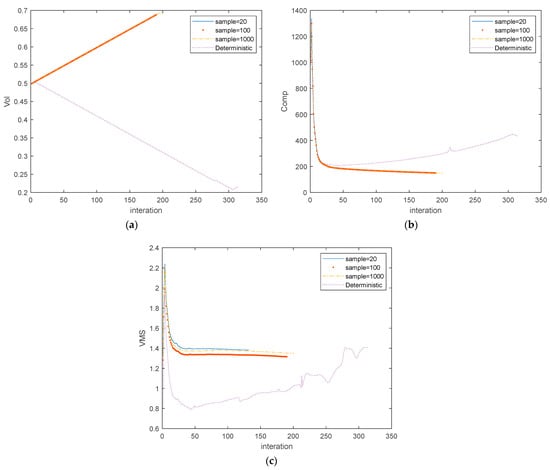
Figure 8.
Search histories of MBB beam (a) volume fraction, (b) compliance, (c) max stress (vms).
From the comparative results, it can be concluded that the optimal topology under different sampling numbers yields a significantly different structure from those yielded by the DTO, as shown in the right column of Table 5. The proposed approach can generate a safer topology with a higher volume fraction and lower stress, satisfying compliance with a desired probability of failure (pf) of 0.02. Additionally, the results from the refinement of the sampling number indicate that the optimal sampling is 102, which aligns with the history of stresses (Figure 8c), wherein lower stress ensures safety. Furthermore, the time consumption comparison between PTOs and PTOr shows that the time spent by PTOr is significantly higher due to the double-loop nested problem.
4.2.5. Validation Results with MCS
From the above results, it can be concluded that the proposed technique can generate a safer topology with a higher volume fraction and lower stress, satisfying compliance with a desired probability of failure at a moderate sampling number of 102. A question arises at this stage: can the reliable shape of PTOr with LHS compare with the traditional MCS? As mentioned in the literature, MCS is one of the most well-known quantification techniques [,]. Although it requires a higher random sampling number than 104, it can handle large random variables, various distribution types, and highly nonlinear systems [,,]. That is why MCS was chosen to validate and confirm some of the results (Case 2 and Case 4). Due to its robustness, PTOr can easily be integrated with MCS. The validation results are presented in Table 6. The results prove the reliable topology shape of the proposed technique at a sampling number of 102, which uses less than 100 times the time consumption compared to MCS in both cases. Especially for the case of the MBB beam, the topology matches with the result at 102 rather than the sample at 103. This study confirms that the optimum sampling number for PTOr with LHS for all cases is 102. The prediction of the volume fraction, maximum stress, compliance, and pf with MCS closely aligns with the sampling number 102 using LHS, being slightly more conservative and significantly saving time.

Table 6.
Optimal topology design validation of CTB with middle-right load and MBB beam with PTOr and MCS.
4.2.6. Aircraft Pylon
The aircraft pylon is a supporting part between the aircraft’s wings and engines as shown in Figure 9. Given its vital role, the design of a pylon must consider the dynamic forces, stresses, and vibrations experienced during flight. In the past, the improvement in pylon design by TO has significantly enhanced its structural efficiency and reduced weight [,,]. Almost all work has used TO to explore optimal pylon structures, aiming for mass reduction. However, there have been only a few research efforts aiming for both structural integrity and weight reduction [].
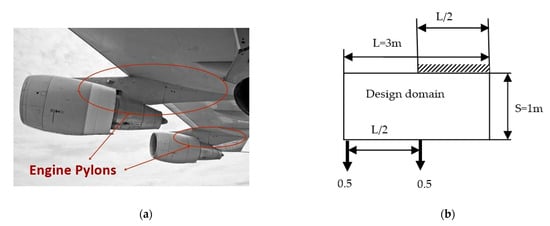
Figure 9.
(a) The pylon model and (b) problem setup.
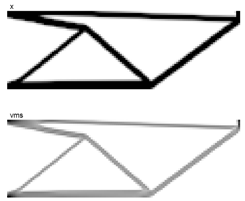
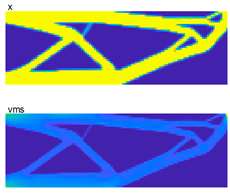
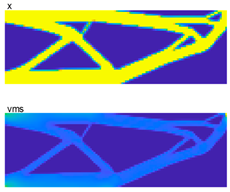
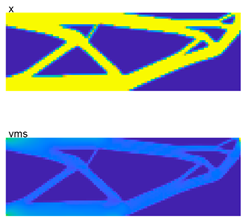
In this experiment, the RBDO of the pylon in a two-dimensional problem is presented, aiming to minimize volume fraction with stress constraints. The power of PTOr-embedded codes in this research can be adapted to solving this task. The pylon model and problem setup are presented in Figure 9. The length and width of the design domain are 3 m × 1 m. The pylon model is fixed with the rigid wing at half of the upper edge, while forces due to engine weight are applied at half of the bottom edge, as shown in the figure. The engine weight is the only load considered in this study; in reality, the inertial load during engine takeoff and landing is far greater. In the aviation industry, for instance, the Federal Aviation Administration (FAA) of the United States mandates that all aircraft parts must meet minimum safety factor (SF) requirements. That means the inertial load during takeoff and landing can be accounted for in the form of SF. At this stage, RBTO is a main obstacle for newcomers who aim to gain knowledge in this field but may be outside the aerospace sector. The complexity of analysis due to its specific field can be alleviated by neglecting it at this moment. The main input parameters are E0 = 1, Emin =10−9, nu = 0.3, p = 3, q = 2, rmin = 1.5, vmslim = 0.6, and pfmax = 0.02. The comparative results of PTOs, Ansys, and PTOr are presented in Table 7. The TO design result with Ansys is DTO similar to PTOs. In this design, PTOr used only 102 sampling numbers due to its high efficiency, as mentioned above from the test problems 1–4. The TO analysis with Ansys requires structural problem definition (material properties, FE model, load, etc.) and an objective function, while the material distribution function over the design domain serves as the optimization parameter. The problem setup is the same as PTO except the optimizer used is the optimal criteria (OC) method, which is gradient-based. The element type chosen for TO analysis is PLANE82.

Table 7.
Optimal topology design of the aircraft pylon.
From the design results, it can be concluded that the optimal topology under reliability-based design yields an optimal pylon structure different from those yielded by PTOs and Ansys as shown in the right column of Table 7. The outer shape of all design results looks similar, confirming the pylon’s optimal shape. Hence, the results are in accordance with the recent study by []. Although the inner structure looks a bit different from the result from Ansys, it looks lighter due to higher voids and uniform distribution in all sections. Furthermore, PTOr can generate a safer topology with a higher volume fraction and lower stress, satisfying compliance with a desired pf = 0.02 when compared with PTOs.
5. Conclusions
Recent research proposes a new reliability-based topology optimization technique, which is based on a non-gradient-based approach, namely the proportional topology optimization for reliability (PTOr). The double-loop nested problem due to the combination of RBTO and probabilistic UQ can alleviate its complexity by the non-gradient-based PTO with high efficiency. Although the UQ technique (LHS) used in conjunction with PTO is a traditional technique, the overall performance of the new RBTO is still high. It can be clearly stated that the proposed technique can reduce the complexity of the traditional technique. The success at this stage of PTOr can reveal the opportunities for other UQ incorporation and increase its performance in the future. From the results of the test case problems, the efficiency of the proposed technique can be presented in such a way that the reliability-based design can achieve safer structures with higher volume fractions and lower values for both maximum stress and compliance. The safer structure depends on the desired probability of failure, which must be suppressed to achieve higher reliability. Time-saving from the sampling number refinement test can reveal that the sampling number can be reduced from the expected 103 to 102 due to incorporating the PTO and LHS techniques. Furthermore, this research provides computer programs for newcomers studying new-edge knowledge in engineering design, including UQ, TO, and RBTO, in a simple way. The application of computer code in this research is applied to solve the optimum pylon structure. The results show that the embedded PTOr codes in this research are a powerful tool for solving the task.
As mentioned previously, future work can explore the incorporation of other high-performance UQ techniques into the PTO, such as variant LHS, fuzzy sets, and interval techniques, which are expected to increase their performance.
Author Contributions
Conceptualization, S.S.; methodology, S.S.; software, S.S.; validation, N.K. and S.S.; formal analysis, N.K. and S.S.; investigation, N.K. and S.S; writing—original draft preparation, N.K. and S.S.; writing—review and editing, N.K. and S.S.; supervision, S.S. All authors have read and agreed to the published version of the manuscript.
Funding
The authors are grateful for the financial support provided by King Mongkut’s Institute of Technology Ladkrabang and the National Research Council Thailand (N42A650549).
Data Availability Statement
Data are contained within the article.
Conflicts of Interest
The authors declare no conflicts of interest. The funders had no role in the design of the study; in the collection, analyses, or interpretation of data; in the writing of the manuscript; or in the decision to publish the results.
Appendix A
Appendix A.1. LHS Sampling and LHS Script Files
Appendix A.2. runPTOsr.m

Appendix A.3. PTOsr_MBB.m Script Files
References
- Bureerat, S.; Kunakote, T. Topological design of structures using population-based optimization methods. Inverse Probl. Sci. Eng. 2006, 14, 589–607. [Google Scholar] [CrossRef]
- Bendsϕe, M.P.; Sigmund, O. Topology Optimization; Springer: Berlin/Heidelberg, Germany, 2003. [Google Scholar]
- Fujii, D.; Kikuchi, N. Improvement of numerical instabilities in topology optimization using the SLP method. Struct. Multidiscip. Optim. 2000, 19, 113–121. [Google Scholar] [CrossRef]
- Bendsϕe, M.P.; Ben-Tal, A.; Zowe, J. Optimization methods for truss geometry and topology design. Struct. Multidiscip. Optim. 1994, 7, 141–159. [Google Scholar] [CrossRef]
- Saggere, L.; Kota, S. Static shape control of smart structures using compliant mechanisms. AIAA J. 1999, 37, 572–578. [Google Scholar] [CrossRef]
- Lu, K.J.; Kota, S. Design of compliant mechanism for morphing structural shapes. J. Intell. Mater. Syst. Struct. 2003, 14, 379–391. [Google Scholar] [CrossRef]
- Sigmund, O. A 99 line topology optimization code written in MATLAB. Struct. Multidiscip. Optim. 2001, 21, 120–127. [Google Scholar] [CrossRef]
- Kane, C.; Schoenauer, M. Topological optimum design using genetic algorithms. Control Cybern 1996, 25, 1059–1088. [Google Scholar]
- Jakiela, M.; Chapman, C.; Duda, J.; Adewuya, A.; Saitou, K. Continuum structural topology design with genetic algorithms. Comput. Methods Appl. Mech. Eng. 2000, 86, 339–356. [Google Scholar] [CrossRef]
- Wang, S.Y.; Tai, K. Graph representation for structural topology optimization using genetic algorithms. Comput. Struct. 2004, 82, 1609–1622. [Google Scholar] [CrossRef]
- Woon, S.Y.; Tong, L.; Querin, O.M.; Steven, G.P. Effective optimisation of continuum topologies through a multi-GA system. Comput. Methods Appl. Mech. Eng. 2005, 194, 3416–3437. [Google Scholar] [CrossRef]
- Madeiraa, J.A.; Rodriguesa, H.C.; Pinam, H. Multiobjective topology optimization of structures using genetic algorithms with chromosome repairing. Struct. Multidiscip. Optim. 2006, 32, 31–39. [Google Scholar] [CrossRef]
- Bureerat, S.; Limtragool, J. Performance enhancement of evolutionary search for topology optimization. Finite Elem. Anal. Des. 2006, 42, 547–566. [Google Scholar] [CrossRef]
- Bureerat, S.; Limtragool, J. Structural topology optimisation using simulated annealing with multiresolution design variables. Finite Elem. Anal. Des. 2008, 44, 738–747. [Google Scholar] [CrossRef]
- Kunakote, T.; Bureerat, S. Structural topology optimization using multiobjective evolutionary algorithms. Eng.Optim. 2011, 43, 541–557. [Google Scholar] [CrossRef]
- Sleesongsom, S.; Bureerat, S. Topology Optimisation Using MPBILs and Multi-Grid Ground Element. Appl. Sci. 2018, 8, 271. [Google Scholar] [CrossRef]
- Guirguis, D.; Aly, M.F. A derivative-free level-set method for topology optimization. Finite Elem. Anal. Des. 2016, 120, 41–56. [Google Scholar] [CrossRef]
- Ram, L.; Sharma, D. Evolutionary and GPU computing for topology optimization of structures. Swarm Evol. Comput. 2017, 35, 1–13. [Google Scholar] [CrossRef]
- Guirguis, D.; Melek, W.W.; Aly, M.F. High-resolution non-gradient topology optimization. J. Comput. Phys. 2018, 372, 107–125. [Google Scholar] [CrossRef]
- Guirguis, D.; Aulig, N.; Picelli, R.; Zhu, B.; Zhou, Y.; Vicente, W.; Sai Tou, K. Evolutionary black-box topology optimization: Challenges and promises. IEEE Trans. Evol. Comput. 2020, 24, 613–633. [Google Scholar] [CrossRef]
- Rostami, P.; Marzbanrad, J. Identification of Optimal Topologies for Continuum Structures Using Metaheuristics: A Comparative Study. Arch. Computat. Methods Eng. 2021, 28, 4687–4714. [Google Scholar] [CrossRef]
- Goto, T.G.; Najafabadi, H.R.; Falheiro, M.F.; Moura, R.T.; Driemeier, L.; Barari, A.; Tsuzuki, M.S.G.; Martins, T.C. A new non-gradient-based topology optimization algorithm with black–white density and manufacturability constraints. Structures 2023, 47, 1900–1911. [Google Scholar] [CrossRef]
- Biyikli, E.; To, A.C. Proportional topology optimization: A new non-sensitivity method for solving stress constrained and minimum compliance problems and its implementation in matlab. PLoS ONE 2015, 10, 5014–5041. [Google Scholar] [CrossRef] [PubMed]
- Wang, H.; Cheng, W.; Du, R.; Wang, S.; Wang, Y. Improved proportional topology optimization algorithm for solving minimum compliance problem. Struct. Multidiscip. Optim. 2020, 62, 475–493. [Google Scholar] [CrossRef]
- Ullah, Z.; Ullah, B.; Khan, W.; ul Islam, S. Proportional topology optimisation with maximum entropy-based meshless method for minimum compliance and stress constrained problems. Eng. Comput. 2022, 38, 5541–5561. [Google Scholar] [CrossRef]
- Tran, M.T.; Nguyen, M.N.; Bui, T.Q.; Nguyen, H.Q. An enhanced proportional topology optimization with virtual elements: Formulation and numerical implementation. Finite Elem. Anal. Des. 2023, 222, 103958. [Google Scholar] [CrossRef]
- Yin, H.; Yu, D.; Xia, R. Reliability-based topology optimization for structures using fuzzy set model. Comput. Methods Appl. Mech. Eng. 2018, 333, 197–217. [Google Scholar] [CrossRef]
- Kharmanda, G.; Olhoff, N.; Mohamed, A.; Lemaire, M. Reliability-based topology optimization. Struct. Multidiscip. Optim. 2004, 26, 295–307. [Google Scholar] [CrossRef]
- Sleesongsom, S.; Bureerat, S. Multi-objective reliability-based topology optimization of structures using a fuzzy set model. J. Mech. Sci. Technol. 2020, 34, 3973–3980. [Google Scholar] [CrossRef]
- Dunning, P.; Kim, H. Robust topology optimization: Minimization of expected and variance of compliance. AIAA Journal 2013, 51, 2656–2664. [Google Scholar] [CrossRef]
- Kim, C.; Wang, S.; Bae, K.R.; Moon, H. Reliability-based topology optimization with uncertainties. J. Mech. Sci. Technol. 2006, 20, 494–504. [Google Scholar] [CrossRef]
- Elishakoff, I.; Colombi, P. Combination of probabilistic and convex models of uncertainty when scare knowledge is present on acoustic excitation parameters. Comput. Methods Appl. Mech. Eng. 1993, 104, 187–209. [Google Scholar] [CrossRef]
- Moens, D.; Hanss, M. Non-probabilistic finite element analysis for parametric uncertainty treatment in applied mechanics: Recent advances. Finite Elem. Anal. Des. 2011, 47, 4–16. [Google Scholar] [CrossRef]
- Mostafa, M.N.; Morteza, T. Robust data envelopment analysis with Monte Carlo simulation model for optimization the energy consumption in agriculture. Energy Sources Part A RecoveryUtil. Environ. Eff. 2020, 1–15. [Google Scholar] [CrossRef]
- Abyani, M.; Bahaari, R.M. A comparative reliability study of corroded pipelines based on Monte Carlo Simulation and Latin Hypercube Sampling methods. Int. J. Press. Vessel. Pip. 2020, 181, 104079. [Google Scholar] [CrossRef]
- Luo, C.; Zhu, S.-P.; Keshtegar, B.; Macek, W.; Branco, R.; Meng, D. Active Kriging-based conjugate first-order reliability method for highly efficient structural reliability analysis using resample strategy. Comput. Methods Appl. Mech. Eng. 2024, 423, 116863. [Google Scholar] [CrossRef]
- Song, L.-K.; Li, X.-Q.; Zhu, S.-P.; Choy, Y.-S. Cascade ensemble learning for multi-level reliability evaluation. Aerosp. Sci. Technol. 2024, 148, 109101. [Google Scholar] [CrossRef]
- Xian, J.-H.; Wang, Z.-Q. Relaxation-based importance sampling for structural reliability analysis. Struct. Saf. 2024, 106, 102393. [Google Scholar] [CrossRef]
- Moller, B.; Graf, W.; Beer, M. Fuzzy structural analysis using α-level optimization. Comp. Mech. 2000, 26, 547–565. [Google Scholar] [CrossRef]
- Nie, X.; Li, H. A direct-integration-based structural reliability analysis method using non-probabilistic convex model. J. Mech. Sci. Technol. 2018, 32, 5063–5068. [Google Scholar] [CrossRef]
- Jiang, G.; Gao, L. Reliability analysis of martial arts arena robot systems based on fuzzy set theory. J. Mech. Sci. Technol. 2018, 32, 5069–5077. [Google Scholar] [CrossRef]
- Tang, Z.C.; Lu, Z.Z.; Hu, J.X. An efficient approach for design optimization of structures involving fuzzy variables. Fuzzy Sets Syst. 2014, 255, 52–73. [Google Scholar] [CrossRef]
- Liu, B.; Jiang, C.; Li, G.; Huang, X. Topology optimization of structures consideringlocal material uncertainties in additive manufacturing. Comput. Methods Appl. Mech. Engrg. 2020, 360, 112786. [Google Scholar] [CrossRef]
- Li, Z.; Wang, L.; Lv, T. Additive manufacturing-oriented concurrent robust topology optimization considering size control. Int. J. Mech. Sci. 2023, 250, 108269. [Google Scholar] [CrossRef]
- Jansen, M.; Lombaert, G.; Schevenels, M.; Sigmund, O. Topology optimization of fail-safe structures using a simplified local damage model. Struct. Multidiscip. Optim. 2014, 49, 657–666. [Google Scholar] [CrossRef]
- Martinez-Frutos, J.; Ortigosa, R. Risk-averse approach for topology optimization of fail-safe structures using the level-set method. Comp. Mech. 2021, 68, 1039–1061. [Google Scholar] [CrossRef]
- Hederberg, H.; Thore, C.J. Topology optimization for fail-safe designs using moving morphable components as a representation of damage. Struct. Multidiscip. Optim. 2021, 64, 2307–2321. [Google Scholar] [CrossRef]
- Wang, X.; Shi, Y.; Hoang, V.-N.; Meng, Z.; Long, K.; Wang, Y. Reliability-based topology optimization of fail-safe structures using moving morphable bars, CMES Comput. Model. Eng. Sci. 2023, 136, 3173–3195. [Google Scholar]
- Cai, J.; Huang, L.; Wu, H.; Yin, L. Topology optimization of truss structure under load uncertainty with gradient-free proportional topology optimization method. Structures 2023, 58, 105377. [Google Scholar] [CrossRef]
- Chanu, S.; Wattanathorn, A.; Senpong, M.; Sleesongsom, S. Reliability analysis in design of mechanical components. AIP Conf. Proc. 2023, 2601, 020030. [Google Scholar]
- Suratemeekul, N.; Kumkam, N.; Sleesongsom, S. Uncertainty Quantification Code Written in MATLAB. Commun. Comput. Inf. Sci. 2024, in press.
- Mischke, C. A method of relating factor of safety and reliability. J. Eng. Ind. 1970, 92, 537–541. [Google Scholar] [CrossRef]
- Wu, Y.T.; Shin, Y.; Sues, R.; Cesare, M. Safety-factor based approach for probability based design optimization. In Proceedings of the 19th AIAA Applied Aerodynamics Conference, Anaheim, CA, USA, 11–14 June 2001. [Google Scholar]
- Qu, X.; Haftka, R.T. Reliability-based Design Optimization Using Probabilistic Sufficiency Factor. Struct. Multidisc. Optim. 2004, 27, 314–325. [Google Scholar] [CrossRef]
- Yin, J.; Du, X. A Safety Factor Method for Reliability-Based Component Design. J. Mech. Eng. 2021, 143, 091705. [Google Scholar] [CrossRef]
- Helton, J.C.; Davis, F.J. Latin hypercube sampling and the propagation of uncertainty in analyses of complex systems. Reliab. Eng. Syst. Saf. 2003, 81, 23–69. [Google Scholar] [CrossRef]
- Olsson, A.; Sandberg, G.; Dahlblom, O. On Latin hypercube sampling for structural reliability analysis. Struct. Saf. 2003, 25, 47–68. [Google Scholar] [CrossRef]
- Remouchamps, A.; Bruyneel, M.; Fleury, C.; Grihon, S. Application of a Bi-Level Scheme Including Topology Optimization to the Design of an Aircraft Pylon. Struct. Multidisc. Optim. 2011, 44, 739–750. [Google Scholar] [CrossRef]
- Coniglio, S.; Gogu, C.; Amargier, R.; Morlier, J. Engine pylon topology optimization framework based on performance and stress criteria. AIAA J. 2019, 57, 5514–5526. [Google Scholar] [CrossRef]
- Xing, Y.; Tong, Y. Accelerating reliability-based topology optimization via gradient online learning and prediction. Aerosp. Sci. Technol. 2024, 145, 108836. [Google Scholar] [CrossRef]
Disclaimer/Publisher’s Note: The statements, opinions and data contained in all publications are solely those of the individual author(s) and contributor(s) and not of MDPI and/or the editor(s). MDPI and/or the editor(s) disclaim responsibility for any injury to people or property resulting from any ideas, methods, instructions or products referred to in the content. |
© 2024 by the authors. Licensee MDPI, Basel, Switzerland. This article is an open access article distributed under the terms and conditions of the Creative Commons Attribution (CC BY) license (https://creativecommons.org/licenses/by/4.0/).
