Abstract
The paper proposes an anomaly detection method for UAVs based on wavelet decomposition and stacked denoising autoencoder. This method takes the negative impact of noisy data and the feature extraction capabilities of deep learning models into account. It aims to improve the accuracy of the proposed anomaly detection method with wavelet decomposition and stacked denoising autoencoder methods. Anomaly detection based on UAV flight data is an important method of UAV condition monitoring and potential abnormal state mining, which is an important means to reduce the risk of UAV flight accidents. However, the diversity of UAV mission scenarios leads to a complex and harsh environment, so the acquired data are affected by noise, which brings challenges to accurate anomaly detection based on UAV data. Firstly, we use wavelet decomposition to denoise the original data; then, we used the stacked denoising autoencoder to achieve feature extraction. Finally, the softmax classifier is used to realize the anomaly detection of UAV. The experimental results demonstrate that the proposed method still has good performance in the case of noisy data. Specifically, the Accuracy reaches 97.53%, the Precision is 97.50%, the Recall is 91.81%, and the F1-score is 94.57%. Furthermore, the proposed method outperforms the four comparison models with more outstanding performance. Therefore, it has significant potential in reducing UAV flight accidents and enhancing operational safety.
1. Introduction
In recent years, with the rapid advancement of science and technology, unmanned aerial vehicles (UAVs) have progressively matured and emerged as a focal point in the new wave of global technological and industrial revolution. Currently, there exists a diverse range of UAV types available in the market including fixed-wing, multi-rotor, and hybrid models, among others. As a reusable aircraft operated by autonomous control or radio remote control [1], UAVs are widely used in environmental monitoring, aerial photography, disaster detection, power inspection, express transportation, and other fields due to their advantages of small size, lightweight, strong mobility, low cost, and easy use [2,3]. In the field of agricultural and forestry plant protection, UAVs can be utilized for plant health detection and pesticide spraying. Additionally, UAV aerial photography has gained significant popularity among photography enthusiasts in the realm of aerial photography. Moreover, they are employed for power line inspection and substation equipment monitoring. UAV is a complex system that integrates multiple disciplines such as electronics, control, sensors, and information, and it is usually designed with low or no redundancy [4,5]. Since there is no pilot on-site operation in the process of carrying out the task, the UAV does not have the real-time observation and response-ability of the pilot, and it will not be able to take emergency measures in time in case of failure, which leads to a higher accident rate of the UAV compared with that of the man–machine. The expansion of the UAV industry and the diversification of application scenarios have led to a frequent occurrence of safety accidents during UAV flights, thus prompting widespread concerns regarding the reliability and safety of UAVs.
UAV flight data refer to a series of flight parameters related to UAV performance and status collected by onboard sensors during flight, usually including various attitudes, speed, altitude, position, and other information. The common parameters are shown in Table 1.

Table 1.
Common flight parameters of UAV.
Currently, anomaly detection based on UAV flight data is a powerful approach for UAV condition monitoring and potential anomaly mining. This data-driven method eliminates the reliance on specific physical models or expert knowledge, allowing for the comprehensive utilization of flight data to achieve effective anomaly detection [6]. It holds more promise compared to prior knowledge and model-based methods, making it highly significant in reducing the risk of UAV flight accidents and enhancing operational safety. Many researchers are using machine learning algorithms to conduct anomaly detection research on UAV flight data due to the rapid development of machine learning technology. Wang et al. [7] proposed an online anomaly detection method for UAV flight status using the least squares support vector machine (LS-SVM) prediction model. The proposed algorithm was verified using simulated flight data, and the experimental results demonstrated its effectiveness in detecting online anomalies for UAVs. Bronz et al. [8] used SVM algorithms based on UAV flight logs to categorize UAV behavior during normal and fault phases and achieved a high level of Accuracy in detecting uncontrolled UAV faults. Yaman et al. [9] developed a lightweight fault detection algorithm for UAV engine anomalies using the SVM algorithm to classify the audio signals, which can work in real time in an embedded system. González-Etchemaite et al. [10] developed a supervised learning-based fault detection and identification module for multi-rotor UAVs, which realized real-time detection based on random forest and support vector machine. Experiments on simulated and real data verified the effectiveness of the solution. Thanaraj et al. [11] proposed a hybrid FDI model for a quadrotor UAV that integrates an extreme learning neuro-fuzzy algorithm with a model-based extended Kalman filter (EKF). The results show that the Fuzzy-ELM FDI model exhibits greater efficiency and sensitivity, while Fuzzy-ELM and R-EL-ANFIS FDI models demonstrate better performance than a conventional neuro-fuzzy algorithm. Li et al. [12] detected anomalies in flight data based on the density similarity between the data using the DBSCAN clustering algorithm and achieved better results. Altinors et al. [13] performed fault diagnosis based on data received by the UAV motor. Signal preprocessing, feature extraction, and machine learning methods were applied to the obtained dataset. Decision tree (DT), Support Vector Machines (SVM), and K-Nearest Neighbor algorithms are used for experiments, and the results showed that the three machine learning algorithms all achieved high Accuracy. Aiming at the high-dimensional characteristics of UAV sensor data, Duan [14] et al. proposed an anomaly detection method for UAV sensor data based on Kernel Principal Component Analysis (KPCA) and experimented with simulated data, and the results showed that the method can achieve satisfactory results. Ahn et al. [15] proposed a detection algorithm based on clustering and a convolutional neural network for the anomaly detection problem of UAV swarm flight data. First, the flight data were labeled by principal component analysis and K-means clustering, and then a one-dimensional convolutional neural network classifier was trained. This method achieved good results on real flight data. It can be seen from the above relevant studies that machine learning methods are widely used in anomaly detection of UAV.
In recent years, deep learning technology has developed rapidly, and it has been widely used in many research fields, such as lithium battery health prediction [16,17,18], bearing fault diagnosis [19,20,21,22], and air quality prediction [23,24,25,26]. Therefore, some researchers have started to study the anomaly detection of UAV flight data based on deep learning technology to ensure the safety and reliability of UAV flights. Xiao et al. [27] proposed a scheme based on recurrent neural networks (RNNs) for the detection of abnormal behavior of UAVs. Firstly, the RNN was used to train and build the normal behavior model of UAV, and then an appropriate threshold was selected through extensive experiments. If the normalized root mean square error between the true position and the model output position is greater than the threshold, the UAV is considered to have abnormal behavior. Finally, the proposed scheme achieves an average Accuracy of 98% on both experimental data. Wang et al. [28] proposed a long-short-term memory recurrent neural network method for UAV anomaly detection and used real UAV flight data to verify the method. The experimental results show that the method can effectively detect point anomalies. Jeon et al. [29] proposed a method for detecting structural abnormalities of quadcopter UAVs, which uses a long short-term memory (LSTM) network and an autoencoder model to learn complex features from routine flight data. The experimental results show that the proposed method has a good effect on detecting structural abnormalities of UAVs. Yang et al. [30] proposed a method for detecting anomalous states in UAVs using timestamp slicing and multiple separable convolutional neural networks (TS-MSCNN) and conducted experiments with real data. This method solves the problem that the traditional abnormal state detection model ignores the difference of POS data frequency domain in the process of feature learning. Wang et al. [31] proposed a method based on long and short-term memory residual filtering. Firstly, the method involves extracting the spatiotemporal characteristics of the flight data using an LSTM network to obtain the estimated values of the monitoring parameters. Then the residuals between the real data and the estimated values are smoothed by the filter. Finally, the smoothed residuals are compared with a statistical threshold to achieve fault detection of UAV flight data. Wang et al. [32] proposed a multivariate sequence anomaly detection model based on an improved graph neural network with a transformer, a graph attention mechanism, and a multi-channel fusion mechanism. The combination of a multi-channel transformer structure and a graph attention mechanism enables intrinsic pattern extraction from different data and better captures the features of the time series. Finally, the multi-channel data fusion module is used to integrate the global information and improve the Accuracy of anomaly detection. The experimental results demonstrate that the average Accuracy of the proposed model is 92.83% and 96.59% on the two datasets of UAV, respectively. Zhong et al. [33] conducted research on anomaly detection and recovery prediction of UAV flight data by combining artificial neural networks and long-short-term memory networks based on spatiotemporal correlation. Artificial neural networks were used to mine the spatiotemporal correlation of flight data and screen out relevant parameter sets. Subsequently, a long-term and short-term memory network model was trained based on these parameter sets to achieve anomaly detection and recovery prediction. Anidjar et al. [34] collected audio information from the UAV flight via a Bluetooth earphone fixed on top of the UAV and then converted the audio signal into a graphical representation using the Wav2Vec2 model based on the transformer structure. Next, a modified VGG-16 convolutional neural network is used to train the image classification model to achieve anomaly detection of the UAV. Finally, the authors further improved the approach for real-time detection and verified the effectiveness of the approach in real-time scenarios. In addition, the establishment of UAV real-time anomaly detection systems based on deep learning technology is also a popular research field. At present, many anomaly detection algorithms have high accuracy, but the calculation process is complicated and takes a long time, which makes it difficult to meet the needs of real-time scenarios. Therefore, the research of high-accuracy and lightweight algorithms based on deep learning technology is the future development direction.
Autoencoder is a typical unsupervised learning model that enables the automatic learning of a representation function of a dataset from a large number of data samples, which can be used for feature extraction and data dimensionality reduction. In order to quickly achieve anomaly detection from system log files, Cavallaro et al. [35] analyzed log files from data centers. First, they used modern Natural Language Processing (NLP) methods to map the log files’ words to a high-dimensional metric space; then, they used an invariant mining model and autoencoder to cluster and classify various system events. Finally, they carried out experiments and obtained an average of F-measure metric over 86%. With the development of deep learning technology, autoencoder models have attracted the attention of many researchers and have been applied in many fields [36,37,38]. Meanwhile, researchers have proposed improved models for traditional autoencoders, such as noise reduction autoencoders, convolutional autoencoders, and stacked autoencoders. Autoencoder models have been successfully applied in anomaly detection and fault diagnosis [39,40] due to their ability to learn effective data representations for downstream classification or regression tasks. Zhang et al. [41] proposed a method for anomaly detection in high-dimensional data based on an autoencoder and least squares support vector machine. The experimental results on real high-dimensional datasets demonstrate the method’s excellent performance. Yang et al. [42] proposed the STC-LSTM-AE method, a spatiotemporal correlation neural network based on LSTM and autoencoder, for unsupervised anomaly detection and the recovery of UAV flight data. The model uses the Savitzky–Golay filtering technique to reduce sensitivity to data noise. The effectiveness of the method is verified using real UAV flight data.
However, although traditional autoencoder models are commonly used in UAV anomaly detection research, stacked autoencoders, a deep model, have received less attention in this field. Due to the relative simplicity of the structure of the traditional self-encoder model, it may have insufficient feature extraction ability and overfitting problems when dealing with high-dimensional data. UAV flight data are typical high-dimensional data, so it is of great significance to investigate the application of stacked self-encoders in UAV flight data anomaly detection. In addition, as the difficulty of UAV missions increases and the harsh environment in which they operate increases, the Accuracy of UAV status information acquisition decreases, and the collected flight data contain a large amount of noisy data, which reduces the effectiveness of the anomaly detection algorithm to some extent. Therefore, it is necessary to study noise reduction processing for UAV flight data and combine it with deep learning models to improve the Accuracy of the anomaly detection algorithm in detecting noisy data. Wavelet decomposition is a signal processing technology based on wavelet transform, which can be used to remove noise in signals and has been widely used in many research fields [43,44,45,46,47,48].
This paper proposes a UAV flight data anomaly detection method based on wavelet decomposition and stacked denoising autoencoder. The wavelet decomposition technology can effectively denoise the original data. As an efficient representation learning model, the stacked denoising autoencoder can well complete the feature extraction of data, which can then be input to the softmax classifier to achieve the classification and identification of the anomalous state. A series of experiments were conducted on an actual dataset to verify the effectiveness of the proposed method. It was also compared with other common anomaly detection algorithms, and the comparative results demonstrate its superior performance. The innovations of this study are outlined below:
- This study proposes a deep learning method based on wavelet decomposition and stacked denoising autoencoder for detecting anomalies in noisy UAV data.
- The adoption of wavelet decomposition can effectively filter the noise information in the original data and improve the signal-to-noise ratio of the data.
- As a deep representation learning model, the stacked denoising autoencoder can effectively learn the feature representation of high-dimensional UAV data, reduce the data dimension, and overcome the difficulty of insufficient abnormal data in the dataset to a certain extent.
- By improving the reconstruction loss function of the stacked autoencoder model, selecting the PReLU activation function, adding the batch normalization layer, and setting the learning rate dynamic adjustment strategy CosineAnnealingLR, the method gives better performance on real datasets.
This study is divided into five parts. Section 1 outlines the background significance of the study while providing an overview of UAV anomaly detection research and the shortcomings of the current research. Section 2 describes the data and outlines the selected data parameters. It also presents various models and methods, such as wavelet decomposition, autoencoder, denoising autoencoder, stacked denoising autoencoder models, and evaluation metrics for model performance. Section 3 introduces the experimental conditions, research methods, and results, and it conducts a model comparison experiment. Section 4 is the experimental study of some important factors that affect the performance of the model. Finally, Section 5 summarizes the research of this paper.
2. Materials and Methods
2.1. Data Description and Preprocessing
The data used in this study come from the flight data of a certain type of multi-rotor UAV. It contains the position, attitude, speed, altitude, and other related parameters during the UAV flight, specifically 118 parameters. The data contain both normal flight data and two flight anomalies, GPS drift, and UAV spin, as shown in Table 2, and the data are stored in “CSV” format.

Table 2.
The labels of flight data.
Data preprocessing is an important step in the data analysis process. During the analysis, it was found that there are duplicate and missing data in the original dataset. Firstly, the duplicate samples and missing values in the dataset are detected and the redundant duplicate sample data are eliminated; then, the missing data are processed using mean interpolation. In addition, this paper uses the maximum–minimum value method to normalize the original data, and the normalization function is shown in Equation (1).
where represents the original data, represents the normalized data, represents the minimum value of the data, represents the maximum value of the data, and the normalization process is performed for all data.
2.2. Parameters Selection
In this paper, we analyzed the correlation among 11 parameters related to abnormal events that have occurred in UAVs. These parameters were selected from the original dataset with the help of professionals. It is important to note that only a subset of the 118 parameters in the original dataset are related to risky events in UAVs. The Pearson correlation coefficient analysis results are shown in Figure 1.
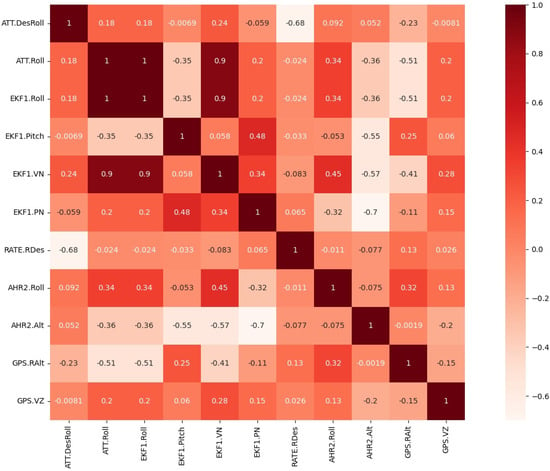
Figure 1.
Correlation analysis heat map.
From the heat map of the Pearson correlation coefficient, it can be seen that the correlation between the parameters ATT.Roll and EKF1.Roll reaches 1, indicating that these two parameters are perfectly correlated. In addition, the correlation of the EKF1.VN parameter with the ATT.Roll and EKF1.Roll parameters is also high. Therefore, the two parameters ATT.Roll and EKF1.Roll must be traded off.
2.3. Wavelet Decomposition
If anomaly detection is performed directly without denoising the noisy data, it is also difficult for the deep model to obtain good learning and classification recognition results. Wavelet decomposition is a signal time–frequency analysis method with good performance in multi-resolution detail analysis. Signal-to-noise separation using wavelet decomposition can largely suppress noise and retain the singular information of the original signal well, which is a simple and effective method [49]. Figure 2 illustrates the primary process of noise reduction through wavelet decomposition, which involves three main steps.
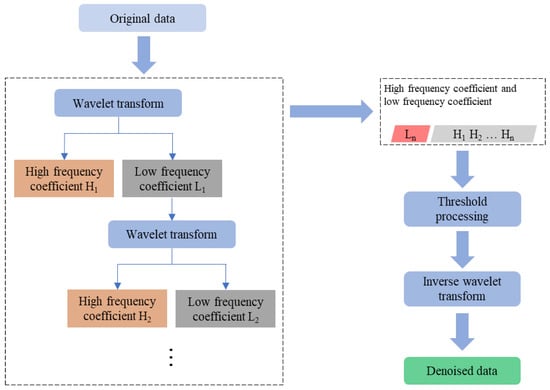
Figure 2.
The process of wavelet decomposition.
- Wavelet transform. Select the appropriate wavelet basis function and number of decomposition layers for wavelet decomposition of the signal to obtain the low-frequency coefficients and high-frequency coefficients.
- Determine the threshold and threshold function. High-frequency coefficients are mainly represented as noise signals and effective signals, and low-frequency coefficients are represented as effective signals. Therefore, the high-frequency coefficients are processed with appropriate thresholds and threshold functions, and the low-frequency coefficients are retained.
- Reconstruct the signal. Apply inverse wavelet transform to the low-frequency coefficients and high-frequency coefficients after processing, and the denoised signal can be obtained.
Wavelet transform is the basis of wavelet decomposition denoising, and the process of wavelet transform is shown in Equation (2).
where is the wavelet basis function, a is the scale factor, and b is the translation factor. Common wavelet basis functions include Daubechies wavelet, Symlets wavelet, Coiflets wavelet, and biorthogonal wavelet. The Daubechies wavelet is the most commonly used basis function, and in this study, the db4 wavelet basis function was chosen for wavelet decomposition.
The inverse wavelet transformation process is shown in Equation (3).
where is the allowable condition for the wavelet basis function, as shown in Equation (4).
where is the Fourier transform of .
2.4. Autoencoder (AE)
Autoencoder is an efficient coding method for learning and extracting the main features of the data, which is implemented in the form of neural networks. Autoencoders are trained to reconstruct the input data, and since the training process does not require data labeling, autoencoders are an unsupervised learning model. Figure 3 shows the structure of the standard autoencoder, which typically comprises two parts: the encoder and the decoder. It specifically consists of an output layer, a hidden layer, and an output layer. The encoder network is formed by the input layer and the hidden layer, while the decoder network is formed by the hidden layer and the output layer. Typically, the number of neurons in the hidden layer is lower than that in the input layer, giving the autoencoder the ability to degrade data and extract features. Additionally, the use of activation functions to introduce nonlinearity can enhance the autoencoder’s representation learning ability.
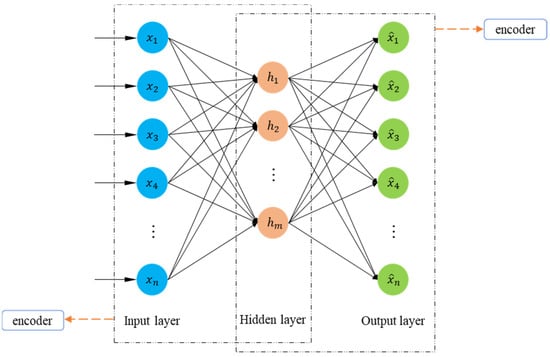
Figure 3.
The structure of standard autoencoder.
The encoder’s task is to learn the primary features of the input data and map the input signal to the hidden layer space. The decoder’s task is to restore the transformed data to its original space representation. Equation (5) is used for encoding, and Equation (6) is used for decoding.
where is the activation function of the encoder network, is the weight matrix of the encoder network, is the bias vector, and is the hidden layer vector.
where is the activation function of the decoder network, is the weight matrix of the encoder network, is the bias vector, and is the hidden layer vector. Activation functions and are both nonlinear functions used to learn nonlinear relationships between data. Commonly used activation functions include ReLu, Sigmoid, and Tanh.
The goal of training the autoencoder is to optimize the parameters of the autoencoder to minimize the reconstruction error . The mean square error is usually used to calculate the reconstruction error, and the reconstruction error and the loss function are shown in Equations (7) and (8).
2.5. Denoising Autoencoder (DAE)
Denoising autoencoder is an extension of the traditional autoencoder. It adds noise to input data based on the autoencoder and then reconstructs “clean” data from noisy input data by training the network. Compared with traditional autoencoder, the denoising autoencoder can learn more robust feature representation and has good generalization ability [50]. The structure of the DAE is shown in Figure 4.
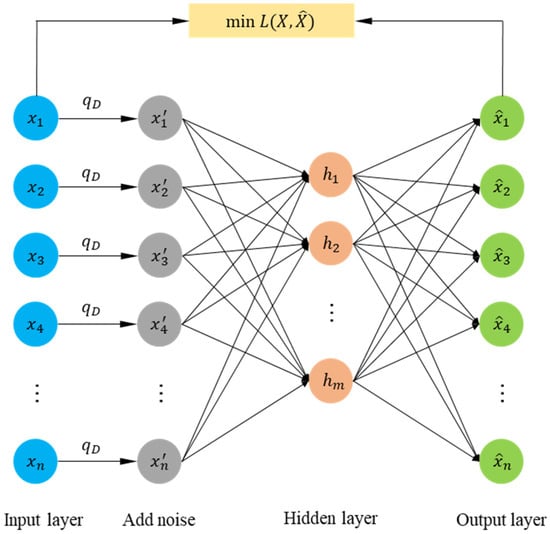
Figure 4.
The structure of denoising autoencoder (DAE).
represents the original ‘clean’ data, represents the noisy data and represents the ‘clean’ data reconstructed by DAE. is obtained from “clean” data by a stochastic mapping: . This conditional distribution represents the probability that a given sample of data produces a sample containing noise. The common method for introducing noise involves applying Gaussian noise or randomly setting values to zero. In this paper, we will take the way of adding Gaussian noise to train the denoising autoencoder. The optimization objective of the denoising autoencoder is to minimize the error between the clean data and the reconstructed output, and the loss function is shown in Equation (9).
2.6. Stacked Denoising Autoencoder (SDAE)
The traditional denoising autoencoder is improved based on the standard autoencoder, which only consists of an encoder and a decoder, while the stacked denoising autoencoder is a deep learning model that stacks multiple denoising autoencoders. The stacked denoising autoencoder utilizes the encoder output of the i-th denoising autoencoder as the encoder input of the i + 1 denoising autoencoder. Greedy training is then completed layer by layer. Compared with the denoising autoencoder, the stacked denoising autoencoder has a deeper network structure and can learn deeper feature representations from input data in an unsupervised manner. Then, the deep feature representations learned by SDAE are input into the softmax classifier. Finally, a small amount of labeled data is used for network fine-tuning to achieve the anomaly classification recognition of UAV flight data. The structure of the stacked noise reduction self-encoder is shown in Figure 5 [51].
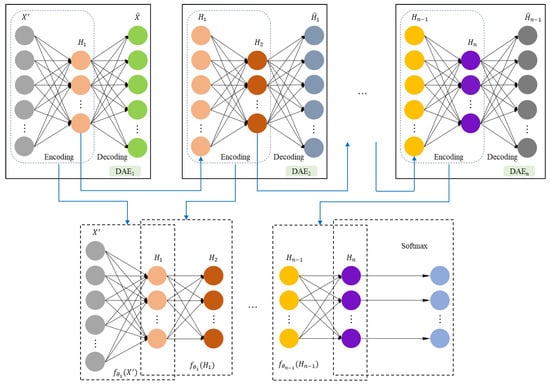
Figure 5.
The structure of stacked denoising autoencoder (SDAE).
The training of the stacked noise reduction autoencoder model can be divided into two stages: pre-training and fine-tuning. The task of the pre-training phase is to train multiple denoising autoencoders and stack them. After training the first noise-reducing autoencoder, the weights and biases of the output layer are removed, and the output of the hidden layer is used as the input of the next denoising autoencoder, which is used to complete the training of the second denoising autoencoder, and so on to complete the stacking of multiple denoising autoencoder networks. At the same time, to achieve the classification and identification of the UAV flight anomalies, the softmax classifier is added at the end of the network. After the pre-training of the SDAE network is completed, the weights of the SDAE network and the weights of the Softmax classification layer are used as the initial parameters of the deep network, and the back-propagation algorithm is used to fine-tune the network and update the network weights.
In the SDAE training process, the mean square error shown in Equation (9) is traditionally used as the loss function. However, it can lead to overfitting. To improve the generalization performance of SDAE, this paper considers adding the L2 regularization term to the traditional loss function to reduce the complexity and instability of the model, as shown in Equations (10)–(12). Here, is the regularization parameter of the weight penalty term.
2.7. Model Evaluation Metrics
To comprehensively evaluate the effectiveness of the proposed model in UAV flight data anomaly detection and compare it with other models, this paper intends to use Accuracy, Precision, Recall, and F1-score as model evaluation indexes. The Accuracy is the proportion of samples that are correctly classified; the Precision is the proportion of samples that are truly abnormal or normal out of all samples that the model judges to be abnormal or normal; and the Recall is the proportion of samples that are correctly classified as abnormal or normal out of all samples that are abnormal or normal. The prediction results of the classifier are classified into four main cases: true-positive class (TP), false-positive class (FP), false-negative class (FN), and true-negative class (TN). Therefore, the Accuracy, Precision, Recall, and F1-score are calculated as follows:
3. Experiments and Results
3.1. Anomaly Detection Model
To validate the performance of the anomaly detection model based on wavelet decomposition and stacked noise reduction self-coding proposed in this paper, experiments are conducted using real UAV flight datasets. All experiments are implemented based on Python (3.10) on a computer equipped with Intel(R) Core (TM) i7-8550U CPU, NVIDIA GeForce MX150 GPU, 16 GB RAM, and Windows 10 64-bit system. The framework of the anomaly detection model proposed in this paper is shown in Figure 6.
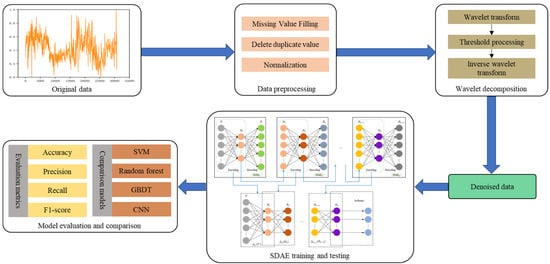
Figure 6.
The framework of the proposed approach in this work.
Firstly, we perform necessary preprocessing operations on the raw data to achieve the deletion of duplicate values, the supplement of missing values, and the normalization of data. Secondly, the wavelet decomposition method is used to denoise the preprocessed data to overcome the impact of noise on the subsequent model detection effect. Thirdly, the data are divided into training and test sets. The training set is used to train the stacked denoising autoencoder network and the softmax classifier as well as optimize the model parameters. Finally, the model’s effectiveness is validated on the test dataset and compared with other models to demonstrate the advantages of the proposed method.
3.2. Experimental Analysis
3.2.1. Wavelet Decomposition
Firstly, we used wavelet decomposition with the db4 wavelet basis function and soft thresholding processing to denoise the preprocessed data. For example, we decomposed the AHR2. Then, we rolled parameter data into high-frequency and low-frequency data using wavelet decomposition and reconstruction. Figure 7 shows (a) the low-frequency component after three-level wavelet decomposition, (b) the high-frequency component after one-layer wavelet decomposition, (c) the wavelet component after two-layer decomposition, and (d) the low-frequency component after three-layer wavelet decomposition.
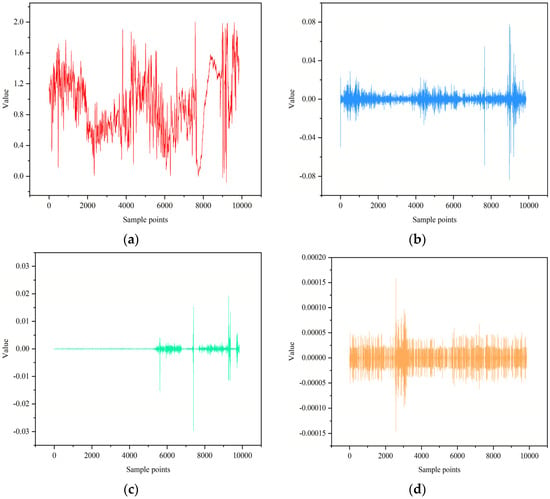
Figure 7.
Sample graphs of wavelet decomposition. (a) Low-frequency data after three-level decomposition; (b) high-frequency data after first-level decomposition; (c) high-frequency data after secondary decomposition; (d) high-frequency data after three-level decomposition.
It can be seen from Figure 7 that the original data are decomposed into high-frequency components and low-frequency components by wavelet decomposition. The small amplitude high-frequency component is similar to the Gaussian signal and contains less valuable information, which can be considered as noise contained in the original data. On the other hand, the low-frequency component contains almost all the characteristics and trend information of the data, making it clean data. Furthermore, as the number of decomposition layers increases, the extreme value of the high-frequency noise component is smaller and smaller, which means that the denoising effect increases with the increase of decomposition layers.
3.2.2. SDAE Training
The processed data are split 7:3 into training and test data for training and testing the stacked denoising autoencoder. The depth of the SDAE network structure will directly affect the classification performance of the model. The research of Larochelle et al. [52] shows that the fault diagnosis Accuracy of the deep learning model improves with the increase in the number of hidden layers of the model. However, when the number of hidden layers of the network exceeds 3, the Accuracy and generalization ability of the model will become worse. To balance the Accuracy and generalization ability of the SDAE model, the number of hidden layers of the SDAE network is set to 3. The Adam optimizer is an optimization algorithm with an adaptive learning rate, which has proven to be very effective in practice, so the Adam optimizer is selected.
The sigmoid function and the rectified linear unit (ReLU) function are commonly used in the training of autoencoders. However, the sigmoid function is prone to problems such as gradient disappearance and large calculation costs. The ReLU activation function will put the neuron in a state of inhibition when the neuron receives negative signals, which can increase the sparse effect of the training process and extract sparse features. However, in stacked autoencoders, overly sparse features are not favorable for the decoder to generate samples, which results in inadequate fitting. Therefore, the PReLU function is adopted as the activation function in this paper, and the PReLU activation function is shown in Equation (17).
For the PReLU activation function, the coefficients in the negative part are not constant but are adaptively learned to be updated, which is usually completed by the momentum method as shown in Equation (18).
where is the momentum, is the learning rate, and is the objective function.
The difference between ReLU and PReLU is shown in Figure 8, which shows that the PReLU activation function allows the neuron to produce an output value when x < 0. At the same time, the PReLU activation function increases the number of parameters by a very small amount compared to ReLU, resulting in a small risk of overfitting the network, which avoids the poor fit caused by excessive sparseness of features, and it does not affect the generalization performance of the model.
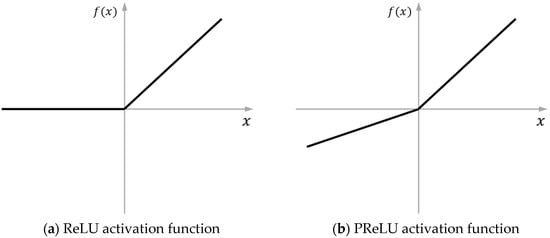
Figure 8.
The difference between ReLU and PReLU.
To prevent overfitting, we add an L2 regularization term to the traditional MSE loss function, as shown in Equation (10). Furthermore, to solve the problems of gradient disappearance and explosion that may arise during the training of stacked autoencoders, this paper adapts the batch normalization method [53] by adding a batch normalization layer to the network. The batch normalization first performs a whitening process on the input data, as shown in Equation (19).
where represents the mean of a batch of input data, denotes the variance of the batch, and is a very small integer avoiding a denominator of 0. After the whitening process, the data were linearly transformed, as shown in Equation (20).
where are updated by iterative training. After applying Equation (20), the network effectively incorporates strong nonlinear expression capabilities, thereby circumventing convergence problems arising from extreme values within the nonlinear interval and enhancing overall convergence speed.
Overall, the main training parameters of the SDAE network are shown in Table 3. The CosineAnnealingLR is a learning rate scheduler, which means that the learning rate is dynamically adjusted according to the cosine function during the model training process. This strategy is widely used in deep learning and has been shown to be effective on many tasks. The initial learning rate in this study was set to 0.053.

Table 3.
Description of SDAE parameters.
The trained model was used to run five experiments on the test data. The Accuracy, Precision, Recall, and F1-score of the five experiments are shown in Figure 9.
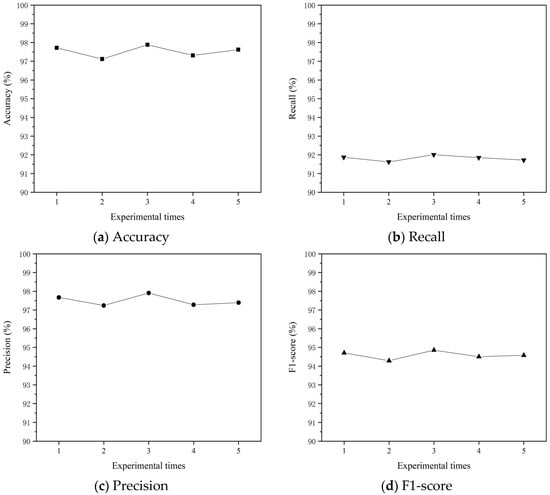
Figure 9.
Model experiment results.
As can be seen in Figure 9, the Accuracy and Precision of the model is around 97% and the Recall is also over 91%, while the F1-score reaches over 94%. The model’s four performance metrics remained stable across all five experiments, indicating its reliability. Table 4 shows the model’s performance on the test data, which was calculated by averaging the results of the five experiments. The results show that Accuracy is 97.53%, Precision is 97.50%, Recall is 91.81% and F1-score is 94.59%.

Table 4.
The experimental results of the proposed approach.
Furthermore, we select multiple fault detection models for comparison, including SVM, random forest, GBDT, and CNN. The comparison results are shown in Table 5.

Table 5.
Comparison of experimental results of 5 models.
As can be seen from Table 5, the SVM model has the worst classification results with an Accuracy of only 76.87%. Random forest and GBDT are common ensemble learning models that integrate multiple decision trees to improve the classification Accuracy of the model. The Accuracy of random forest and GBDT is 84.13% and 89.00%, respectively. However, the Recall rate of the random forest model is only 80.94%, indicating that the model may misidentify abnormal data as normal data. As a common deep neural network model, CNN achieves the highest Accuracy among the four contrast models, but the Precision is low. Compared with the four contrast models, the method proposed in this paper achieves better results, which utilizes both normal and abnormal data from the historical UAV flight dataset to fully extract the deep robust features of the data through the encoding and decoding process. Therefore, it can achieve more efficient anomaly identification, which is conducive to identifying risks during UAV flight and improving the reliability and safety of UAVs in performing their tasks.
4. Discussion
To assess the effectiveness and importance of wavelet decomposition denoising, we conducted a repeated experiment using the stacked denoising autoencoder without wavelet decomposition. We kept all data preprocessing operations and parameter settings the same as in the original experiment. The results of the two experiments are shown in Table 6.

Table 6.
Comparison of SDAE and WD-SDAE.
Table 6 shows that the stacked noise reduction autoencoder model achieves better classification after wavelet denoising. This indicates that wavelet decomposition effectively reduces the negative impact of high-frequency noise on feature extraction, and the SDAE extracts important feature representations.
To explore the influence of wavelet decomposition layers on subsequent models, we tested the data filtered by different wavelet layers. In the test, other experimental settings were identical except for wavelet decomposition layers. The wavelet decomposition layers are set as 1, 2, 3, and 4, respectively, for the experiment, and the results are shown in Table 7.

Table 7.
Experimental results under different wavelet decomposition layers.
It can be seen from Table 7 that when the number of wavelet decomposition layers is 1, 2, 3, and 4, the Accuracy of the model is 95.73%, 96.71%, 97.53%, and 95.18%, respectively. The model works best when the number of wavelet decomposition layers is 3.
In addition, the Accuracy of the model increases as the number of wavelet decomposition layers increases, which may be since as the number of wavelet decomposition layers increases, the greater the filtering of high-frequency noise. However, when the number of wavelet decomposition layers is 4, the model’s Accuracy does not increase but decreases, which may be that excessive filtering destroys the important features of the data.
The random noise added to the network is an important factor affecting the performance of the stacked denoising autoencoder. Excessive noise interference will increase the difficulty of model training and reconstruction output, and affect the result of feature learning. Too little noise may lead to the inability to extract robust feature representation. To determine the appropriate noise and make the model extract more robust feature expression, this paper carried out test experiments with different proportions of Gaussian noise and selected the appropriate noise ratio according to their training loss results. Under the same model structure, the noise ratios of 0.05, 0.1, 0.15, 0.2, 0.25, and 0.3 are selected for training. The training loss results under different noise ratios are shown in Figure 10.
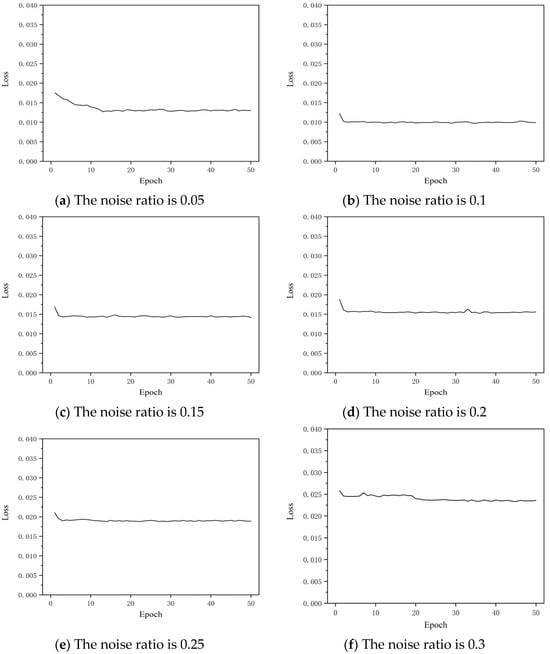
Figure 10.
The results of training loss under different noise ratios.
It can be seen from Figure 10 that under the same training round, when the noise ratio is 0.1, the training loss value is the smallest, which indicates that the feature extraction and data reconstruction ability of the model is the best at this time. In addition, Figure 10c–f show that if a larger proportion of Gaussian noise is added, the loss value of the model will increase. Therefore, it is necessary to add an appropriate proportion of noise in combination with the actual situation of the data, which will help the model extract robust data features and better reconstruct the data.
5. Conclusions
Anomaly detection based on UAV flight data is a powerful means of UAV condition monitoring and potential abnormal state mining, which is of great significance to reduce the risk of UAV flight accidents and improve the safety of UAV operation. However, with the increasing diversity of UAV mission scenarios and the harsher environment, the Accuracy of UAV state information acquisition is reduced, and the noise contained affects the Accuracy of the anomaly detection algorithm to a certain extent. In order to overcome the negative impact of noise in the original data on the anomaly detection model and combine it with the feature extraction ability of the deep learning model, this paper proposes a UAV anomaly detection method based on wavelet decomposition and stacked denoising autoencoder. As an efficient representation learning model, the stacked denoising autoencoder can extract robust feature representations. Meanwhile, the use of wavelet decomposition helps to eliminate the negative impact of high-frequency noise on the model.
This paper conducts experiments on real UAV datasets and evaluates the model performance with Accuracy, Precision, Recall, and F1-score. The comparison with other common anomaly detection models also reflects the excellent performance of the proposed method. The proposed method can overcome the negative impact of noise in the original data, and the Accuracy and Precision in multiple tests reach more than 97%. Meanwhile, the Recall reaches 91.81%, and the F1-score reaches 94.57%.
Finally, we explore some important factors that affect the performance of the model. The conclusions are as follows:
- (1)
- Using wavelet decomposition to filter the original data can remove the negative impact of noise and improve the model’s performance.
- (2)
- Three-layer wavelet decomposition can achieve the best denoising effect, and excessive filtering may destroy the important features of the data and cause the performance of the model to decline.
- (3)
- The proportion of random noise in the stacked denoising autoencoder needs to be determined according to the specific data. An appropriate proportion of noise is beneficial to the model to extract robust data features and better reconstruct data, while an excessive proportion of noise will be counterproductive.
Author Contributions
Conceptualization, S.Z.; Data curation, Z.H. and X.C.; Formal analysis, Z.H.; Funding acquisition, S.Z.; Investigation, Z.H. and X.C.; Methodology, S.Z. and Z.H.; Resources, W.C.; Supervision, W.C.; Validation, X.C.; Visualization, Z.H. and X.C.; Writing—original draft, Z.H.; Writing—review and editing, Z.H. All authors have read and agreed to the published version of the manuscript.
Funding
This research was funded by the National Natural Science Foundation of China (Grant No. 72371013 & 71971013) and the Fundamental Research Funds for the Central Universities (YWF-23-L-933). The study was also sponsored by the Teaching Reform Project and Graduate Student Education and Development Foundation of Beihang University.
Data Availability Statement
Due to privacy and ethical restrictions, the authors do not provide data. If readers request data, readers can contact authors via email.
Conflicts of Interest
The authors declare no conflicts of interest.
References
- Fan, B.; Li, Y.; Zhang, R.; Fu, Q. Review on the Technological Development and Application of UAV Systems. Chin. J. Electron. 2020, 29, 199–207. [Google Scholar] [CrossRef]
- Shamta, I.; Demir, B.E. Development of a deep learning-based surveillance system for forest fire detection and monitoring using UAV. PLoS ONE 2024, 19, e299058. [Google Scholar] [CrossRef] [PubMed]
- Luo, Y.H.; Yu, X.; Yang, D.S.; Zhou, B.W. A survey of intelligent transmission line inspection based on unmanned aerial vehicle. Artif. Intell. Rev. 2023, 56, 173–201. [Google Scholar] [CrossRef]
- Yang, L.; Jia, G.; Wei, F.; Chang, W.; Zhou, S.; Li, C. The cipca-bpnn failure prediction method based on interval data compression and dimension reduction. Appl. Sci. 2021, 11, 3448. [Google Scholar] [CrossRef]
- Zhou, S.; Wang, T.; Yang, L.; He, Z.; Cao, S. A Self-Supervised Fault Detection for UAV Based on Unbalanced Flight Data Representation Learning and Wavelet Analysis. Aerospace 2023, 10, 250. [Google Scholar] [CrossRef]
- Alos, A.M.; Dahrouj, Z.; Dakkak, M. A novel technique to assess UAV behavior using PCA-based anomaly detection algorithm. Int. J. Mech. Eng. Robot. Res. 2020, 9, 721–726. [Google Scholar]
- Wang, B.; Chen, Y.; Liu, D.; Peng, X. An embedded intelligent system for on-line anomaly detection of unmanned aerial vehicle. J. Intell. Fuzzy Syst. 2018, 34, 3535–3545. [Google Scholar] [CrossRef]
- Bronz, M.; Baskaya, E.; Delahaye, D.; Puechmore, S. Real-time Fault Detection on Small Fixed-Wing UAVs using Machine Learning. In Proceedings of the 2020 AIAA/IEEE 39th Digital Avionics Systems Conference (DASC), San Antonio, TX, USA, 11–15 October 2020; pp. 1–10. [Google Scholar]
- Yaman, O.; Yol, F.; Altinors, A. A Fault Detection Method Based on Embedded Feature Extraction and SVM Classification for UAV Motors. Microprocess. Microsy. 2022, 94, 104683. [Google Scholar] [CrossRef]
- González-Etchemaite, J.I.; Pose, C.D.; Giribet, J.I. Rotor Fault Detection and Identification in Multirotors Based on Supervised Learning. Unmanned Syst. 2023, 1–15. [Google Scholar] [CrossRef]
- Thanaraj, T.; Low, K.H.; Ng, B.F. Actuator fault detection and isolation on multi-rotor UAV using extreme learning neuro-fuzzy systems. ISA T. 2023, 138, 168–185. [Google Scholar]
- Li, L.; Das, S.; John Hansman, R.; Palacios, R.; Srivastava, A.N. Analysis of Flight Data Using Clustering Techniques for Detecting Abnormal Operations. J. Aerosp. Inform. Syst. 2015, 12, 587–598. [Google Scholar] [CrossRef]
- Altinors, A.; Yol, F.; Yaman, O. A sound based method for fault detection with statistical feature extraction in UAV motors. Appl. Acoust. 2021, 183, 108325. [Google Scholar] [CrossRef]
- Duan, Y.; Zhao, Y.; Xu, Y.; Peng, Y.; Liu, D. Unmanned aerial vehicle sensor data anomaly detection using kernel principle component analysis. In Proceedings of the 2017 13th IEEE International Conference on Electronic Measurement & Instruments (ICEMI), Yangzhou, China, 20–22 October 2017; pp. 241–246. [Google Scholar]
- Ahn, H.; Moon, S.T.; Choi, H.L.; Kang, M. Learning-based anomaly detection and monitoring for swarm drone flights. Appl. Sci. 2019, 9, 5477. [Google Scholar] [CrossRef]
- Ma, G.; Xu, S.; Jiang, B.; Cheng, C.; Yang, X.; Shen, Y.; Yang, T.; Huang, Y.; Ding, H.; Yuan, Y. Real-time personalized health status prediction of lithium-ion batteries using deep transfer learning. Energy Environ. Sci. 2022, 15, 4083–4094. [Google Scholar] [CrossRef]
- Kurucan, M.; Özbaltan, M.; Yetgin, Z.; Alkaya, A. Applications of artificial neural network based battery management systems: A literature review. Renew. Sust. Energ. Rev. 2024, 192, 114262. [Google Scholar] [CrossRef]
- Thomas, J.K.; Crasta, H.R.; Kausthubha, K.; Gowda, C.; Rao, A. Battery monitoring system using machine learning. J. Energy Storage 2021, 40, 102741. [Google Scholar] [CrossRef]
- Khorram, A.; Khalooei, M.; Rezghi, M. End-to-end CNN plus LSTM deep learning approach for bearing fault diagnosis. Appl. Intell. 2021, 51, 736–751. [Google Scholar] [CrossRef]
- Hoang, D.T.; Kang, H.J. A Motor Current Signal-Based Bearing Fault Diagnosis Using Deep Learning and Information Fusion. IEEE T. Instrum. Meas. 2020, 69, 3325–3333. [Google Scholar] [CrossRef]
- Niu, G.X.; Wang, X.; Golda, M.; Mastro, S.; Zhang, B. An optimized adaptive PReLU-DBN for rolling element bearing fault diagnosis. Neurocomputing 2021, 445, 26–34. [Google Scholar] [CrossRef]
- He, M.; He, D. A new hybrid deep signal processing approach for bearing fault diagnosis using vibration signals. Neurocomputing 2020, 396, 542–555. [Google Scholar] [CrossRef]
- Manna, T.; Anitha, A. Hybridization of rough set-wrapper method with regularized combinational LSTM for seasonal air quality index prediction. Neural Comput. Appl. 2024, 36, 2921–2940. [Google Scholar] [CrossRef]
- Schürholz, D.; Kubler, S.; Zaslavsky, A. Artificial intelligence-enabled context-aware air quality prediction for smart cities. J. Clean. Prod. 2020, 271, 121941. [Google Scholar] [CrossRef]
- Kaur, M.; Singh, D.; Jabarulla, M.Y.; Kumar, V.; Kang, J.S.; Lee, H.N. Computational deep air quality prediction techniques: A systematic review. Artif. Intell. Rev. 2023, 56, 2053–2098. [Google Scholar] [CrossRef]
- Chang, W.; Chen, X.; He, Z.; Zhou, S. A Prediction Hybrid Framework for Air Quality Integrated with W-BiLSTM(PSO)-GRU and XGBoost Methods. Sustainability 2023, 15, 16064. [Google Scholar] [CrossRef]
- Xiao, K.; Zhao, J.; He, Y.; Li, C.; Cheng, W. Abnormal Behavior Detection Scheme of UAV Using Recurrent Neural Networks. IEEE Access 2019, 7, 110293–110305. [Google Scholar] [CrossRef]
- Wang, B.; Wang, Z.; Liu, L.; Liu, D.; Peng, X. Data-Driven Anomaly Detection for UAV Sensor Data Based on Deep Learning Prediction Model. In Proceedings of the 2019 Prognostics and System Health Management Conference (PHM-Paris), Paris, France, 2–5 May 2019; pp. 286–290. [Google Scholar]
- Jeon, S.; Kang, J.; Kim, J.; Cha, H. Detecting structural anomalies of quadcopter UAVs based on LSTM autoencoder. Pervasive Mob. Comput. 2023, 88, 101736. [Google Scholar] [CrossRef]
- Yang, T.; Chen, J.; Deng, H.; Lu, Y. UAV Abnormal State Detection Model Based on Timestamp Slice and Multi-Separable CNN. Electronics 2023, 12, 1299. [Google Scholar] [CrossRef]
- Wang, B.; Liu, D.; Peng, Y.; Peng, X. Multivariate Regression-Based Fault Detection and Recovery of UAV Flight Data. IEEE Trans. Instrum. Meas. 2020, 69, 3527–3537. [Google Scholar] [CrossRef]
- Wang, G.; Ai, J.; Mo, L.; Yi, X.; Wu, P.; Wu, X.; Kong, L. Anomaly Detection for Data from Unmanned Systems via Improved Graph Neural Networks with Attention Mechanism. Drones 2023, 7, 326. [Google Scholar] [CrossRef]
- Zhong, J.; Zhang, Y.; Wang, J.; Luo, C.; Miao, Q. Unmanned Aerial Vehicle Flight Data Anomaly Detection and Recovery Prediction Based on Spatio-Temporal Correlation. IEEE Trans. Rel. 2022, 71, 457–468. [Google Scholar] [CrossRef]
- Anidjar, O.H.; Barak, A.; Ben-Moshe, B.; Hagai, E.; Tuvyahu, S. A Stethoscope for Drones: Transformers-Based Methods for UAVs Acoustic Anomaly Detection. IEEE Access 2023, 11, 33336–33353. [Google Scholar] [CrossRef]
- Cavallaro, C.; Ronchieri, E. Identifying Anomaly Detection Patterns from Log Files: A Dynamic Approach. In Proceedings of the 21st International Conference on Computational Science and Its Applications (ICCSA 2021), Cagliari, Italy, 13–16 September 2021; pp. 517–532. [Google Scholar]
- Pintelas, E.; Pintelas, P. A 3D-CAE-CNN model for Deep Representation Learning of 3D images. Eng. Appl. Artif. Intell. 2022, 113, 104978. [Google Scholar] [CrossRef]
- Ninkovic, V.; Vukobratovic, D.; Häger, C.; Wymeersch, H.; Amat, A. Autoencoder-Based Unequal Error Protection Codes. IEEE Commun. Lett. 2021, 25, 3575–3579. [Google Scholar] [CrossRef]
- Berahmand, K.; Daneshfar, F.; Salehi, E.S.; Li, Y.F.; Xu, Y. Autoencoders and their applications in machine learning: A survey. Artif. Intell. Rev. 2024, 57, 28. [Google Scholar] [CrossRef]
- Albuquerque Filho, J.E.D.; Brandao, L.C.P.; Fernandes, B.J.T.; Maciel, A.M.A. A Review of Neural Networks for Anomaly Detection. IEEE Access 2022, 10, 112342–112367. [Google Scholar] [CrossRef]
- Gareev, A.; Protsenko, V.; Stadnik, D.; Greshniakov, P.; Yuzifovich, Y.; Minaev, E.; Gimadiev, A.; Nikonorov, A. Improved Fault Diagnosis in Hydraulic Systems with Gated Convolutional Autoencoder and Partially Simulated Data. Sensors 2021, 21, 4410. [Google Scholar] [CrossRef] [PubMed]
- Zhang, X.; Wei, P.; Wang, Q. A hybrid anomaly detection method for high dimensional data. PeerJ Comput. Sci. 2023, 9, e1199. [Google Scholar] [CrossRef] [PubMed]
- Yang, L.; Li, S.B.; Li, C.J.; Zhu, C.C.; Zhang, A.S.; Liang, G.Q. Data-driven unsupervised anomaly detection and recovery of unmanned aerial vehicle flight data based on spatiotemporal correlation. Sci. China Technol. Sc. 2023, 66, 1304–1316. [Google Scholar] [CrossRef]
- Garai, S.; Paul, R.K.; Rakshit, D.; Yeasin, M.; Emam, W.; Tashkandy, Y.; Chesneau, C. Wavelets in Combination with Stochastic and Machine Learning Models to Predict Agricultural Prices. Mathematics 2023, 11, 2896. [Google Scholar] [CrossRef]
- Kamal, N.; Bakar, A.A.; Zainudin, S. Optimization of Discrete Wavelet Transform Feature Representation and Hierarchical Classification of G-Protein Coupled Receptor Using Firefly Algorithm and Particle Swarm Optimization. Appl. Sci. 2022, 12, 12011. [Google Scholar] [CrossRef]
- Javdanian, H.; Heidari, A.; Raeisi, J. Seismic ground response under wavelet-based decomposed earthquake records. Soil Dyn. Earthq. Eng. 2021, 149, 106865. [Google Scholar] [CrossRef]
- Kumar, A.; Tomar, H.; Mehla, V.K.; Komaragiri, R.; Kumar, M. Stationary wavelet transform based ECG signal denoising method. ISA T. 2021, 114, 251–262. [Google Scholar] [CrossRef]
- Kim, J.; Hasanien, H.M.; Tagayi, R.K. Investigation of noise suppression in experimental multi-cell battery string voltage applying various mother wavelets and decomposition levels in discrete wavelet transform for precise state-of-charge estimation. J. Energy Storage 2023, 73, 109196. [Google Scholar] [CrossRef]
- Jaseena, K.U.; Kovoor, B.C. Decomposition-based hybrid wind speed forecasting model using deep bidirectional LSTM networks. Energ. Convers. Manag. 2021, 234, 113944. [Google Scholar] [CrossRef]
- Wahab, M.F.; O’Haver, T.C. Wavelet transforms in separation science for denoising and peak overlap detection. J. Sep. Sci. 2020, 43, 1998–2010. [Google Scholar] [CrossRef] [PubMed]
- Zhu, K.; Zhang, N.; Ying, S.; Zhu, D. Within-project and cross-project just-in-time defect prediction based on denoising autoencoder and convolutional neural network. IET Softw. 2020, 14, 185–202. [Google Scholar] [CrossRef]
- Chen, L.; Ma, Y.; Hu, H.; Khan, U.S. An effective fault diagnosis approach for bearing using stacked de-noising auto-encoder with structure adaptive adjustment. Measurement 2023, 214, 112774. [Google Scholar] [CrossRef]
- Larochelle, H.; Bengio, Y.; Louradour, J.; Lamblin, P. Exploring strategies for training deep neural networks. J. Mach. Learn. Res. 2009, 10, 1–40. [Google Scholar]
- Peerthum, Y.; Stamp, M. An empirical analysis of the shift and scale parameters in BatchNorm. Inf. Sci. 2023, 637, 118951. [Google Scholar] [CrossRef]
Disclaimer/Publisher’s Note: The statements, opinions and data contained in all publications are solely those of the individual author(s) and contributor(s) and not of MDPI and/or the editor(s). MDPI and/or the editor(s) disclaim responsibility for any injury to people or property resulting from any ideas, methods, instructions or products referred to in the content. |
© 2024 by the authors. Licensee MDPI, Basel, Switzerland. This article is an open access article distributed under the terms and conditions of the Creative Commons Attribution (CC BY) license (https://creativecommons.org/licenses/by/4.0/).