Article

Crater Triangle Matching Algorithm Based on Fused Geometric and Regional Features

1
College of Automation & Electronic Engineering, Qingdao University of Science and Technology, Qingdao 266100, China
2
Shaodong Key Laboratory of Autonomous Landing for Deep Space Exploration, Qingdao 266100, China
*
Author to whom correspondence should be addressed.
Aerospace 2024, 11(6), 417; https://doi.org/10.3390/aerospace11060417
Submission received: 29 March 2024 / Revised: 6 May 2024 / Accepted: 9 May 2024 / Published: 21 May 2024
(This article belongs to the Special Issue Space Navigation and Control Technologies)

Abstract

:
Craters are regarded as significant navigation landmarks during the descent and landing process in small body exploration missions for their universality. Recognizing and matching craters is a crucial prerequisite for visual and LIDAR-based navigation tasks. Compared to traditional algorithms, deep learning-based crater detection algorithms can achieve a higher recognition rate. However, matching crater detection results under various image transformations still poses challenges. To address the problem, a composite feature-matching algorithm that combines geometric descriptors and region descriptors (extracting normalized region pixel gradient features as feature vectors) is proposed. First, the geometric configuration map is constructed based on the crater detection results. Then, geometric descriptors and region descriptors are established within each feature primitive of the map. Subsequently, taking the salience of geometric features into consideration, composite feature descriptors with scale, rotation, and illumination invariance are generated through fusion geometric and region descriptors. Finally, descriptor matching is accomplished by computing the relative distances between descriptors and adhering to the nearest neighbor principle. Experimental results show that the composite feature descriptor proposed in this paper has better matching performance than only using shape descriptors or region descriptors, and can achieve a more than 90% correct matching rate, which can provide technical support for the small body visual navigation task.

1. Introduction

Exploring small bodies contributes to understanding the formation and evolution of the universe for human beings and researching the origin of life [1]. In the past decade, many countries have conducted a series of exploration missions targeting small bodies, such as the United States’ OSIRIS-REx and Lucy’s mission [2,3,4], the European Space Agency’s Rosetta mission [5], and Japan’s Hayabusa2 mission [6]. Craters have played an important role in different extraterrestrial body exploration navigation missions in recent asteroid missions [7,8,9]. In small body exploration missions, craters often serve as navigation landmarks for their wide distribution and remarkable terrain features. However, detecting and recognizing craters from navigation images obtained during the descent and landing process are influenced by variations in scale, illumination, and other factors. As a result, the effectiveness of crater detection and recognition is diminished, consequently affecting the accuracy of image matching [10,11].
Deep learning-based crater detection methods extract deep-level crater features to achieve crater detection, resulting in a higher recognition rate compared to traditional image processing algorithms [12,13]. Wang et al. proposed a deep learning network called CraterIDNet for the detection and recognition of craters by integrating the CNN network framework. They enhanced the recognition rate of craters by optimizing anchor box scales and adjusting the density in the crater detection pipeline [14]. Chen et al. designed a single-stage crater detection network called DPCDN, which uses CReLU modules to reduce the number of parameters and improve the speed of crater detection [15]. Tewari et al. leveraged the Mask R-CNN framework to detect craters from optical images, the digital elevation model, and the slope model, aiming at eliminating duplicate craters and extracting their positions [16]. Delatte and Silburt et al. employed an enhanced U-Net model to segment and extract craters on Mars and Mercury, thereby achieving crater detection [17,18]. Wang et al. designed ERU-Net, which enhances the capability of crater feature extraction by incorporating deep residual network modules [19]. Yang et al. proposed an end-to-end high-resolution feature pyramid network (HRFPNet), which uses feature aggregation modules to enhance the feature extraction capability of small- to medium-sized craters [20]. The deep learning-based methods for crater detection learn various deep features of the small body terrain from existing crater image data and achieve crater recognition in different illumination and viewing conditions, demonstrating high accuracy and robustness [21,22].
It is necessary to further achieve the matching of crater recognition results to provide navigation guidance for visual navigation. Composite matching algorithms are an important direction in the current research on image matching. By integrating multiple features and strategies in the matching process, the accuracy and robustness of matching can be improved. Compared to methods that rely solely on image features, incorporating geometric information constraints can reduce the interference of factors such as illumination changes on the matching results. Lu et al. proposed a crater matching algorithm that matches detected craters with an crater database based on the geometric similarity of crater triangles [23]. Park et al. approached crater matching from the perspective of geometric configuration, proposing an algorithm that improves matching accuracy as the number of craters increases [24]. Alfredo et al. achieved the matching of crater triangles by using the ratio of interior angles to the radius of craters and the distance between their centroids [25]. Doppenberg et al., in their matching process, used the invariant order of triangular craters and established feature descriptors for the matching of craters [26]. All of the above algorithms need to fit the crater geometric information. However, under different states and complex small body terrain conditions, the recognized craters form the captured images with scale, rotation and illumination variations. These factors significantly impact the accuracy of crater rim fitting. Therefore, it is necessary to combine the geometric features and regional pixel gradient features extracted within generated crater triangle to further improve the accuracy and robustness of the matching algorithm.
To achieve accurate matching of real small body crater images, deep learning results for crater detection can be integrated with geometric information constraints to match the crater images. In this paper, we propose a composite feature matching method. During the landing process of the detector, a deep learning-based method is used to detect craters. Based on the recognition results, a geometric configuration map is constructed, and feature primitives are designed. After that, support regions are selected to construct geometric descriptors and region descriptors. The salience of geometric features is quantified, and all descriptors are weighted and fused to generate composite feature descriptors. Finally, the generated descriptors are matched by calculating their relative distances based on the nearest neighbor principle. Experimental verification explores the matching effect of composite feature descriptors under scale, illumination and rotation transformations.
This paper is organized as follows: Section 2 describes the process of constructing geometric configuration map. In Section 3, we introduce the process of composite feature descriptors description and matching. Section 4 shows the matching results and discussion. Finally, the paper ends with conclusions in Section 5.

2. Construction of the Geometric Configuration Feature Map

In this section, we will introduce a deep learning-based algorithm to detect craters, then the geometric configuration feature map is constructed by the process of the Delaunay triangulation algorithm.

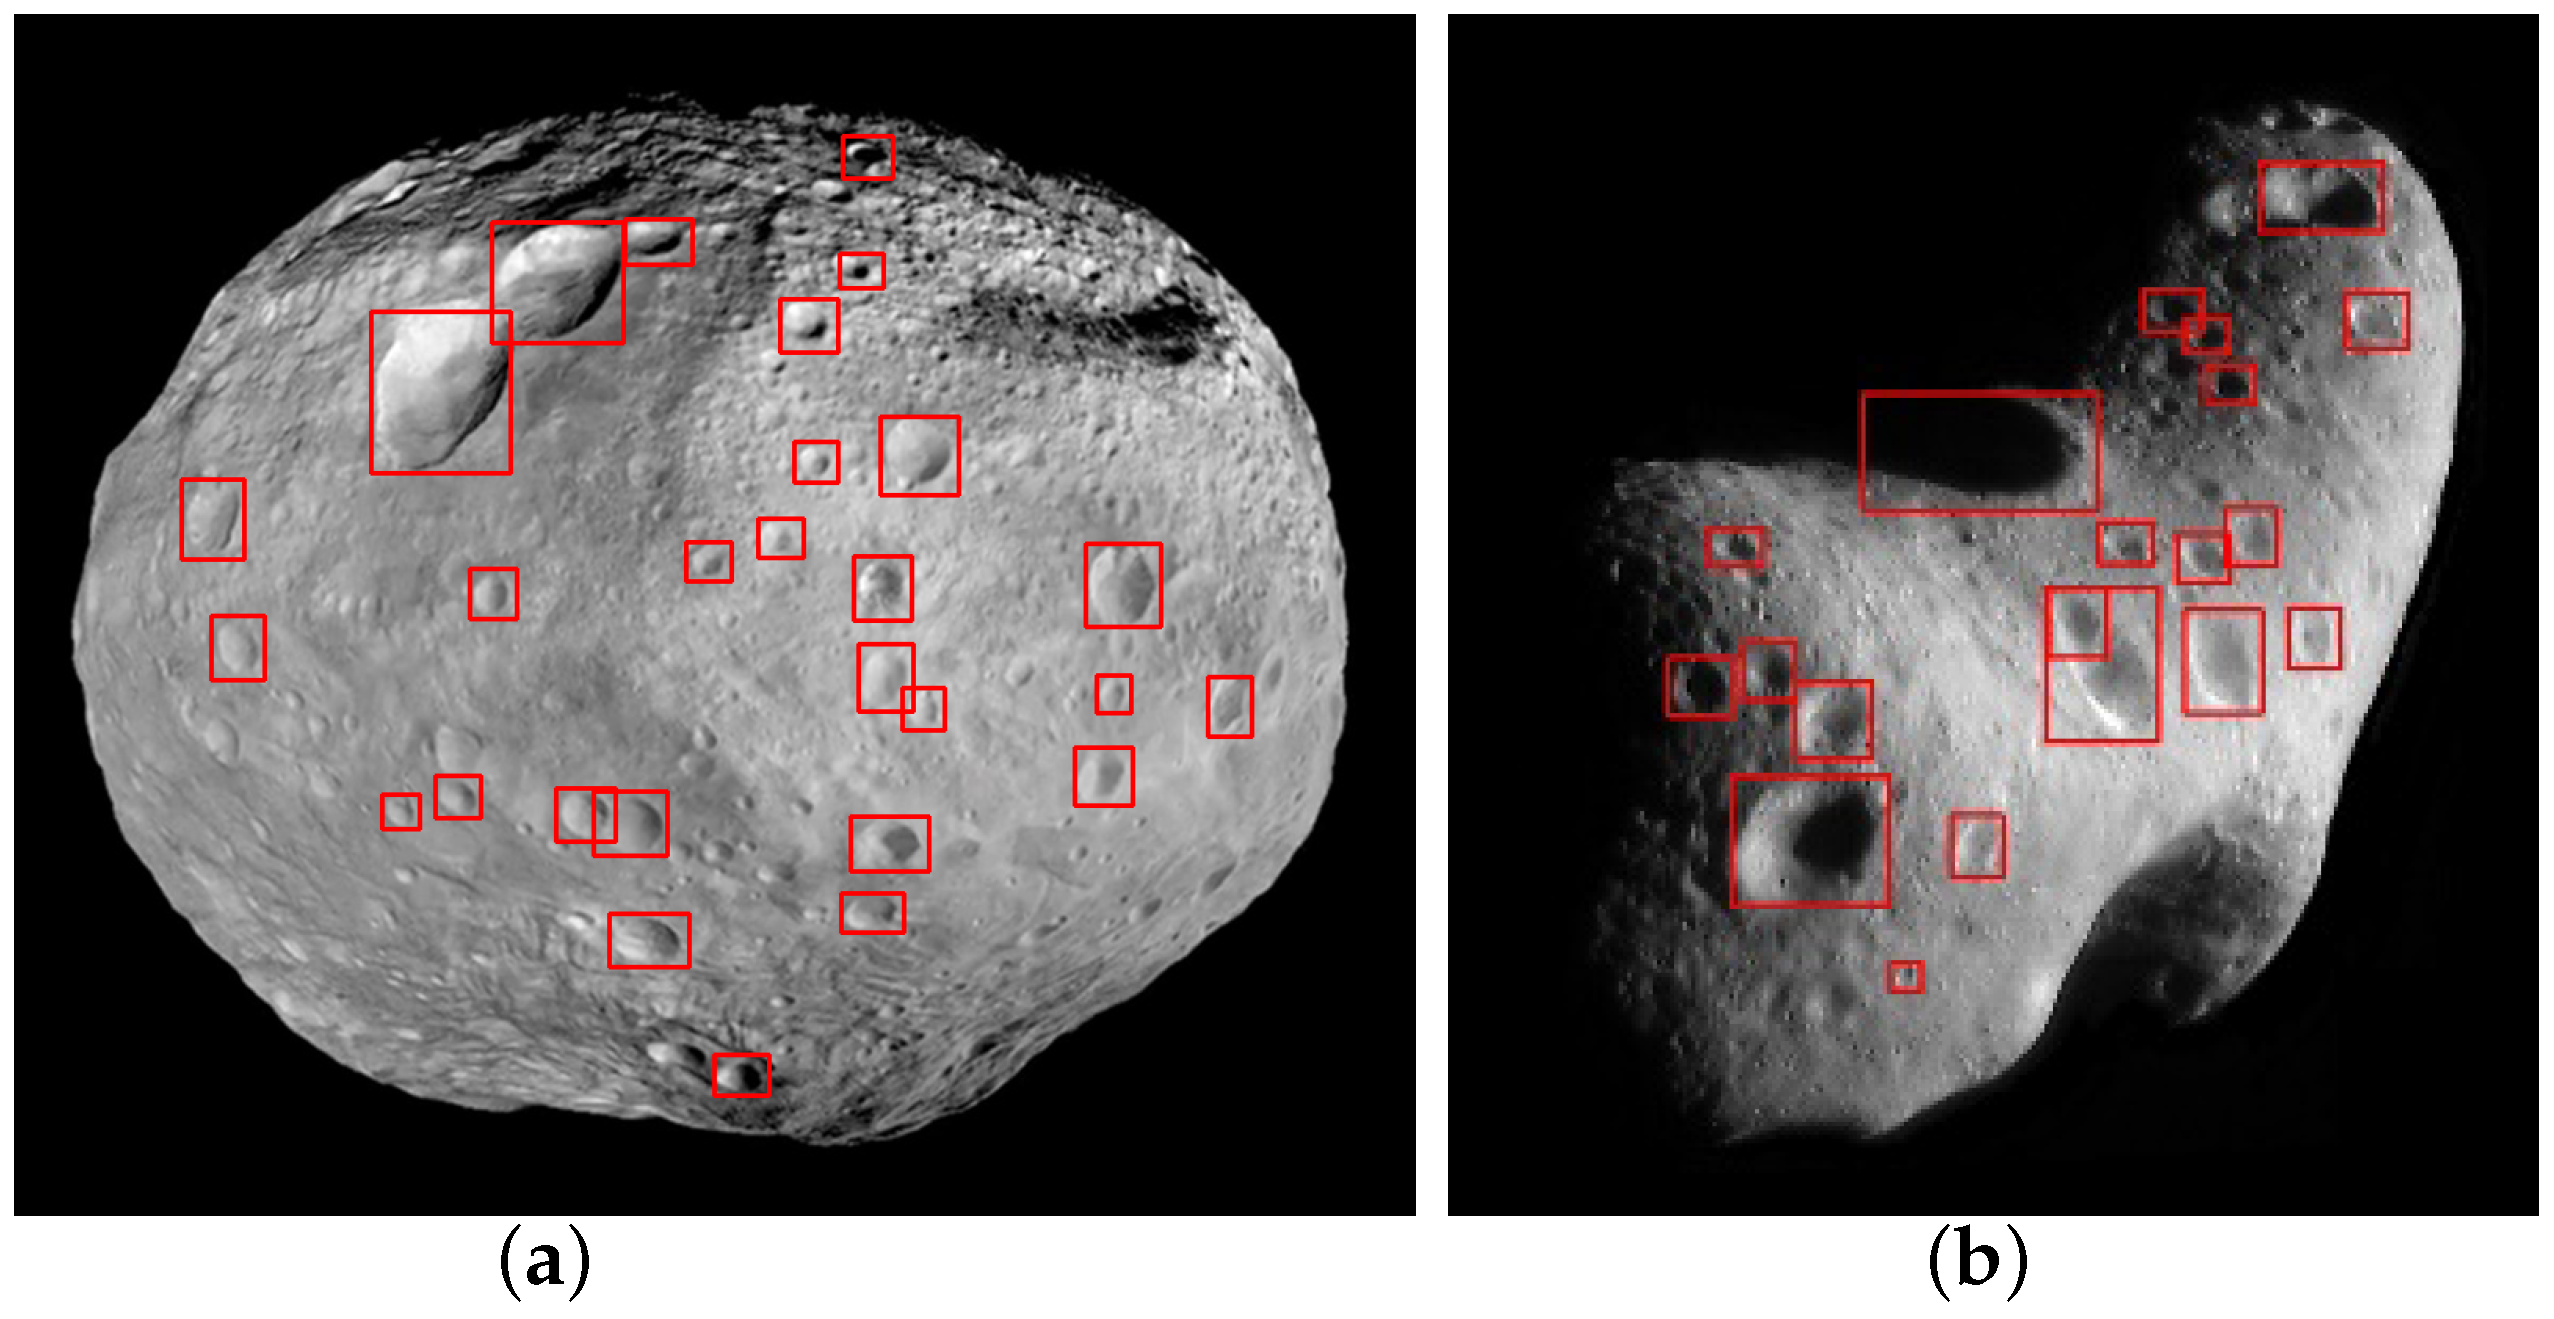
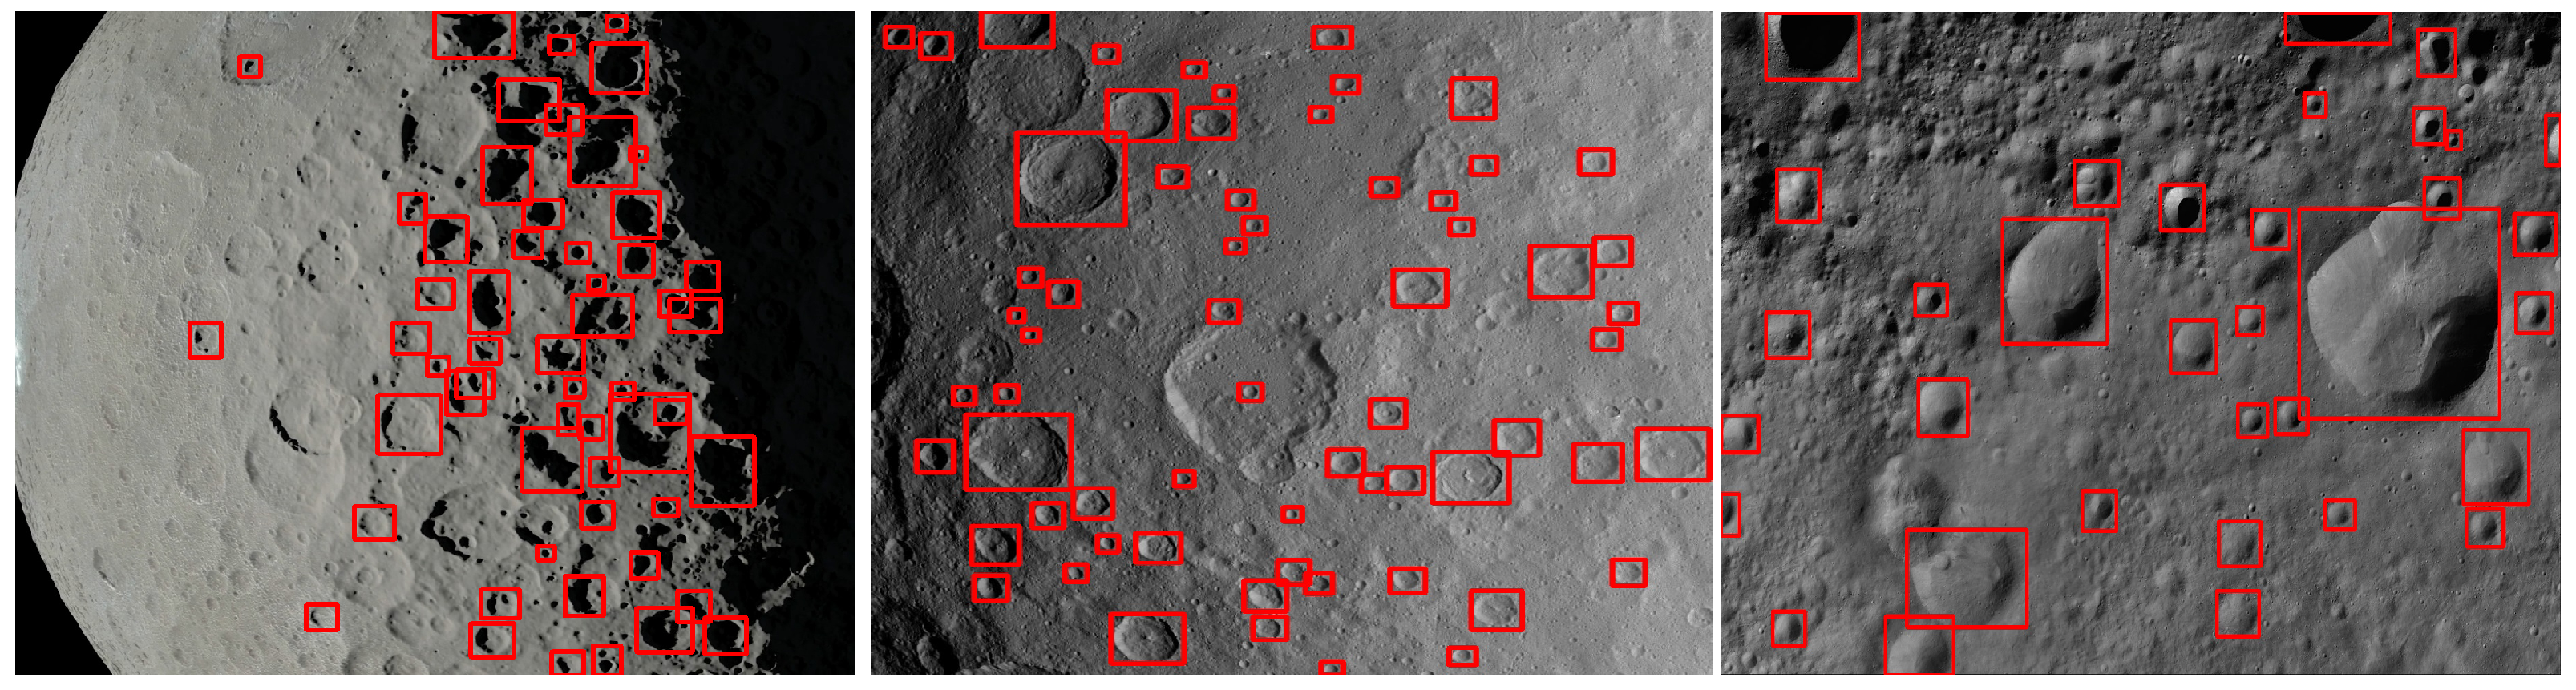
2.1. Crater Detection Based on Deep Learning Method

Deep learning methods possess strong capabilities in extracting deep features from data, presenting significant advantages over traditional algorithms in extracting crater features. In the process of visual navigation tasks for target recognition and obstacle avoidance, the Yolov7 network [27] is used for crater detection. Various data augmentation techniques, including known environmental morphology feature images and navigation images captured during flyby and hover segments, combined with perspective transformation, are employed to construct a benchmark dataset of surface terrain features for small body crater detection. The recognition results of the deep learning-based small body crater detection algorithm for Vesta and Eros are shown in Figure 1, with a detection rate of 85.42%, and a single-frame detection time of 10 ms.

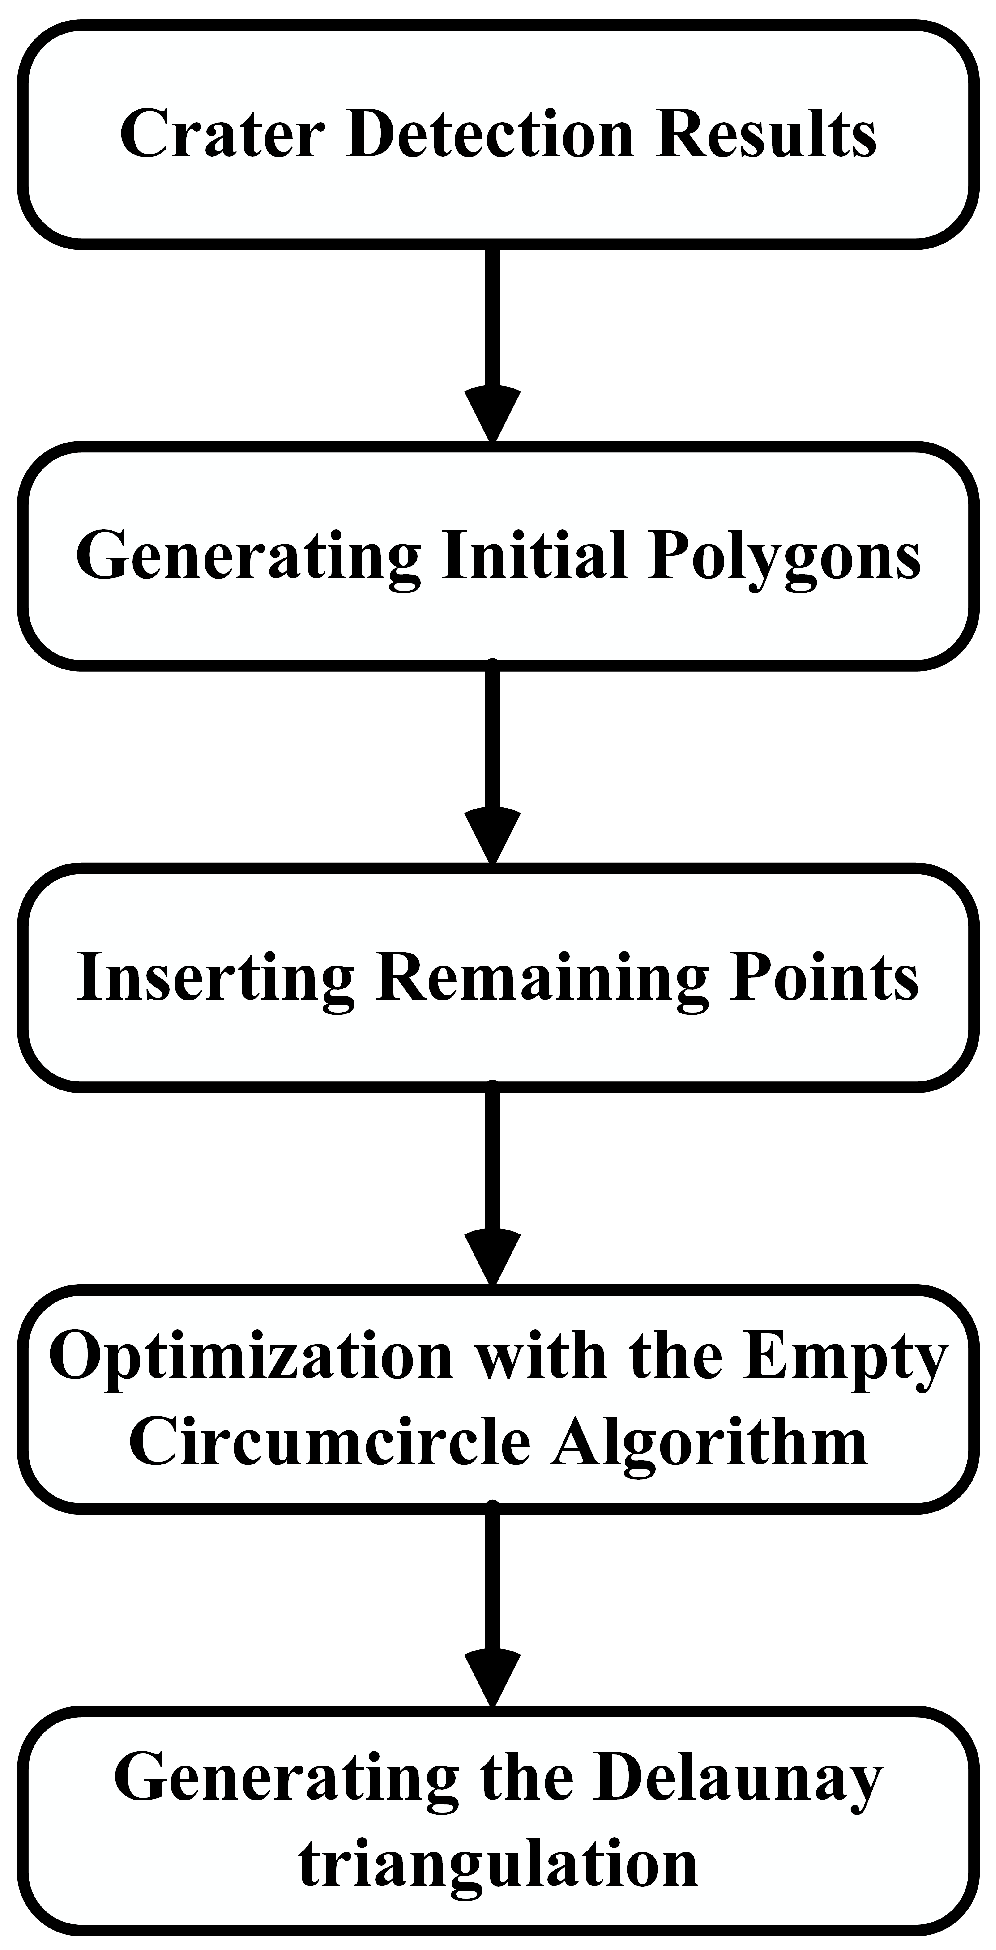
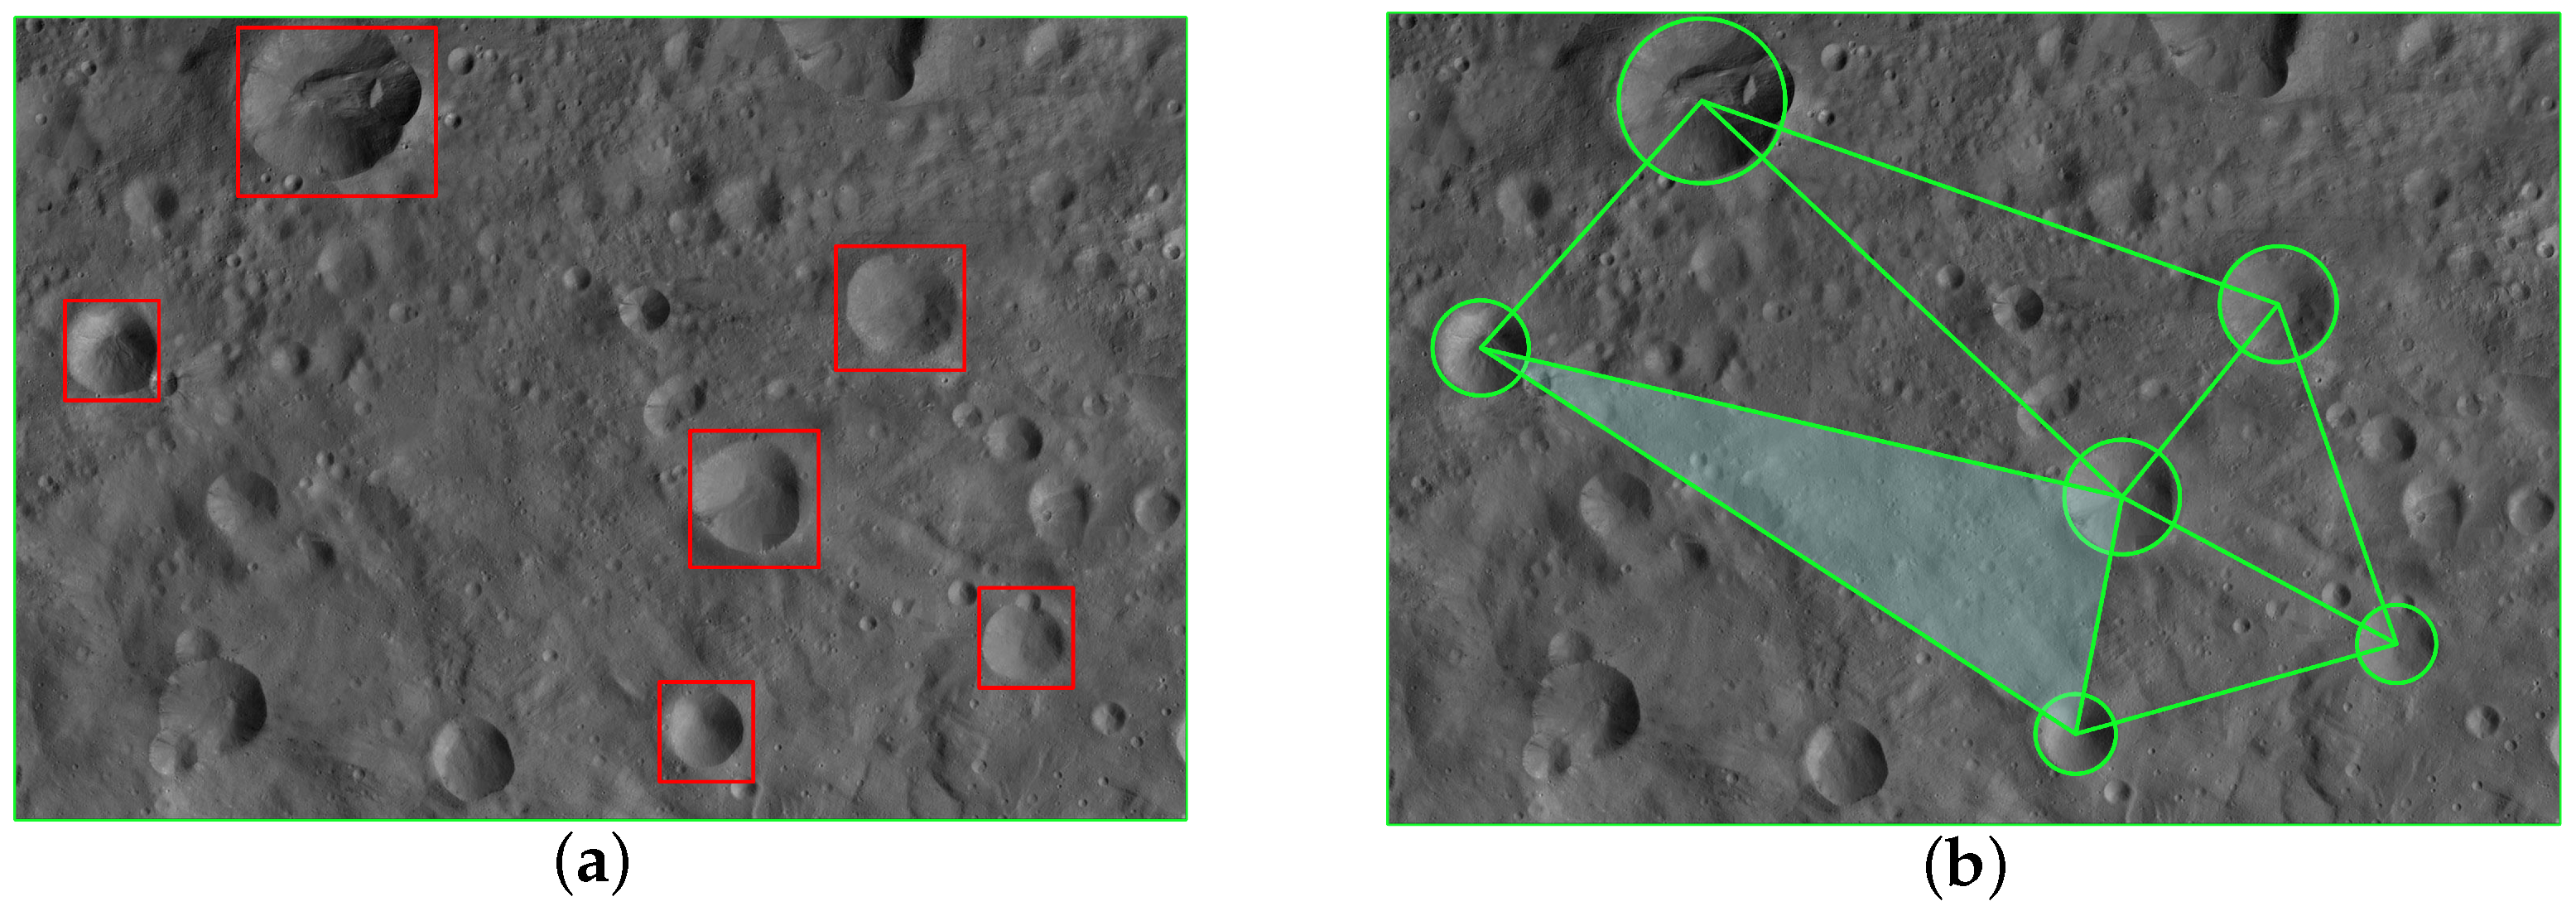
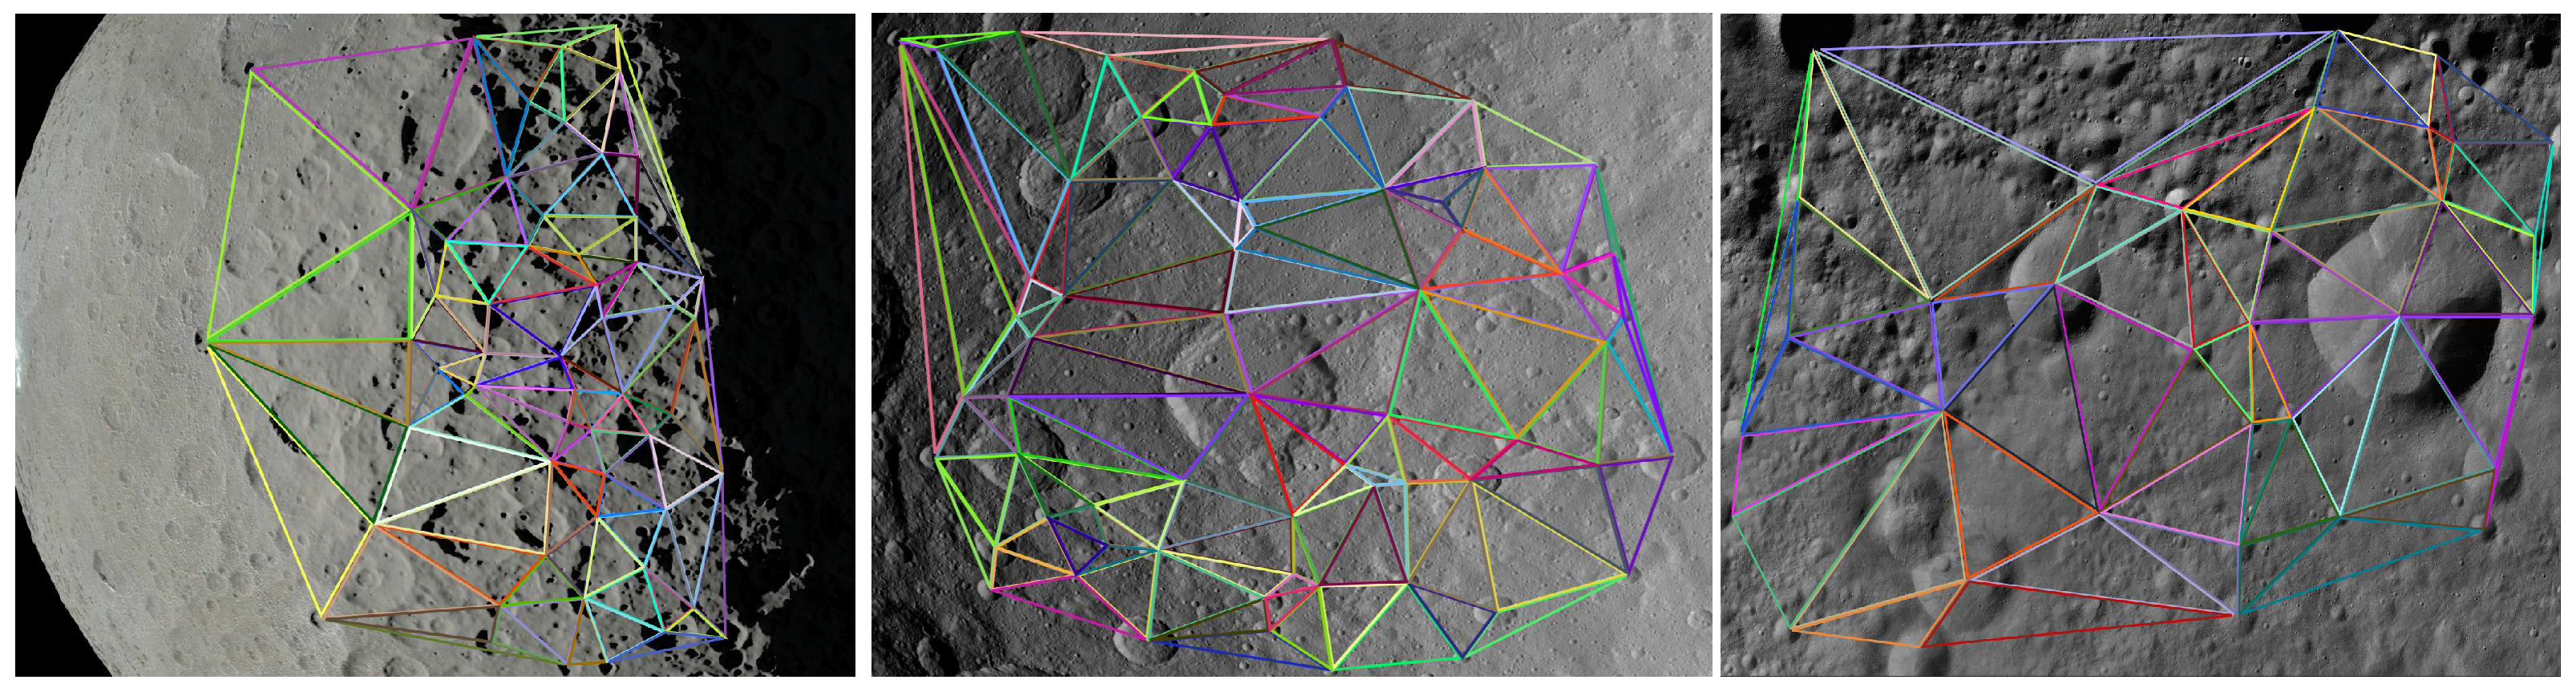
2.2. Delaunay Triangulation

To acquire the geometric features of craters, the Delaunay triangulation algorithm is initially employed to handle the crater detection results. The process of Delaunay triangulation involves partitioning the deep learning crater recognition results into triangular meshes, using a set of central points extracted from crater locations [28]. The algorithmic flow is illustrated in Figure 2.
In the planar crater set shown in Figure 3a, an initial polygon surrounding all crater centroids is obtained, and an initial triangular mesh is established. Then, the remaining points are individually inserted, and optimization is performed using the empty circumcircle algorithm (no other nodes are included inside the circumcircle of any triangle) to generate a Delaunay triangulation. As shown in Figure 3b, detected crater set P = p 1 , , p n is transformed into triangle set T = t 1 , , t n , where p i is the centroid of the i t h detected crater.

3. Descriptor Construction and Matching

In this section, we will introduce the process of establishing geometric descriptors and region descriptors. Taking the salience of geometric features into consideration, composite feature descriptors are later generated with fused weight values. Based on the nearest neighbor principle, the matching results are obtained.

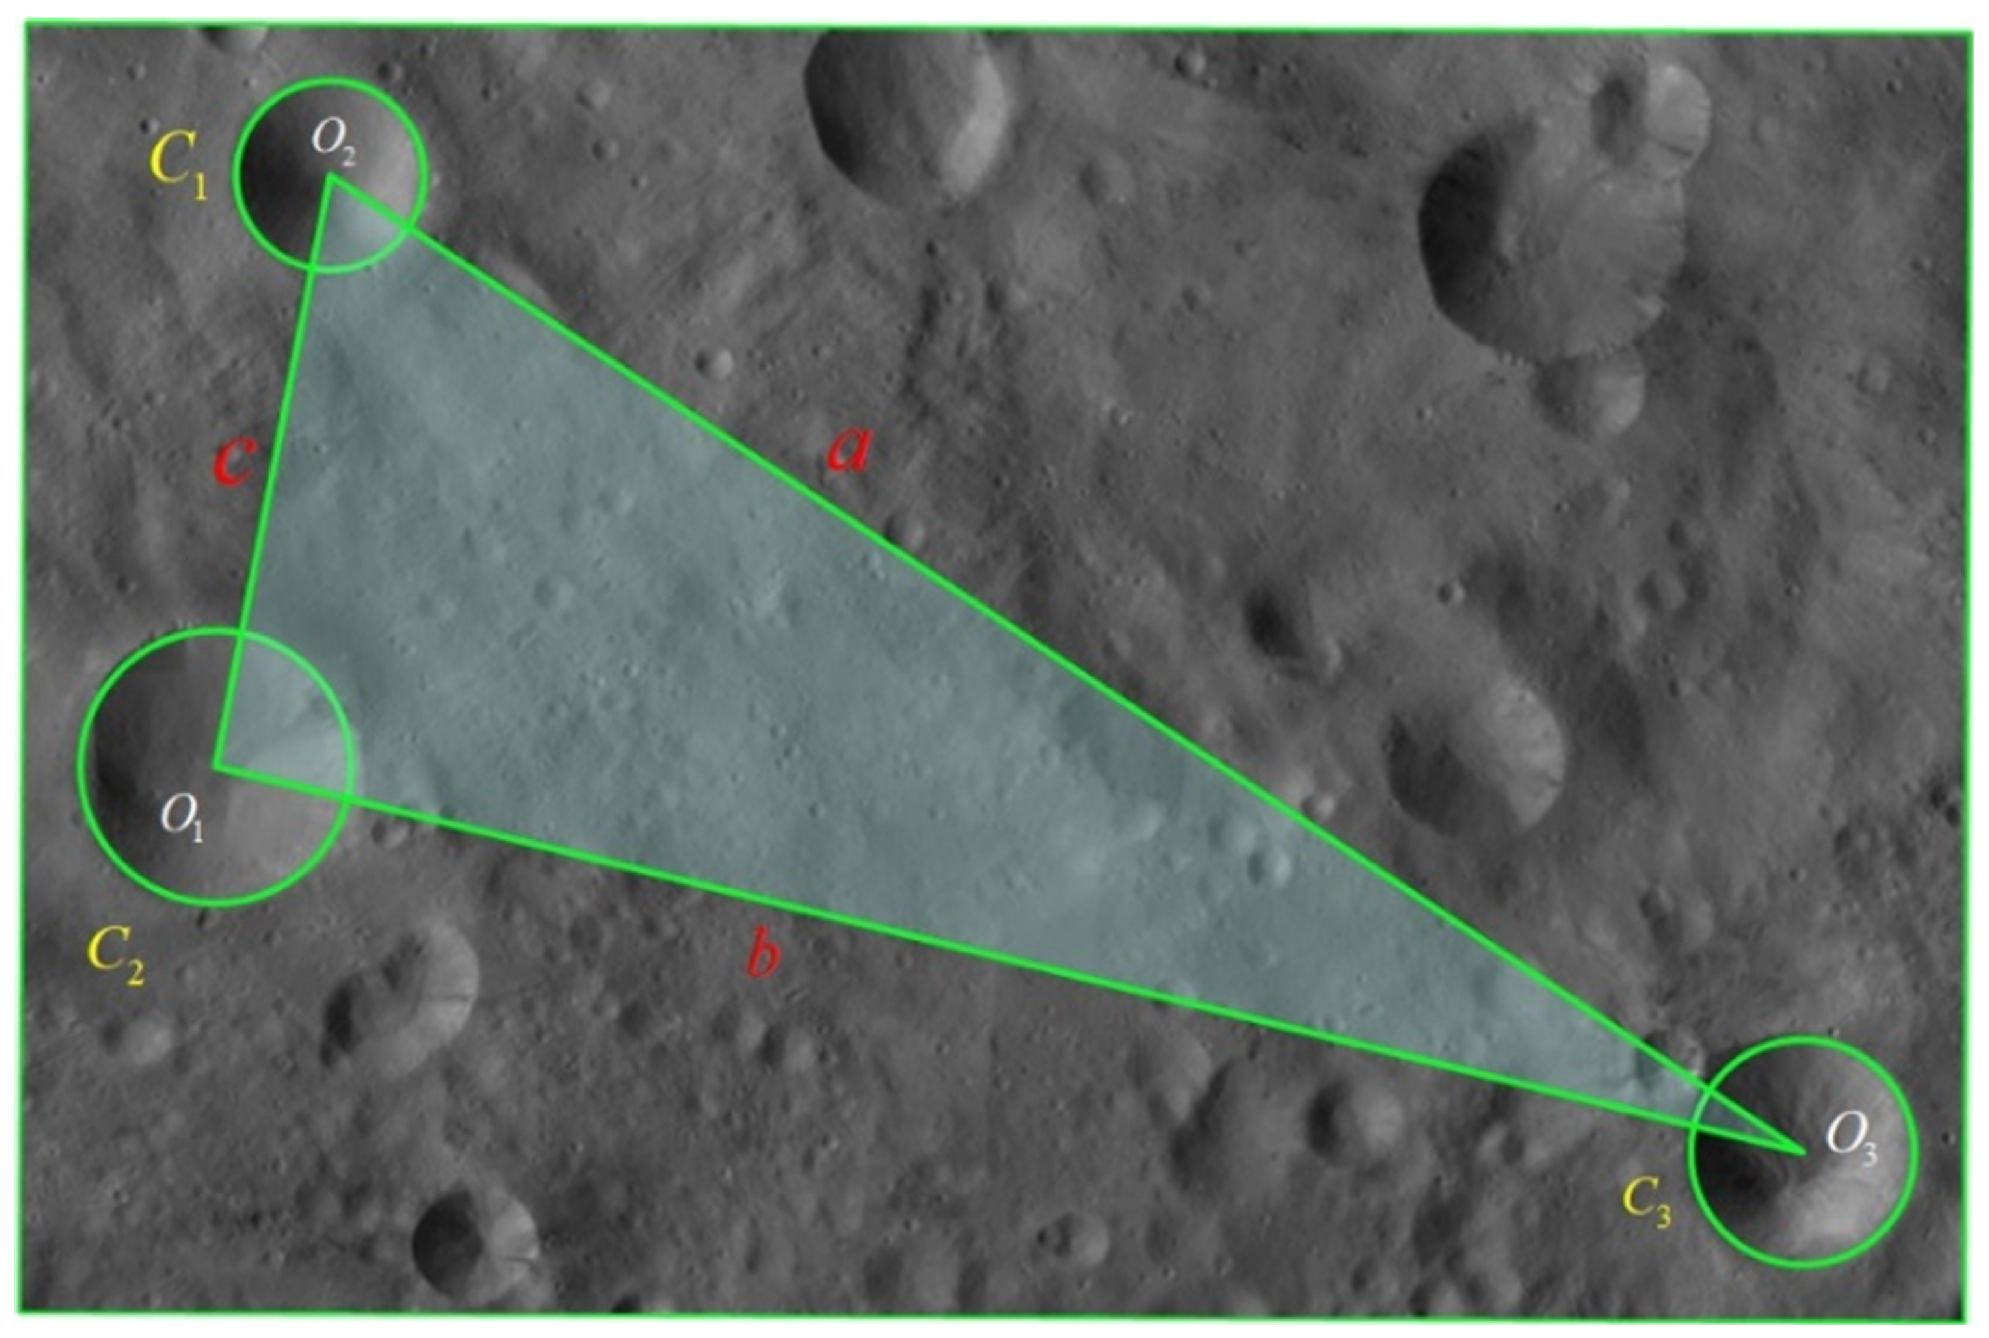
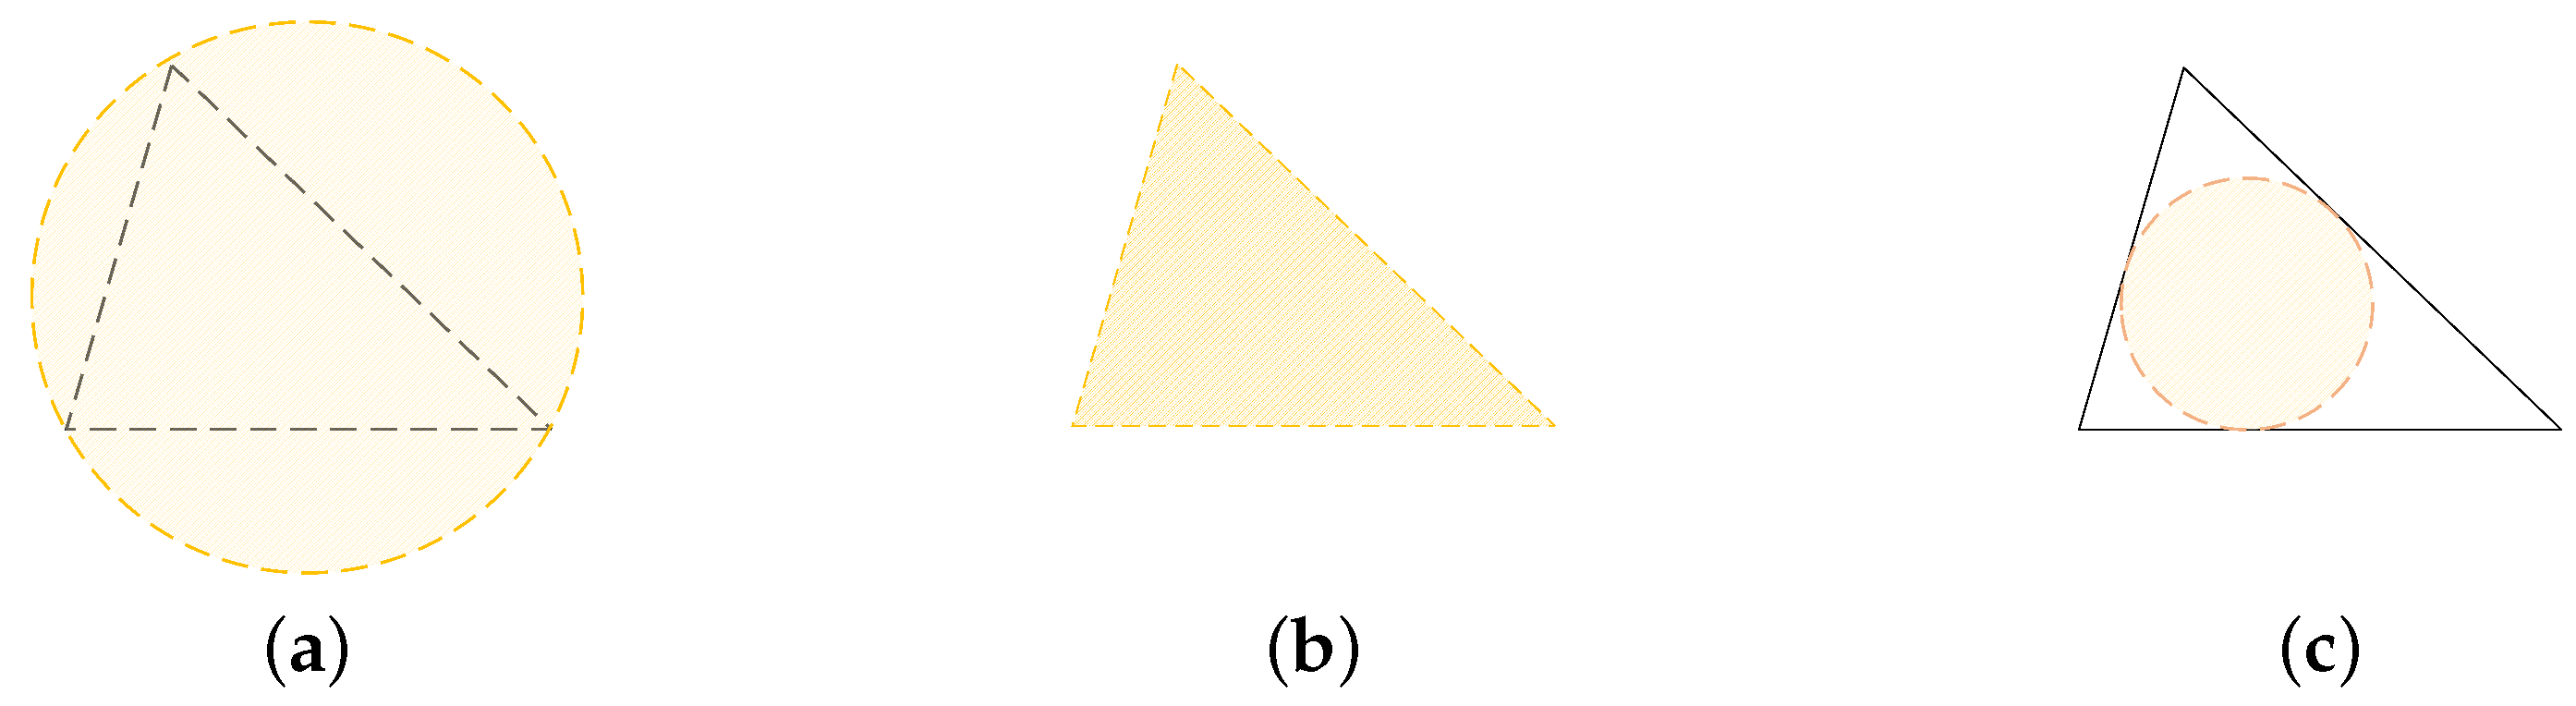
3.1. Geometric Descriptor Construction

Figure 4 shows a schematic diagram of constructing triangular feature primitive based on crater detection results.
In the set of triangles T, the feature primitive corresponding to the k t h triangular unit O 1 O 2 O 3 is composed of three craters C i with centers at O i ( i = 1 , 2 , 3 ) and radii r i ( i = 1 , 2 , 3 ) forming triangles with the crater centers as vertices.
The vertices O 1 , O 2 , and O 3 correspond to three edges, respectively, as a, b, and c, satisfying a b c . Geometric descriptors are established using the ratios r 1 , r 2 , r 3 , b, and c with respect to a. Geometric descriptors are represented by S D = [ δ 1 , δ 2 , δ 3 , δ 4 , δ 5 ] :
δ 1 = r 1 a , δ 2 = r 2 a , δ 3 = r 3 a , δ 4 = b a , δ 5 = c a
The crater triangles to be matched in the captured small body scene image are similar to the corresponding matching crater triangles in the database, and the corresponding matching crater radii are proportional. Introducing crater radius constraints into the geometric descriptors, each parameter is normalized to ensure scale invariance of the geometric descriptors. Rotational invariance is achieved by arranging the vectors of shape descriptors in the order of the three craters’ sizes, the second longest side of the triangle, and the shortest side of the triangle.

3.2. Region Descriptor Construction

Based on the geometric descriptors constructed for each feature primitive in Section 3.1, in order to avoid mismatch of descriptors formed by triangular feature primitives with poor geometric significance (i.e., triangles obtained by triangulation converge to equilateral triangles, and crater radius differences are small), we introduce the region descriptor that uses pixel gradient features in the support region to eliminate triangular feature primitives with similar shape descriptors, which is unlike traditional feature matching methods, where regional pixel gradient features play a dominant role.
(1) Construction of support region
To address the problem of image scale variation, images are downsampled and undergo Gaussian blur processing as illustrated in Figure 5. The downsampling factor is 2 as a way to ensure continuity in space. The input image size is related to the number of Gaussian pyramid layers o c t a v e :
o c t a v e = l g ( m i n ( w i d t h , h e i g h t ) ) l g 2 2
and w i d t h and h e i g h t are the size of the original image, respectively. The function m i n ( ) is to select the minimum value of the width and height of the original image.
By simulating multi-scale features of the images, descriptors are generated for each image in the pyramid. Within the coverage area of the feature primitive, the inscribed circle of triangle Δ O 1 O 2 O 3 is selected as the supporting region for the region descriptor. We will make the selection in the following Section 4.1.
(2) Computing gradient histograms and acquiring dominant direction.
The gradient magnitude m ( x , y ) and direction α ( x , y ) of pixel ( x , y ) within the supporting region G is precomputed using pixel differences:
G x = 1 0 1 2 0 2 1 0 1 I x , y , G y = 1 2 1 0 0 0 1 2 1 I x , y
m x , y = G x 2 + G y 2 , α x , y = a r c t a n ( G y G x )
where I x , y means the pixel value in ( x , y ) of the image.
The pixels within the supporting region are divided into eight sectors based on their gradient direction α ( x , y ) . According to the divided gradient directions, the gradient magnitudes of the pixels within each sector are summed up, and then the gradient histogram is generated. The peak of the gradient histogram represents the dominant gradient direction of the pixels within the supporting region. Traversing all sectors counterclockwise, the sum of the gradient magnitudes within the t t h direction sector can be expressed as:
M t = α ( x , y ) i n m ( x , y ) , i [ 1 , 2 , , 8 ]
(3) Traversing the gradient histogram to construct the feature descriptor vector.
Starting from the dominant direction, traverse the sectors in sequence and use M t to construct the feature descriptor vector I = [ M t , , M 8 , M 1 , , M t 1 ] T , thereby maintaining the rotational invariance of the region descriptor. The t t h sector is the one where the dominant direction lies as illustrated in Figure 6 and Figure 7.
(4) Establishing normalized region descriptors.
The obtained feature descriptor vectors M t in Equation (2) are normalized to M ˜ t to ensure scale invariance, resulting in the final generation of region descriptors B D :
B D = M ˜ t M ˜ n M ˜ 1 M ˜ t 1 = M t M min M max M min M n M min M max M min M 1 M min M max M min M t 1 M min M max M min

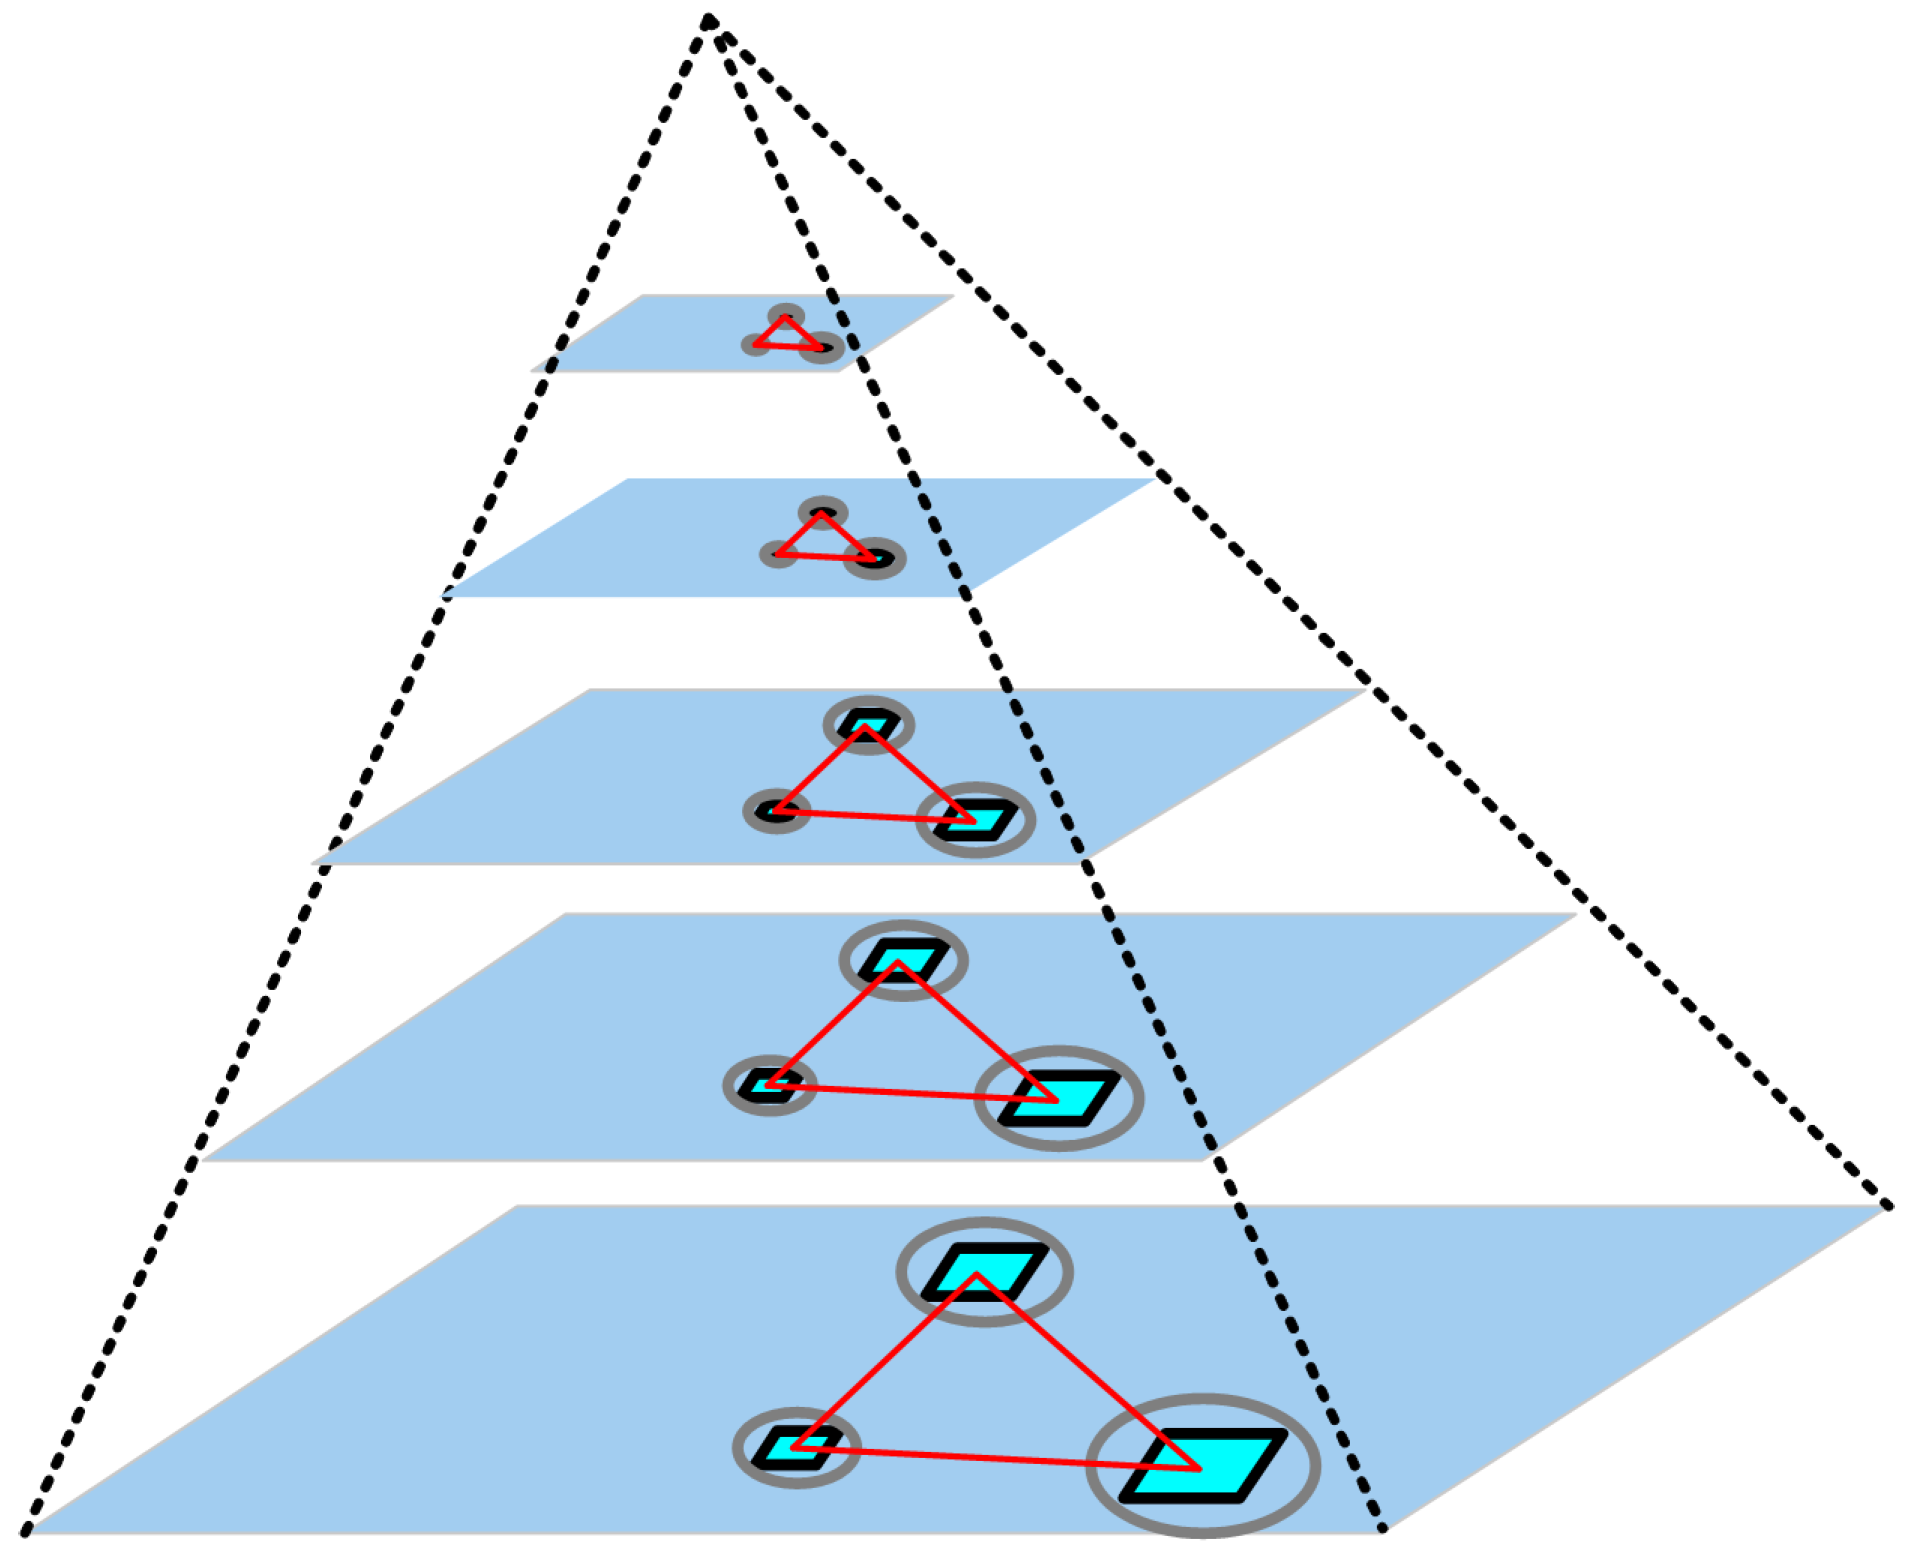
3.3. Generating Composite Descriptor

To allocate weights for geometric descriptors and region descriptors in composite feature descriptors, geometric descriptor weight vectors w s ( x T , x C ) and region descriptor weight vectors w B ( x T , x C ) are introduced, where x T is a set containing the lengths of the three sides of the triangle, x C is a set containing the values of the radii of three craters, and the sum of the two weights equals 1:
w s ( x T , x C ) + w B ( x T , x C ) = 1
Define geometric feature similarity function G S ( x T , x C ) and geometric feature saliency quantification function Q S ( x T , x C ) :
G S ( x T , x C ) = 1 3 i = 1 3 x T i m a x ( x T ) + 1 3 i = 1 3 x C j m a x ( x C )
Q S ( x T , x C ) = l n G S ( x T , x C )
where Q S ( x T , x C ) controls the sensitivity to geometric feature similarity. The obtained result is used to assign values to the geometric descriptor weight vector after it has been normalized:
w s ( x T , x C ) Q S ( x T , x C ) Q S m i n Q S m a x Q S m i n
Finally, by weightedly fusing the geometric descriptor and region descriptor, we obtained the composite feature descriptor:
D = w S ( x T , x C ) · S D w B ( x T , x C ) · B D

3.4. Descriptor Matching

To evaluate the matching performance of crater matching, the correct matching rate is defined as the ratio of the number of correct matches to the total number of matches. The nearest neighbor criterion is an effective standard for feature matching. When performing descriptor matching, the matching effectiveness is evaluated by computing the distance between two descriptor vectors. When matching descriptor D 1 , if the best matching option is D 2 , then the condition for determining a successful match is:
1 D 1 D 2 D 1 > γ
where γ represents the Euclidean distance threshold of the relative distance between descriptors.

4. Experiments and Results

During the descent and landing process, the captured navigation image will undergo scale, rotation and illumination transformations, so the algorithm is validated in three cases, respectively. The real small body images are obtained from NASA’s official website [29,30] with different image quality: 62 m, 410 m and 0.5 m per pixel. They are used for the experiments on the algorithm proposed in this paper. The images in Figure 8 are the results of crater detection. The images in Figure 9 are the results of constructing a geometric configuration feature map by detecting craters.

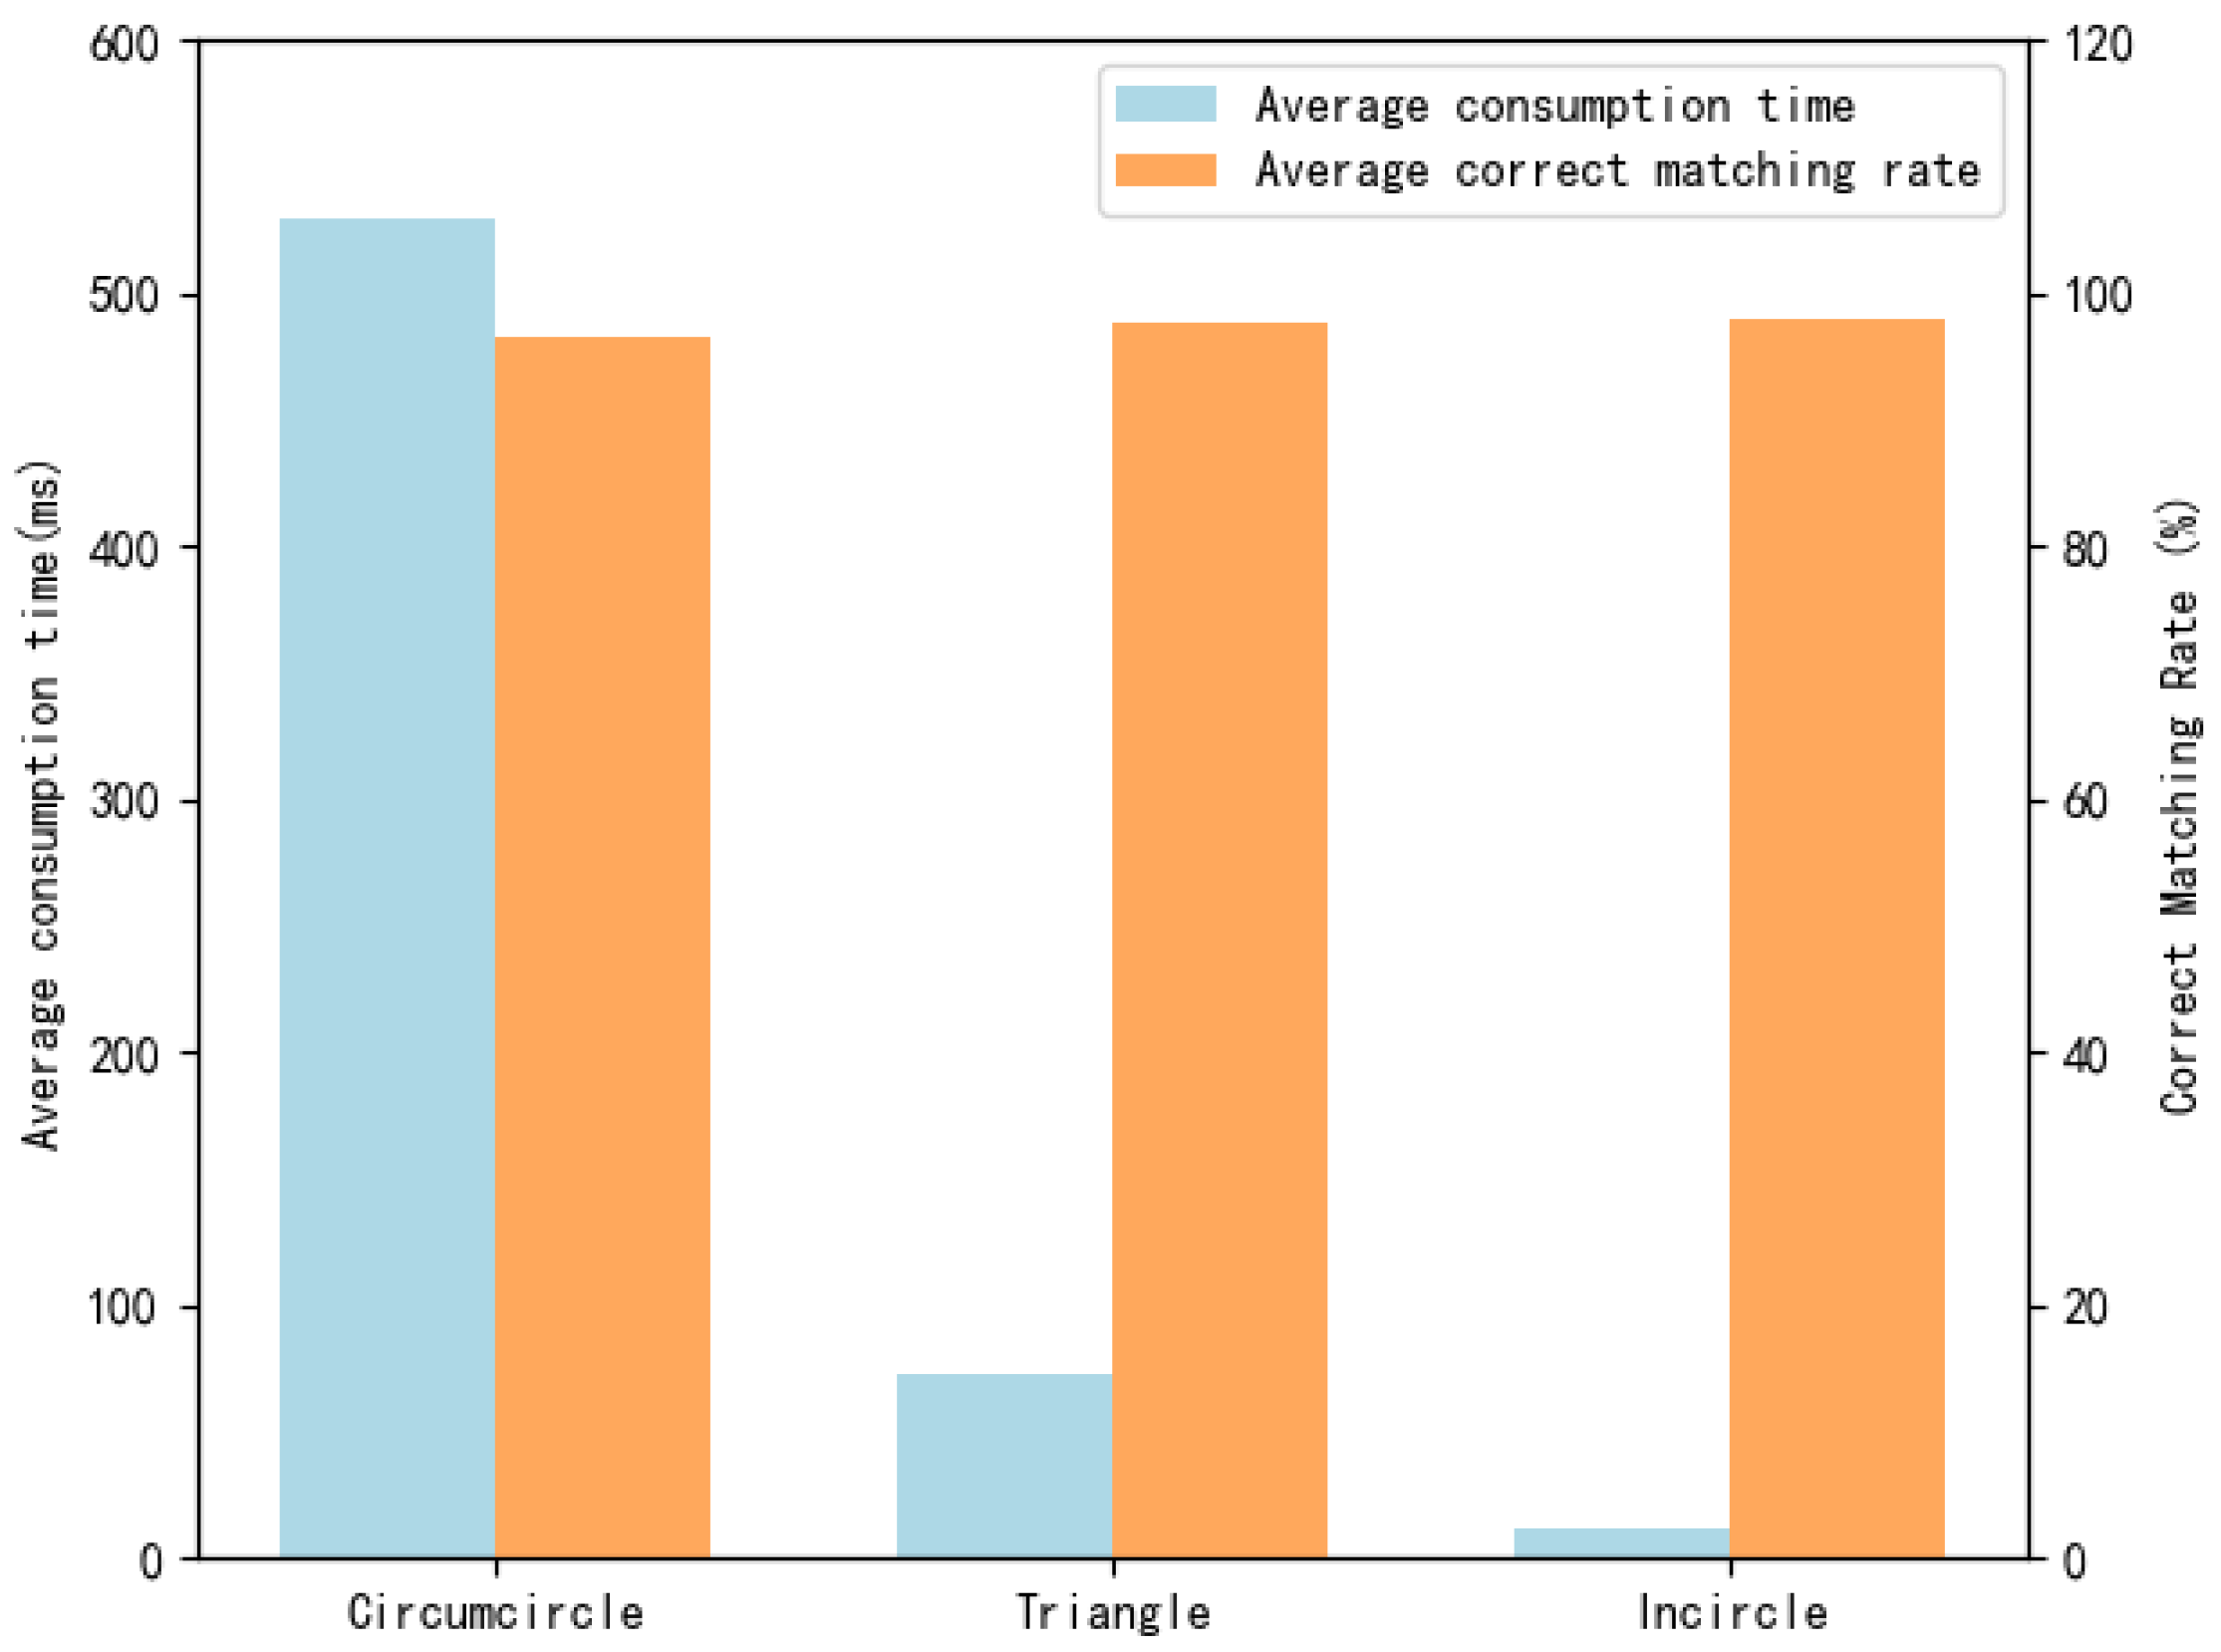
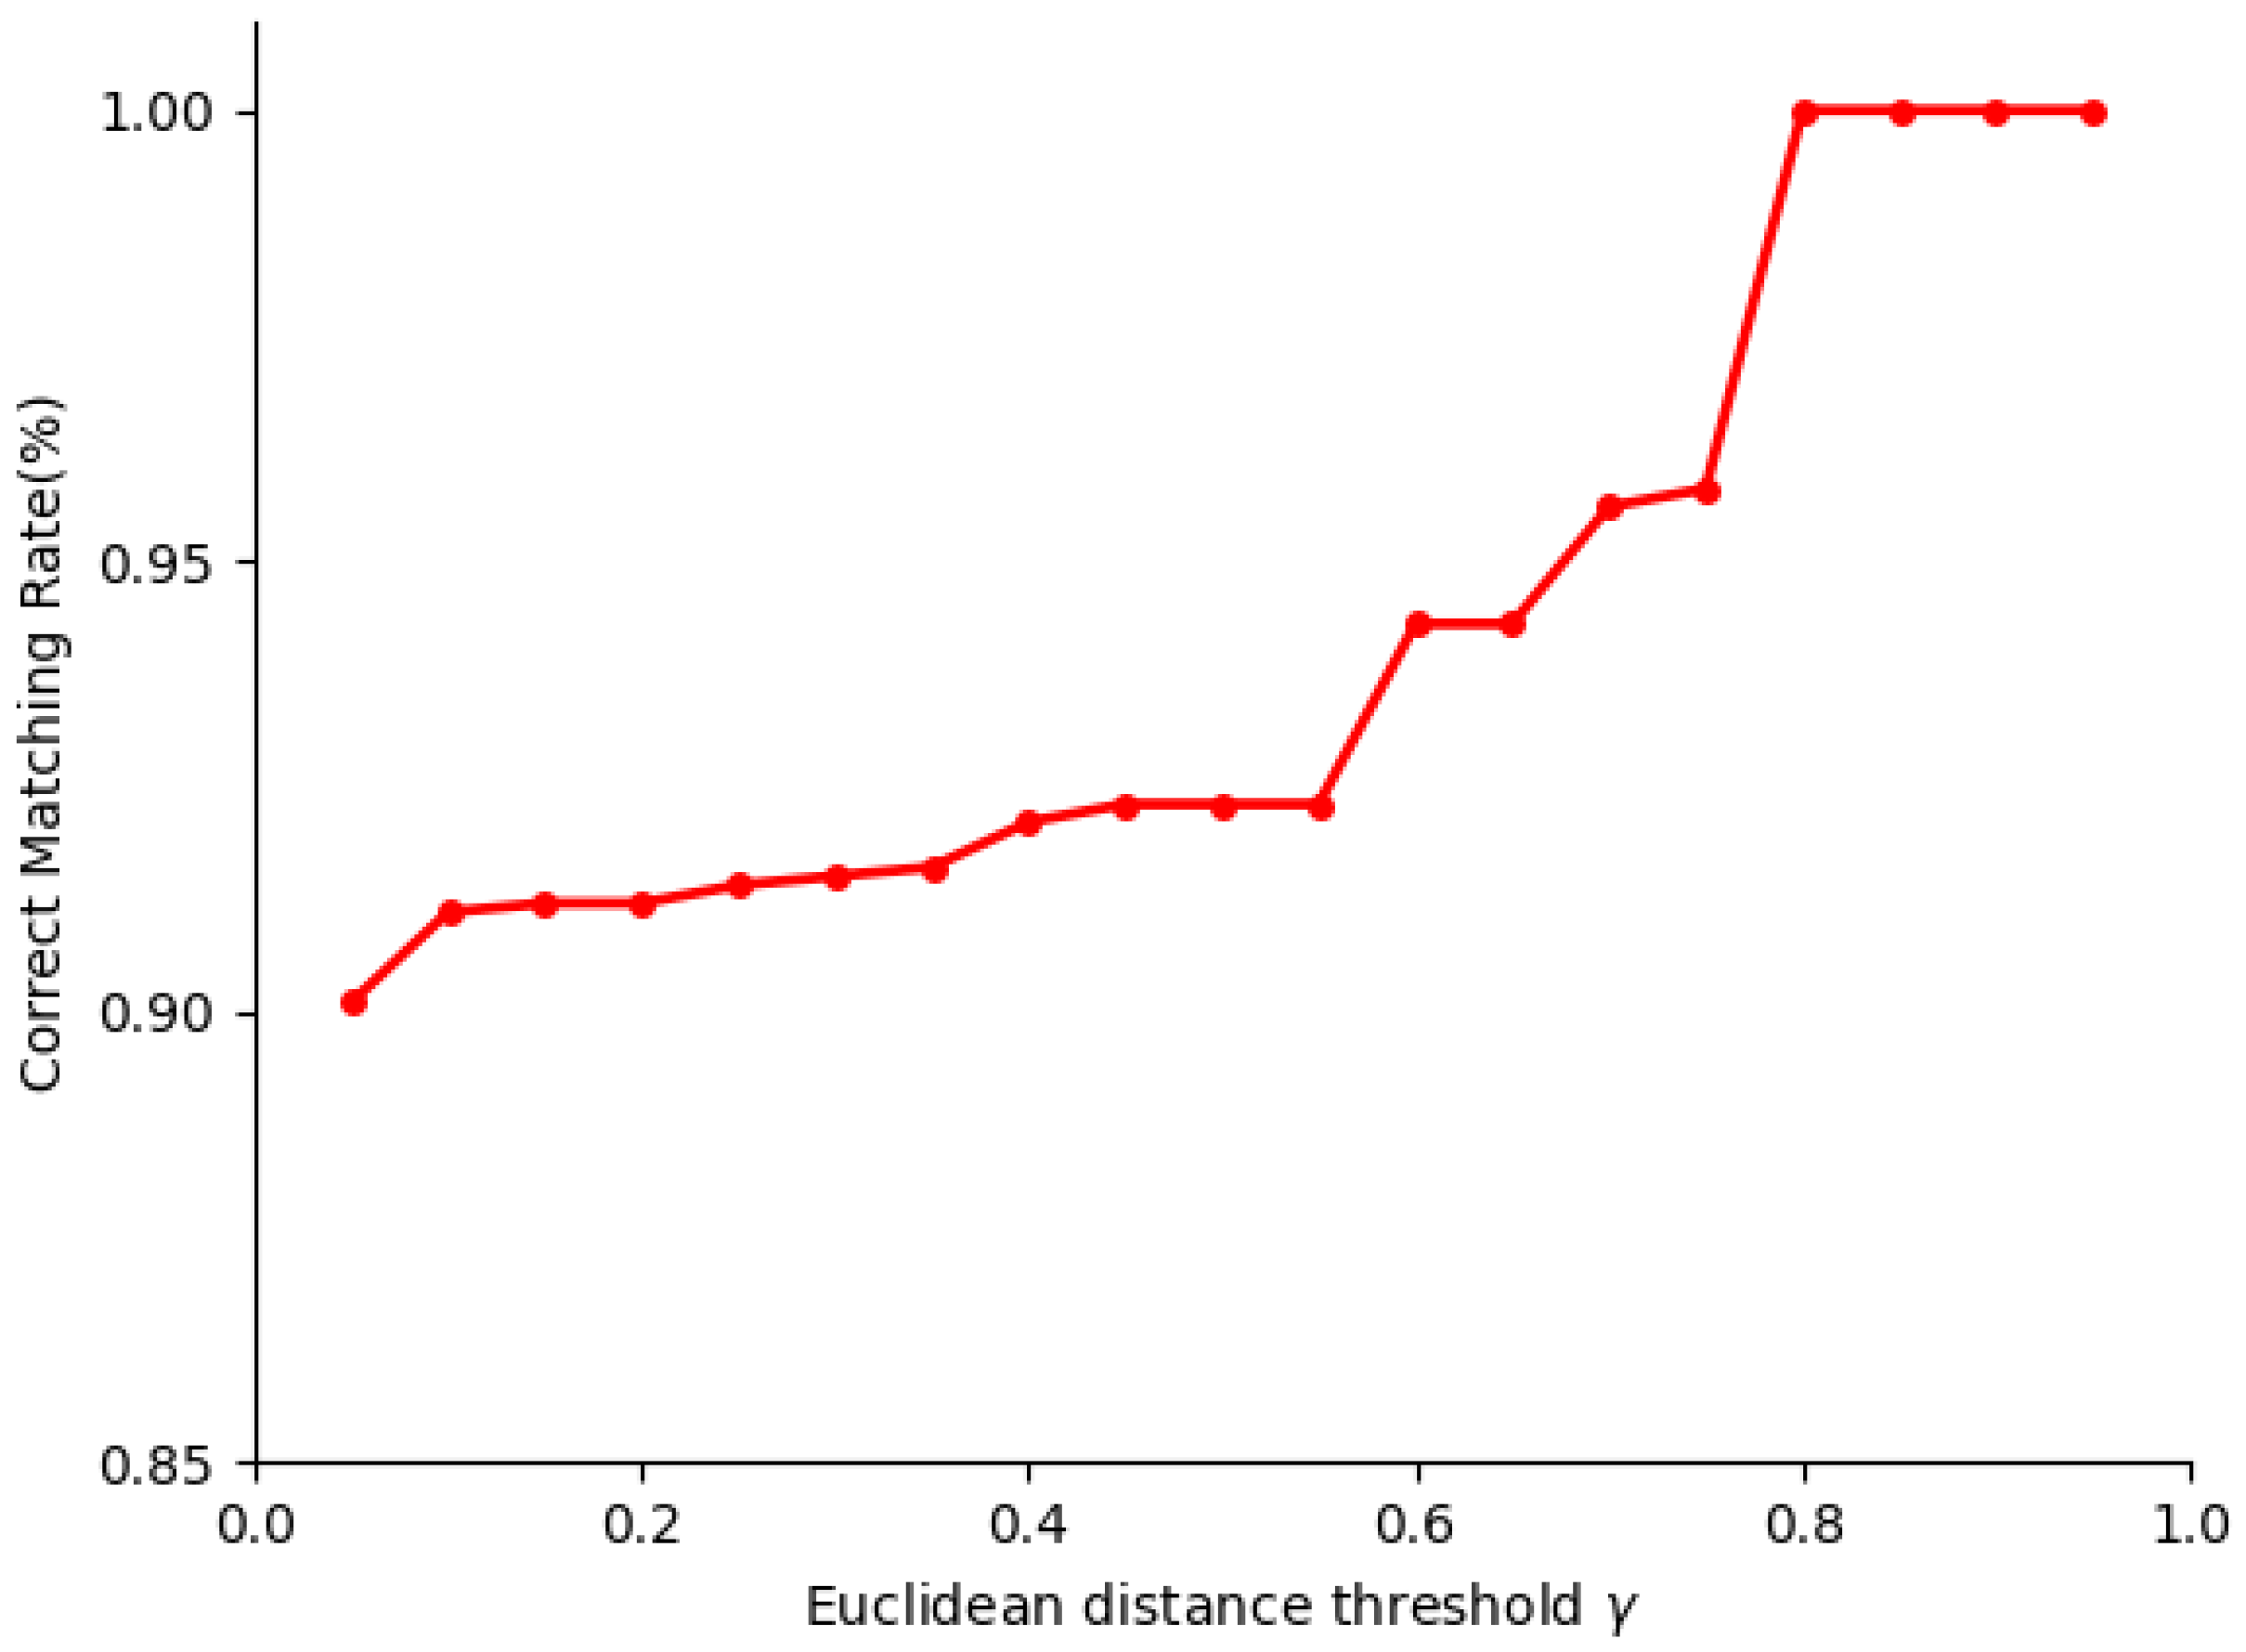
4.1. Parameter Selection
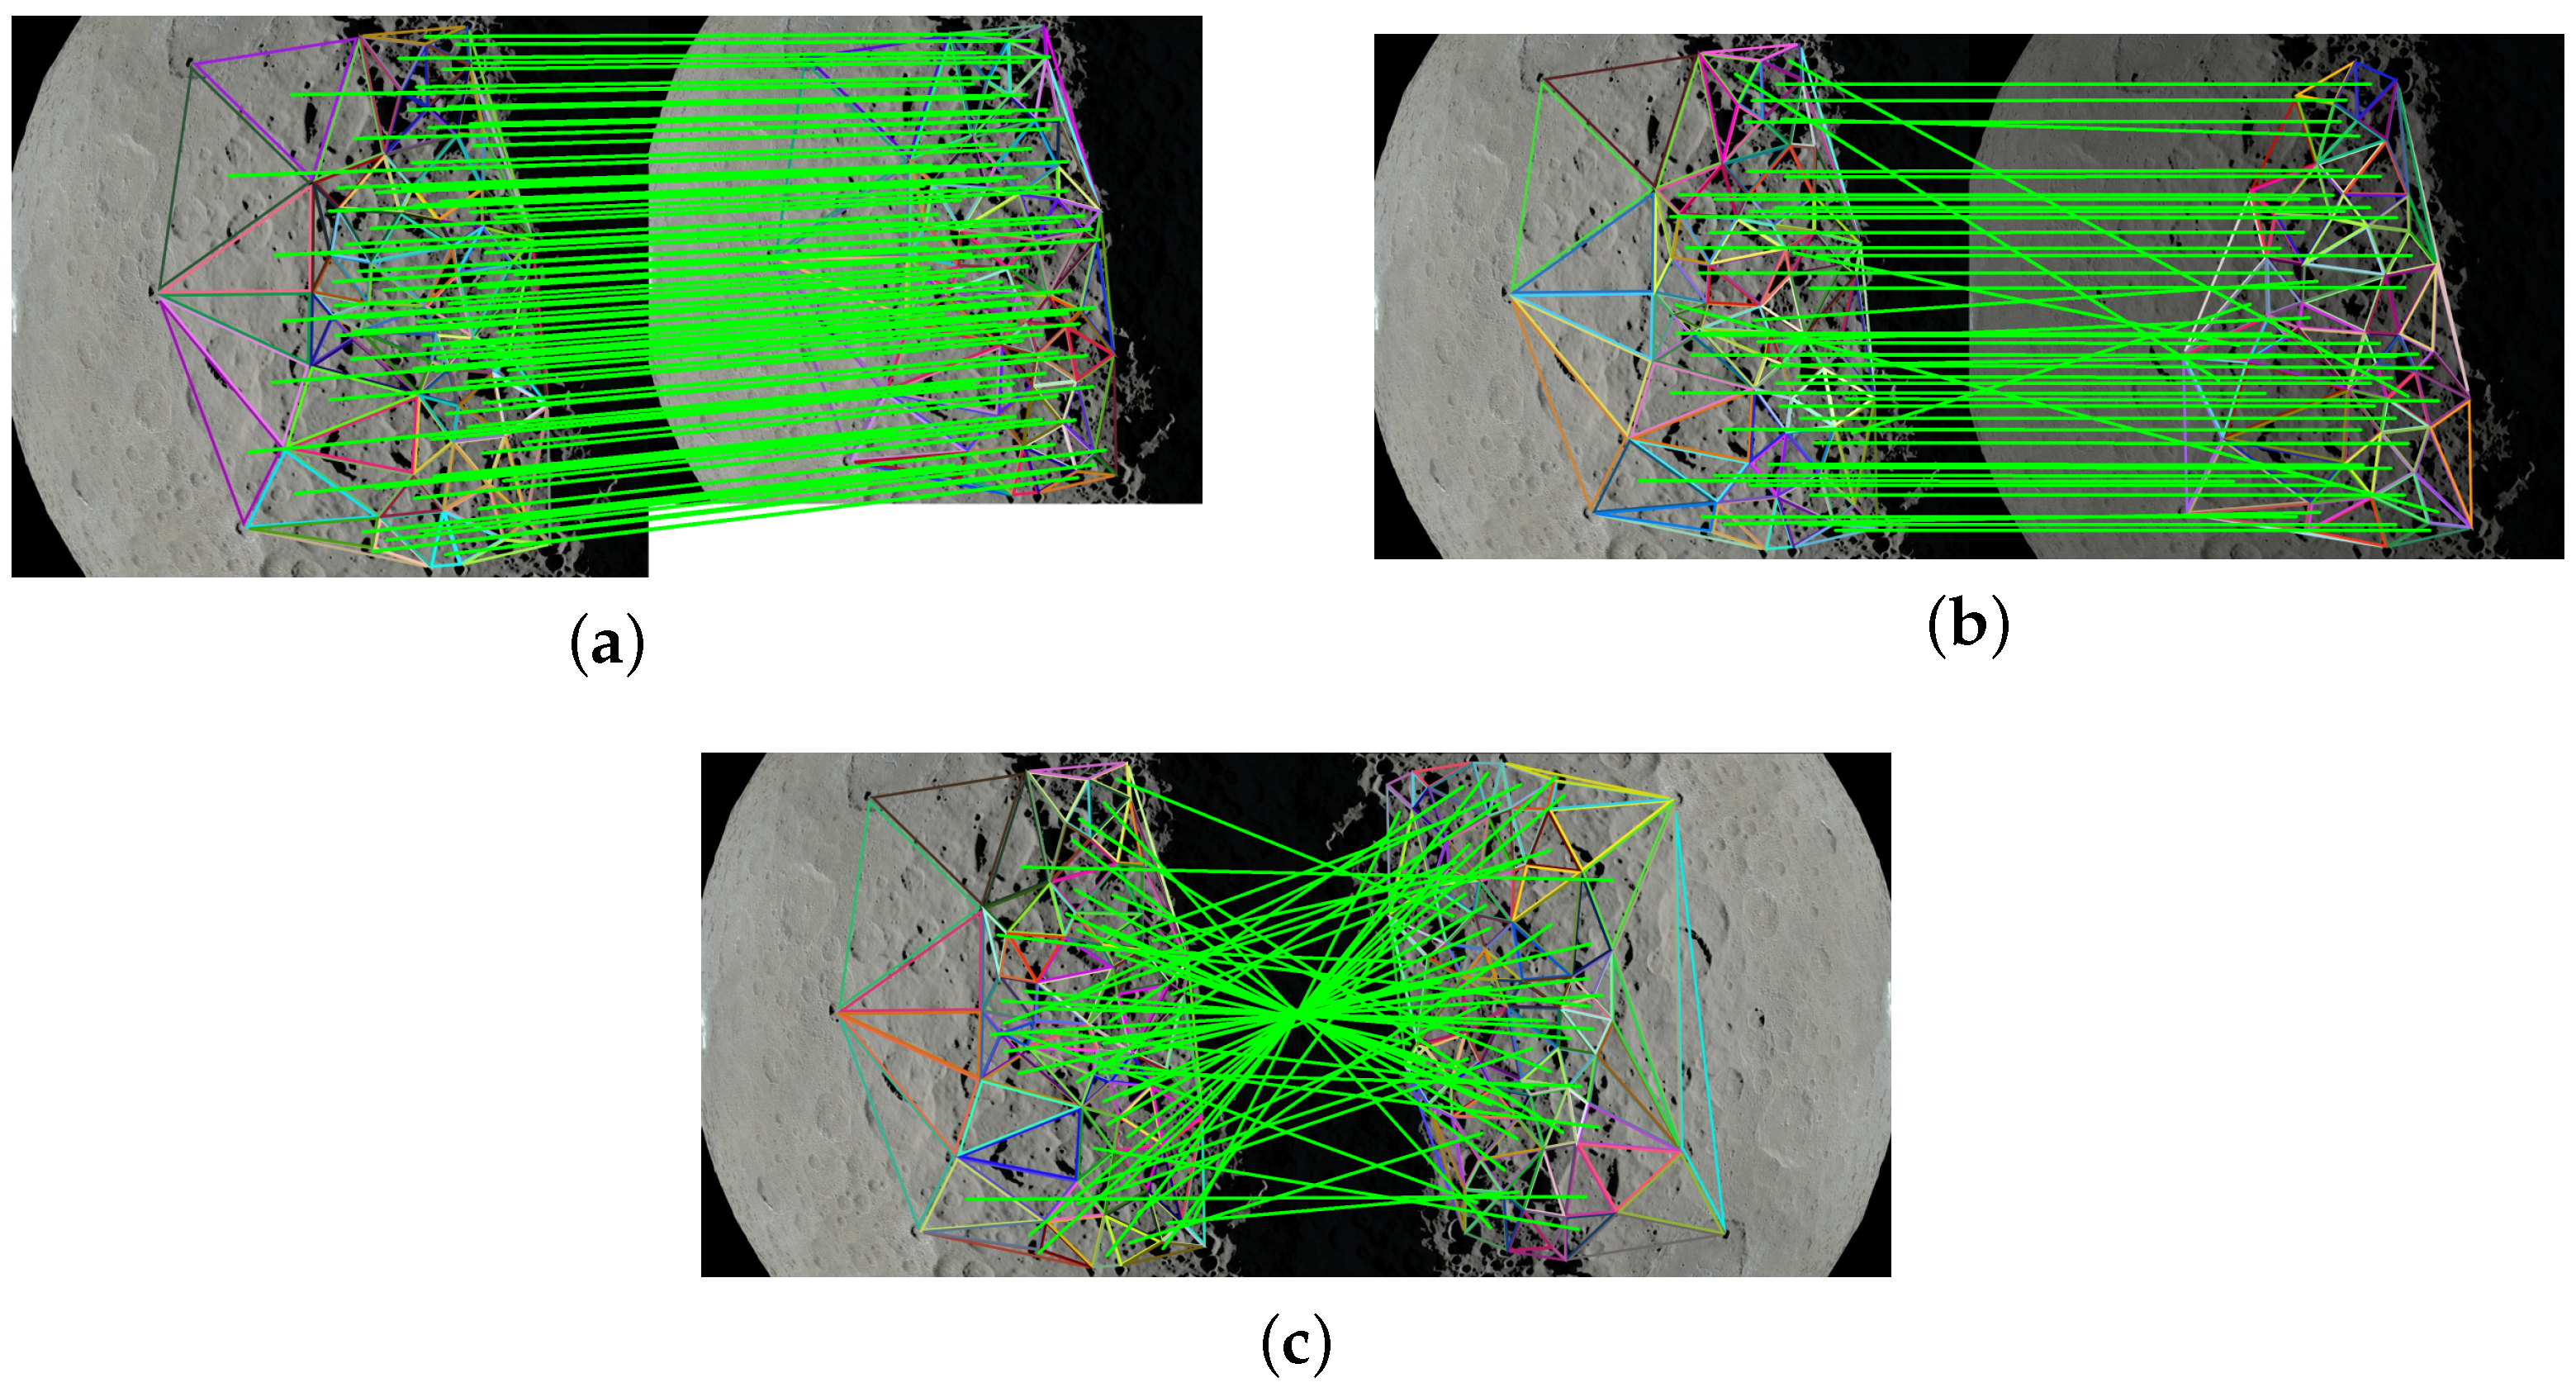
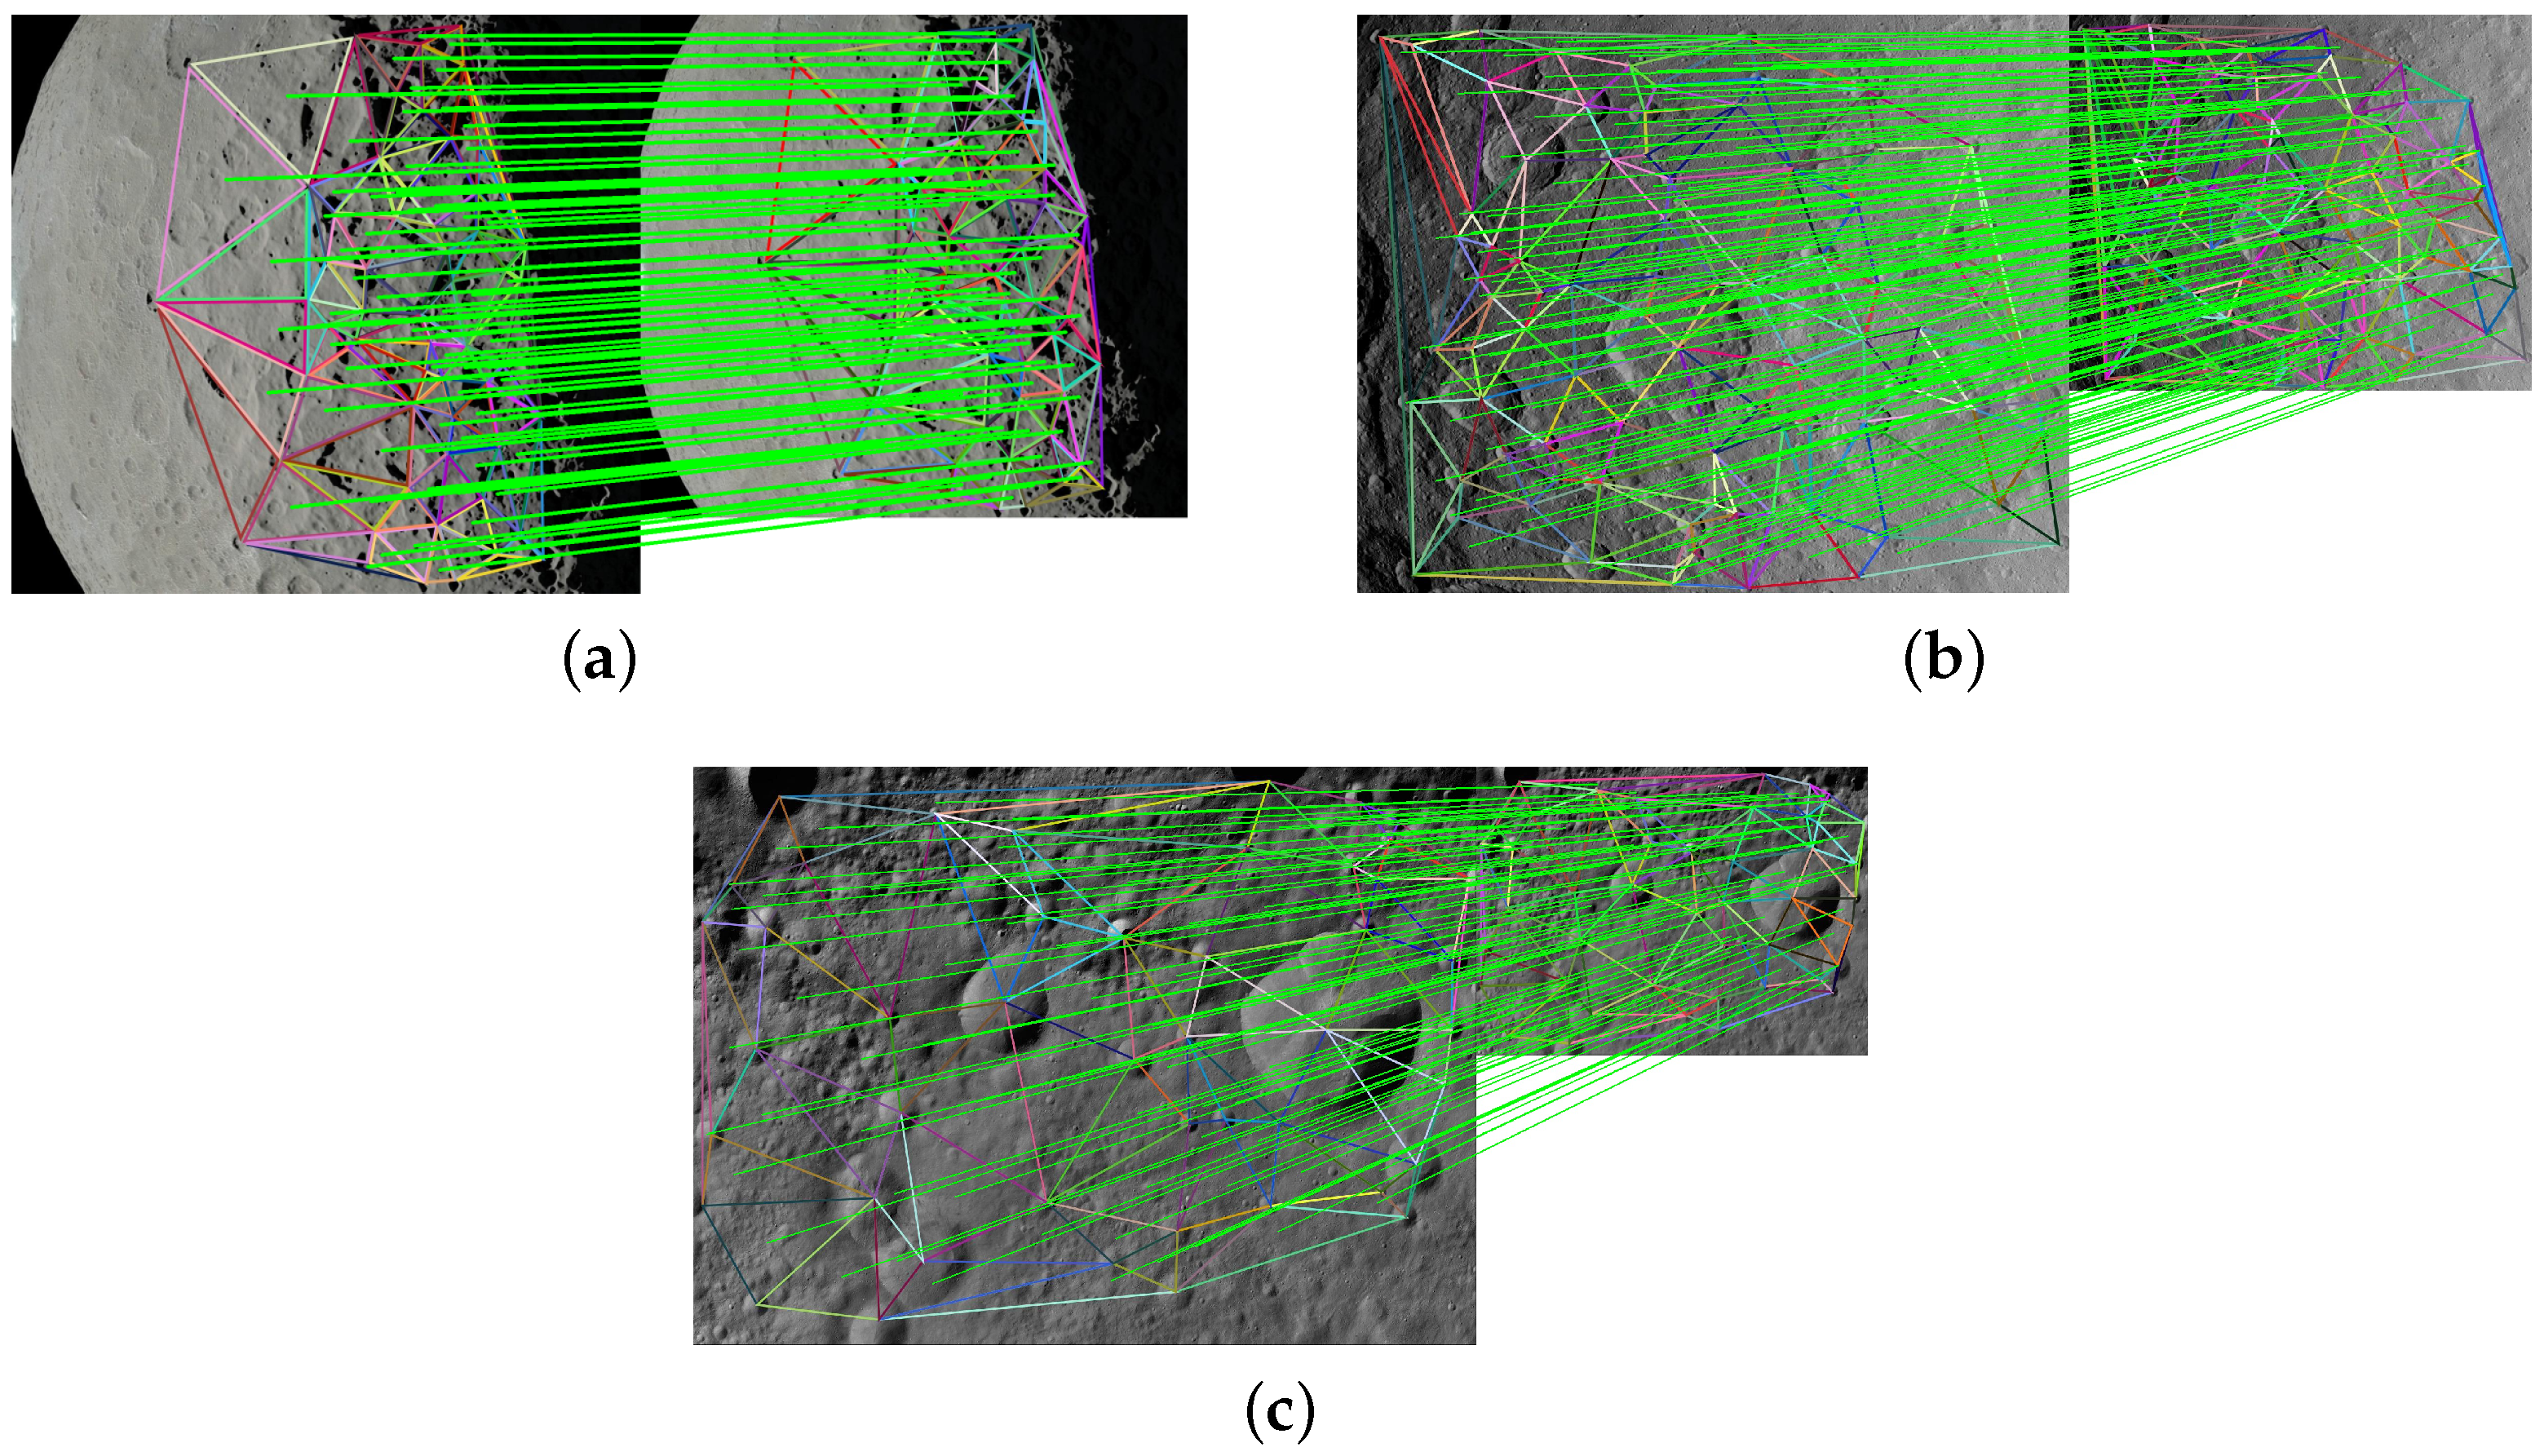
To examine the influence of different support region selections and relative distance threshold γ between descriptors on the matching results, relevant parameter selection experiments were conducted. The experiments were performed using the aforementioned images of Ceres under transformations with scale of 0.8, illumination intensity of 0.8, and rotation of 180°, and the matching results are generated.
To address the problem of support region selection mentioned in Section 3.2, we conducted tests on the circumscribed circle, triangle, and inscribed circle support regions, respectively, as is shown in Figure 10. Using the circumcircle, triangle, and incircle regions respectively resulted in average consumption times of 529.8 ms, 73.2 ms, and 12.5 ms, with corresponding average correct matching rates of 96.5%, 97.9%, and 97.8% as is shown in Figure 11. Considering the matching performance and consumption time, we chose to use the incircle as the support region.
In response to the problem of threshold selection in Section 3.4, we examined the influence of different γ values on the correct matching rate through experiments. The smaller the γ value, the greater the amount of feature matching pairs obtained, but the probability of mismatching is also greater, meaning the matching accuracy will decrease. Therefore, choosing different γ values will result in different matching results. We set the Euclidean distance threshold γ to vary from 0.05 to 0.95, totaling 19 simulations. It can be observed in Figure 12 that when the γ value exceeds 0.8, the correct matching rate no longer increases. Therefore, we selected 0.8 as the descriptor Euclidean distance threshold.

4.2. Ablation Study

Then, on the basis of the obtained geometric configuration feature map results, we respectively verified the matching performance of geometric descriptors and region descriptors under scale, rotation, and illumination transformations as illustrated in Figure 13 and Figure 14, where (a) shows the scale transformation matching result, (b) shows the illumination matching result, and (c) shows the rotation transformation matching result.
As shown in Figure 13 and Table 1, when only using geometric descriptors for matching, the correct matching rate under rotation and illumination transformations is notably diminished. This result arises from significant disparities in the detected positions of craters between images under rotation and illumination transformation compared to the original image, as well as missed detections. Consequently, the geometric configuration features generated under such conditions exhibit considerable noise, thereby diminishing the matching rate.
As shown in Figure 14 and Table 2, when using only region descriptors for matching, the correct matching rate is reduced due to the distortion of regional pixel features caused by illumination and rotation variations on the calculation of gradients within each region.
We comprehensively verify the matching performance of composite descriptors under scale, rotation, and illumination crater images, with crater images of Ceres and Vesta as illustrated in Figure 15, Figure 16 and Figure 17. Figure 15 shows the matching results under transformations with scales of 0.8, 0.65 and 0.5. Figure 16 shows the matching results under transformations with illumination intensities of 0.8, 0.9 and 1.2. Figure 17 shows the matching results under transformations with rotation angles of 180°, 90° and 5°.
As shown in Figure 15, Figure 16 and Figure 17 and Table 3, compared to only using geometric descriptors and region descriptors separately, using the fused composite feature descriptors can simultaneously increase the number of matches and the accuracy of matches, and the invariance of feature descriptors to illumination and rotation variations is enhanced. It achieves a 100% correct matching rate under scale transformation, a 98.9% correct matching rate under brightness variation, and a 94.2% correct matching rate under rotation transformation. Therefore, the proposed method meets the navigation task requirements during the landing descent process.

5. Conclusions

This paper proposes a composite feature matching algorithm for craters that fuses geometric descriptors and region descriptors, which mainly includes crater recognition, composite feature descriptor construction and descriptor matching. Based on the results of crater detection using deep learning, a geometric configuration feature map is constructed. In each feature primitive, a composite feature descriptor is obtained by fusing geometric descriptors and region descriptors. Compared with the traditional descriptor algorithm, this proposed algorithm integrates regional pixel gradient features and geometric feature constraints. Experimental results show that the proposed algorithm can achieve more than a 90% correct matching rate.
However, there are certain limitations associated with the algorithm. The proposed algorithm for crater matching is not invariant under affine transformations, perspective transformations, and more complex transformations. Therefore, we will take further measures to incorporate viewpoint invariance into this feature descriptor, which will also be a key focus of future work. In this paper, the deep learning-based crater detection method is independent of the crater matching algorithm. Although crater detection algorithms based on deep learning achieve a high recognition rate, the instability of the crater detection results due to the lighting and view changes of the crater detection results leads to considerable disturbances in the established geometric configurations.
In the future, we will try to establish more robust geometric constraints with projective invariance (a property that remains unchanged under projective transformations so that the descriptors can stay invariant despite changes in viewing angles) to enhance the matching performance of the composite feature algorithm and support crater landmark navigation in future missions.

Author Contributions

Conceptualization, W.S.; methodology, M.J.; software, M.J. and W.S.; validation, M.J.; formal analysis, M.J.; investigation, M.J.; resources, M.J.; data curation, M.J.; writing—original draft preparation, M.J. and W.S.; writing—review and editing, M.J. and W.S..; visualization, M.J. and W.S.; supervision, W.S.; project administration, W.S.; funding acquisition, W.S. All authors have read and agreed to the published version of the manuscript.

Funding

This research was funded by National Natural Science Foundation of China grant number No. U2341214 and Shandong Provincial Natural Science Foundation, China (ZR2023MF006, ZR2023QF176).

Data Availability Statement

Data are contained within the article.

Conflicts of Interest

The authors declare that there are no conflicts of interest regarding the publication of this paper.

References

  1. Ge, D.T.; Cui, P.Y.; Zhu, S.Y. Recent development of autonomous GNC technologies for small celestial body descent and landing. Prog. Aerosp. Sci. 2019, 110, 100551. [Google Scholar] [CrossRef]
  2. Anthony, N.; Emami, M.R. Asteroid engineering: The state-of-the-art of Near-Earth Asteroids science and technology. Prog. Aerosp. Sci. 2018, 100, 1–17. [Google Scholar] [CrossRef]
  3. Robbins, S.J.; Bierhaus, E.B.; Barnouin, O.; Lauer, T.R.; Spencer, J.; Marchi, S.; Weaver, H.A.; Mottola, S.; Levison, H.; Russo, N.D.; et al. Imaging Lunar Craters with the Lucy Long Range Reconnaissance Imager (L’LORRI): A Resolution Test for NASA’s Lucy Mission. Planet. Sci. J. 2023, 4, 234. [Google Scholar] [CrossRef]
  4. Bowles, N.E.; Snodgrass, C.; Gibbings, A.; Sanchez, J.P.; Arnold, J.A.; Eccleston, P.; Andert, T.; Probst, A.; Naletto, G.; Vandaele, A.C.; et al. CASTAway: An Asteroid Main Belt Tour and Survey. Adv. Space Res. 2018, 62, 1998–2025. [Google Scholar] [CrossRef]
  5. Accomazzo, A.; Lodiot, S.; Companys, V. Rosetta mission operations for landing. Acta Astronaut. 2016, 125, 30–40. [Google Scholar] [CrossRef]
  6. Tsuda, Y.; Yoshikawa, M.; Saiki, T.; Nakazawa, S.; Watanabe, S.I. Hayabusa2–Sample return and kinetic impact mission to near-earth asteroid Ryugu. Acta Astronaut. 2019, 156, 387–393. [Google Scholar] [CrossRef]
  7. Boazman, S.; Kereszturi, A.; Heather, D.; Sefton-Nash, E.; Orgel, C.; Tomka, R.; Houdou, B.; Lefort, X. Analysis of the Lunar South Polar Region for PROSPECT, NASA/CLPS. In Proceedings of the Europlanet Science Congress, EPSC2022-530, Palacio de Congresos de Granada, Granada, Spain, 18–23 September 2022. [Google Scholar]
  8. Changela, H.G.; Chatzitheodoridis, E.; Antunes, A.; Beaty, D.; Bouw, K.; Bridges, J.C.; Capova, K.A.; Cockell, C.S.; Conley, C.A.; Dadachova, E.; et al. Mars: New insights and unresolved questions. Int. J. Astrobiol. 2021, 20, 394–426. [Google Scholar] [CrossRef]
  9. Longo, A.Z. The Mars Astrobiology, Resource, and Science Explorers (MARSE) Mission Concept. LPI Contrib. 2024, 3040, 1917. [Google Scholar]
  10. Tian, Y.; Yu, M.; Yao, M. Crater edge-based flexible autonomous navigation for planetary landing. J. Navig. 2019, 72, 649–668. [Google Scholar] [CrossRef]
  11. Christian, J.A.; Yao, M. Optical navigation using planet’s centroid and apparent diameter in image. J. Guid. Control. Dyn. 2015, 38, 192–204. [Google Scholar] [CrossRef]
  12. DeLatte, D.M.; Crites, S.T.; Guttenberg, N.; Yairi, T. Automated crater detection algorithms from a machine learning perspective in the convolutional neural network era. Adv. Space Res. 2019, 64, 1615–1628. [Google Scholar] [CrossRef]
  13. Wu, Y.; Wan, G.; Liu, L.; Wang, S. Intelligent crater detection on planetary surface using convolutional neural network. In Proceedings of the 5th Advanced Information Technology, Chongqing, China, 13–14 March 2021. [Google Scholar]
  14. Wang, H.; Jiang, J.; Zhang, G. CraterIDNet: An end-to-end fully convolutional neural network for crater detection and identification in remotely sensed planetary images. Remote Sens. 2018, 10, 1067. [Google Scholar] [CrossRef]
  15. Chen, Z.; Jiang, J. Crater detection and recognition method for pose estimation. Remote Sens. 2021, 13, 3467. [Google Scholar] [CrossRef]
  16. Tewari, A.; Verma, V.; Srivastava, P.; Jain, V.; Khanna, N. Automated crater detection from co-registered optical images, elevation maps and slope maps using deep learning. Planet. Space Sci. 2022, 218, 105500. [Google Scholar] [CrossRef]
  17. DeLatte, D.M.; Crites, S.T.; Guttenberg, N.; Tasker, E.J.; Yairi, T. Segmentation convolutional neural networks for automatic crater detection on mars. IEEE J. Sel. Top. Appl. Earth Obs. Remote Sens. 2019, 12, 2944–2957. [Google Scholar] [CrossRef]
  18. Silburt, A.; Ali-Dib, M.; Zhu, C.; Jackson, A.; Valencia, D.; Kissin, Y.; Daniel, T.; Menou, K. Lunar crater identification via deep learning. Icarus 2019, 317, 27–38. [Google Scholar] [CrossRef]
  19. Wang, S.; Fan, Z.; Li, Z.; Zhang, H.; Wei, C. An effective lunar crater recognition algorithm based on convolutional neural network. Remote Sens. 2020, 12, 2694. [Google Scholar] [CrossRef]
  20. Yang, S.; Cai, Z. High-resolution feature pyramid network for automatic Crater detection on Mars. IEEE Trans. Geosci. Remote Sens. 2021, 60, 1–12. [Google Scholar] [CrossRef]
  21. Silvestrini, S.; Lavagna, M. Deep learning and artificial neural networks for spacecraft dynamics, navigation and control. Drones 2022, 6, 270. [Google Scholar] [CrossRef]
  22. Pauly, L.; Rharbaoui, W.; Shneider, C.; Rathinam, A.; Gaudillière, V.; Aouada, D. A survey on deep learning-based monocular spacecraft pose estimation: Current state, limitations and prospects. Acta Astronaut. 2023, 212, 339–360. [Google Scholar] [CrossRef]
  23. Lu, T.; Hu, W.; Liu, C.; Yang, D. Relative pose estimation of a lander using crater detection and matching. Opt. Eng. 2016, 55, 023102. [Google Scholar] [CrossRef]
  24. Park, W.; Jung, Y.; Bang, H.; Ahn, J. Robust crater triangle matching algorithm for planetary landing navigation. J. Guid. Control. Dyn. 2019, 42, 402–410. [Google Scholar] [CrossRef]
  25. Alfredo, R. A robust crater matching algorithm for autonomous vision-based spacecraft navigation. In Proceedings of the IEEE 8th International Workshop on Metrology for AeroSpace, Naples, Italy, 23–25 June 2021. [Google Scholar]
  26. Doppenberg, W. Autonomous Lunar Orbit Navigation with Ellipse R-CNN. Master’s Thesis, Delft University of Technology, Delft, The Netherlands, 7 July 2021. [Google Scholar]
  27. Wang, C.Y.; Bochkovskiy, A.; Liao, H.Y.M. YOLOv7: Trainable bag-of-freebies sets new state-of-the-art for real-time object detectors. In Proceedings of the IEEE/CVF Conference on Computer Vision and Pattern Recognition, Vancouver, Canada, 18–22 June 2023. [Google Scholar]
  28. Mark, B.; Cheong, O.; Krevel, M.; Overmars, M. Computational Geometry: Algorithms and Applications; Springer: Berlin/Heidelberg, Germany, 2008. [Google Scholar]
  29. NASA Scientific Visualization Studio. Available online: https://svs.gsfc.nasa.gov/4475 (accessed on 20 March 2024).
  30. NASA Jet Propulsion Laboratory. Available online: https://www.jpl.nasa.gov/images/pia19518-lepida-av-l-14 (accessed on 20 March 2024).
Figure 1. Deep learning crater detection results. (a) Vesta crater detection results. (b) Eros crater detection results.
Aerospace 11 00417 g001
Figure 2. Delaunay triangulation flow chart.
Aerospace 11 00417 g002
Figure 3. Deep learning crater detection results. (a) Crater detection results. (b) Triangulation results.
Aerospace 11 00417 g003
Figure 4. Schematic diagram of the triangle feature primitive of the craters. The primitive feature region encompasses the green area where Δ ABC is located.
Aerospace 11 00417 g004
Figure 5. Schematic diagram of the Gaussian pyramid images.
Aerospace 11 00417 g005
Figure 6. Gradient direction division of support region.
Aerospace 11 00417 g006
Figure 7. Support region gradient histogram. Arrows represent gradient directions. As shown in the dotted box, the peak of the gradient histogram represents the dominant gradient direction.
Aerospace 11 00417 g007
Figure 8. Crater detection results with deep learning method.
Aerospace 11 00417 g008
Figure 9. Triangulation results with detected craters.
Aerospace 11 00417 g009
Figure 10. Schematic diagram of the support region. (a) Circumcircle support region. (b) Triangle support region. (c) Incircle support region.
Aerospace 11 00417 g010
Figure 11. Average consumption time and correct matching rate for different support regions.
Aerospace 11 00417 g011
Figure 12. Effects of different Euclidean distance of descriptors γ .
Aerospace 11 00417 g012
Figure 13. Experimental results of geometric descriptors under different transformations. (a) Scale transformation matching results. (b) Illumination transformation matching results. (c) Rotation transformation matching results.
Aerospace 11 00417 g013
Figure 14. Experimental results of region descriptors under different transformations. (a) Scale transformation matching results. (b) Illumination transformation matching results. (c) Rotation transformation matching results.
Aerospace 11 00417 g014
Figure 15. Experimental results of composite descriptors under scale transformations. (a) Scale = 0.8. (b) Scale = 0.65. (c) Scale = 0.5.
Aerospace 11 00417 g015
Figure 16. Experimental results of composite descriptors under illumination transformations. (a) Illumination intensity = 0.8. (b) Illumination intensity = 0.9. (c) Illumination intensity = 1.2.
Aerospace 11 00417 g016
Figure 17. Experimental results of composite descriptors under rotation transformations. (a) Angle = 180°. (b) Angle = 90°. (c) Angle = 5°.
Aerospace 11 00417 g017
Table 1. Geometric descriptor matching results.
TransformationScaleRotationIllumination
Correct matching rate/%95.841.267.1
Table 2. Region descriptor matching results.
TransformationScaleRotationIllumination
Correct matching rate/%96.586.391.2
Table 3. Average composite descriptor matching results.
TransformationScaleRotationIllumination
Correct matching rate/%10098.994.2
Disclaimer/Publisher’s Note: The statements, opinions and data contained in all publications are solely those of the individual author(s) and contributor(s) and not of MDPI and/or the editor(s). MDPI and/or the editor(s) disclaim responsibility for any injury to people or property resulting from any ideas, methods, instructions or products referred to in the content.

