Article

Sensitivity Analysis for Design Parameters of Electric Tilt-Rotor Aircraft

1
National Key Laboratory of Helicopter Aeromechanics, College of Aerospace Engineering, Nanjing University of Aeronautics and Astronautics, Nanjing 210016, China
2
Advanced Design Technology of Aircraft National Defense Key Subject Laboratory, College of Aerospace Engineering, Nanjing University of Aeronautics and Astronautics, Nanjing 210016, China
*
Author to whom correspondence should be addressed.
Aerospace 2024, 11(4), 322; https://doi.org/10.3390/aerospace11040322
Submission received: 1 March 2024 / Revised: 15 April 2024 / Accepted: 18 April 2024 / Published: 20 April 2024

Abstract

:
In recent years, there has been rapid development in electric aircraft, particularly electric vertical takeoff and landing (eVTOL) aircraft, as part of efforts to promote green aviation. During the conceptual design stage, it is crucial to select appropriate values for key parameters and conduct sensitivity analysis on these parameters. This study focuses on an electric tilt-rotor aircraft and proposes a performance analysis method for electric aircraft while developing a general design tool specifically for this type of aircraft. Subsequently, the impact of wing incidence angle, sweep angle, span, propeller solidity, battery-specific energy, and battery mass on range, maximum takeoff weight, and hover power are analyzed. The results show that the battery mass, wingspan, and wingtip chord length have great effects on the maximum takeoff weight; among these, battery mass had the greatest influence. In terms of range, the battery energy density has a great positive effect on range, while the increase in wing angle of incidence, wingtip chord length and battery mass have some negative effects on range.

1. Introduction

After Uber Elevate published a white paper in 2016 titled “Fast-Forwarding to a Future of On-Demand Urban Air Transportation”, electric vertical takeoff and landing aircraft (eVTOL) have gained significant attention due to their extensive potential applications in urban air traffic, intercity transportation, unmanned cargo, and the concurrent advancement of battery technology, motor systems, flight control mechanisms, and other related technologies. In recent years, the development of electric vertical takeoff and landing aircraft has been very rapid. Many researchers have made great efforts in the configurations and the innovation of analytical methods.
Moore et al. [1,2,3] explained the advantages of battery storage, electric motors, and power electronics applied to air travel, and highlighted the potential of electric propulsion to enable cheap, quiet, and reliable short-range VTOLs.
Bacchini et al. [4,5] analyzed and compared various performance of three eVTOL aircraft with different configurations. Multirotor vehicles are more efficient in hovering; vectored thrust jets are more efficient in cruising and have a higher range; lift–cruise vehicles are a compromise.
Ma et al. [6] proposed a DEP eVTOL aircraft conceptual design and optimization method based on a single-ducted fan and its surrounding wing section. The applicability and effectiveness of the proposed design scheme were proved by a case study. Kankanawadi et al. [7] studied the conceptual design of a small, fixed-wing VTOL UAV. Palaia et al. [8] presented a new conceptual design methodology for urban air vehicles and applied it to an innovative convertiplane based on a box–wing architecture. Thu et al. [9] proposed an accurate analytical method to improve the performance prediction of eVTOL UAV under stable level flight conditions. Beyne and Schoser et al. [10,11] conducted a preliminary study on the performance analysis method of long-range eVTOL aircraft with tandem wing configuration. In addition, in terms of range estimation, Dundar and Xu et al. proposed a range duration estimation method for UAV aircraft, while Traub et al. estimated the range and endurance of electric aircraft by establishing a relationship [12,13,14]. The existing research on conceptual design or performance analysis primarily focuses on small aircraft and unmanned aerial vehicles, as well as specific aircraft configurations, without the establishment of a comprehensive performance analysis system that encompasses multiple configurations and sizes. This limitation can be attributed to technological maturity and market demand.
In the optimization work of eVTOL aircraft, Osita Ugwueze et al. [15,16] presented the development of a robust sizing method for efficiently estimating and comparing key performance parameters for two broad categories of eVTOL aircraft (power-lift and wingless) during the conceptual design phase. Alba-Maestre et al. [17] applied multidisciplinary design optimization technology to the design process of eVTOL aircraft and carried out local optimization of energy consumption. Sun et al. [18] propose a new orbital optimization method for electric vertical takeoff and landing (eVTOL) vehicles for urban air mobility (UAM) missions.
The system complexity of eVTOL aircraft is relatively high, involving many key technologies such as high-energy-density batteries, aircraft design, energy management, and high-power-density electric propulsion technology. In the preliminary design stage, it is crucial to determine reasonable design parameters, which include but are not limited to the plane parameters of the wing (such as span length and sweep angle), battery weight, battery energy density, and the size parameters of the propulsion system, etc., all of which affect the takeoff weight, hovering power, range, and flight time of the aircraft to varying degrees.
Palaia et al. [19] developed a conceptual design tool for hybrid–electric VTOL aircraft, which provides a platform for the analysis of design parameters. Kadhiresan et al. [20] used the weight-based method to study the influence of parameters such as motor size and wing load on different configurations according to the task requirements. Hascaryo and Tyan et al. [21,22] also proposed size adjustment methods for eVTOL aircraft to determine more reasonable design parameters.
Sensitivity analysis can provide a basis for determining the design parameters. Sensitivity analysis of the design parameters can clarify the impact of each parameter on the specific performance indicators, and then provide a reference for the selection of the design parameters and the optimization of the design scheme. Lee et al. [23] conducted a sensitivity analysis of the design parameters of the eVTOL aircraft, but it seems that the tilting transition segment was not considered in the mission performance analysis.
Taking a certain type of electric tilt-rotor aircraft as an example, this paper proposed a performance analysis method for the electric aircraft. With MS Excel and VBA programming languages as development tools, a conceptual design tool for electric aircraft was developed by integrating OpenVSP 3.27.1 aircraft conceptual design software and an engineering estimation method of aircraft weight. The design parameters such as wing incidence angle, sweep angle, span, battery mass, battery energy density, and propeller solidity were selected to analyze their effects on the aircraft’s performance indexes, such as maximum takeoff weight, range, duration, hover power, and cruise power.

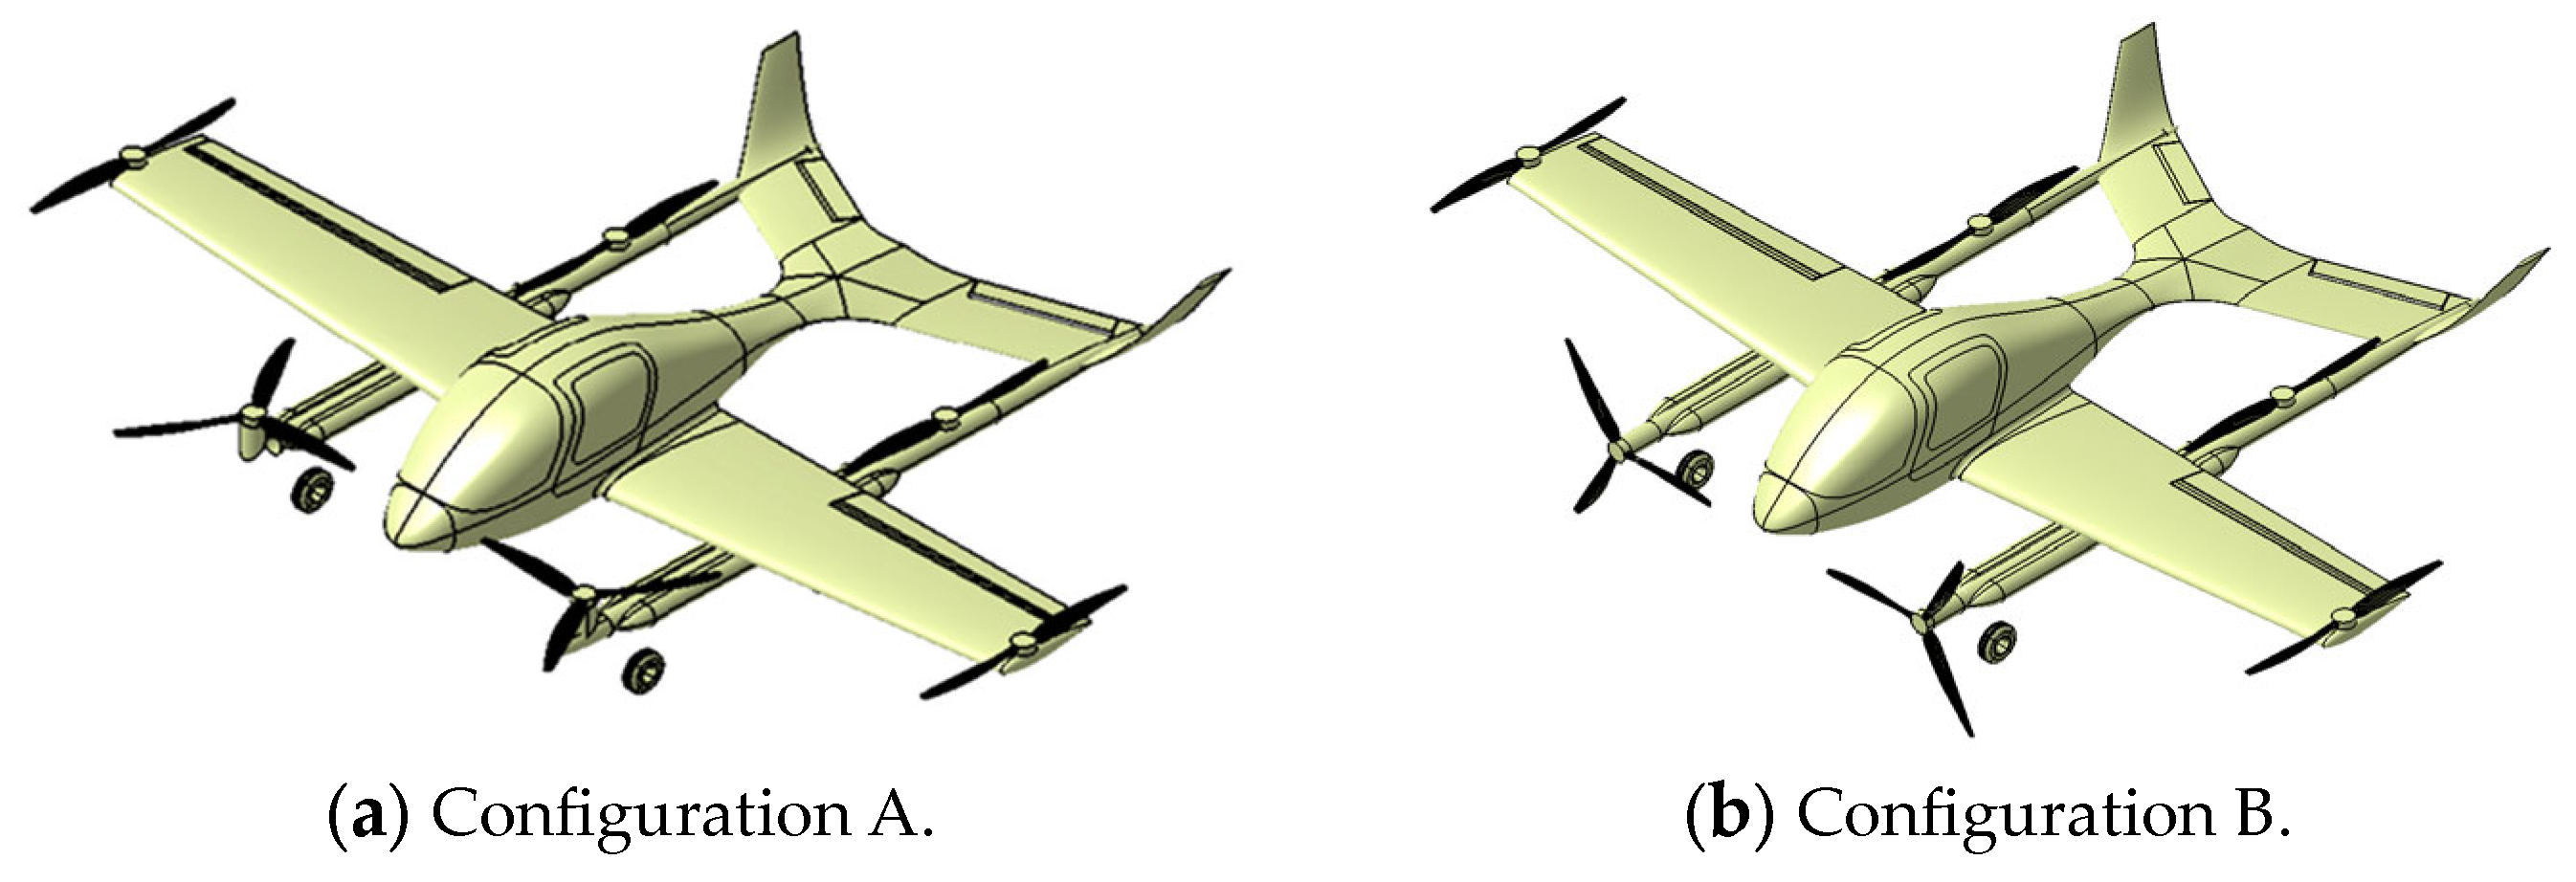
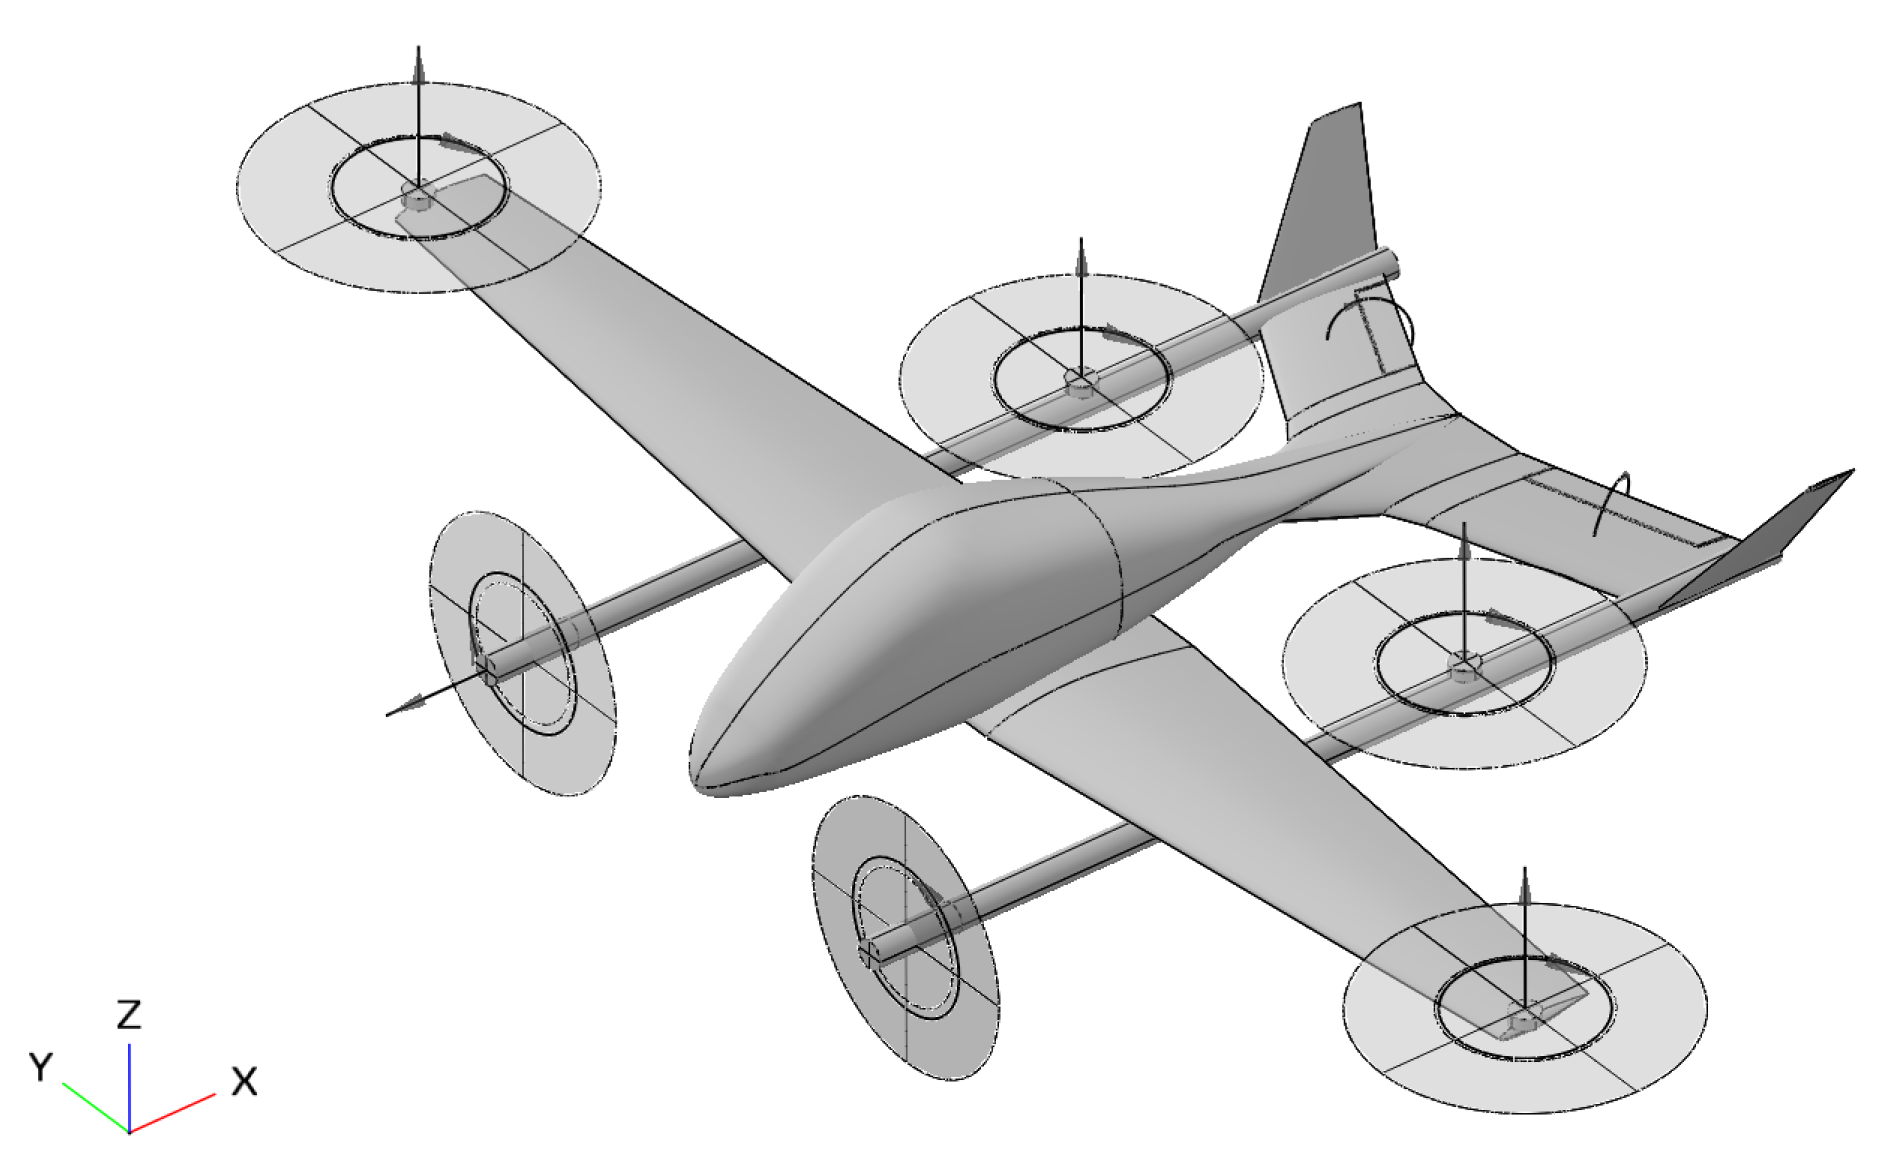
2. The Electric Tilt-Rotor Aircraft

This research focuses on an electric tilt-rotor aircraft, which possesses vertical takeoff and landing capabilities as well as high-speed cruising abilities. As shown in Figure 1, it employs a single-wing layout and is equipped with six fixed-pitch propellers. The two three-blade propellers near the nose are mounted on the connecting rod suspended below the wing. They collaborate with the rear four propellers to maintain hover mode and provide thrust for forward flight, both of which require tilting maneuvers. The rear four propellers solely generate thrust during hover, takeoff, and landing, while the lift force during cruising is provided by the wing to counterbalance gravity. The configurations are illustrated below:

3. Electric Aircraft Conceptual Design Tool

The conceptual design tool of electric aircraft is the basis of sensitivity analysis of the design parameters. In this paper, MS Excel and VBA programming languages were selected as tools to realize the development of conceptual design tools for the electric aircraft, which can meet the requirements of analysis accuracy in the conceptual design stage. The tool mainly includes several modules, such as parametric modeling, aerodynamic analysis, weight estimation, and performance analysis. The functions of each module are briefly introduced below.

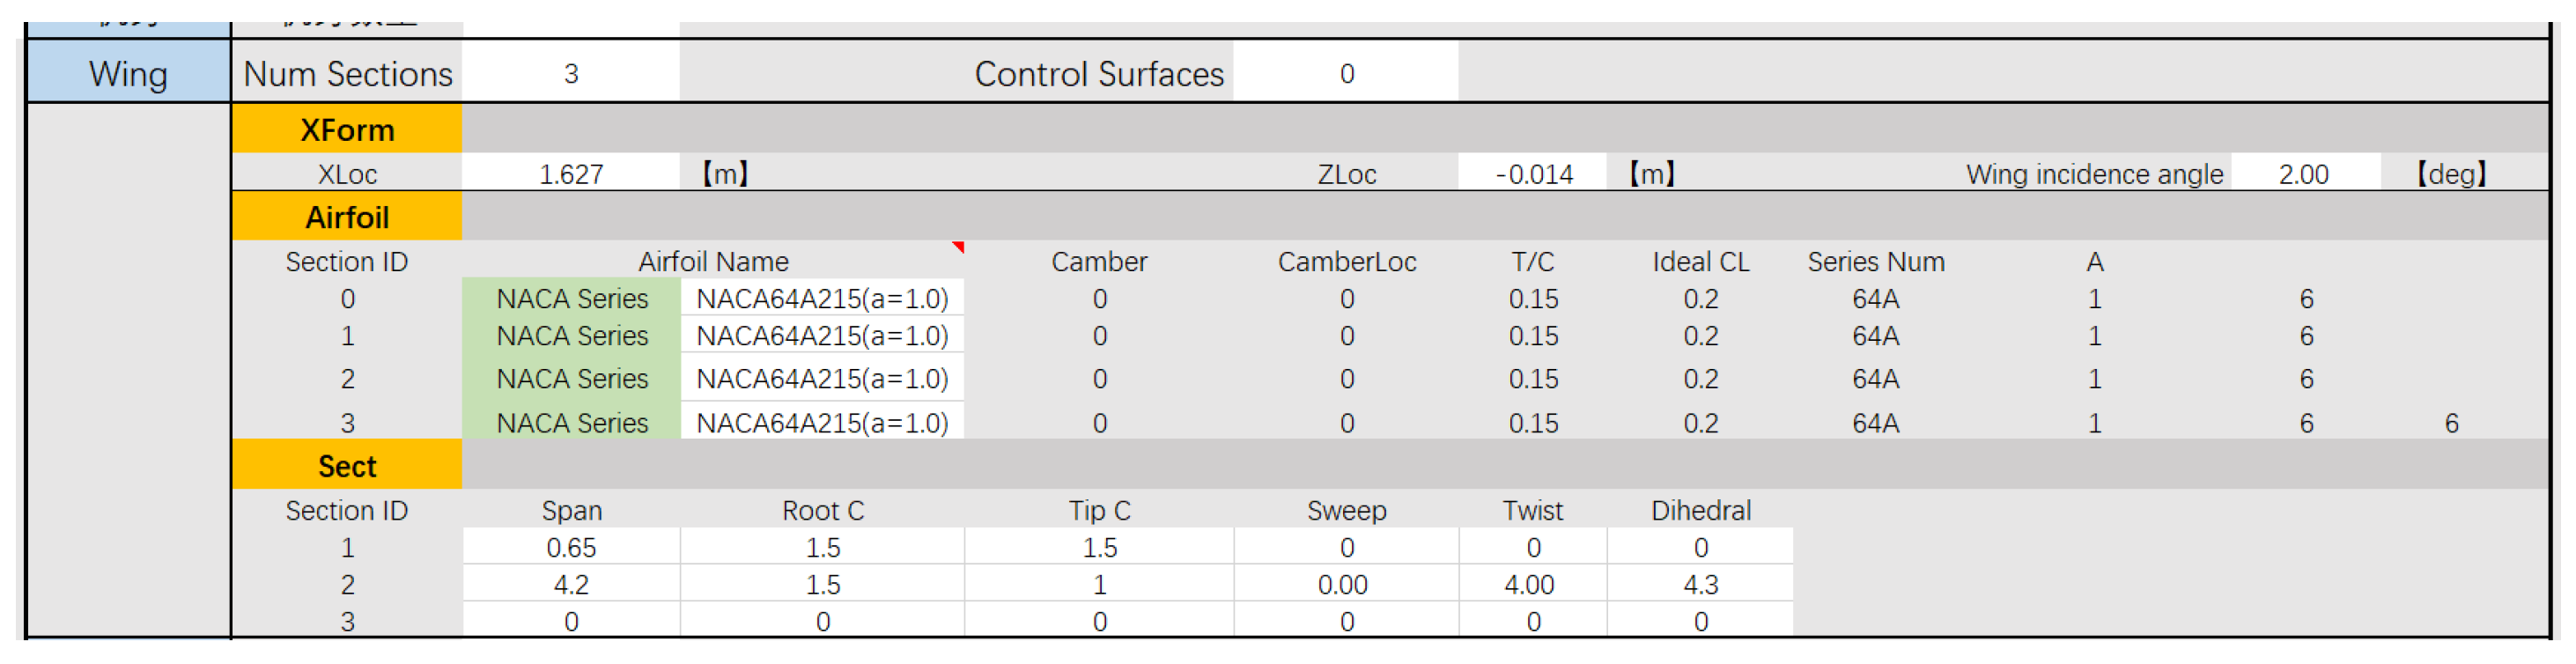
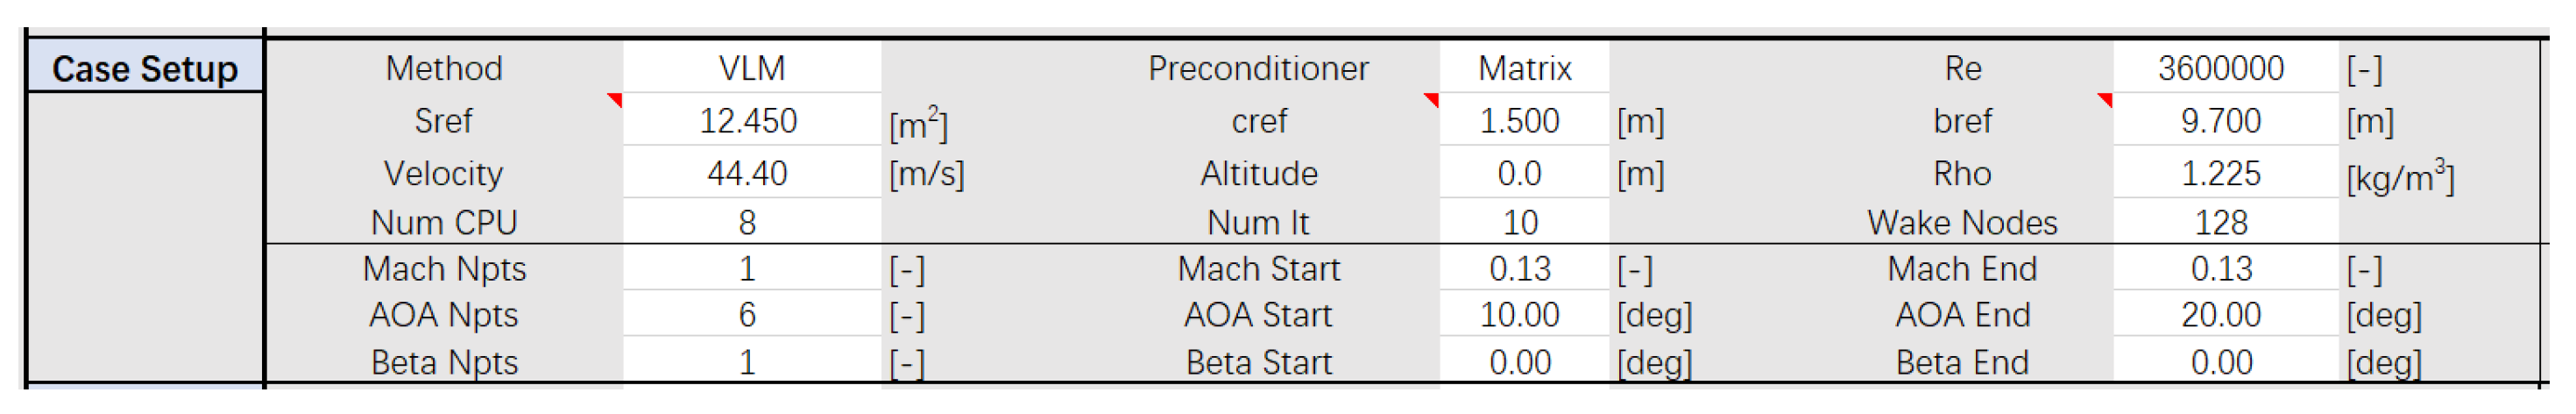
3.1. Parametric Modeling and Aerodynamic Analysis

The geometric model is the basis of aerodynamic analysis and provides the necessary geometric data for other modules. In order to meet the needs of convenient and quick modeling, OpenVSP aircraft design software was selected to complete the construction of the parametric modeling module of electric aircraft. The modeling logic of OpenVSP and the modeling methods of various components have been introduced in detail in the literature [24]. This paper also wrote scripts based on C++ language. The modeling was realized by calling cmd scripts through VBA program.
Aerodynamic analysis can provide the necessary lift–drag coefficient and other data for subsequent performance analyses. This module was realized by integrating the VSPAero solver embedded in OpenVSP, and the aerodynamic analysis results could be achieved with low computational cost by using the vortex lattice method. Partial input interfaces for parametric modeling and aerodynamic analysis are shown in Figure 2 and Figure 3.

3.2. Weight Module

The weight of the aircraft has a great impact on the range and endurance. In this paper, VBA program was written to build the weight module. In the case of setting the initial maximum takeoff weight of the aircraft, the statistical classification weight method for general aircraft in [25] was adopted to complete the weight estimation of the aircraft through repeated iterations. It includes the structural weight ( m s ), the power system weight ( m ps ), the equipment weight ( m e ), and the payload ( m pl ). At the same time, it can give the classification weight list, the weight distribution diagram, and the relative position diagram of the aircraft center of gravity and the wing.
m = m s + m ps + m e + m pl
The structural weight ( m s ) includes the wing weight ( m w ), the flat tail weight ( m ht ), the vertical tail weight ( m vt ), the fuselage structural weight ( m f ), and the landing gear weight ( m lg ).
m s = m w + m ht + m vt + m f + m lg
The power system weight ( m ps ) includes the battery weight ( m b ), the motor weight ( m m ), and the propeller weight ( m prop ).
m ps = m b + m m + m prop
This paper focuses on the effects of wing parameters on weight and performance. The weight of the wing structure is related to the wing reference area ( S r e f ), the wing aspect ratio ( A R ), the sweep angle of the 1/4 chord ( Λ 25 % ), the dynamic pressure, the tip/root ratio ( λ ), the average relative thickness of the wing ( t ¯ av ), the maximum load factor ( n z ) and the design flight weight at full payload ( m d g ) [25]. The units in the formula below are international units.
m w = 0.036 ( S r e f K f t _ m 2 ) 0.758 ( A R cos 2 Λ 25 % ) 0.6 ( K f t _ m K l b _ k g q ) 0.006 λ 0.04 ( 100 t ¯ av cos Λ 25 % ) 0.3 ( n z m d g K l b _ k g ) 0.49 K l b _ k g

3.3. Performance Analysis Module

The sensitivity analysis of design parameters greatly relies on performance analysis, which plays a crucial role in this study. The technical approach employed by the performance analysis module in this paper is identical to that of the weight module, and it utilizes a VBA program to achieve solutions for various aircraft performance indicators. Considering the flight characteristics of electric vehicles, this paper proposes a method for conducting sensitivity analysis through performance analysis, encompassing key indicators such as range duration and hover performance.

4. Aircraft Performance Analysis

Electric vehicles, particularly eVTOL vehicles, possess the characteristics of electric propulsion and diverse configurations, which give rise to challenges that render traditional performance analysis methods inapplicable. For instance, the Breguet equation cannot be used to analyze the range and endurance of electric aircraft. The configurations of eVTOL aircraft are various and complex. For the aircraft using a vectored thrust configuration or a lift–cruise configuration, attention should be paid to the analysis of tilt performance; factors such as motor performance, propeller propulsion efficiency, and propeller thrust vary with the flight speed, which should also be comprehensively considered. This elevates the complexity involved in performing an analysis on eVTOL aircraft’s performance. This paper proposes a comprehensive approach to analyzing the performance of electric aircraft while taking the aforementioned factors into account.

4.1. Hover and Vertical Climb

During hover or vertical climb, the propeller serves as the sole lifting surface, responsible for bearing all the necessary thrust force to maintain a hover. For the propeller, the ratio between the thrust force and the area of the propeller disk is the disk loading, which affects the flight performance and quality of the aircraft. It is also directly related to the strength and life of the propeller.
According to the actuator disk theory, the propeller disk loading and propeller input power of eVTOL aircraft during hover are analyzed:
Propeller disk loading:
D L = T A
where D L is the disk loading, N/m2; T is the thrust force of a single propeller, N; A is the propeller disk area of the propeller, m2.
Propeller input power [26]:
P = T 3 2 ρ A
where P is the input power for the propeller, W; ρ is the density of the air, kg/m3.
When the propeller is in a hovering state, its rotation induces various physical effects such as tip loss, wake vortex, and uneven flow. These factors result in an actual required propeller input power that exceeds the power calculated through the momentum theory. To address this issue, the concept of figure of merit is introduced to estimate the propeller input power during hovering. Figure of merit represents the efficiency of thrust generation by the propeller while hovering and is defined as the ratio between its ideal hover power and actual hover power. If we have knowledge about propeller parameters, they can be estimated using the following methods [27]:
F M = C T 2 / 3 2 k C T 2 / 3 2 + σ C d 0 8
where F M is the figure of merit; k is the induced power coefficient, the general value is 1.15; C d 0 is the drag coefficient of the cross-section profile, usually 0.01; C T is the propeller thrust coefficient, which can be determined by the following formula [26]:
C T = T ρ N 2 D 4
where N is the revolutions per second (RPS) of propeller, r/s; D is the propeller diameter, m.
σ is the propeller solidity, and its value is determined by the following formula [26]:
σ = N b c π R
where N b is the number of propeller blades; c is the average chord length of the blade, m; R is the propeller radius, m.
Then, the input power of the propeller during hovering can be corrected as:
P = T 3 2 ρ A / F M
It is worth noting that, through the simulation calculation, it was found that the thrust generated by the propellers at the wingtips will lose about 20% due to the aerodynamic interference with the wing. Therefore, in the calculation process, consider setting a coefficient of propeller thrust with a value of 1.2.

4.2. Range

The range is a crucial performance indicator for aircraft, which to some extent deter-mines the market competitiveness of an aircraft. The weight of the electric aircraft remains relatively constant during flight. For tilt-rotor aircraft, the flight can be divided into seven task segments: hovering takeoff, transition, accelerated climb, cruise, deceleration and de-scent, transition, and hovering landing. Based on the given mission profile, we can estimate the energy required for each task segment except cruise and determine the cruise power of the aircraft using parameters such as cruise speed. Subsequently, we can calculate the flight time of the plane.
(1) Vertical takeoff and landing:
The vertical takeoff and landing of the aircraft is a stable process; that means that the propeller input power is constant. The calculation method is given in Section 4.1. The power and energy estimations for each stage in this paper were the propeller input power and energy.
(2) Transition from hover to level flight:
Due to the complexity of the tilting transition process, a tilting transition strategy with constant flight height was developed. It was assumed that, during the whole tilting process, the aircraft fuselage angle of attack was zero and the nacelle angle was tilting at an angular velocity of 6 degrees per second. The steps were as follows:
(a)
The propeller tilts at a specific angle;
(b)
The propeller works at a fixed angle to accelerate the vehicle;
(c)
After the flight speed reaches VS0, the propeller will continue to tilt until the tilting is complete.
Where the velocity VS0 is the flight speed at which the wing of the aircraft can generate all the lift to keep the aircraft flat at a zero angle of attack when the flap is down. In the process of tilting, the aircraft speed, the propeller efficiency, the nacelle angle, and other parameters are in dynamic change. In order to estimate the transient propeller state more accurately, this paper iteratively calculated the acceleration, speed, wing lift, propeller pull and power, and other parameters during the tilting process. The basic analysis process is shown in Figure 4.
The propeller propulsion efficiency involved was obtained by linear interpolation according to the given data table of the propeller performance, and the power of the propeller during tilting was estimated by the decomposition method [26]:
P v = T v 3 2 ρ A / F M
P h = T h × V
P t = P v + P h
where T v is the component of the pull of the propeller in the vertical direction, N; T h is the component of the pull of the propeller in the direction of motion, N; P v is the vertical component of the input power of the propeller, W; P h is the component of the input power of the propeller in the direction of motion, W; P t is the input power to the propeller, W.
(3) Accelerated climb and decelerated descent:
After transitions from the hover state to the level-flight state, the aircraft accelerates and climbs from the altitude at the end of the tilt process to the cruise altitude. And the decelerated descent stage refers to the height at which the aircraft descends from the cruise altitude to the beginning of the transition from the level-flight state to the hovering state. The instantaneous thrust of the front propeller is determined by the following formula:
T i = D i + W TO × a
where T i is the instantaneous combined force of the front propeller, N; a is the average acceleration, m/s2; D i is the instantaneous aerodynamic drag, N, whose value is:
D i = 1 2 ρ V i 2 S ref C D
where C D is the drag coefficient; V i is the instantaneous speed, m/s, and its value is calculated as follows:
V i = V i 1 + a × Δ t
where Δt is the time step; 1 s was taken in this paper. The propulsion efficiency of the propeller in the calculation process was obtained by linear interpolation; then, the instantaneous input power of the propeller of the aircraft is:
P i = T i × V i / η i
where η i is the instantaneous propulsion efficiency of the propeller; then, the electric energy consumed by the accelerated climb or decelerated descent is:
E i = P i t
(4) Transition from level flight to hover:
To simplify the estimation process, a tilting transition strategy with constant flight height was developed, which was divided into three stages:
(a)
After reducing the speed and the thrust force of the front propellers to slow down the aircraft to the specified speed of 1.1VS0, the rear four lift-propellers start to work.
(b)
The nacelle angle begins to tilt at an angular velocity of 6 degrees per second until the tilting is complete. At this stage the vertical thrust required by the propellers is evenly distributed among the six propellers.
(c)
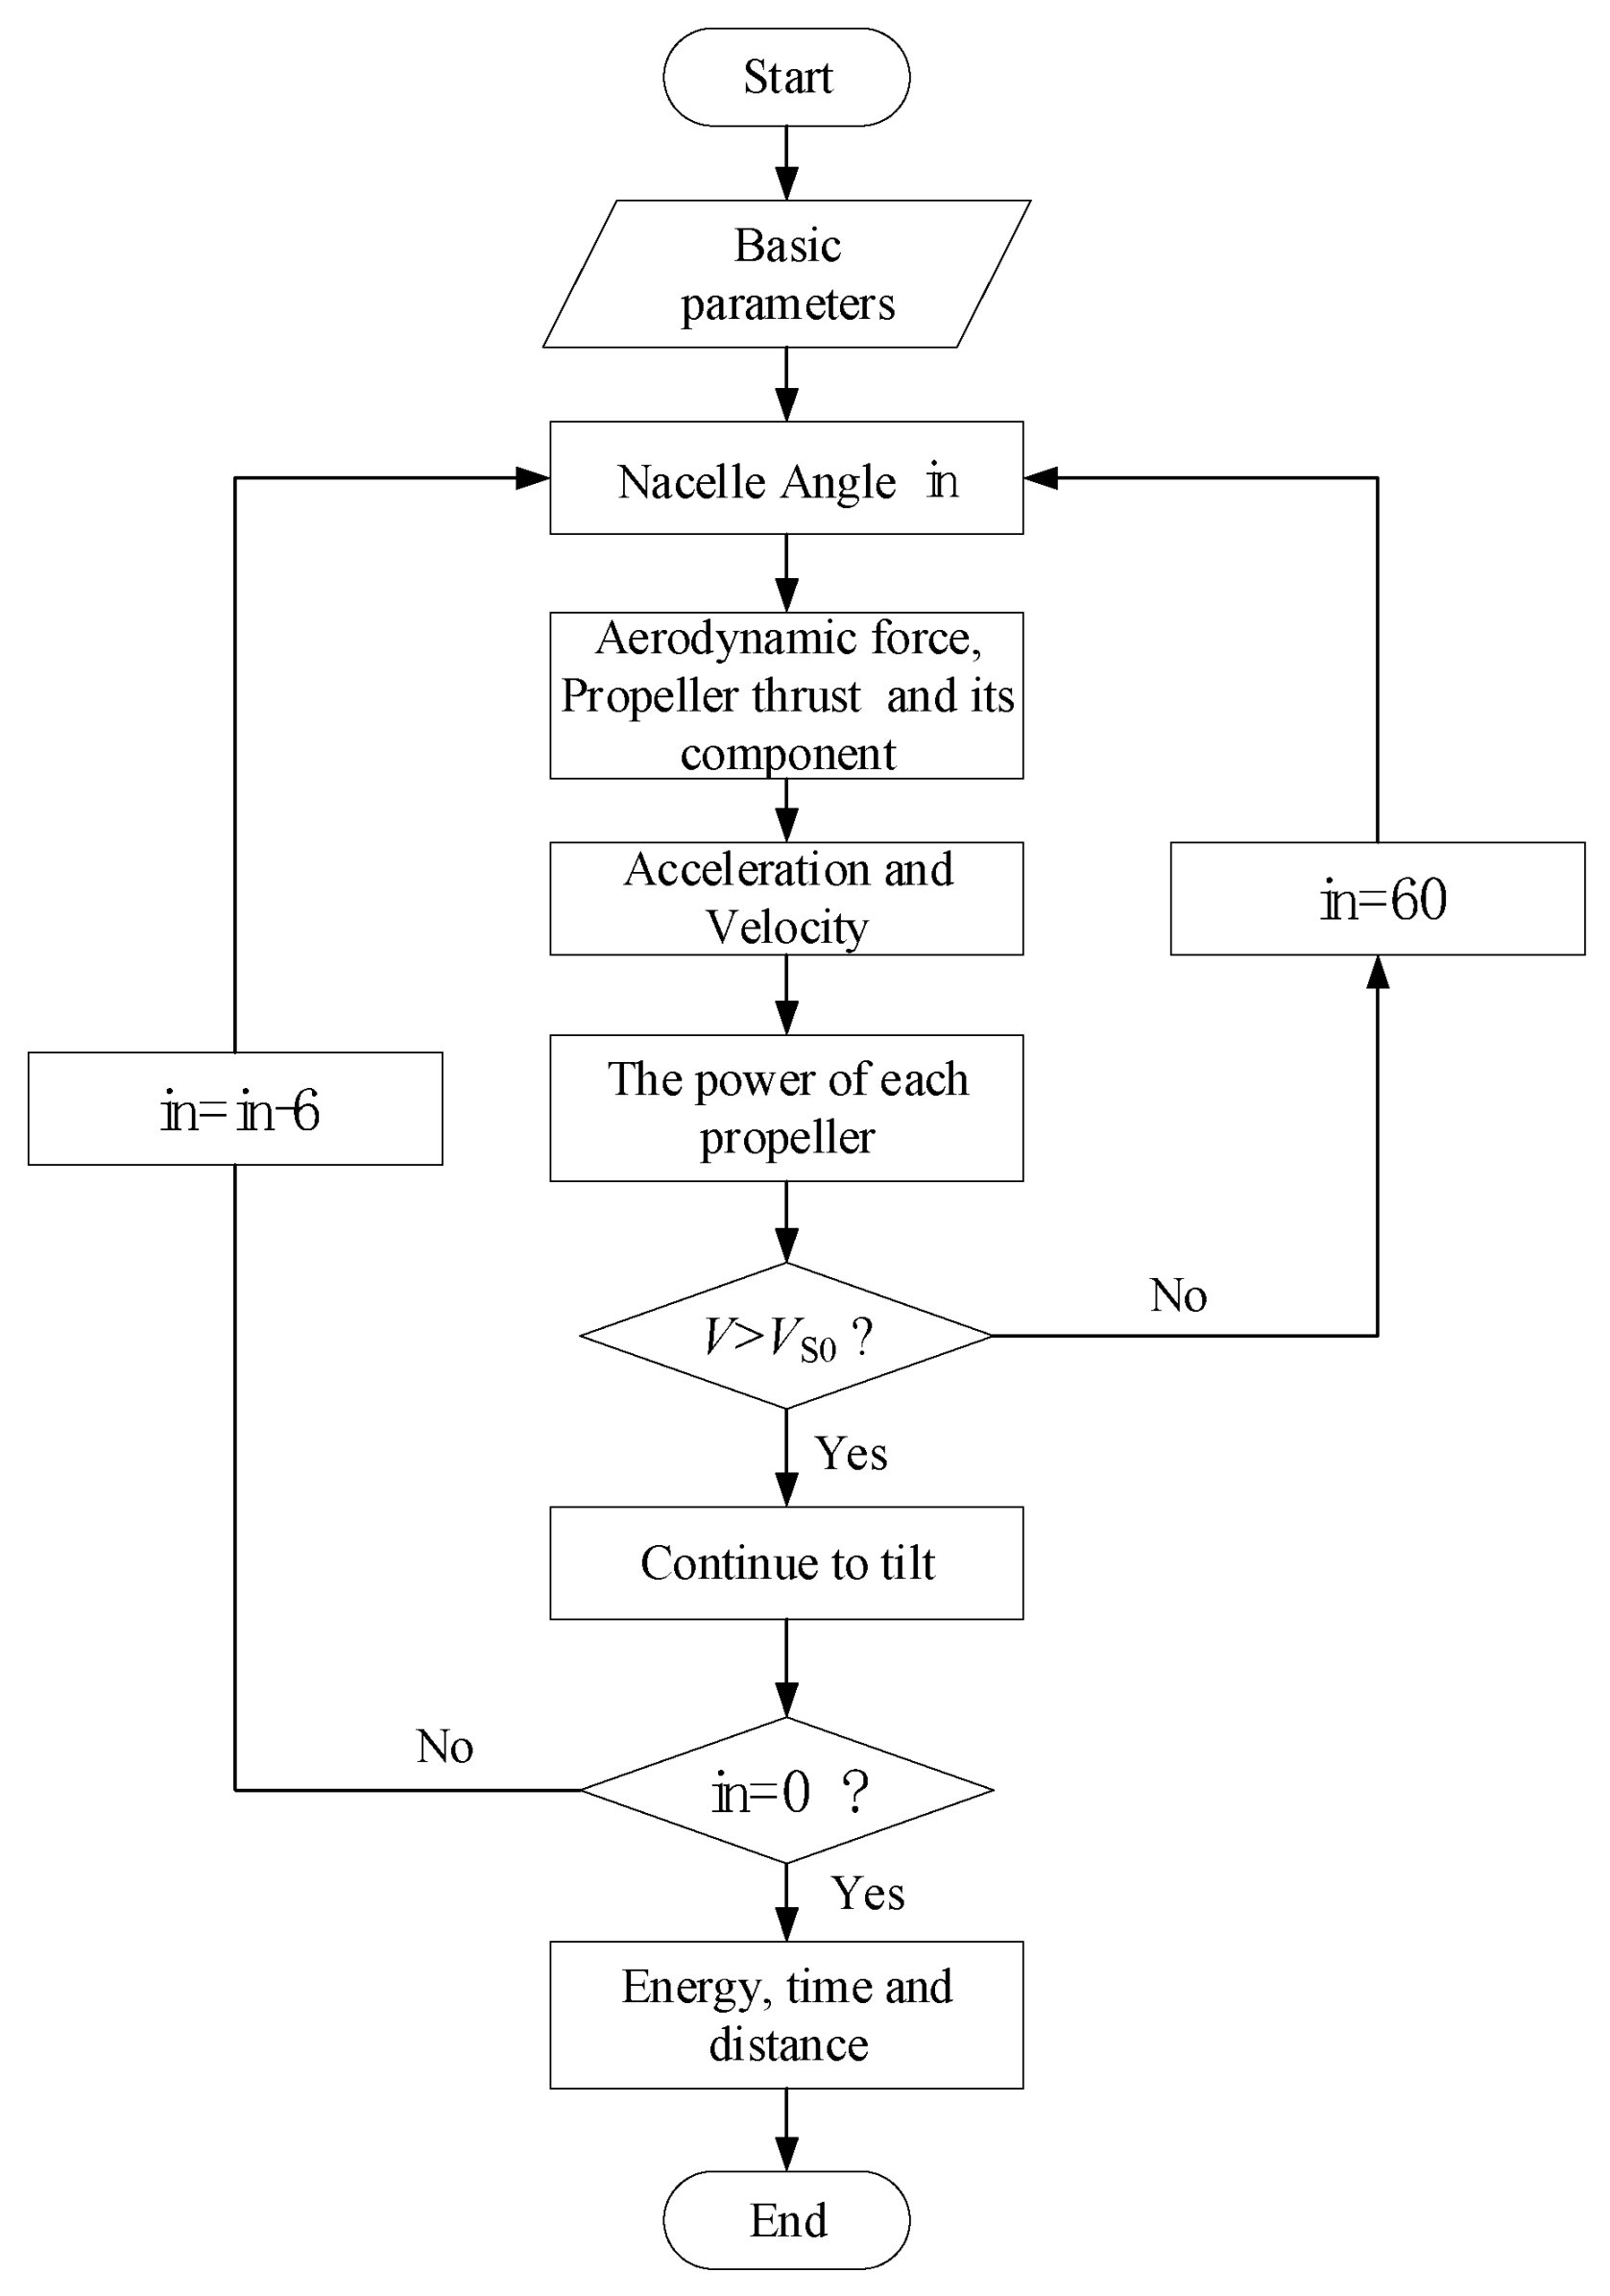
After the nacelle angle reaches 90 degrees, the aircraft decelerates in the form of multiple propellers by increasing the fuselage angle of attack, which was set at 5 degrees in this paper until the speed reaches zero, and the entire transition process ends. The analysis process is shown in Figure 5.
(5) Cruising:
The total energy of the battery was calculated according to the energy density of the selected model and the battery weight specified in the design scheme:
E = E sb × m b
where E is the total energy of the battery, Wh; E s b is the battery-specific energy, Wh/kg; m b is the battery mass, kg. In practical applications, the available power of the battery is affected by the reserve power and the depth of discharge; the depth of discharge indicates the percentage of the battery discharge and the rated capacity of the battery. In order to extend the service life of the battery, it needs to be limited to a certain range. Then, the available capacity can be expressed as:
E ky = E × D O D E by
where E ky is the battery available capacity, Wh; D O D is the discharge depth, %; E b y is the capacity for reserve, Wh.
Through the analysis of the above sections, the total energy consumed E n c of the aircraft in six mission segments, including vertical takeoff and landing, tilting transition, accelerated climb, and decelerated descent, has been obtained, and the available energy consumption for the front propellers at cruise stage is as follows:
E c = E ky × η E nc
where E c is the available energy consumption for the front propellers at cruise stage, Wh. The power at cruise stage is:
P c = D c V c / η c = W TO V c L c / D c / η c
where P c is the input power at the cruise stage, W; D c is the aerodynamic drag of cruise stage, N; V c is the cruising speed, m/s; η c is the propeller efficiency of cruise stage; L c / D c is the lift to drag ratio at cruise. Then, the endurance is:
t c = E c P c
S c = 3.6 × V c × t c
where t c is the endurance, h; S c is the range, km.

5. Sensitivity Analysis and Optimization of Key Design Parameters

The conceptual design of aircraft requires comprehensive consideration of various design indicators. In the design process, the design parameters will be constantly adjusted to meet the requirements. The change of design parameters will inevitably affect the important performance of the aircraft. Therefore, sensitivity analysis of the key design parameters is needed to clarify the impact of each parameter on the performance index, so as to provide references for the selection of design parameters and the optimization of the design scheme.
In this paper, the Isight 5.7 computer-aided optimization platform was used to integrate the conceptual design tool of electric aircraft as shown in Figure 6, and the optimal Latin Hypercube was adopted for the design of the experiment. During the analysis, the sweep angle of the wing 1/4 chord was 0°, and the number of samples was set to 120. The intervals of variation of design parameters are shown in Table 1.
According to the performance analysis method mentioned above, the energy consumption of the aircraft in various flight stages under the initial design scheme is shown in Table 2.

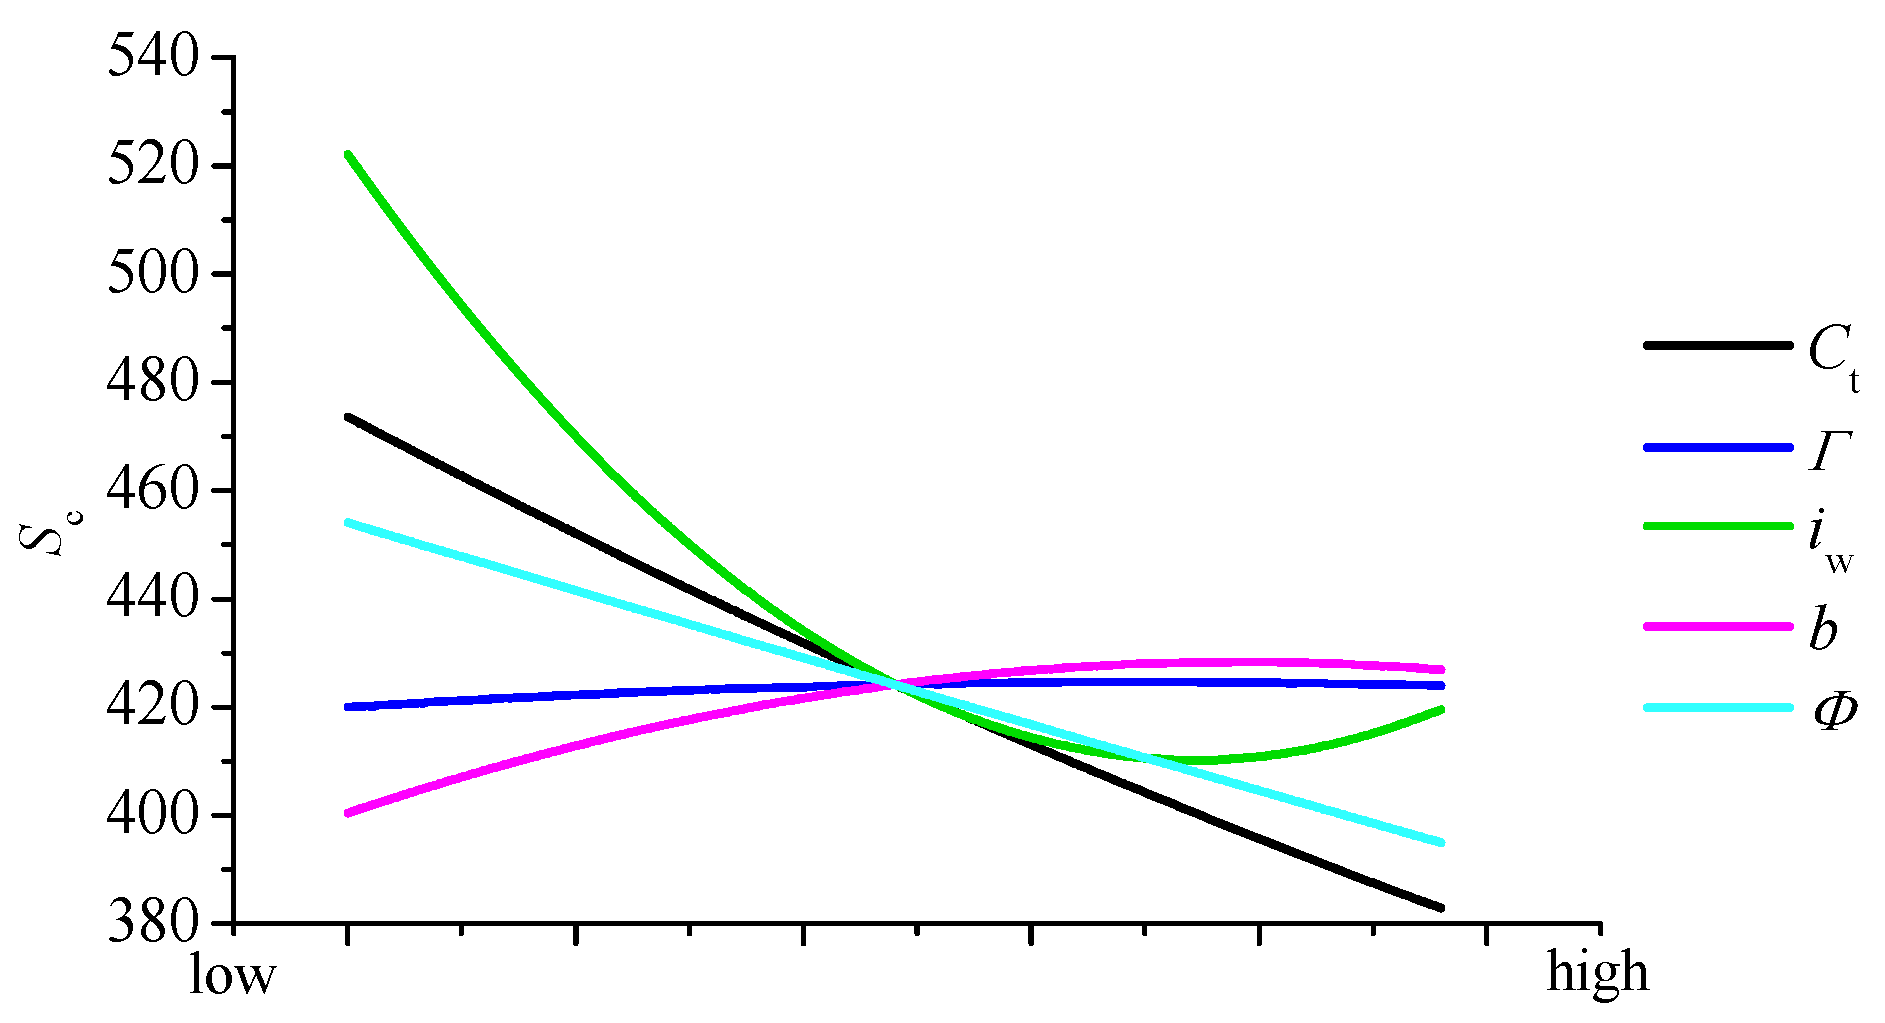
5.1. Influence of the Design Parameters of Wing on Flight Performances

This paper mainly focuses on the effects of the key design parameters of the wing on the maximum takeoff weight, cruise power, and range of the aircraft. The sensitivity analysis results are shown in Figure 7, Figure 8 and Figure 9. In Figure 7, the lines for dihedral Γ and incidence iw are covered by the black line of twist Φ. As can be seen from the figures, the effect of dihedral on these performance characters is very small. The twist angle of the wing can adjust the spanwise lift distribution, and increasing the twist angle will increase the wingtip load. The lift distribution will be further away from the wing root, which will increase the cruise resistance and reduce the range. The influence of the incidence angle on performance is mainly reflected in the cruise power and range. With the increase in incidence angle, the cruise power first increases and then decreases, reaching the maximum value at about 4.2°. The variation trend of range is the opposite. Increasing the incidence angle is beneficial in increasing the lift coefficient of the wing at 0°. However, it decreases the stall speed at this angle. It is beneficial to reduce the energy consumed by the aircraft in the tilting transition and thus increase the range, but also increase the drag coefficient during the cruise, so that the aerodynamic drag and the cruise power increase, and the range decreases.
The increase in the wingtip chord length will inevitably lead to the increase in the reference area of the wing, thus increasing the structural weight. However, the increase in the tip/root ratio will affect the spanwise distribution of the aerodynamic load, resulting in better stall characteristics. However, in this example, the induced drag will be increased at the same time, thus increasing the cruise power and reducing the range.
From an aerodynamic viewpoint, the larger the aspect ratio, the smaller the induced drag is, and the larger the lift to drag ratio is; thus, the cruise power decreases. However, when the half-span of the wing is approximately 5.8 m for this aircraft, the increase in the wingspan has no obvious beneficial effect on the range.

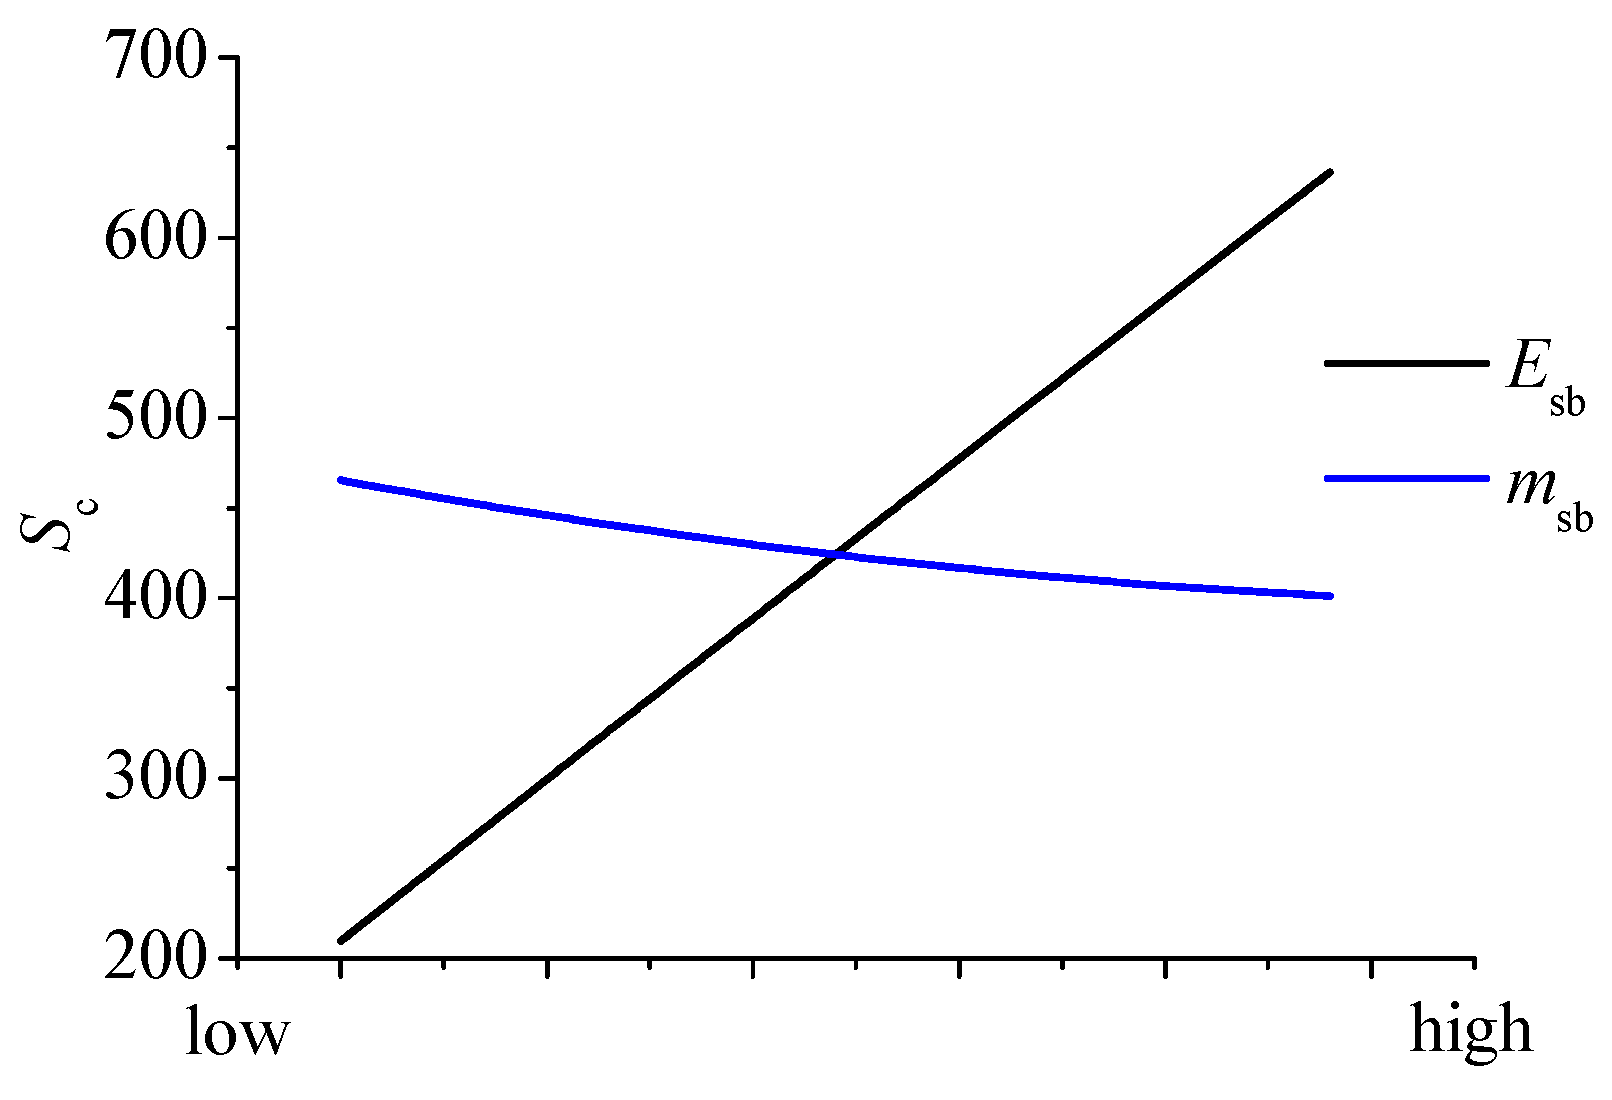
5.2. Effects of Battery Parameters on Range

The primary focus of this study was to investigate the impact of battery mass and battery energy density on range performance, as illustrated in Figure 10. Increasing the battery mass inevitably leads to an increase in the aircraft’s maximum takeoff weight, consequently raising power requirements for both hover and cruise operations. Despite providing more available energy, the dominant effect is observed on cruise power requirements, resulting in a decrease in range. Conversely, enhancing battery energy density augments the overall available energy of the aircraft, thereby leading to an increase in range.

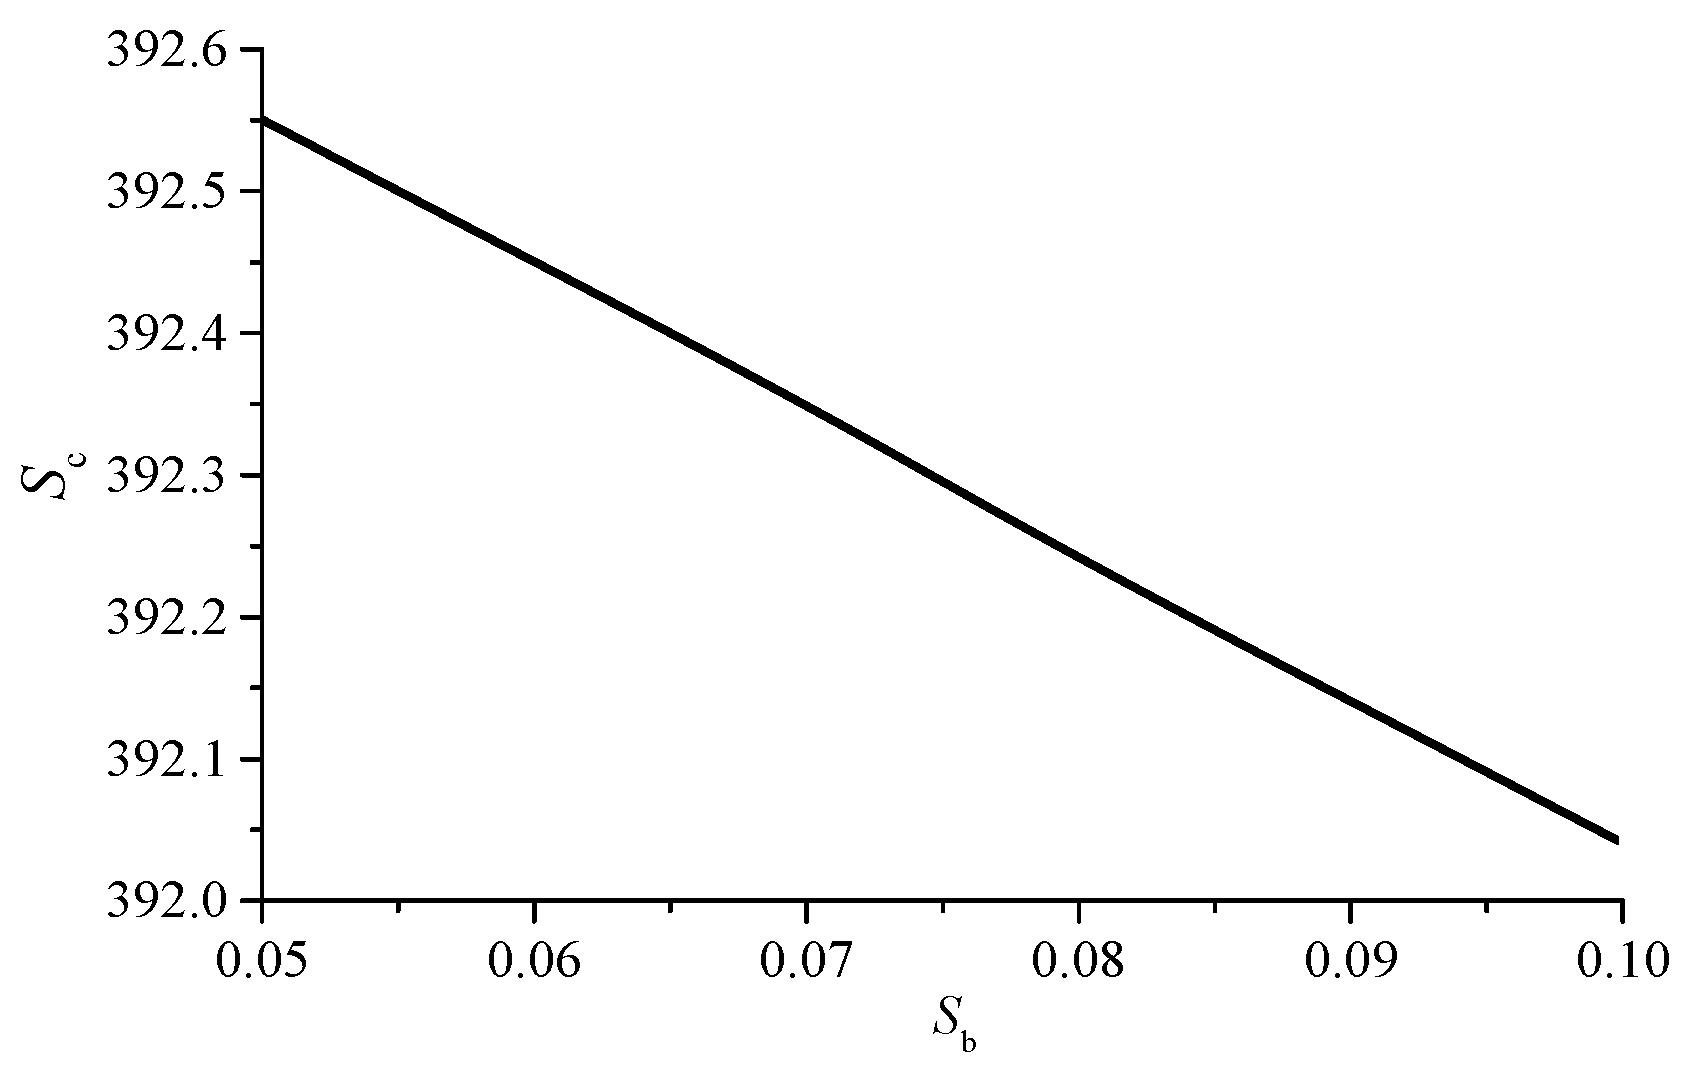
5.3. Effects of Propeller Solidity on Hover Power

In this paper, the blade area of a single blade is adjusted to reflect the change of propeller solidity. Propeller solidity has little effect on takeoff weight and cruise power, and only its influence on hover power and range is investigated here. The results are shown in Figure 11 and Figure 12. According to Equation (3), the increase in propeller solidity can reduce the figure of merit, thereby increasing the input power of propeller in hover, and increasing the energy consumption in the hover climbing and descending stages. As can be seen from Figure 12, propeller solidity has little influence on the range, and the range decreases with the increase in propeller solidity. This is because the increase in propeller solidity reduces the cruise-available energy.

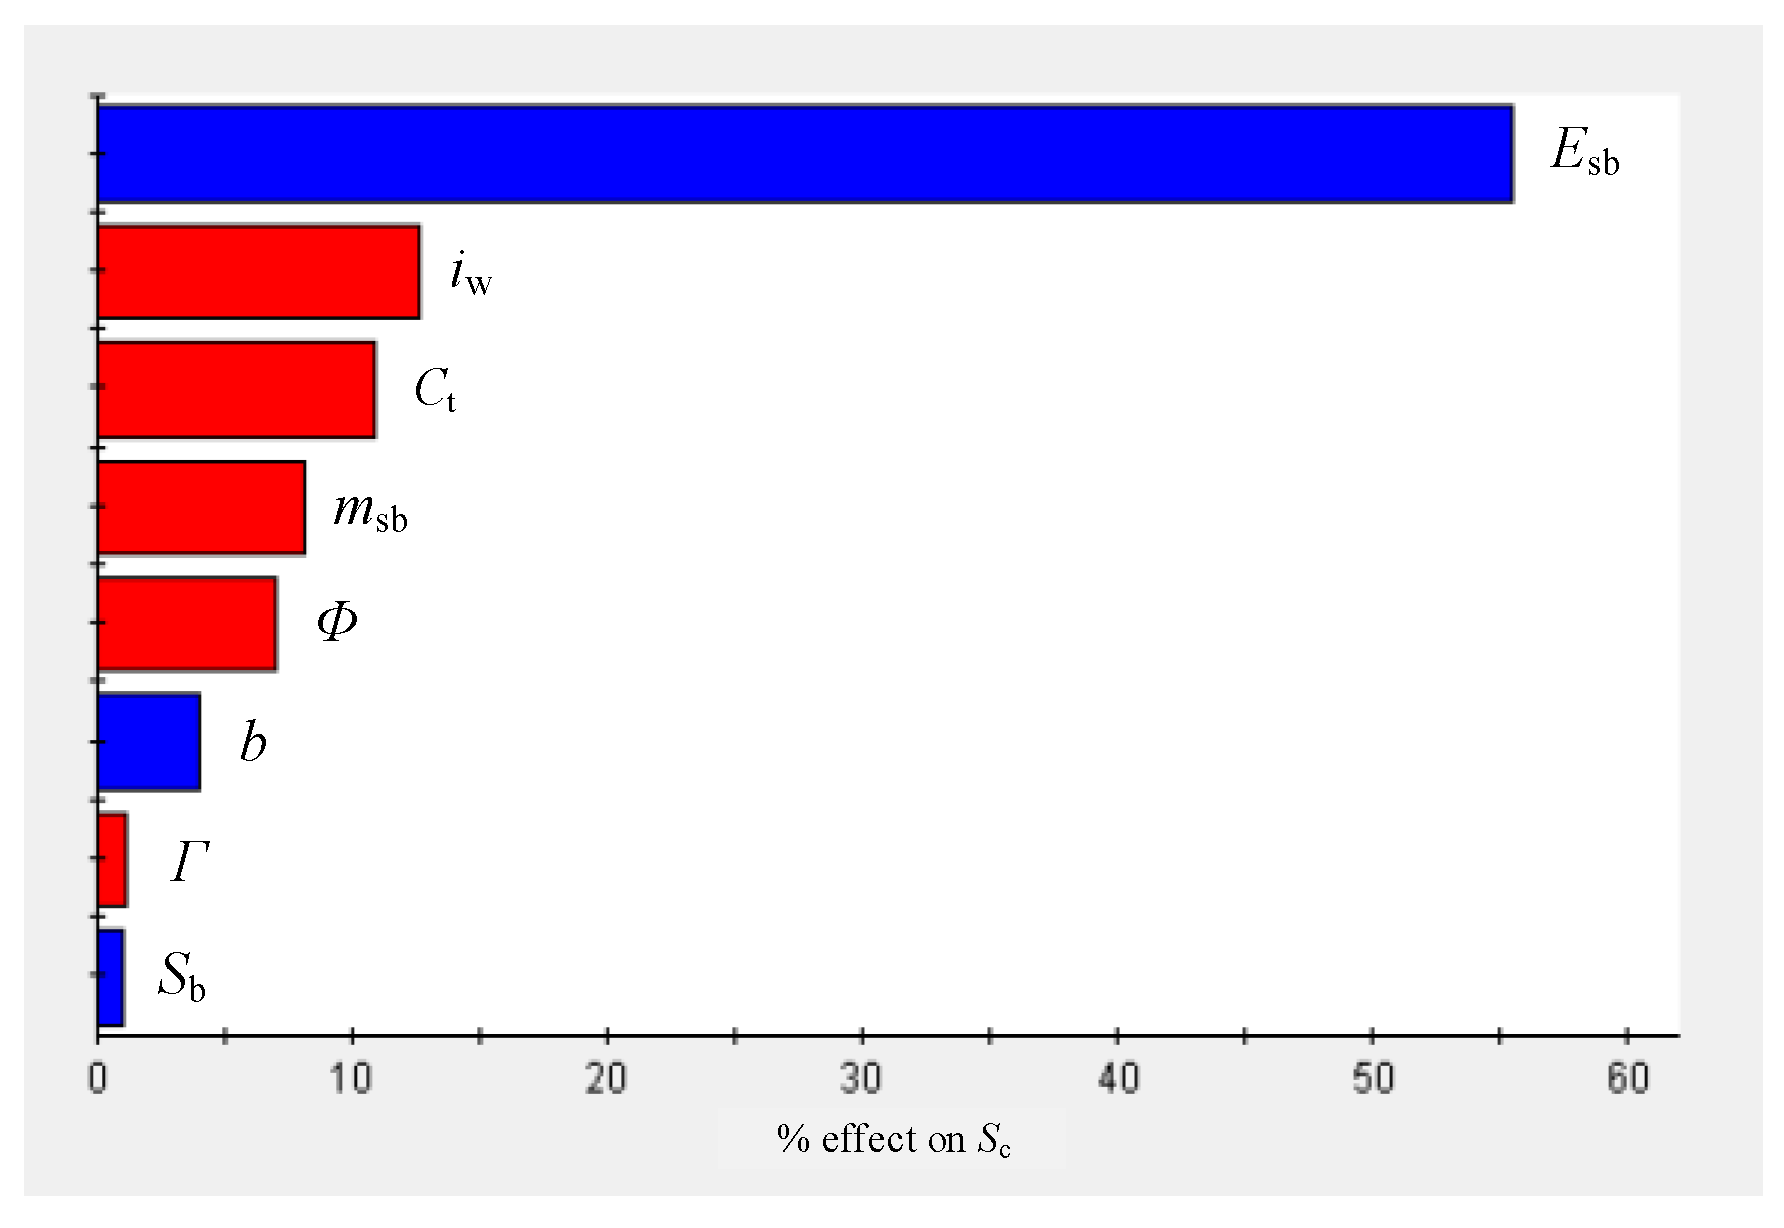
5.4. Multi-Parameter Sensitivity Analysis

The influences of multiple parameters on performance are represented with a Pareto diagram in this paper. The analysis results shown in Figure 13 and Figure 14 reveal the influence of eight design parameters on takeoff weight and range. These parameters are the five main parameters of the wing, the two battery parameters, and the parameter of propeller solidity. It can be seen in the figures that the battery mass, wingspan, and chord length of the wingtip have the most positive effect on the maximum takeoff weight, WTO; meanwhile, the influence of other parameters is not obvious. Battery energy density has the greatest positive effect on range, SC; meanwhile, wingspan has little effect on range increase. The four parameters with negative effects are wing incidence angle, the chord length of the wingtip, the battery mass, and the wing twist.

5.5. Optimization of Key Design Parameters

Based on the sensitivity analysis, the parameters were optimized for maximizing the range of aircraft. The sensitivity analysis results show that, among the eight design variables, the wing dihedral and the blade area have little influence on the range. In addition, the battery-specific energy has a linear effect on the range. Therefore, these three parameters were constant in the optimization. The optimization objective is to maximize the range. The maximum takeoff weight should be less than 900 kg. The initial values and ranges of the design variables refer to Table 3. The software Isight 5.7 was used to build an optimization platform. The multi-island genetic algorithm (MIGA) was used to solve this optimization problem. In the algorithm, the population size and the number of generations were set to be 100 and 10, respectively.
The optimization results are shown in Table 3 as well, And the configuration of aircraft is shown in Figure 15. The range increases by 15.6%. And the strict constraint for maximum takeoff weight is satisfied. Compared with the initial design, the optimum design is achieved with a lower span, a negative twist, and a lower taper ratio. The proper incidence angle and smaller reference area could reduce the aerodynamic drag in the cruise stage. The lower battery weight results in a lighter aircraft.

6. Conclusions

The present study proposes a comprehensive performance analysis methodology for electric tilt-rotor aircraft, utilizing MS Excel and VBA programming languages to develop conceptual design tools specifically tailored for electric aircraft. The investigation focuses on analyzing the impact of key parameters such as wing characteristics, propeller solidity, and battery specifications on crucial aspects including range capability, maximum takeoff weight, and hover power requirements. Optimal Latin Hypercube sampling is employed for data collection purposes.
The sensitivity analysis outcomes reveal that the mass of the battery pack, the wingspan dimensions, and the wingtip chord length exert significant influence over the maximum takeoff weight; battery mass exhibits the most pronounced effect among these factors. Concerning range capability, higher energy density in batteries positively contributes to extended flight distances; however, an increase in wing incidence angle along with larger wingtip chord length and heavier battery packs may have some adverse effects on overall range performance. It can be inferred that advancements in battery technology play a pivotal role in driving progress within the realm of electric aircraft.
Based on the sensitivity analysis, five parameters were chosen to be optimized for maximizing the range of aircraft. The proper incidence angle and smaller reference area of the optimum design could reduce the aerodynamic drag in cruise stage. The range increases by 15.6%, and the strict constraint for maximum takeoff weight is satisfied with lower battery weight.

Author Contributions

Conceptualization, Y.W. and W.M.; methodology, Y.W., W.M. and Z.C.; software, W.M.; validation, Y.W. and W.M.; formal analysis, Y.W. and W.M.; investigation, W.M. and Z.C.; resources, Y.W. and W.M.; data curation, W.M. and Z.C.; writing—original draft preparation, Y.W. and W.M.; writing—review and editing, Y.W., W.M. and Z.C.; visualization, Y.W. and W.M.; supervision, Y.W. All authors have read and agreed to the published version of the manuscript.

Funding

This research was funded by Hunan Innovation-oriented Provincial Special Fund, grant number 2022GK1070, and National Key Laboratory of Helicopter Aeromechanics, Funding No. 2023-HA-LB-067-06.

Data Availability Statement

Data are contained within the article.

Conflicts of Interest

The authors declare no conflicts of interest.

References

  1. Moore, M. NASA Puffin Electric Tailsitter VTOL Concept. In Proceedings of the 10th AIAA Aviation Technology, Integration, and Operations (ATIO) Conference, Fort Worth, TX, USA, 13–15 September 2010. [Google Scholar]
  2. Patterson, M.; German, B.; Moore, M. Performance Analysis and Design of On-Demand Electric Aircraft Concepts. In Proceedings of the AIAA ATIO Conference, Indianapolis, IN, USA, 17–19 September 2012. [Google Scholar]
  3. Moore, M.; Fredericks, W.J. Misconceptions of Electric Aircraft and their Emerging Aviation Markets. In Proceedings of the 52nd Aerospace Sciences Meeting (AIAA SciTech Forum), National Harbor, MD, USA, 13–17 January 2014. Report number: AIAA 2014-0535. [Google Scholar]
  4. Bacchini, A.; Cestino, E. Electric VTOL configurations comparison. Aerospace 2019, 6, 26. [Google Scholar] [CrossRef]
  5. Bacchini, A.; Cestino, E. Key aspects of electric vertical take-off and landing conceptual design. Proc. Inst. Mech. Eng. Part G J. Aerosp. Eng. 2020, 234, 774–787. [Google Scholar] [CrossRef]
  6. Ma, T.; Wang, X.; Qiao, N.; Zhang, Z.; Fu, J.; Bao, M. A Conceptual Design and Optimization Approach for Distributed Electric Propulsion eVTOL Aircraft Based on Ducted-Fan Wing Unit. Aerospace 2022, 9, 690. [Google Scholar] [CrossRef]
  7. Kankanawadi, N.; Karinagshetru, G.; Patil, L.; Ultheru, B.; Baruch, J.; Nallusamy, T. Conceptual design of a fixed wing vertical take-off and landing unmanned aerial vehicle. In Proceedings of the AIP Conference Proceedings, Jamshedpur, India, 29–30 August 2020; AIP Publishing: New York, NY, USA, 2021; p. 2341. [Google Scholar]
  8. Palaia, G.; Abu Salem, K.; Cipolla, V.; Binante, V.; Zanetti, D. A Conceptual Design Methodology for e-VTOL Aircraft for Urban Air Mobility. Appl. Sci. 2021, 11, 10815. [Google Scholar] [CrossRef]
  9. Thu, Z.W.; Ahn, J.H.; Lee, J.L.; Kwon, D.Y.; Choi, Y.J.; Won, W.J.; Lee, J.W. Enhanced Performance Prediction of Hydrogen Fuel Cell Powered eVTOL UAV. In Proceedings of the AIAA AVIATION 2022 Forum, Chicago, IL, USA, 27 June–1 July 2022; p. 3382. [Google Scholar]
  10. Beyne, E.E.; Castro, S.G. Preliminary performance assessment of a long-range eVTOL aircraft. In Proceedings of the AIAA SCITECH 2022 Forum, San Diego, CA, USA, 3–7 January 2022; p. 1030. [Google Scholar]
  11. Schoser, J.; Cuadrat-Grzybowski, M.; Castro, S.G. Preliminary control and stability analysis of a long-range eVTOL aircraft. In Proceedings of the AIAA SCITECH 2022 Forum, San Diego, CA, USA, 3–7 January 2022; p. 1029. [Google Scholar]
  12. Dündar, Ö.; Bilici, M.; Ünler, T. Design and performance analyses of a fixed wing battery VTOL UAV. Eng. Sci. Technol. Int. J. 2020, 23, 1182–1193. [Google Scholar] [CrossRef]
  13. Xu, G.; Liu, L.; Zhang, X. Modeling and performance analysis for low altitude electric UAVs. In Proceedings of the 2016 International Conference on Civil, Transportation and Environment, Guangzhou, China, 30–31 January 2016; Atlantis Press: Amsterdam, The Netherlands, 2016; pp. 1058–1065. [Google Scholar]
  14. Traub, L.W. Range and Endurance Estimates for Battery-Powered Aircraft. J. Aircr. 2012, 48, 703–707. [Google Scholar] [CrossRef]
  15. Ugwueze, O.; Statheros, T.; Horri, N.; Innocente, M.; Bromfield, M. Investigation of a Mission-based Sizing Method for Electric VTOL Aircraft Preliminary Design. In Proceedings of the AIAA SCITECH 2022 Forum, San Diego, CA, USA, 3–7 January 2022. [Google Scholar]
  16. Ugwueze, O.; Statheros, T.; Horri, N.; Bromfield, M.A.; Simo, J. An Efficient and Robust Sizing Method for eVTOL Aircraft Configurations in Conceptual Design. Aerospace 2023, 10, 311. [Google Scholar] [CrossRef]
  17. Alba-Maestre, J.; Beyne, E.; Buszek, M.; Cuadrat-Grzybowski, M.; Montoya Santamaria, A.; Poliakov, N.; Prud’homme van Reine, K.; Salvador Lopez, N.; Schoser, J.; Wadia, K. Midterm Report—Multi-Disciplinary Design and Optimisation of a Long-Range eVTOL Aircraft; Technical Report; Delft University of Technology: Delft, The Netherlands, 2021. [Google Scholar] [CrossRef]
  18. Wang, Z.; Wei, P.; Sun, L. Optimal cruise, descent, and landing of eVTOL vehicles for urban air mobility using convex optimization. In Proceedings of the AIAA Scitech 2021 Forum, Virtual, 1–15 & 19–21 January 2021; p. 0577. [Google Scholar]
  19. Palaia, G.; Zanetti, D.; Salem, K.A.; Cipolla, V.; Binante, V. THEA-CODE: A design tool for the conceptual design of hybrid-electric aircraft with conventional or unconventional airframe configurations. Mech. Ind. 2021, 22, 19. [Google Scholar] [CrossRef]
  20. Kadhiresan, A.R.; Duffy, M.J. Conceptual design and mission analysis for eVTOL urban air mobility flight vehicle configurations. In Proceedings of the AIAA Aviation 2019 forum, Dallas, TX, USA, 17–21 June 2019; p. 2873. [Google Scholar]
  21. Hascaryo, R.W.; Merret, J.M. Configuration-independent initial sizing method for UAM/eVTOL vehicles. In Proceedings of the AIAA Aviation 2020 Forum, Virtual, 15–19 June 2020; p. 2630. [Google Scholar]
  22. Tyan, M.; Van Nguyen, N.; Kim, S.; Lee, J.W. Comprehensive preliminary sizing/resizing method for a fixed wing–VTOL electric UAV. Aerosp. Sci. Technol. 2017, 71, 30–41. [Google Scholar] [CrossRef]
  23. Lee, B.S.; Tullu, A.; Hwang, H.Y. Optimal design and design parameter sensitivity analyses of an eVTOL PAV in the conceptual design phase. Appl. Sci. 2020, 10, 5112. [Google Scholar] [CrossRef]
  24. McDonald, R.A.; Gloudemans, J.R. Open vehicle sketch pad: An open source parametric geometry and analysis tool for conceptual aircraft design. In Proceedings of the AIAA SciTech 2022 Forum, San Diego, CA, USA, 3–7 January 2022; p. 0004. [Google Scholar]
  25. Gudmundsson, S. General Aviation Aircraft Design: Applied Methods and Procedures; Butterworth Heinemann: Oxford, UK, 2013. [Google Scholar]
  26. Bacchini, A. Electric VTOL Preliminary Design and Wind Tunnel Tests. Ph.D. Thesis, Politecnico di Torino, Turin, Italy, 2020. [Google Scholar]
  27. Seddon, J.M.; Newman, S. Basic Helicopter Aerodynamics; John Wiley & Sons, Ltd.: Hoboken, NJ, USA, 2011. [Google Scholar]
Figure 1. Configurations electric tilt-rotor vehicle.
Aerospace 11 00322 g001
Figure 2. The interface for wing parameters input.
Aerospace 11 00322 g002
Figure 3. The interface for aerodynamic parameters input.
Aerospace 11 00322 g003
Figure 4. Analysis process of transition from hover to level flight.
Aerospace 11 00322 g004
Figure 5. Analysis process of transition from level flight to hover.
Aerospace 11 00322 g005
Figure 6. Design of experiment simulation process.
Aerospace 11 00322 g006
Figure 7. The influence of wing parameters on takeoff weight.
Aerospace 11 00322 g007
Figure 8. Influence of wing parameters on cruise power.
Aerospace 11 00322 g008
Figure 9. Influence of the design parameters of wing on the range.
Aerospace 11 00322 g009
Figure 10. Effect of battery parameters on range.
Aerospace 11 00322 g010
Figure 11. Influence of blade area on hover power.
Aerospace 11 00322 g011
Figure 12. Influence of blade area on range.
Aerospace 11 00322 g012
Figure 13. Pareto diagram of maximum takeoff weight.
Aerospace 11 00322 g013
Figure 14. Pareto diagram of maximum range.
Aerospace 11 00322 g014
Figure 15. The optimized parameterized model of electric tilt-rotor vehicle.
Aerospace 11 00322 g015
Table 1. Intervals of variation of design parameter.
ParametersLower InitialUpper
Wing incidence angle iw/(°)025
Wing twist Φ/(°)−404
Wing dihedral Γ/(°)045
Wing half-span b/m44.856.2
Wingtip chord length Ct/m0.451.01.5
Battery weight mb/kg200223300
Battery-specific energy Esb/(Wh/kg)200276500
Single blade area Sb/m20.050.08040.1
Table 2. The proportion of energy consumed by each flight stage.
Flight PhaseEnergy Ratio Flight PhaseEnergy Ratio
Vertical takeoff1.5%Decelerated descent1.3%
Transition2%Transition2.6%
Accelerated climb2.7%Vertical landing1.5%
Cruise88%
Table 3. The results of optimization of design variables.
ParametersLower InitialOptimizedUpper
Wing incidence angle iw/(°)02.00.05.0
Wing twist Φ/(°)−2.00.0−2.02.0
Wing half-span b/m4.04.854.66.2
Wingtip chord length Ct/m0.451.00.451.5
Battery weight mb/kg200.0250.0224.2250.0
maximum takeoff weight Wto/kg--934.3899.7900.0
Range Sc/km--303.3350.7--
Disclaimer/Publisher’s Note: The statements, opinions and data contained in all publications are solely those of the individual author(s) and contributor(s) and not of MDPI and/or the editor(s). MDPI and/or the editor(s) disclaim responsibility for any injury to people or property resulting from any ideas, methods, instructions or products referred to in the content.

