Article

Long-Duration Dynamic Numerical Simulation of Combustion and Flow in Hybrid Rocket Motors Considering Nozzle Erosion

School of Astronautics, Beihang University, Beijing 100191, China
*
Author to whom correspondence should be addressed.
Aerospace 2024, 11(4), 318; https://doi.org/10.3390/aerospace11040318
Submission received: 1 April 2024 / Revised: 12 April 2024 / Accepted: 16 April 2024 / Published: 18 April 2024

Abstract

:
Hybrid rocket motors have great development potential due to their outstanding thrust adjustment flexibility and long-term operation ability. However, nozzle erosion during the motor operation can cause an increase in the throat area of the nozzle, which leads to a decrease in combustion chamber pressure and nozzle efficiency. Therefore, a performance prediction model for hybrid rocket motors considering nozzle erosion has become a key technology that must be addressed when developing hybrid rocket motors. This study uses dynamic grid technology to simulate the regression of the combustion surface and nozzle erosion, which fits well with experimental values. The behavior of high-energy particles in the combustion chamber is simulated through a discrete phase model. Notably, distinctive behavior is observed in Al and Mg droplets, with Al droplets exhibiting incomplete vaporization in the combustion chamber while Mg droplets completely vaporize. A ground firing test using the Φ336 mm hybrid rocket motor lasting 200 s is conducted. The results show that the dynamic numerical simulation, accounting for nozzle erosion, substantially enhances performance prediction accuracy. The average deviation in motor thrust remains below 1.8%, and the combustion chamber pressure deviation stays under 2.6%, confirming the precision of the model. Ultimately, both simulation and experimental outcomes indicate a gradual decrease in specific impulse and characteristic velocity over the long-term operation, attributed to the gradual deviation of the oxygen-fuel ratio. This research provides valuable insights for guiding hybrid rocket motor design and optimizing design parameters to improve overall performance. This model can achieve long-duration and high-precision performance predictions for hybrid rocket motors.

1. Introduction

The hybrid rocket motor, characterized by a relatively low regression rate, exhibits the capability for long-term operation, which can be applied in sounding rockets, launch vehicle propulsion, and space engines [1,2,3,4]. After the design of the hybrid rocket motor is completed, the expensive firing test is carried out. In order to determine the working conditions of the firing test, the performance parameters are generally predicted by zero-dimensional or one-dimensional numerical simulation. However, due to the additions of high-energy additives and serious nozzle erosion in long-duration operations, the performance prediction accuracy of zero-dimensional or one-dimensional numerical simulation is relatively low. Therefore, it is necessary to carry out long-duration dynamic numerical simulations in hybrid rocket motors with higher performance prediction accuracy, which can provide an important basis for the determination of the working conditions and the program modification, guide and optimize the design of the hybrid rocket motors, and significantly reduce the cost. However, during the long-term operation of hybrid rocket motors, significant variations in performance parameters and flow field structure occur as a result of the substantial regression of the combustion surface. Additionally, the complex nature of non-premixed diffusion combustion, coupled with strong transients, renders the long-duration dynamic numerical simulation of hybrid rocket motors challenging.
At present, a large amount of steady simulation has been carried out for hybrid rocket motors, which has greatly promoted the research of hybrid rocket motors. However, there are few transient simulations of HRMs that consider the regression of the fuel surface using dynamic mesh technology. Mangeot developed a model based on the CFD-ACE, which utilizes mesh deformation to follow regression [5]. The model shows nice stability within 10 s. Zhang conducted a study of hybrid rocket motors with a diaphragm, utilizing a two-dimensional model that implements dynamic mesh technology [6]. The simulation duration was limited to 10 s due to the significant grid deformation. Di Martino established a model coupled with an improved interface treatment, which aligns well with experimental measurements during ignition tests [7]. Li studied the regulation of oxidizer mass flow in HRMs within 3.0 s using dynamic mesh technology [8]. The results indicate a positive correlation between the regression and oxidizer mass flow rates. In our earlier research, we created a 2D simulation model using dynamic mesh technology and integrated the Butterworth filter, which was utilized to smooth the interface and prevent severe grid deformation [9,10]. The simulation duration reached 40 s. Concurrently, these motors face severe nozzle erosion during prolonged operation, with nozzle erosion displaying characteristics of prolonged nonlinearity and spatial non-uniformity [11,12]. The expansion of the nozzle throat area leads to a decrease in combustion chamber pressure and nozzle efficiency [13,14]. Kamps developed a nozzle-throat reconstruction technique to obtain a nozzle–throat–erosion history, varying by nine static-firing tests, which is the first experimental result to obtain a hybrid rocket nozzle erosion history [15]. Yu investigated the ablation characteristics of graphite nozzles in HRMs utilizing star grains were investigated [16]. The study revealed that the geometry of the fuel directly influenced the erosion of the nozzle, and the primary oxidizing species responsible for thermochemical erosion were identified as OH and H2O. Kamps further conducted 44 static-firing tests to obtain an empirical model, which treats the combustion gas as a bulk oxidizing agent in the nozzle throat. The predicted results showed good agreement with experimental results. The model effectively predicted the erosion rate based on a quantitative clarification of the nozzle erosion mechanism [17]. Zhang investigated the combined effects of chemical ablation and mechanical erosion by numerical simulation [18,19]. The findings demonstrated that the erosion rate was primarily governed by both chemical ablation and mechanical erosion in the downstream region of the converging section and upstream of the throat. To the best of our knowledge, dynamic numerical simulations that consider both nozzle erosion and combustion surface regression simultaneously are rare in HRMs at present. In addition, it is worth noting that the above simulations are all based on laboratory-level hybrid rocket motors. Long-term simulations (over 200 s) of large-sized, practically hybrid rocket motors considering nozzle erosion have not been found.
In this work, a dynamic numerical simulation model considering nozzle erosion is developed based on dynamic numerical simulation models from our previous works. It takes into account the melting and evaporation of aluminum and magnesium particles as well as their interaction with the flow field. The behavior of the aluminum and magnesium particle flow field is simulated using a discrete phase model. The developed model is based on the hybrid rocket motor of the “Beihang-4” sounding rocket, which is used to detect meteorological parameters at high altitudes. By employing a dynamic mesh model with a filter, a dynamic numerical simulation with a duration of 200 s is achieved. This model can achieve long-duration and high-precision performance prediction of hybrid rocket motors. The accuracy of the simulation is validated through large-scale ground firing tests of hybrid rocket motors. At the same time, this study can also lay the foundation for the trajectory prediction of long-duration flight, which is not available in the short-duration simulation.

2. Transient Simulation Models

Based on the aforementioned content, the current long-duration dynamic numerical simulation of hybrid rocket motors is constrained by severe deforming of the combustion surface mesh and the absence of consideration for nozzle erosion. In this paper, the issue of severe mesh deformation during the long-duration simulation process by employing the burning surface mesh optimization technique introduced in our previous work [9]. The simulation is based on the Φ336 mm hybrid rocket motor, capable of continuous operation for 200 s with a maximum thrust of 3 kN.

2.1. Gas Governing Equation

The two-dimensional governing equations governing the axisymmetric flow field can be succinctly expressed as elucidated in the literature [20,21,22]:
ρ Φ t + ( ρ u Φ ) x + 1 r ( r ρ v Φ ) r = x Γ Φ x + 1 r r r Γ Φ r + S Φ
where ρ represents the density, t is the time, x is the axial position, r is the radial position, u and v refer to the axial and radial velocity, respectively, Φ denotes the general variable, S Φ represents the source item, Γ refers to the diffusion coefficient.

2.2. Turbulent Model

The realizable k-ε model has better accuracy in pipeline flow and flat plate flow, so it is widely used in numerical simulation of the flow field. The realizable k-ε model is adopted in this project as follows [8]:
t ρ k + ρ v k = μ + μ t σ k k + G k ρ ε
t ρ ε + ρ v ε = μ + μ t σ ε ε + G ε ρ C 1 ε 2 k + v ε
where k represents the turbulence kinetic energy, ε refers to the turbulence dissipation rate, μ is the viscosity coefficient, μ t is the turbulent viscosity coefficient, G k is the generation of turbulence kinetic energy, G ε is the generation of the dissipation rate, σ k and σ ε are the Prandtl number for k and ε .

2.3. Gas–Solid Coupling Model

The solid fuel surface maintains the conservation of mass and energy, which can be expressed as follows [23,24,25,26]:
ρ g u = ρ f r ˙
λ g T r g = ρ f r ˙ h g h s
where ρ g and ρ f refer to the density of pyrolysis gas and solid fuel, respectively, r ˙ is the regression rate, λ g is the thermal conductivity of gas, h g and h s denote the enthalpy of pyrolysis gas and solid fuel.

2.4. Solid Fuel Pyrolysis Model

In previous literature [27,28], it has been believed that the regression rate of metal additive propellant mainly depends on the regression rate of polymer (HTPB). The average regression rate predicted by simulation was 2.64% higher than the test data [28], which indicates that the accuracy of the simulation model is acceptable. The prediction model in the form of the Arrhenius formula is used to solve the regression rate of solid fuel, which can be given as follows [29,30]:
r ˙ = A exp ( E a / R T )
where A represents the pre-exponential constant, E a is the activation energy, R is the universal gas constant. For HTPB, when T < 722 K, Ea = 55803.0 J/mol, A = 3.9640 m/s; when Ts ≥ 722 K, Ea = 20,523.8 J/mol, A = 0.01104 m/s [31].

2.5. Chemical Reaction Model

In the simulation, the hybrid rocket motor utilized 98% H2O2 as the oxidizer and an HTPB-based solid fuel with a formulation of 60% HTPB, 28% Al, 10% Mg, and 2% C as the propellant. After catalysis, the main products from 98% H2O2 were a mixture of water vapor and oxygen, with a temperature of 1224 K, which was obtained through thermodynamic calculation software Rocket Propulsion Analysis (RPA v.1.2) [32]. The primary pyrolysis product of the HTPB-based fuel is C4H6. Given the high combustion temperatures in the combustion chamber of hybrid rocket motors and the burning surface temperature significantly exceeding the melting points of Al and Mg, it was assumed that Al and Mg particles were introduced into the flow field in the form of liquid droplets. The content of C particles is minimal and neglected in this simulation. And the 2% C was substituted with 2% HTPB in the simulation. In thermodynamic calculations, it was found that the characteristic exhaust velocity deviation of the two fuel formulations was less than 0.1%. Thus, it is believed that this treatment method is reasonable. The chemical reactions in the hybrid rocket motor can be simplified into a 15-reaction combustion model involving 13 components: oxidizer O2, and fuel components C4H6, Al, and Mg [33,34]. After entering the flow field, Al and Mg droplets evaporated into Al and Mg vapor under the influence of high-temperature gases in the combustion chamber, as represented by the following equation:
Al ( l ) Al ( g )
Mg ( l ) Mg ( g )
Aluminum (Al) and magnesium (Mg) vapors underwent further combustion reactions with oxygen, resulting in the generation of aluminum oxide. The combustion mechanism of micron-sized aluminum fuel reacting with oxygen is summarized in Table 1. Reaction rate calculations employed the eddy-dissipation model.

2.6. Discrete Phase Model

The initial diameters of the Al and Mg liquid droplets were 2 μm and 20 μm, respectively. The initial outer diameter of the particles was measured by electron microscopy scanning before the experiment. The simulation took into account the evaporation of these liquid droplets. The state parameters of the Al and Mg droplets, including mass flow rate m ˙ al and m ˙ mg , velocity v al and v mg , and temperature T al and T mg , were determined by the following equations [33]:
m ˙ al = w al / ρ f A f r ˙
m ˙ mg = w mg / ρ f A f r ˙
v al = v mg = w HTPB r ˙ ρ f / ρ g
T al = T mg = T f
The evaporation control equation for droplets can be expressed as follows:
d T d d t = h A d T T d m d c d                                                       T d < T evap  
m d c d d T d d t = h A d T T d + d m d d t h vap                         T d T evap
In the equation, T is the gas-phase fluid temperature, Tevap is the metallic oxide evaporation temperature, h is the convective heat transfer coefficient, Ad is the surface area of the droplet, md is the mass of the droplet, c d is the specific heat of the droplet, h vap is the heat of vaporization of the droplet, and d m d / d t is the rate of change of particle mass during the evaporation process, calculated using the convective/diffusion-controlled model:
d m d d t = k c A d ρ ln ( 1 + B m )
B m = Y i , s Y i , 1 Y i , s
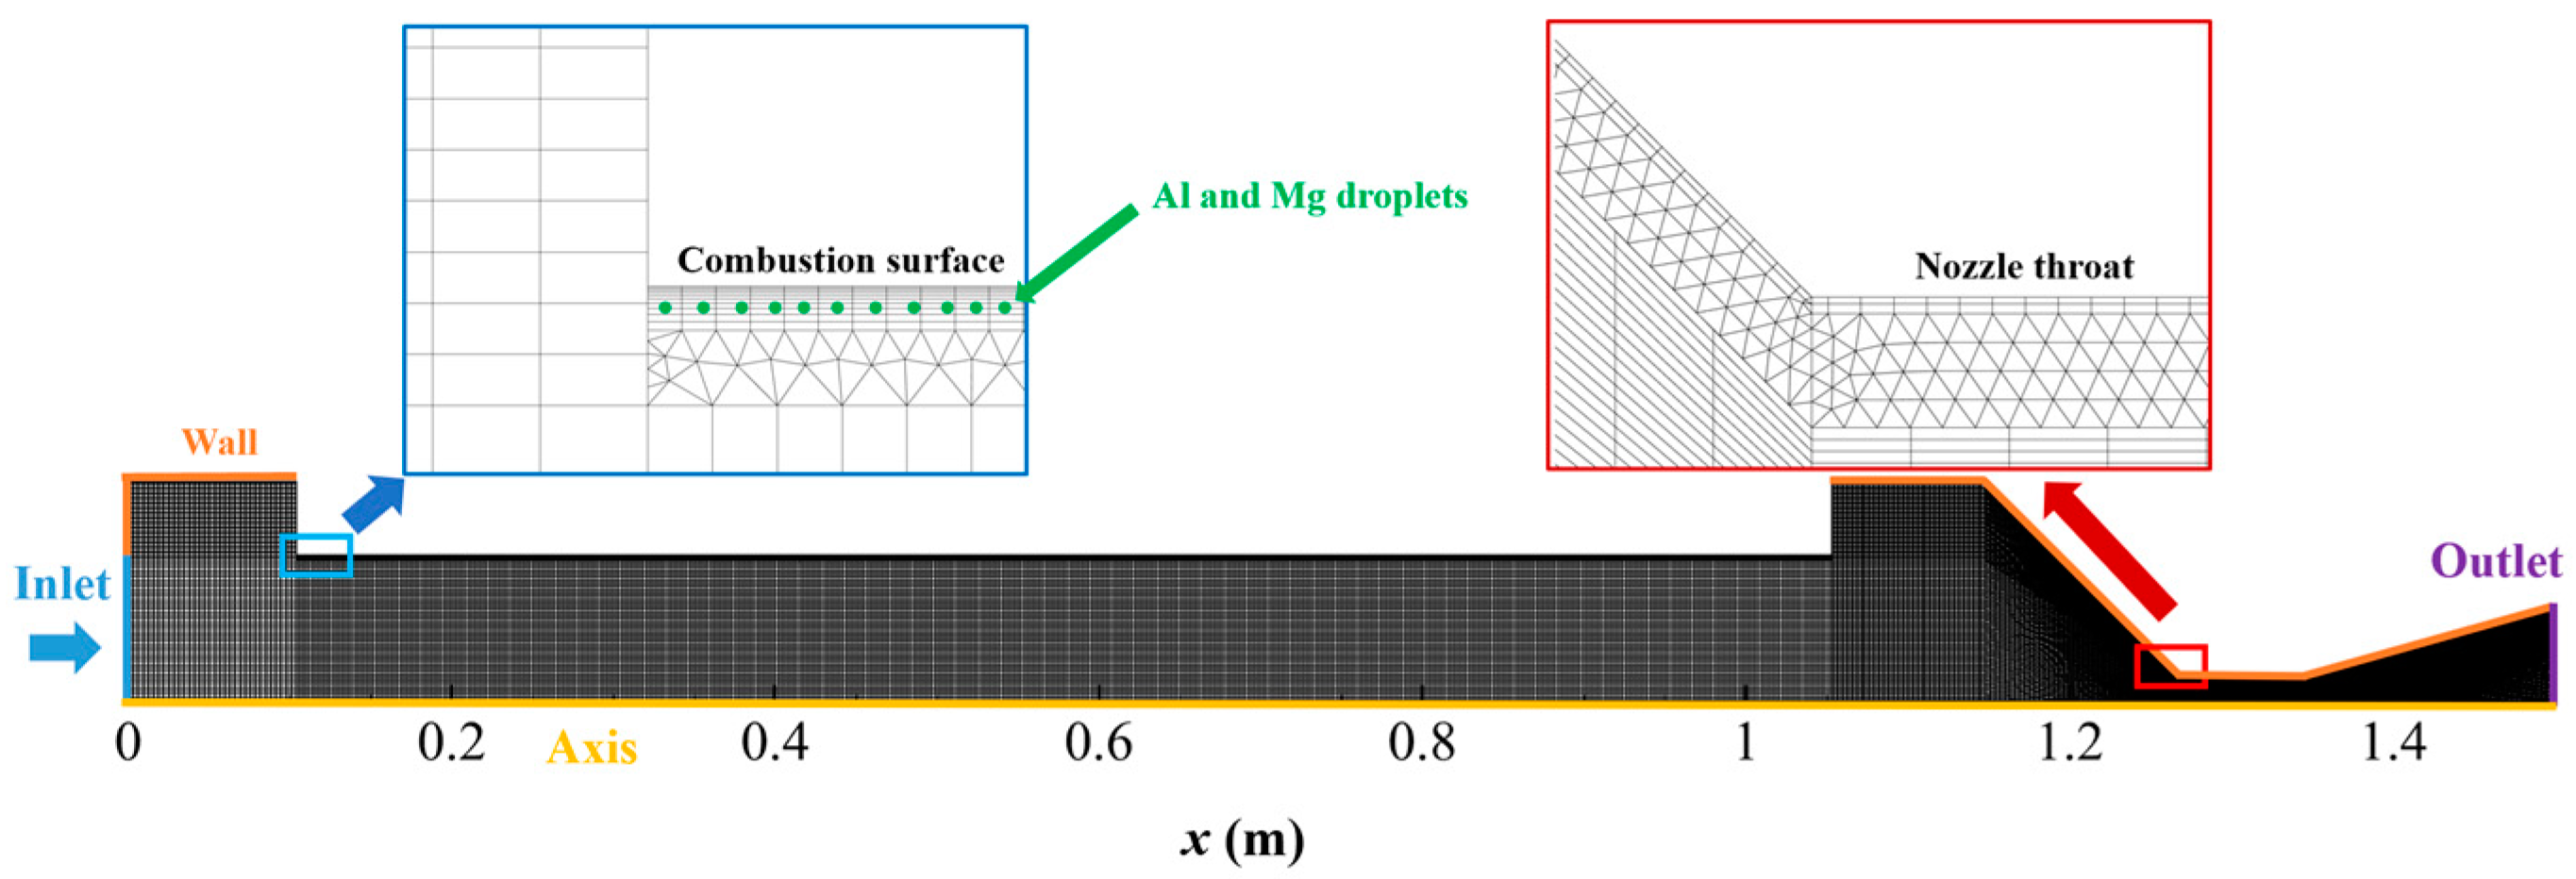
Here, k c is the mass transfer coefficient, ρ is the density of the gas-phase fluid, B m is the Sparling mass number, Y i , s is the liquid droplet surface evaporative mass fraction, and Y i , is the evaporative mass fraction in the gas phase. It is noteworthy that in two-dimensional numerical simulations, the Surface Injection method cannot be coupled with dynamic grid technology. Therefore, the Group Injection method is employed, and injection points were set 1 mm away from the burning surface using a user-defined function.

2.7. Mesh Grid

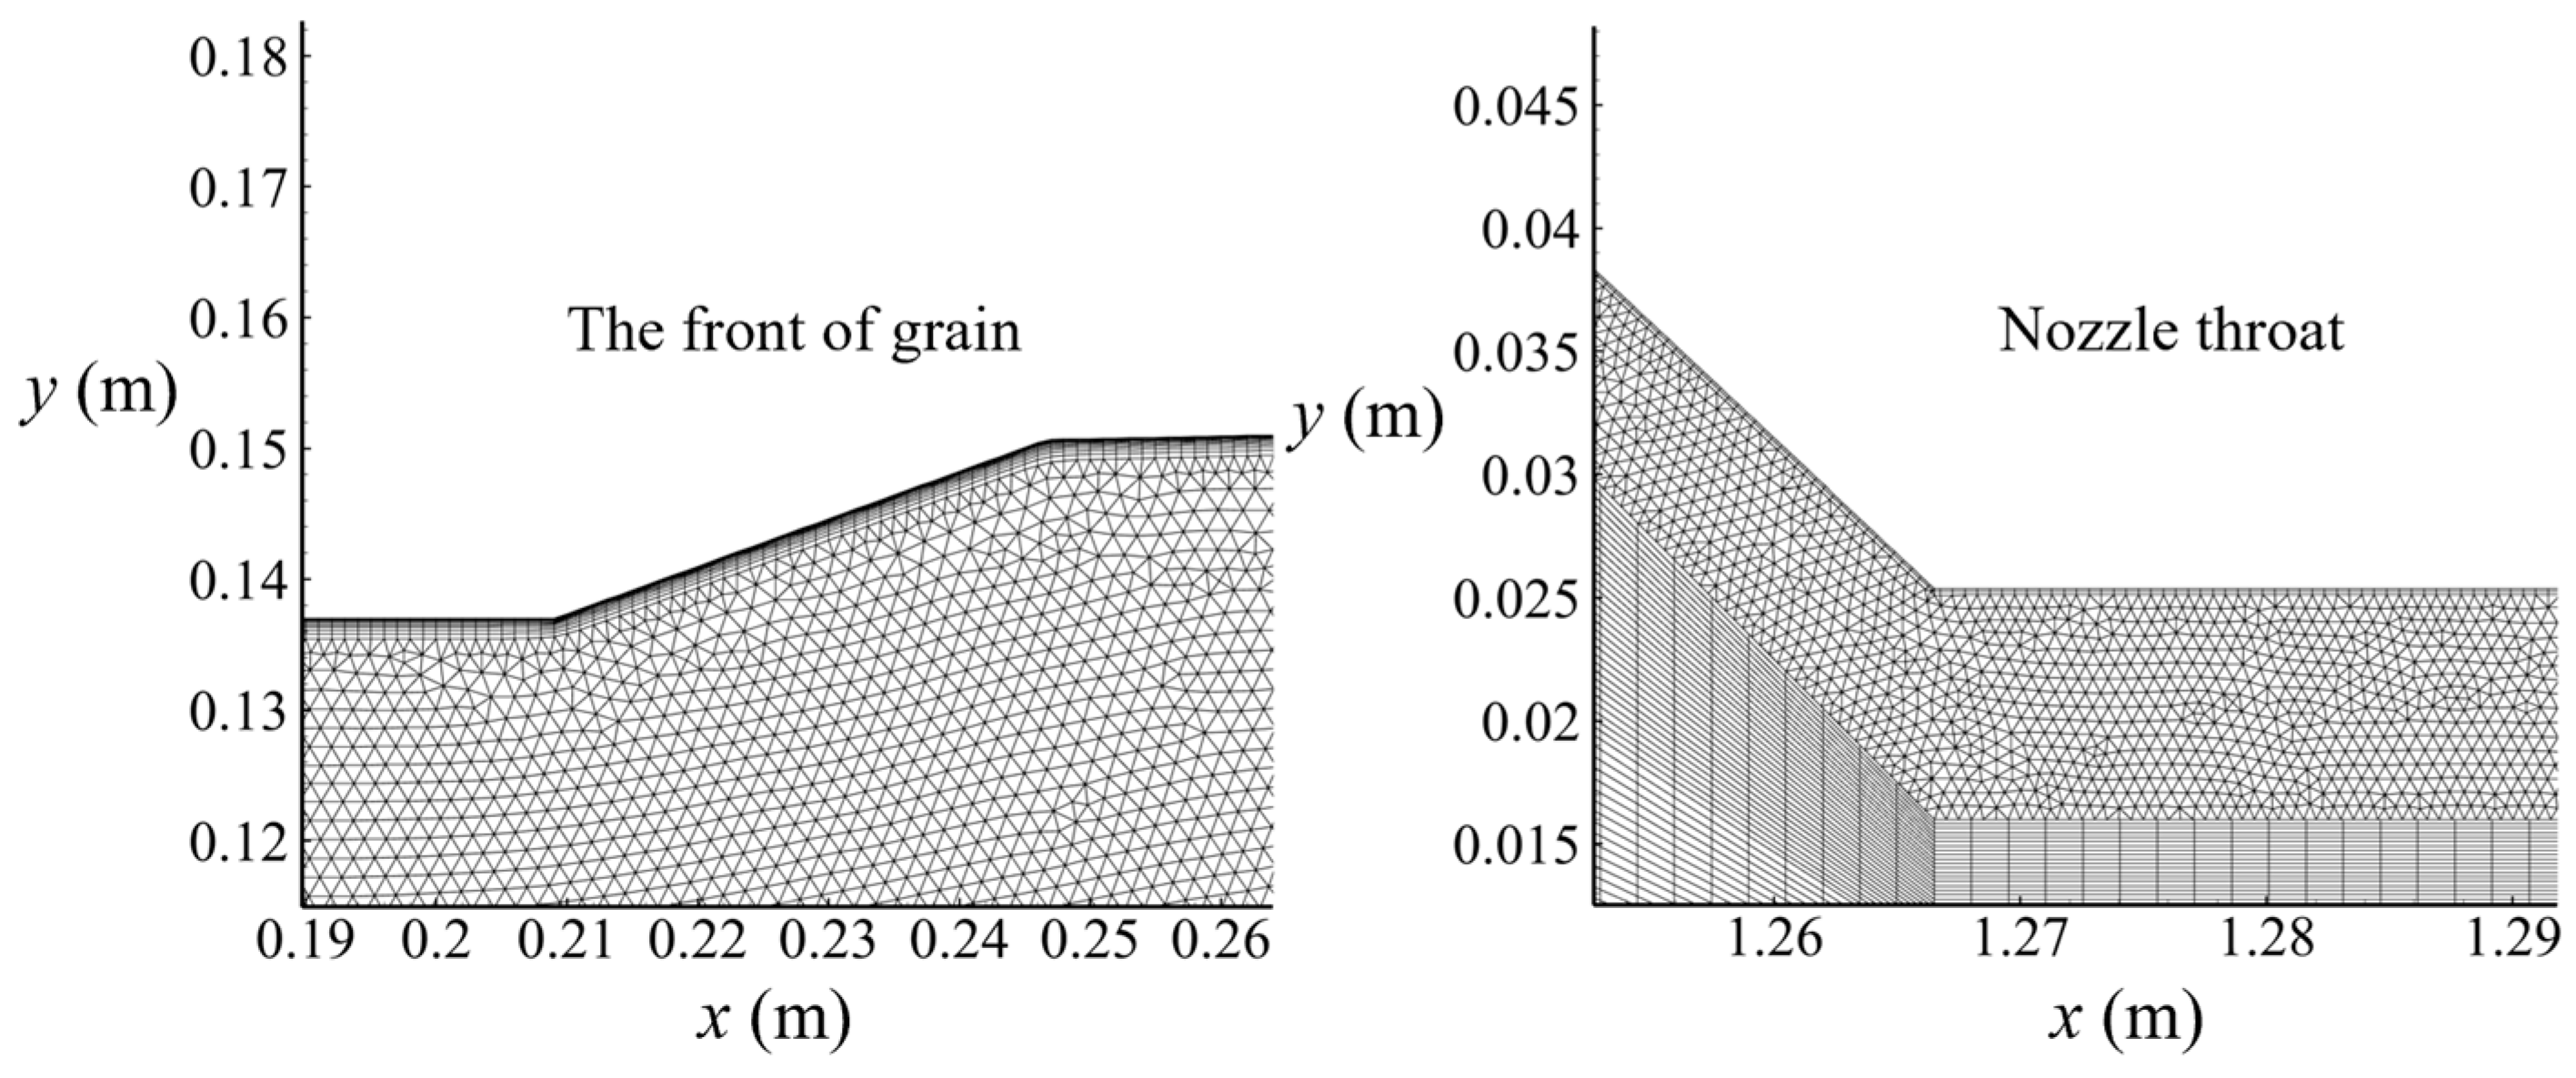
In this simulation, a Φ336 mm hybrid rocket motor was used with a grain length of 949 mm and an internal diameter of 183 mm, as illustrated in the schematic diagram of the combustion chamber in Figure 1. Other key dimensions are provided in Table 2. Figure 2 displays the computational grid for the hybrid rocket motor. Near the burning surface and the nozzle wall, unstructured triangular grids with boundary layer regions were employed to facilitate dynamic grid changes. It is noteworthy that, near the burning surface, due to the inclusion of source terms and the injection of discrete-phase particles, the boundary layer region grid was relatively thin. The use of enhanced wall treatment can improve the calculation accuracy near the wall; thus, the first layer grid height was set to 0.01 mm to ensure a y+ value of approximately 1 to meet the requirement of the enhanced wall treatment. In the calculation domain away from the burning surface, a structured quadrilateral grid was employed to enhance computational speed. An interface boundary condition was applied between unstructured and structured grids. As mentioned earlier, the injection points for Al and Mg droplets were set 1 mm away from the combustion surface, evenly distributed along the axial direction. By comparing the simulation results with previous experimental results, it was found that the 1 mm position was more suitable, in which the simulation and experimental results were in good agreement. If the distance is further reduced, it will cause instability in the regression rate of the grain.

2.8. Dynamic Mesh Model

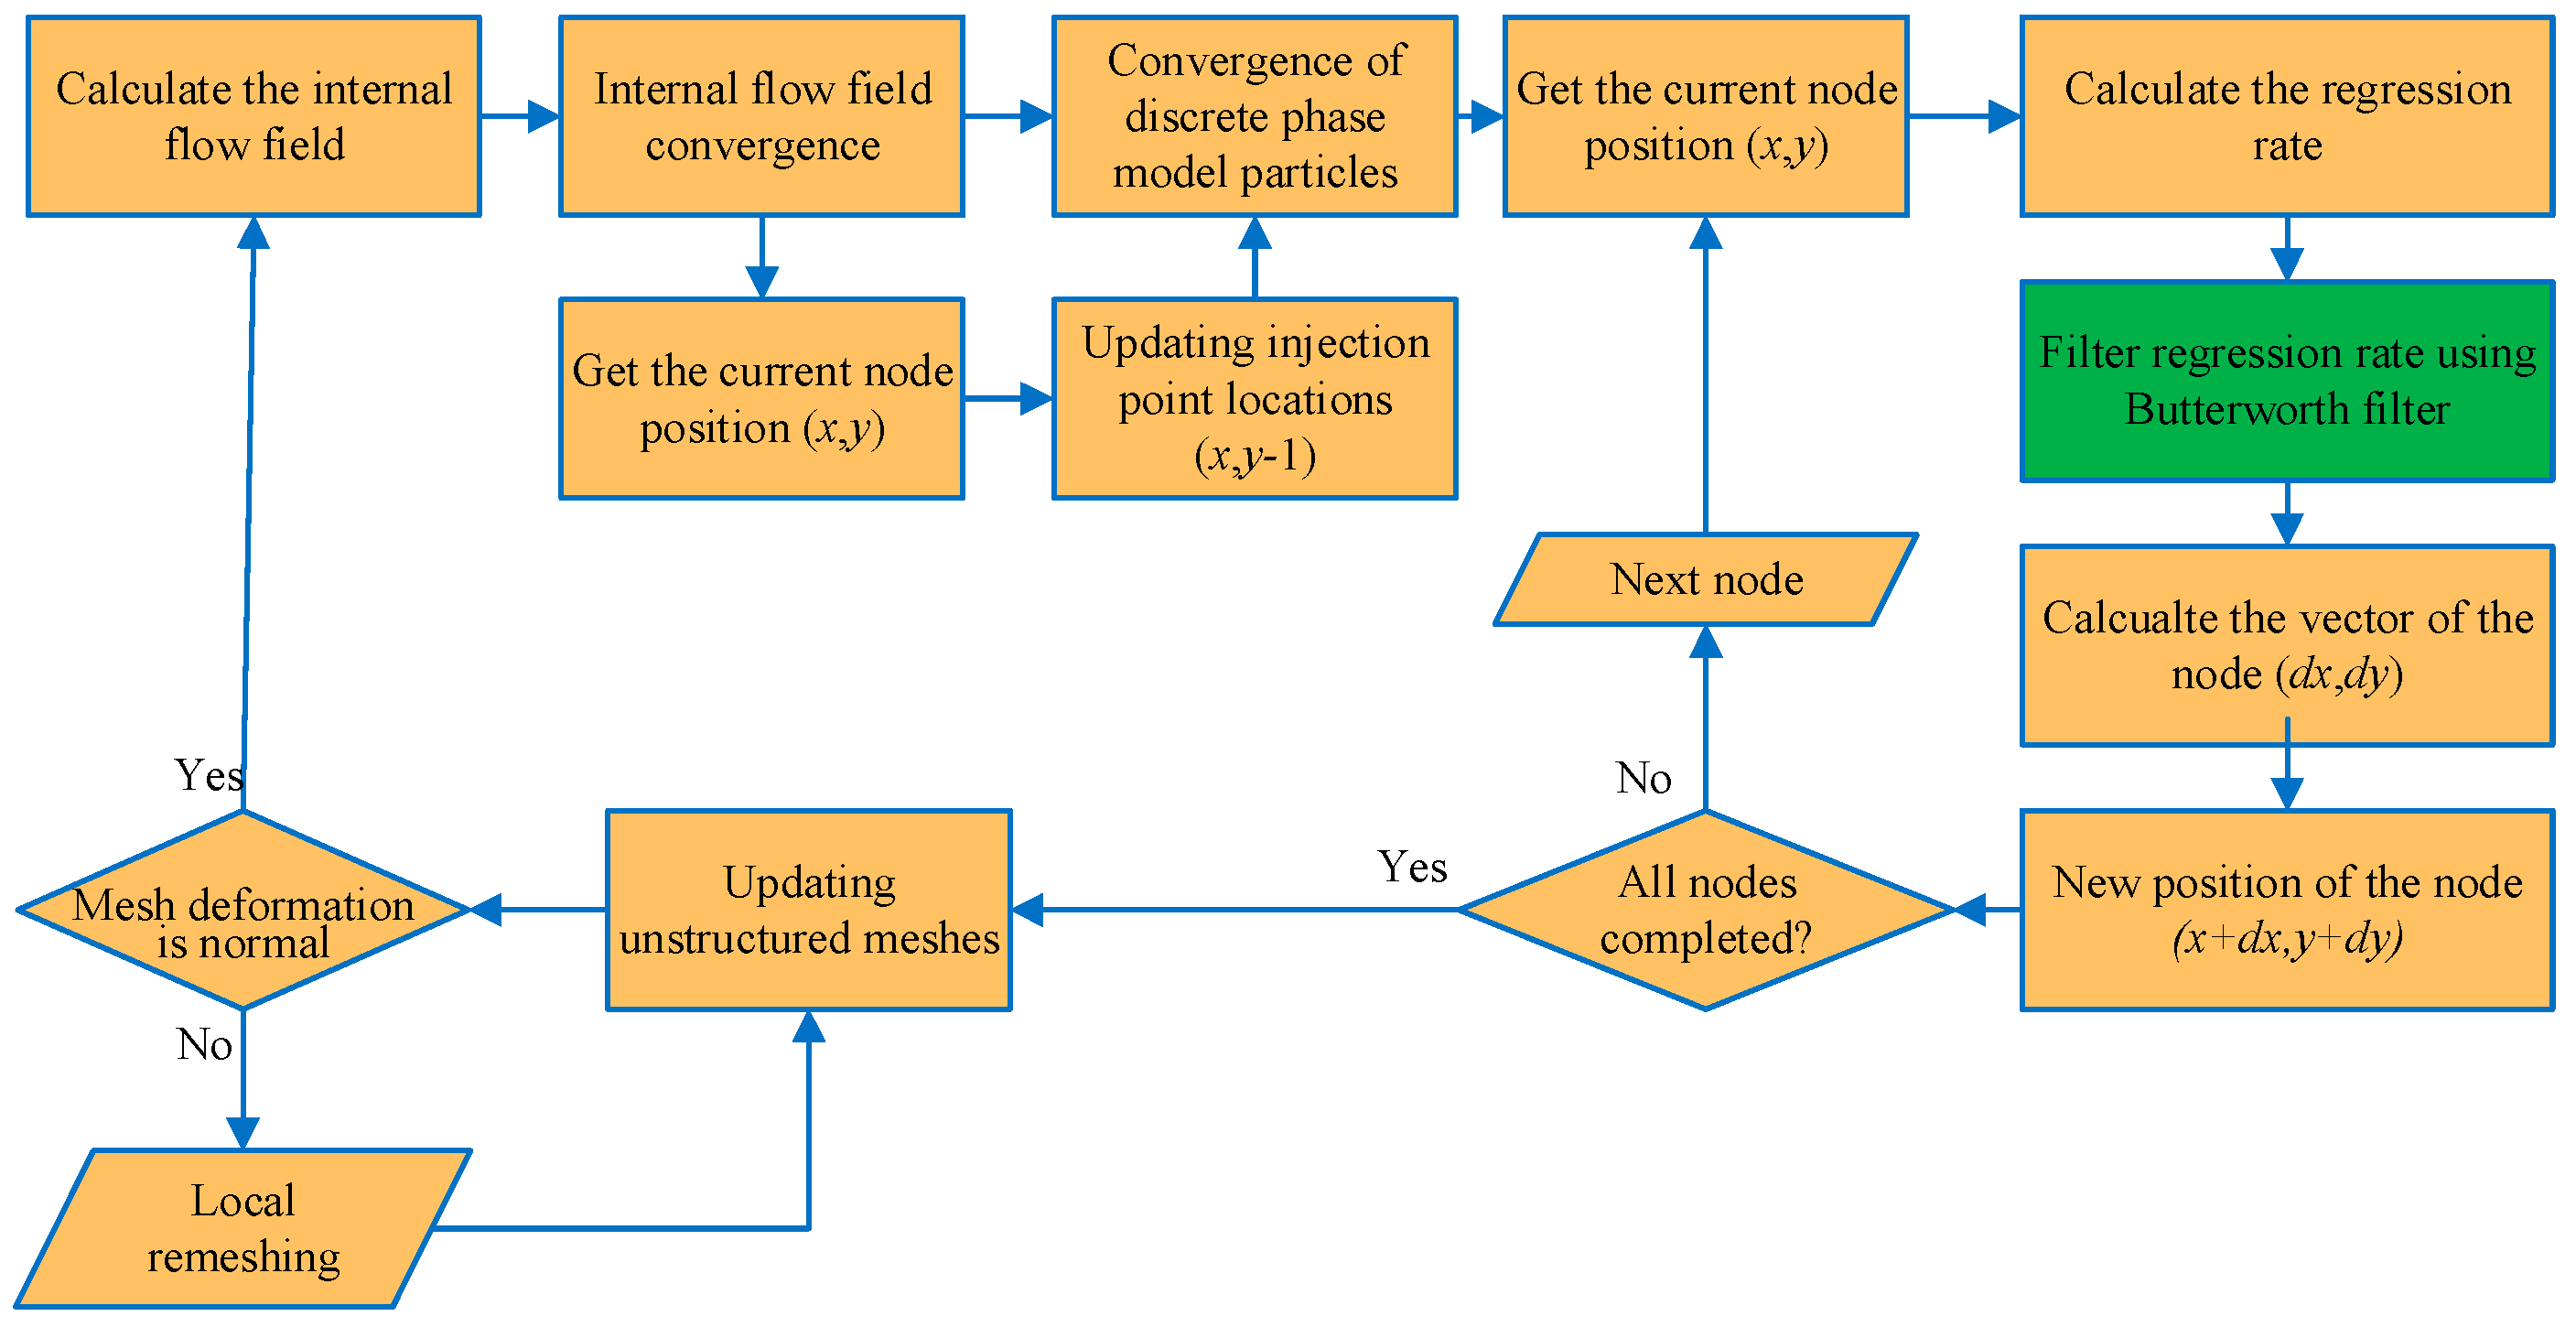
In order to solve the problems of severe mesh deformation and difficulty in updating discrete phases on the combustion surface, this dynamic mesh model with filter considering the discrete phase model is proposed, as shown in Figure 3. The regression of the combustion surface was controlled by the filtered regression rate, which can prevent the issue of extreme mesh deformation. The method of discrete phase injection was Group Injection, which can couple the dynamic mesh model. After the convergence of the internal flow field calculation, the injection point position was obtained through user-defined functions, and the discrete phase droplets were added to the flow field.

2.9. Boundary Conditions

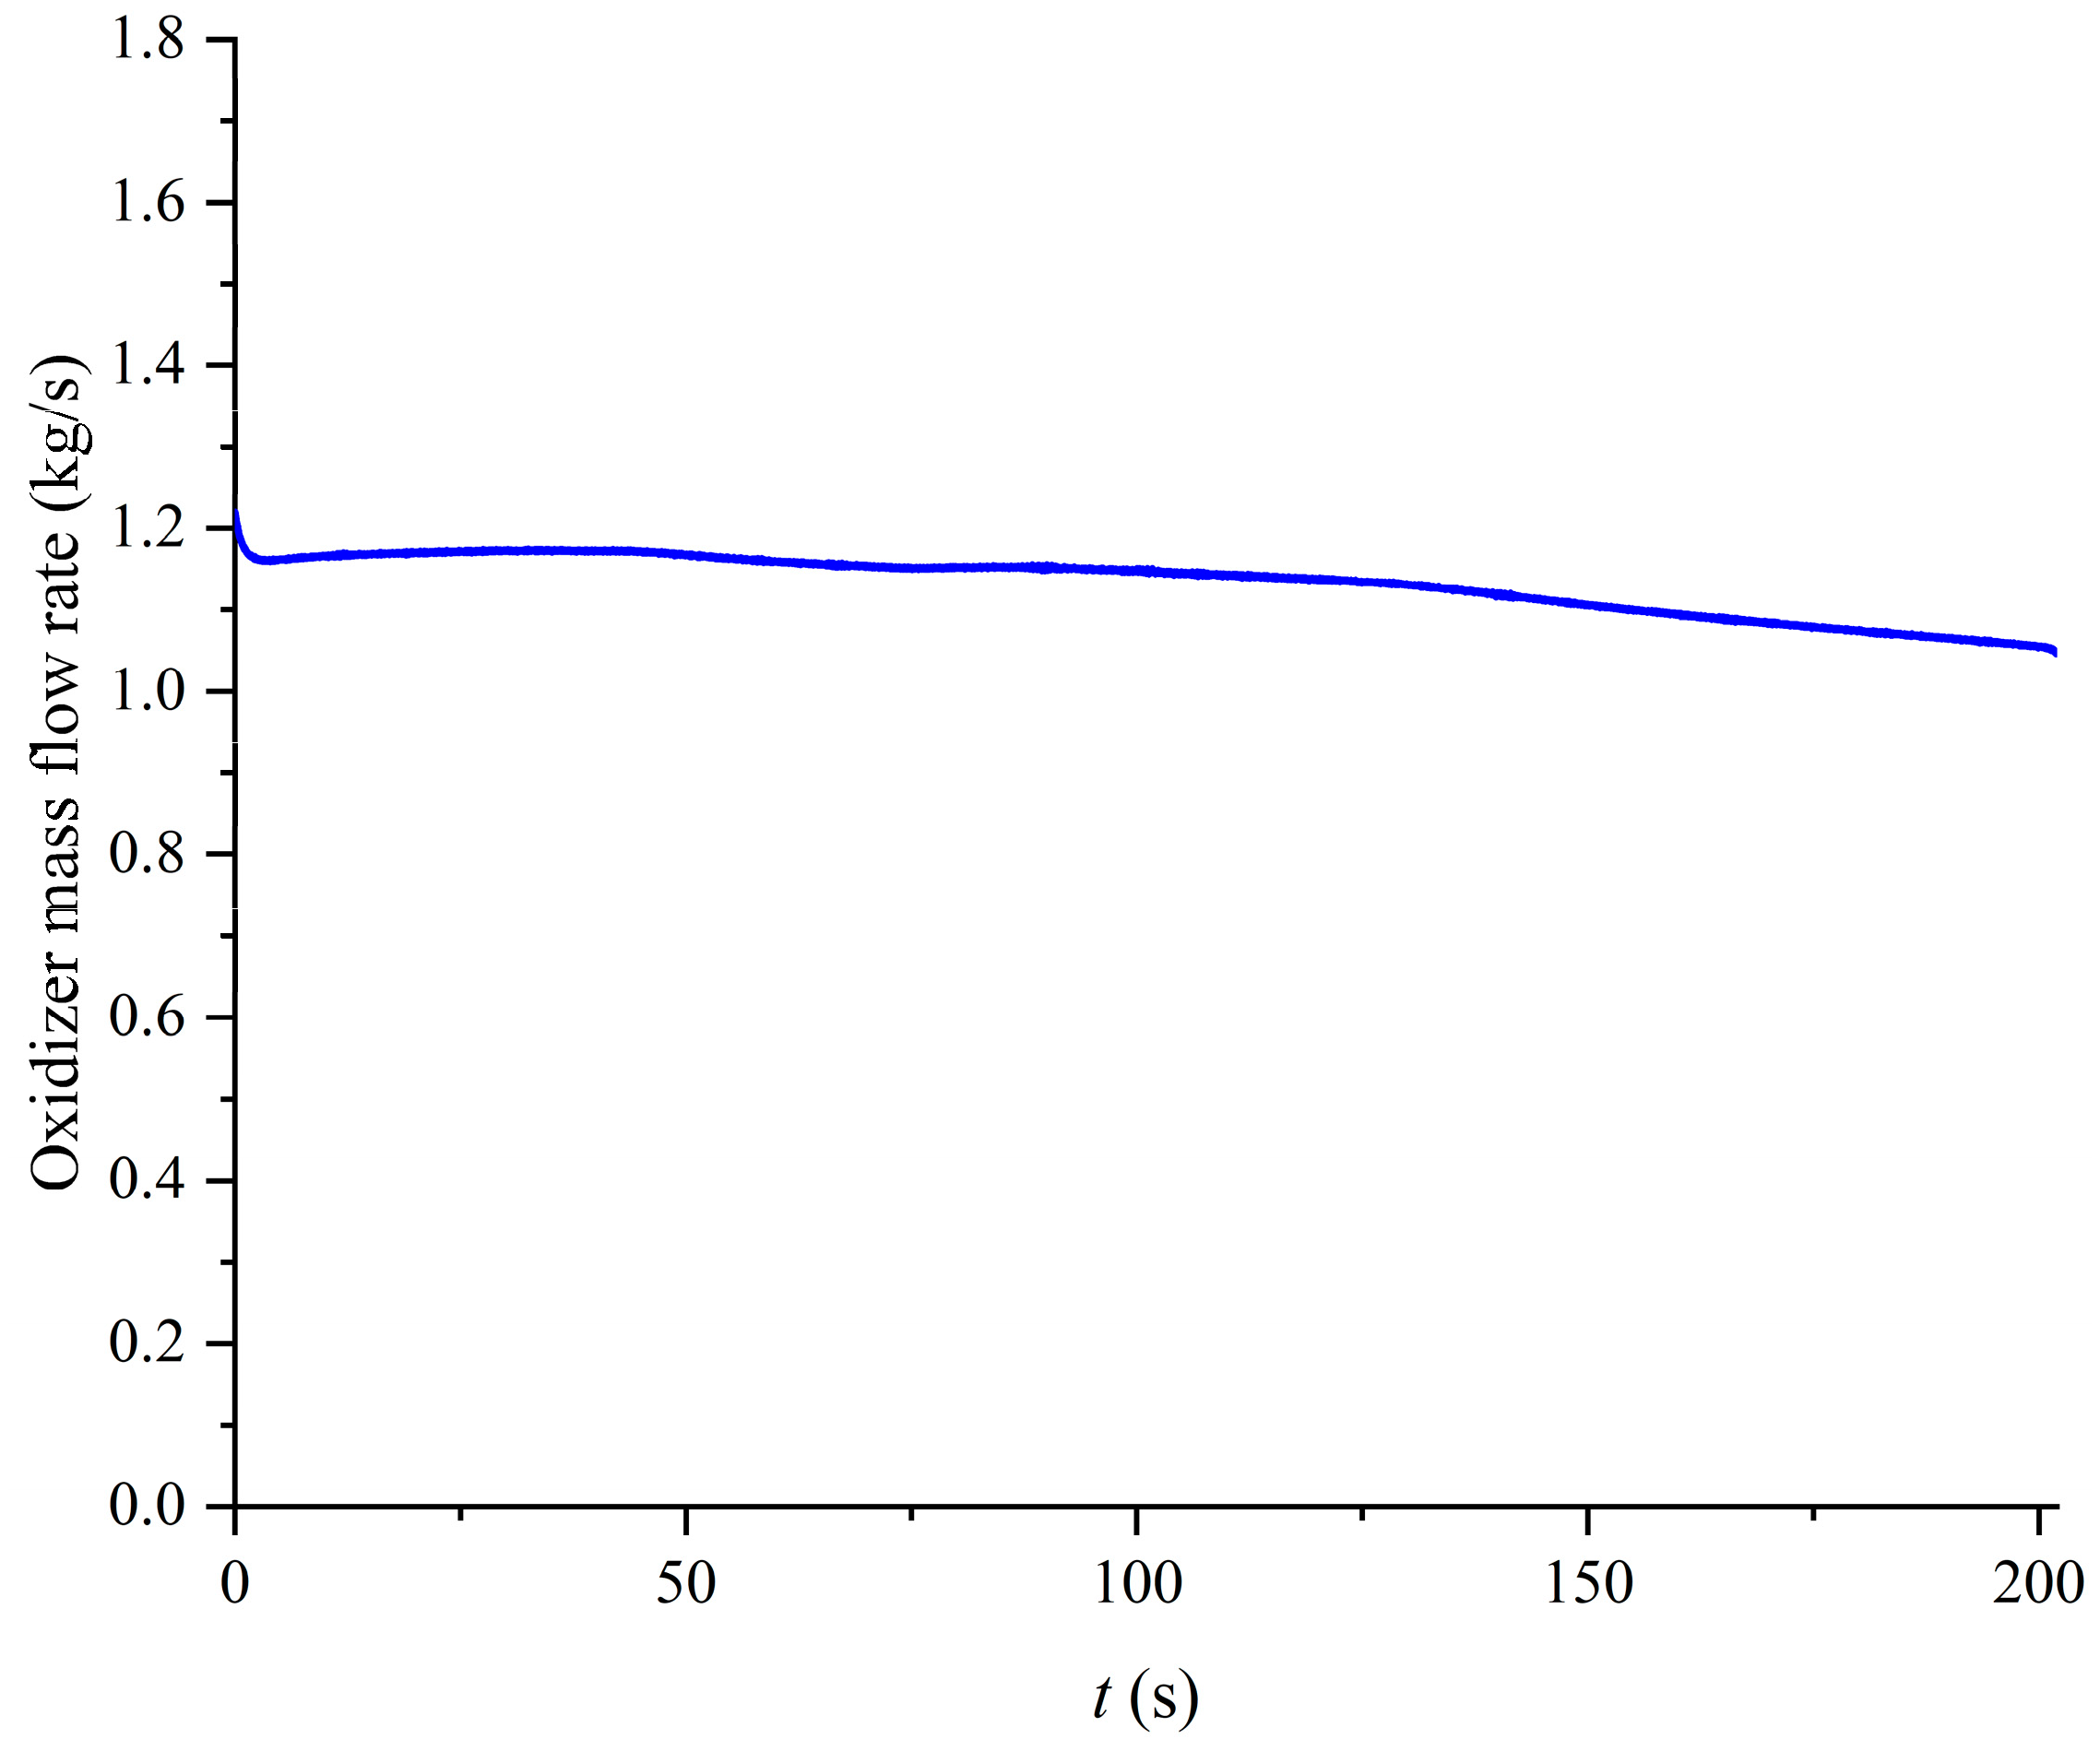
In this simulation, a two-dimensional axisymmetric model was employed with the central axis set as the symmetry axis boundary condition. The oxidizer inlet used a mass flow inlet boundary condition. Due to system limitations in experiments, the tank pressure slightly decreased during the operation. To align with the experiments, the oxidizer mass flow rate was set to vary from 1.22 kg/s to 1.02 kg/s over a period of 200 s. The boundary condition for the burning surface of the fuel grain was a temperature wall boundary condition, and the specific temperature value was calculated using a user-defined function. Other solid wall surfaces used adiabatic and no-slip wall boundary conditions. The nozzle exit was set as a pressure outlet boundary condition. The pressure of the nozzle outlet was extrapolated from the inner domain when the flow inside the nozzle was supersonic.
The erosion rate was obtained in the previous experiment. The nozzle erosion rate was calculated by the reconstruction method described in Ref. [35]. The oxidizer-fuel ratio (O/F) is first assumed in the process of solving the regression rate, and the characteristic exhaust velocity can be obtained under specific combustion chamber pressure and O/F. Then, the total mass flow rate can be obtained by the combustion chamber pressure, nozzle-throat area, and characteristic exhaust velocity, and the mass flow rate of fuel can be further obtained. Therefore, the O/F at this time can be obtained by the mass flow rate of oxidizer to the mass flow rate of fuel, and the actual O/F can be gradually approached through iterative solving of the O/F. When the calculation of the O/F converges, the regression rate can be further obtained. After obtaining the regression rate, the nozzle-throat area in the calculation can be changed to make the combustion chamber pressure closer to the test value. The nozzle erosion rate can be obtained by the change of the nozzle-throat diameter to time step. During the initial 50 s of operation, little erosion occurred in the nozzle throat; from 50 to 110 s, the nozzle throat experienced erosion at a rate of 0.028 mm/s; from 110 to 200 s, the nozzle throat erosion rate increased to 0.064 mm/s. After obtaining the nozzle erosion rate through previous experimental data, it was set as a simulation condition in this simulation. Although the nozzle erosion rate in this simulation was obtained through experiments, when the changes in the nozzle material, O/F, and combustion chamber pressure are small, the model has a certain degree of predictability. In order to further enhance the application scope of the model, it was necessary to conduct experiments and simulations on different materials, O/F, and combustion chamber pressures, explore the mechanical and chemical erosion mechanisms of the nozzle throat, obtain the erosion law of the nozzle throat, and guide the ablation of the nozzle throat in this model.

3. Experimental System

To validate the accuracy of the dynamic numerical simulation model, experiments were conducted based on the Φ336 mm hybrid rocket motor.

3.1. Hybrid Rocket Motor

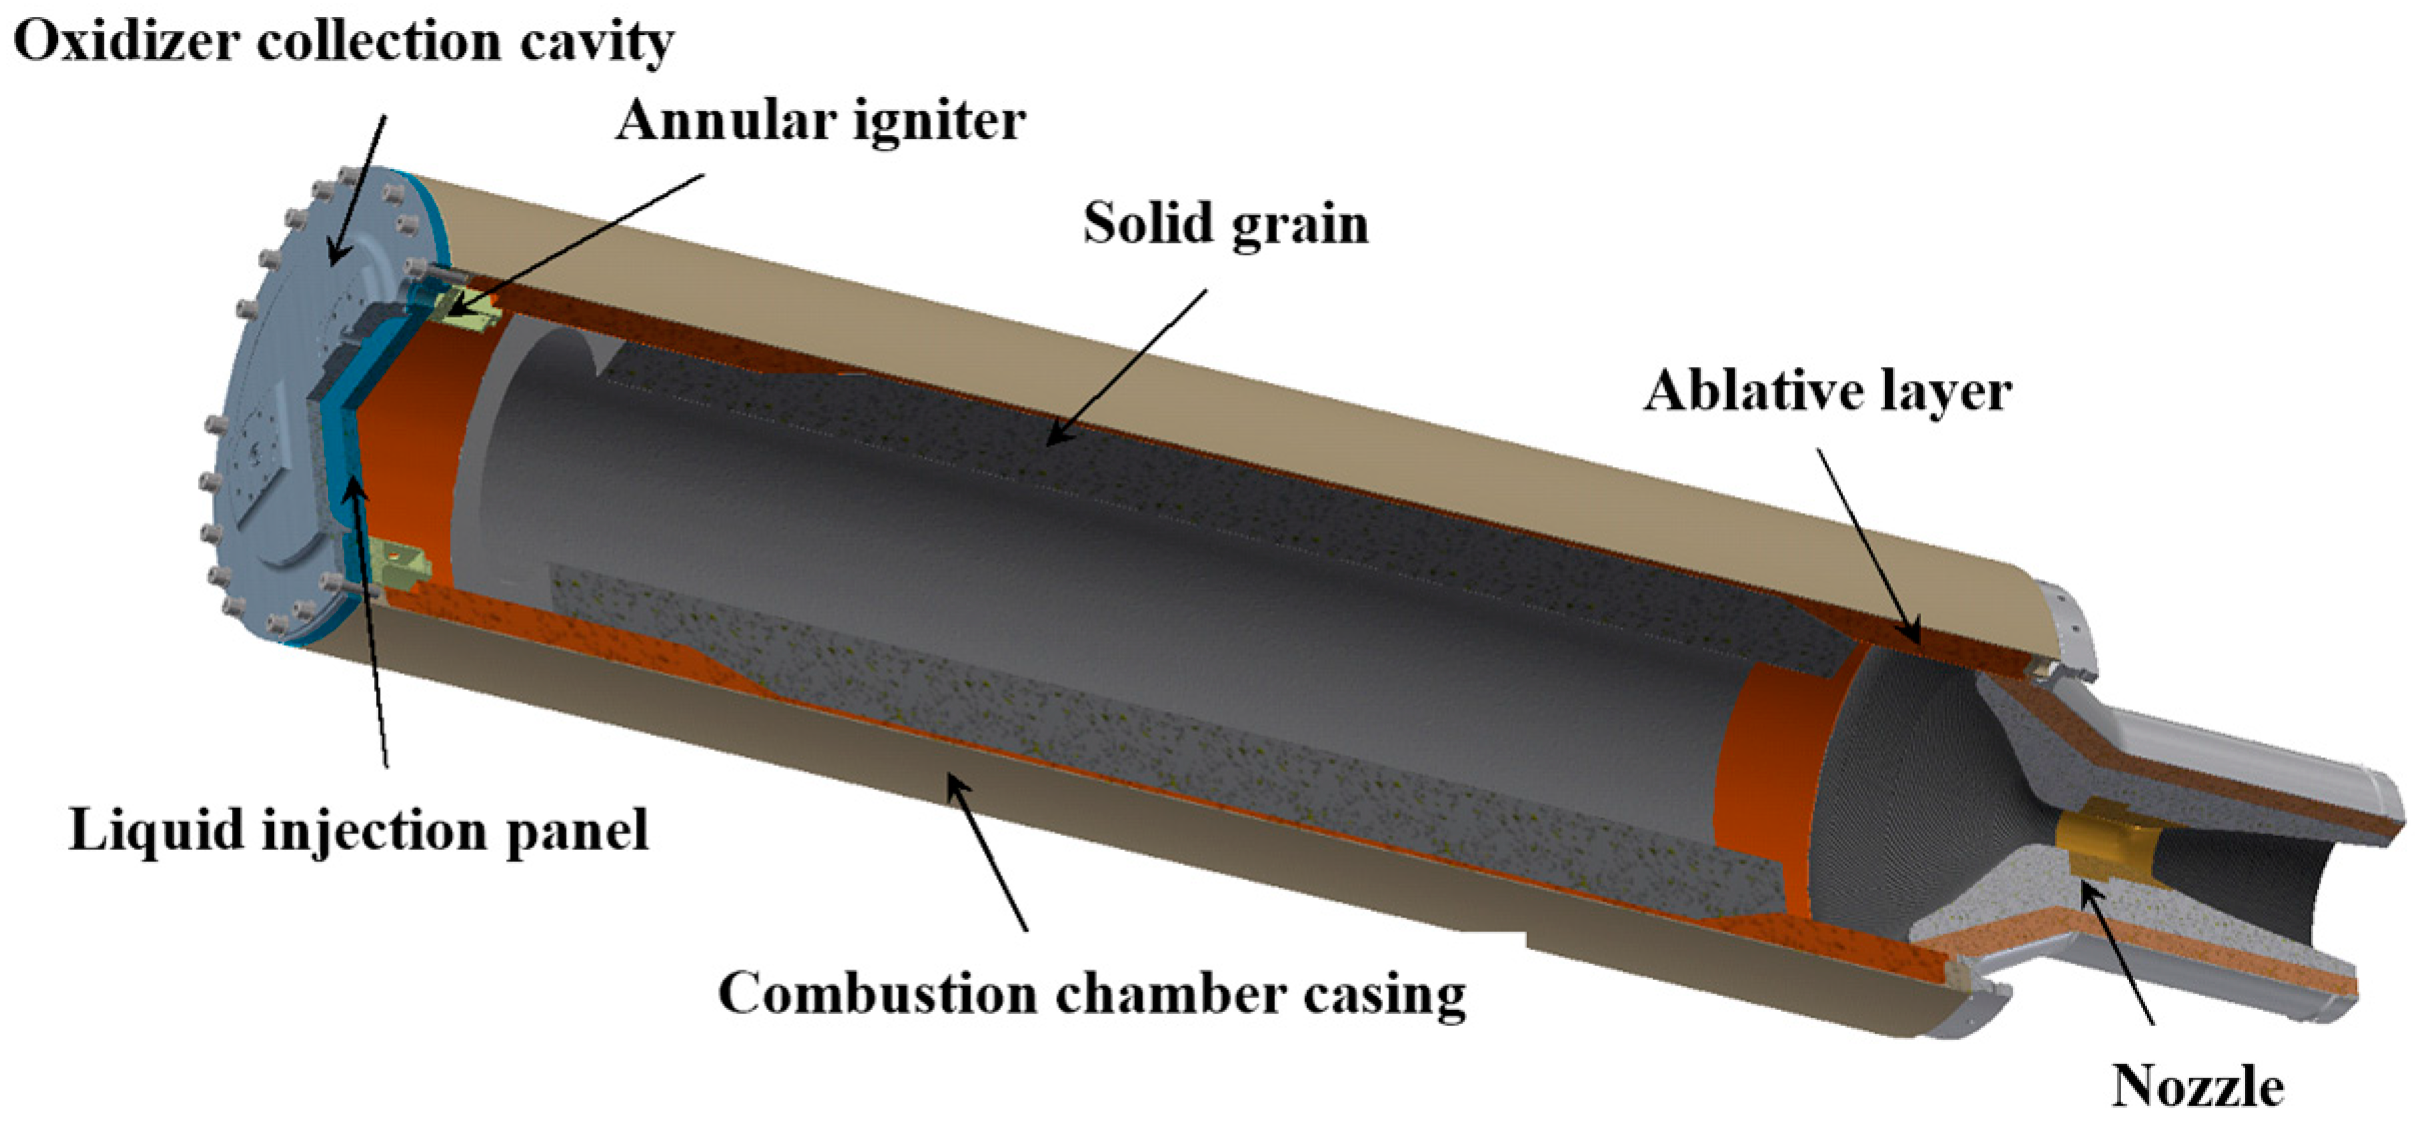
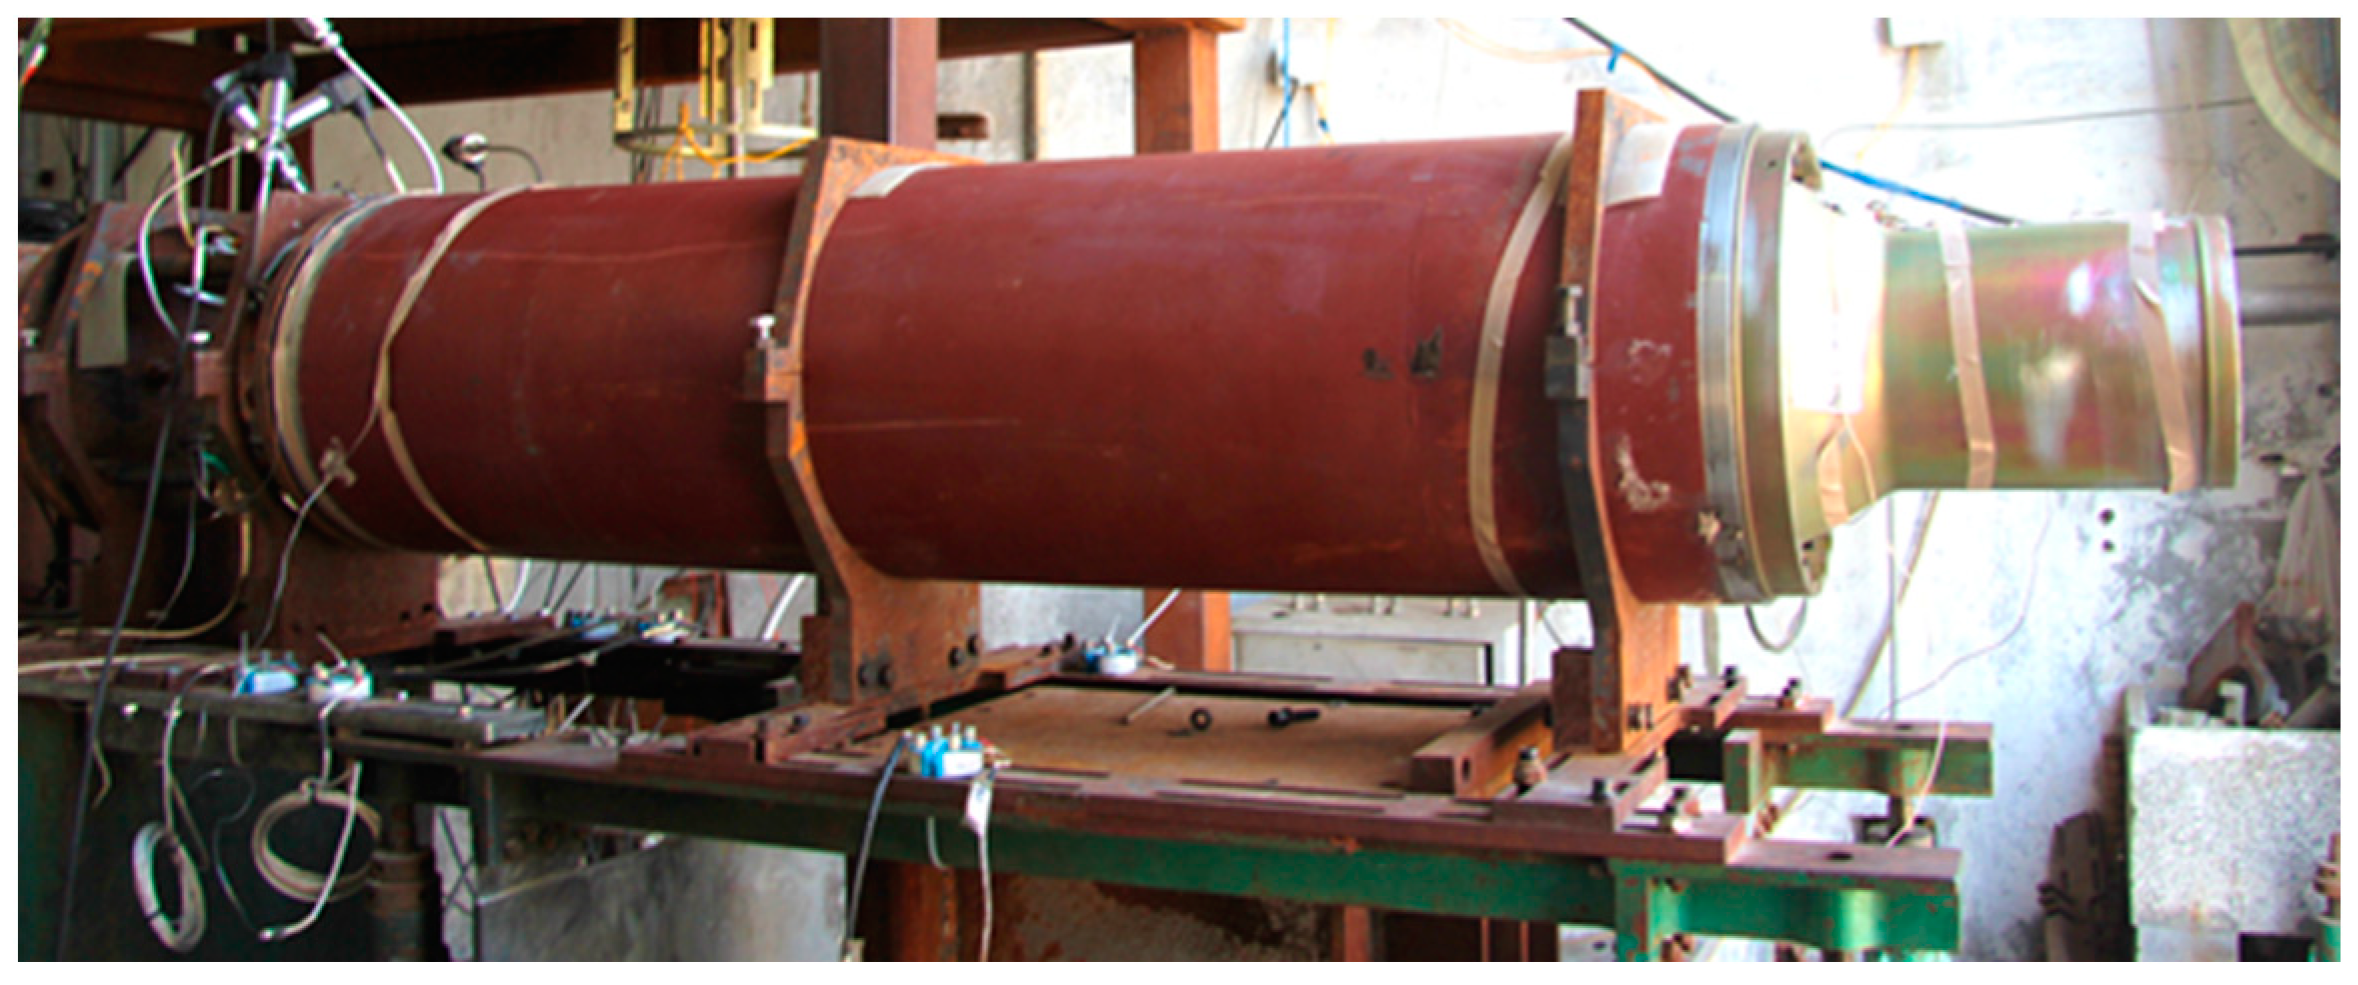
To meet the technical requirements for achieving long-duration operations in hybrid propulsion, the fuel adopted a tubular grain configuration, as illustrated in Figure 4. The rocket motor consisted mainly of the oxidizer collection cavity, liquid injection panel, annular igniter, solid grain, combustion chamber casing, combustion chamber ablative layer, and nozzle. The propellant grain had a thickness of up to 70 mm, enabling stable combustion for over 200 s at an oxidizer flow rate of 1 kg/s. The combustion chamber casing was constructed from 30CrMnSiA material, ensuring excellent strength and pressure-bearing capabilities. The ablative layer of the combustion chamber utilized ethylene propylene diene monomer (EPDM) rubber. The physical structure of the hybrid rocket motor is depicted in Figure 5.

3.1.1. Motor Head Structure

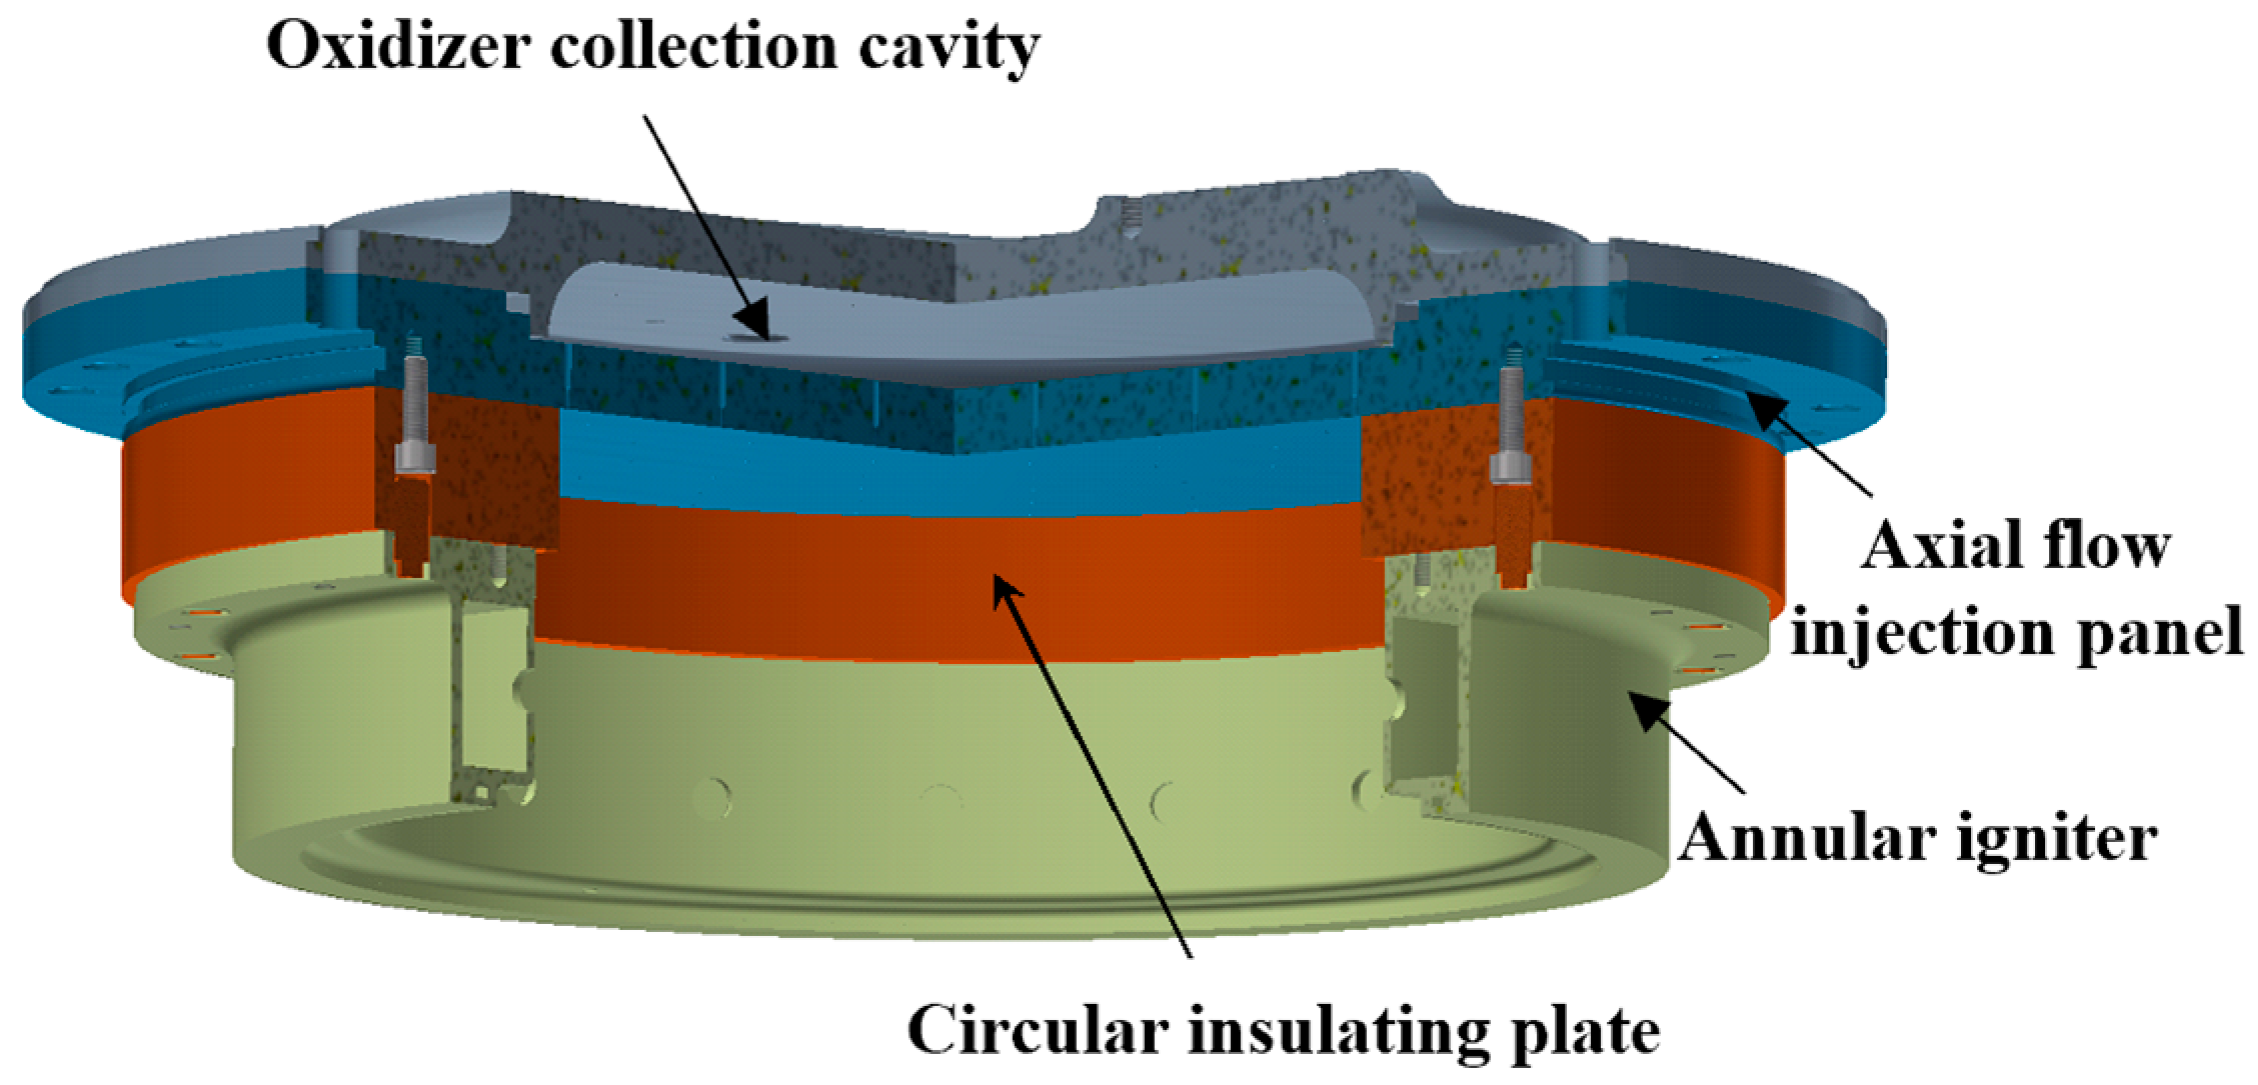
To achieve effective oxidizer atomization, an axial flow injection panel structure was employed as the head design for the hybrid rocket motor. In order to ensure reliable ignition of the motor, a fireworks-inspired annular igniter structure was utilized. Furthermore, to facilitate efficient, stable combustion during motor operation, a circular insulating plate was employed to provide thermal protection for the edge region of the liquid injection panel. The schematic representation of the head structure is depicted in Figure 6.
The annular igniter, requiring sufficient ignition energy and duration, utilized a solid propellant-based igniter, as depicted in Figure 7. It primarily consisted of an ignition head, boron/potassium nitrate igniter, solid propellant, insulating layer, and igniter casing. During the ignition process, the ignition head first ignited the boron/potassium nitrate igniter, subsequently initiating the combustion of the solid propellant. The high-temperature products of the solid propellant combustion were expelled through the ignition ports into the combustion chamber, thereby achieving the heating of the oxidizer and fuel columns and providing ignition energy. Ground ignition tests verified that this annular igniter meets technical requirements and can maintain an ignition duration of at least 6 s.

3.1.2. Motor Nozzle

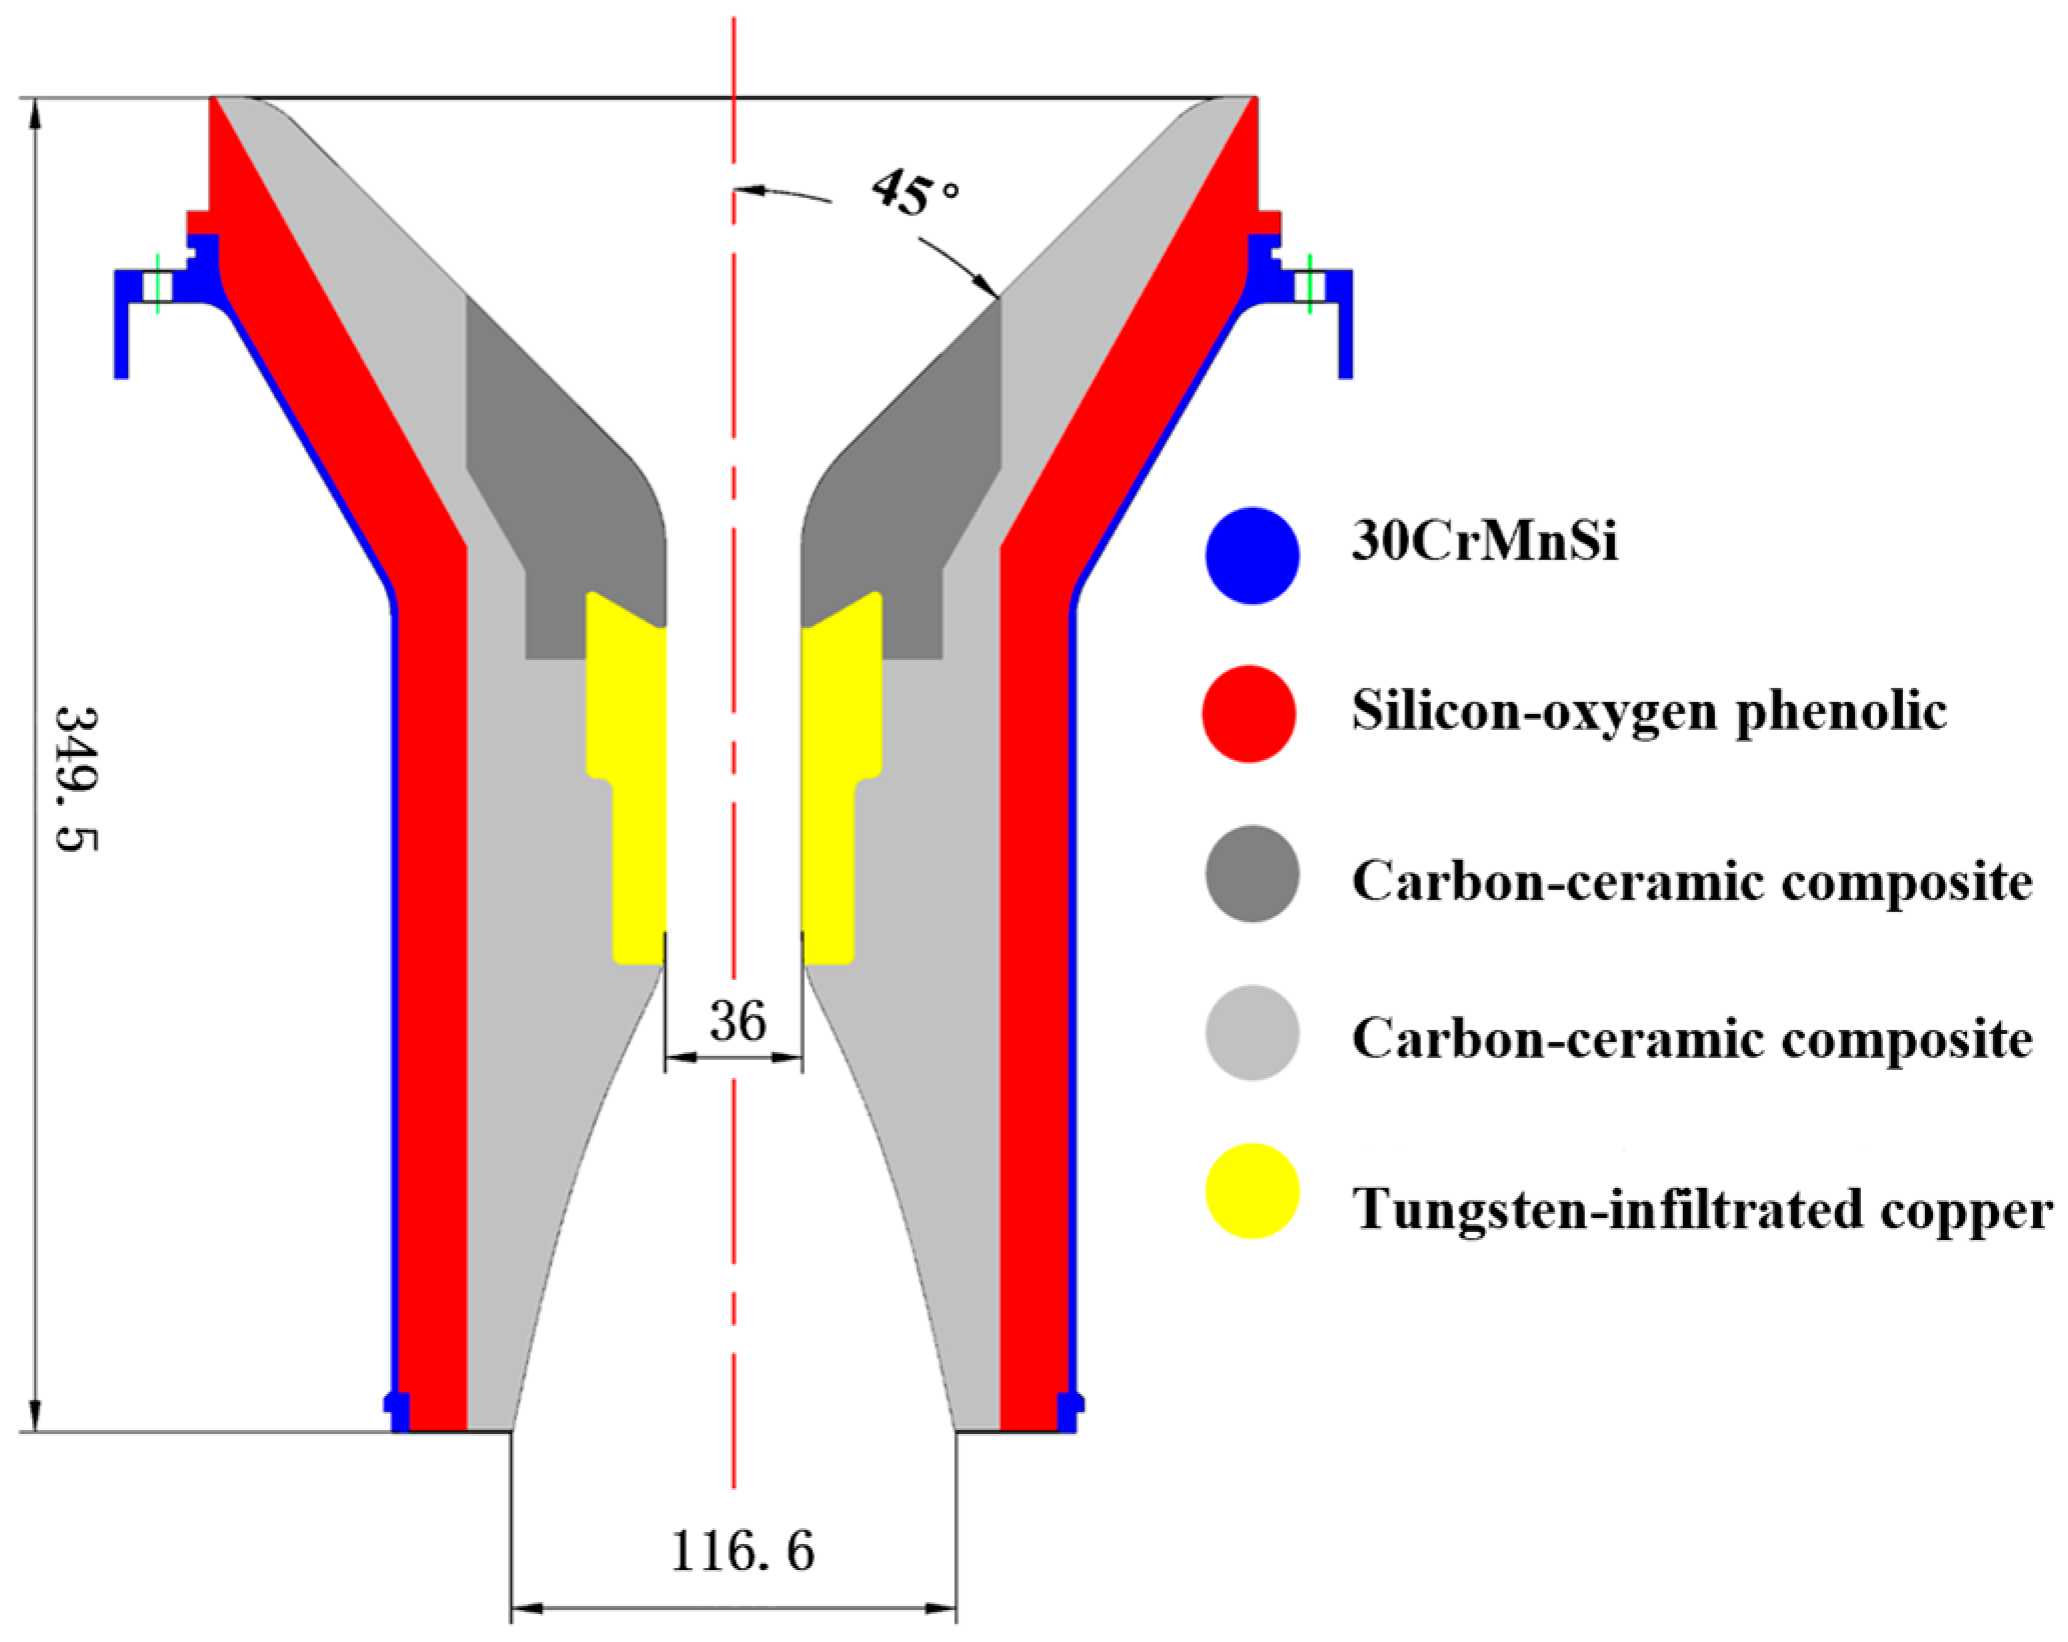
To achieve prolonged and effective operation of the hybrid rocket motor nozzle, a multi-interface nozzle was employed, combining the characteristics of different materials, which is demonstrated in Figure 8. The insulating layer utilized a high silicon-oxygen phenolic resin material, the convergent and divergent sections used carbon–ceramic composite materials, and the throat employed tungsten-infiltrated copper high-temperature alloy. The silicon–oxygen phenolic had a low density and excellent insulation properties, the carbon–ceramic composite material had low specific gravity and high hardness, and the tungsten-infiltrated copper high-temperature alloy exhibited excellent high-temperature resistance and achieved a sweating-like cooling effect. This design significantly reduced the nozzle erosion rate. The nozzle throat diameter was 36 mm, the expansion ratio was 10.38, and based on previous experience, the convergent angle for the nozzle convergent section was chosen as 45°.

3.2. Ground Test System

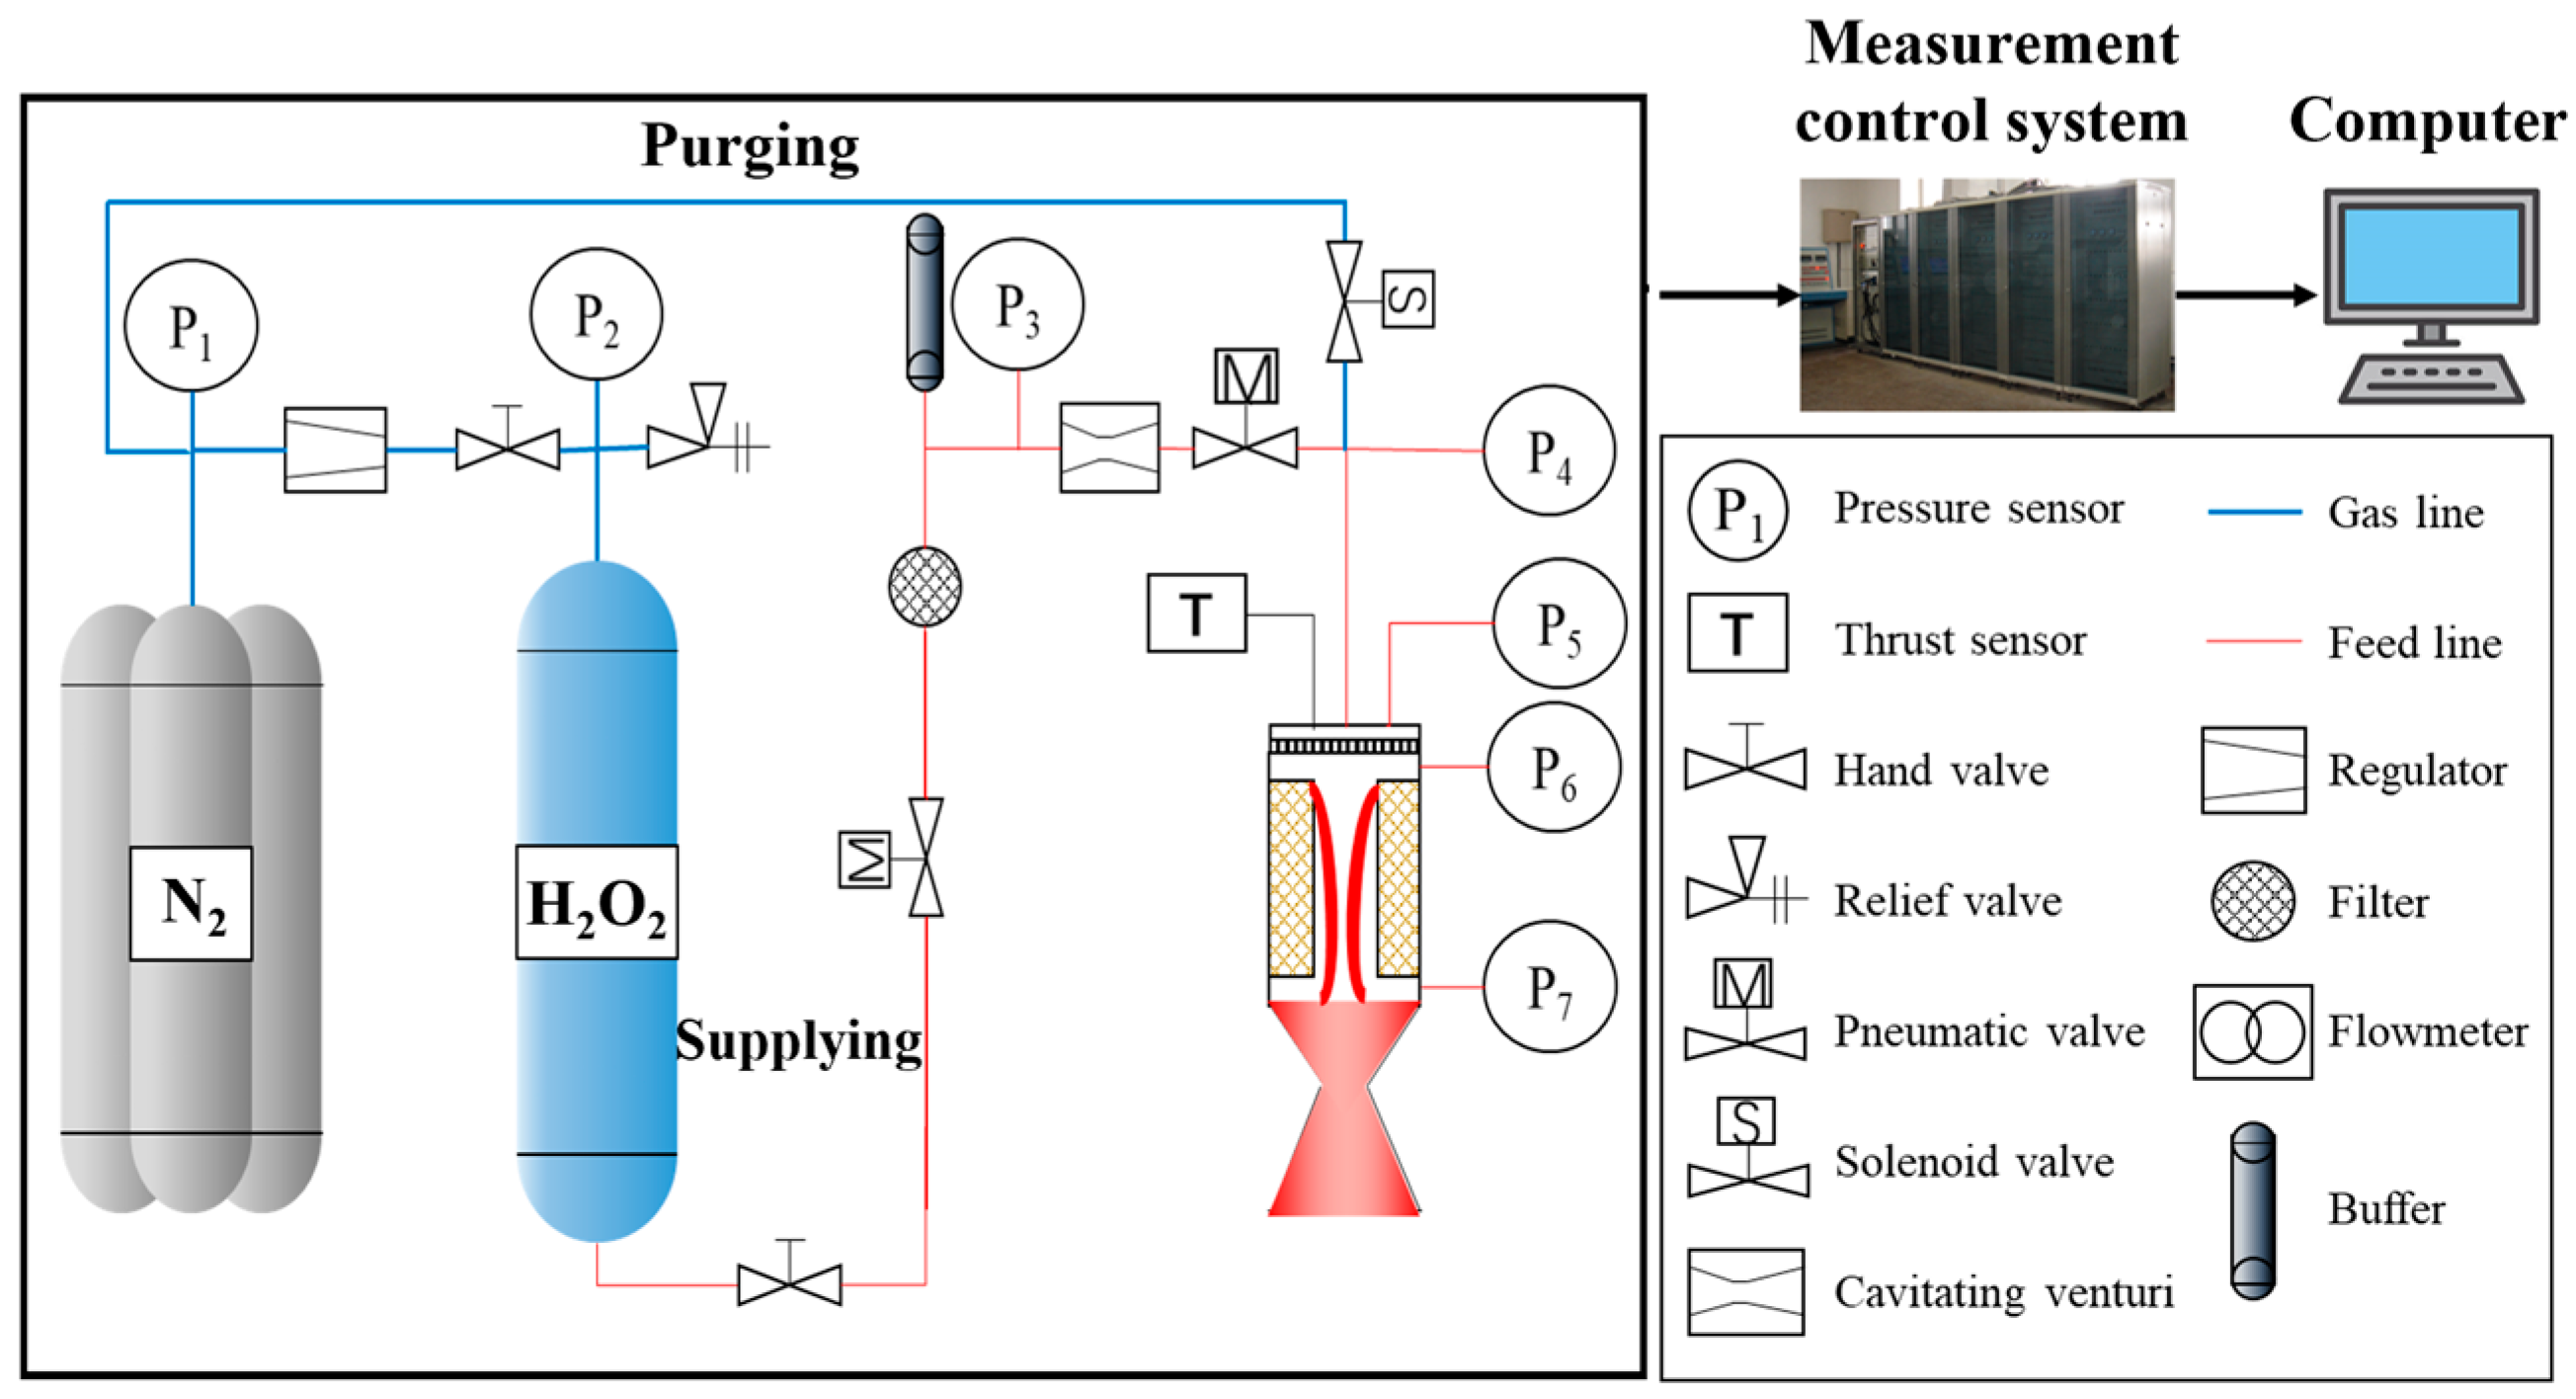
The schematic diagram of the ground test system for the hybrid rocket motor is illustrated in Figure 9. It primarily consisted of components such as a high-pressure nitrogen source, pressure regulator, manual valve, H2O2 tank, tank safety valve, pneumatic valve, filter, buffer tank, Venturi tube, solenoid valve, pressure sensor, thrust sensor, measurement and control system, and computer.
The pressure regulator reduced the pressure of the upstream high-pressure nitrogen source before delivering it to the oxidizer tank. The tank safety valve ensured that the pressure in the tank did not exceed the safety threshold. The pneumatic valve controlled the on–off state of the transport pipeline through pneumatic effects, providing a rapid response. The Venturi tube throttled the oxidizer using the saturation vapor pressure, ensuring that the upstream pressure corresponds to the oxidizer mass flow rate within the cavitation range. The solenoid valve possessed favorable structural dimensions and rapid response. The experimental measurement and control system employed a programmable logic controller for sequence control, including ignition command triggering and valve switching. The measurement system had a sampling frequency of up to 1000 Hz. The pressure sensor used a splatter membrane-type pressure sensor with a measurement range of 0 to 10 MPa and an accuracy of 0.02 MPa. The thrust sensor used an S-type force sensor (BK-1) with a measurement range of ±30 kN and a measurement accuracy of 30 N.

4. Results and Discussions

4.1. Grid and Time Step Independence Verification

In order to verify the accuracy of dynamic simulation results, grid independence verification and time step independence verification were conducted.

4.1.1. Grid Independence Verification

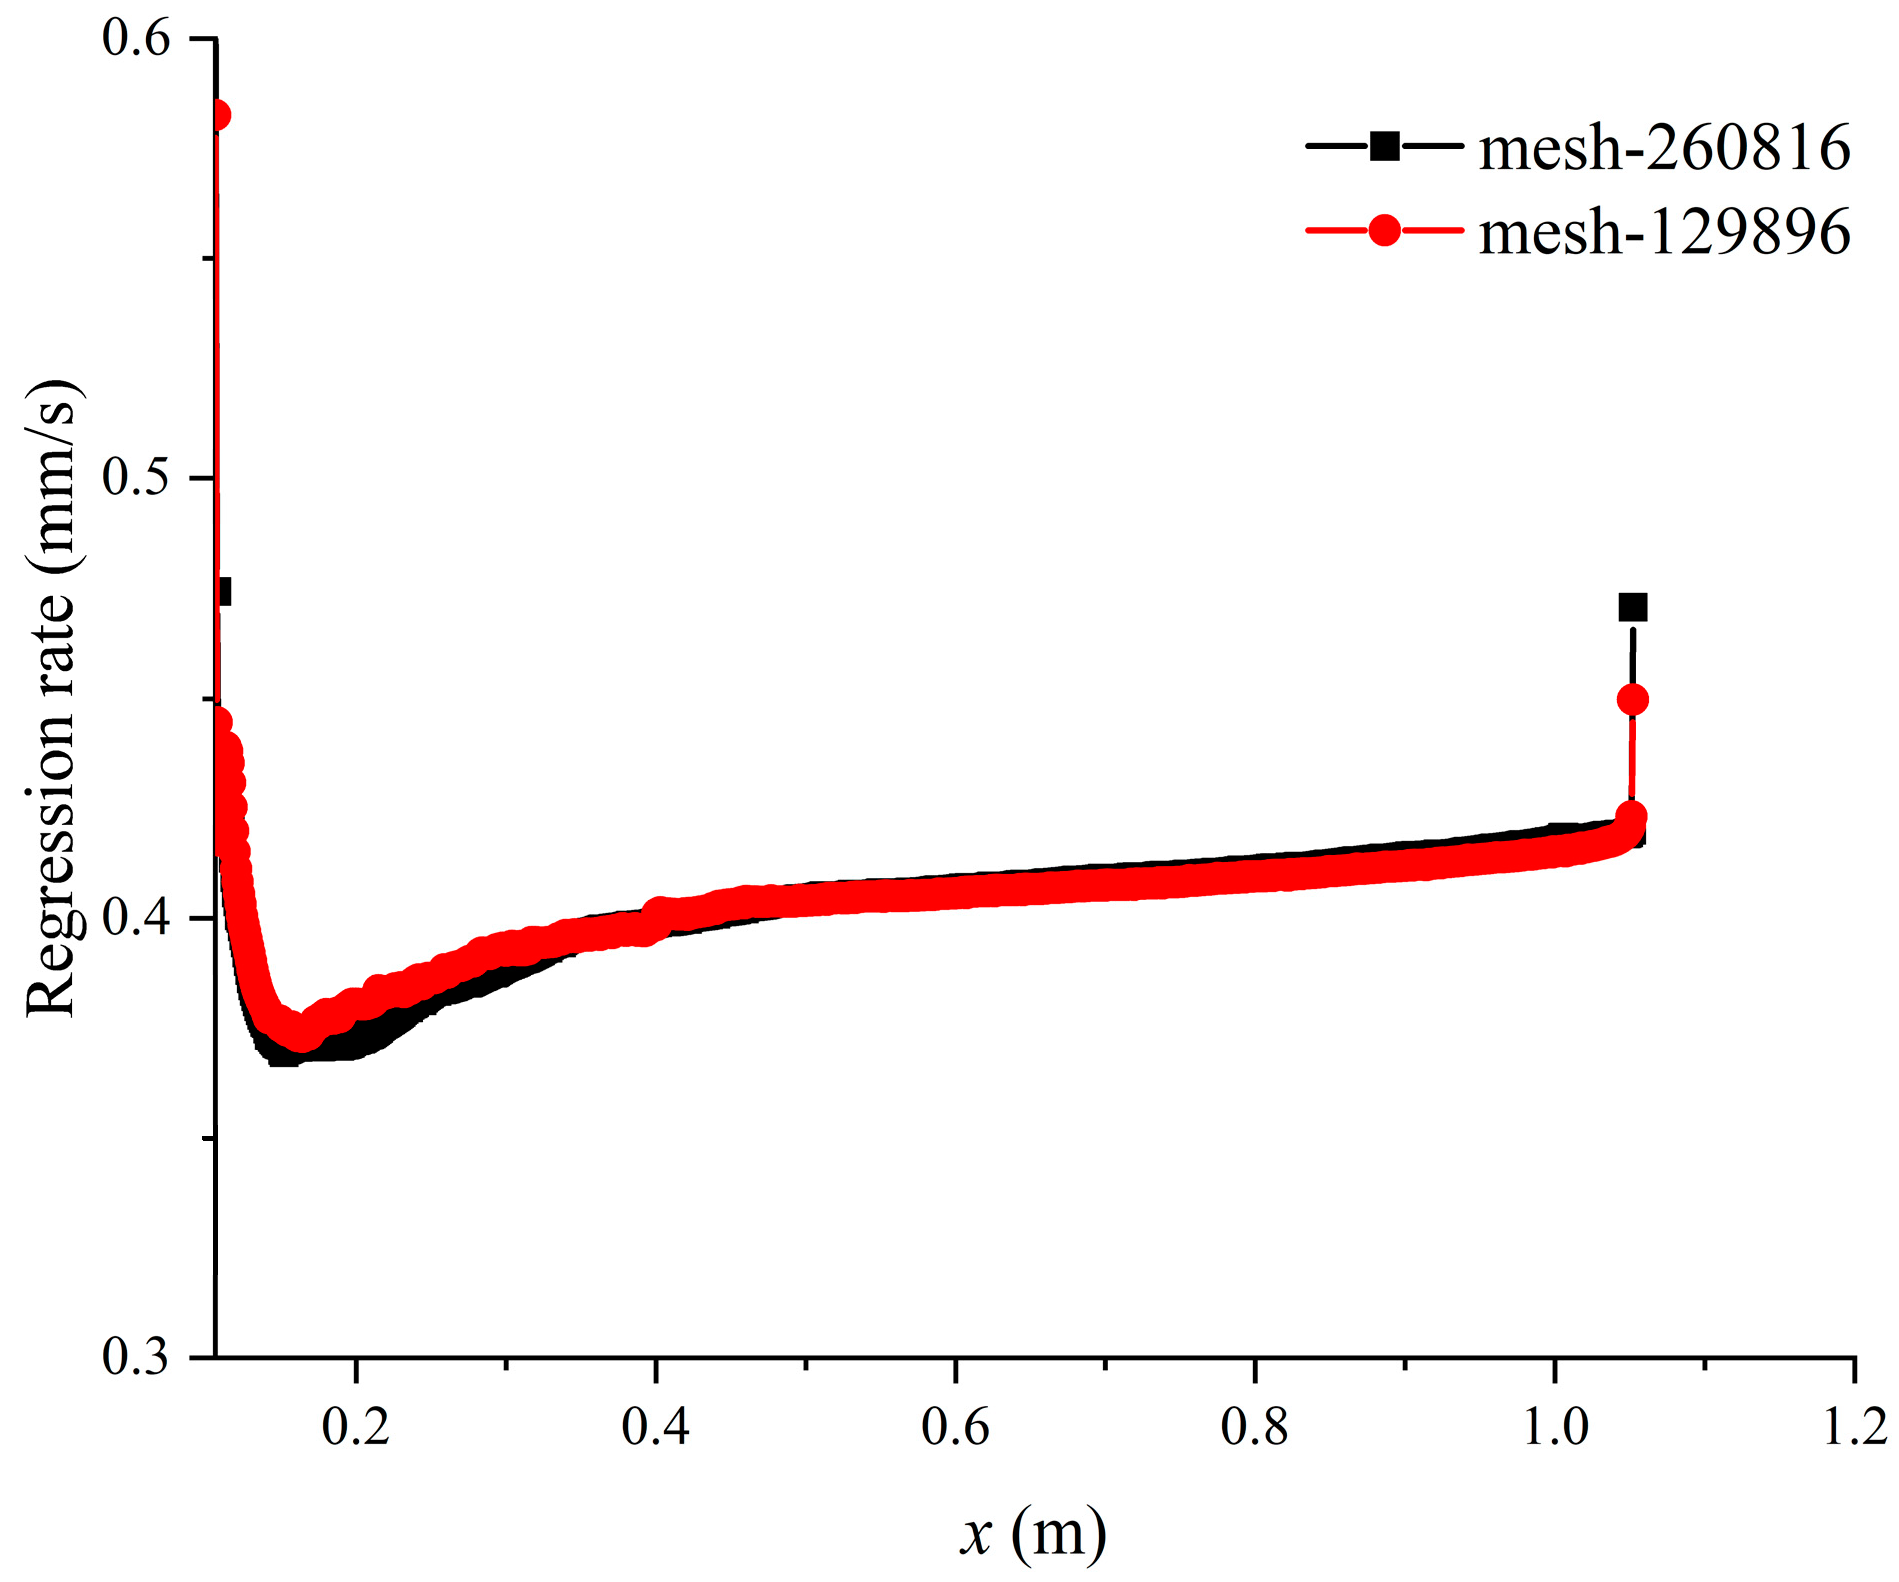
The standard mesh was the same as that presented in Figure 2. The total mesh number was 129896. The total cell numbers of the comparison mesh were 260816. It can be found that the simulated regression rates were close with different meshes, as shown in Figure 10. Therefore, the influence of computational grids can be ignored.

4.1.2. Time Step Independence Verification

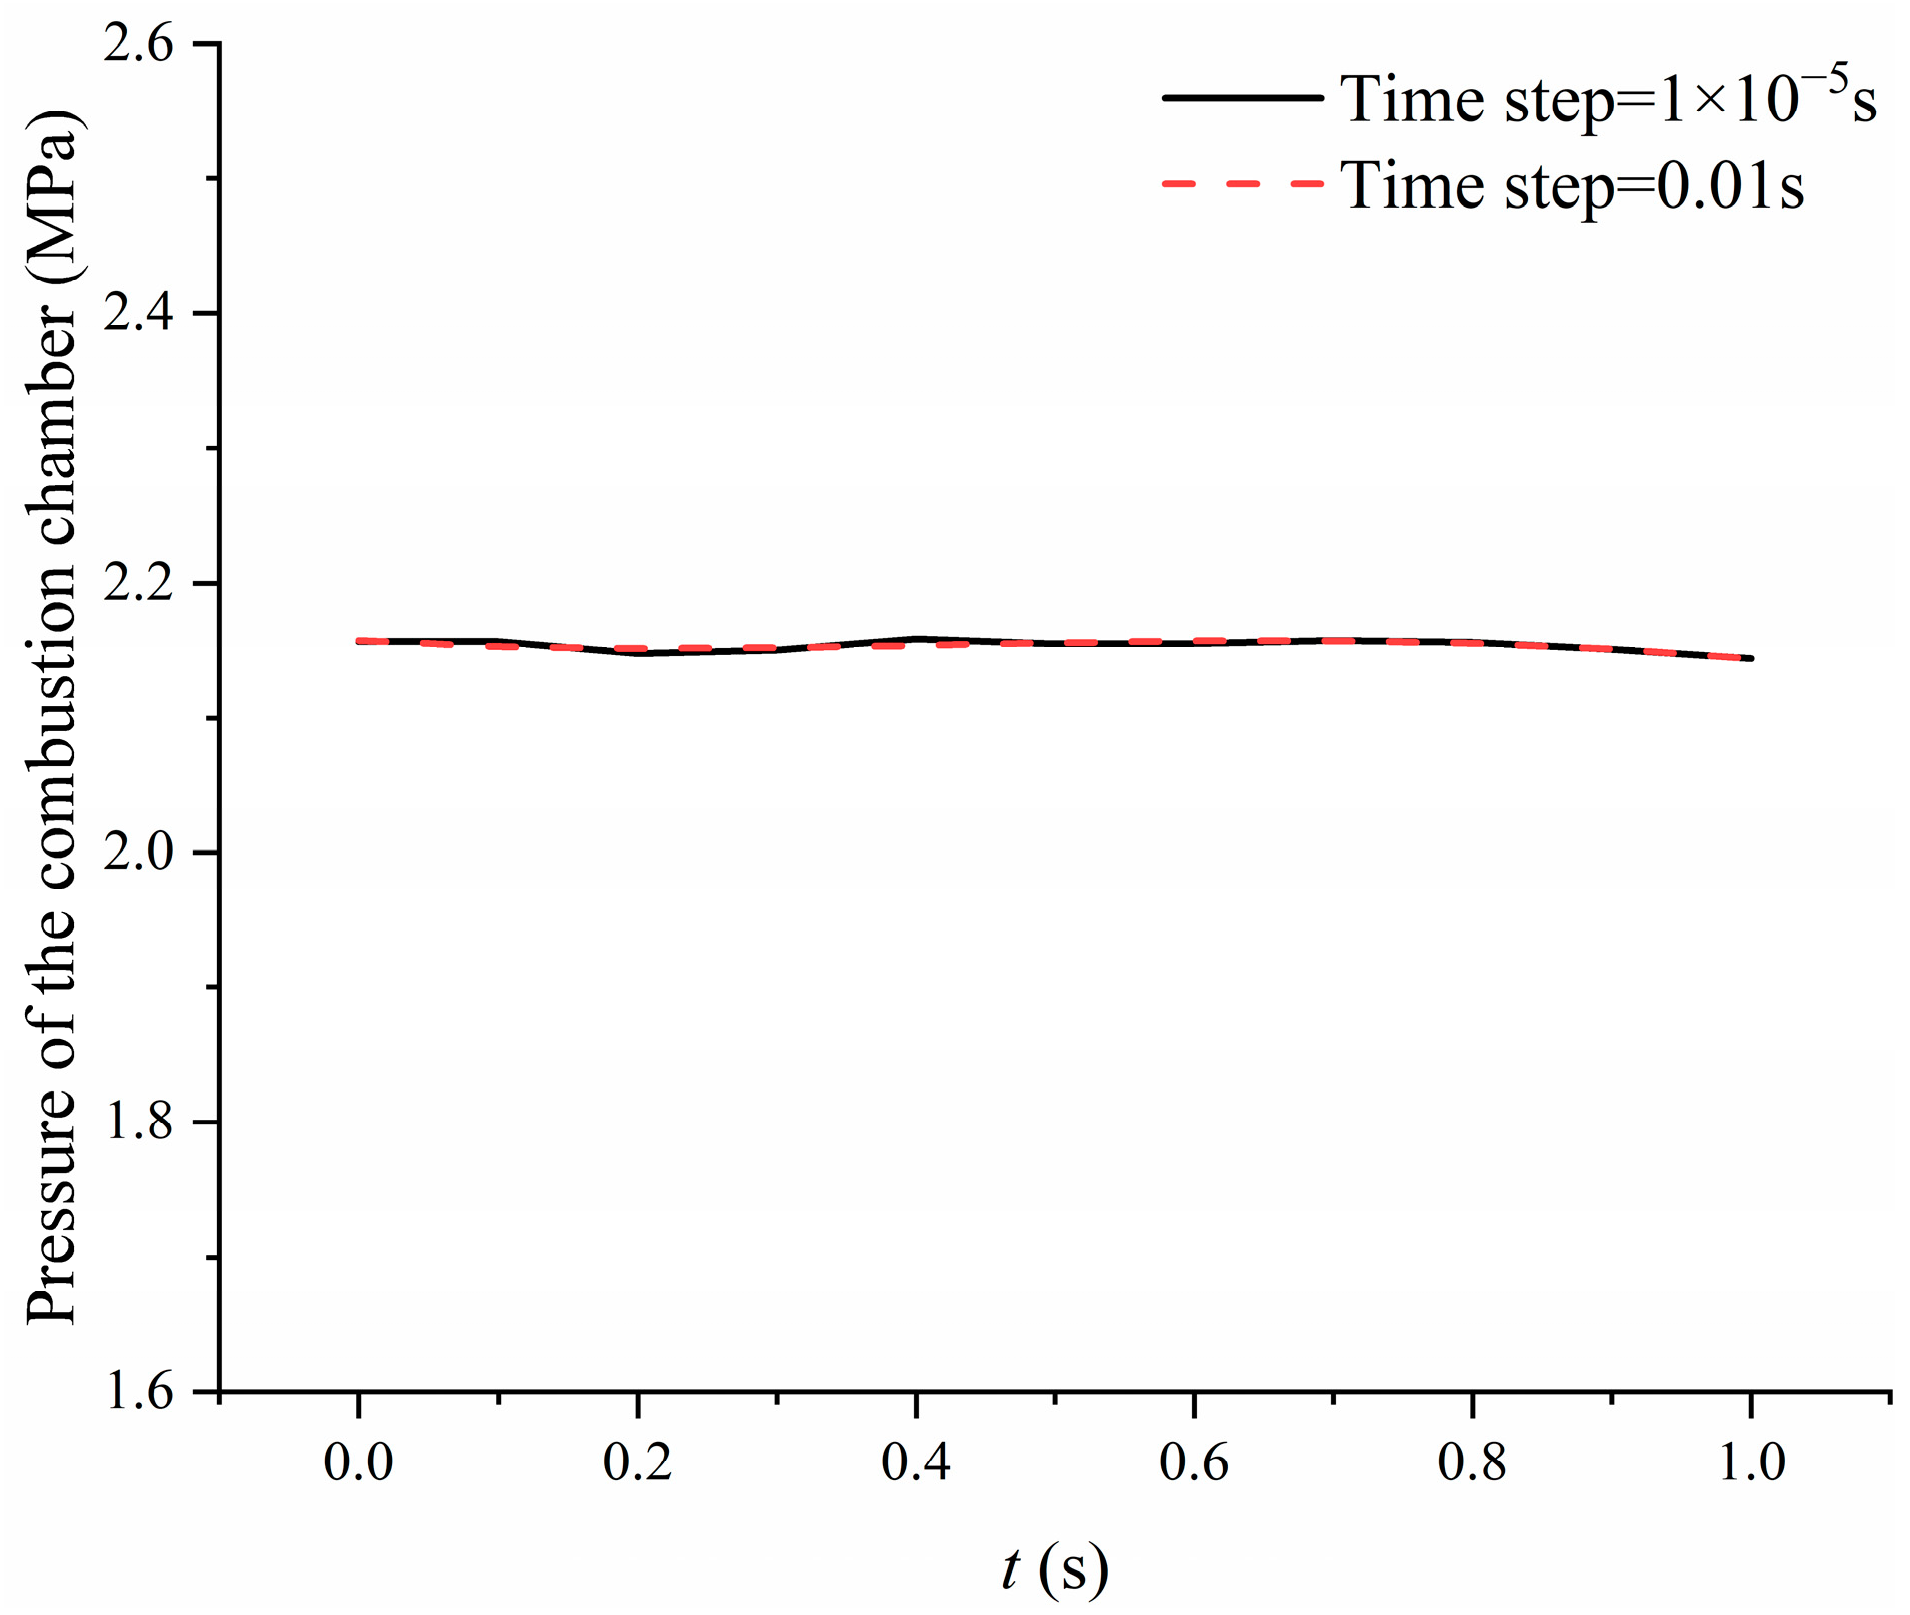
According to Ref. [36], the simulated time step corresponded to the convective time in the fluid, which was about 1 × 10⁻⁵ s in this simulation. However, the dynamic simulation was conducted over a long period corresponding to the time scale. Therefore, a bigger time scale (0.01 s) was proposed and compared with the smaller one. It can be found that the simulated combustion chamber pressures were close with different time steps, as shown in Figure 11. Therefore, the influence of the time step can be ignored.

4.2. Experimental Results

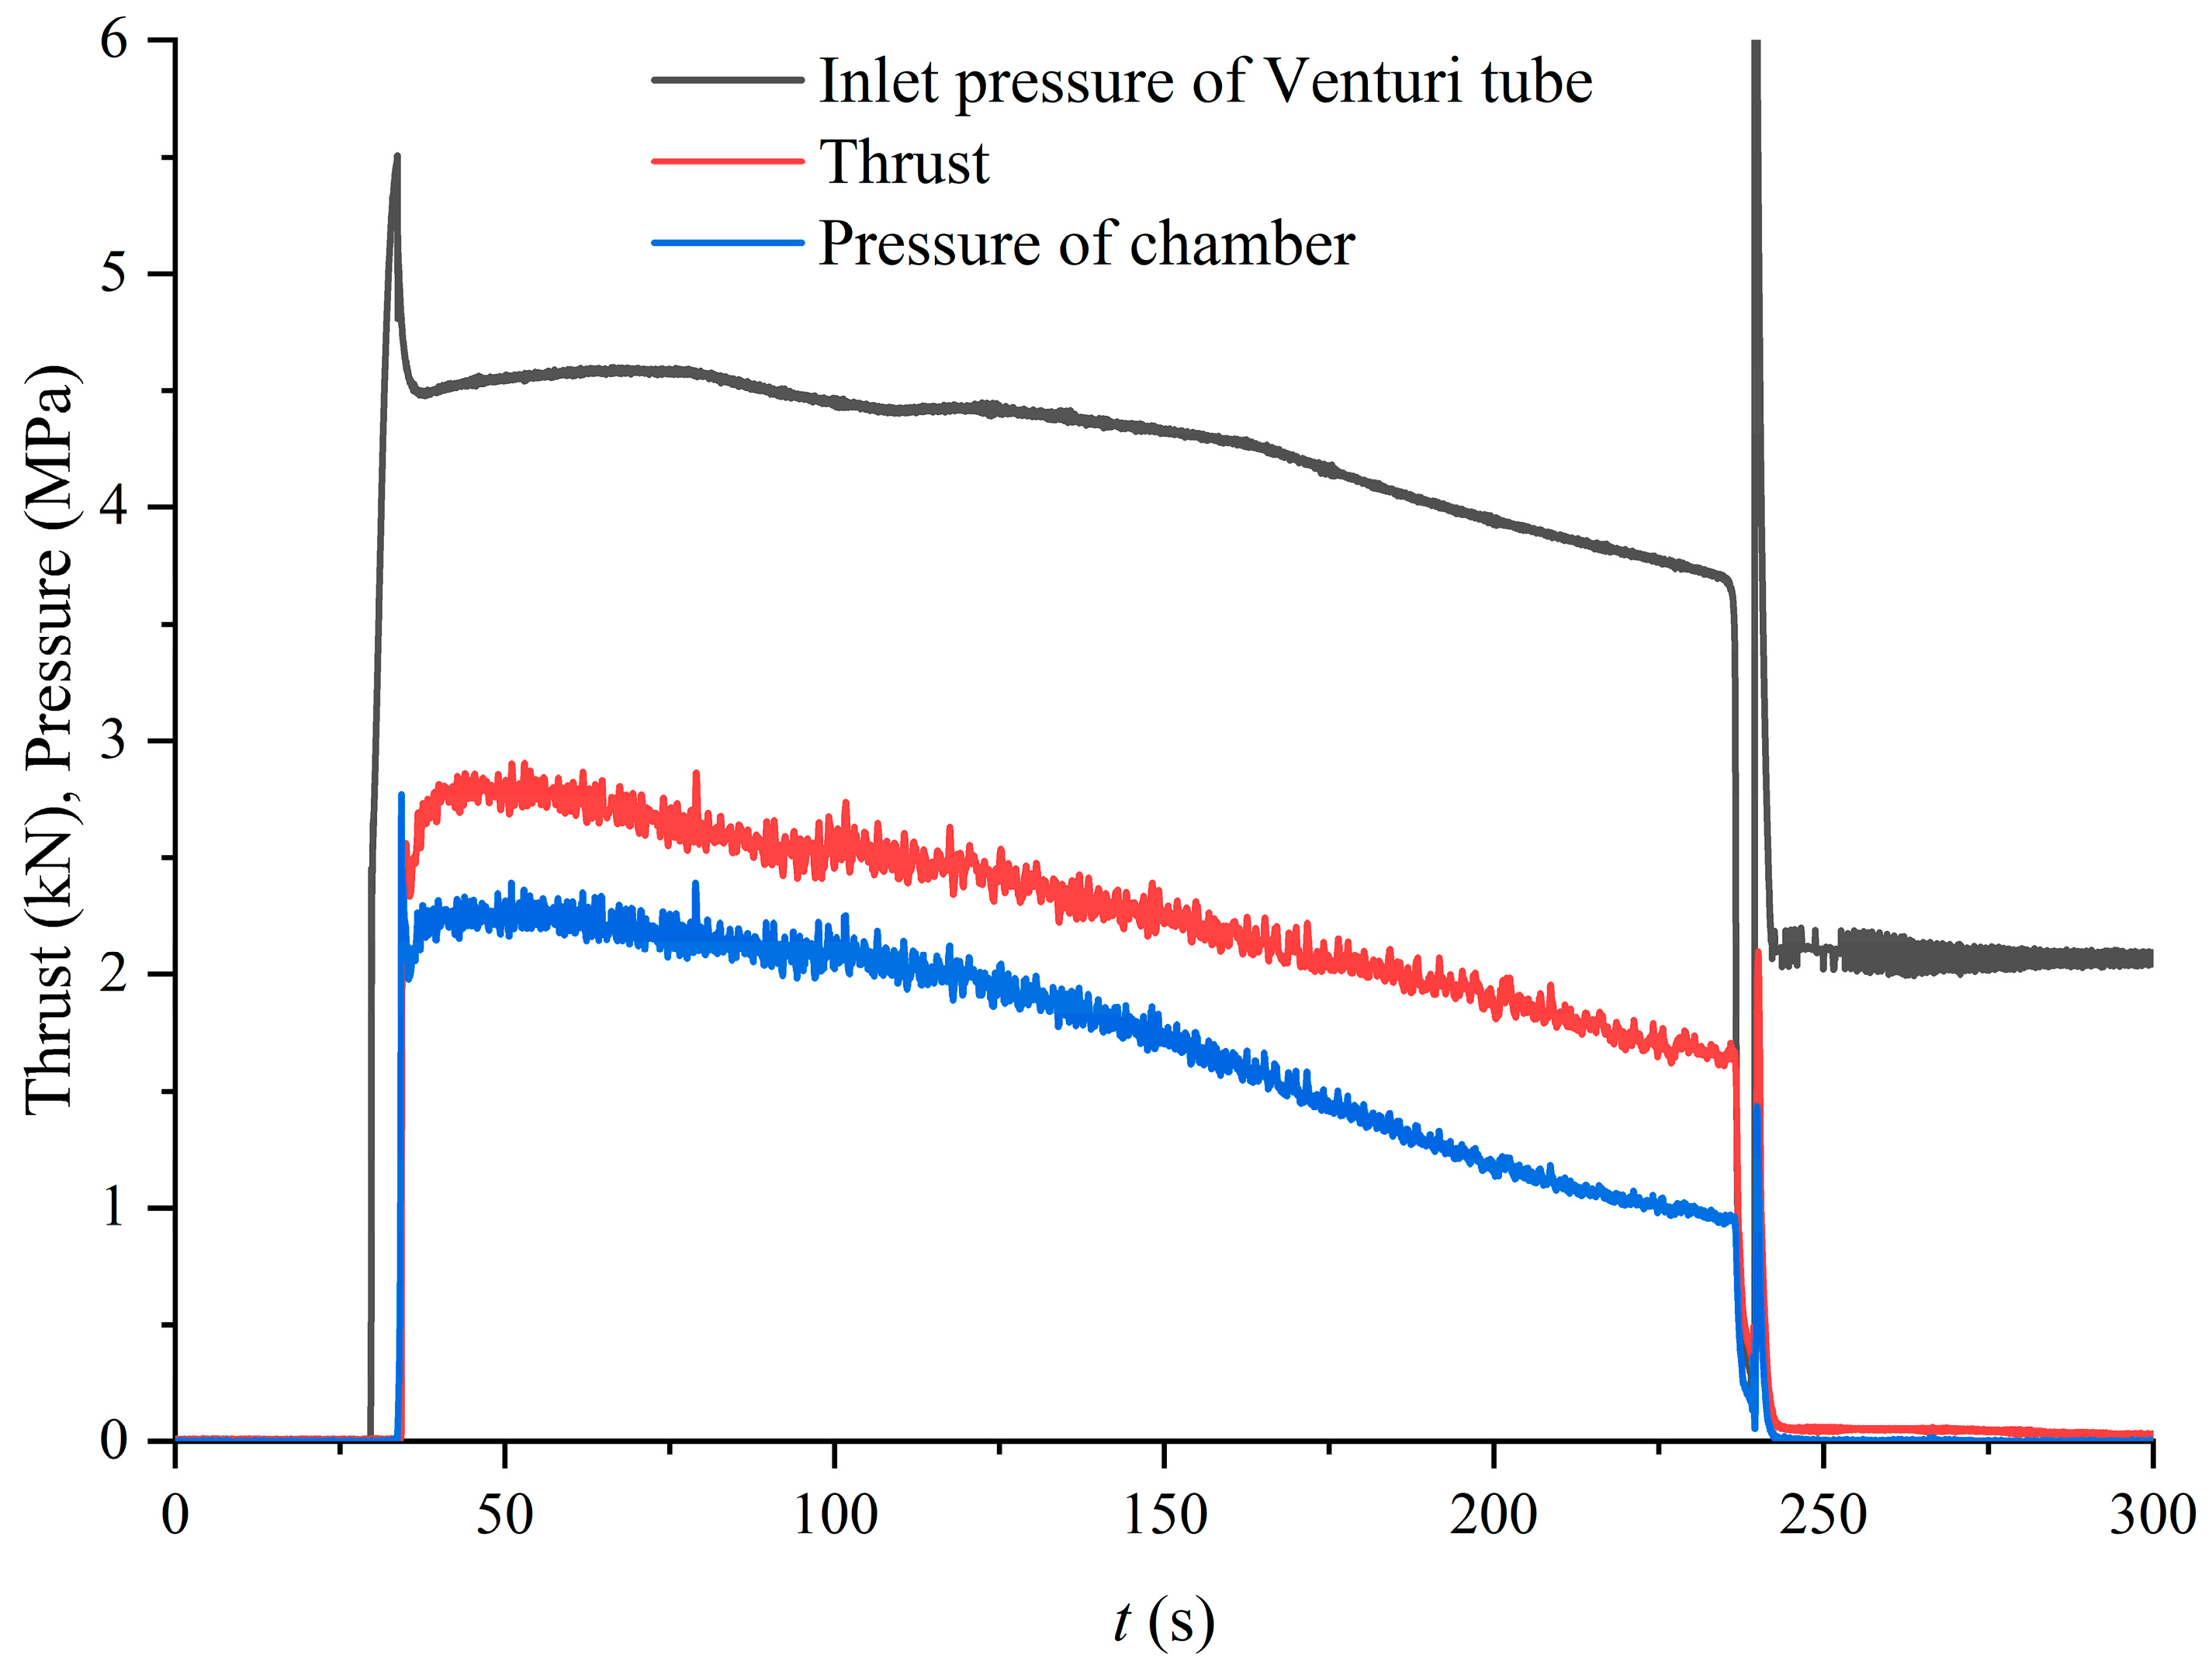
The hybrid rocket motor achieved stable operation for 200 s, with the tail flame during the operation in Figure 12. Throughout the motor operation, the inlet pressure of the venturi tube, motor thrust, and combustion chamber pressure exhibited smooth variations, as depicted in Figure 13. The final operational time of the motor was approximately 203 s, during which stable combustion and structural integrity were maintained. Both thrust and combustion chamber pressure gradually decreased in the working process. Two primary factors contributed to this trend. First, variations in the O/F led to a decrease in the thrust and combustion chamber pressure. Simulation analysis indicated a gradual reduction in O/F. Second, erosion of the nozzle directly led to a decline in combustion chamber pressure and nozzle efficiency. The maximum thrust achieved by the motor was 2.93 kN, and the maximum combustion chamber pressure reached 2.30 MPa. The essential performance data for the hybrid rocket motor during prolonged operation are summarized in Table 3.
The oxidizer mass flow rate during the experiment was calculated based on the inlet pressure of the Venturi tube using the following equation:
m ˙ o = C v A 0 2 ρ o p i p s
Here, Cv represents the flow coefficient, A0 is the throat area of the Venturi tube, ρo is the density of the oxidizer, pi is the inlet pressure of the Venturi tube, and ps is the saturation vapor pressure of the oxidizer. The calculated oxidizer mass flow rate for the 200-s ground firing test of the hybrid rocket motor is illustrated in Figure 14. The oxidizer mass flow rate slightly decreased during the operational process, reducing from 1.22 kg/s at ignition to 1.02 kg/s.
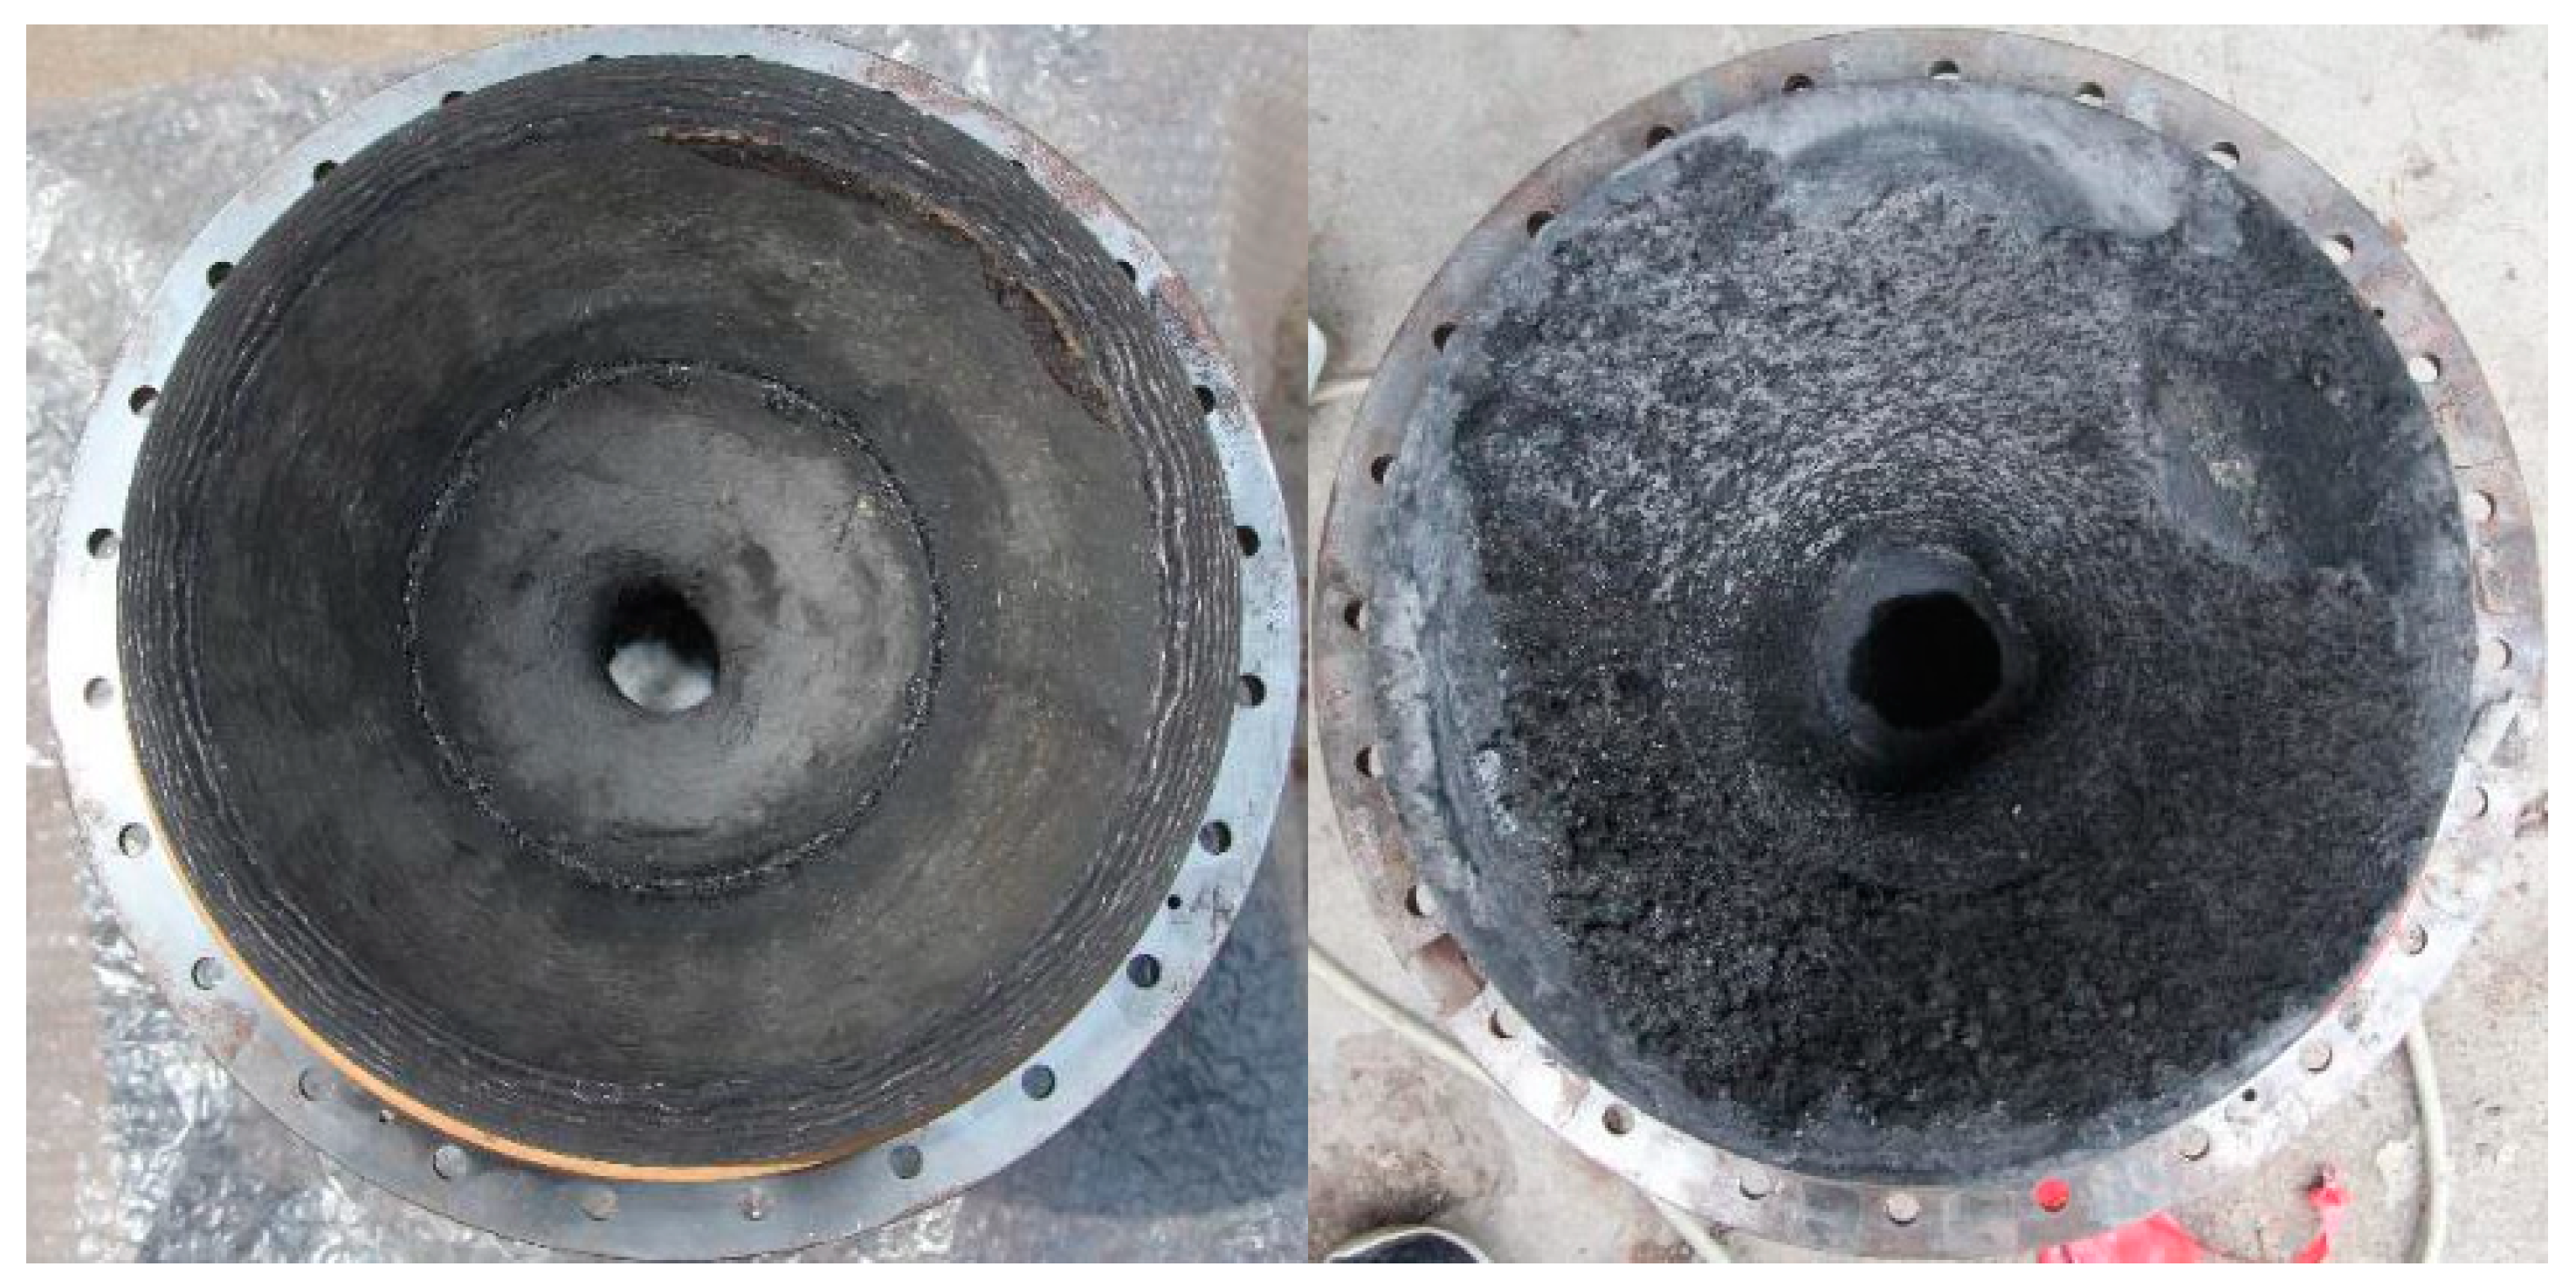
The evolution of the fuel grain in the hybrid rocket motor before and after the 200-s firing test is depicted in Figure 15. It is evident from the image that the internal insulation layer of the motor melted after the test. The changes in the nozzle before and after the test are illustrated in Figure 16, revealing pronounced and asymmetric nozzle erosion. The throat diameter of the nozzle was measured at multiple points in the circumferential direction using an internal micrometer at the throat section, and the average values were calculated. The nozzle throat diameter was 35.87 mm before the test and increased to 50.49 mm after the test. The calculated nozzle throat average erosion rate was 0.036 mm/s. The nozzle exhibited satisfactory erosion resistance, meeting the requirements and aligning with the conditions set in the simulation. It is noteworthy that the observed asymmetry in the nozzle throat may lead to thrust eccentricity. Therefore, future research should delve into the mechanisms of nozzle erosion, employing more accurate models to predict thrust magnitude and direction more precisely.

4.3. Comparison Analysis of Long-Term Simulation and Experimental Data

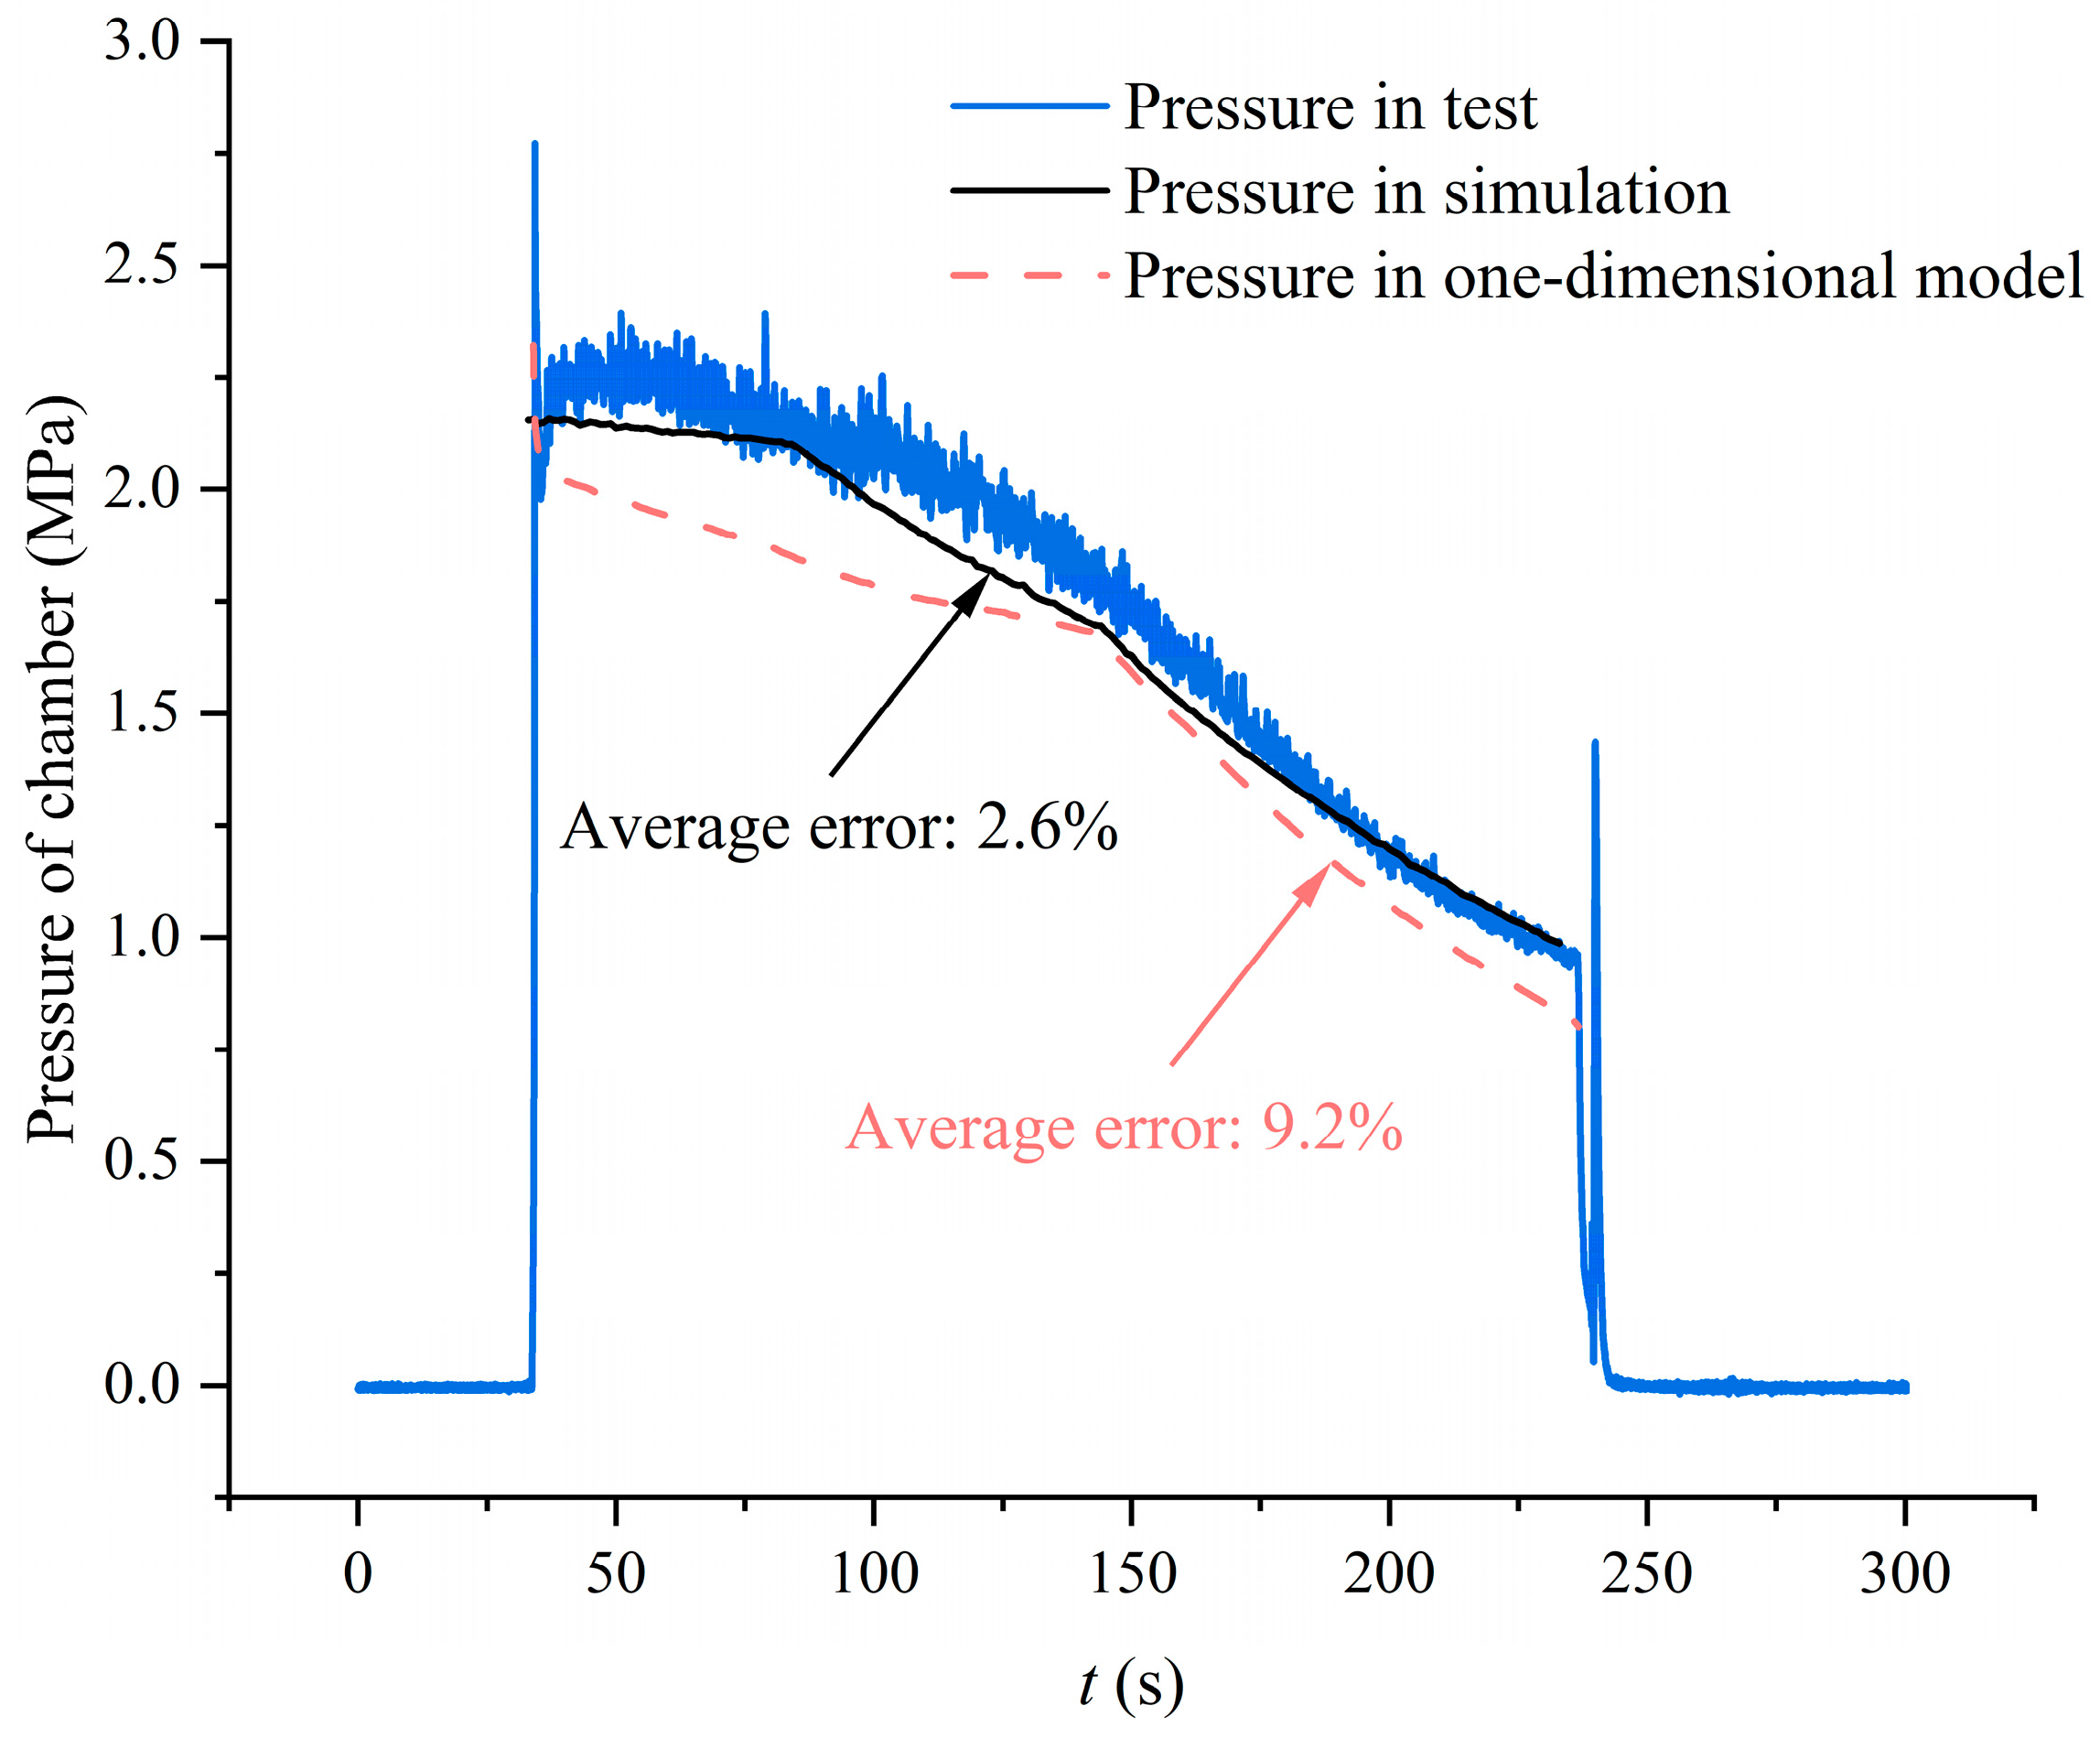
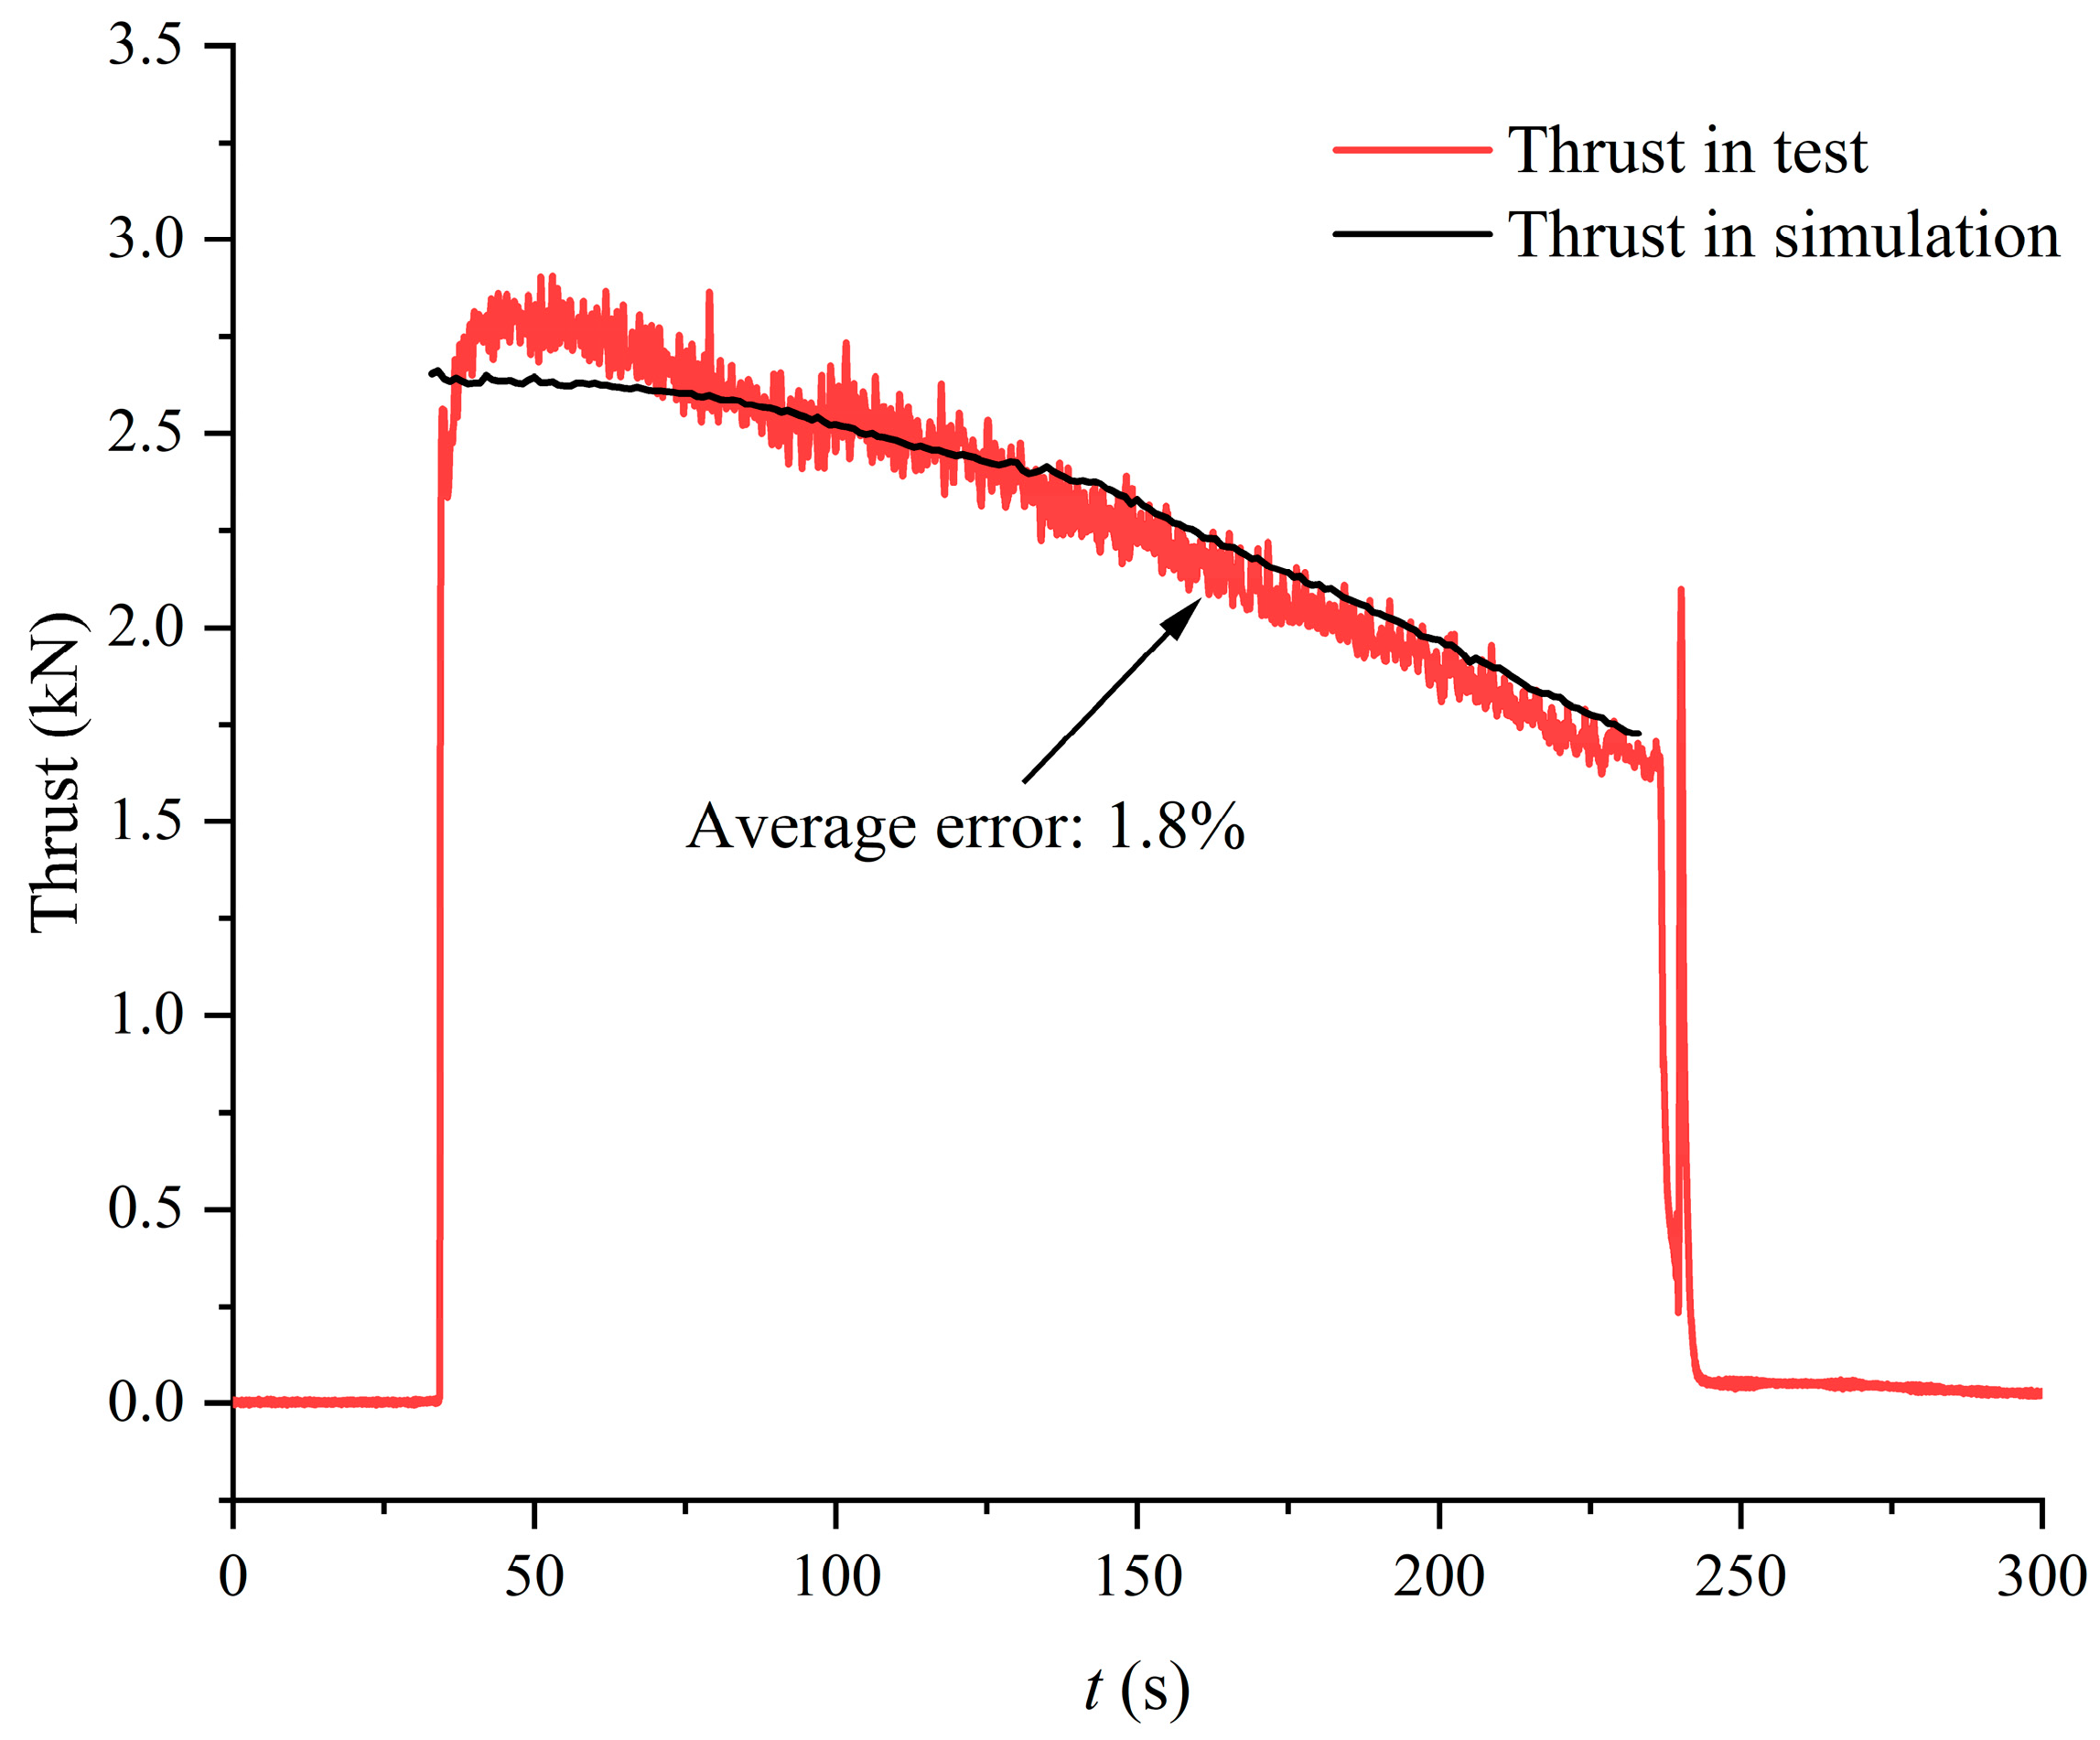
The comparison between the combustion chamber pressure during the 200-s firing test and simulation for the hybrid rocket motor is illustrated in Figure 17. It is evident that there was a good fit between the simulated and experimental combustion chamber pressures. The average combustion chamber pressure during the test was 1.73 MPa, while the average simulated combustion chamber pressure was 1.685 MPa. The average deviation between the simulation and experiment was 2.6%. Meanwhile, the simulations using a one-dimensional model were also conducted, and the results showed that the deviation between the simulated and experimental combustion chamber pressures reached 9.2%. The main reason is that the regression rate in the one-dimensional model was uniform along the axial direction, resulting in a relatively small combustion surface. This indicates that the dynamic numerical simulation model for this hybrid rocket motor exhibits excellent accuracy. There was a slight initial increase in combustion chamber pressure during the ignition phase, which, according to relevant experience, may be attributed to the contraction of the metallic actual throat area due to heating in the initial stages of operation. With further operation, the sweating and cooling of the nozzle throat made of tungsten-infiltrated copper material became insufficient to maintain the nozzle throat dimensions. The nozzle throat area increased by chemical and mechanical erosion, leading to a reduction in combustion chamber pressure. The comparison between the thrust during the 200-s firing test and simulation for the hybrid rocket motor is depicted in Figure 18. The fitting between the experimental and simulated motor thrust was also good. The average thrust during the test was 2.36 kN, while the average simulated motor thrust was 2.318 kN. The average deviation between the simulation and experiment was 1.8%. This further demonstrates the excellent accuracy of the dynamic numerical simulation model for the hybrid rocket motor, laying a good foundation for precise thrust predictions in actual flight scenarios. The combustion chamber pressure exhibited a strong dependence on the nozzle throat diameter. The slope of the combustion chamber pressure reduction can be divided into three stages, corresponding to the three stages of nozzle erosion. The average characteristic exhaust velocity was 1378.3 m/s in the simulation and 1419.5 m/s in the experiment. The deviation of the average characteristic exhaust velocity between the simulation and experiment was 2.9%.

4.4. Flow Field Parameter Analysis in Long-Term Dynamic Numerical Simulation

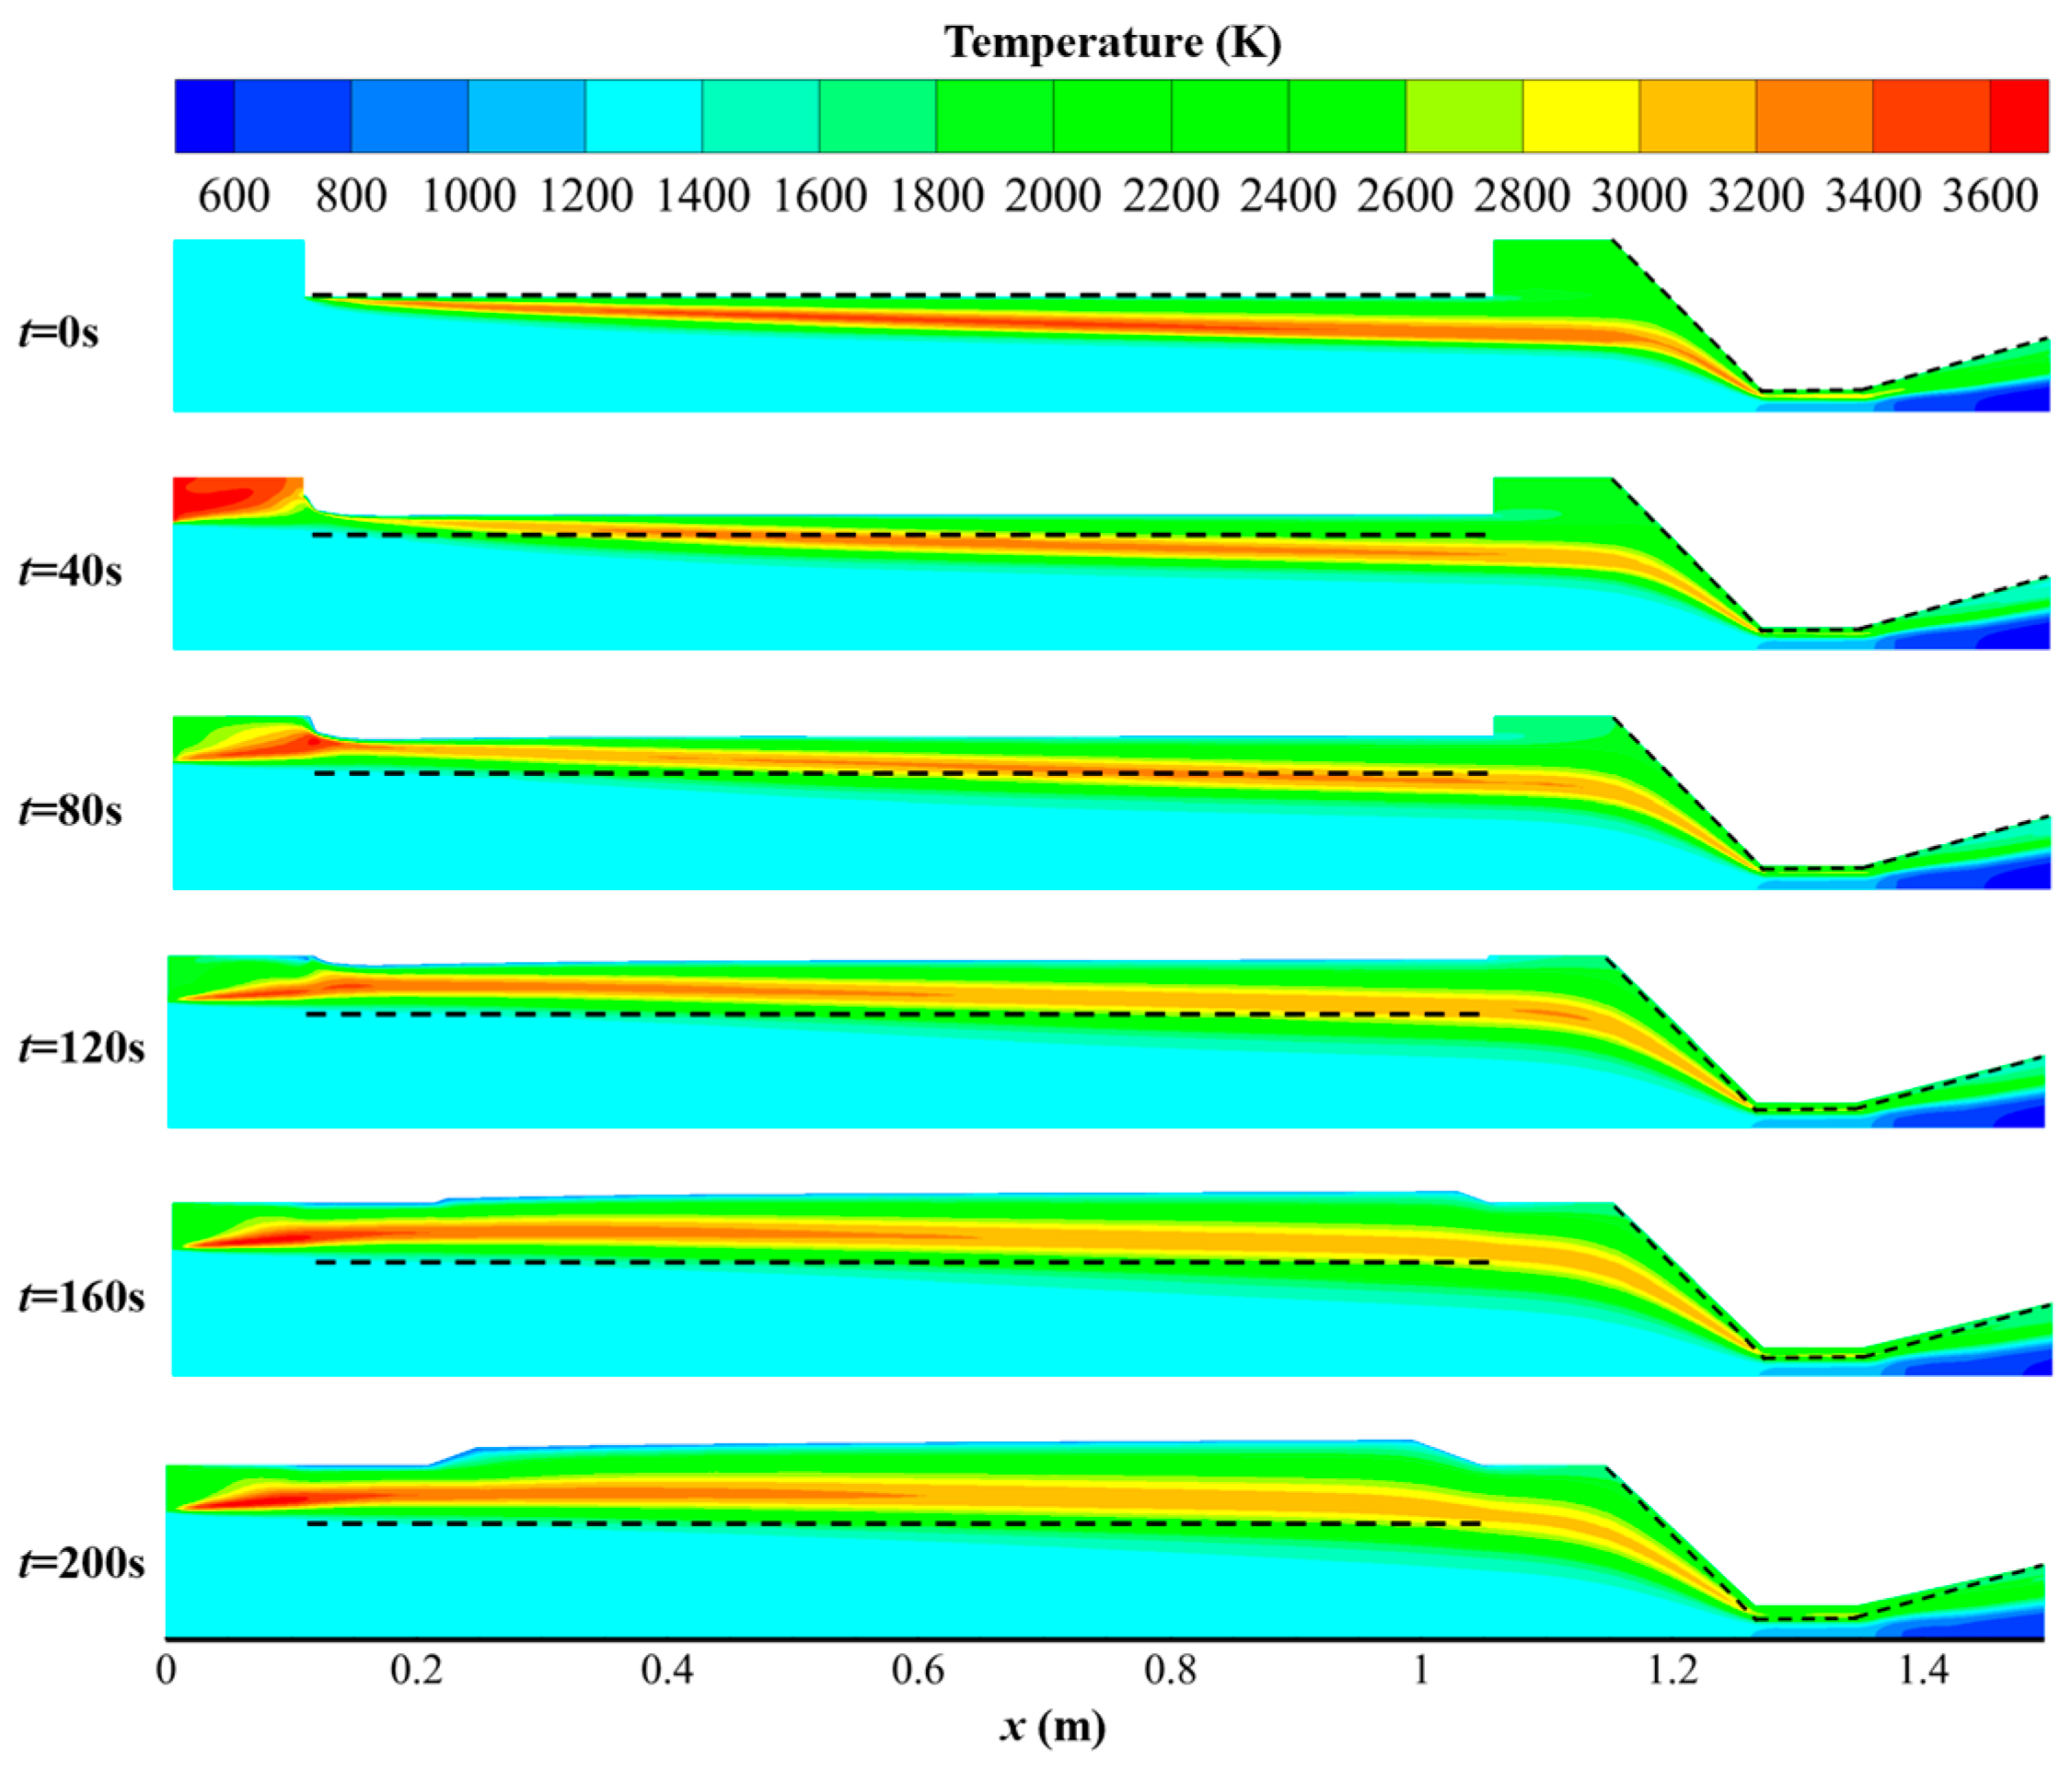
The temperature distribution of the flow field in the 200 s long-duration simulation of the hybrid rocket motor is shown in Figure 19. The dashed lines in the figure represent the initial positions of the burning surface and nozzle throat. During the simulation process, the burning surface did not experience severe distortion, and all parameters met the convergence criteria (10−3), demonstrating that the numerical simulation model is capable of simulating the operation of the hybrid rocket motor for up to 200 s. In the first 120 s of operation, the radial position of the flame layer noticeably moved upward. This is primarily due to the continuous retreat of the burning surface, causing the radial position of the pyrolysis gas entering the flow field to move upward gradually. Consequently, the radial position of the mixed combustion of oxidizer and fuel also moved upward. From 120 to 200 s, the radial position of the flame layer changed less significantly. This is because the radial position of the oxidizer inlet was fixed, and although the burning surface continued to retreat after 120 s, the radial position of the flame layer was essentially maintained at a certain distance above the maximum radial position of the oxidizer inlet. At this location, the mixing and combustion of oxidizer and fuel were more thorough, resulting in higher combustion temperatures. After 160 s of operation, the burning surface gradually took on a “trapezoidal” shape. This is mainly because the adiabatic layers at the front and rear ends of the grain were thick, as shown in Figure 1. To simulate this feature, the regression of the burning surface was restricted after reaching the adiabatic layer, and it no longer moved. Therefore, the burning surface exhibited a “trapezoidal” shape in the simulation. Additionally, it is noteworthy that the gas temperature in the pre-chamber was relatively high throughout the entire operation, indicating a more severe thermal environment in the pre-chamber. Therefore, a ring-shaped insulating plate was used in the experiment to ensure the reliable long-term operation of the hybrid rocket motor.
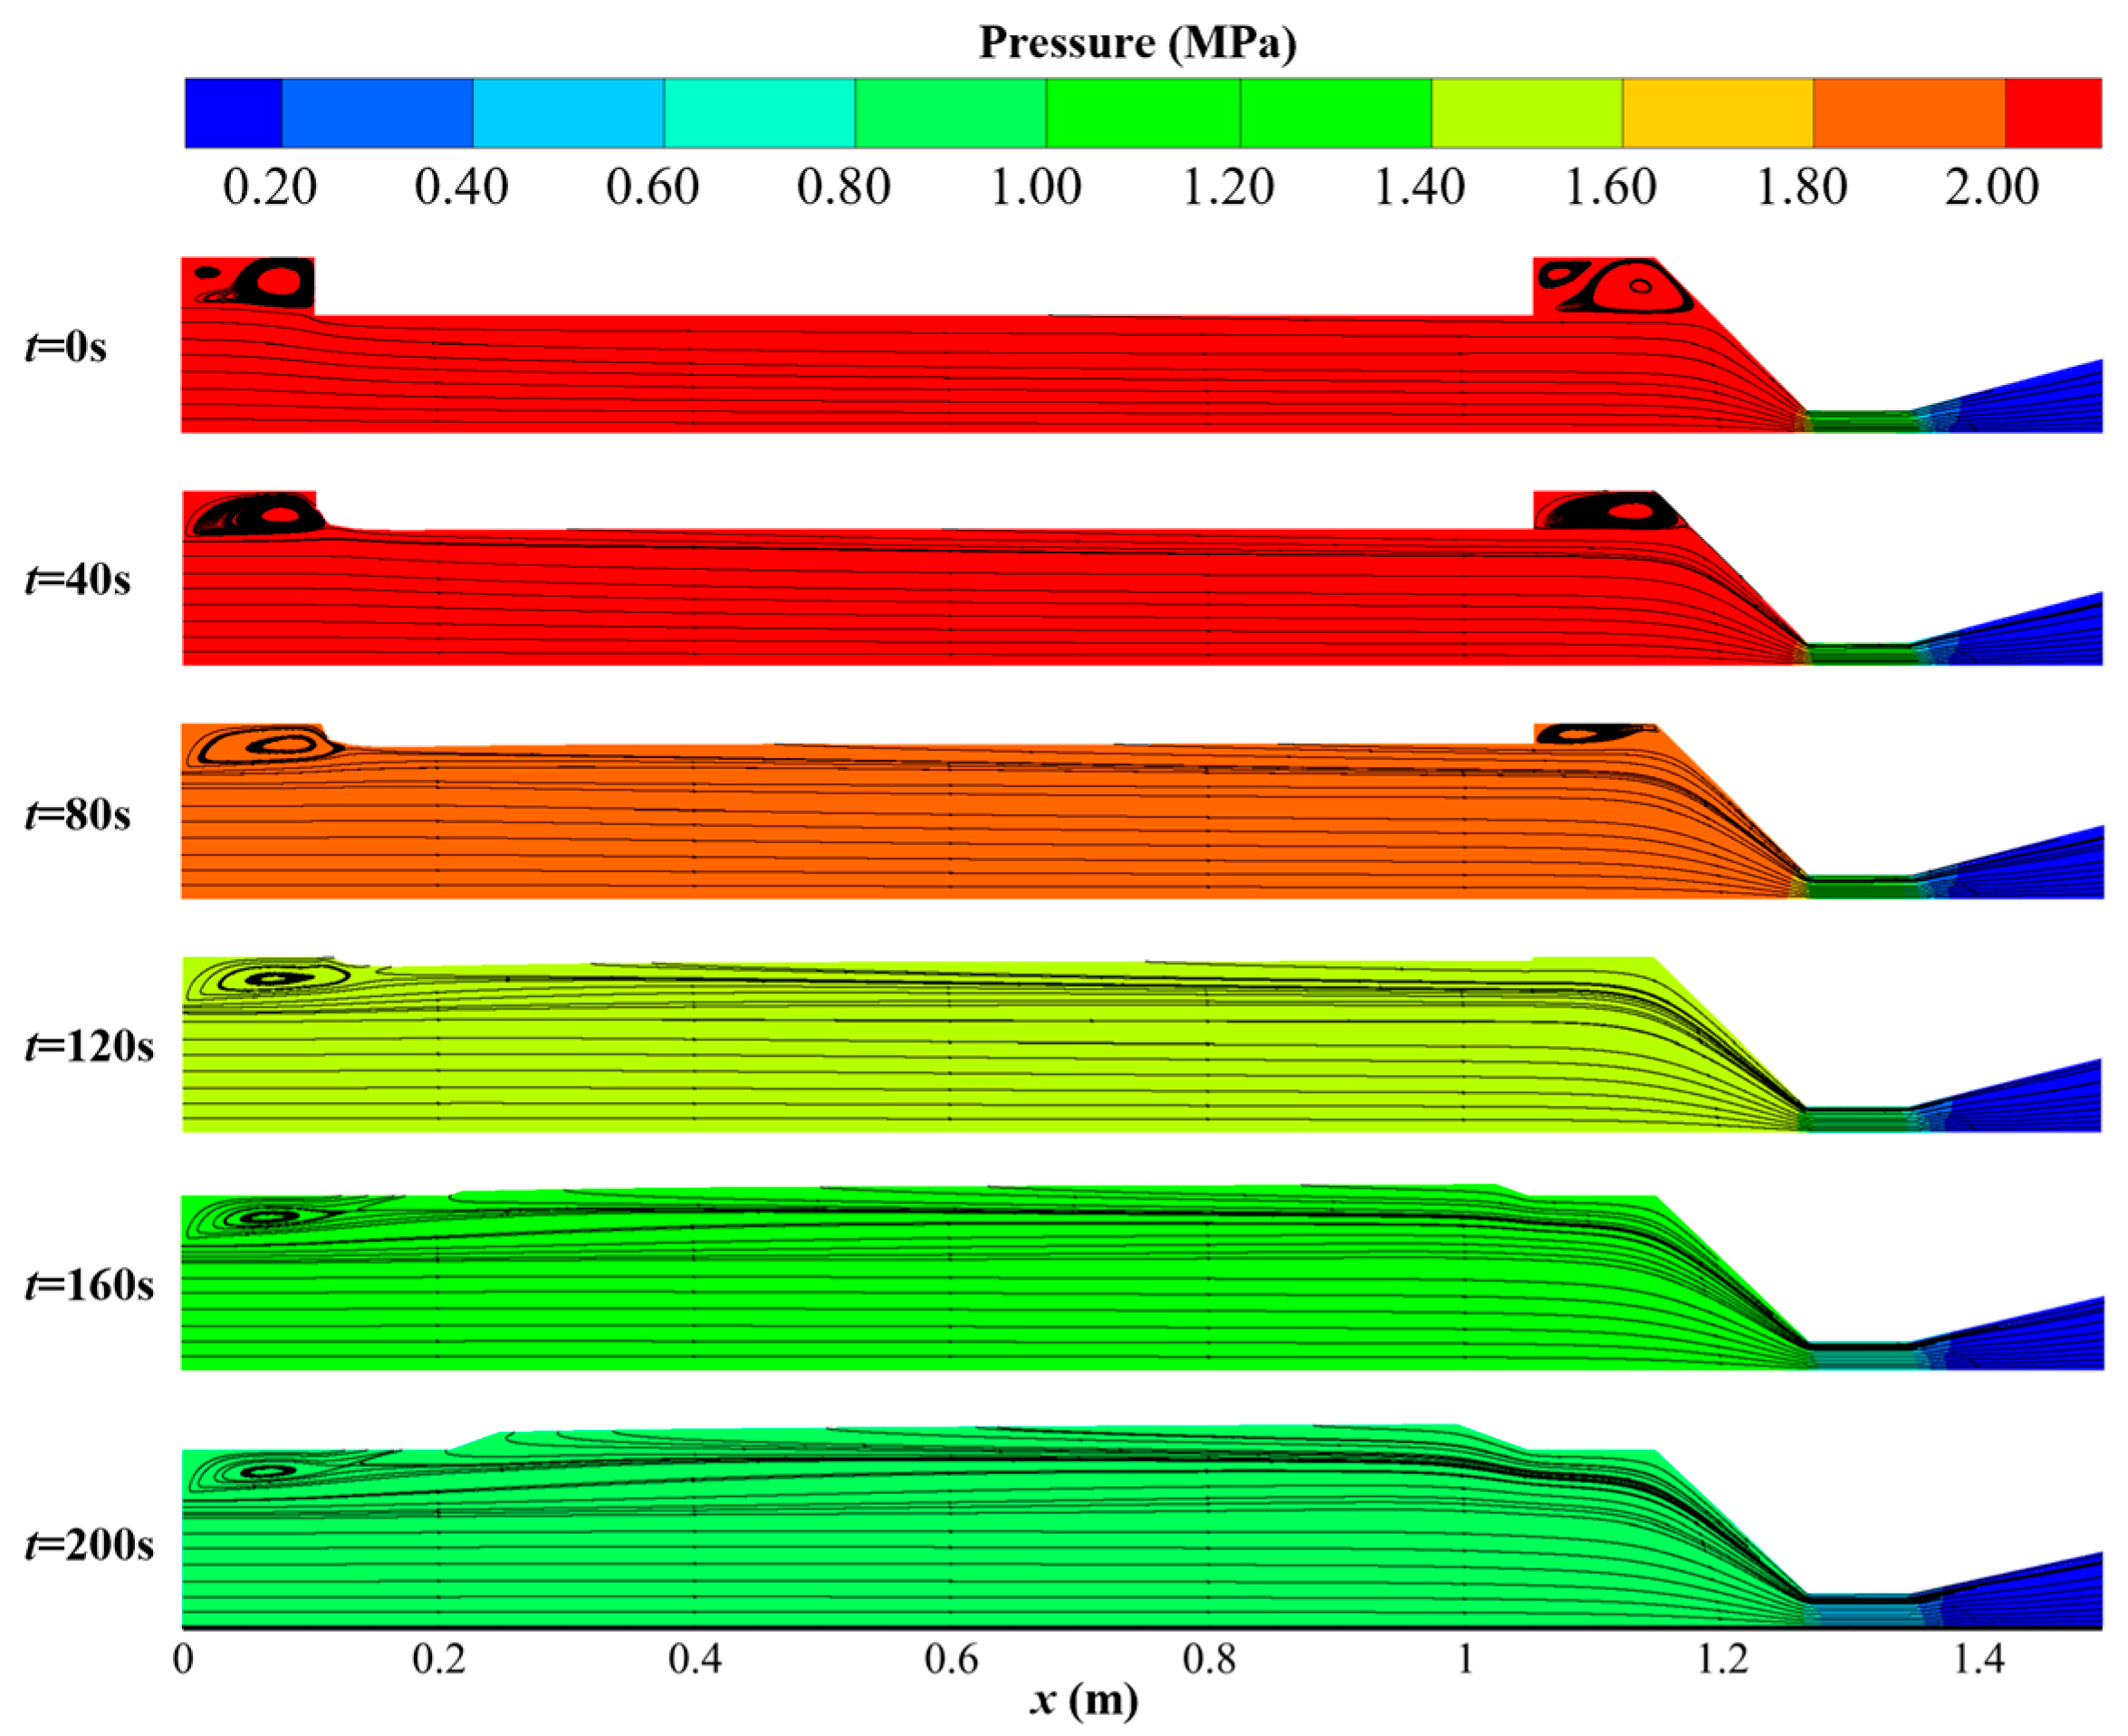
The pressure and streamlined distribution of the flow field in the 200 s long-duration simulation of the hybrid rocket motor is shown in Figure 20. The combustion chamber pressure gradually decreased with working time, and there was no flow separation at the nozzle exit during the operation. It can be observed that a vortex was consistently present in the pre-chamber during the operation, promoting thorough mixing and combustion of oxidizer and fuel, leading to a relatively high gas temperature in the pre-chamber. The variation range of the combustion chamber pressure was approximately 2.2–0.9 MPa, which was consistent with the experimental data. After the 200 s long-duration simulation, the computed grid near the burning surface and nozzle throat is shown in Figure 21. The boundary layer grid near the burning surface consistently maintained a small thickness (approximately 0.01 mm), consistent with the initial simulation, ensuring the accuracy of boundary layer calculations.
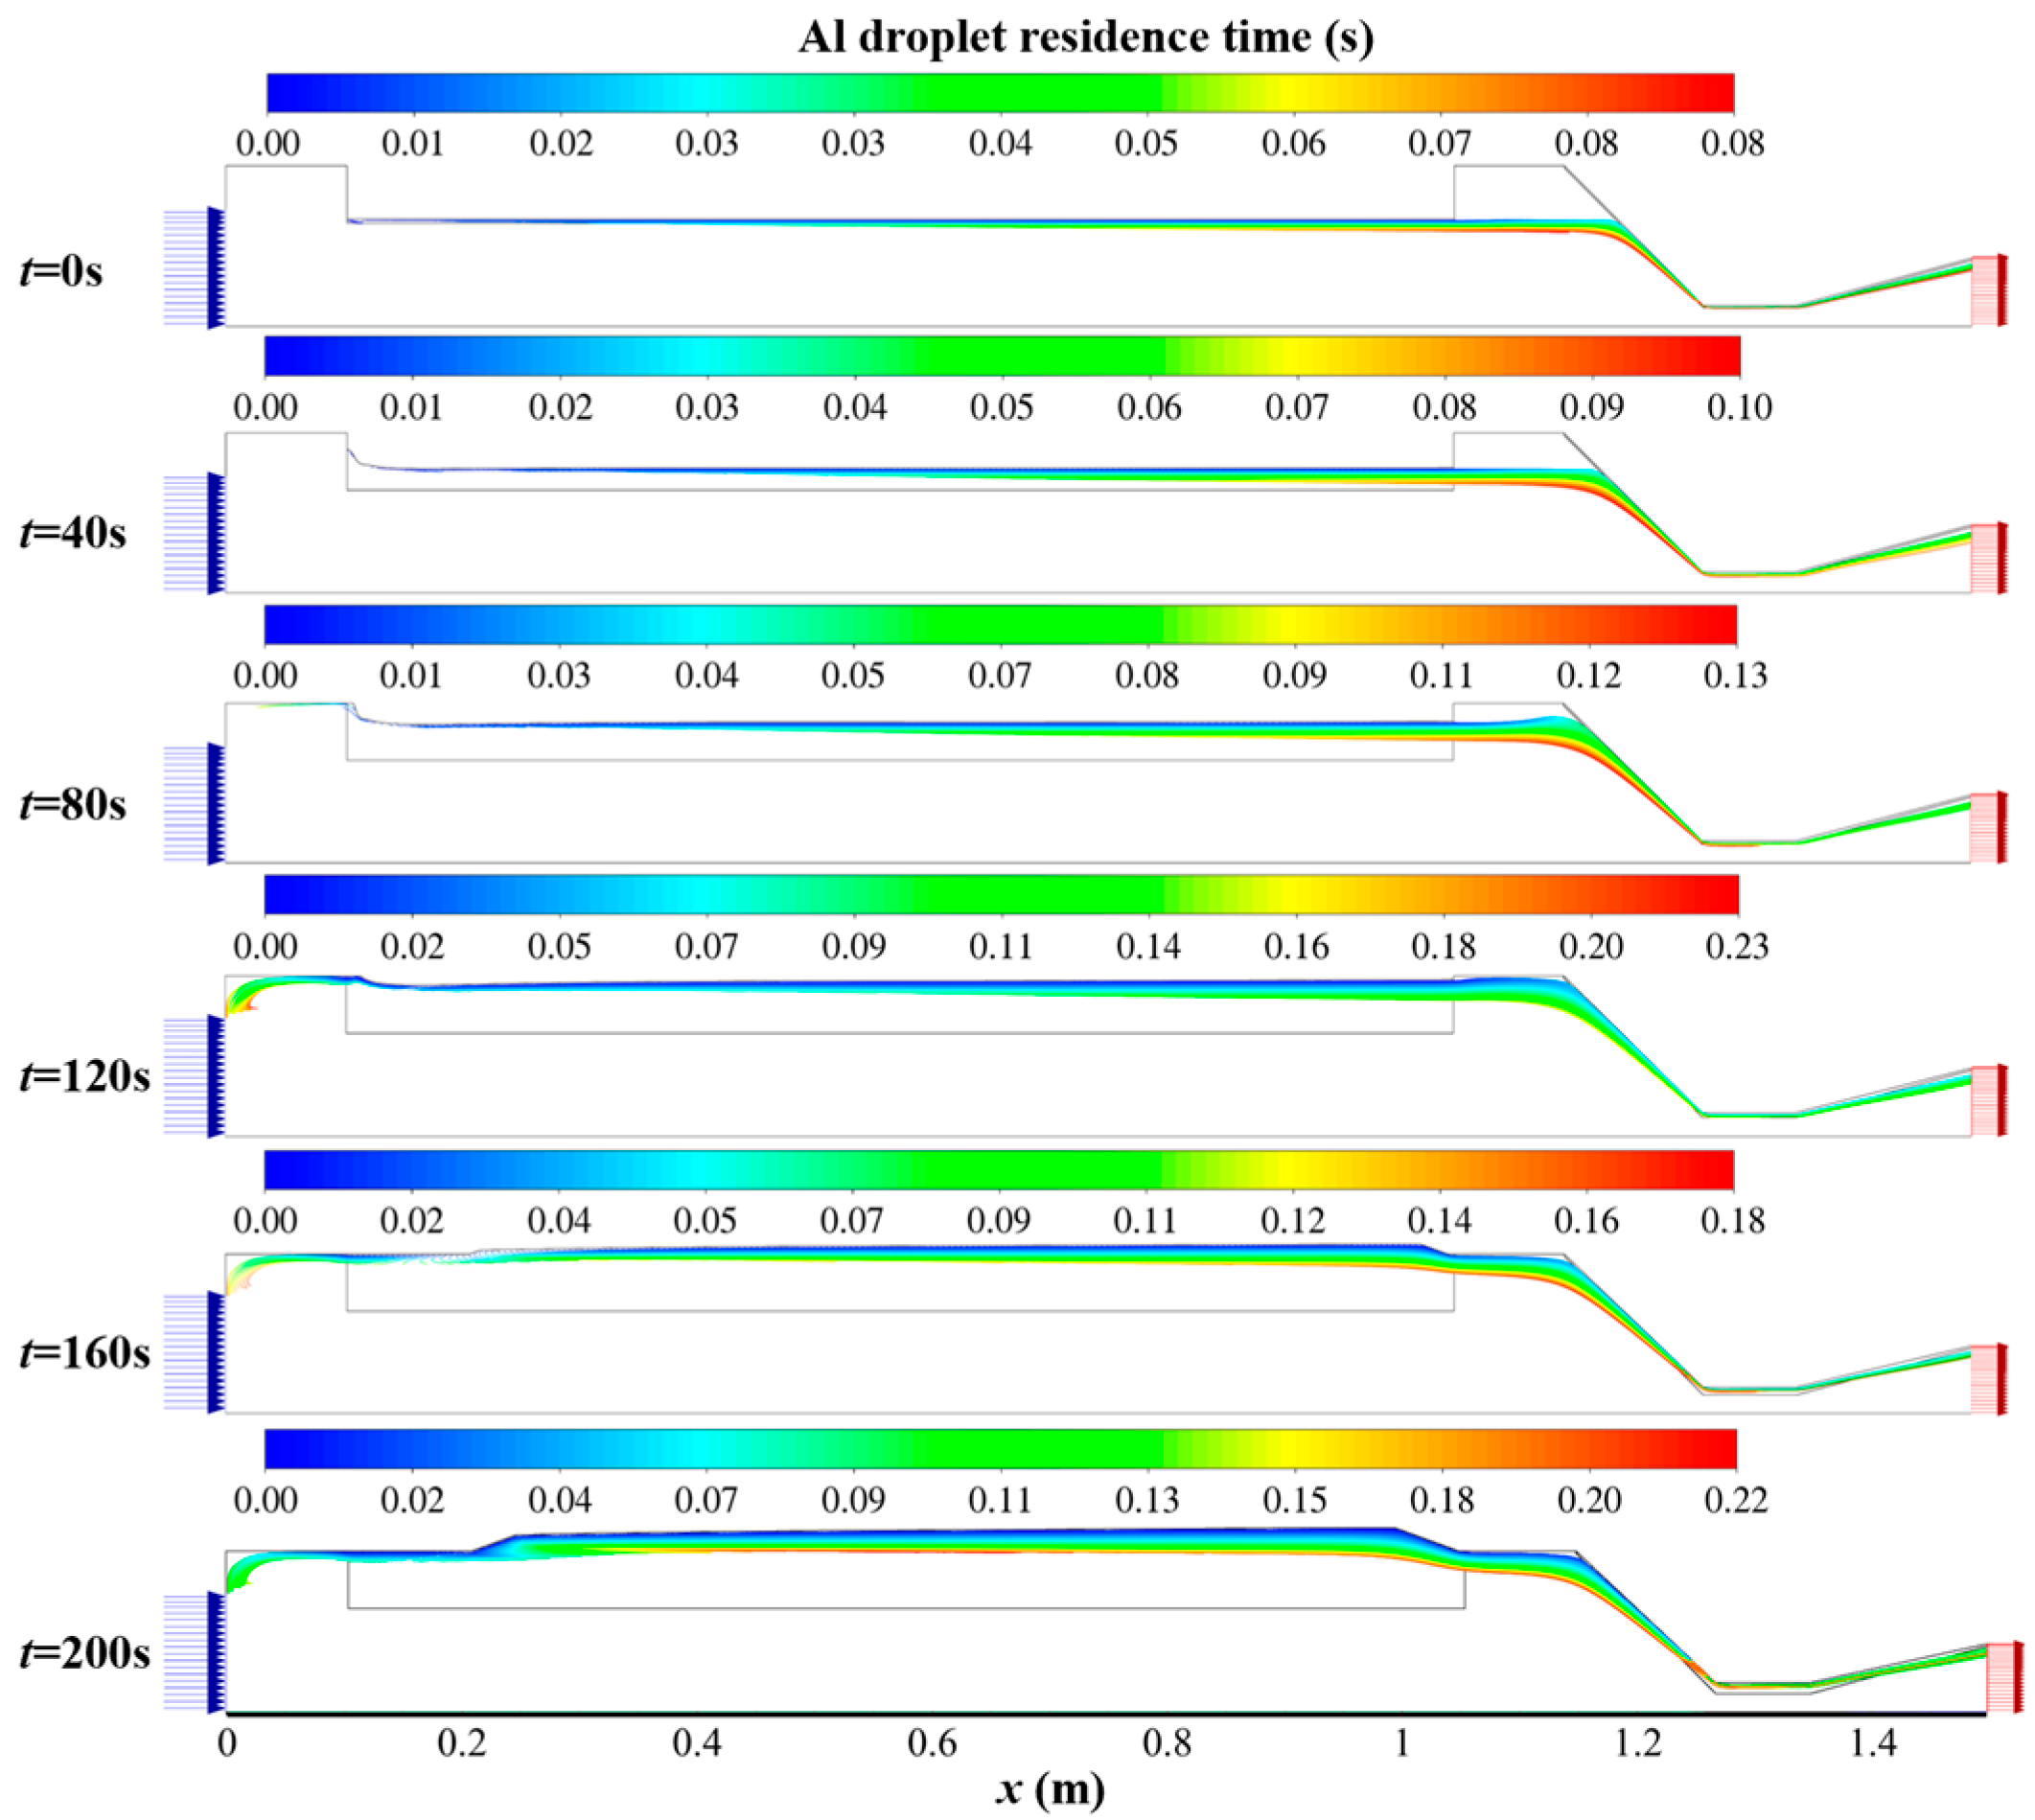
The distribution of aluminum particle residence time during the operating process is shown in Figure 22. The particle residence time is defined as the residence time of particles staying in the flow field, and its trajectory is shown in the figure. The particles are generated from the combustion surface and added to the flow field, moving to the corresponding positions in the figure. Some aluminum particles will completely vaporize in the combustion chamber, and their residence time is the time it takes for vaporization; another part of the aluminum particles is not completely vaporized, and their residence time is the time it injects out from the nozzle outlet. The residence time was calculated using the discrete phase model considering the evaporation effect. It can be observed that aluminum droplets find it challenging to completely evaporate inside the combustion chamber, and some particles are expelled from the nozzle exit. Overall, disregarding the condition at 120 s of operation, the longest residence time of aluminum droplets gradually increased from 0.08 s to 0.22 s during the 200 s of operation. The main reasons are twofold: first, the continuous retreat of the burning surface caused the injection position of aluminum droplets to move farther from the nozzle exit. The motion path of Al droplets significantly increased over 200 s. Second, the retreat of the burning surface results in a gradual decrease in the regression rate during the operation. According to Equation (11), the droplet injection velocity decreases with the reduction in the regression rate. Therefore, the longest residence time of droplets gradually increases with the increase in working time.
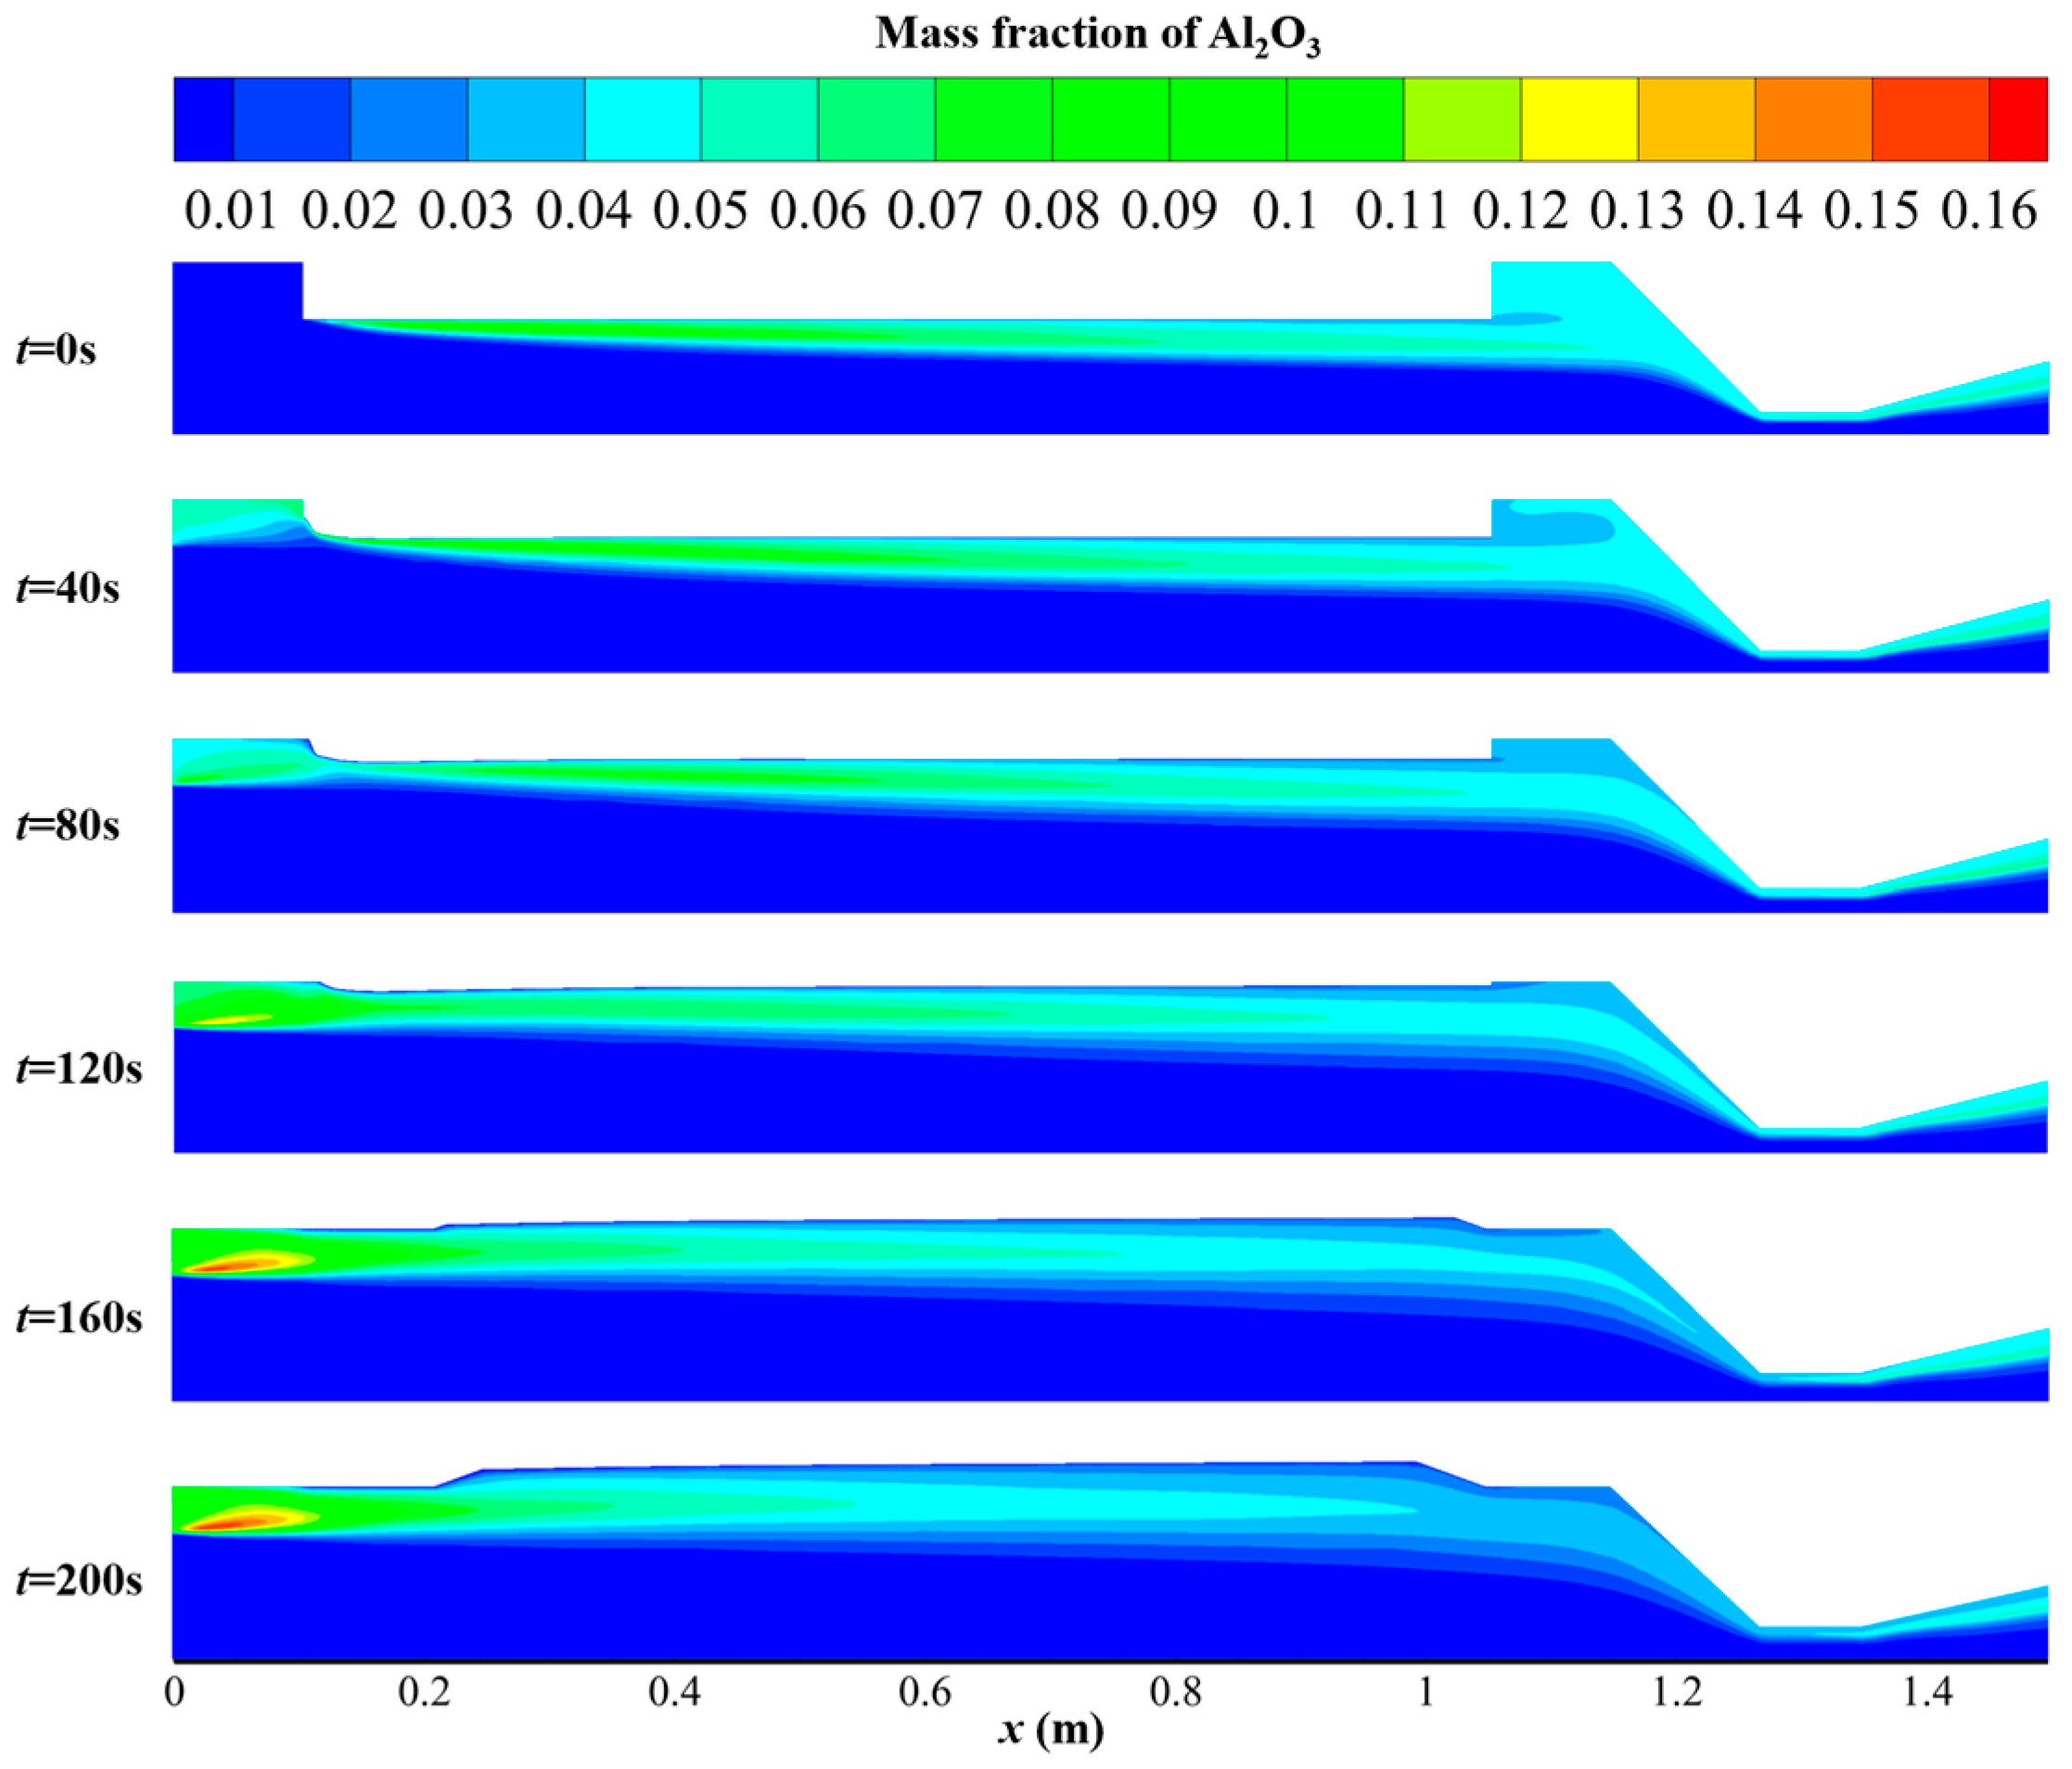
An analysis of the condition at 120 s revealed that the longest residence time of droplets occurred in the pre-chamber, which is different from other moments. By tracking droplets expelled from the nozzle exit, it was found that the longest residence time was approximately 0.15 s at 120 s, following the general trend of increasing residence time with working time. A comparison with the previous flow field structure and temperature distribution indicates that, at 120 s, the diameter difference between the pre-chamber and the grain port was small. Al droplets were more likely to be drawn into the pre-chamber, and the high-temperature region in the pre-chamber was relatively small compared to the condition at 80 s. Consequently, Al droplets were more challenging to evaporate, resulting in the longest residence time of 0.23 s. Further analysis of the mass fraction distribution of Al2O3 during the long-duration simulation is shown in Figure 23. This distribution aligned with the aforementioned flow field temperature distribution and aluminum droplet residence time distribution. In the first 80 s of operation, the evaporated amount of aluminum droplets in the pre-chamber was relatively small, resulting in a lower mass fraction of Al2O3 in the pre-chamber. After 120 s of operation, the evaporated amount of aluminum droplets in the pre-chamber was significant. The combustion reaction between the evaporated aluminum droplets and oxidizer generated Al2O3, leading to a higher mass fraction of Al2O3 in the pre-chamber.
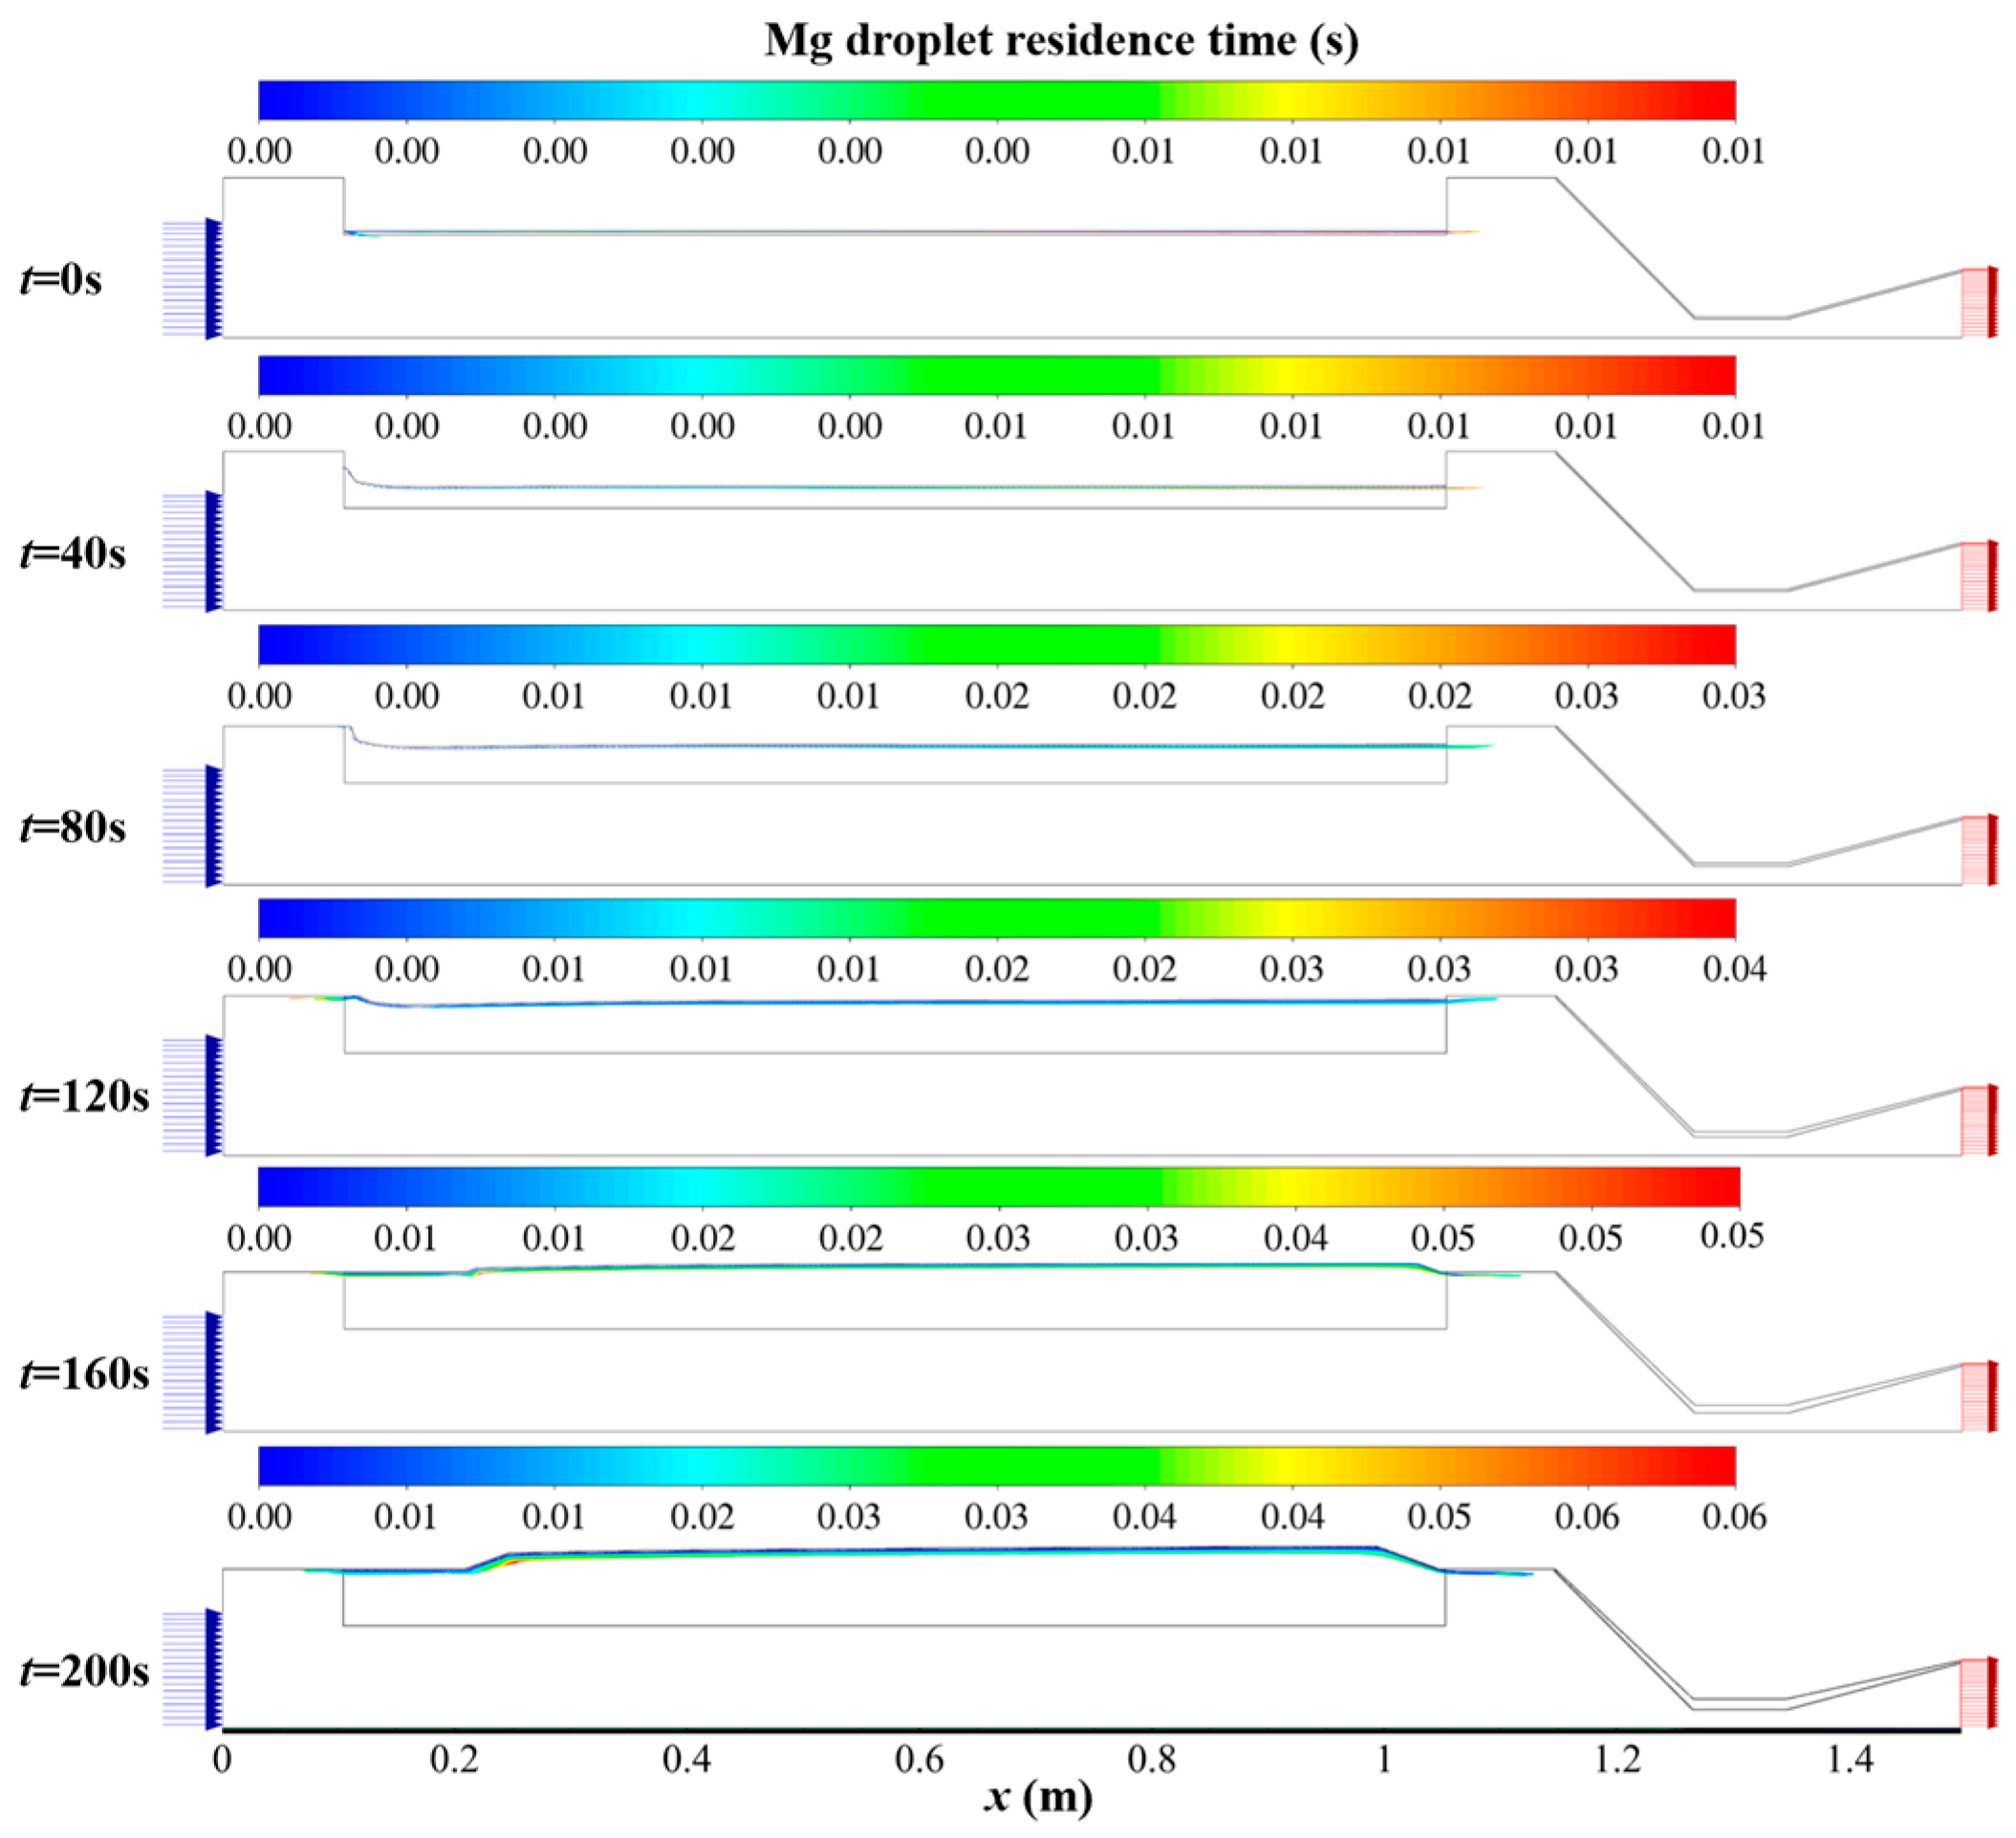
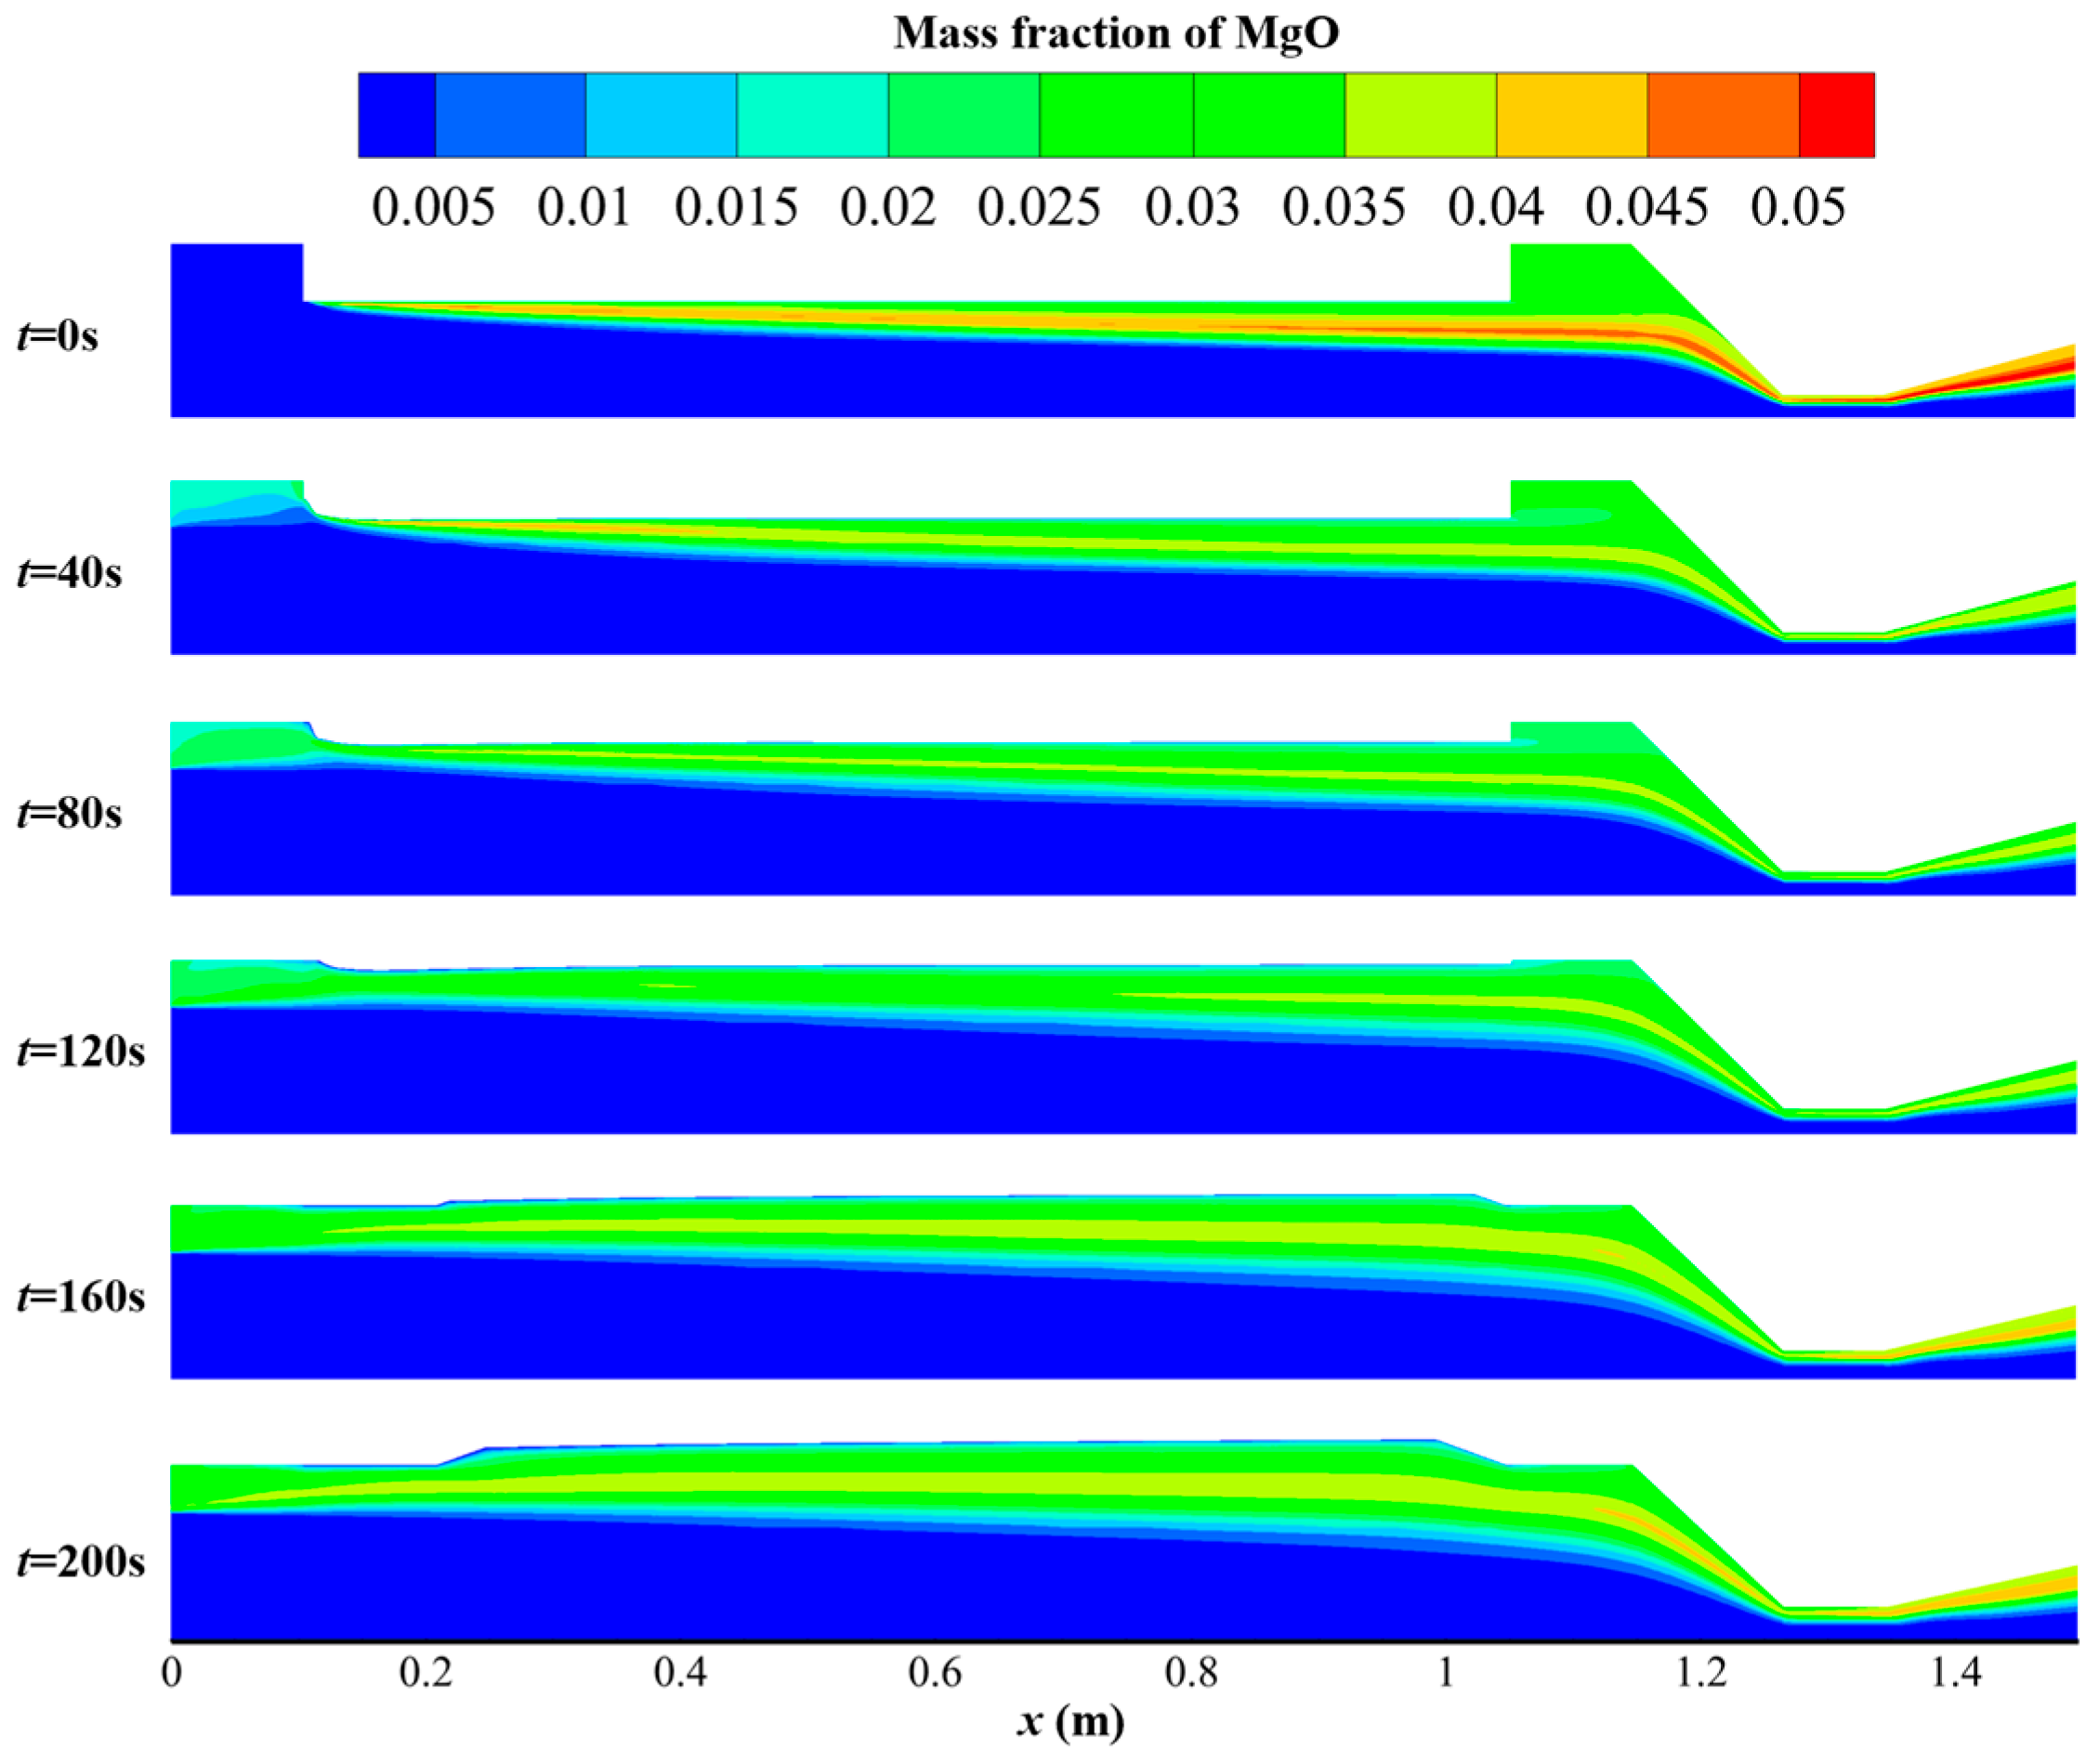
The distribution of magnesium particle residence time during the operating process is shown in Figure 24. It can be observed that Mg droplets completely vaporized in the combustion chamber, which was entirely different from the situation with Al droplets. Analysis revealed that the boiling point of Mg was 1363 K, with a vaporization heat of 127.4 kJ/mol, while the boiling point of Al was 2767 K, with a vaporization heat of 290.8 kJ/mol. Therefore, Mg droplets were more prone to vaporization, resulting in significantly lower residence times in the combustion chamber compared to Al droplets. The longest residence time of Mg droplets was approximately 0.01–0.06 s, increasing with working time over 200 s of operation. There are two main reasons for this trend. First, the regression rate gradually decreased during the working process, and according to Equation (11), the droplet injection velocity decreases with the reduction in the regression rate. This causes Mg droplets to reach the high-temperature region more slowly. Second, the injection position of Mg droplets gradually moved with the retreat of the burning surface during the working process, increasing their distance from the high-temperature flame layer. Therefore, the longest residence time of Mg droplets gradually increased with the extension of working time. Further analysis of the mass fraction distribution of MgO during the long-duration simulation is shown in Figure 25. Since Mg droplets completely vaporize in the combustion chamber during the working process and further undergo combustion with O2 to generate MgO, the mass fraction distribution of MgO in the flow field was essentially consistent with the temperature distribution.
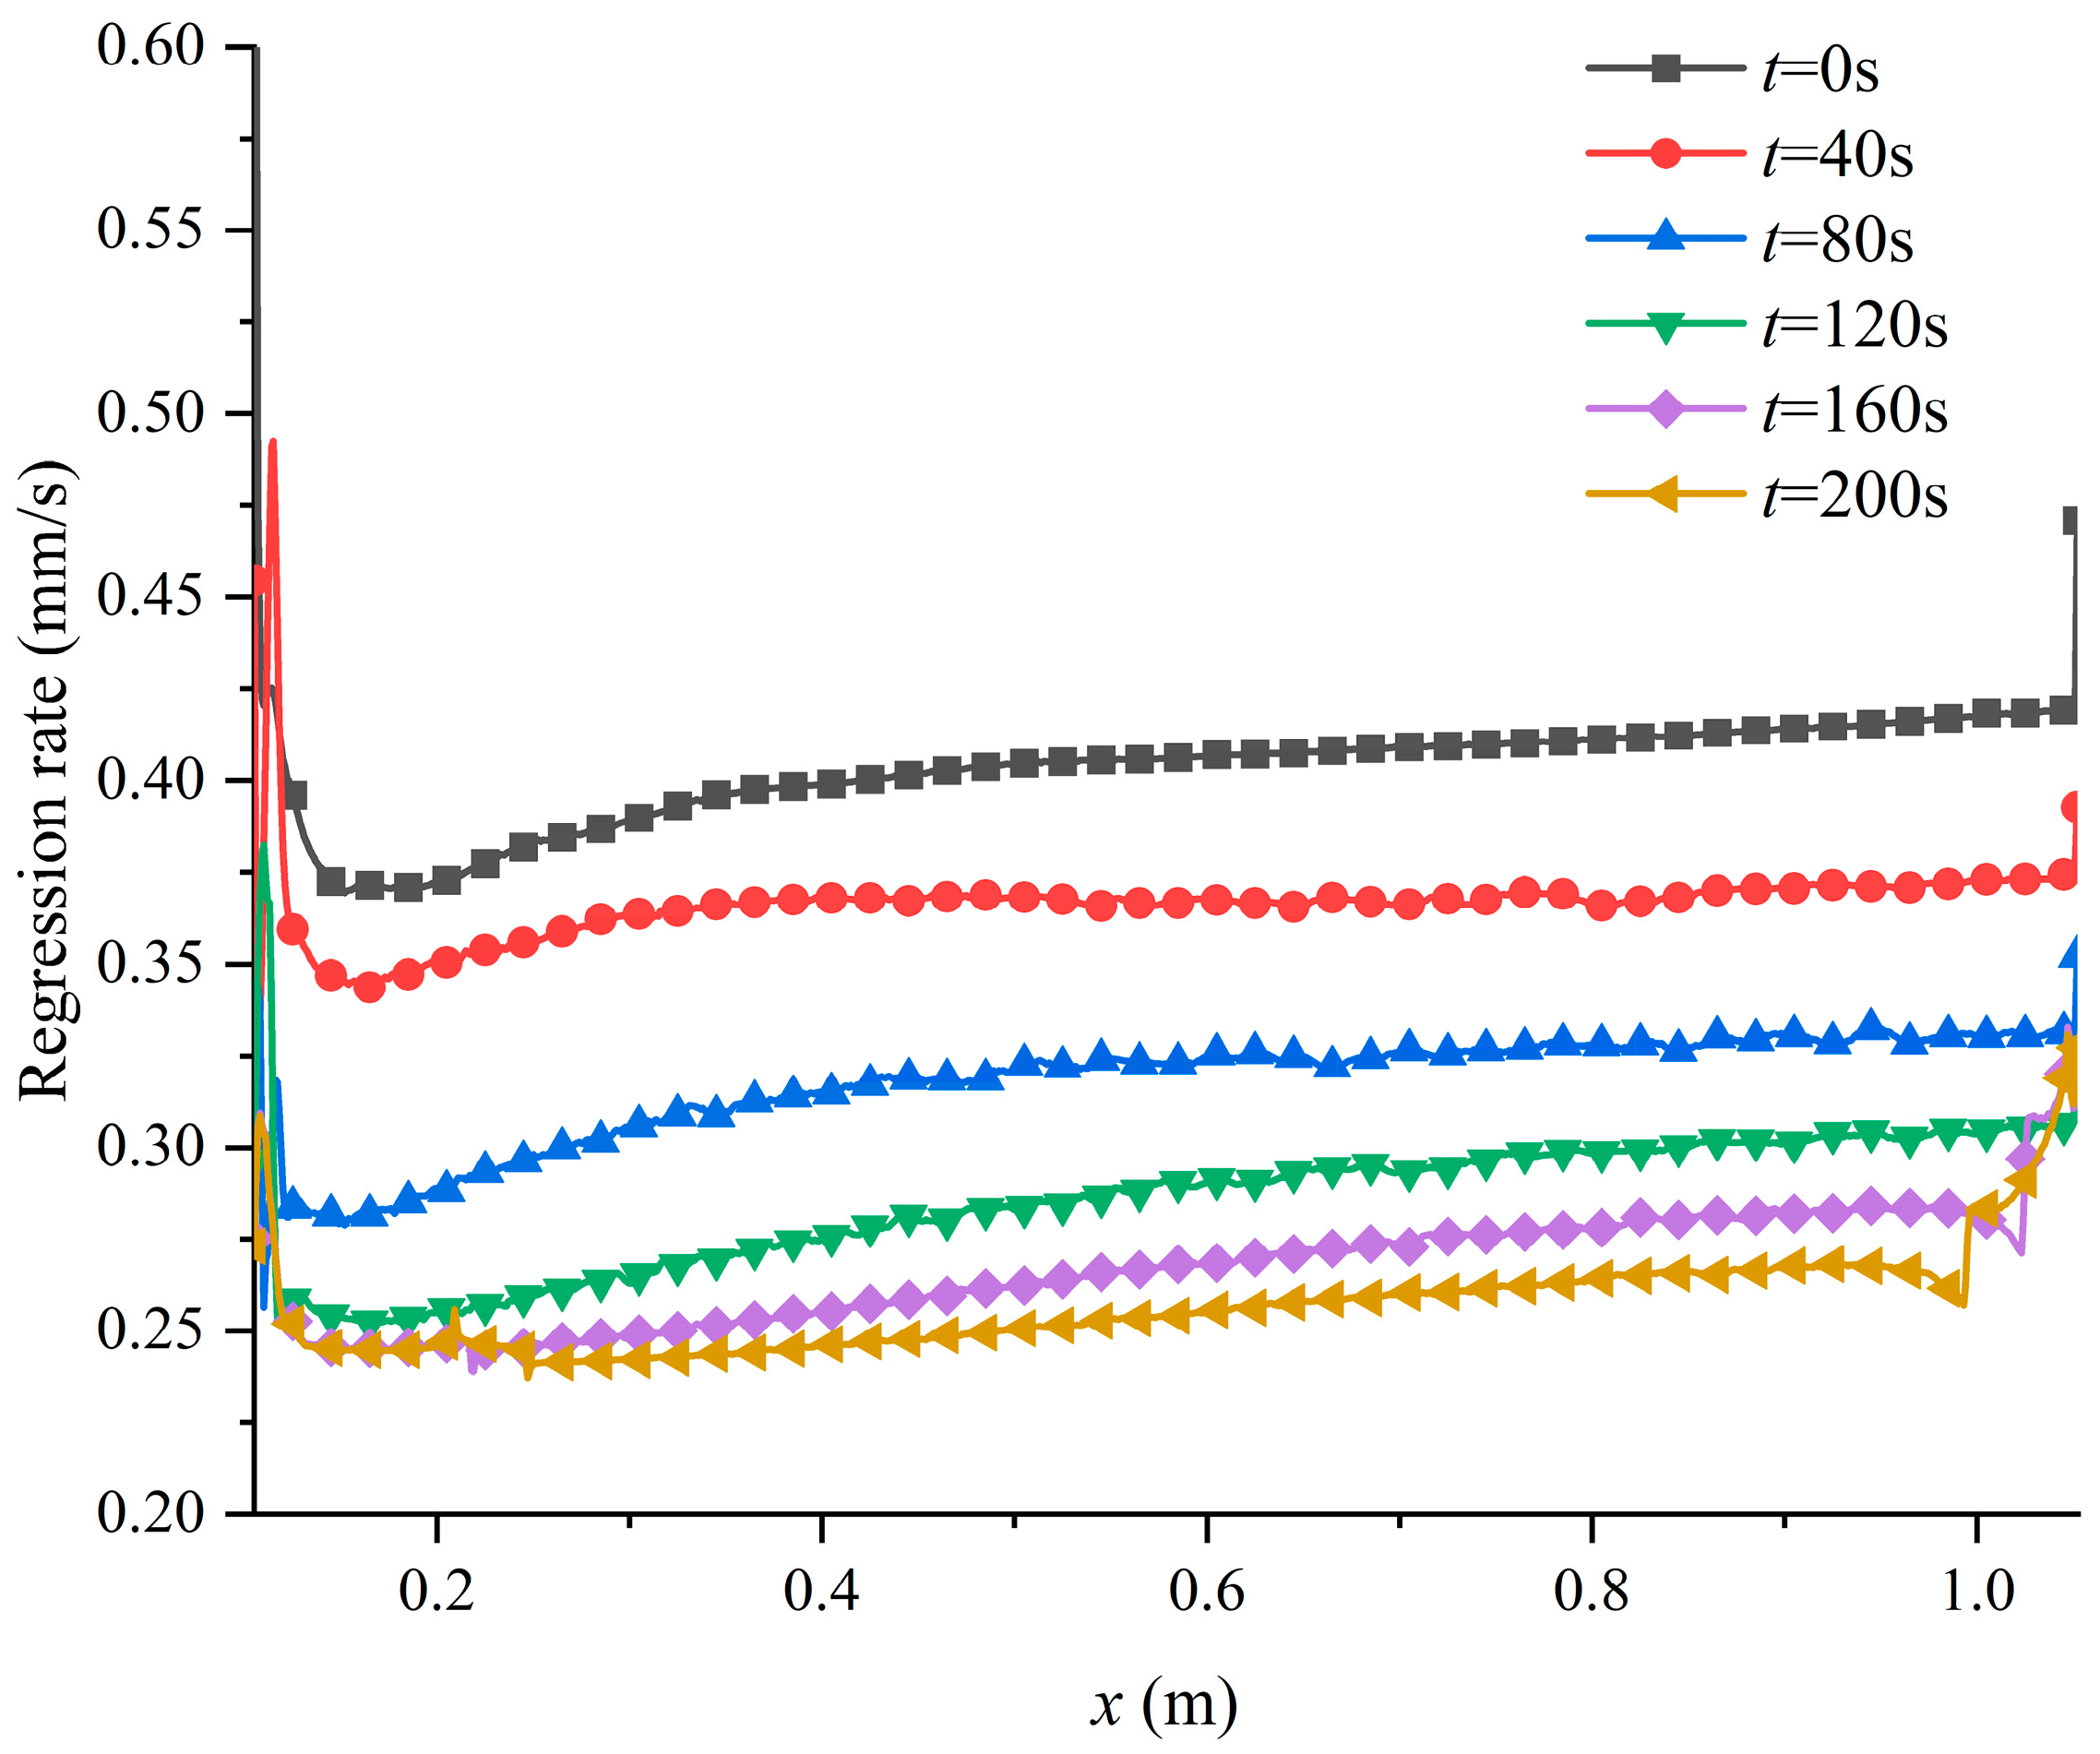
Further analysis of the variation in the combustion surface and regression rate during the 200 s simulation is illustrated in Figure 26 and Figure 27, respectively. It can be observed that the burning surface exhibited good smoothness throughout the working process. It indicates that the dynamic mesh model can avoid the serious deformation of the combustion surface caused by regression rate oscillation and make the combustion surface smoother. Before 120 s of operation, the regression at the front of the grain was obvious. This is primarily due to the relatively thin boundary layer in this region, resulting in more intense heat exchange, which was consistent with the axial distribution pattern of the regression rate shown in Figure 27. As the working time extended further, the burning surface gradually took on a “trapezoidal” shape. During the operational period, the regression rate gradually decreased. The main reason for this is the expansion of the grain port, leading to a decrease in the oxidizer flux and a weakening of convective heat transfer within the channel. Additionally, it is worth noting that there was a peak in the regression rate at the front of the grain. This is mainly attributed to the enhancement of mixing and combustion of oxidizer and fuel in this region due to the presence of vortices. As the overall regression rate continuously decreases, this peak in regression rate also gradually diminishes.

4.5. Performance Parameter Analysis in Long-Term Dynamic Numerical Simulation

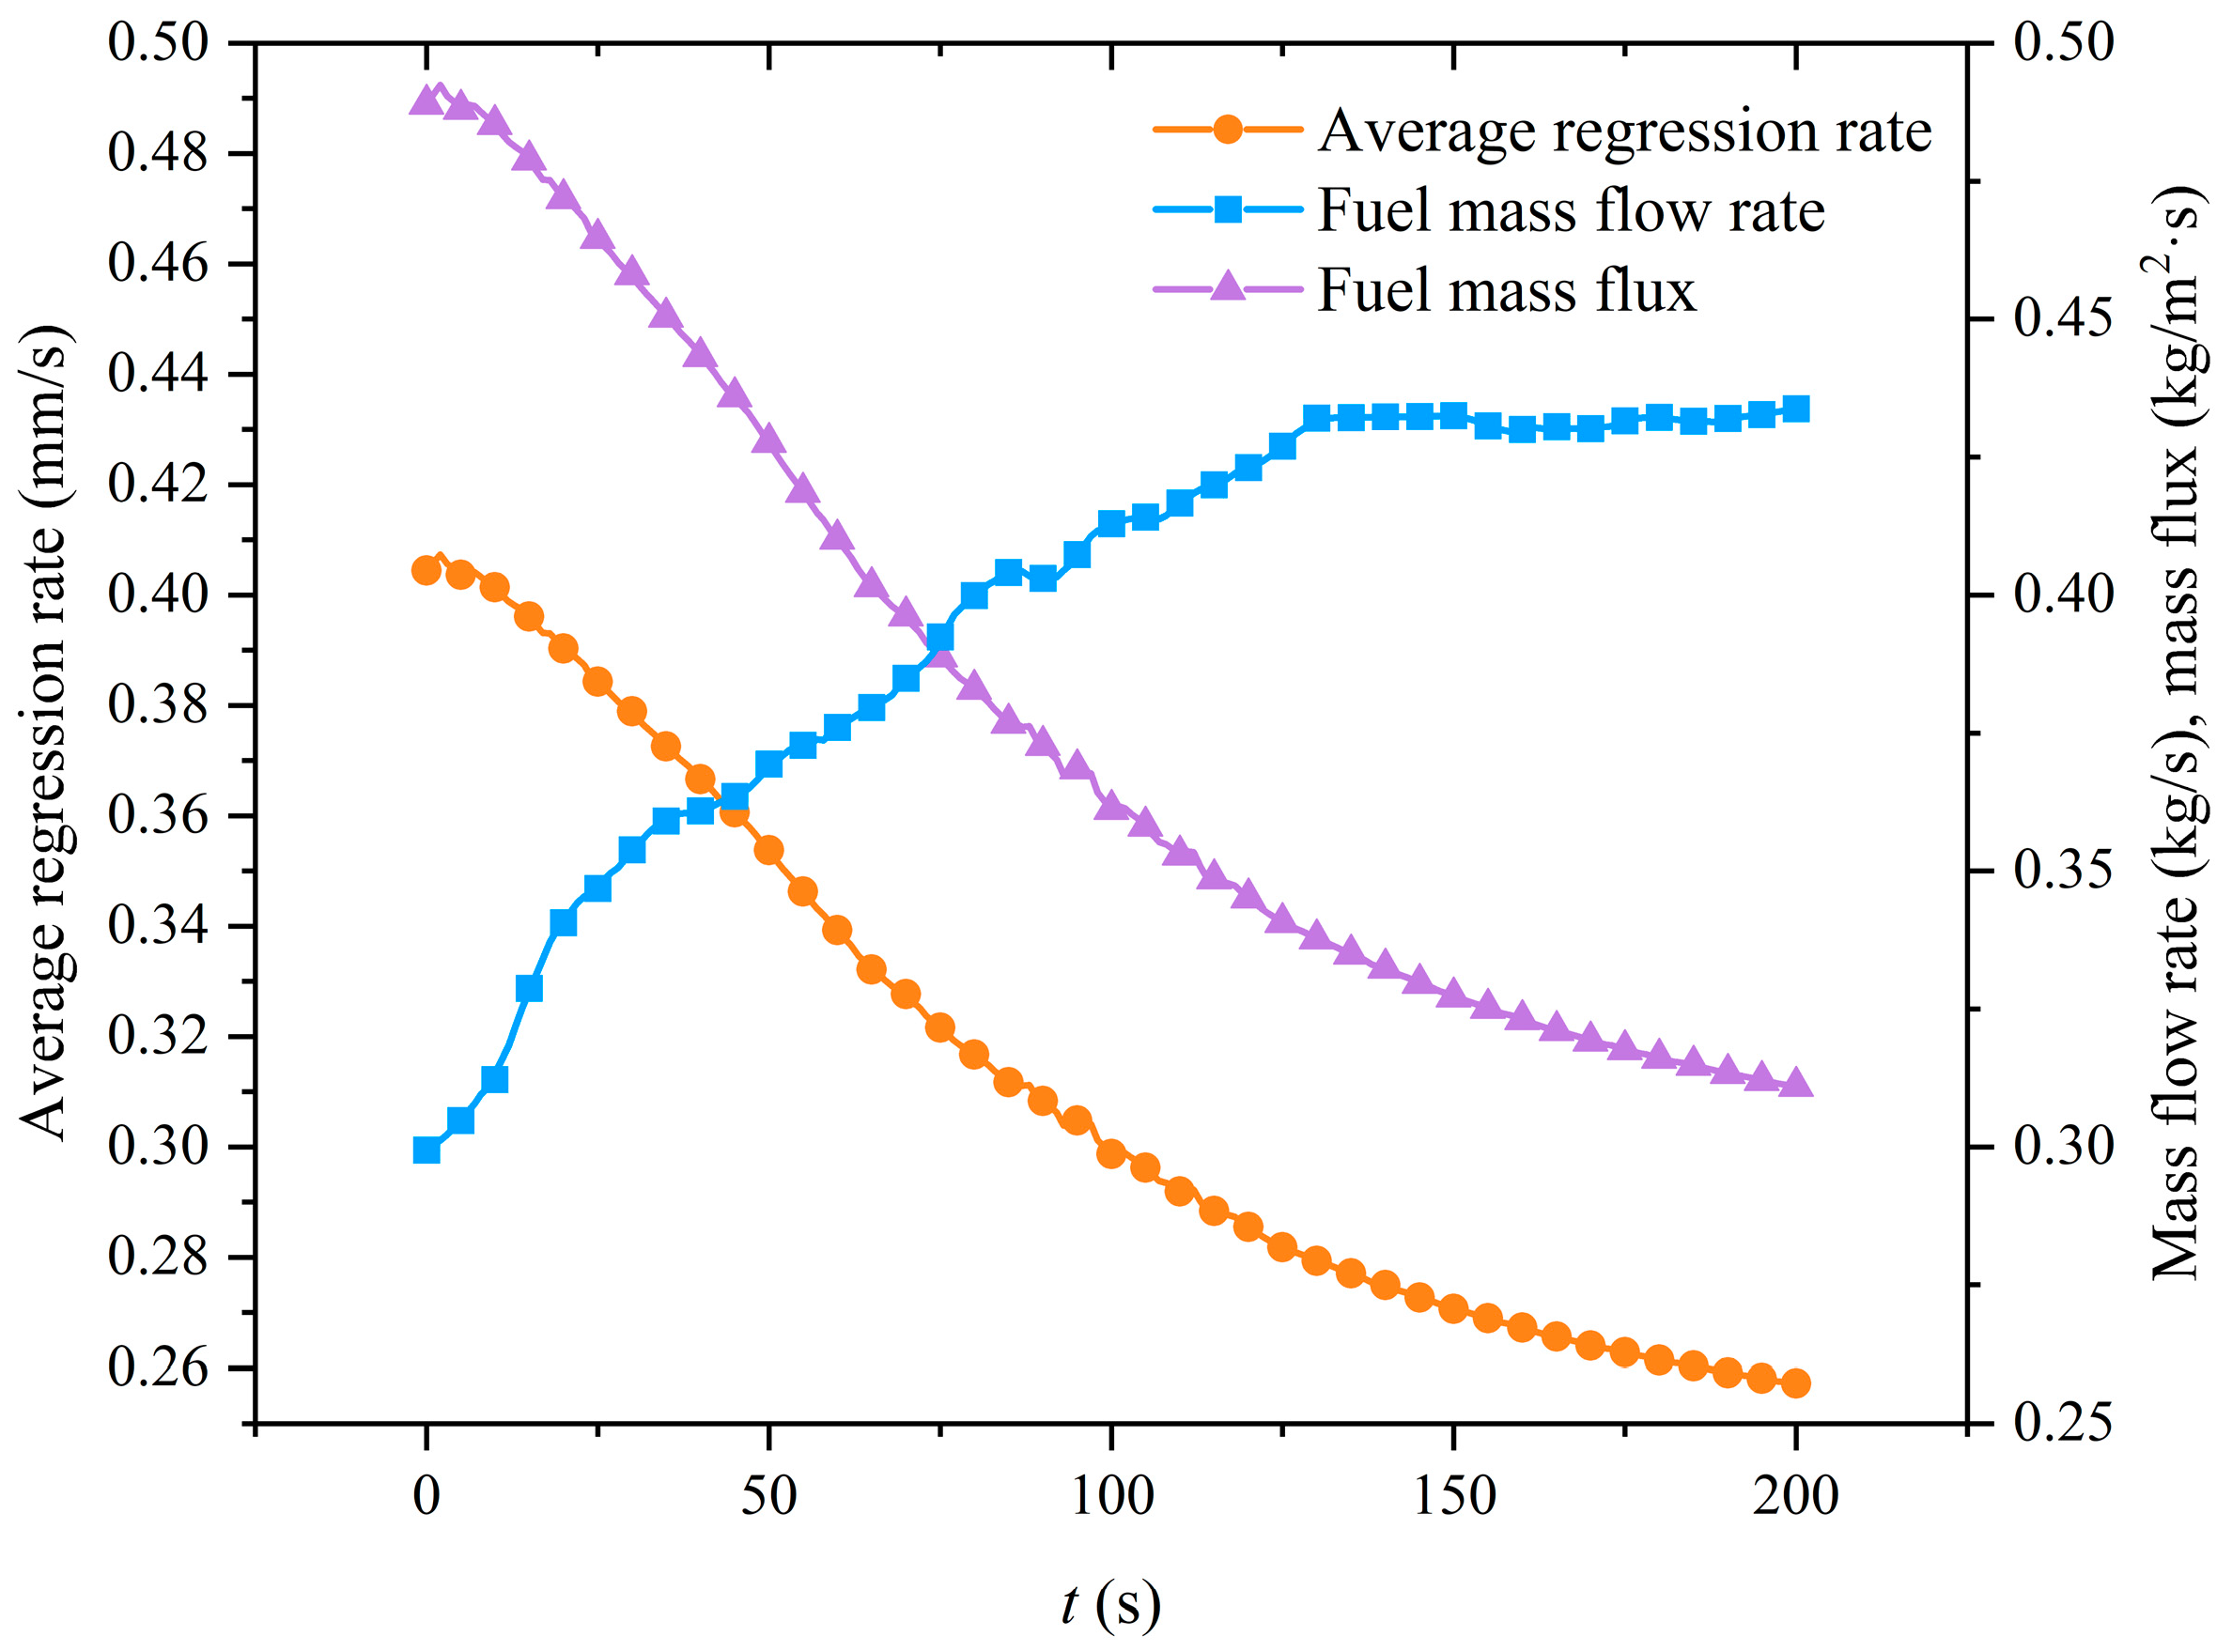
Based on the previous analysis of the flow field, further examination of the performance parameter variations in the 200-s long-term simulation of the solid rocket motor was conducted. The average regression rate and fuel mass flow rate variations over time in the simulation are illustrated in Figure 28. The regression rate and mass flux on the combustion surface correlated positively. Throughout the operational process, the average regression rate gradually decreased with the increasing operation time. Furthermore, the rate of decrease in the average regression rate also diminished over time. It is commonly believed that the regression rate is positively correlated with the oxidizer flux, which represents the mass flow rate of the oxidizer per unit area. Therefore, the main reason for the decrease in the regression rate was a reduction in the oxidizer flow rate. The fuel mass flow rate exhibited a gradual upward trend throughout the entire operational process. The primary reason for this increase is the gradual expansion of the burning surface area over time. Despite the gradual decrease in the regression rate during the operational process, the increased burning surface compensated for this loss and even caused the fuel mass flow rate to increase gradually.
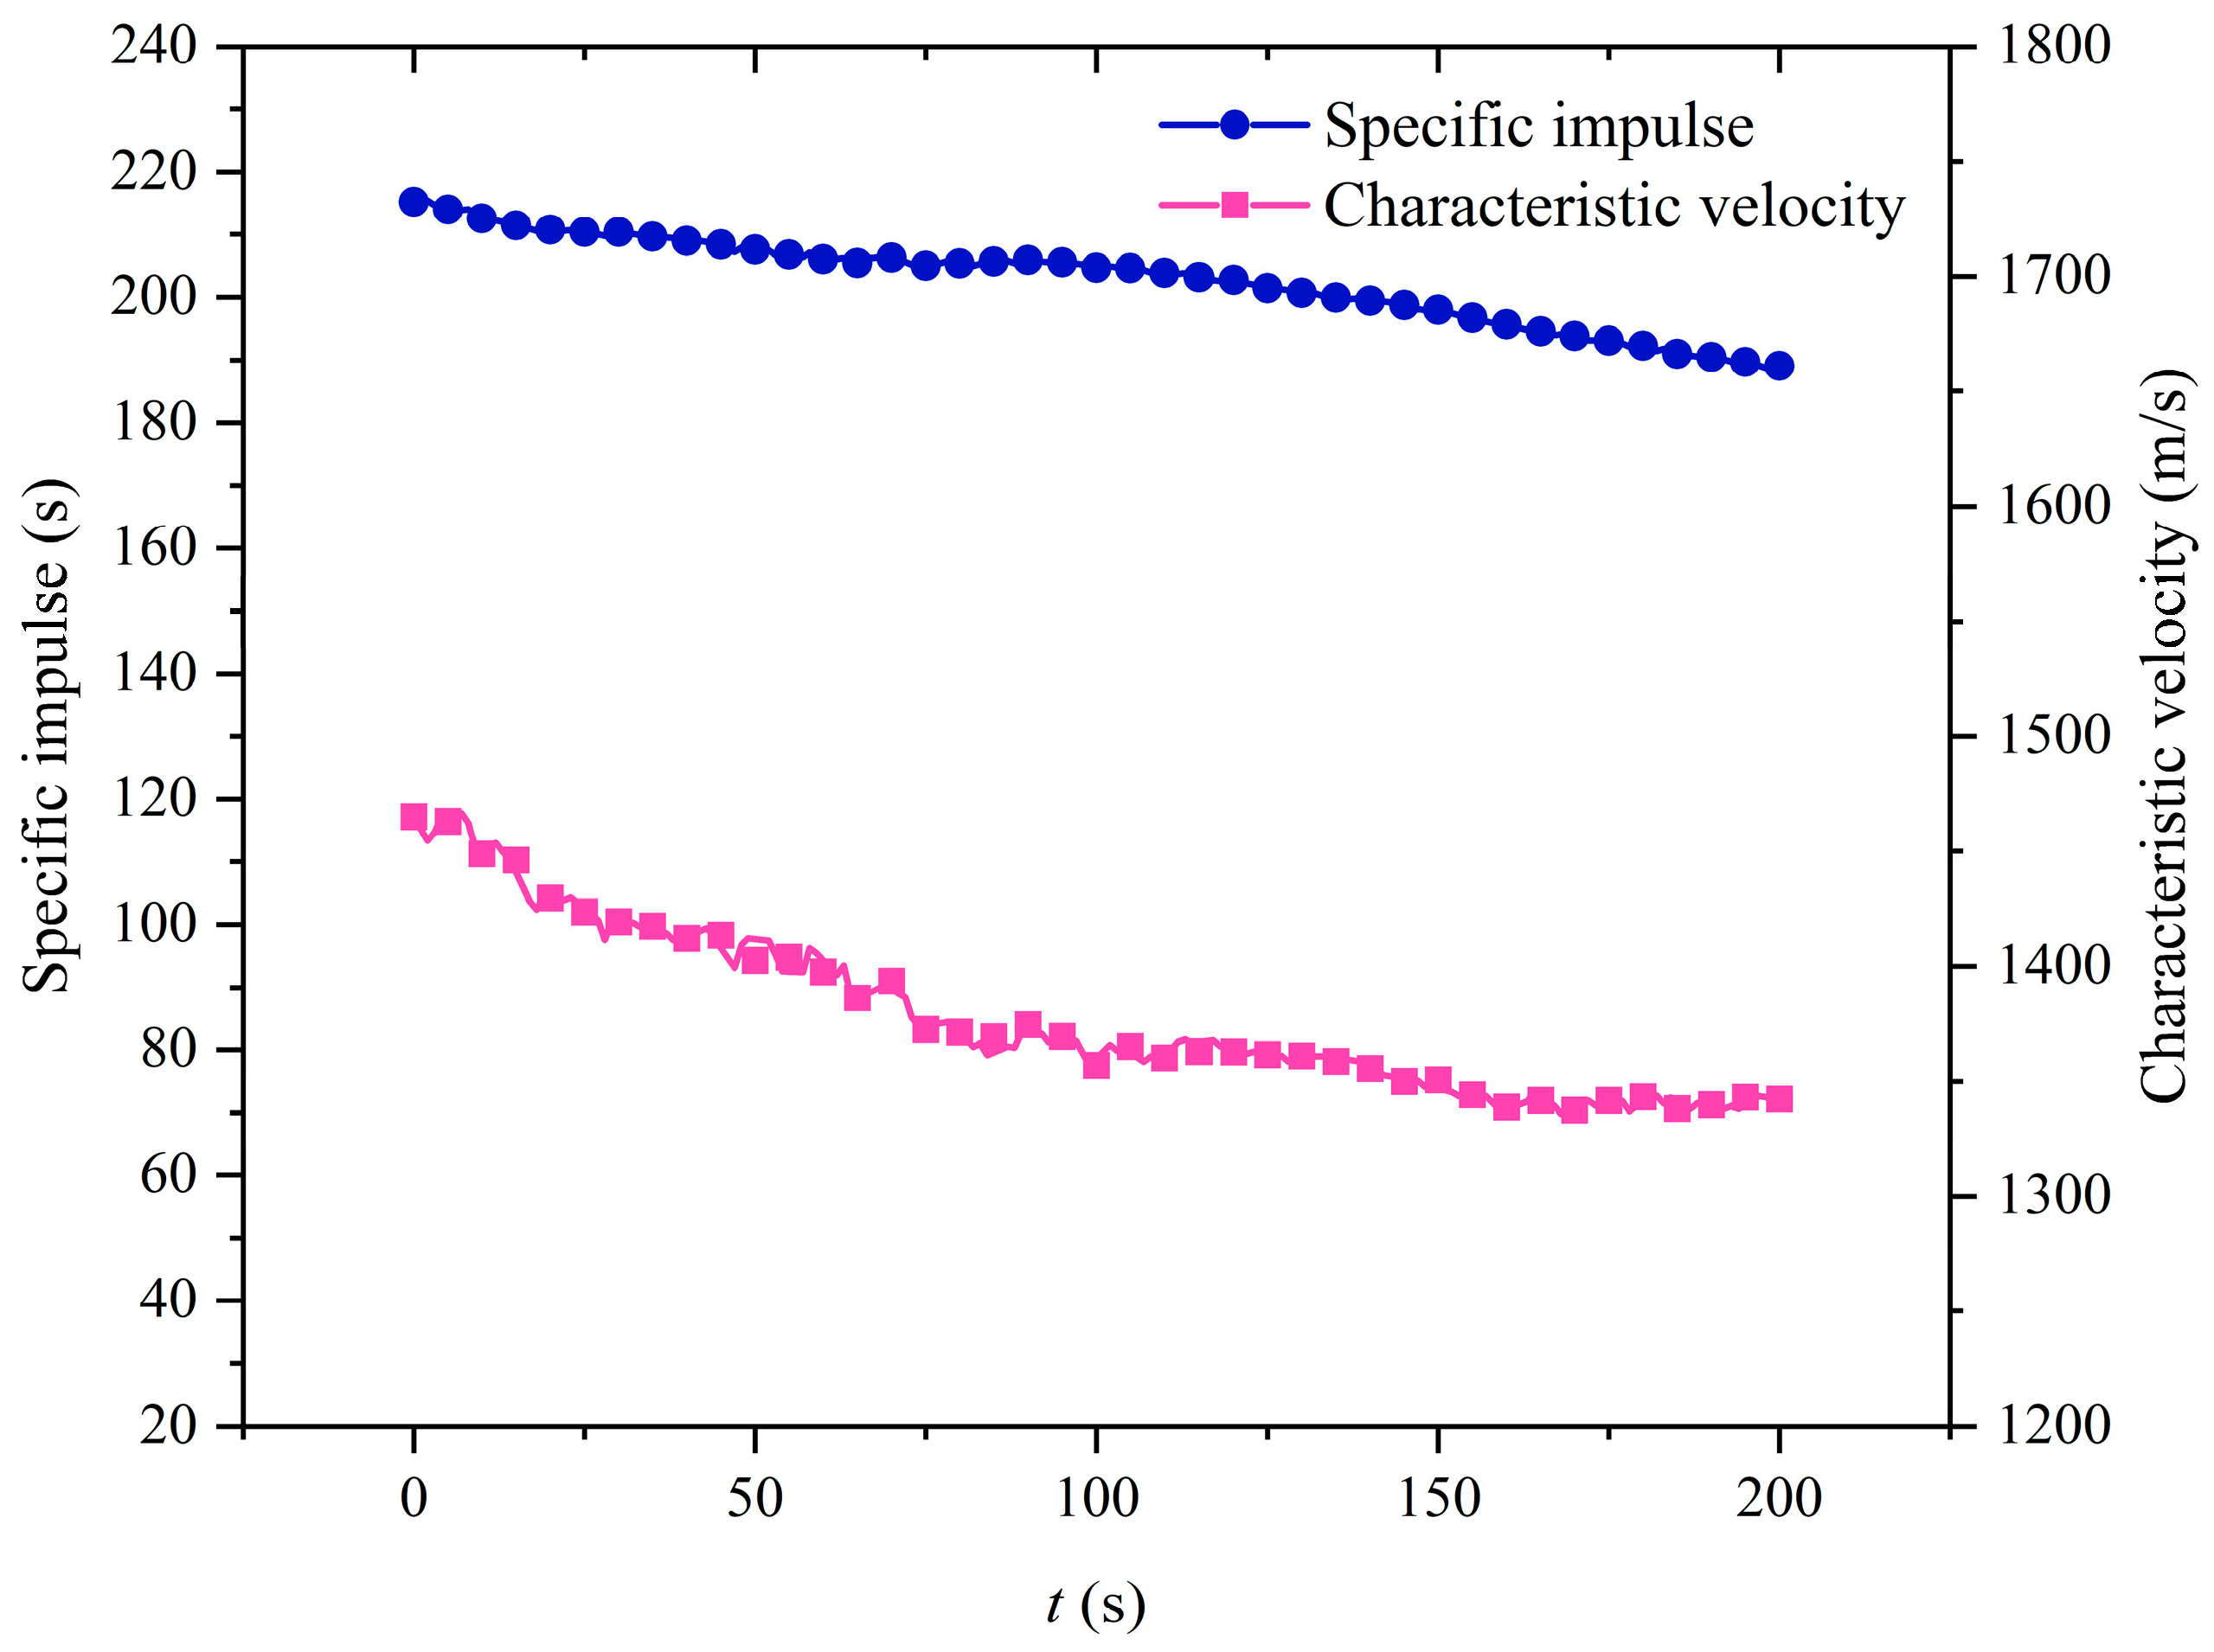
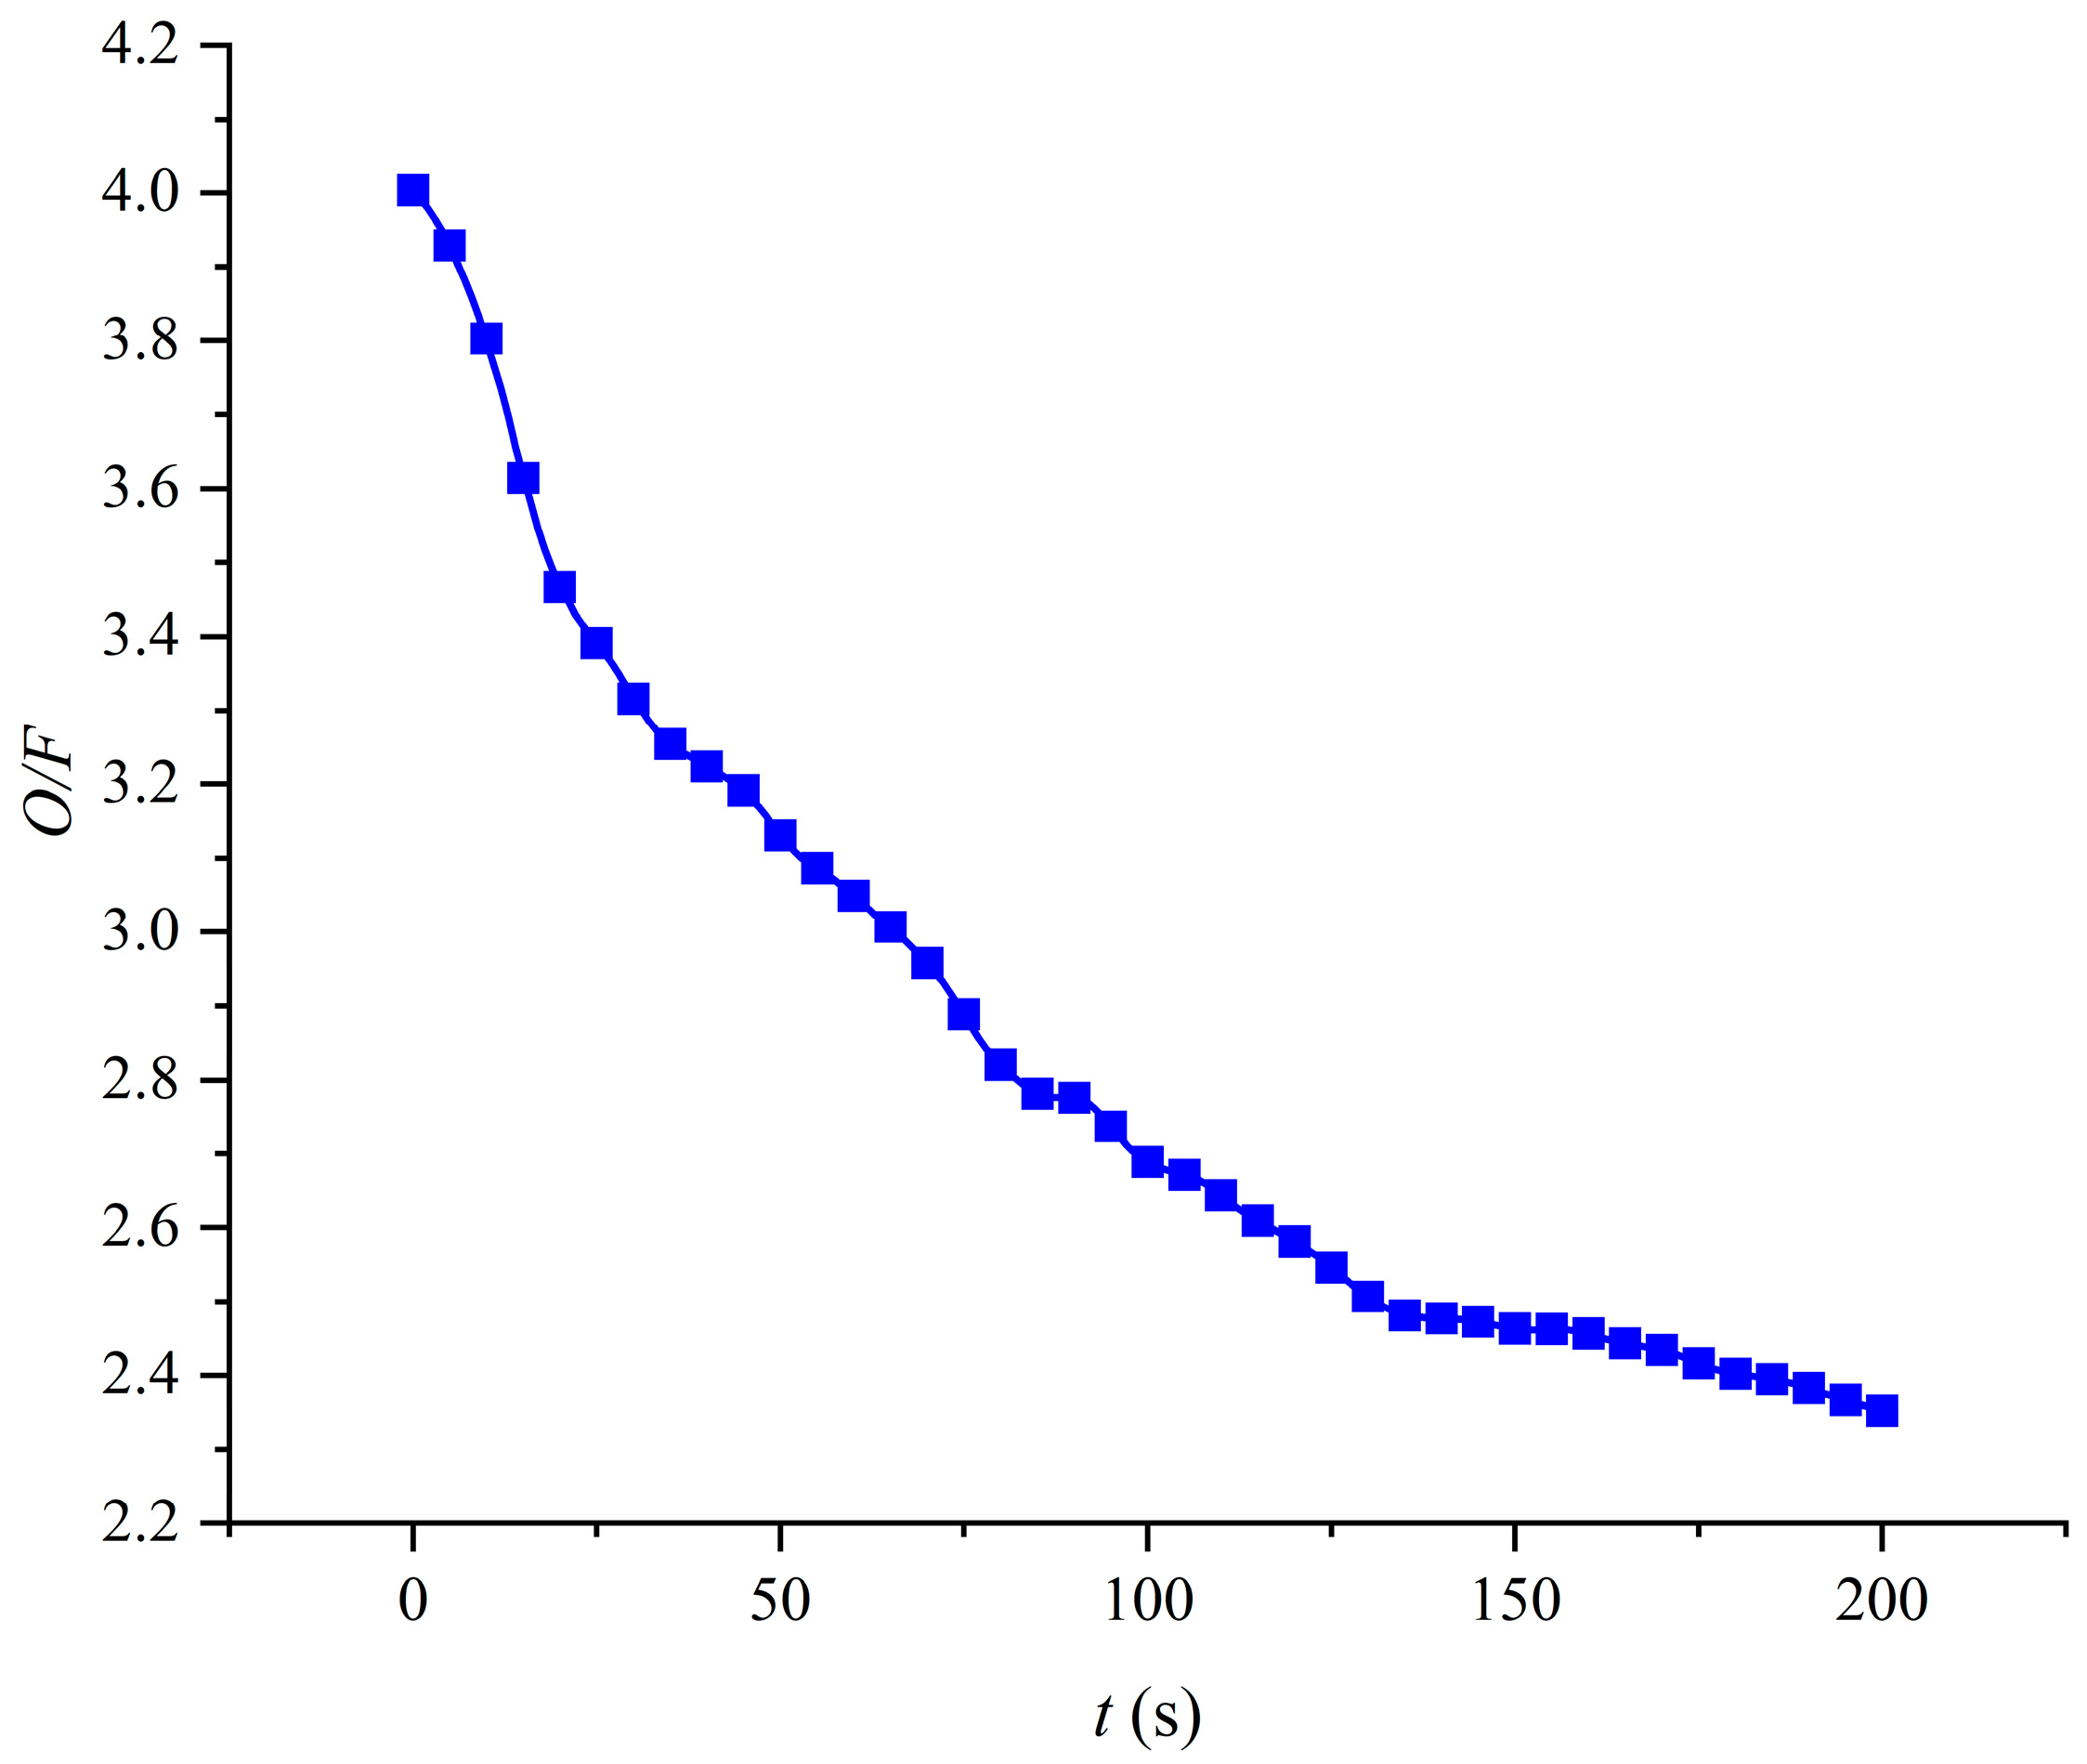
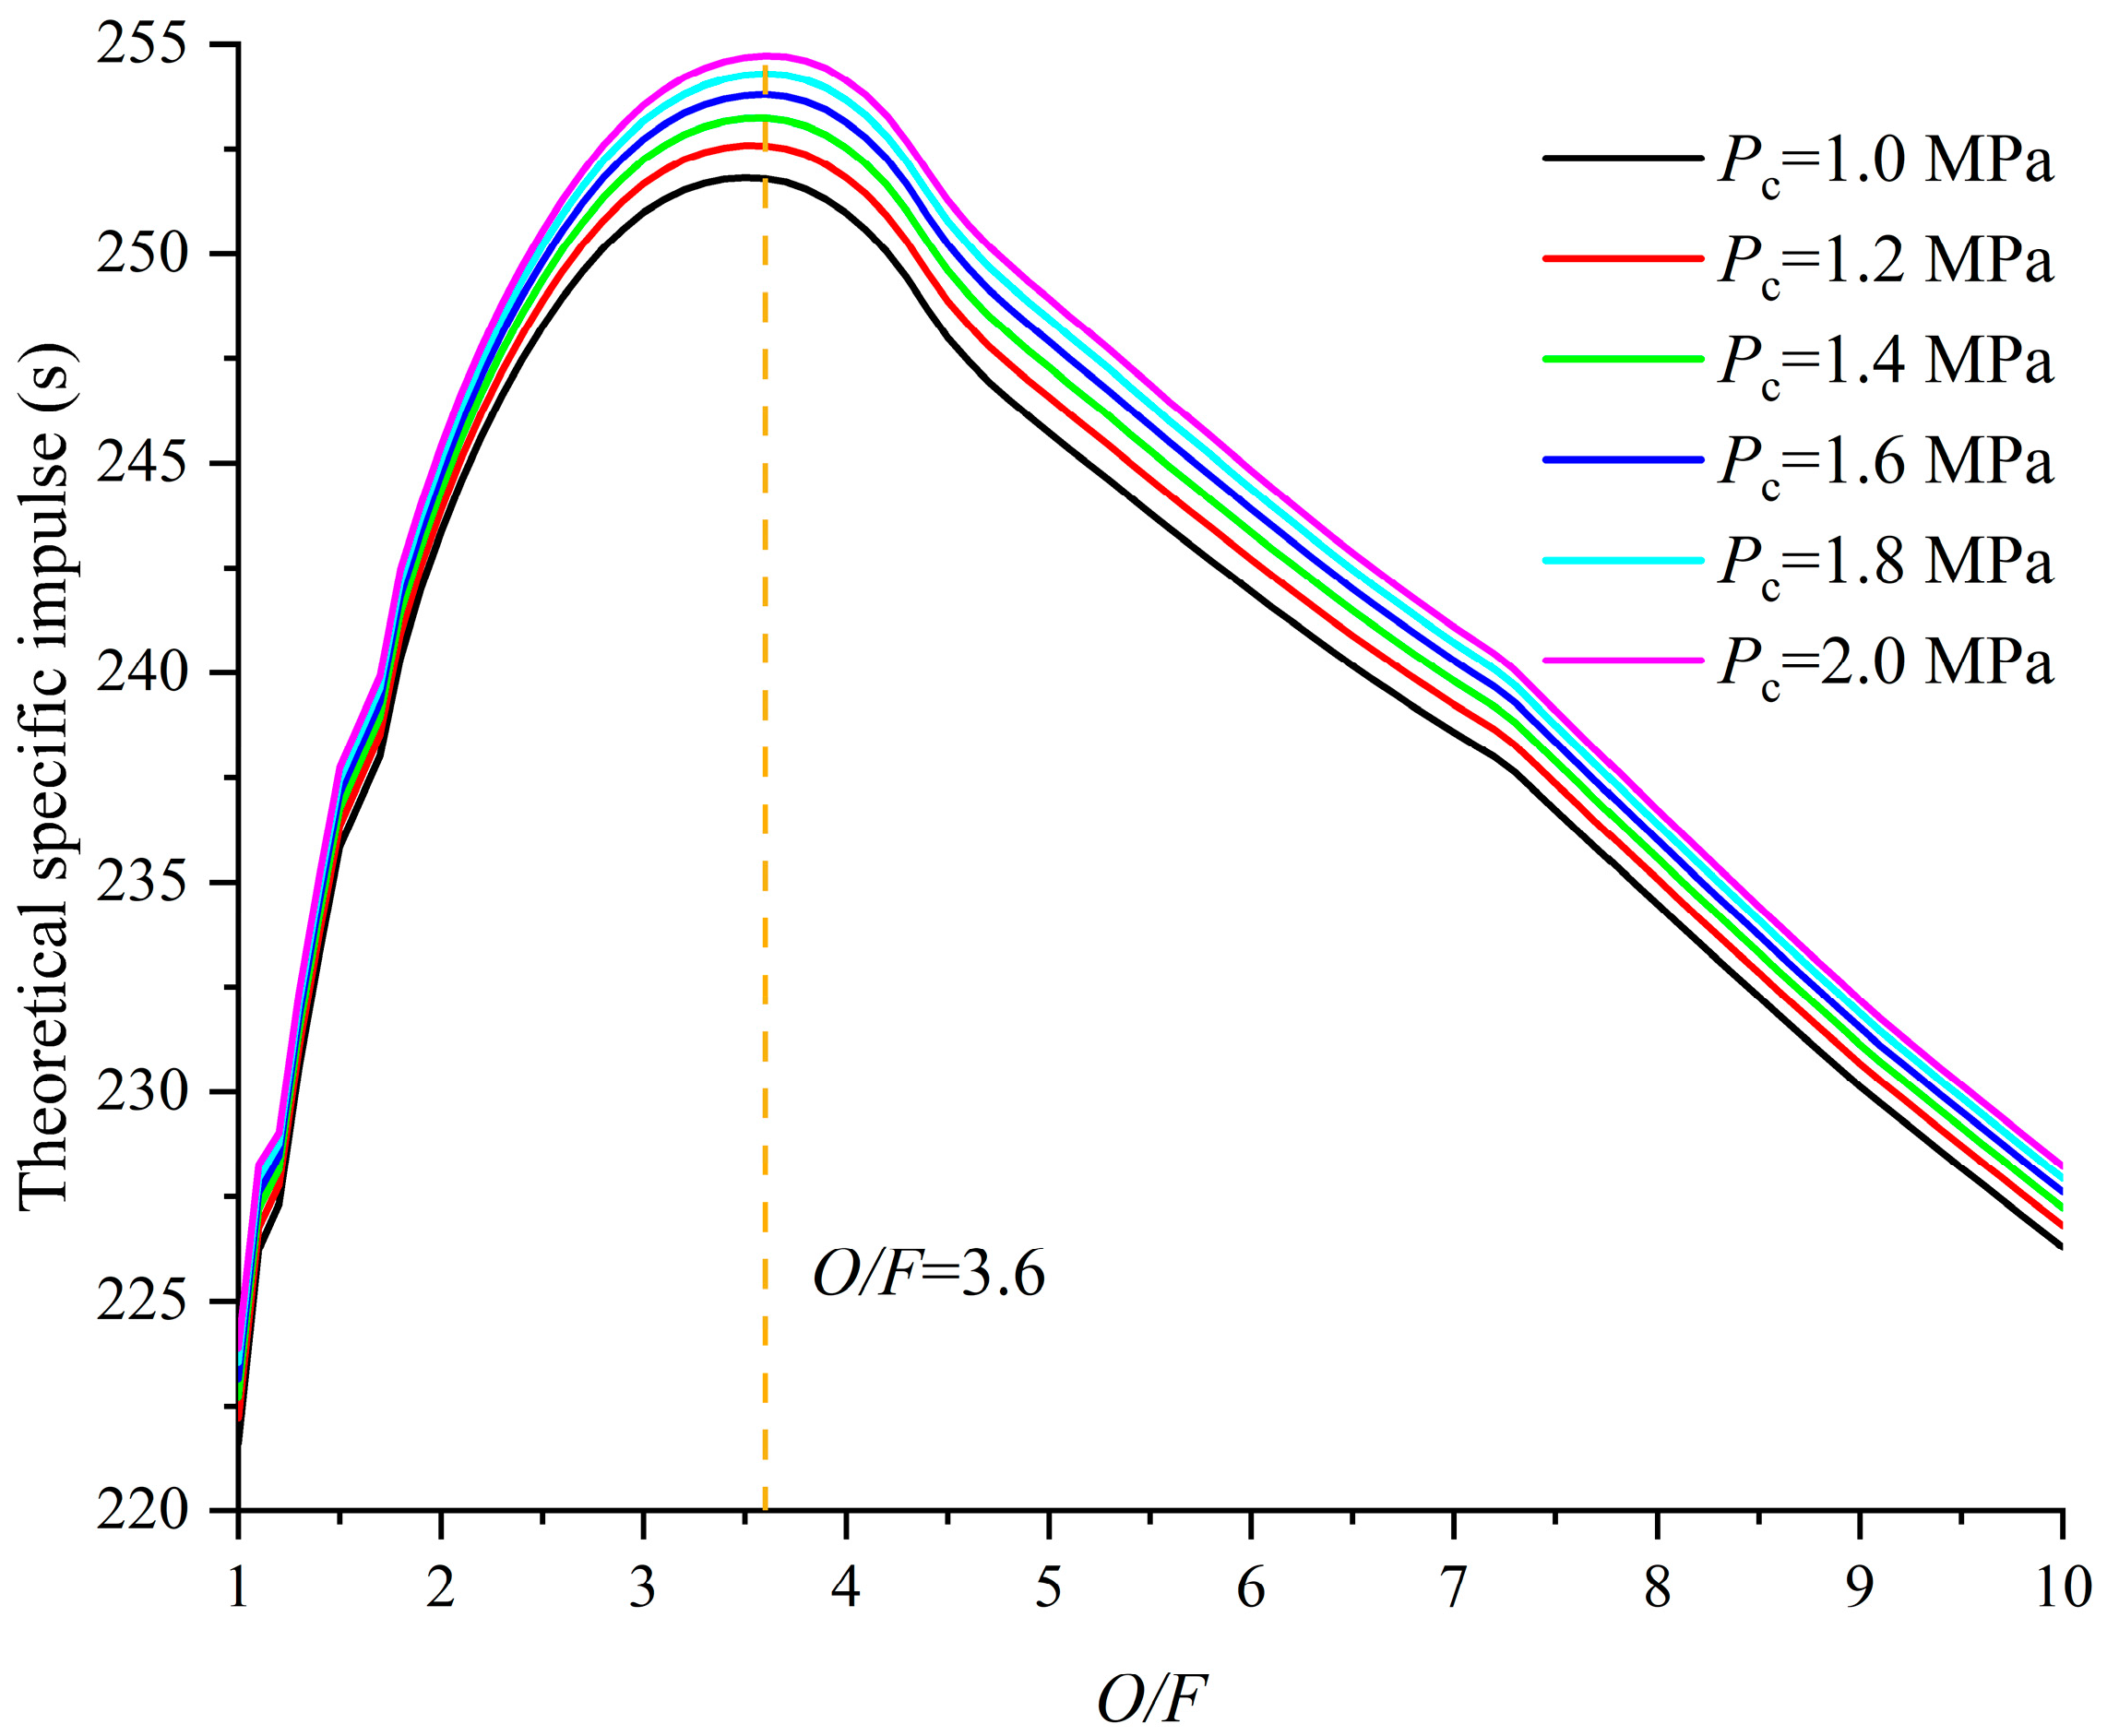
In the simulation, the specific impulse (Isp) and characteristic exhaust velocity (c*) varied over time, as depicted in Figure 29. Throughout the operational period, both specific impulse and characteristic exhaust velocity gradually decreased, with a specific impulse range of 189.0 to 215.3 s and a characteristic exhaust velocity range of 1335.5 to 1465.1 m/s. The primary reason for this trend was the gradual reduction in the O/F during the operational process, as illustrated in Figure 30. The O/F decreased from an initial value of 4.00 to a final value of 2.35, primarily due to variations in the burning surface area leading to changes in fuel mass flow rate. It is not common for the O/F to decrease over time, which means that the exponent of oxidizer flux (Go) in the regression rate formula was less than 0.5. It is generally believed that the regression rate is directly proportional to the, and in many experiments, the exponent of Go was greater than 0.5. This is because the Blasius empirical formula applied to smooth tubes (obtained through flow experiments) was used in the theoretical derivation process, and the exponent of Go was obtained to be 0.8. However, the fuel pyrolysis gas and discrete phase metal particles were added near the wall in this simulation, which enhanced wall heat transfer and thus made the decrease in regression rate relatively small compared to the increase in the burning surface. This might result in the exponent of Go below 0.5, and an increase in fuel mass flow rate, and ultimately, a decrease in O/F. To analyze the impact of O/F changes on the performance parameters, the theoretical specific impulse was computed using RPA v.1.2 as shown in Figure 31. Six different combustion chamber pressures, as indicated in the figure, were chosen to broadly cover the combustion chamber pressure during the operational process. It is evident that, for this particular hybrid rocket motor, the optimal O/F was approximately 3.6. However, over the majority of the operational time, the O/F gradually deviated from the optimum, resulting in a decrease in specific impulse. Similarly, the O/F gradually deviated from the stoichiometric ratio (which corresponded to the highest combustion temperature, approximately 3.6 for this propellant), leading to a reduction in the c*.

5. Conclusions

Due to the addition of high-energy additives and serious nozzle erosion in long-duration operations, the performance prediction accuracy of zero-dimensional or one-dimensional numerical simulation is relatively low. Therefore, it is necessary to carry out long-duration dynamic numerical simulations in hybrid rocket motors with higher performance prediction accuracy, which can provide an important basis for the determination of the working conditions and the program modification and significantly reduce the cost. In this study, a comprehensive study on the long-duration dynamic behavior of the hybrid rocket motor was conducted. A numerical simulation model for the long-duration dynamic behavior of the hybrid rocket motor was established, considering nozzle erosion and discrete phase effects. The model successfully achieved a dynamic numerical simulation with a working time of up to 200 s, obtaining performance parameters and flow field variations during the long-term operation of the hybrid rocket motor. The accuracy of the model was validated through the ground firing test. The main conclusions drawn are as follows:
(1)
The numerical simulation model provides insight into the distribution changes of internal flow field parameters during long-duration dynamic numerical simulations, guiding the hybrid rocket motor design. For example, the high-temperature region in the pre-combustion chamber poses a significant challenge to thermal protection, leading to the incorporation of a ring-shaped insulating plate at the head.
(2)
The behavior of Al droplets and Mg droplets in the flow field differs significantly over the long-term simulation, with Al droplets unable to fully vaporize in the combustion chamber due to higher boiling points and vaporization heat. In contrast, Mg droplets, with lower boiling points and vaporization heat, can completely vaporize in the combustion chamber. The longest residence time of Al and Mg droplets in the flow field differs by approximately one order of magnitude.
(3)
The dynamic numerical simulation study, considering nozzle erosion, significantly improves performance prediction accuracy. The average error in motor thrust is less than 1.8%, and the average error in combustion chamber pressure is less than 2.6% during the 200-s long-duration simulation, demonstrating the accuracy of the numerical simulation model, which lays a good foundation for accurate performance prediction of long-duration hybrid rocket motors.
(4)
Both simulation and experimental results indicated a gradual decrease in specific impulse and characteristic velocity over the extended operation period. The main reason for this is the gradual deviation of the oxygen-fuel ratio from the optimum ratio during the operation. The model can guide the design of hybrid rocket motors and optimize their design parameters. At the same time, this study can also lay the foundation for the trajectory prediction of long-duration flight, which is not available in the short-duration simulation.

Author Contributions

Conceptualization, X.M.; methodology, X.M.; software, X.N. and J.G.; validation, H.Z.; resources, H.T.; data curation, X.N.; writing—original draft preparation, X.M.; writing—review and editing, H.T., H.Z. and J.G.; project administration, H.Z. and G.C.; funding acquisition, H.T., H.Z. and G.C. All authors have read and agreed to the published version of the manuscript.

Funding

This research was funded by the National Natural Science Foundation of China, grant number U20B2034.

Data Availability Statement

The original contributions presented in the study are included in the article, further inquiries can be directed to the corresponding author/s.

Acknowledgments

The authors would like to express their gratitude to Beihang University, which supported the hybrid technology development.

Conflicts of Interest

The authors declare no conflict of interest.

References

  1. Meng, X.; Tian, H.; Zhu, H.; Wang, Z.; Yu, R.; Guo, Z.; Cai, G. Effects of Aluminum and Aluminum Hydride Additives on the Performance of Hybrid Rocket Motors Based on 95% Hydrogen Peroxide. Aerosp. Sci. Technol. 2022, 130, 107914. [Google Scholar] [CrossRef]
  2. Hyun, W.; Lee, C. Ignition Delay and Low-Frequency Coupling in Hybrid Rocket Combustion. Acta Astronaut. 2024, 214, 83–94. [Google Scholar] [CrossRef]
  3. Gallo, G.; Kamps, L.; Hirai, S.; Carmicino, C.; Nagata, H. One-Dimensional Modelling of the Nozzle Cooling with Cryogenic Oxygen Flowing through Helical Channels in a Hybrid Rocket. Acta Astronaut. 2023, 210, 176–196. [Google Scholar] [CrossRef]
  4. Okninski, A.; Kopacz, W.; Kaniewski, D.; Sobczak, K. Hybrid Rocket Propulsion Technology for Space Transportation Revisited-Propellant Solutions and Challenges. FirePhysChem 2021, 1, 260–271. [Google Scholar] [CrossRef]
  5. Mangeot, A.; William-Louis, M.; Gillard, P. Static and Moving Solid/Gas Interface Modeling in a Hybrid Rocket Engine. Acta Astronaut. 2018, 148, 89–98. [Google Scholar] [CrossRef]
  6. Zhang, S.; Hu, F.; Wang, D.; Okolo, N.P.; Zhang, W. Numerical Simulations on Unsteady Operation Processes of N2O/HTPB Hybrid Rocket Motor with/without Diaphragm. Acta Astronaut. 2017, 136, 115–124. [Google Scholar] [CrossRef]
  7. Di Martino, G.D.; Carmicino, C.; Mungiguerra, S.; Savino, R. The Application of Computational Thermo-Fluid-Dynamics to the Simulation of Hybrid Rocket Internal Ballistics with Classical or Liquefying Fuels: A Review. Aerospace 2019, 6, 56. [Google Scholar] [CrossRef]
  8. Tian, H.; Li, Y.; Zeng, P. Transient Simulation of Regression Rate on Thrust Regulation Process in Hybrid Rocket Motor. Chin. J. Aeronaut. 2014, 27, 1343–1351. [Google Scholar] [CrossRef]
  9. Meng, X.; Tian, H.; Chen, X.; Jiang, X.; Wang, P.; Wei, T.; Cai, G. Numerical Simulation of Combustion Surface Regression Based on Butterworth Filter in Hybrid Rocket Motor. Acta Astronaut. 2023, 202, 400–410. [Google Scholar] [CrossRef]
  10. Tian, H.; Meng, X.; Zhu, H.; Li, C.; Yu, R.; Zhang, Y.; Cai, G. Dynamic Characteristics Study of Regression Rate in Variable Thrust Hybrid Rocket Motor. Acta Astronaut. 2022, 193, 221–229. [Google Scholar] [CrossRef]
  11. Thakre, P.; Yang, V. Chemical Erosion of Refractory-Metal Nozzle Inserts in Solid-Propellant Rocket Motors. J. Propuls. Power 2009, 25, 40–50. [Google Scholar] [CrossRef]
  12. D’Elia, R.; Bernhart, G.; Hijlkema, J.; Cutard, T. Experimental Analysis of SiC-Based Refractory Concrete in Hybrid Rocket Nozzles. Acta Astronaut. 2016, 126, 168–177. [Google Scholar] [CrossRef]
  13. Fouladi, N.; Farahani, M. Numerical Investigation of Second Throat Exhaust Diffuser Performance with Thrust Optimized Parabolic Nozzles. Aerosp. Sci. Technol. 2020, 105, 106020. [Google Scholar] [CrossRef]
  14. Yan, D.; Wei, Z.; Xie, K.; Wang, N. Simulation of Thrust Control by Fluidic Injection and Pintle in a Solid Rocket Motor. Aerosp. Sci. Technol. 2020, 99, 105711. [Google Scholar] [CrossRef]
  15. Kamps, L.; Saito, Y.; Kawabata, R.; Wakita, M.; Totani, T.; Takahashi, Y.; Nagata, H. Method for Determining Nozzle-Throat-Erosion History in Hybrid Rockets. J. Propuls. Power 2017, 33, 1369–1377. [Google Scholar] [CrossRef]
  16. Tian, H.; Yu, R.; Li, C.; Zhao, S.; Zhu, H. Numerical and Experimental Study of the Thermochemical Erosion of a Graphite Nozzle in a Hybrid Rocket Motor with a Star Grain. Acta Astronaut. 2019, 155, 10–22. [Google Scholar] [CrossRef]
  17. Kamps, L.; Hirai, S.; Sakurai, K.; Viscor, T.; Saito, Y.; Guan, R. Investigation of Graphite Nozzle Erosion in Hybrid Rockets Using Oxygen/High-Density Polyethylene. J. Propuls. Power 2020, 36, 423–434. [Google Scholar] [CrossRef]
  18. Zhang, X.; Wang, Z.; Wang, R.; Lu, C.; Yu, R.; Tian, H. Numerical Simulation of Chemical Ablation and Mechanical Erosion in Hybrid Rocket Nozzle. Acta Astronaut. 2022, 192, 82–96. [Google Scholar] [CrossRef]
  19. Kim, K.-S.; Lee, S.-H.; Nguyen, V.Q.; Yun, Y.; Kwon, S. Ablation Characteristics of Rocket Nozzle Using HfC-SiC Refractory Ceramic Composite. Acta Astronaut. 2020, 173, 31–44. [Google Scholar] [CrossRef]
  20. Karabeyoglu, A.; Zilliac, G.; Cantwell, B.J.; Dezilwa, S.; Castellucci, P. Scale-up Tests of High Regression Rate Liquefying Hybrid Rocket Fuels. J. Propuls. Power 2004, 20, 1037–1045. [Google Scholar] [CrossRef]
  21. Sun, X.; Tian, H.; Li, Y.; Yu, N.; Cai, G. Regression Rate Behaviors of HTPB-Based Propellant Combinations for Hybrid Rocket Motor. Acta Astronaut. 2016, 119, 137–146. [Google Scholar] [CrossRef]
  22. Tian, H.; He, L.; Yu, R.; Zhao, S.; Wang, P.; Cai, G.; Zhang, Y. Transient Investigation of Nozzle Erosion in a Long-Time Working Hybrid Rocket Motor. Aerosp. Sci. Technol. 2021, 118, 106978. [Google Scholar] [CrossRef]
  23. Cai, G.; Zhao, Z.; Zhao, B.; Liu, Y.; Yu, N. Regression Rate and Combustion Performance Investigation on Hybrid Rocket Motor with Head-End Swirl Injection under High Geometric Swirl Number. Aerosp. Sci. Technol. 2020, 103, 105922. [Google Scholar] [CrossRef]
  24. Xintian, L.I.; Hui, T.; Guobiao, C. Numerical Analysis of Fuel Regression Rate Distribution Characteristics in Hybrid Rocket Motors with Different Fuel Types. Sci. China Technol. Sci. 2013, 56, 1807–1817. [Google Scholar]
  25. Li, C.; Cai, G.; Tian, H. Numerical Analysis of Combustion Characteristics of Hybrid Rocket Motor with Multi-Section Swirl Injection. Acta Astronaut. 2016, 123, 26–36. [Google Scholar] [CrossRef]
  26. Tian, H.; Duan, Y.; Zhu, H. Three-Dimensional Numerical Analysis on Combustion Performance and Flow of Hybrid Rocket Motor with Multi-Segmented Grain. Chin. J. Aeronaut. 2020, 33, 1181–1191. [Google Scholar] [CrossRef]
  27. Sun, X.; Tian, H.; Yu, N.; Cai, G. Regression Rate and Combustion Performance Investigation of Aluminum Metallized HTPB/98HP Hybrid Rocket Motor with Numerical Simulation. Aerosp. Sci. Technol. 2015, 42, 287–296. [Google Scholar] [CrossRef]
  28. Guo, Z.; Tian, H.; Wang, Z.; Meng, X.; Cai, G. Numerical and Experimental Study on 95% Hydrogen Peroxide Catalytic Ignition of Hybrid Rocket Motors with HTPB-Based Aluminum Additive Fuel. Acta Astronaut. 2022, 195, 98–108. [Google Scholar] [CrossRef]
  29. Tian, H.; Yu, R.; Zhu, H.; Wu, J.; Cai, G. Three-Dimensional Numerical and Experimental Studies on Transient Ignition of Hybrid Rocket Motor. Acta Astronaut. 2017, 140, 247–254. [Google Scholar] [CrossRef]
  30. Bianchi, D.; Betti, B.; Nasuti, F.; Carmicino, C. Simulation of Gaseous Oxygen/Hydroxyl-Terminated Polybutadiene Hybrid Rocket Flowfields and Comparison with Experiments. J. Propuls. Power 2015, 31, 919–929. [Google Scholar] [CrossRef]
  31. Chiaverini, M.J.; Kuo, K.K.; Peretz, A.; Harting, G.C. Regression-Rate and Heat-Transfer Correlations for Hybrid Rocket Combustion. J. Propuls. Power 2001, 17, 99–110. [Google Scholar] [CrossRef]
  32. Rocket Propulsion Software+Engineering UG. Available online: https://www.rocket-propulsion.com/index.htm (accessed on 17 March 2024).
  33. Meng, X.; Gao, J.; Tian, H.; Niu, X.; Chen, R.; Cai, G. Study on the Dynamic Numerical Simulation of Flow and Combustion in Hybrid Rocket Motors Based on a Discrete Phase Model. Acta Astronaut. 2024, 215, 156–167. [Google Scholar] [CrossRef]
  34. Cheng, G.; Farmer, R.; Jones, H.; McFarlane, J. Numerical Simulation of the Internal Ballistics of a Hybrid Rocket Motor. In 32nd Aerospace Sciences Meeting and Exhibit; Aerospace Sciences Meetings; American Institute of Aeronautics and Astronautics: Reston, VA, USA, 1994. [Google Scholar] [CrossRef]
  35. Li, X.T.; Zeng, P.; Tian, H.; Cai, G.B. Instantaneous Fuel Regression Rate Analysis of Hybrid Rocket Motor Experiment. Tuijin Jishu/J. Propuls. Technol. 2012, 33, 211–215. [Google Scholar]
  36. Bandyopadhyay, A.; Majumdar, A. Network Flow Simulation of Fluid Transients in Rocket Propulsion Systems. J. Propuls. Power 2014, 30, 1646–1653. [Google Scholar] [CrossRef]
Figure 1. Diagram for the hybrid rocket motor combustion chamber.
Aerospace 11 00318 g001
Figure 2. Two-dimensional computational region meshes of this motor.
Aerospace 11 00318 g002
Figure 3. Flow chart of dynamic mesh model with filter considering the discrete phase model.
Aerospace 11 00318 g003
Figure 4. Schematic of hybrid rocket motor.
Aerospace 11 00318 g004
Figure 5. Photograph of the hybrid rocket motor before the test.
Aerospace 11 00318 g005
Figure 6. Schematic of hybrid rocket motor head structure.
Aerospace 11 00318 g006
Figure 7. Schematic of hybrid rocket motor annular igniter.
Aerospace 11 00318 g007
Figure 8. Schematic of hybrid rocket motor nozzle.
Aerospace 11 00318 g008
Figure 9. Schematic of hybrid rocket motor ground test system.
Aerospace 11 00318 g009
Figure 10. Regression rate distribution with different meshes.
Aerospace 11 00318 g010
Figure 11. Combustion chamber pressure with different time step.
Aerospace 11 00318 g011
Figure 12. Hybrid rocket motor 200-s ground firing test.
Aerospace 11 00318 g012
Figure 13. Firing test data for hybrid rocket motor.
Aerospace 11 00318 g013
Figure 14. Oxidizer flow rate for the 200-s ground firing test.
Aerospace 11 00318 g014
Figure 15. Evolution of the propellant column before and after the 200-s firing test.
Aerospace 11 00318 g015
Figure 16. The changes in the motor nozzle before and after the 200-s firing test.
Aerospace 11 00318 g016
Figure 17. The comparison between the combustion chamber pressure during the 200-s prolonged test and simulation.
Aerospace 11 00318 g017
Figure 18. The comparison between the thrust during the 200-s prolonged test and simulation.
Aerospace 11 00318 g018
Figure 19. Temperature distribution of the flow field in the 200 s long-duration simulation.
Aerospace 11 00318 g019
Figure 20. Pressure and streamline distribution of the flow field in the 200 s long-duration simulation.
Aerospace 11 00318 g020
Figure 21. Computed grid near the burning surface and nozzle throat after the 200 s simulation.
Aerospace 11 00318 g021
Figure 22. Aluminum particle residence time distribution during the operating process.
Aerospace 11 00318 g022
Figure 23. Al2O3 mass fraction distribution during the operating process.
Aerospace 11 00318 g023
Figure 24. Magnesium particle residence time distribution during the operating process.
Aerospace 11 00318 g024
Figure 25. MgO mass fraction distribution during the operating process.
Aerospace 11 00318 g025
Figure 26. Combustion surface variation during the 200 s simulation.
Aerospace 11 00318 g026
Figure 27. Regression rate distribution along the axial direction during the 200 s simulation.
Aerospace 11 00318 g027
Figure 28. Average regression rate, fuel mass flow rate and flux variations over time in the simulation.
Aerospace 11 00318 g028
Figure 29. Specific impulse and characteristic exhaust velocity variations over time in the simulation.
Aerospace 11 00318 g029
Figure 30. O/F ratio variations over time in the simulation.
Aerospace 11 00318 g030
Figure 31. Theoretical specific impulse under various O/F ratios and combustion chamber pressure.
Aerospace 11 00318 g031
Table 1. Reaction mechanism of C4H6 and O2.
NO.Reaction ModelArectionBrectionErection/R (K)
1 C 4 H 6 + 2 O 2 4 CO + 3 H 2 8.80 × 10110.015,200
2 H 2 + O 2 2 OH 1.70 × 10130.024,100
3 OH + H 2 H 2 O + H 2.19× 10130.02590
4 2 OH O + H 2 O 6.02× 10120.0550
5 O + H 2 OH + H 1.80 × 10101.04480
6 H + O 2 OH + O 1.22 × 10¹⁷−0.918370
7 H + O + M OH + M 1.00 × 10160.00
8 O + O + M O 2 + M 2.55 × 10¹⁸−1.059,400
9 H + H + M H 2 + M 5.00 × 10150.00
10 H + OH + M H 2 O + M 8.40 × 10²¹−2.00
11 CO + OH CO 2 + H 4.00 × 10120.04030
12 CO + O 2 CO 2 + O 3.00 × 10120.025,000
13 CO + O + M CO 2 + M 6.00 × 10130.00
14 4 Al ( g ) + 3 O 2 2 Al 2 O 3 ( l ) 9.70 × 10130.080.6
15 2 Mg ( g ) + O 2 2 MgO ( l ) 1.00 × 10150.012,000
Table 2. Structure parameters of this hybrid rocket motor.
Structural ParametersValue
Combustion chamber outer diameter dc (mm)336
Grain inner diameter df (mm)183
Grain length Lf (mm)949
Pre-combustion chamber inner diameter dpre (mm)274
Post-combustion chamber inner diameter dpost (mm)274
Nozzle throat diameter dt (mm)36
Nozzle outlet diameter de (mm)116.6
Table 3. Essential performance data for the hybrid rocket motor.
ParametersMaximumMinimumAverage
Pressure of chamber (Mpa)2.300.951.73
Thrust (kN)2.931.692.36
Disclaimer/Publisher’s Note: The statements, opinions and data contained in all publications are solely those of the individual author(s) and contributor(s) and not of MDPI and/or the editor(s). MDPI and/or the editor(s) disclaim responsibility for any injury to people or property resulting from any ideas, methods, instructions or products referred to in the content.