1. Introduction
Aircraft icing poses a significant threat to flight safety. Practical experiences and studies have demonstrated that the accumulation of ice can severely disrupt the aerodynamic structure, resulting in compromised flight performance and potentially catastrophic consequences, including damage to the aircraft and loss of human life [
1,
2]. Hot air anti-icing is currently the most commonly used method for the airfoil and engine blade, and has been widely used on aviation aircraft. The common structure of the hot air anti-icing system includes a hot air supply cavity, jet impingements, and anti-icing surfaces. High-temperature air extracted from the engines is first led into the hot air supply cavity through a pressure-regulating valve, and then impacts the inner surface through jet holes. Driven by the temperature difference between the inner and outer surfaces, the heat travels through the wall via conductive and convection heat transfer. Throughout this process, the convective heat transfer coefficient of hot air directly determines the efficiency of the anti-icing system, indicating that an efficient heat transfer design of hot air can effectively improve the ice prevention performance. At the same time, the hot air anti-icing system requires the consumption of precious hot air from the engines, inevitably increasing the load on the engine and reducing its performance. Therefore, exploring new hot air anti-icing technology and achieving efficient anti-icing performance with reduced hot air consumption has always been an important direction of aircraft anti-icing development.
Swirling flow is a promising heat transfer technology which was initially applied in the cooling of gas turbine/aero-engine blades [
3]. Kreith and Margolis [
4] first proposed the concept: by adjusting the intensity and position of tangential jets, they successfully formed a swirling flow within the heat transfer chamber. Since then, many researchers around the world have actively carried out basic research on the swirling flow, e.g., Glezer et al. [
5,
6,
7] conducted experimental research on the swirling heat transfer and verified that the swirling flow has higher heat transfer performance than that of the turbulence ribs. According to the reports by Qian et al. [
8], compared to the impingement jet heat transfer commonly used today, the swirling flow not only shows improved heat transfer, but also uniformizes the surface heat transfer distribution. Subsequent research has made continuous improvements in the heat transfer performance of the swirl cooling system. The impacts of various factors, including the working medium [
9], the jet [
10,
11,
12], the chamber [
13,
14], as well as the Reynolds number [
7,
15,
16], have been extensively studied to enhance the heat transfer efficiency.
The swirling flow field is quite complex, as are its characteristics, and there are some representative studies that provide a preliminary understanding. Bruschewski et al. [
17] categorized the swirling flow fields into three regimes as the swirl intensity mounted. In regime I, a unidirectional axial velocity prevails in the swirling flow at a low swirl intensity. In regime II, the axial velocity reverses in the tube’s center. And in regime III, three axial flow regions are present, each reversing in its respective annular region. Kreith and Sonju [
18] conducted an experimental study on the decay of a fully developed turbulent swirling flow induced by a tap through a pipe. It was observed that the turbulent swirling flow decayed to about 10–20% of its initial intensity over a distance of approximately 50 times the pipe diameter. This indicates that the swirling heat transfer can be continuously intense and evenly distributed in the upstream and downstream. The study of Khalatov et al. [
19] and Winter et al. [
20] showed that the swirl can stabilize the flow in the heat transfer channel, and the channel turns and overall rotation have no significant impact on the swirling flow or heat transfer performance. Bruschewski et al. [
17] also focused on the outlet of the swirling tube and showed that the outlet geometry is a crucial parameter for flow regime I; conversely, flow regimes II and III are much less responsive to changes in the tube outlet direction.
Researchers have conducted in-depth studies on the heat transfer enhancement mechanism of swirling flow. Ligrani et al. [
21] and Hedlund et al. [
22] described that the large-scale swirls and vortex pairs are the main reasons for the significant improvement of heat transfer performance in swirl tubes. Biegger et al. [
23,
24] showed that the strong radial velocity gradient and helical vortex structures in the near-wall region of the swirl tube enhance turbulent mixing, which is the reason why the swirl has high heat transfer performance. And they also explained the flow and heat transfer characteristics of swirl tubes with single tangential jets are significantly different from those with multi-tangential jets. The swirl heat transfer tube with multiple tangential jets shows more practical performance and can achieve stronger and more uniform heat transfer distribution [
25]. In addition, Liu et al. [
26], Biegger et al. [
24], and Bruschewski et al. [
27] have conducted numerical simulations of swirling flow in a tube using RANS (Reynolds averaged numerical simulation), DES (detached eddy simulation), and LES (large eddy simulation) and obtained flow field results that matched the experimental heat transfer results.
However, the swirling flow has not been applied to the anti-icing design of an airfoil/aero-engine, which could help to significantly improve the anti-icing performance and reduce the hot air consumption. Based on the high similarity between the cooling and anti-icing, as well as its consistency in the basic heat transfer theory, this study explores the application of swirling flow on hot air anti-icing. Numerical calculations were carried out to simulate the internal flow and heat transfer characteristics as well as the whole hot air anti-icing process. Three internal jet arrangement patterns were studied and compared (impingement jet, offset jet, swirl jet), while four tube Reynolds numbers (from 10,000 to 40,000) were investigated. Specific issues that related to the anti-icing were taken into consideration, such as the water evaporation on the anti-icing surface and the matches between internal heat transfer and external icing load.
2. Numerical Setups
In order to accurately simulate the flow and heat transfer characteristics of hot air anti-icing, this study constructed an internal heat transfer configuration based on the NACA0012 airfoil with a chord length of 1000 mm, as shown in
Figure 1.
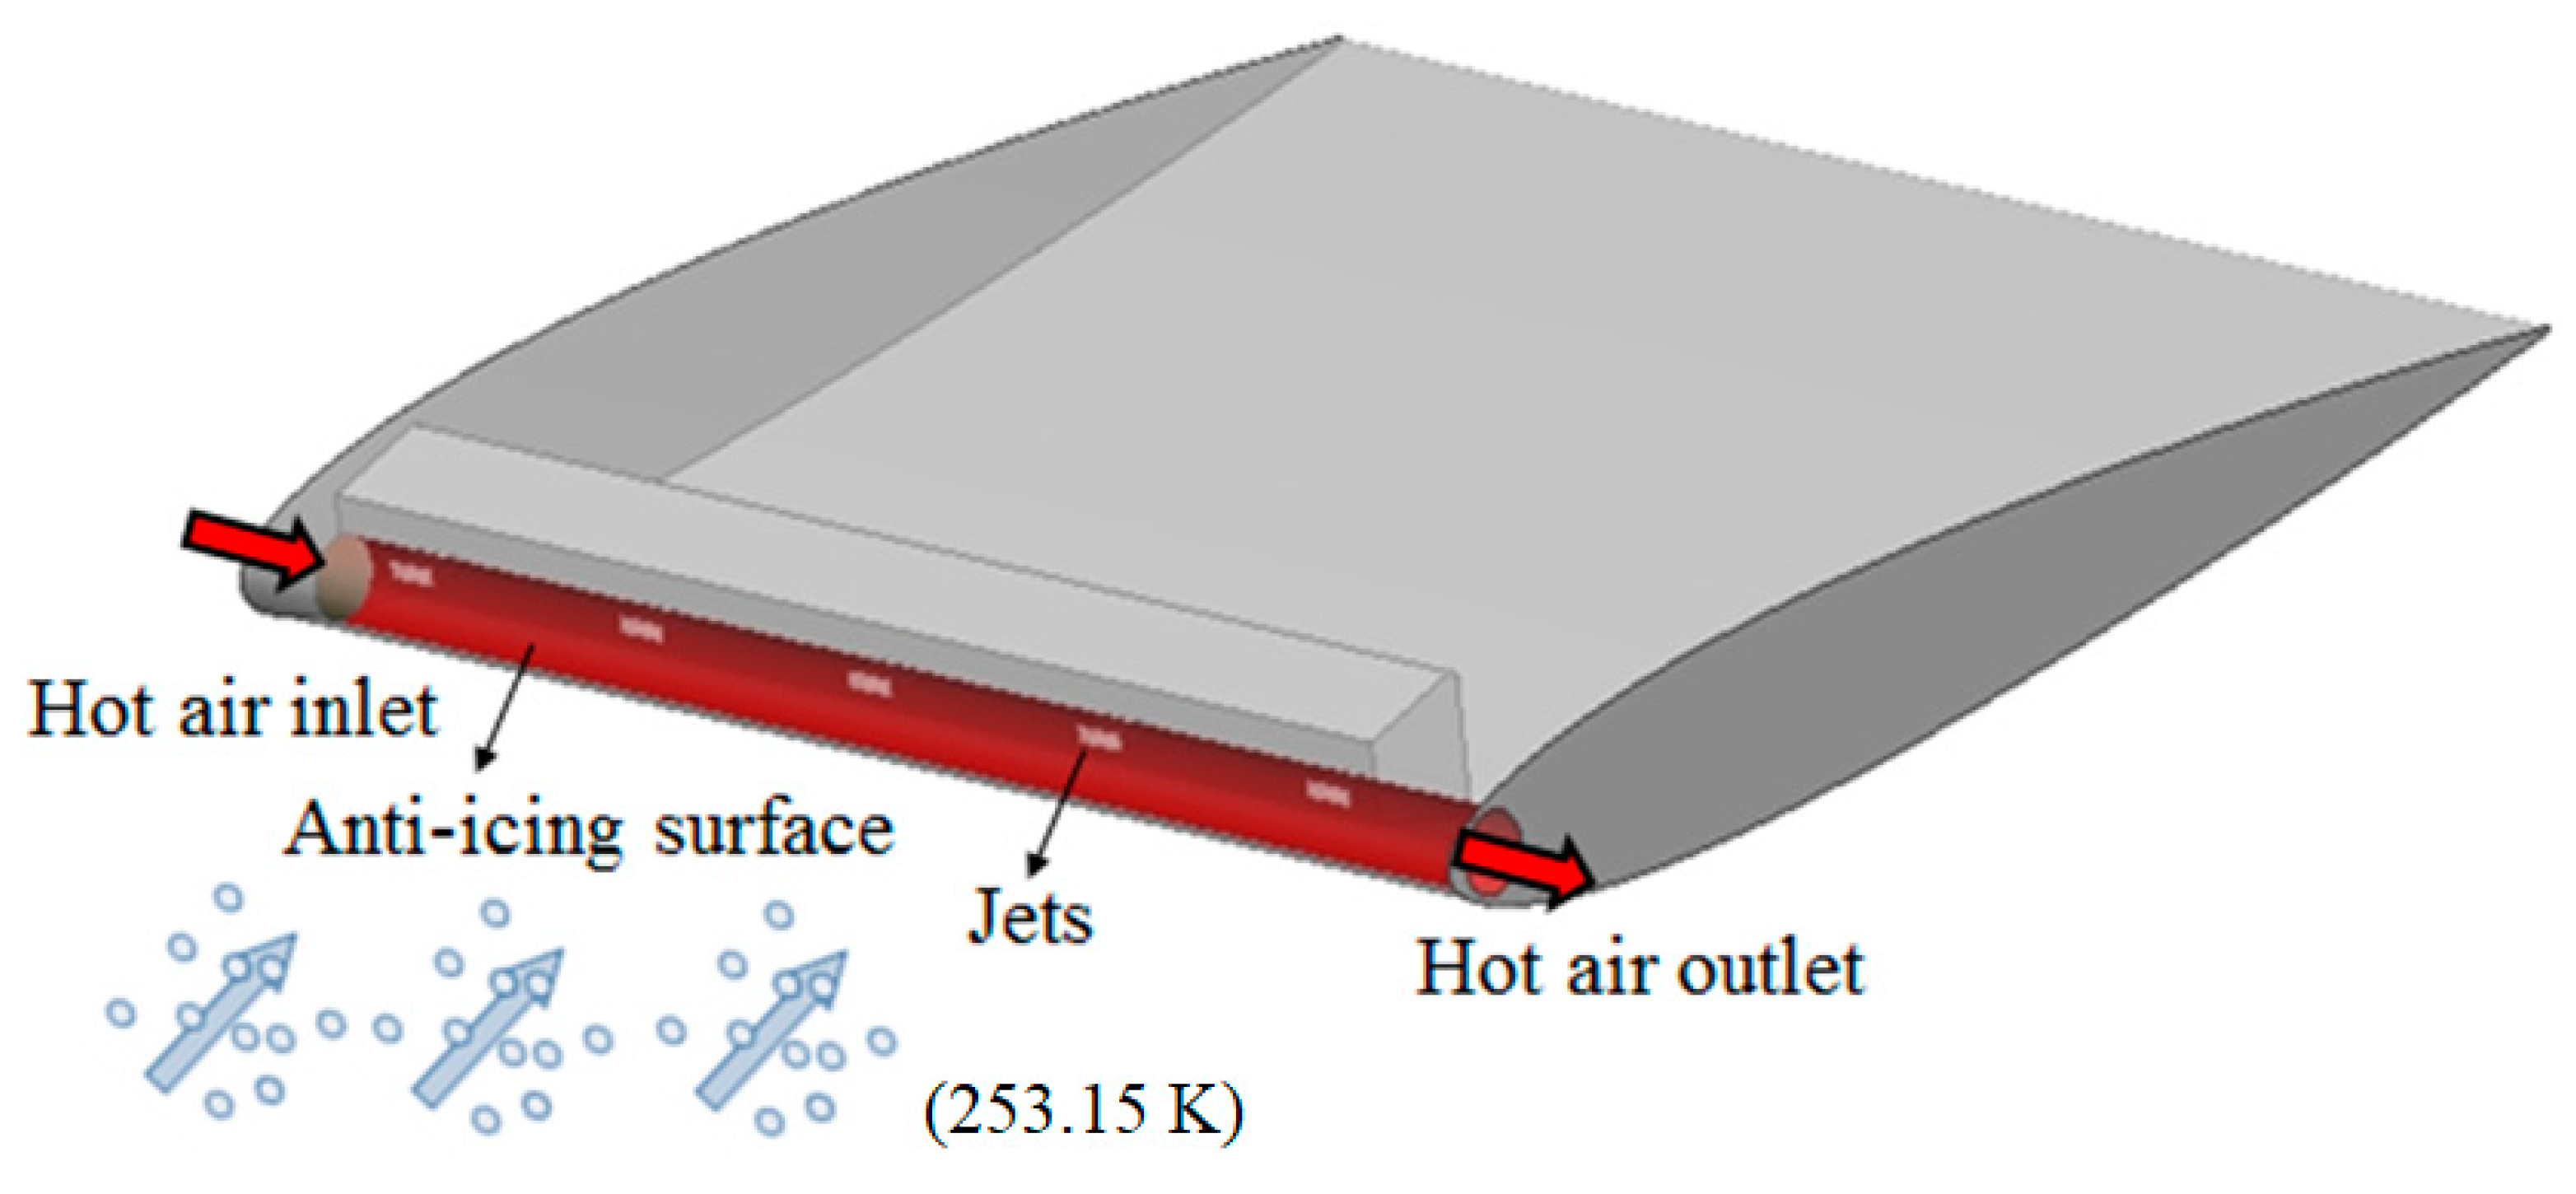
Figure 2 provides a schematic of the computational geometry of anti-icing inner fluid, where the circular tube has a length of 1000 mm and a diameter of 50 mm, conforming precisely to the specifications outlined in Ref. [
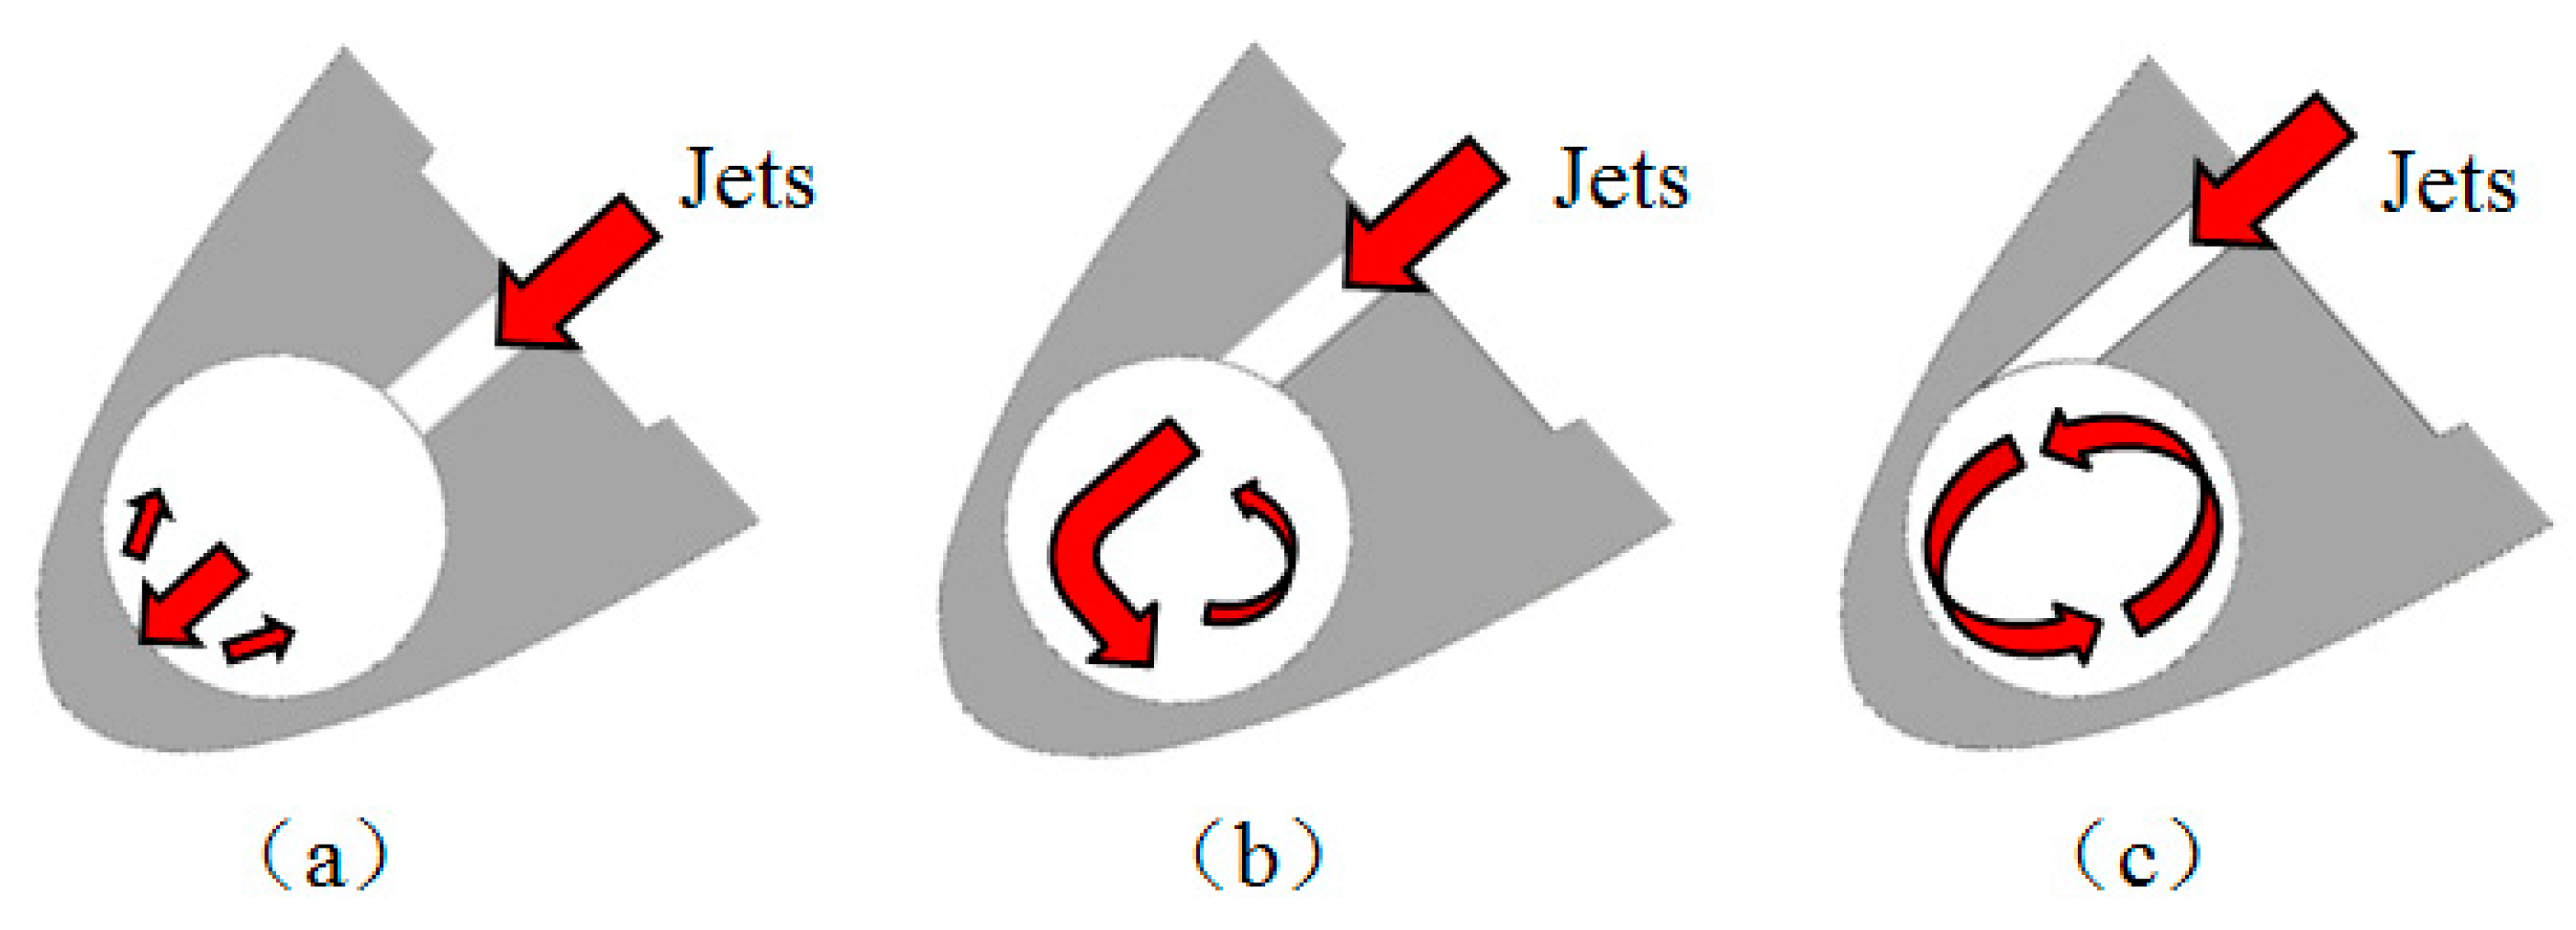
25]. The hot air is extracted from engine compressor and passes through five holes to reach the inner anti-icing surface, and the five holes are of three types, which are the impingement jets, offset jets, and swirl jets. The impingement jet means that the hot air is injected from the normal direction of the circular tube impacting on the other side of the wall; the swirl jet is tangentially injected and forms a large range of vortexes in the chamber under the restriction of the wall surface; and the offset jet is a hybrid between the impingement jet and the swirl jet, forming a lower-intensity vortex flow in the chamber, as shown in
Figure 3. After multiple jets, the hot air flows out from the outlet, which extends directly to the anti-icing surface without bending. Previous research papers [
25] have verified that the present swirling air belongs to the flow pattern of regime II, and the direction of outlet has essentially no impact on the heat transfer characteristics [
17].
An investigation using three-dimensional numerical computations was carried out in which the internal convection heat transfer, solid heat conduction, and external convection heat transfer were calculated separately and jointly iterated for the full-process anti-icing computation. The ANSYS FLUENT software was used for the calculations of internal fluid, the ANSYS FENSAP-ICE software was employed for the computations of external water collection and icing, and the CHT3D module in the ANSYS FENSAP-ICE was adopted for the full process anti-icing computation. Through the co-iteration of internal flow, solid wall, and external flow temperatures, the effects of water evaporation, heat absorption, and icing on the outer surface were considered. The full-process anti-icing computation utilizes three sets of grids for the collaborative iteration, where the internal flow grid is a hybrid grid and the external flow and solid use unstructured grids, as illustrated in
Figure 4.
The flow rate of hot air supply is determined based on five Reynolds numbers, which are calculated using Equation (1). In this equation,
represents the tube diameter,
denotes the average velocity at the tube outlet, and
is the dynamic viscosity. The internal heat transfer is characterized by the dimensionless Nusselt number, as shown in Equation (2). In the full-process anti-icing calculations, the following boundary conditions were set: the mainstream was 253.15 K and 40 m/s; the hot air was 333.15 K, with the Reynolds number ranging from 10,000 to 40,000; the
MVD was 20 μm; the
LWC ranged from 0.5 g/m
3 to 2.0 g/m
3; the material of the solid was an aluminum alloy with a thermal conductivity of 167 W/(m·K); and all the fluid–solid interfaces were thermal coupled and no-slip. When calculating the internal heat transfer, the internal wall temperature was assigned a value of 323.15 K, and a set of separate calculations was performed to obtain the high-resolution distribution of the Nusselt number on the internal wall.
A two-equation steady-state SST (shear-stress transport)
turbulent model based on Reynolds averaging was employed to simulate a complex swirling flow based on the assumptions of eddy viscosity and shear layer transport, [
26,
28,
29] with high simulation accuracy [
25,
26]. More than 15 prism layers were set near the tube wall with a non-dimensional distance number, Y+, of about 1.0 to meet the requirements of the SST
turbulence model. When utilizing the FLUENT for the internal flow simulations, the pressure–velocity coupling used the SIMPLEC algorithm and the pressure spatial discretization selected the PRESTO! scheme. After undergoing over 4000 iterations, the residuals of momentum and energy equation decreased to the levels of 10
−4 and 10
−7, respectively, and the calculated physical values changed by less than 0.05%, indicating that the computation was converged. Based on the already obtained flow fields, 120 iteration steps for water collection and 180 s of icing were performed to obtain the water collection coefficient and ice shape of the outer surface. For the full-process anti-icing calculations, the previously obtained flow fields, water collection coefficients, and ice shapes were inputted into the CHT3D module for 100-step co-iterations. In each of the co-iterations, the flow field did not calculate further and only the change in energy equation was updated; the water collection, as well as the icing, were computed 10 times; and the time step of solid conduction was set to 0.2 s, with a total time of 1.0 s in a single co-iteration. Finally, the temperature distribution on the outer surface with the internal hot air anti-icing and external icing load was obtained, having carefully considered the heat absorption of water evaporation and the heat conduction of the solid.
3. Data Validations
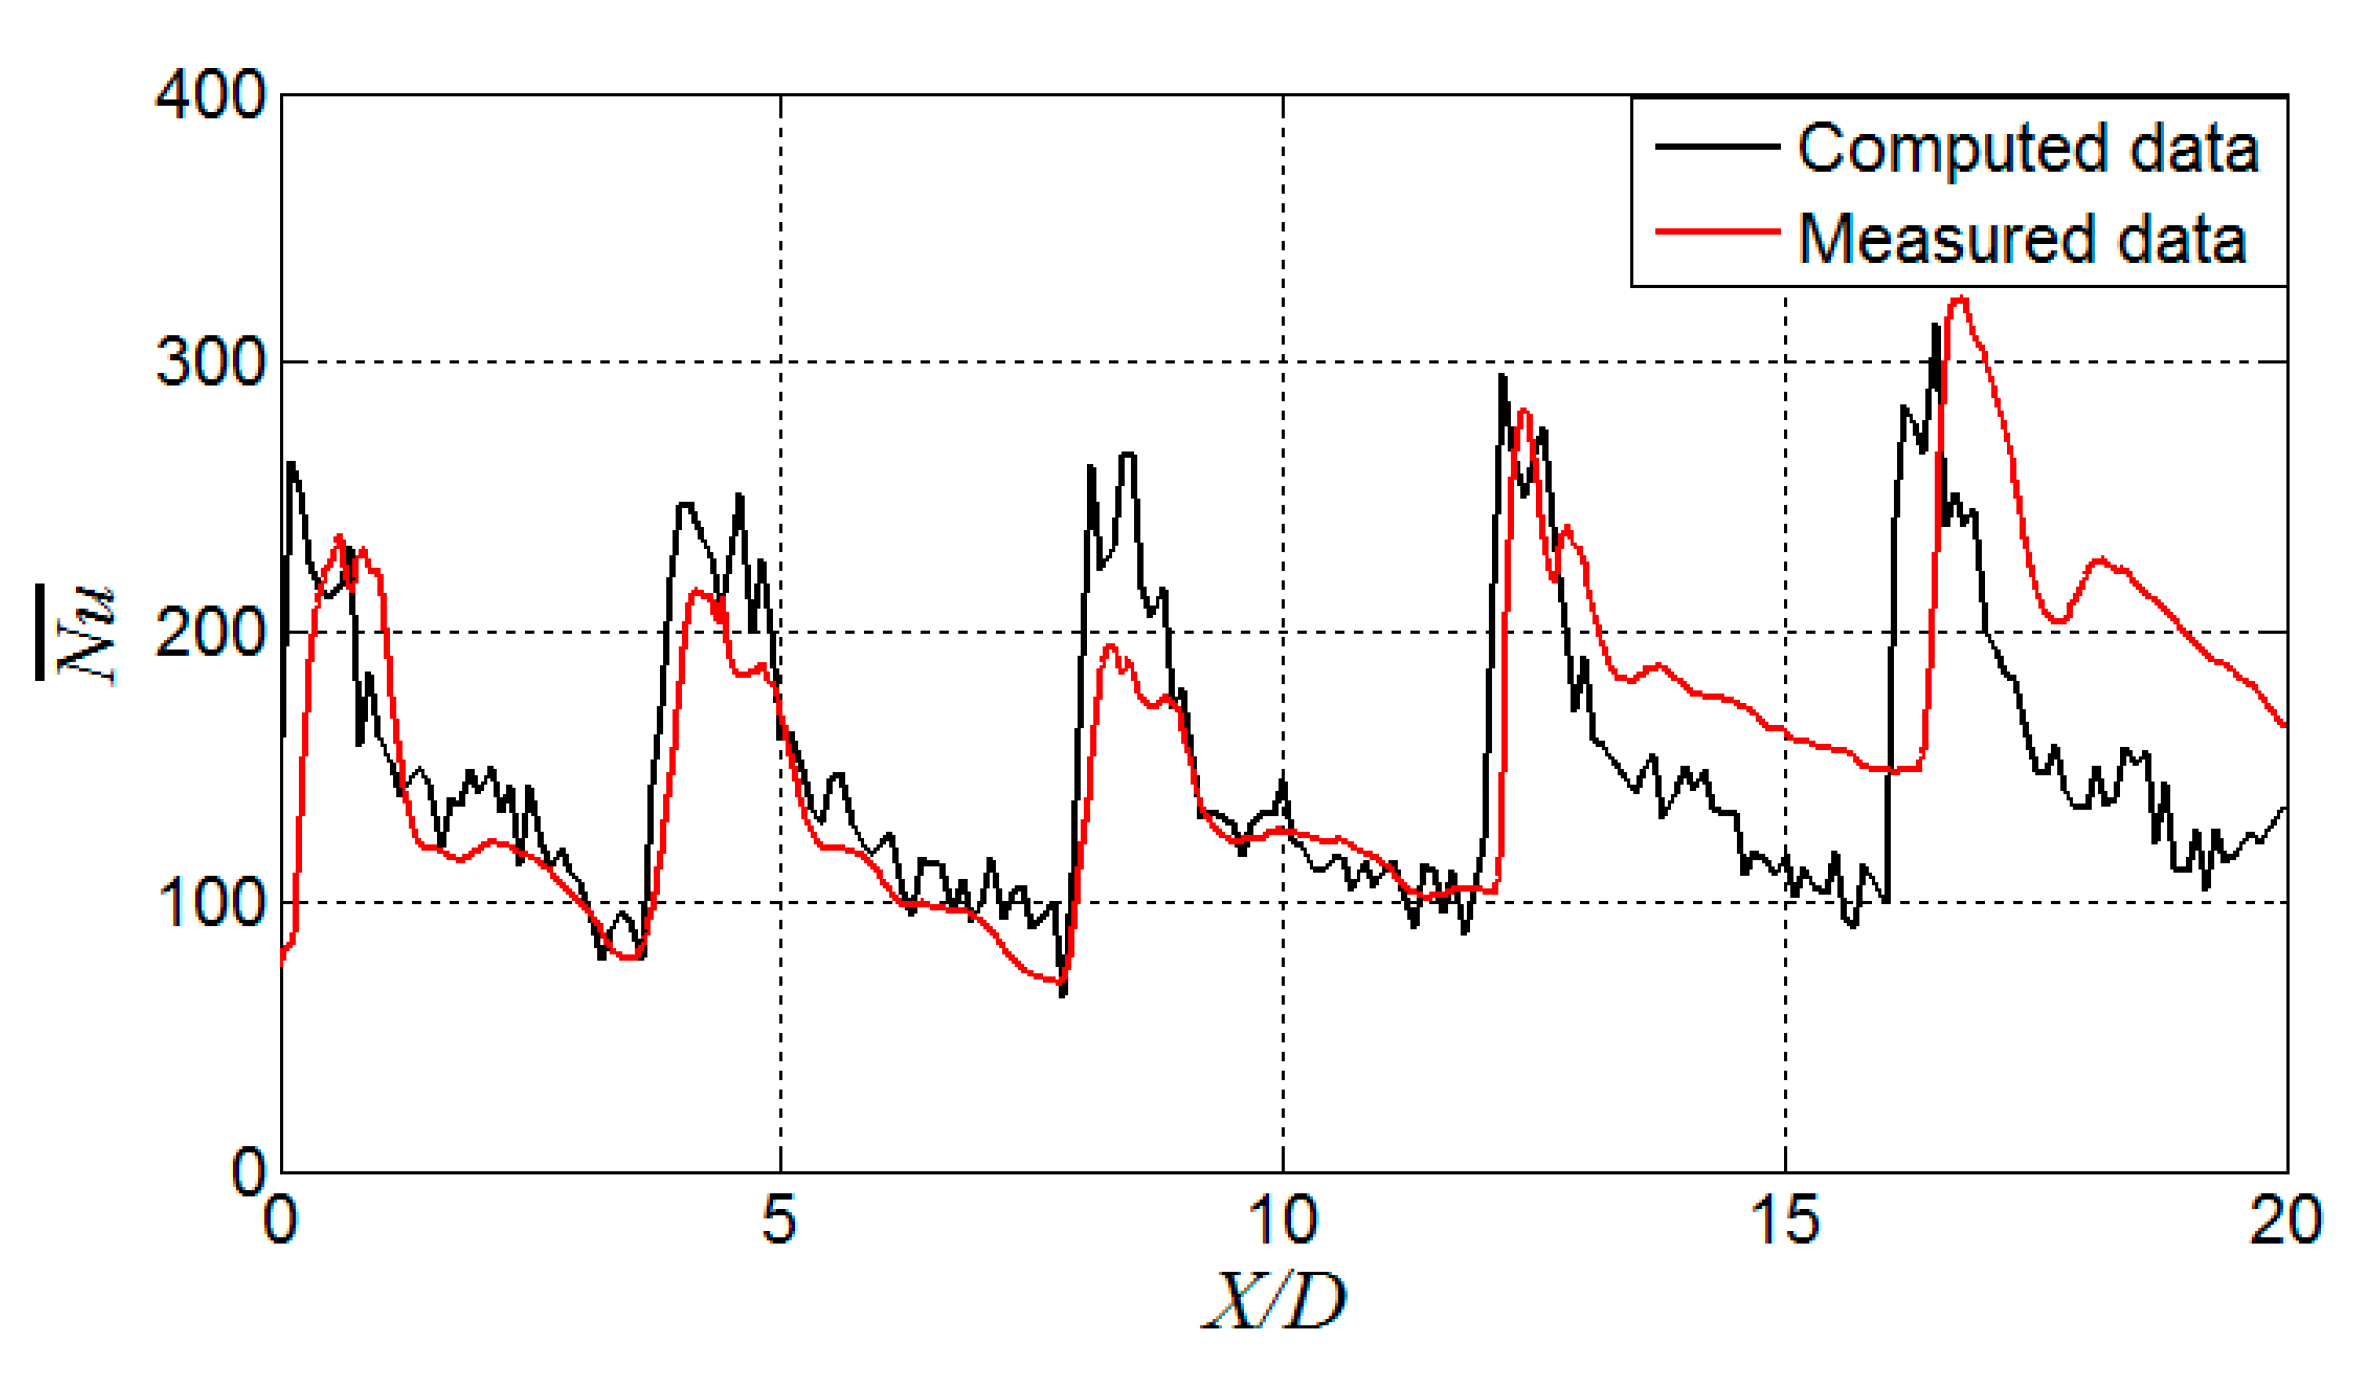
By using the circumferential averaged Nusselt number in the internal heat supply chamber with the swirl jets, a comparative validation with the literature data [
25] was conducted to confirm the accuracy and reliability of the present numerical method, as shown in
Figure 5. The circumferential averaged Nusselt number reached the peak at each jet hole, gradually decreasing and being reinforced again at the next jet hole. For the numerically computed data compared to the experimental measured data, the heat transfer was particularly consistent at the first two jet holes. However, due to the complexity of the swirling flow, there were some deviations in the circumferential averaged Nusselt number around the last three jet holes. The prediction deviation in the downstream area could have been due to the uneven flow distribution through the five jet holes and the limitations of the turbulence model simulating the complex swirling flow. The overall averaged deviation of the Nusselt number was within 5% in the Reynolds number range of 10,000 to 40,000, and therefore, the simulation results are considered reasonable acceptable.
Aiming to identify the optimal grid number that strikes a balance between computational efficiency and precision, ultimately leading to more accurate and dependable simulation outcomes, a grid independence check was conducted using three sets of grids for the heat transfer simulations of the internal hot air supply chamber with the swirl jets, as shown in
Figure 6. In terms of the local distributions, the deviation of circumferential averaged Nusselt in the regions between two jet holes was relatively small, whereas in the regions corresponding to jet stagnations, the deviation was comparatively larger. In terms of the overall averaged value, the deviation caused by different grid quantities was not significant. At the Reynolds number of 40,000, the Nusselt numbers calculated on the inner wall were 151.8, 151.0, and 150.8, respectively, for the grid counts of 2.0 million, 3.0 million, and 4.5 million. After the grid number exceeded 3.0 million, the variation in heat transfer was less than 1%, indicating that a grid number of 3.0 million was sufficient for conducting the present numerical simulation. Therefore, in subsequent research, the setting of 3.0 million grid mesh has been adopted as a benchmark for the meshing.
4. Results and Discussion
This article compares three jet positions within the hot air anti-icing chamber, which are the impingement jets, the offset jets, and the swirl jets. By analyzing the results, such as the Nusselt number, pressure loss, vortex structure, swirl intensity, and temperature distribution, on the airfoil outer surface, the influence of the internal swirling effect on the anti-icing performance was elucidated.
4.1. Comparisons of Internal Flow and Heat Transfer
Figure 7 presents the high-resolution Nusselt number distributions on the internal wall formed by the jet holes at different positions at a Reynolds number of 40,000. By adopting the impingement jets, high heat transfer was only observed in the region at the first three jet holes. However, in the areas corresponding to the last two jet holes, due to the presence of crossflow in the passage, the high heat transfer region disappeared, leading to quite uneven heat transfer on the wall. For the offset jets, the swirling effect in the chamber overcame the influence of crossflow on the last two jet stagnations, forming high heat transfer at all five jet holes. This improved the heat transfer uniformity to some extent, and still, the heat transfer decayed quickly in the downstream of each jet. For the swirl jets with more pronounced swirling intensity, the heat transfer deterioration in the downstream of individual jet hole was slower, leading to significant improvements in either heat transfer uniformity or overall heat transferred. Compared to the impinging jet heat transfer at
ReD = 40,000, the area-averaged Nusselt number with the offset jet increased by 19.5%, while that with the swirl jets increased by 44.3%.
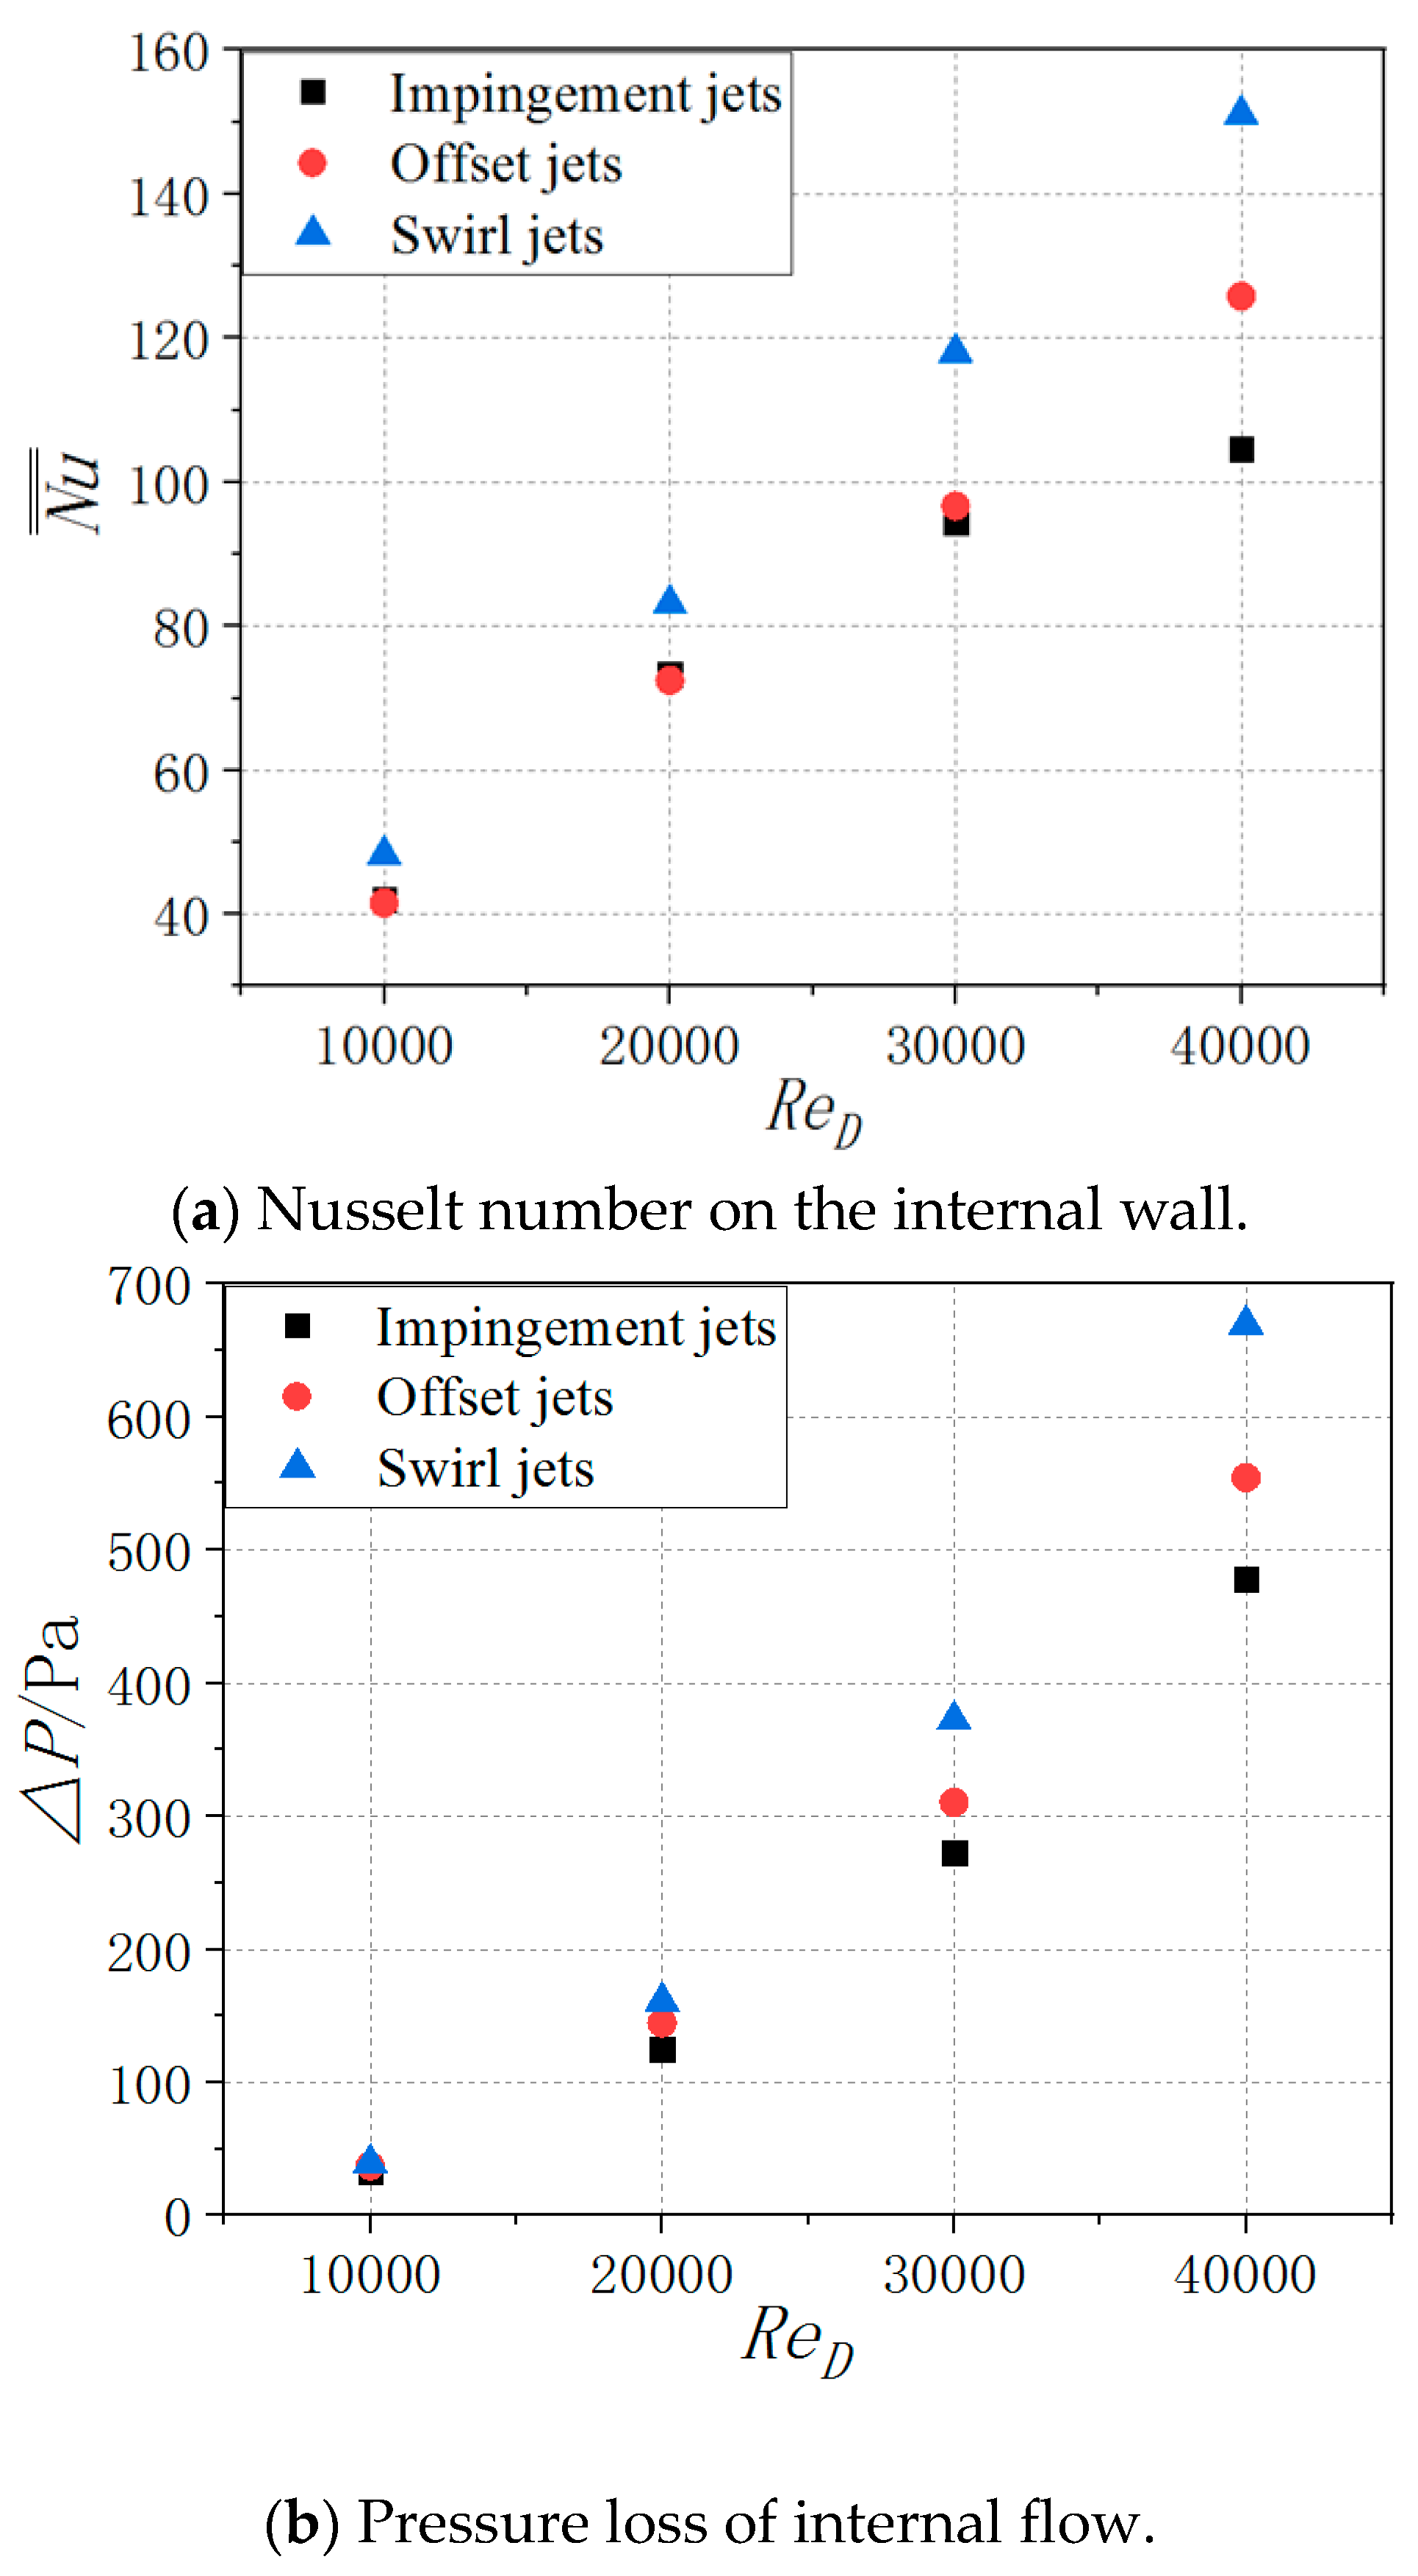
Figure 8 provides the heat transfer and pressure loss data for the anti-icing internal flow with three types of jet holes, covering the Reynolds numbers of 10,000 to 40,000. At the high Reynolds numbers, the heat transfer improvement caused by the swirling effect was more pronounced, and there was also a greater increase in pressure loss. As the Reynolds number increased from low to high, the heat transfer enhancement of the swirl jets compared to the impingement jets progressed from 14.6% to 13.3%, then to 25.0%, and finally to 44.3%. Meanwhile, the pressure loss also increased by 20.0%, 28.6%, 36.7%, and 40.0%, respectively. The heat transfer enhancement rates of the offset jets compared to the impingement jets were −1.3%, −1.2%, 2.4%, and 20.2%, and the corresponding increases in the pressure loss were 13.6%, 15.4%, 14.0%, and 15.9%, respectively. This indicates that, when designing the jet for internal heat transfer, it is necessary to consider both the heat transfer quantity and the pressure loss increase.
The dimensionless
Q criterion, as defined in Equation (3), is a commonly used vortex identification method in fluid dynamics. It is defined as the second invariant of the velocity gradient tensor, normalized by square of the local strain rate. Equation (4) presents the formula for computing the circumferential velocity, which serves as an indication of the swirl speed magnitude of the fluid adjacent to the wall surface.
Figure 9 shows the time-averaged
Q criterion iso-surfaces formed under various jet holes at a Reynolds number of 40,000, and the color signifies the magnitude of the circumferential velocity. It is evident that the high-vorticity region formed by the impingement jets was relatively small and existed exclusively in the vicinity of the jet hole as well as its corresponding stagnation area, and the circumferential velocity within the high-vorticity region was also quite low. If the jet is offset arranged, the
Q criterion iso-surfaces and vortex structures become stronger and more extensive, with the circumferential velocity increased. The intense vortex flow remains concentrated near the jet stagnation area, which explains why there was an obvious deterioration in Nusselt numbers downstream of each jet hole. As for the swirl jets, the significant difference is that the high-intensity vortex iso-surface covered a large area, filling the entire heat transfer area and exhibiting spiral stripes with a higher circumferential velocity. The distribution of
Q criterion iso-surfaces and the magnitude of circumferential velocities induced by the swirl jets helped to reveal the swirling flow and heat transfer mechanisms characterized by high heat transfer intensity and a high pressure loss.
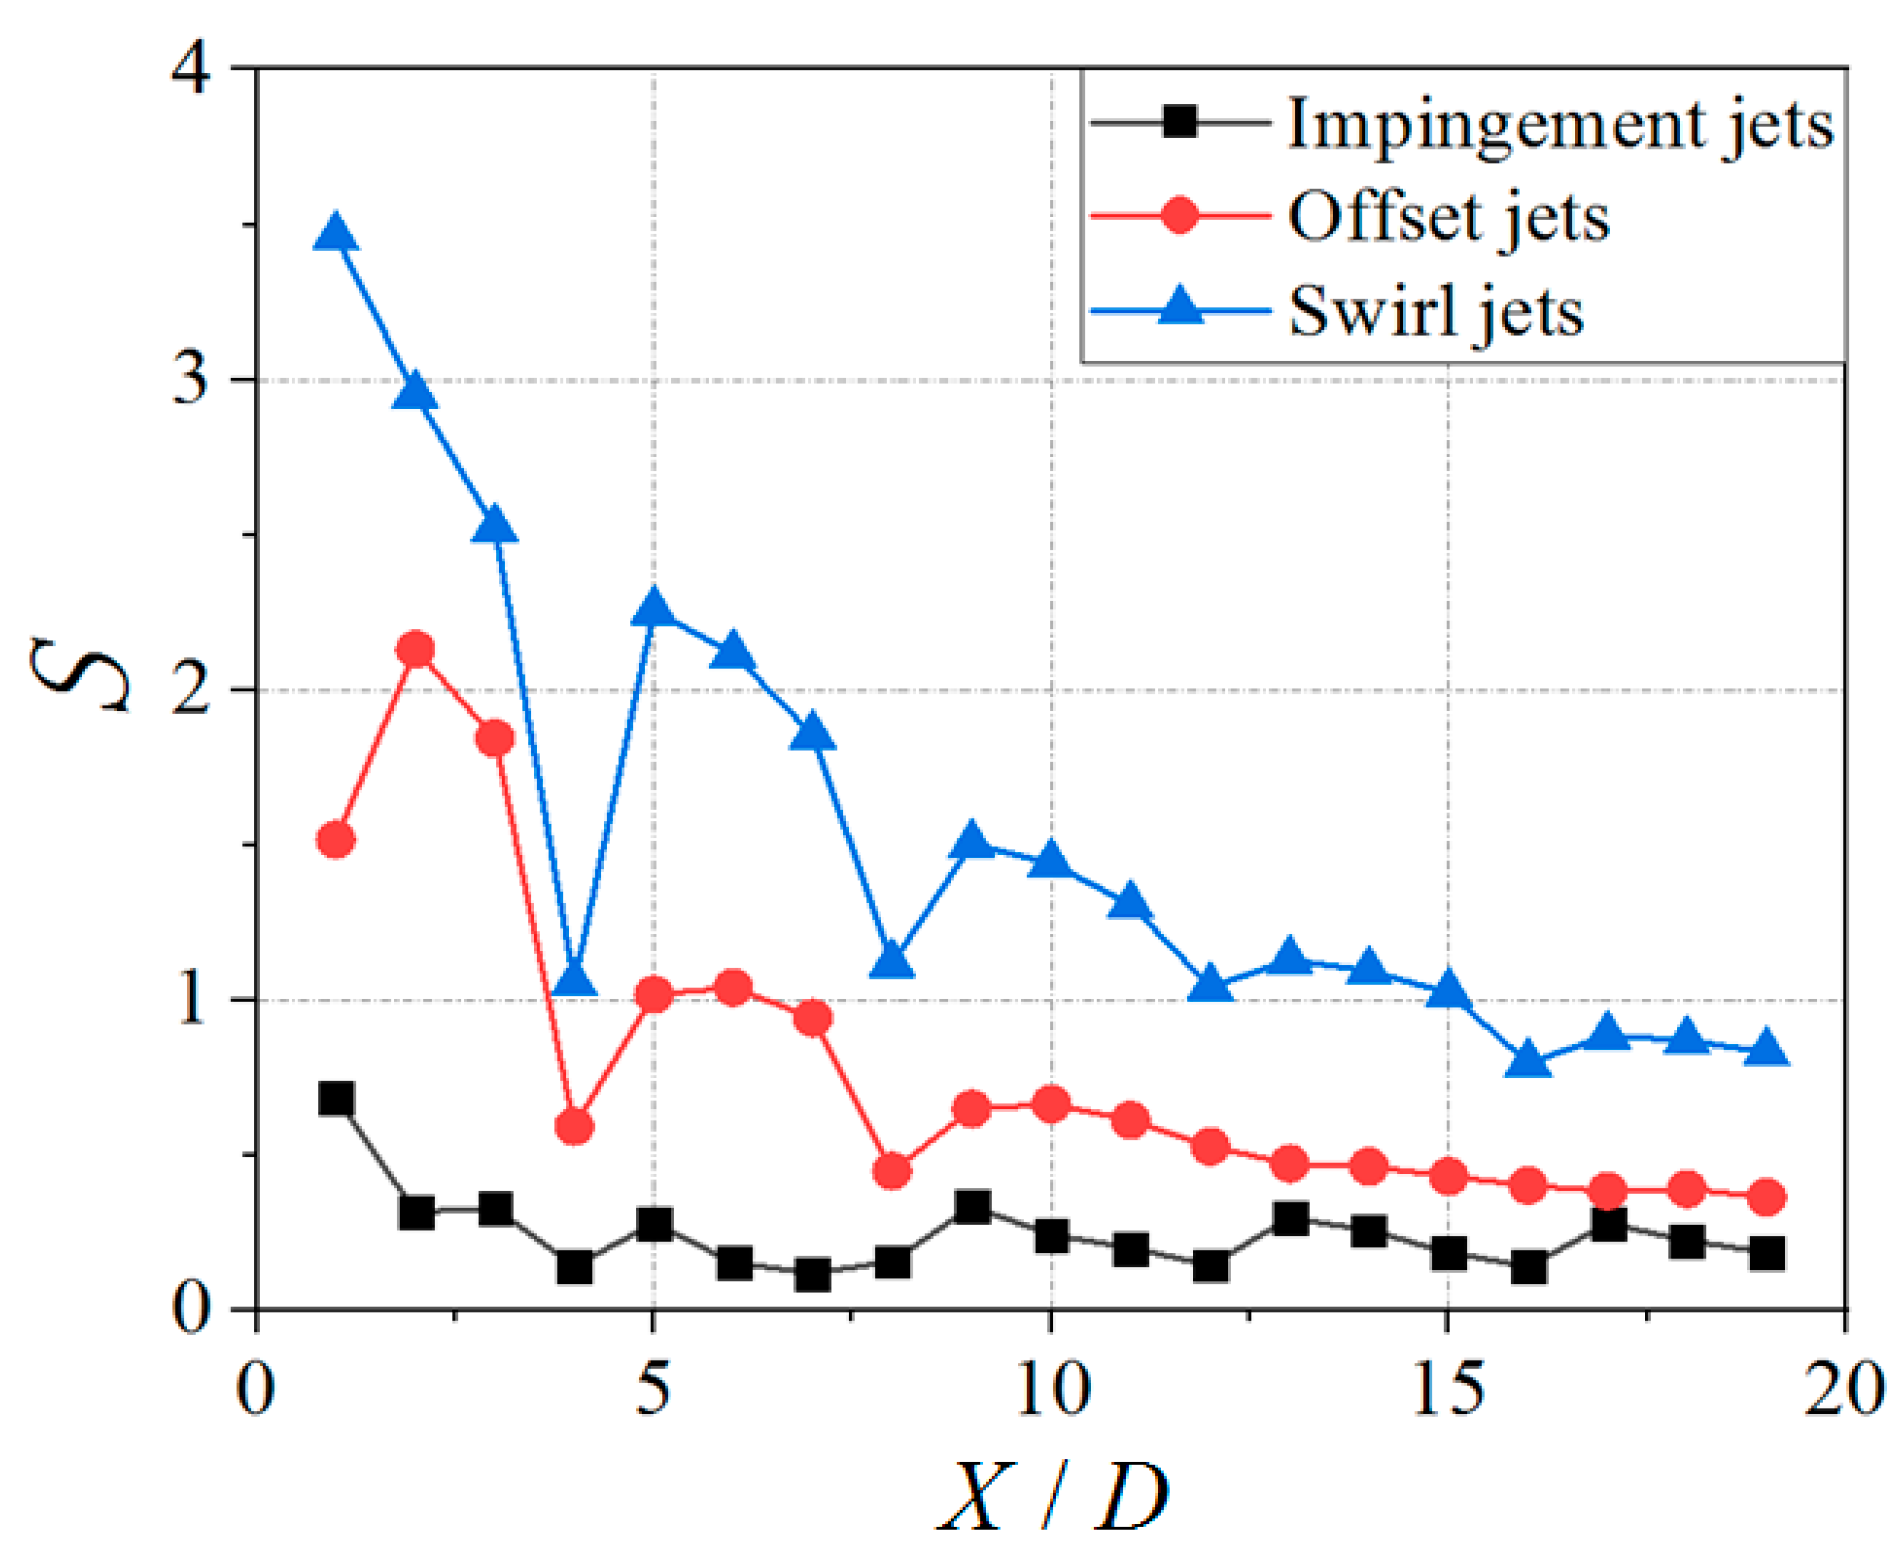
The swirl number is a dimensionless quantity used to characterize the degree of swirling in a fluid flow. It presents the ratio of the axial flux of angular momentum to the axial flux of linear momentum in a swirling flow, as described in Equation (5). In other words, the swirl number quantifies the relative strength of the swirling component of the flow compared to the axial component.
Figure 10 illustrates the local swirl number values under different jet arrangements across multiple cross-sectional planes at the Reynolds number of 40,000. It can be observed that, from upstream to downstream, as the axial momentum increased, the swirl number exhibited a general decreasing trend. The swirl number formed by the impingement jets within the chamber was the lowest across all-sections, yet it remained greater than zero. By offsetting the jet holes, the local swirl number was significantly increased, with a maximum enhancement of approximately 6.8 times and a minimum improvement of about 1.6 times. The swirling flow formed by the tangential jets further increased the swirl number within the internal chamber, with an enhancement ranging from 3.5 times to 9.3 times. Due to the enhanced swirl intensity caused by the tangentially injected jet flow, the flow boundary layer was thinned and the effect of crossflow on the jet inclination was suppressed, which reasonably reveals the reason why the swirling flow could effectively enhance the heat transfer efficiency on the internal wall.
4.2. Comparisons of Anti-Icing Performance
The simulations of internal flow and heat transfer did not take into account the heat absorption of water evaporation on the airfoil surface, nor the resulting internal and external heat transfer matching issues. It is necessary to carry out a comprehensive computational analysis of hot air anti-icing performance that couples internal flow, solid wall, and external flow.
Figure 11 provides the outer surface temperature distribution derived from the anti-icing full-process numerical computations at
ReD = 40,000 and
LWC = 1.0 g/m
3. When the internal impingement jet was utilized, the temperature distribution along the spanwise direction exhibited non-uniformity, which was primarily attributed to the poor heat transfer performance downstream of the internal passage and resulted in a disproportionate amount of heat being extracted from the upstream region. Consequently, a high-temperature zone was predominantly formed in the upstream area, leading to the observed uneven temperature distribution across the airfoil’s outer wall. By adopting the offset jet, the temperature distribution along the airfoil’s surface was more uniform, and it can be seen that the high heat transfer hot spots existed corresponding to the internal jet holes. The heat originally accumulated in upstream was transferred out from the downstream, and thus, the upstream high heat transfer temperature decreased. In the case with the tangentially arranged jet holes, the hot spots along the spanwise direction were more pronounced. Benefiting from the significant improvement in internal heat transfer intensity and uniformity, the temperature and uniformity on the airfoil’s outer surface are synchronously enhanced. The anti-icing full-process computational results show that compared to the impingement jets, the offset jets elevated the leading edge temperature by approximately 1.5 K, while the swirl jets increased the leading edge temperature by around 4.1 K when the internal-to-external temperature difference was 80 K.
From
Figure 11, it is noteworthy that a consistently lower temperature region emerged at the leading edge of the airfoil, which was caused by a combination of heat absorption during water evaporation and the relatively thicker solid wall at the leading edge.
Figure 12 presents the temperature distribution in the cross-section of anti-icing chamber as well as on the external surface. It can be observed that the highest temperature occurred near the jet hole on the internal wall, while the lowest temperature was located at the trailing edge of the airfoil. At
ReD = 40,000 and
LWC = 1.0 g/m
3, the leading edge temperature formed by the impingement jets was approximately 3 K lower than that of its nearby two sides, and the temperature distribution on the both sides was symmetrical. The temperature formed by the offset jet was not symmetrical in the
Y direction, and the leading edge temperature differed from the highest temperature by about 10 K. For the swirl holes, the asymmetric trend in temperatures was further exaggerated, and the temperature difference between the leading edge and its nearby sides increased to about 14 K. Even so, the swirling internal hot air led to higher temperatures everywhere outside of the airfoil compared to that with the impingement jets and offset jets, which is illustrated in
Figure 12c. This indicates that the tangential jet arranged on one side of the airfoil did not cause a mismatch between the internal heat transfer and external icing load.
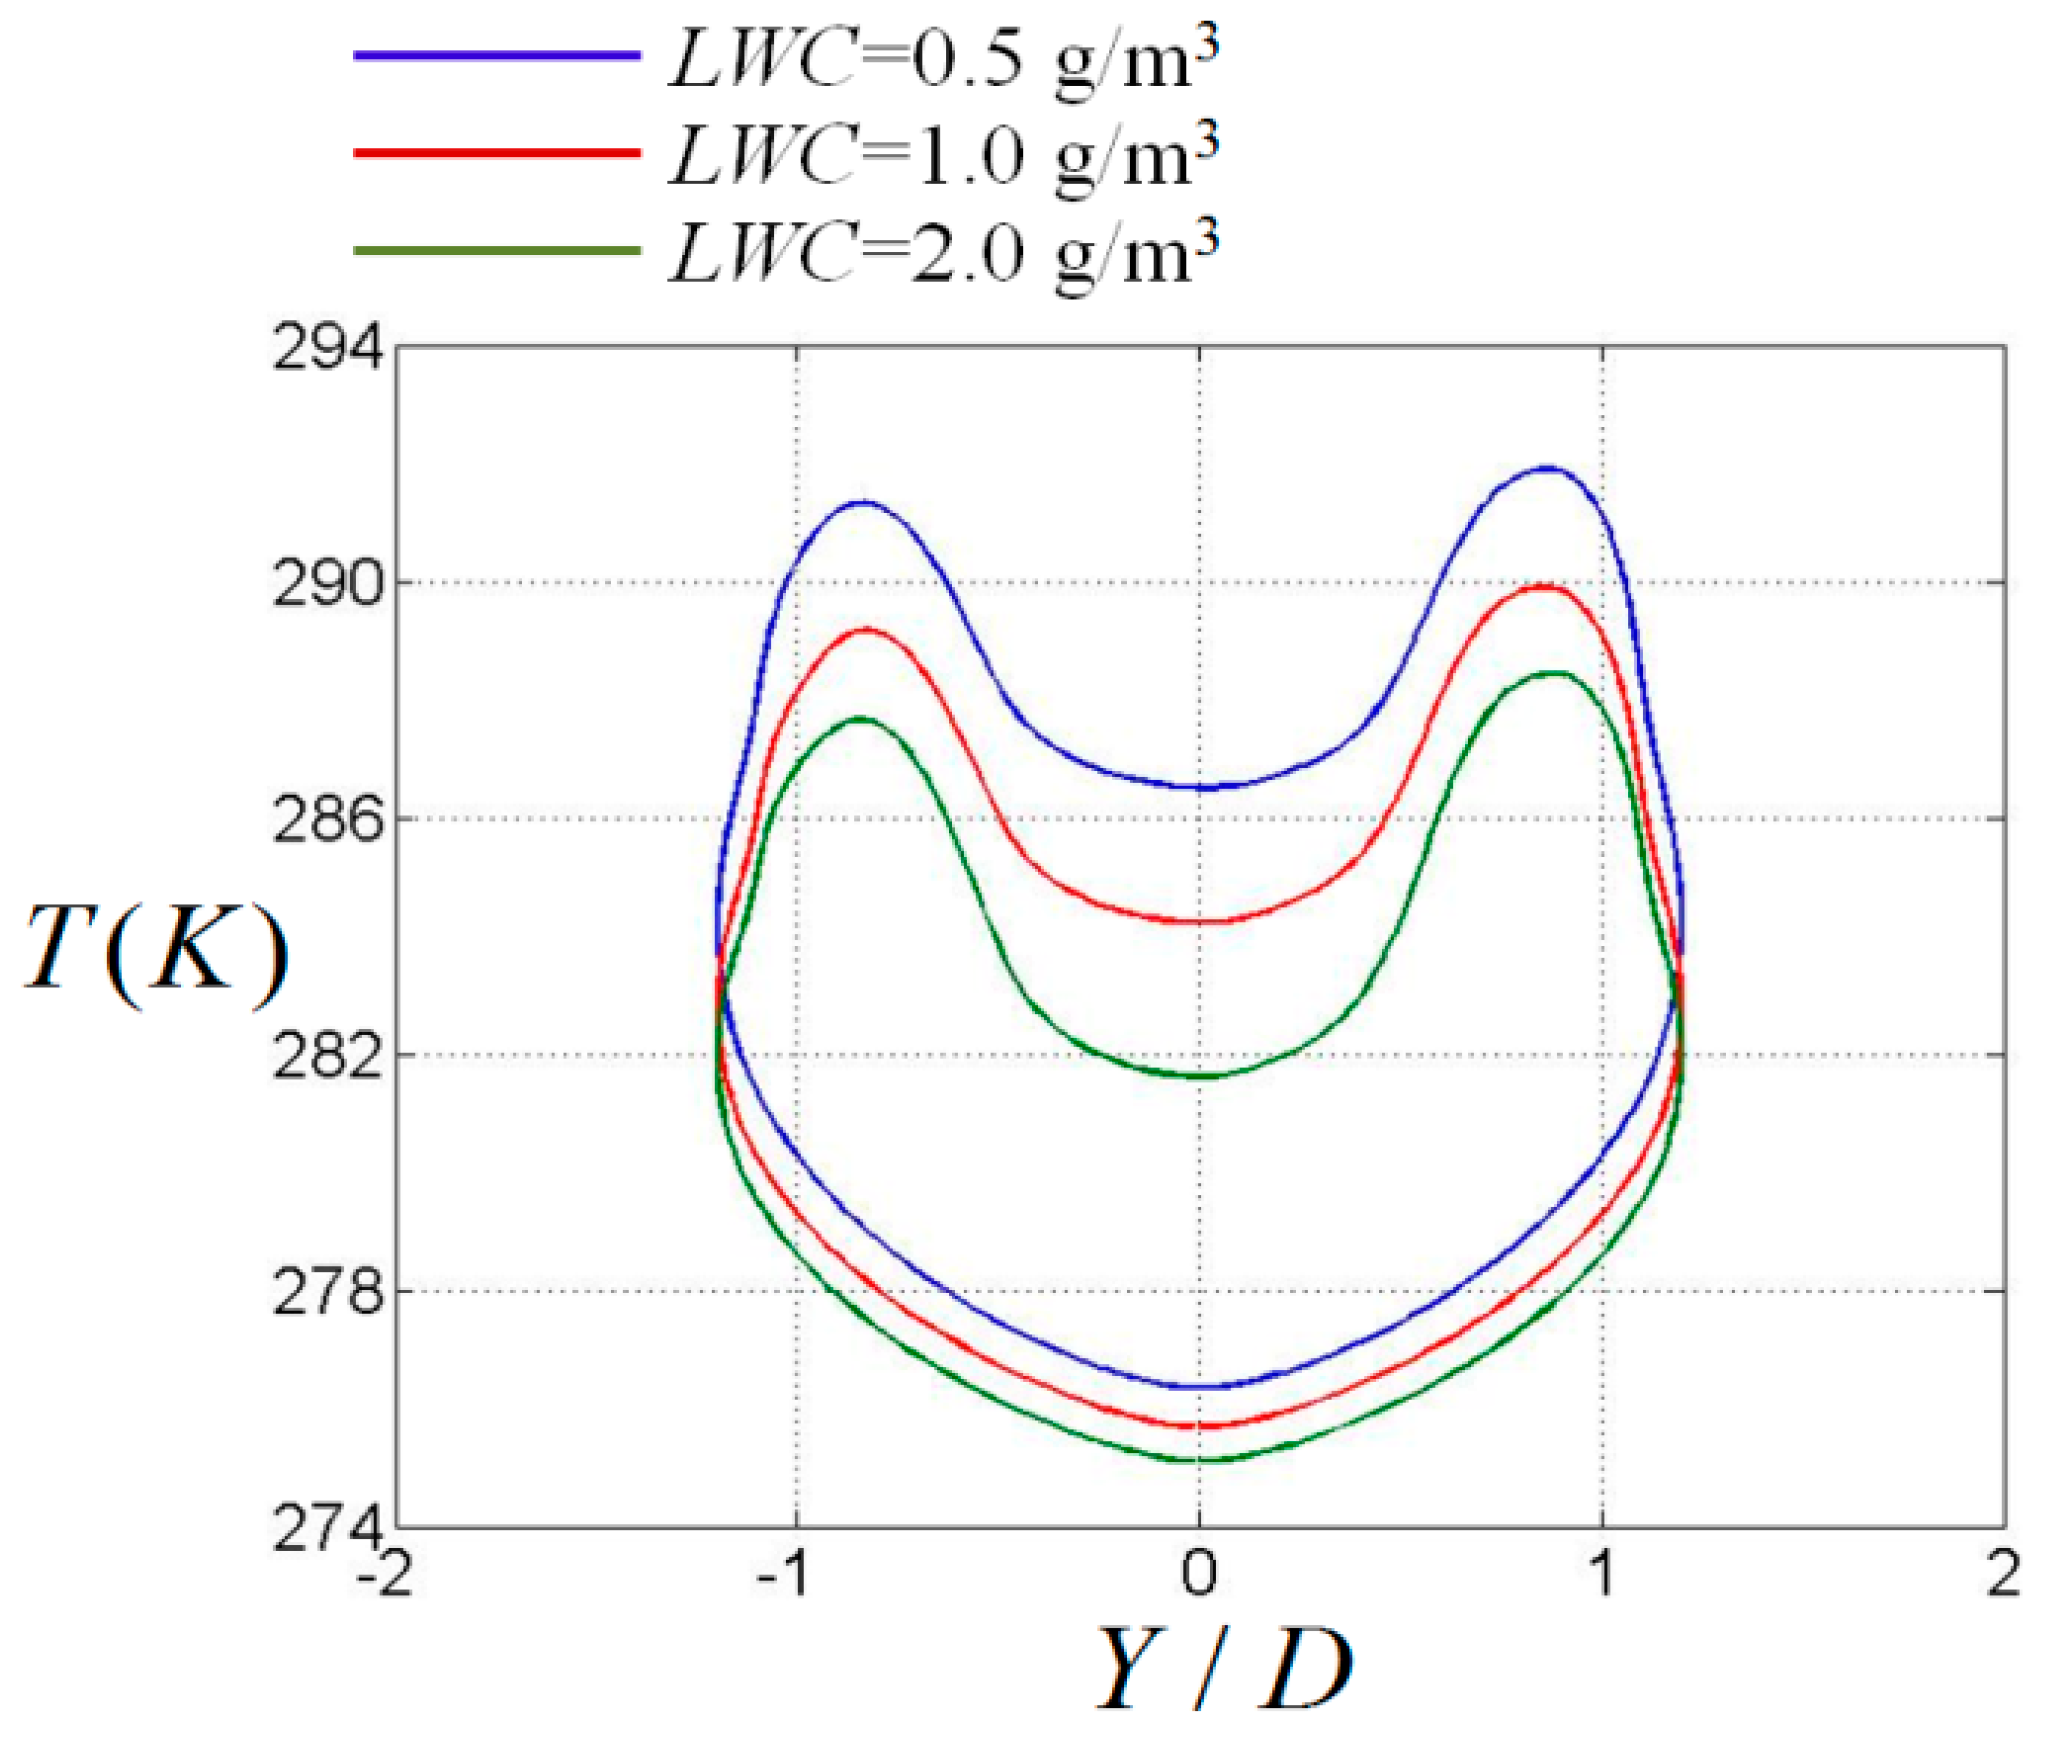
The heat absorption of water evaporation on the anti-icing surface is an important factor influencing the leading edge’s temperature magnitude.
Figure 13 gives the temperature distribution on the cross-section at the middle of two jets as the
LWC ranged from 0.5 g/m
3 to 2.0 g/m
3. At the location corresponding to the tangential jet injection, the high-temperature region with respect to the other side had almost disappeared. It is evident that, at the mid-section between two swirl jets, the swirling flow induced less temperature asymmetry relative to that at the 3rd jet cross section. Additionally, as the water content increased, there was a gradual decrease observed in the surface temperature, and the airfoil’s leading edge temperature was most susceptible to being affected by the
LWC. The greater the
LWC was, the larger the leading edge temperature drop was. As the
LWC increased from 0.5 g/m
3 to 1.0 g/m
3, the leading edge surface temperature dropped by approximately 2 K, and when the
LWC increased from 1.0 g/m
3 to 2.0 g/m
3, the leading edge surface temperature decreased further by about 3 K.

