Article

Experimental Investigation of the Shock-Related Unsteadiness around a Spiked-Blunt Body Based on a Novel DMD Energy Sorting Criterion

1
State Key Laboratory of Mechanics and Control of Aeronautics and Astronautics Structures, Nanjing University of Aeronautics and Astronautics, Nanjing 210016, China
2
AECC Aero-Engine Control System Institute, Wuxi 214063, China
*
Author to whom correspondence should be addressed.
Aerospace 2024, 11(3), 188; https://doi.org/10.3390/aerospace11030188
Submission received: 8 January 2024 / Revised: 8 February 2024 / Accepted: 14 February 2024 / Published: 27 February 2024
(This article belongs to the Special Issue Shock-Dominated Flow)

Abstract

:
In this study, we propose a novel dynamic mode decomposition (DMD) energy sorting criterion that works in conjunction with the conventional DMD amplitude-frequency sorting criterion on the high-dimensional schlieren dataset of the unsteady flow of a spiked-blunt body at Ma = 2.2. The study commences by conducting a comparative analysis of the eigenvalues, temporal coefficients, and spatial structures derived from the three sorting criteria. Then, the proper orthogonal decomposition (POD) and dynamic pressure signals are utilised as supplementary resources to explore their effectiveness in capturing spectral characteristics and spatial structures. The study concludes by summarising the characteristics and potential applications of DMD associated with each sorting criterion, as well as revealing the predominant flow features of the unsteady flow field around the spiked-blunt body at supersonic speeds. Results indicate that DMD using the energy sorting criterion outperforms the amplitude and frequency sorting criteria in identifying the primary structures of unsteady pulsations in the flow field, which proves its superiority in handling an experimental dataset of unsteady flow fields. Moreover, the unsteady pulsations in the flow field around the spiked-blunt body under supersonic inflow conditions are observed to exhibit multi-frequency coupling, with the primary frequency of 3.3 kHz originating from the periodic motion of the aftershock.

1. Introduction

The phenomenon of flow unsteadiness is typically observed ahead of a wide range of axisymmetric forebodies, particularly when operating at supersonic and hypersonic velocities [1,2]. Various configurations, including mixed compression inlets [3,4], double cones [5,6], forward-facing cavities [7], axially positioned cavities [8], wall protrusions [9], and spiked/aerodisk forebodies [10,11,12], have been identified as significant sources of flow unsteadiness. This unsteadiness spans a broad spectrum of flow Reynolds numbers, which affects laminar and turbulent flow states [13,14,15]. In general, the most pronounced form of shock-related unsteadiness is referred to as ‘buzzing’ [16,17]. This phenomenon is primarily induced by inviscid, unsteady shock processes [18] and is known for its potential to inflict severe damage to the structure of the vehicle. By contrast, another form of flow unsteadiness, which is predominantly influenced by the interactions between the viscous shock wave and the turbulent boundary layer, is observed to be less severe when compared with the buzzing phenomenon [19,20].
During the supersonic flight, the forebody of the aircraft encounters substantial post-shock total pressure and undergoes localised aerothermal ablation phenomena [21]. Currently, the most widely adopted measures for reducing drag and providing thermal protection to supersonic aircraft forebodies involve the incorporation of slender cylindrical rods at the stagnation point of the incoming flow to form a ‘spiked-blunt body’ configuration [1]. In terms of flow stability, spiked forebodies generally exhibit a steady flow pattern. A necessary requirement to maintain flow stability dictates that at least a single streamline within the shear layer, known as the dividing streamline [22], must stagnate on the forebody [23]. However, the flow may exhibit unsteadiness under certain circumstances, depending on factors such as spike length, freestream Mach number, and forebody configuration. Two distinct modes of flow instability are associated with the use of a mechanical spike device: violent pulsation and mild oscillation, both characterised by self-sustained periodic variations in the flow field structures. The violent mode is commonly referred to as the ‘pulsation mode’, while the mild mode is termed the ‘oscillation mode’ [24]. The two modes are typically observed with flat or highly blunt conical forebodies. On the contrary, hemispherical and spherically blunted forebodies equipped with mechanical spikes generally exhibit steady flow. However, manifestations of the mild oscillation mode have been recorded in these scenarios [25,26,27]. The introduction of an aerodisk at the spike tip has been demonstrated to stabilise the flow for certain spike lengths [28]. Typical flow field structures during steady and unsteady states are depicted in Figure 1. The investigation of the flow unsteadiness of the spiked-blunt body is critical for preserving the structural integrity of the vehicle and flight control during actual flight.
Dynamic mode decomposition (DMD) is a data-driven algorithm that is designed to extract dynamic information from experimental measurements or numerical simulations of flow fields. DMD was introduced by Schmid [29,30], and it has been widely applied in fluid mechanics to analyse the essential features of complex unsteady flows and construct lower-order dynamic models of flow fields. A fundamental aspect of the DMD method is the conceptualisation of flow evolution as a linear, dynamic process. By conducting an eigenanalysis of snapshots depicting the flow evolution process, the method provides lower-order modes that encapsulate flow field information along with their corresponding eigenvalues. A distinctive feature of the DMD method is that each mode corresponds to a singular frequency and a specific growth rate. This feature provides DMD with a significant advantage when analysing dynamic linear and cyclical flows. Furthermore, DMD allows for the direct representation of flow evolution processes through the eigenvalue of each mode, which eliminates the need for additional control equations. This simultaneous acquisition of mode characteristics and dynamic information grants DMD a unique edge over current flow field reduction methods based on system identification (using time series and input–output samples) and feature extraction (using spatial samples). Specifically, DMD facilitates the integrated modelling of space and time.
Since the introduction of DMD, it has captured the attention of numerous researchers due to its comparative simplicity [31,32,33]. Subsequent efforts have aimed to enhance the capabilities of conventional DMD, particularly in terms of pre-processing and post-processing. These advanced strategies encompass various methodologies, such as ensemble-averaging [34], sparsity-promoting techniques [35,36], and refined least-square methods [37,38,39,40]. Scholars have also deepened their understanding of the DMD algorithm by investigating the effects of noise [41] and contemplating considerations such as data updates [42], sub-Nyquist-rate data [43], and arbitrarily sampled systems [44]. Adaptations of DMD, including DMD with control [45] and input–output DMD [46], have been established to enable the design of control laws.
Notably, the conventional DMD has proven effective in capturing dominant flow modes in periodic flows or fully linear systems, with typical applications including investigations of boundary layer flows [47], transitional jets [48], airfoil transitions [49], and backward-facing step flow [50]. This effectiveness largely arises from the characteristics of most periodic or linear flows, where the magnitude of each mode can vary significantly, which allows for the straightforward identification of dominant modes from either the initial conditions or the norm of each mode. However, capturing the primary flow features becomes even more challenging when dealing with the experimental dataset of unsteady flow fields, such as the flow field around a spiked-blunt body under supersonic conditions. This challenge arises from the potential presence of multiple fundamental frequencies and the need for a greater number of numerically transient modes to fully approximate the samples. Accurate ranking of the importance of each mode requires consideration of not only the initial condition but also the evolution of the mode throughout the entire dataset.
In this study, we propose a novel energy sorting criterion that fully takes into account the initial conditions and the time evolution of each mode. The DMD with the energy sorting criterion and the conventional amplitude and frequency sorting criteria are applied to the experimental dataset of the unsteady flow of the spiked-blunt body at Ma = 2.2. A comparative analysis is conducted on the results obtained using the three sorting criteria from the perspectives of eigenvalues, temporal coefficients, and flow field structures. In addition, the experimental data are subjected to POD, and the results are discussed in conjunction with dynamic pressure signals. This study concludes by summarising the characteristics and application scenarios of DMD under the three sorting criteria and by revealing the main flow characteristics of the unsteady flow field of the spiked-blunt body under supersonic conditions.

2. Experimental Facility and Method

2.1. Direct-Connect Wind Tunnel

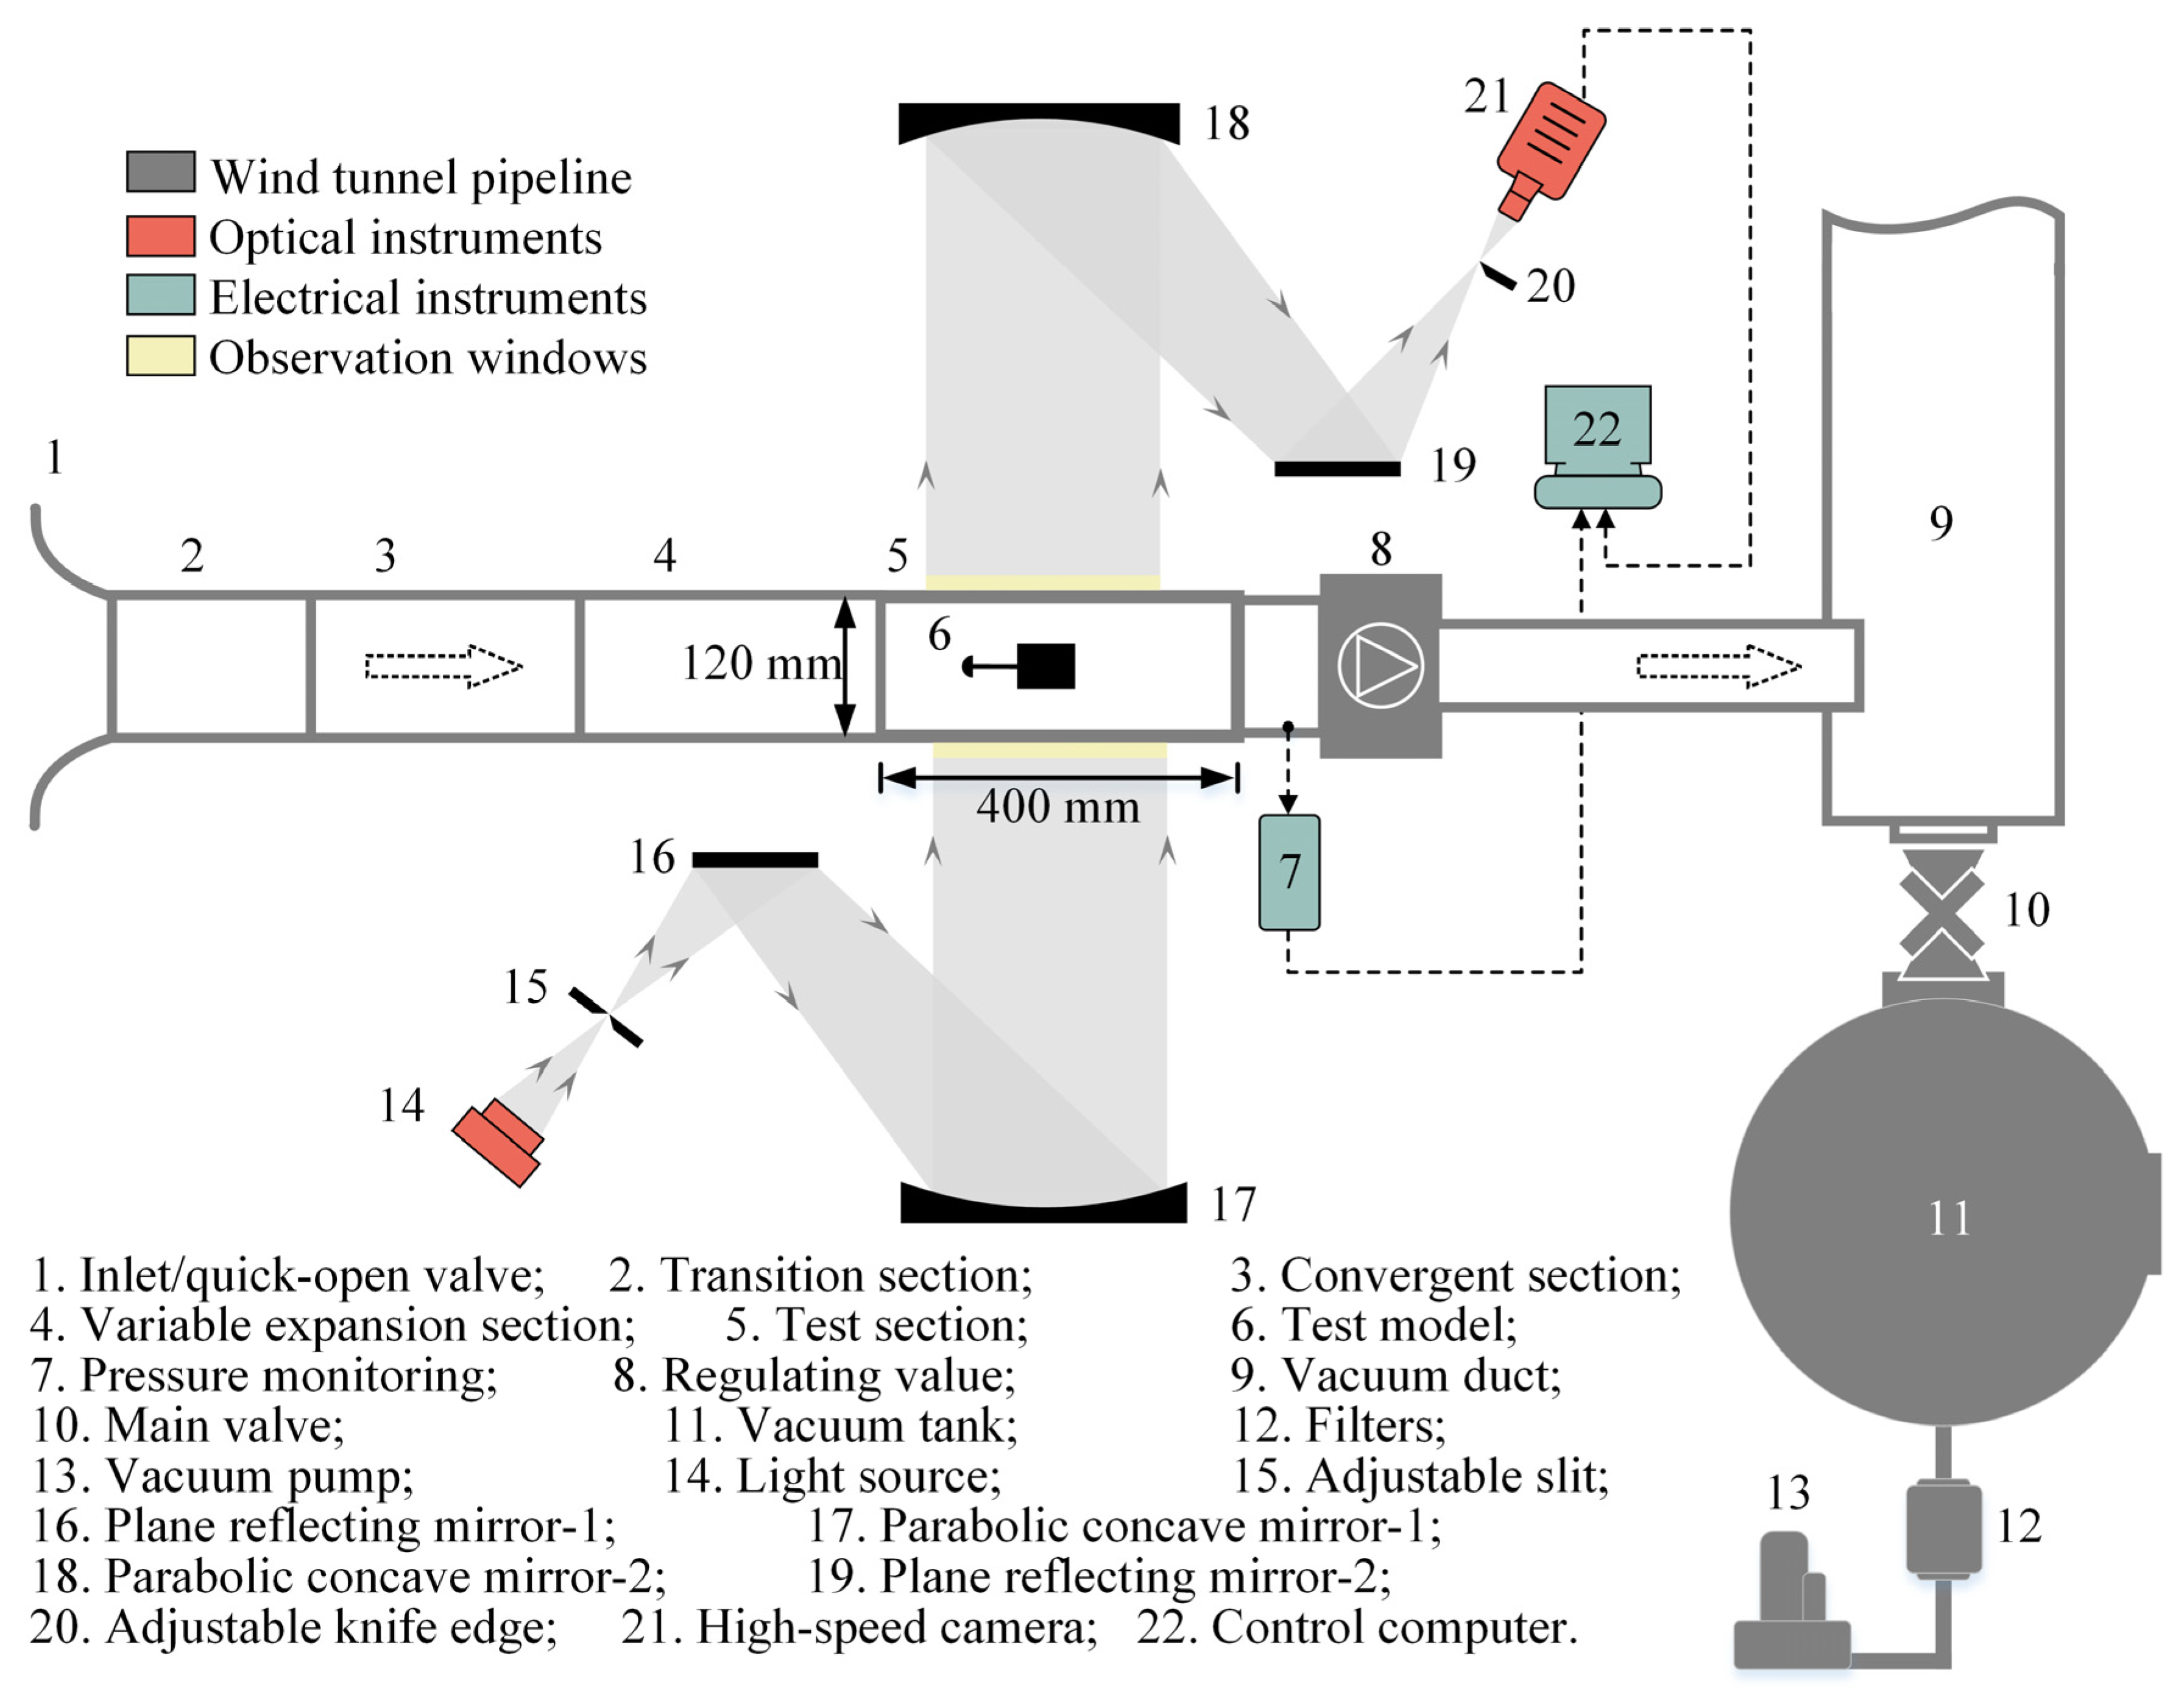
The experiment was conducted in the SCVT-1 supersonic direct-connect wind tunnel of the State Key Laboratory of Mechanics and Control of Aeronautics and Astronautics Structures at Nanjing University of Aeronautics and Astronautics. The main structure of the wind tunnel is shown in Figure 2. Given the relatively low Mach number of the experiment, a combination of an atmospheric inlet and vacuum suction was adopted. The inflow initially accelerates to supersonic through the facility nozzle, then enters the test section, and lastly exhausts into a vacuum tank with a volume of 400 m3 through the vacuum pipeline.
The size of the test section is 400 × 120 × 160 mm3, and it is surrounded by plexiglass side walls on all sides. This design enables the execution of high-speed schlieren experiments. Calibration results indicate that the Mach number of the wind tunnel is Ma = 2.2. During the experiment, the total pressure of the wind tunnel inlet was 101 kPa, and the total temperature was maintained at 305 K. The detailed experimental conditions are meticulously documented in Table 1.

2.2. Spiked-Blunt Body Model

In this study, we utilised an experimental model comprising an aerodome and a cylindrical blunt body, as illustrated in Figure 3a. The diameter of blunt body D was determined by applying one-dimensional isentropic flow theory and one-dimensional normal shock wave theory while considering the unstarting problem inherent to a direct-connected wind tunnel. In addition, the safe blockage ratio Am/Ae of the wind tunnel was calculated based on the wind tunnel’s operating Mach number Mae and the coefficient of total pressure loss σ. The detailed derivation processes for these considerations are provided in previous research [51] conducted on this wind tunnel, with the final result expressed in the form of Equation (1):
A m A e = 1 M a e σ [ 2 k + 1 ( 1 + k 1 2 M a e 2 ) ] k + 1 2 ( k 1 ) × { ( 2 k k + 1 M a e 2 k 1 k + 1 ) [ k 1 k + 1 + 2 ( k + 1 ) M a e 2 ] k } 1 k 1 .
To avoid the unstart phenomenon, the diameter of blunt body D was set to 40 mm, which resulted in a blockage ratio of Am/Ae of 0.128. Based on the computational findings and the requirements of the actual experiment, the length of the cylindrical blunt body L and the spike length l were both set to D, while the spike diameter d was 0.065 D and the aerodome diameter DA was 0.36 D. These detailed parameters are documented in Table 2.
The spike was connected to the blunt body through threading and positioned using the step surface at the base of the spike. The cylindrical, blunt body is supported from the top and affixed to the upper wall of the wind tunnel using two threaded rods. Figure 3b presents the physical assembly drawing of the model at an attack angle of 0°.

2.3. High-Speed Schlieren System

The current experiment employs a Z-type schlieren optical path, as illustrated in Figure 2. Parallel light passes perpendicularly through the straight test section, and a high-speed CMOS camera, the Phantom VEO 710L, is used in conjunction with a continuously adjustable LED light source (0–100 W) to capture the unsteady flow field. The exposure time of the camera is set to 1.74 μs. The sampling frequency fs of the camera is set to 22 kHz to capture as much information as possible about the unsteady flow field. According to the Nyquist sampling theorem, this setup allows for the capture of flow field characteristic frequencies up to 11 kHz. Considering the need for resolution and the sensitivity to small density gradients and orientations, a slit configuration was chosen for the schlieren system. Meanwhile, the knife-edge direction and the slit length direction are set vertically in this experiment. As a result, the obtained schlieren images can reflect the density gradient variations in the flow field in the horizontal direction.
The experiment simultaneously monitors unsteady pressure fluctuations on the windward side of the cylinder using pressure taps. As shown in Figure 3, four measurement points are situated at half the cylindrical diameter and evenly distributed in the circumferential direction. Fluctuating temporal pressure signals are recorded using a dynamic pressure sensor (Kulite XTL190SM) and a pressure acquisition card (NI USB-9162). The sensor has a rated measurement pressure of 120 kPa with an accuracy of ±0.05% of the full range. The acquisition rate of the pressure sensors is set to 10 kHz. According to the Nyquist sampling theorem, this configuration enables the capture of pulsating pressure signals up to 5 kHz.

2.4. Dynamic Mode Decomposition

The experimentally derived data are processed into a snapshot sequence from the 1st to Nth moment {x1, x2, x3, …, xN}, where the column vector xi represents the flow field snapshot at the ith moment. At this stage, a linear transformation relationship exists between the flow field xi+1 and the adjacent moment’s flow field xi, as defined by Equation (2):
x i + 1 = A x i .
where A represents the system matrix of the high-dimensional flow field. This procedure is a linear estimating process, even if the dynamic system is nonlinear. Because a linear relationship is assumed, the dynamical characteristics are contained in the eigenvalues of matrix A. By utilising the flow field snapshots from the 1st to Nth moment, two snapshot matrices can be constructed as X = {x1, x2, x3, …, xN−1} and Y = {x2, x3, x4, …, xN}, as per Equation (3):
Y = { x 2 , x 3 , x 4 , , x N } = { A x 1 , A x 2 , A x 3 , , A x N 1 } = A X .
This study employs singular value decomposition (SVD) to perform similarity transformations on high-order operators to obtain a low-order representation of the system and extract the dominant eigenvalues and primary DMD modes.
The high-dimensional matrix A can be replaced by a low-dimensional similar matrix A ˜ . To find the orthogonal space of the similarity transformation, SVD is performed on the matrix X, as defined by Equations (4) and (5):
X = U Σ V H ,
A = U A ˜ U H .
The matrix Σ is a diagonal matrix with r singular values on its diagonal, and the unitary matrices U and V satisfy UHU = I and VHV = I. It should be noted that the SVD was truncated in this study for noise reduction of the experimental data. When truncating the SVD in DMD, the premise is to retain only the dominant modes or components that capture the most significant dynamics of the system while discarding the less significant modes. This truncation is often carried out based on the decay of the singular values. The calculation of the matrix A ˜ can be viewed as a minimisation problem of the Frobenius norm, which is used to solve for the approximate matrix, as per Equation (6):
A A ˜ = U H Y V Σ 1 .
Given that the matrix A ˜ is a similarity transformation of the matrix A, it contains the primary eigenvalues of A. The eigenvalues of the matrix A ˜ are determined by Equation (7):
A ˜ Λ j = λ j Λ j ,
where λj is the jth eigenvalue of A ˜ and Λ j is the eigenvector corresponding to the eigenvalue λj. This procedure allows the calculation of the jth DMD mode, as defined by Equation (8):
Φ j = U Λ j .
The growth rate gj and frequency ωj corresponding to the jth mode are given by Equations (9) and (10):
g j = Re { lg ( λ j ) } / Δ t ,
w j = Im { lg ( λ j ) } / Δ t ,
The magnitude of the amplitude of the jth mode represents the contribution of this mode to the initial snapshot x1. The modal amplitude corresponding to the jth mode is given by Equation (11):
α j = Λ j 1 U H x 1 .
The method used to determine the dominant DMD mode is usually not unique. The current general method is to sort all the modes based on the characteristic parameters and extract a subset of the front modes to represent the primary features of the flow field. Each sorting method has its own unique advantages and disadvantages. The conventional frequency sorting criterion and amplitude sorting criterion take the modal frequency and amplitude as the characteristic parameters, as illustrated in Equations (10) and (11), respectively. They differ in their focus and application, with the former focusing more on the intrinsic dynamic properties of the flow field and the latter focusing more on the actual behaviour and response of the flow field during vibration.
For each mode, DMD calculates a corresponding temporal coefficient, which describes the evolution of that mode over time. To further analyse the flow unsteadiness, the temporal coefficient of the jth mode at time instant i is defined by Equation (12):
C i j = ( λ j ) i 1 α j .
This study proposes an energy sorting criterion specifically designed for experimental data on unsteady flow fields. This criterion considers initial conditions and the temporal evolution of each mode. In addition to assessing the temporal coefficient, it integrates the spatial elements of each mode. It defines the Frobenius norm of the space–time matrix of each mode as the total energy of that mode throughout the entire period, as shown in Equation (13):
E j = Φ j C j F 2 .
To highlight the advantages of the energy sorting criterion in handling an experimental dataset of unsteady flow fields, this criterion is applied to high-speed schlieren snapshots of the unsteady flow field around a spiked-blunt body. The results are compared with those obtained using the conventional amplitude and frequency sorting criteria. Moreover, the validity of the results is verified by combining the POD results with the dynamic pressure signals.

3. Results and Discussion

3.1. Conventional Amplitude Sorting Criterion

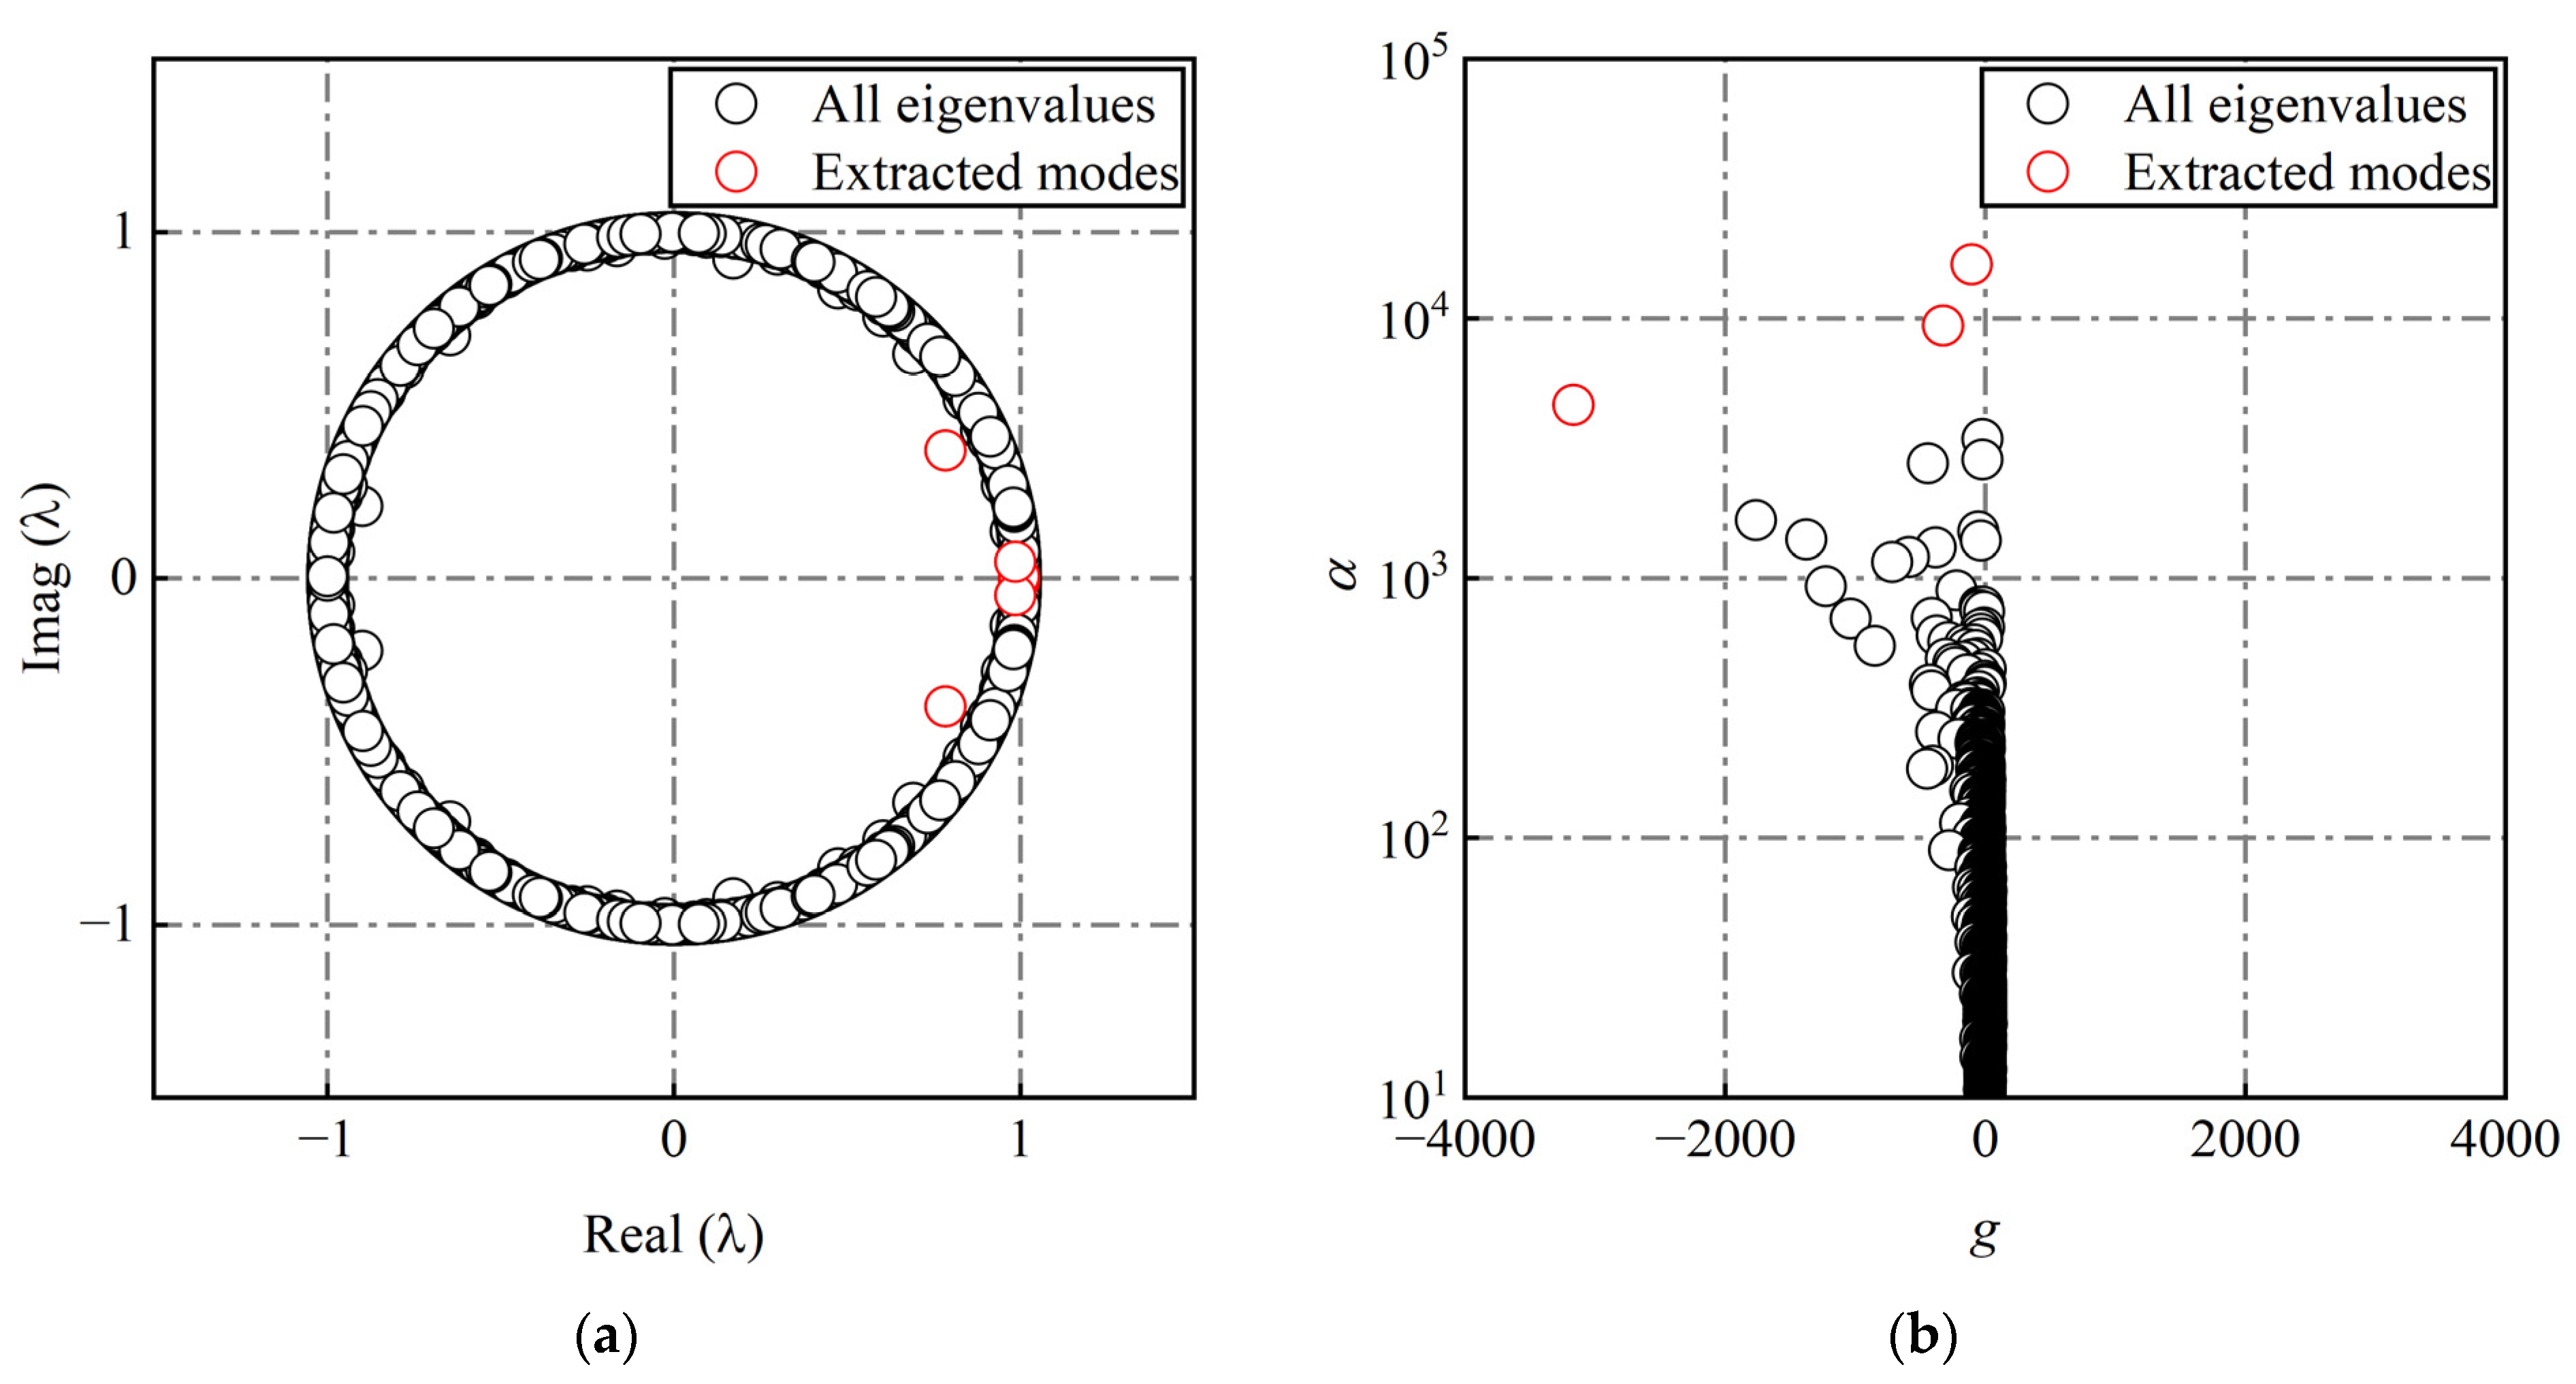
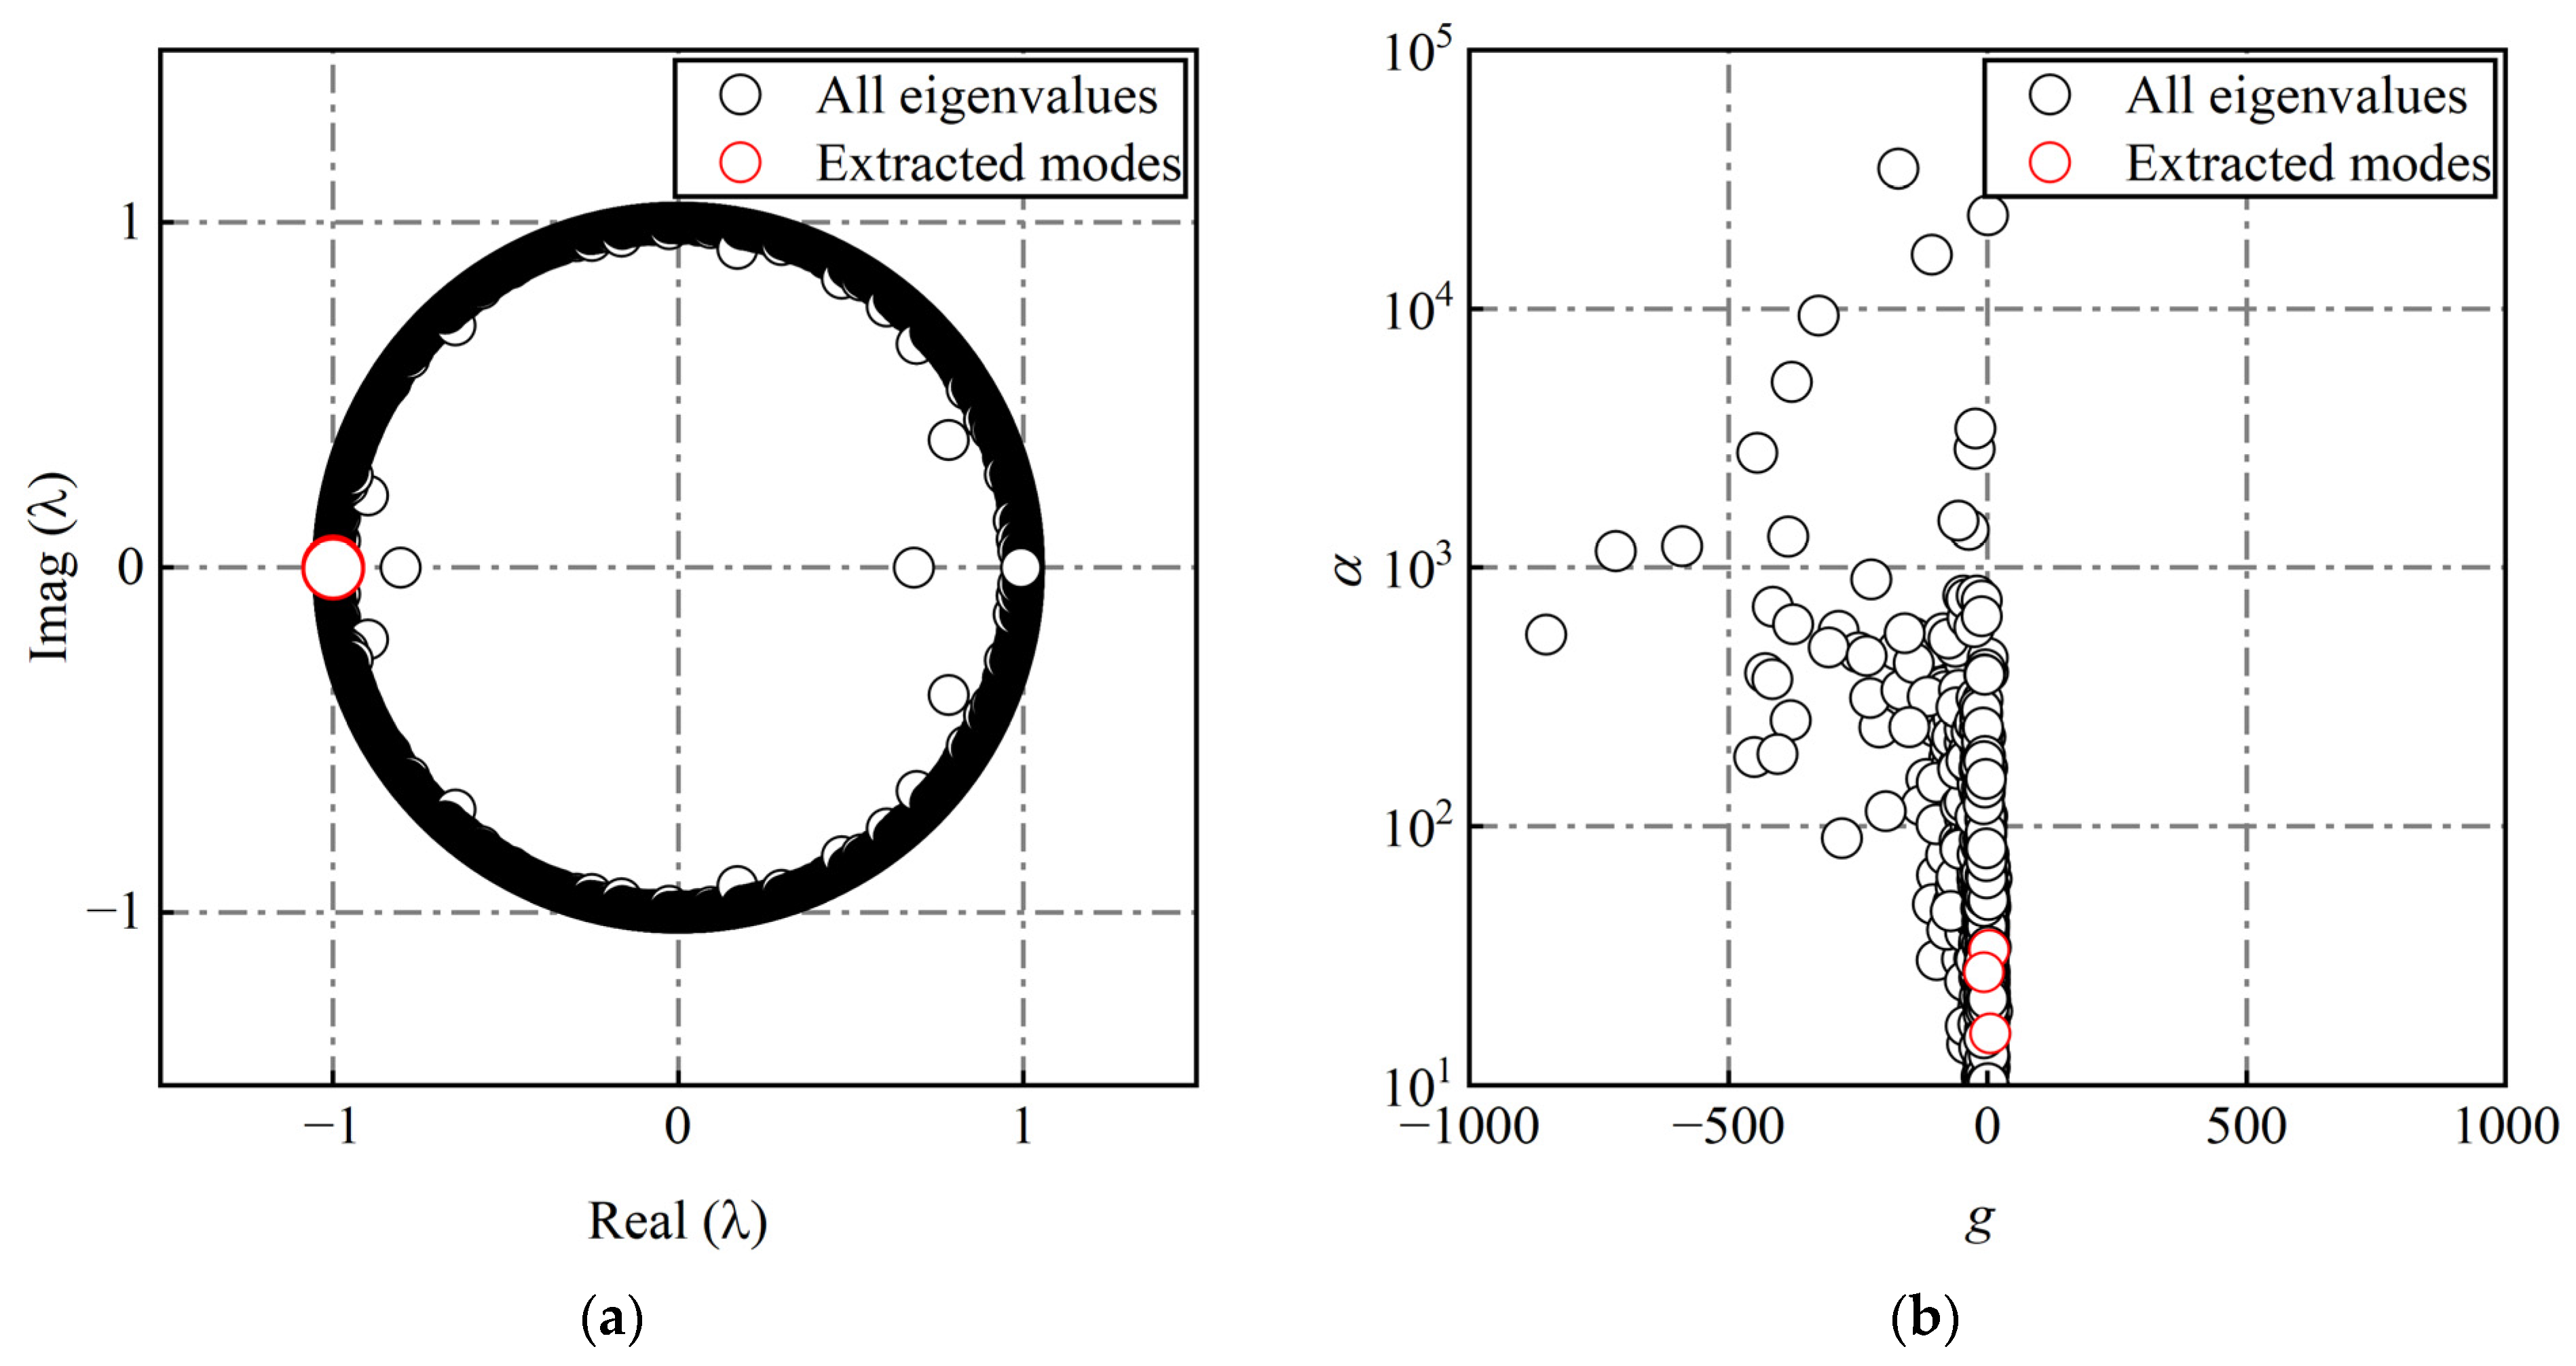
The amplitude sorting criterion is a commonly used method in conventional DMD. This section presents the results obtained by applying DMD to 5000 consecutively acquired schlieren snapshots from a single experiment and sorting the modes according to their amplitude magnitudes. Figure 4a illustrates the distribution of eigenvalues of the modes after applying DMD. Each unit circle in the diagram denotes the eigenvalue of a mode, with the coordinates of each point representing the real and imaginary parts of the eigenvalues. Circles located on the unit circle indicate stable modes; those within the unit circle represent decaying modes; and those outside the unit circle are unstable modes. The eigenvalues appear in conjugate pairs, with most mode eigenvalues located on the unit circle. A small fraction of modes with high amplitudes are within the unit circle, which suggests that most flow fields are stable following DMD, with only a few modes starting with high initial amplitudes that subsequently decay. The eigenvalues of the first six DMD modes have been extracted and marked with red circles. These eigenvalues are all located within the unit circle. This condition indicates that the initial amplitudes of the first six modes are high, but they are expected to decay over time and are classified as decaying modes. In Figure 4b, the relationship between the growth rate and amplitude of each mode is illustrated, which reveals a general trend where stable modes have smaller amplitudes and lower growth rates, while decaying modes have larger amplitudes and higher growth rates. Among the first six modes, the first four exhibit relatively lower growth rates, which implies slower decay. The fifth and sixth modes have higher growth rates, which suggests a faster decay rate. This aspect is one of the shortcomings of the amplitude sorting criterion, which will be further discussed in the subsequent sections.
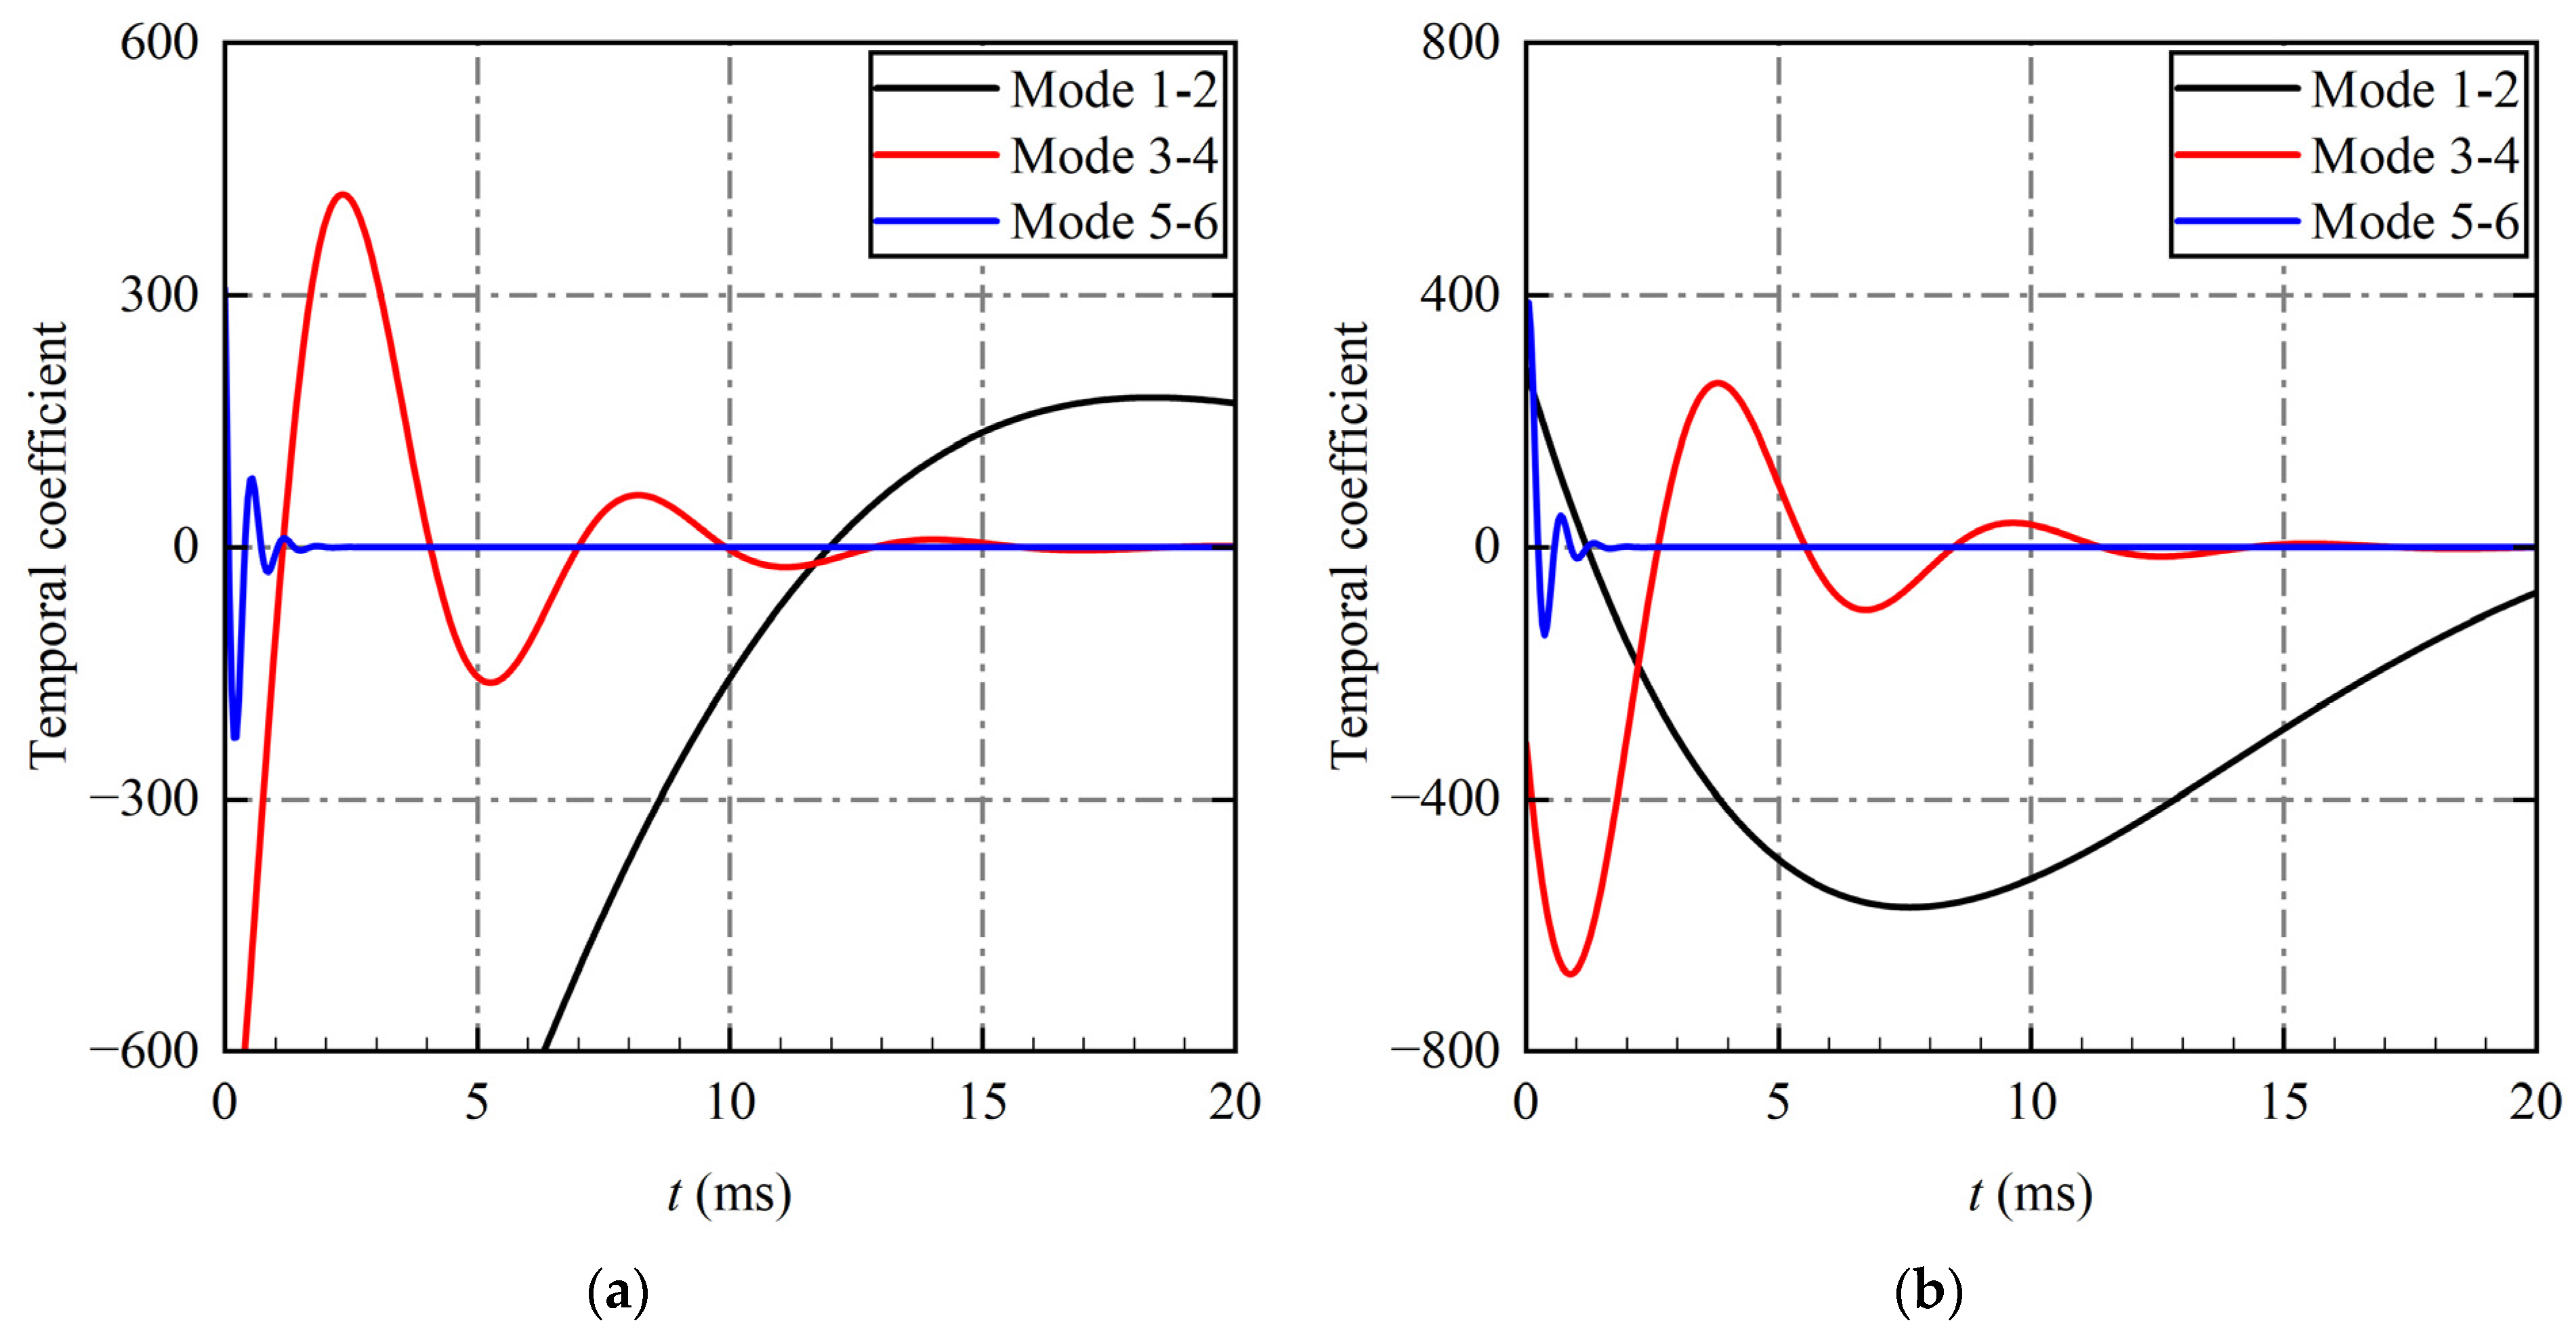
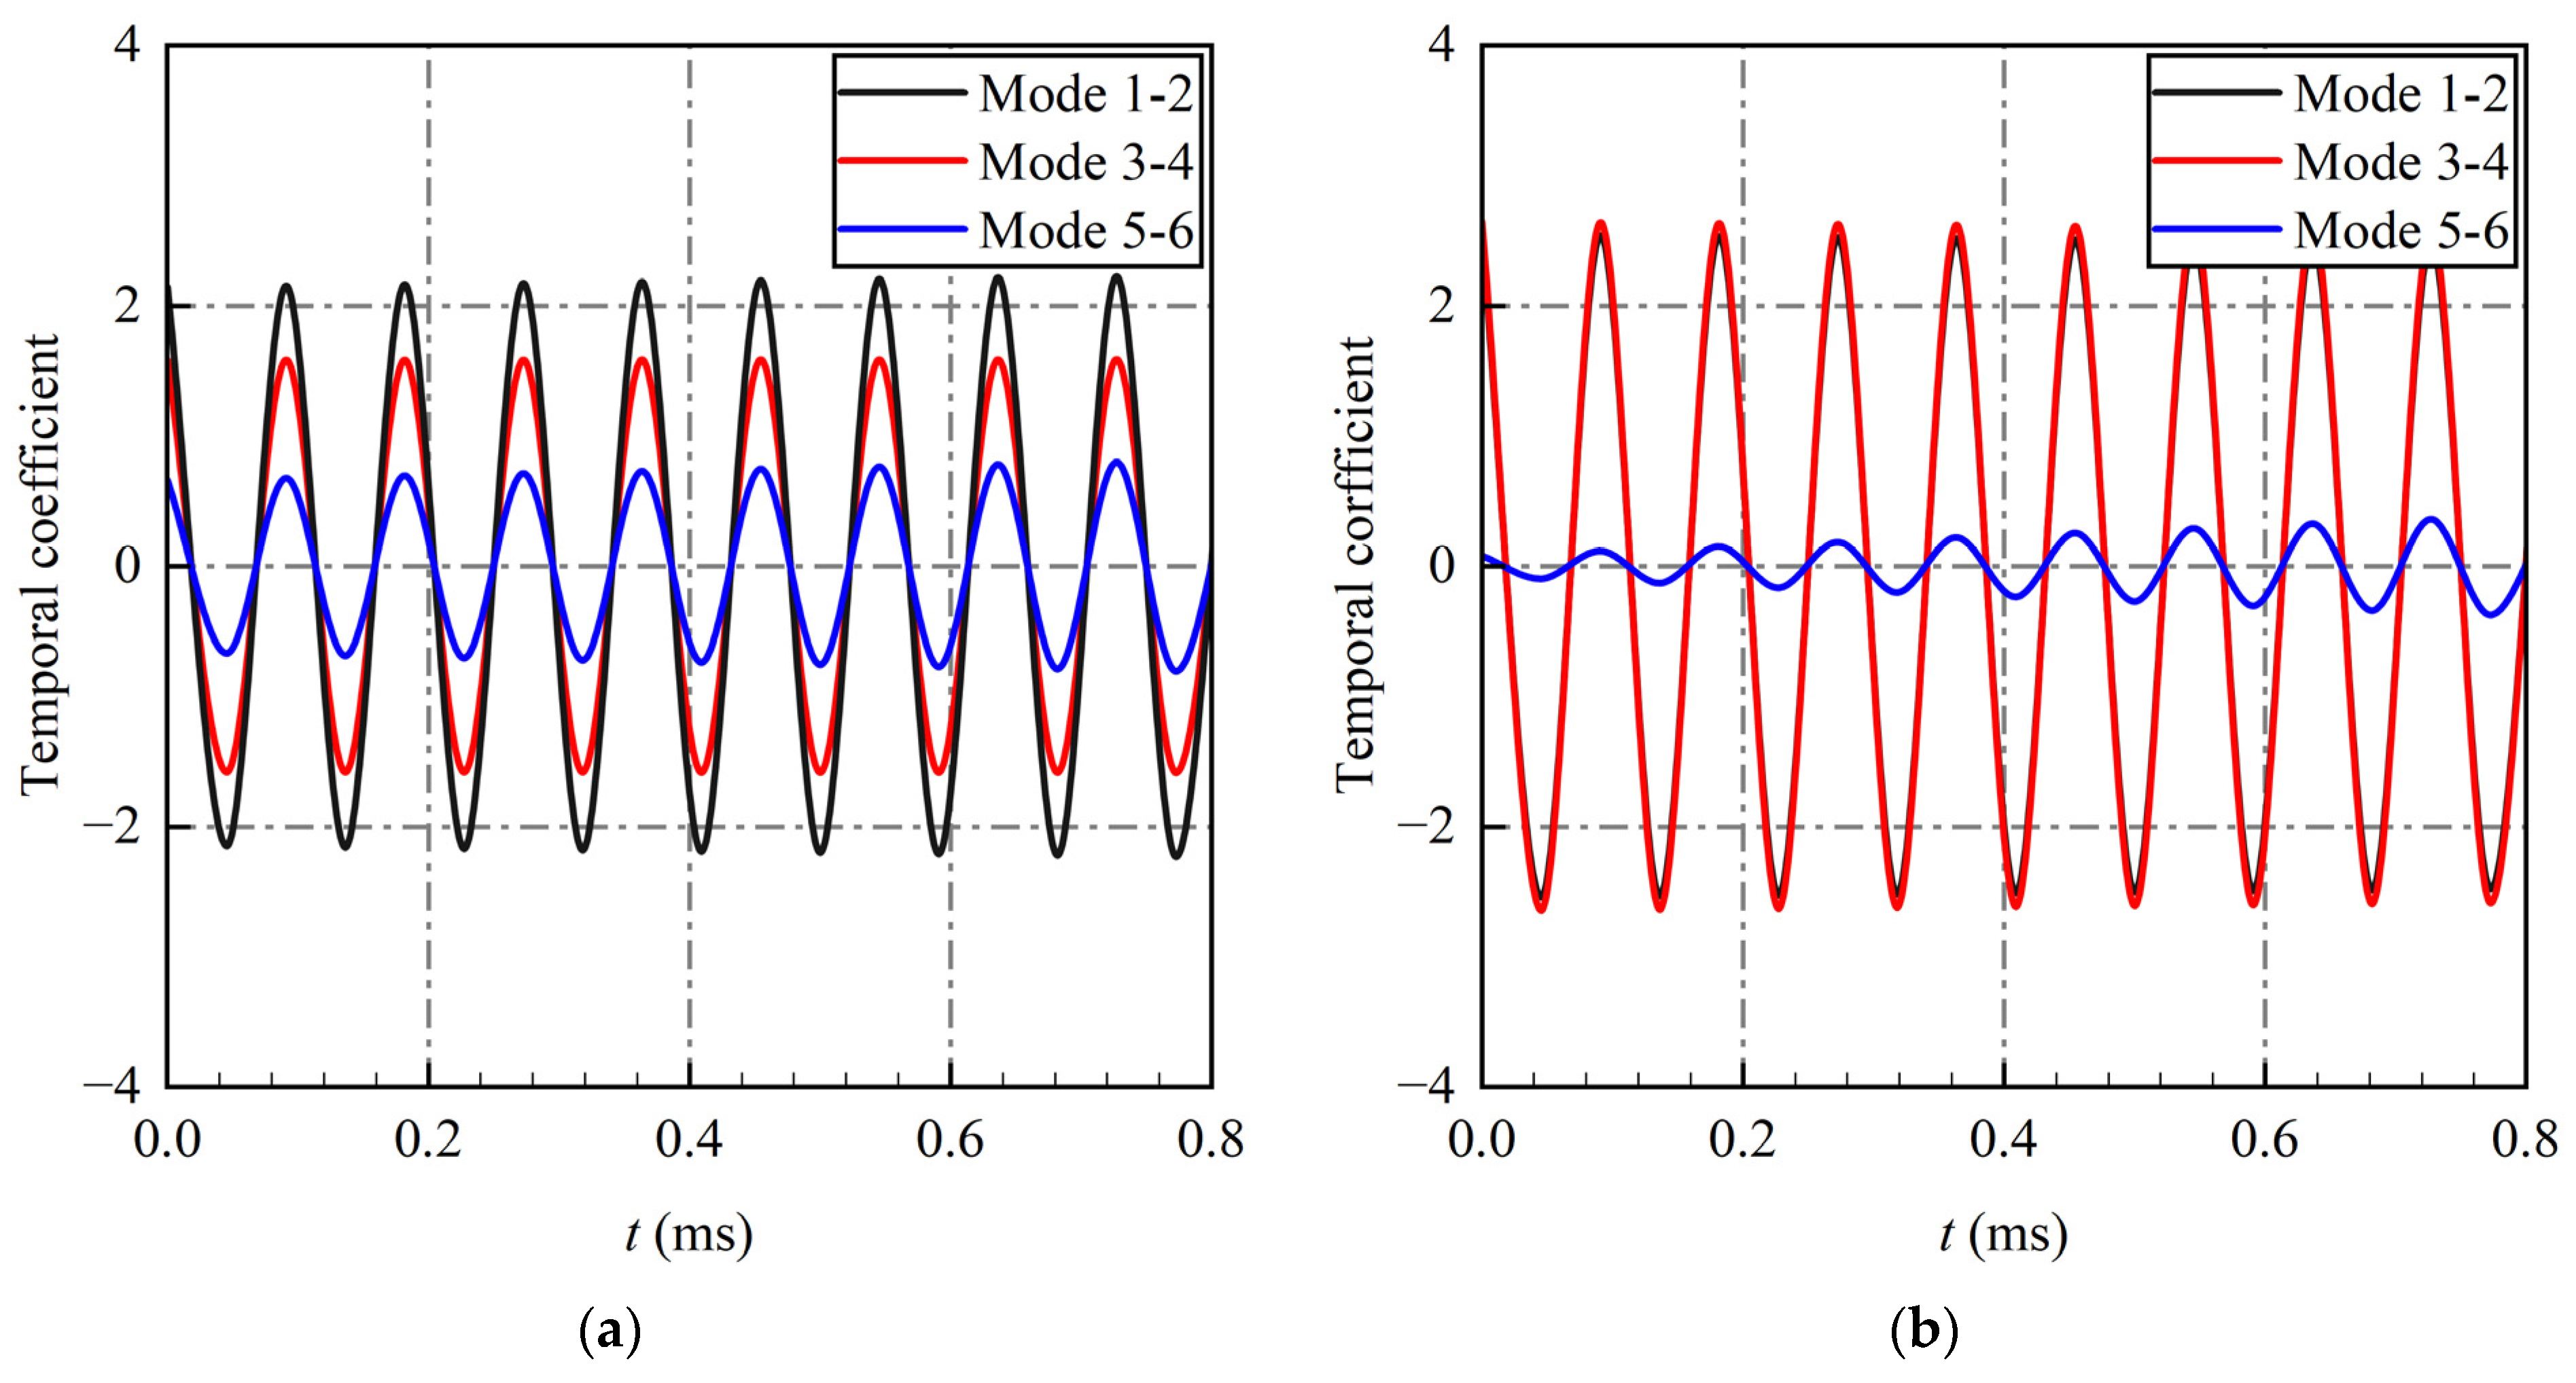
Each mode appears in conjugate pairs, with the same real part for the even and odd modes of a pair and a 180° phase difference in the imaginary part. Therefore, only the odd modes are used to represent a pair of conjugate modes in this study, such as mode 1–2, which represents the common real part of modes 1 and 2, as well as the imaginary part of mode 1. Figure 5 depicts the evolution of the temporal coefficients for the first six modes of the DMD, sorted by amplitude. Figure 5a and Figure 5b represent the real part and the imaginary part, respectively. A comparison between Figure 5a,b reveals that the amplitudes and frequencies of the real and imaginary parts of the temporal coefficients for a given mode pair are nearly identical. The temporal coefficients of the first six modes all initially display high amplitudes that decay over time. Mode 1–2 exhibits the highest initial amplitudes and also the fastest rate of decay. The amplitude and decay rate progressively decrease with the increase in mode order. These observations align with the patterns of the eigenvalues of the first six modes shown in Figure 4.
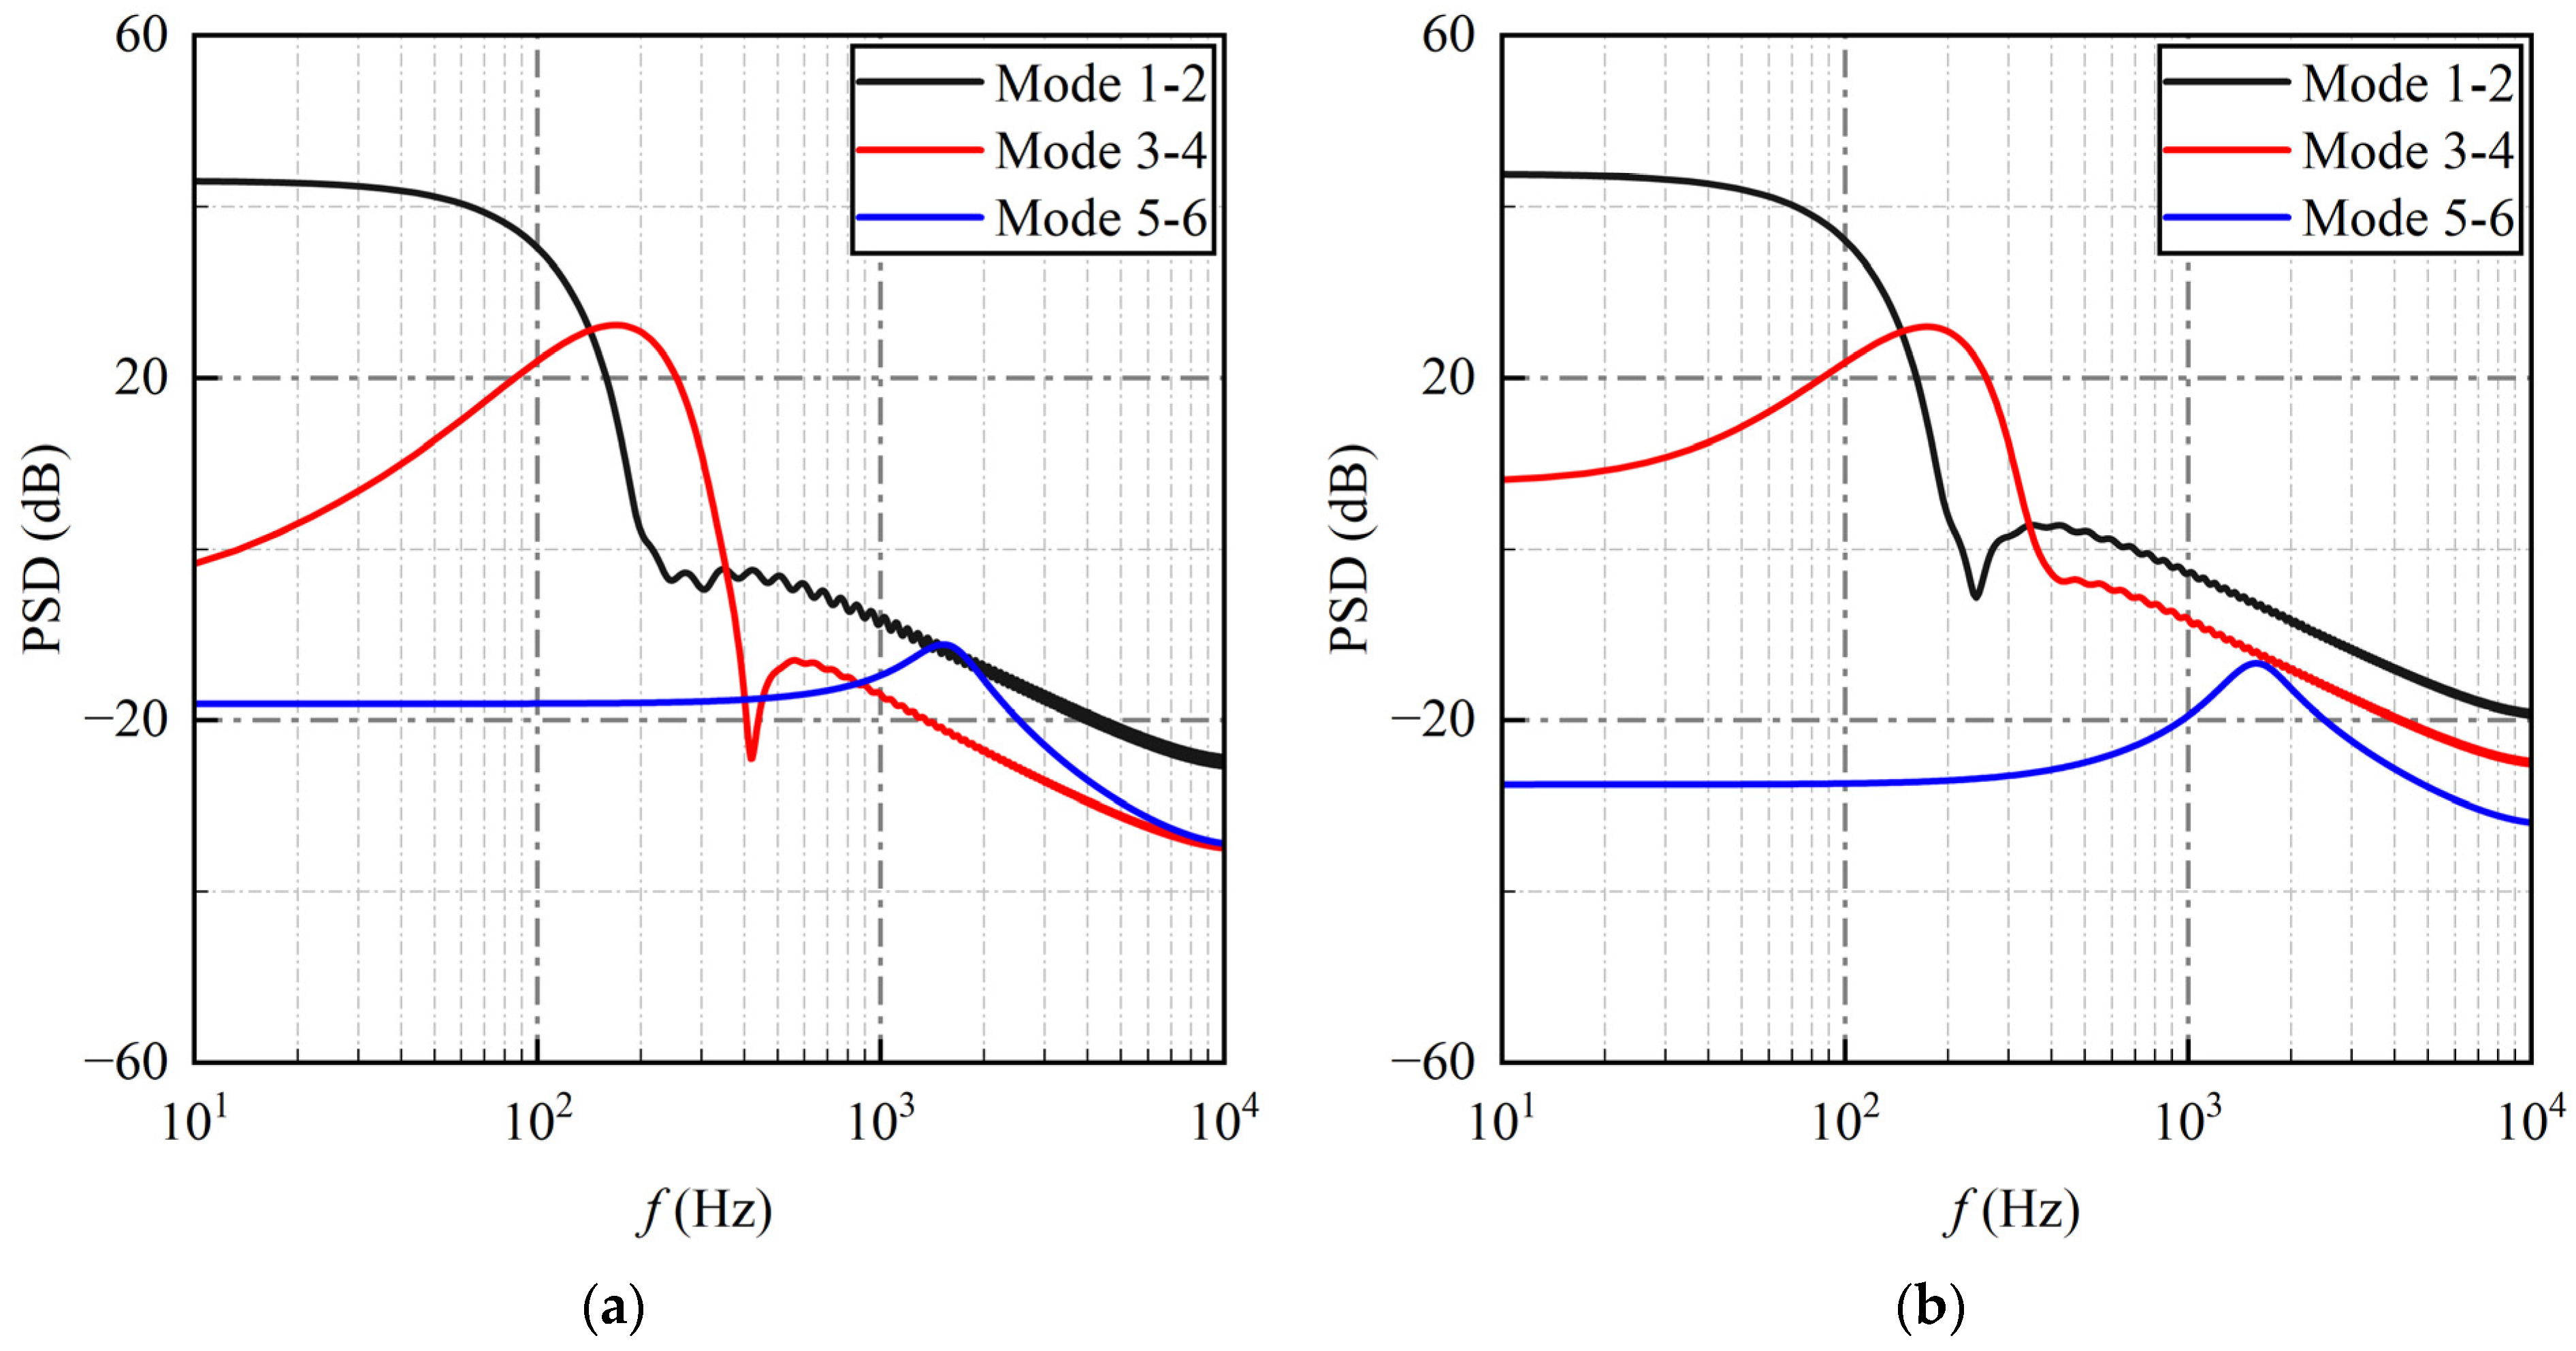
Figure 6 presents the power spectral density (PSD) of the temporal coefficients for the first six modes of the DMD using the amplitude sorting criterion. Figure 6a and Figure 6b represent the real part and the imaginary part, respectively. A comparison between Figure 6a,b reveals that the PSD of the temporal coefficients for each mode exhibits a single frequency peak. This observation shows that the temporal coefficient variation of each mode closely approximates a simple harmonic motion at a single frequency. In other words, the unsteady pulsations in the flow field have been extracted into a combination of single-frequency modes, with each mode having a unique frequency component but a relatively dispersed energy distribution. Although the real and imaginary parts of the temporal coefficients for each mode exhibit different developmental trajectories in their PSD, they share the same peak frequencies. The first three pairs of peak frequencies are 23, 171, and 1546 Hz, respectively. The mode sorting was based on the modal amplitude magnitude, with no consideration for the decay rate. Consequently, the first mode exhibits a high initial amplitude and a high decay rate. Given its low-frequency pulsation, the first mode represents low-frequency, high-amplitude noise in the flow field rather than the evolution of the main flow field.
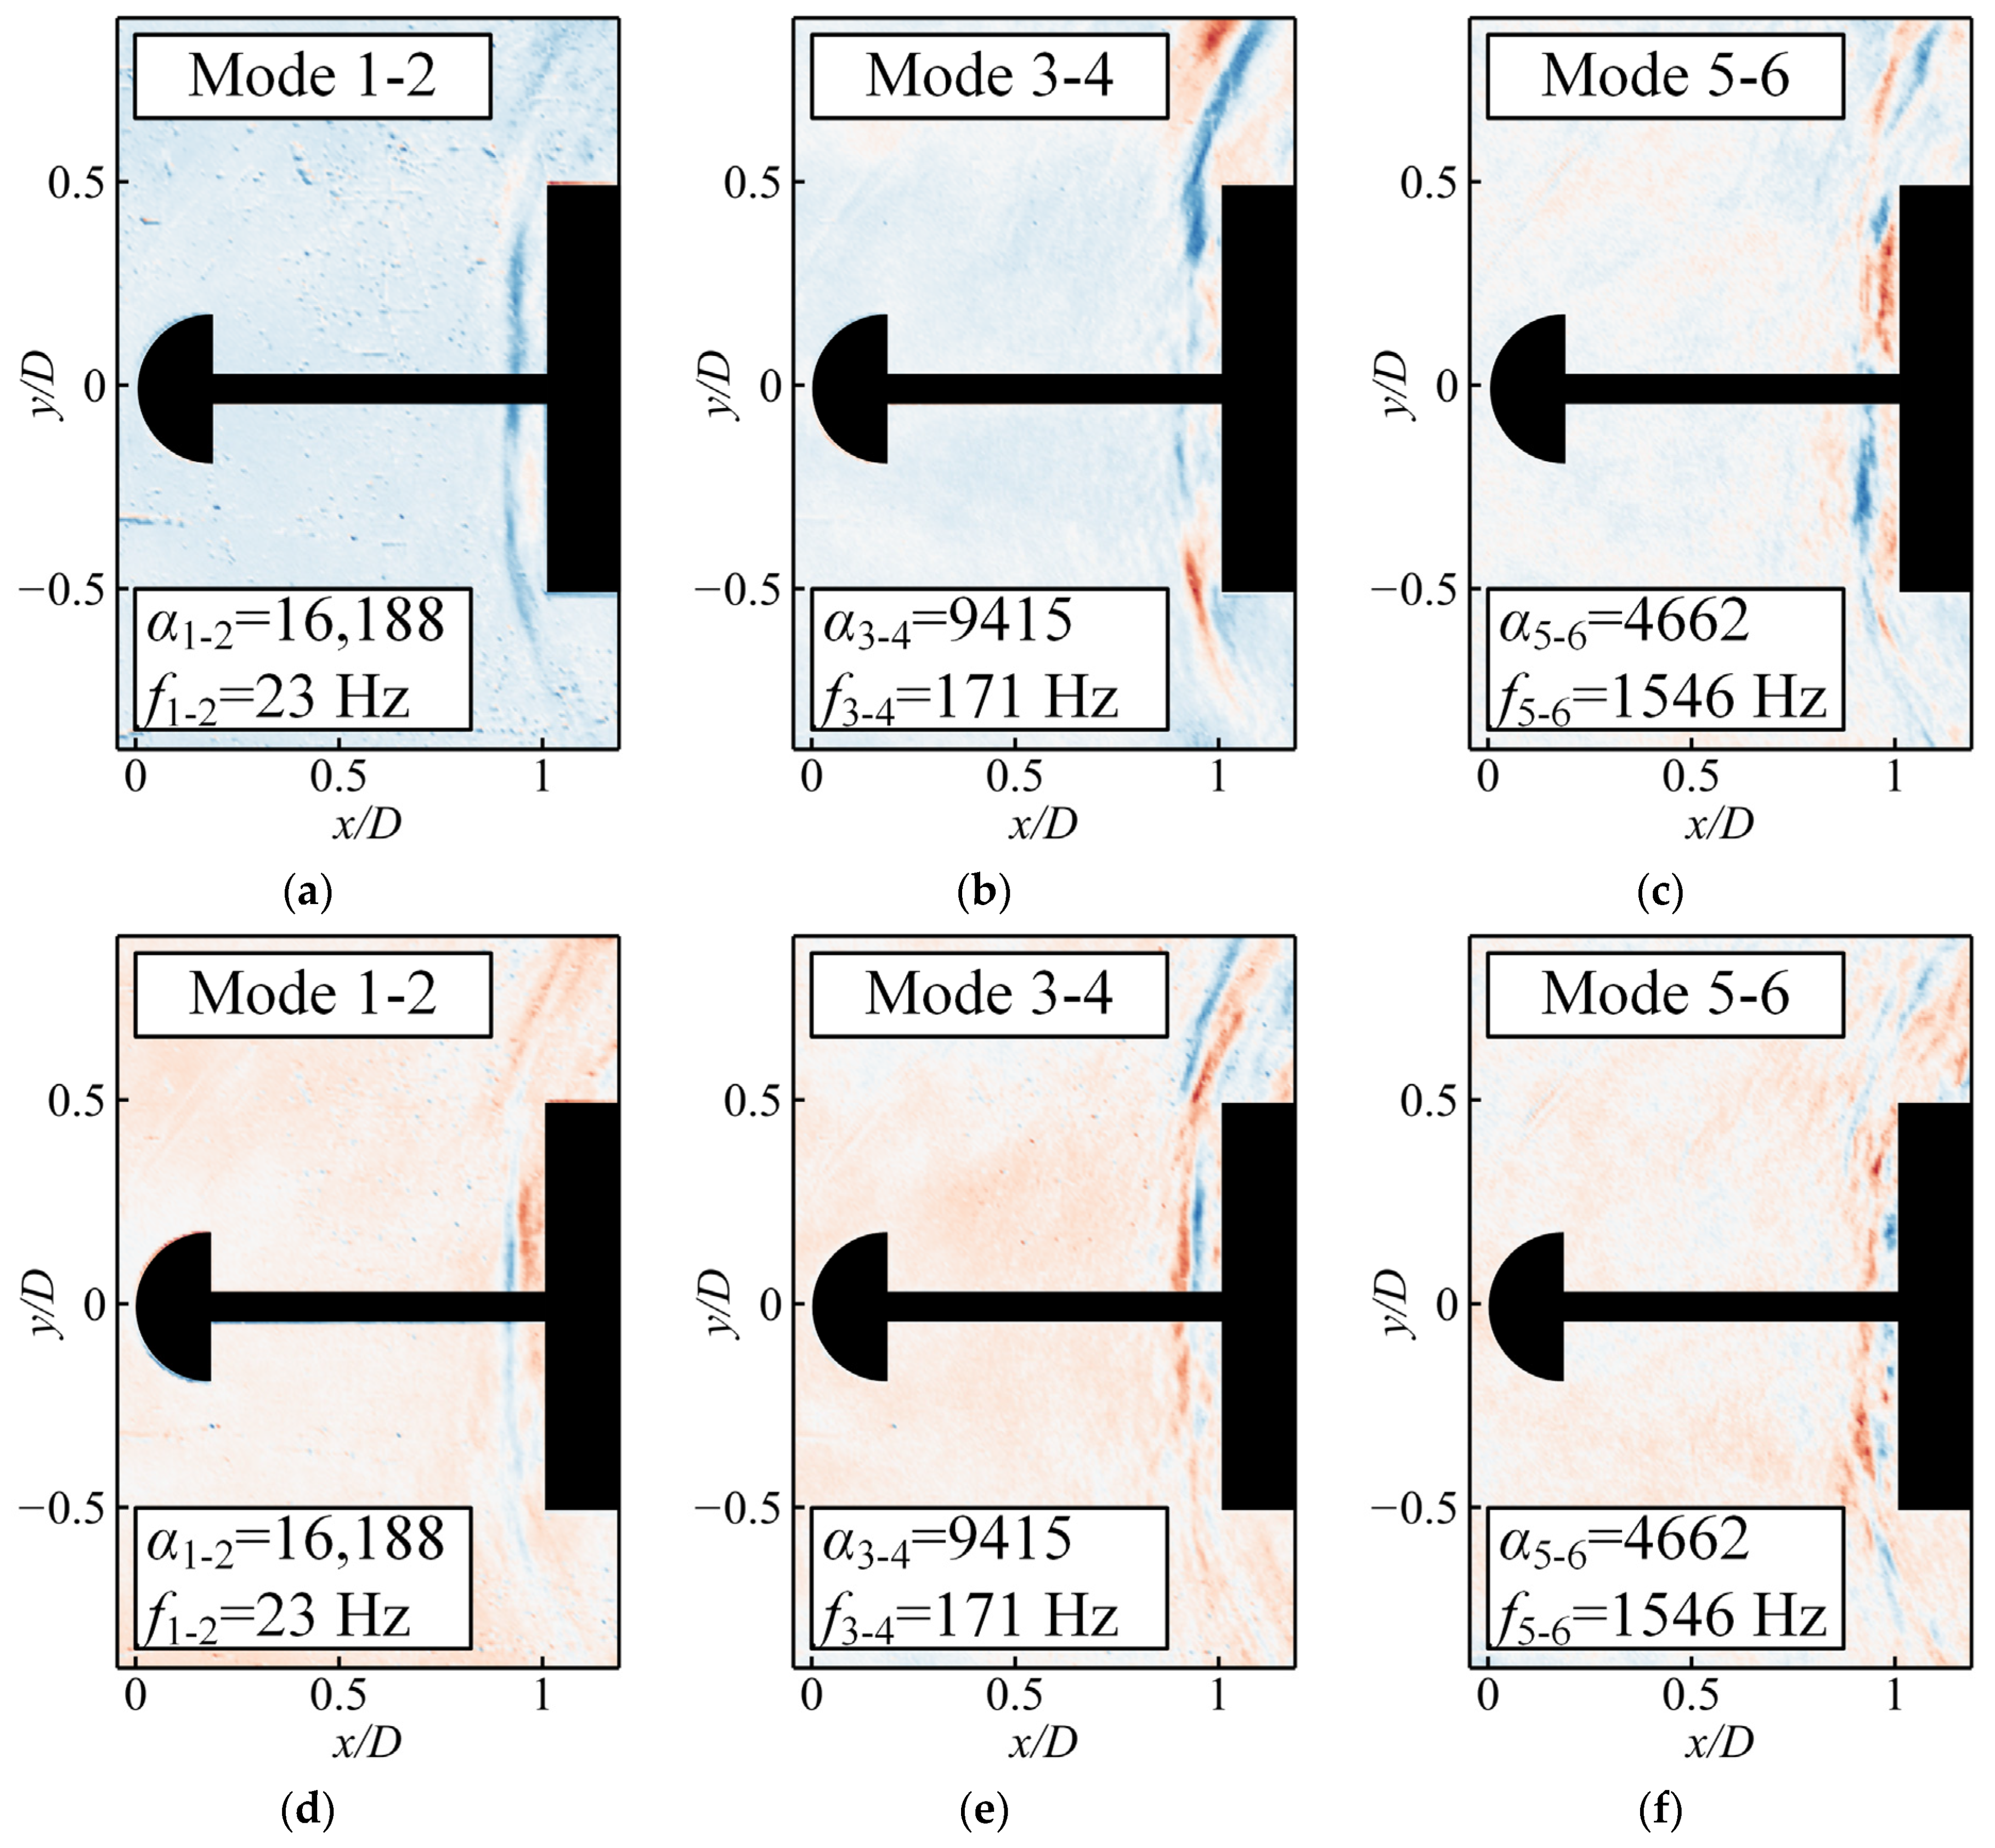
The DMD of experimental data offers a modal representation of the primary spatial structures in the flow at various characteristic frequencies. Adjacent modes are complex conjugates of one another. In other words, every two adjacent DMD modes share identical real parts and opposite imaginary parts. Figure 7 illustrates the flow field structures of the initial six DMD modes for the spiked-blunt body by using the amplitude sorting criterion. Figure 7a–c and Figure 7d–f represent the real and imaginary parts, respectively. For ease of description, the coordinates of the schlieren images are nondimensionalised by the cylinder diameter D, with the coordinate origin located at the spike tips. The real and imaginary parts of the same mode exhibit identical flow structures. In mode 1–2, a shallow aftershock is observed ahead of the cylindrical blunt body, which is accompanied by speckles and scratches in the field of view. They are caused by water droplets due to humidity and impurities on the glass on the day of the experiment. Considering the previous results, specifically the high initial amplitude and rapid decay rate of mode 1–2, it represents low-frequency noise in the experiment rather than the primary flow structures of interest. The flow field of mode 3–4 does not contain the low-frequency noise observed in mode 1–2 and only exhibits an aftershock ahead of the cylindrical blunt body. This aftershock is axially symmetrical along the spike and is replaced by fine flow features in the centre region of the cylindrical blunt body surface (approximately −0.36 < y/D < 0.36). The aftershock is attached to the shoulder of the cylindrical blunt body, which results in a three-dimensional ring-like structure. In mode 5–6, the flow field similarly displays only a bow aftershock ahead of the cylindrical blunt body. However, this aftershock appears fragmented, with a higher intensity in the central region (approximately −0.47 < y/D < 0.47) due to its unsteady pulsation along the flow direction, which continuously impacts the surface of the cylindrical blunt body. Notably, a very weak aftershock is present in the flow field above the aerodome in modes 3–4 and 5–6. This bow shock is a consequence of the high-speed incoming flow being obstructed by the hemispherical aerodome. Given that the aftershocks in this state are relatively stable, they exhibit very weak intensity in the modes sorted by amplitude. As indicated by the modal eigenvalues in Figure 4 and the evolution of the temporal coefficients in Figure 5, the corresponding spatial structures of the flow field for each mode will decay over time at different rates.

3.2. Conventional Frequency Sorting Criterion

The frequency sorting criterion is also a commonly used method in conventional DMD. This section presents the results of applying DMD to the same dataset as in Section 3.1 and sorting the modes based on their frequency magnitudes. In Figure 8a, the distribution of DMD mode eigenvalues reveals that these eigenvalues appear as pairs of conjugate complex numbers. Most of the mode eigenvalues are located on the unit circle, while a smaller fraction of higher amplitude modes is found within the unit circle. Therefore, the flow field for most modes is relatively stable, with only a few modes with high initial amplitudes showing decay. The eigenvalues of the first six DMD modes are extracted and marked with red circles, which signifies that these modes have low initial amplitudes but are relatively stable. Thus, they are classified as stable modes. Figure 8b presents the relationship between the growth rates and amplitudes of each mode. In general, DMD modes with smaller amplitudes and subsequently lower growth rates are stable, while those with larger amplitudes and higher growth rates are decaying modes. Among the first six modes selected in this section, all exhibit low amplitudes. Therefore, these modes are relatively stable. However, considering that the eigenvalues of the first six modes are nearly identical, clearly distinguishing their individual features is difficult. This limitation constitutes one of the drawbacks of the frequency sorting criterion. This aspect will be further discussed later in this subsection.
Figure 9 illustrates the evolution of the temporal coefficients for the first six modes of the DMD using the frequency sorting criterion. Figure 9a and Figure 9b represent the real and imaginary parts, respectively. The evolution of the temporal coefficients for the first four modes remains relatively stable and consistently exhibits periodic motion with a high frequency and a small amplitude. Only the amplitude of mode 5–6 increases at a relatively low growth rate. Given that the modes are organised according to the magnitude of their frequencies, the frequencies of the temporal coefficient evolution decrease sequentially with the increase in mode sequence. However, they remain very close to each other.
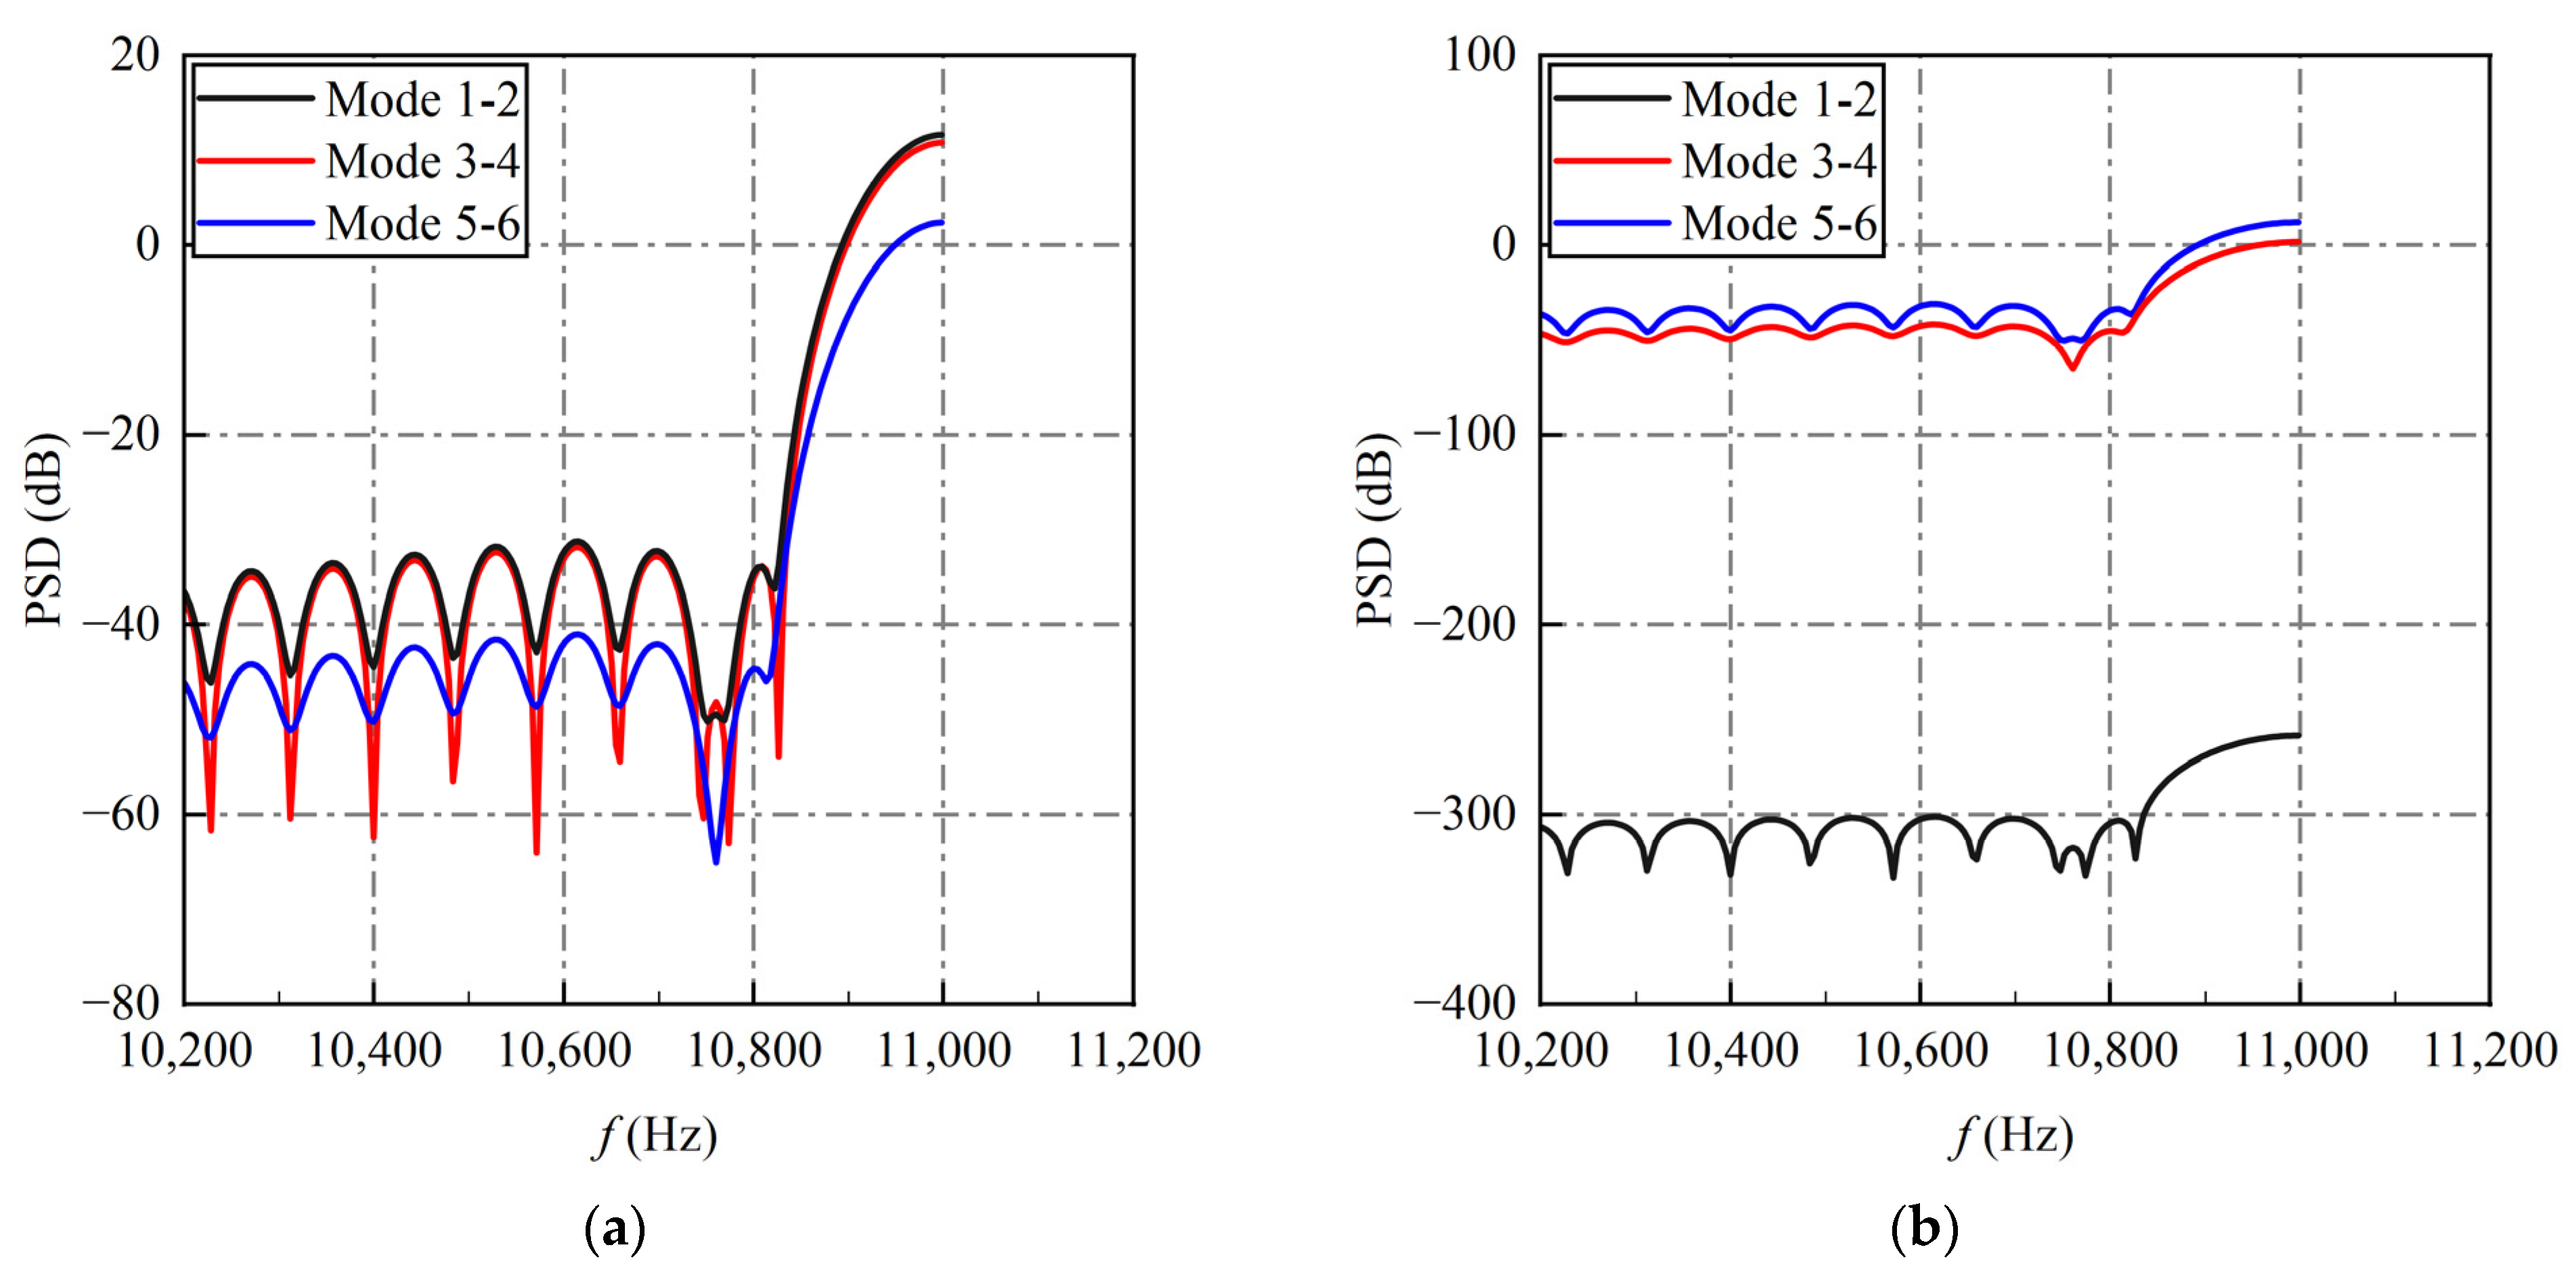
Figure 10 presents the PSD of the temporal coefficients among the first six modes for the DMD using the frequency sorting criterion. Figure 10a and Figure 10b represent the real and imaginary parts, respectively. Although the trajectories of the PSD of the real and imaginary sections of the temporal coefficients differ for the same mode, they share the same peak frequency. The peak frequencies of the first six modes are extremely close to one another because the modes are sorted by their frequency magnitudes. The characteristic frequency of mode 1–2 corresponds to the highest frequency amongst the collected signals, specifically 11 × 103 Hz. This frequency is a result of setting the sampling frequency of the Phantom VEO 710L high-speed camera to 22 × 103 Hz. According to the Nyquist sampling theorem, frequencies up to 11 × 103 Hz can be collected for the flow field characteristic frequency. The characteristic frequencies of the two other pairs of modes are 10,993 and 10,988 Hz, respectively.
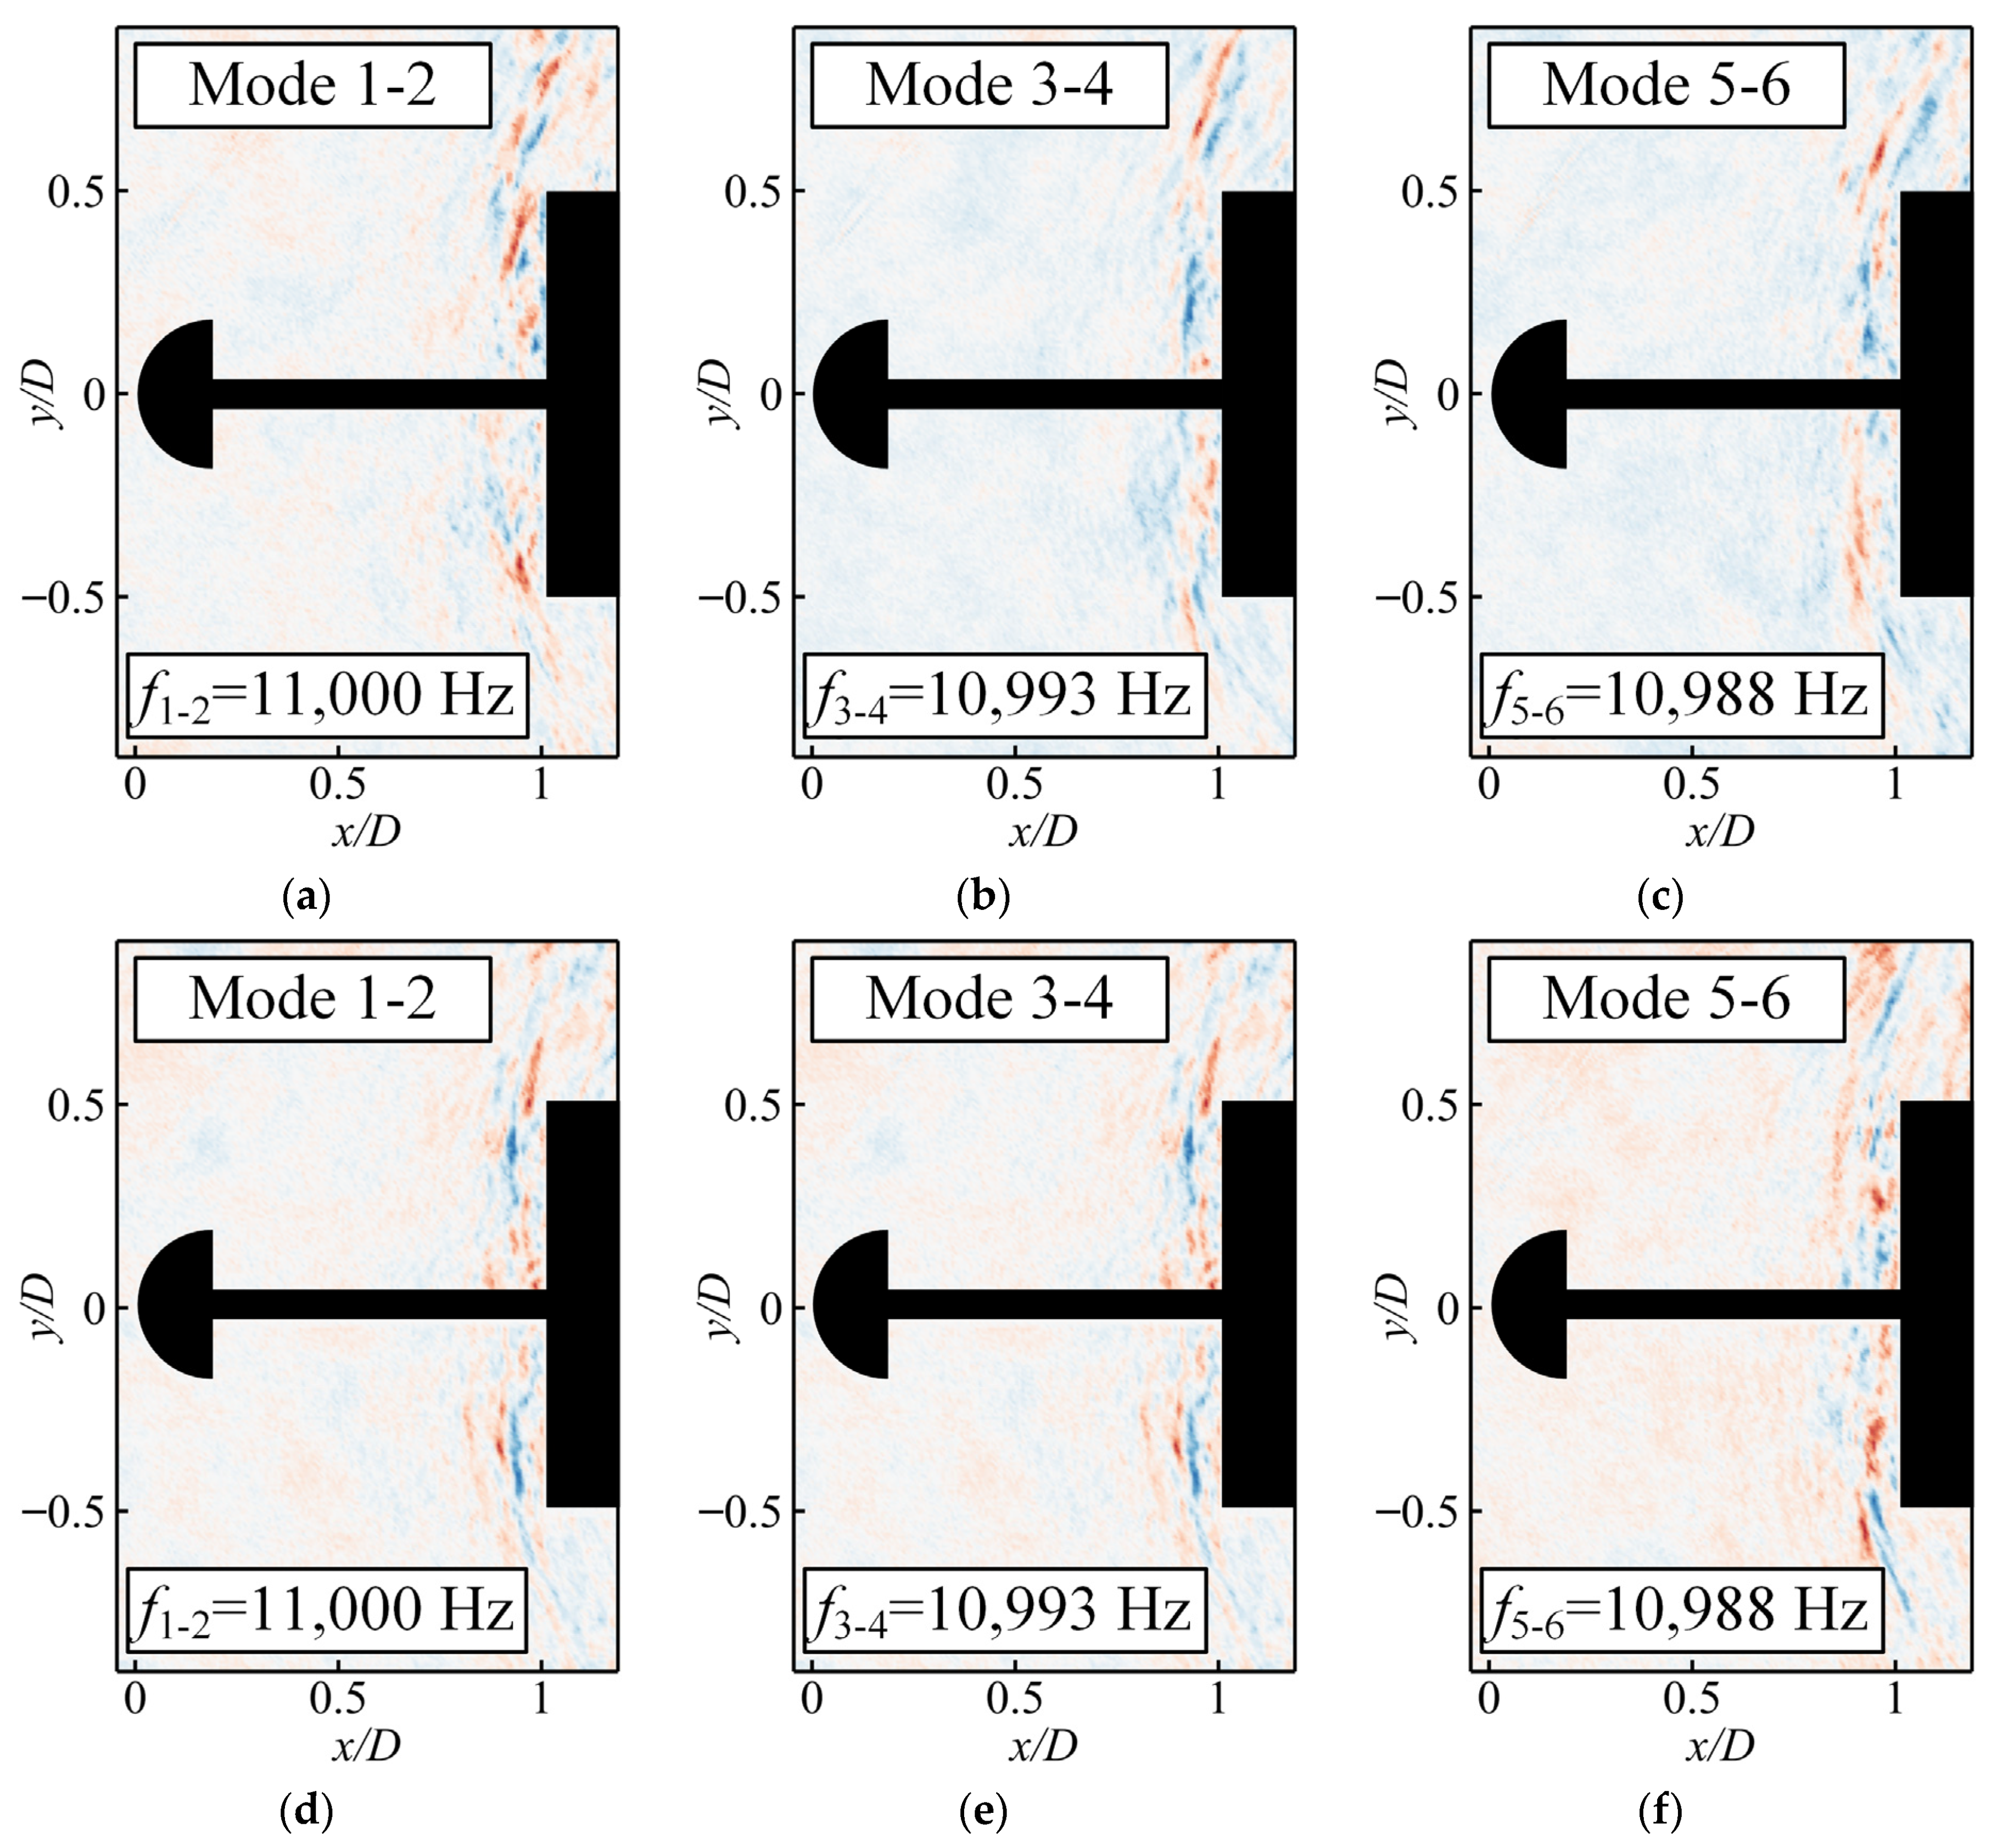
Figure 11 depicts the flow field structures of the first six modes of the DMD using the frequency sorting criterion for the spiked-blunt body. Figure 11a–c represent the real parts, and Figure 11d–f represent the imaginary parts. Given the application of the frequency sorting criterion, the frequencies of the first six modes are extremely close, which displays identical flow structures without distinctly differentiating the flow structures of each mode. The real and imaginary parts of the first six modes both exhibit the same flow structures. Specifically, the flow field is devoid of the low-frequency noise mentioned in the previous section (i.e., spots and scratches in the field of view), and only an aftershock that entirely covers the windward surface of the cylindrical blunt body is observable. This shock wave is distributed axially symmetrically along the spike axis, weaker in the central region of the cylindrical blunt body (approximately −0.36 < y/D < 0.36) and stronger at the shoulder positions where reattachment occurs. Notably, the aftershock appears highly fragmented, which represents a minor high-frequency pulsation structure within the typical pulsation mode. As can be inferred from the modal eigenvalue features in Figure 8 and the evolution of the time coefficients in Figure 9, the spatial structures corresponding to each mode will exhibit periodic pulsations at a high frequency (approximately 11 × 103 Hz).

3.3. Novel Energy Sorting Criterion

From the research results presented in previous sections, we observe that the amplitude sorting criterion frequently results in the selection of modes with larger initial amplitudes, but they also exhibit higher decay rates over time. Consequently, these modes evolve into flow field structures with less energy, which potentially overlooks the structures that actually constitute a significant portion of the energy. In the meantime, the frequency sorting criterion often leads to the selection of modes with nearly identical characteristic frequencies, which causes difficulty in effectively distinguishing between different modes. This similarity amongst modes results in flow structures that closely resemble each other, which prevents the reduction of high-dimensional flow fields into distinguishable multiple low-dimensional structures. Moreover, focusing solely on high or low frequencies can lead to the misinterpretation of noise at these frequencies as flow field structures. Considering these shortcomings, this study proposes an energy sorting criterion that is better suited for unsteady flow field experimental data.
To precisely quantify the contribution of each mode to the unsteady flow field, this subsection presents the results of performing DMD on the same dataset as in the previous subsections and sorting the modes based on their energy levels. Figure 12 shows the energy proportion of each mode and the cumulative energy proportion of modes for the first 1000 modes in the DMD using the energy sorting criterion. The blue circles represent the energy proportion of each mode among all modes. The first mode contributes 95.0% of the energy, which represents the mean flow field that persists throughout the time domain. The second and third modes contribute 2.7% and 0.6% of the total energy, respectively, with the energy proportions of subsequent modes significantly dropping to very low levels. The red circles represent the cumulative energy proportions of the modes. The first three modes together contribute 98.3% of the total energy, and the cumulative energy proportion reaches over 99% at the 1000th mode. The rapid convergence of the energy spectrum suggests that most of the important flow features can be identified in the initial modes. Consequently, this study primarily discusses the dominant flow modes within the first five modes.
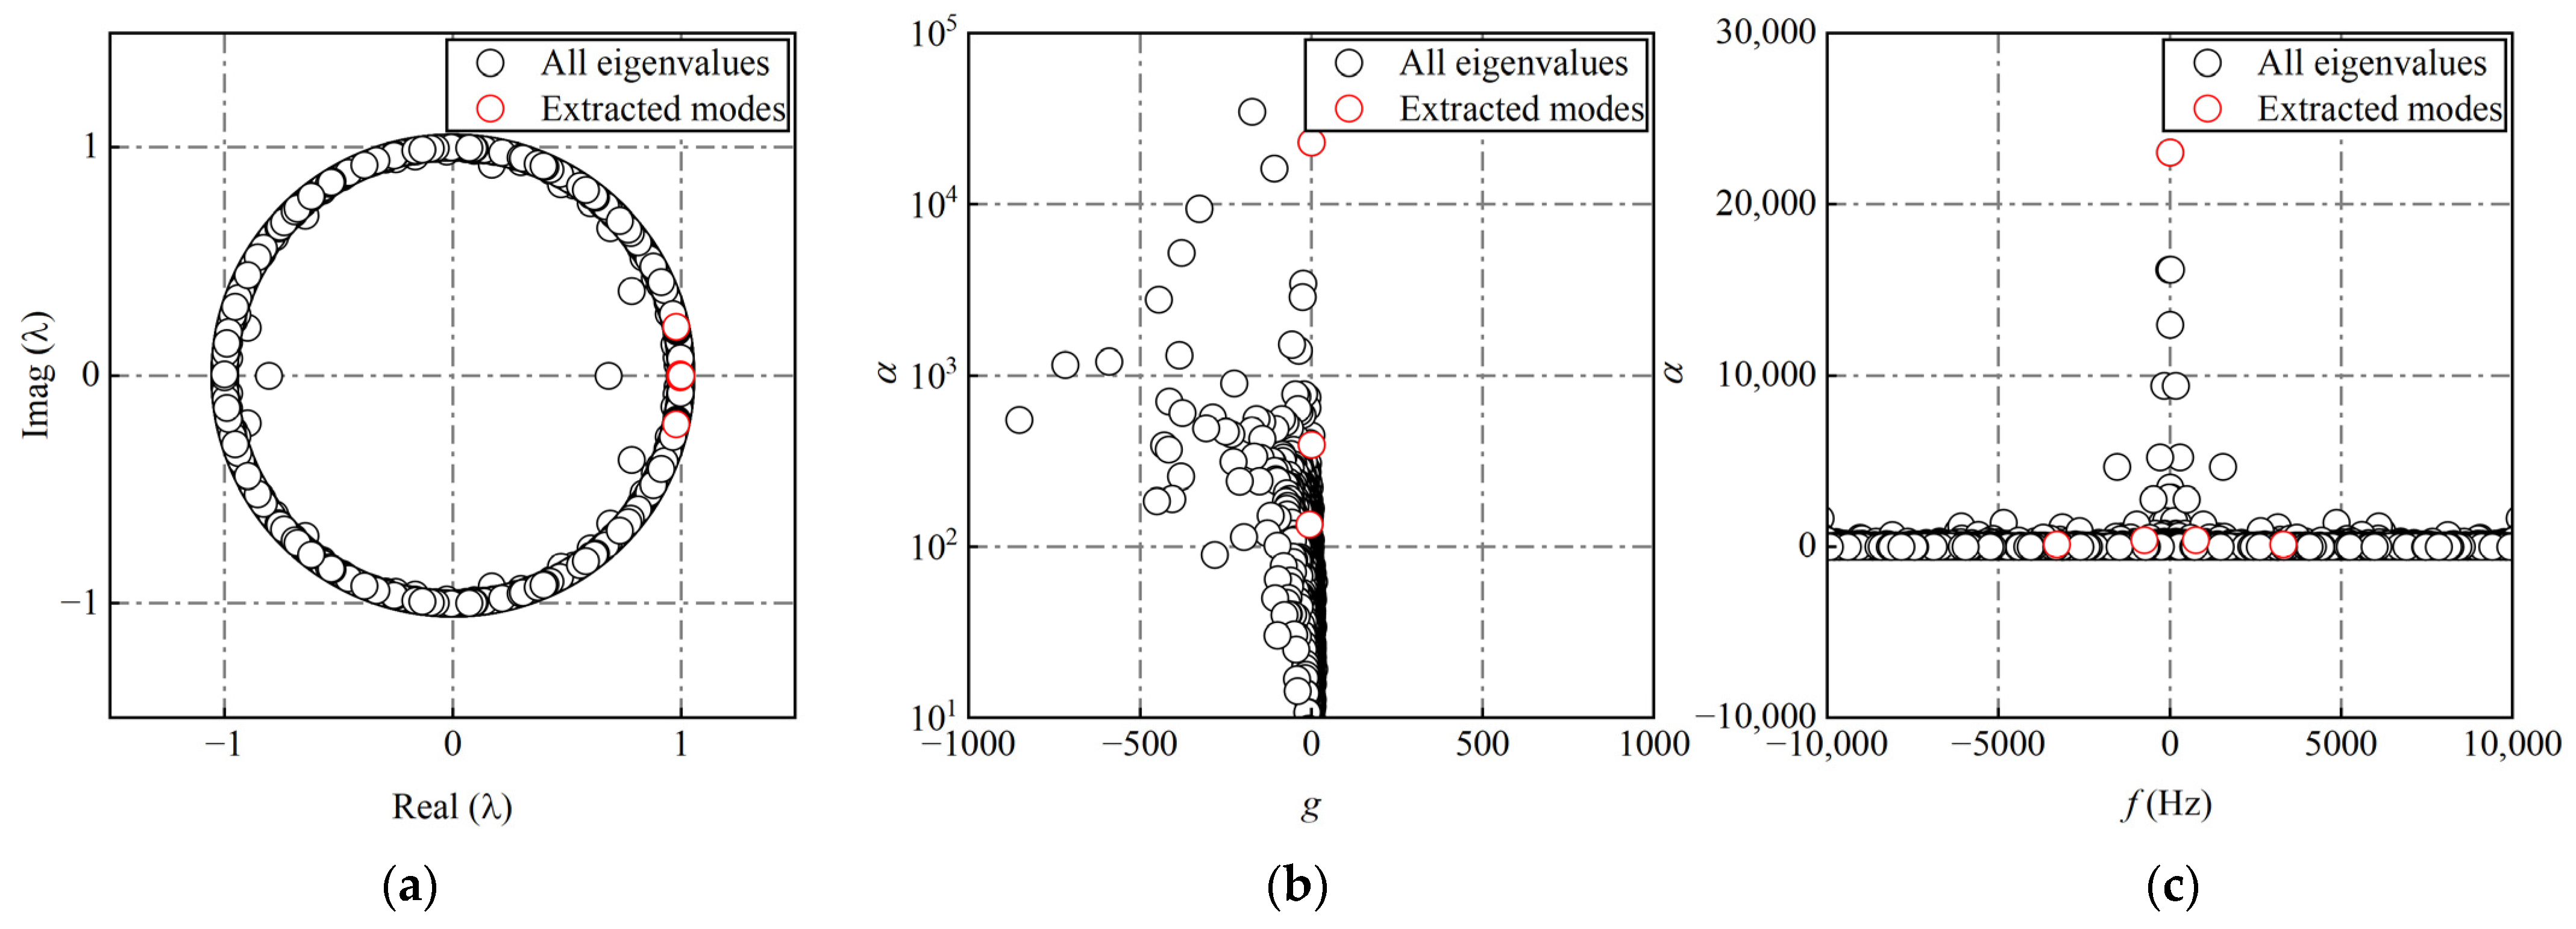
Figure 13a displays the distribution of the modal eigenvalues of the DMD using the energy sorting criterion. The eigenvalues are observed as conjugate complex pairs, with most of them located on the unit circle. Only a few modes with high amplitudes have eigenvalues within the unit circle, which indicates that most flow fields are relatively stable following DMD, and only a few modes with high initial amplitudes exhibit decay. As the first mode represents the mean flow field, the eigenvalues of the first five modes are extracted and marked in red. These markers are positioned on the unit circle, which suggests that the first five modes are stable. Figure 13b portrays the relationship between the growth rates and amplitudes of each mode. The overall trend shows that modes with smaller amplitudes and, thus, lower growth rates are stable. In the meantime, those with larger amplitudes and higher growth rates are decaying modes. For the first five modes selected in this section, all of them are classified as stable modes. Figure 13c illustrates the relationship between the frequencies and amplitudes of each mode. The overall trend reveals that modes with larger amplitudes are low-frequency modes, while high-frequency modes have small amplitudes. Therefore, if either of the two factors is independently chosen as a sorting criterion, then the other factor is likely to be somewhat neglected. However, the first five modes selected according to this energy sorting criterion consider amplitude and frequency, which effectively address the shortcomings of the first two sorting criteria.
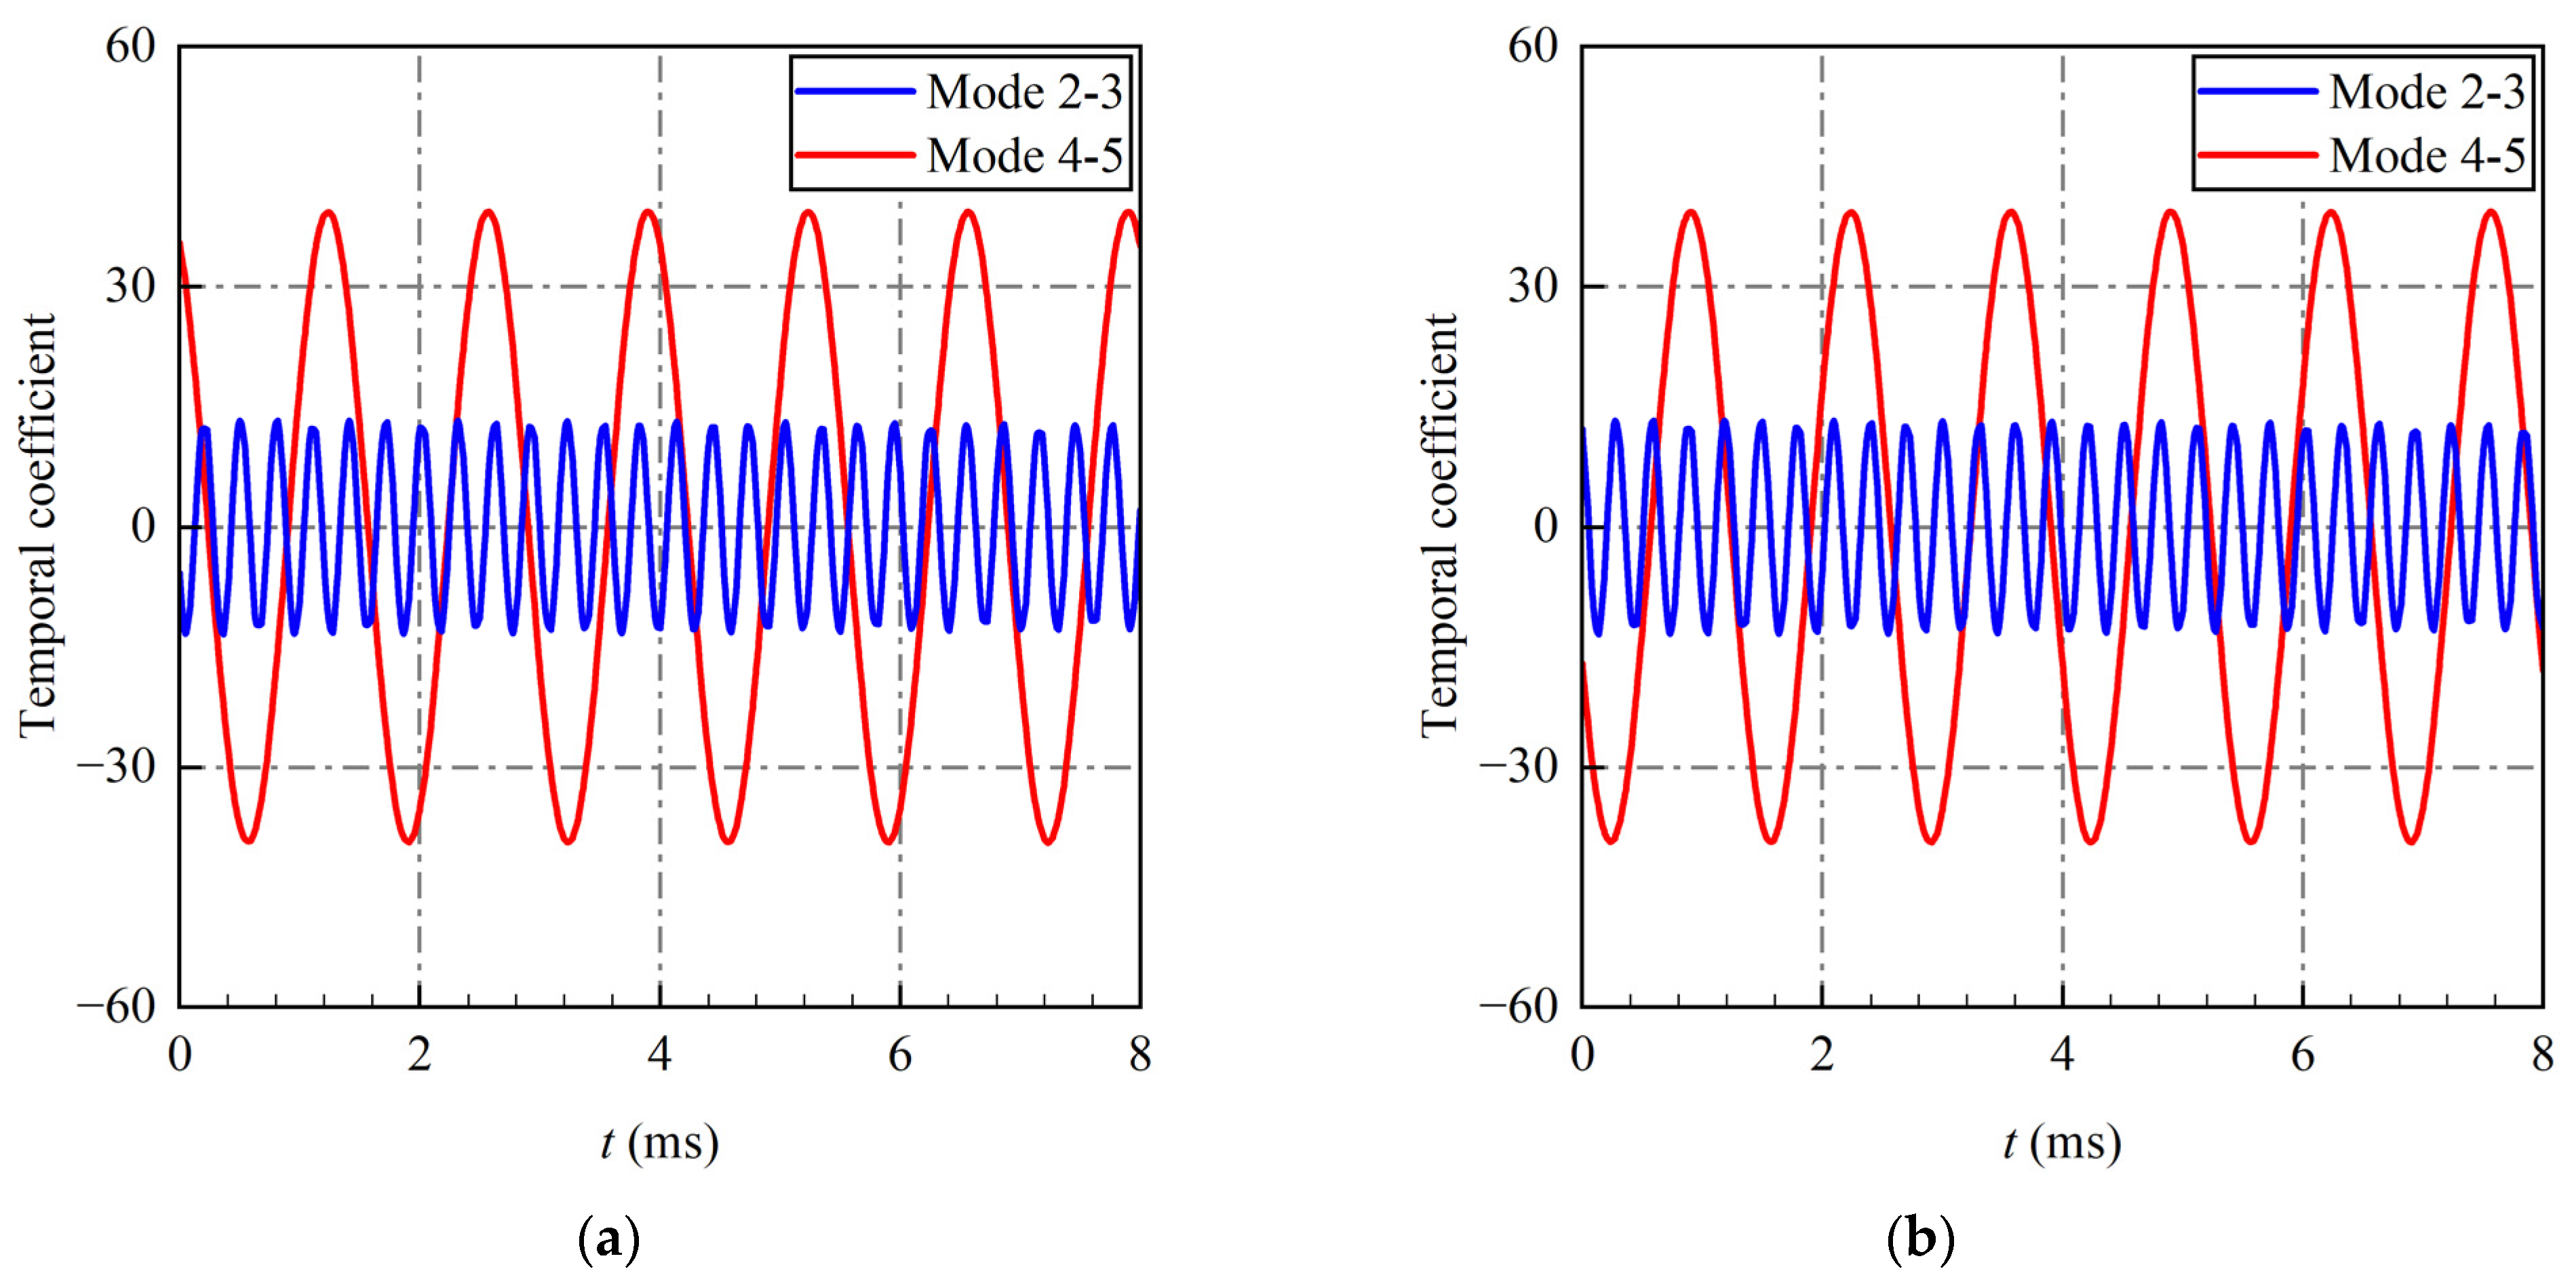
Given that the first mode represents the mean flow field, the corresponding characteristic frequency of the temporal coefficient is zero. For this reason, the temporal coefficient results of the first mode will not be discussed here. Figure 14 presents the evolution of the temporal coefficients for modes 2–3 and 4–5 of the DMD using the energy sorting criterion. Figure 14a and Figure 14b represent the real and imaginary parts, respectively. A comparison between Figure 14a,b reveals that the real and imaginary parts of the temporal coefficients for the same mode pair have identical amplitudes and frequencies. The evolution of the two components of the temporal coefficients of the same mode pair is relatively stable, which follows periodic motion at a single characteristic frequency. The amplitude of mode 2–3 is smaller than that of mode 4–5, but the frequency of mode 2–3 exceeds that of mode 4–5.
Figure 15 presents the PSD of the temporal coefficients for modes 2–3 and 4–5 of the DMD using the energy sorting criterion, where Figure 15a and Figure 15b represent the real and imaginary parts, respectively. A comparison between Figure 15a,b shows that the PSD of the temporal coefficients for each mode exhibits only one frequency peak. This observation indicates that the variations in the temporal coefficients for each mode closely resemble simple harmonic motion with a single frequency, which implies that the unsteady pulsations in the flow field have been captured as a combination of single-frequency modes. Although the PSD of the real and imaginary parts of the temporal coefficients for each mode exhibit different trajectories, they share the same peak frequencies. The peak frequency for mode 2–3 is 3307 Hz, and that for mode 4–5 is 750 Hz. The DMD modes selected according to this energy sorting criterion avoid the high decay rate situation encountered when using the amplitude sorting criterion and the issues related to high- and low-frequency noise found when using the frequency sorting criterion.
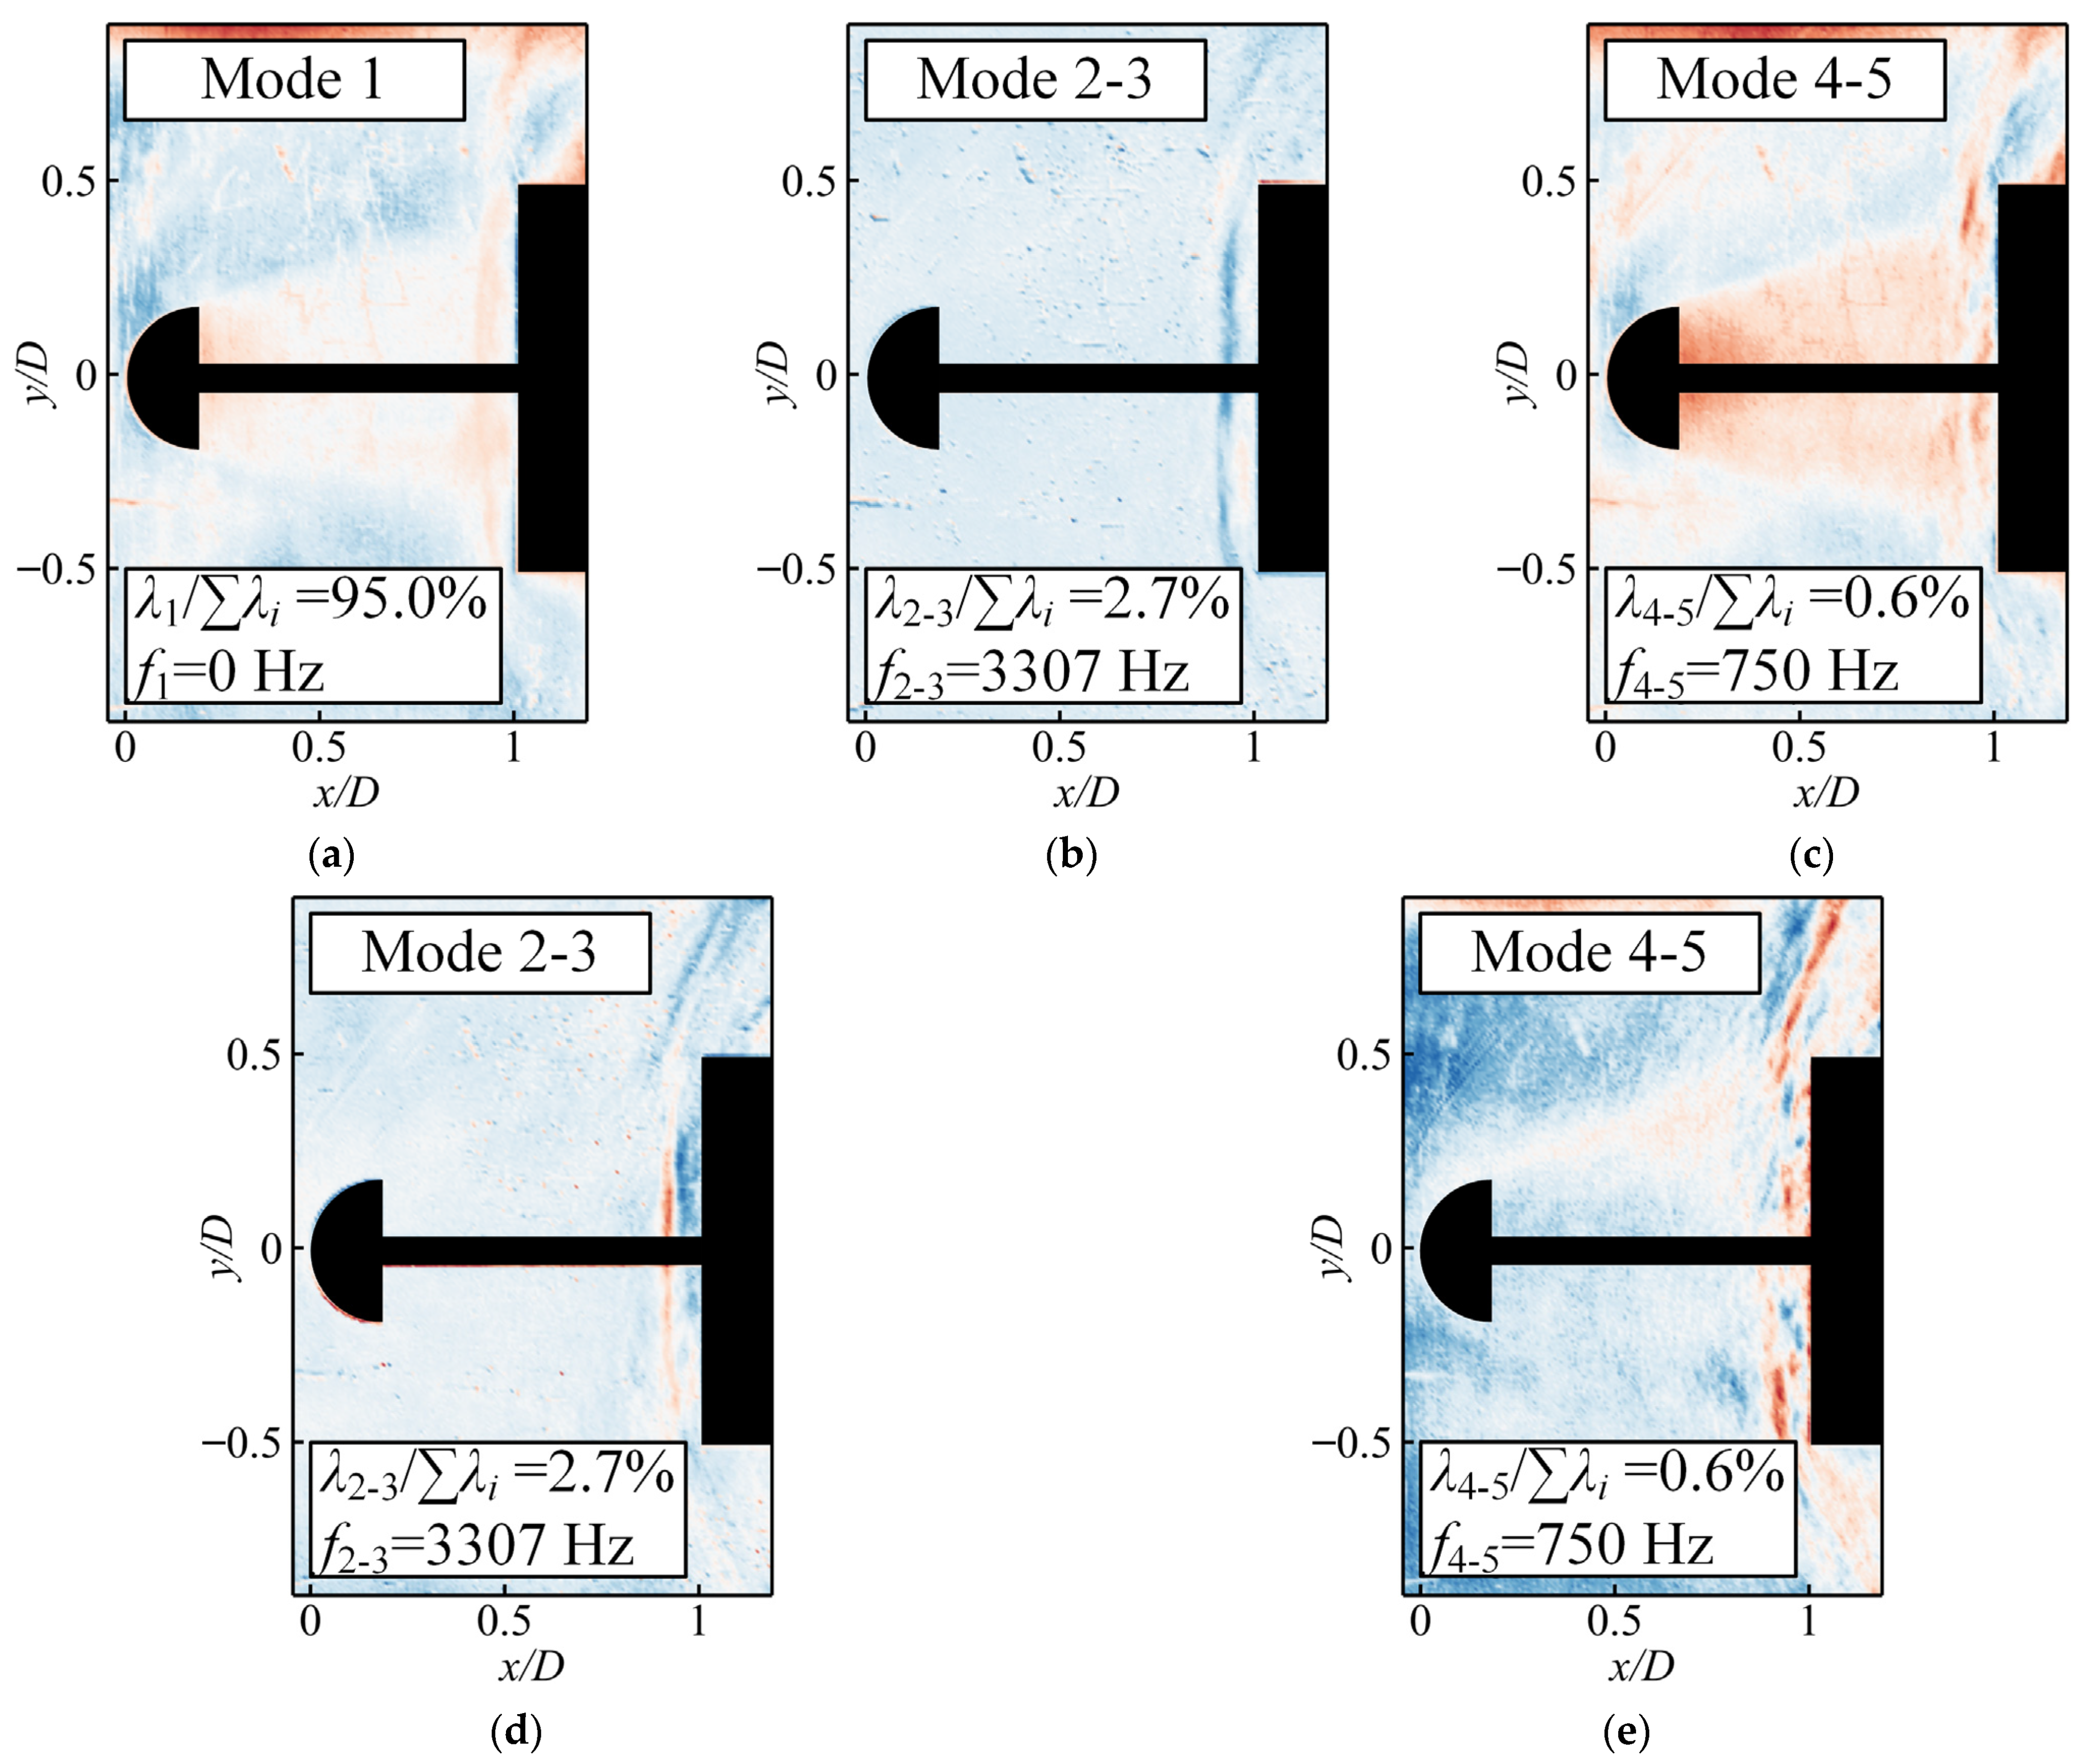
Figure 16 illustrates the flow field structures of the first five modes of the DMD using the energy sorting criterion for the spiked-blunt body. Figure 16a–c represents the real parts, while Figure 16d,e represents the imaginary parts. The first mode represents the mean flow field and serves as the fundamental flow field structure for the typical/suppressed pulsation mode. This mode contributes 95.0% to the total energy of the flow evolution, with its frequency and growth rate equating to zero. Therefore, its flow structure pervades the entire unsteady pulsating process of the flow field. In the first mode, a complete aftershock appears in front of the cylindrical, blunt body. The shock wave exhibits an axisymmetric distribution and attaches to the shoulders of the cylindrical, blunt body. Behind the aerodome, a clear shear layer encapsulates the recirculation zone. The airflow within the recirculation zone undergoes reciprocating pulsation due to pressure fluctuations. Furthermore, the trace of ejected flow mass near the cylinder shoulder is observable. As the flow direction progresses, the clear profile of the shear layer gradually becomes blurred due to the unsteady motion of the downstream shear layer. This condition implies that the fluctuation of the shear layer along the flow direction gradually intensifies. This process closely resembles the evolution of the Kelvin–Helmholtz instability. The interaction between the aftershock and the shear layer is noticeable around the coordinates (x/D = 0.95, y/D = 0.45). The fluctuations in the shear layer interacting with the aftershock further amplify the unsteady motion of the shock wave. Notably, some specks and streaks are present in the first mode, which can be attributed to noise (water droplets and glass impurities) that was present during the experiment and influenced the mean flow field.
Mode 2–3 contributes 2.7% of the total energy with a characteristic frequency of 3307 Hz. The flow field structure is characterised by a single aftershock in front of the cylindrical, blunt body. This aftershock also exhibits an axisymmetric distribution, but it is stronger in the central area of the cylindrical blunt body and weaker at the shoulders. This observation is similar to the spatial structure observed in the suppressed pulsation mode as observed in a previous study [52], where the aftershock entirely covers the windward surface of the cylindrical blunt body. The primary frequency of 3.3 kHz arises from the low-amplitude pulsations of the aftershock.
Mode 4–5 accounts for 0.6% of the total energy with a characteristic frequency of 750 Hz. The primary feature of the flow field structure is the recirculation zone that dominates the windward surface of the blunt body. The aftershock only covers the shoulder of the cylindrical blunt body, and the shock wave within the range of −0.36 < y/D < 0.36 has been replaced by fine flow features. The aftershock appears to have been ‘broken’ by the recirculation zone. The aftershock attaches to the shoulder of the cylindrical blunt body, which results in a three-dimensional ring-like structure. Simultaneously, the shear layer interacts with the aftershock at approximately x/D = 0.95. This flow field structure, where the recirculation zone occupies the surface of the cylindrical blunt body, can remain stable for a short time. The primary frequency of 750 Hz results from the low-frequency, high-amplitude pulsations of the aftershock. These pulsations are associated with the back-and-forth movement of the airflow in the recirculation zone, which is driven by the pressure differences along the flow direction. In addition, a bow foreshock emerges in front of the aerodome, which is formed as a consequence of the aerodome blocking the high-speed inflow.

3.4. Proper Orthogonal Decomposition

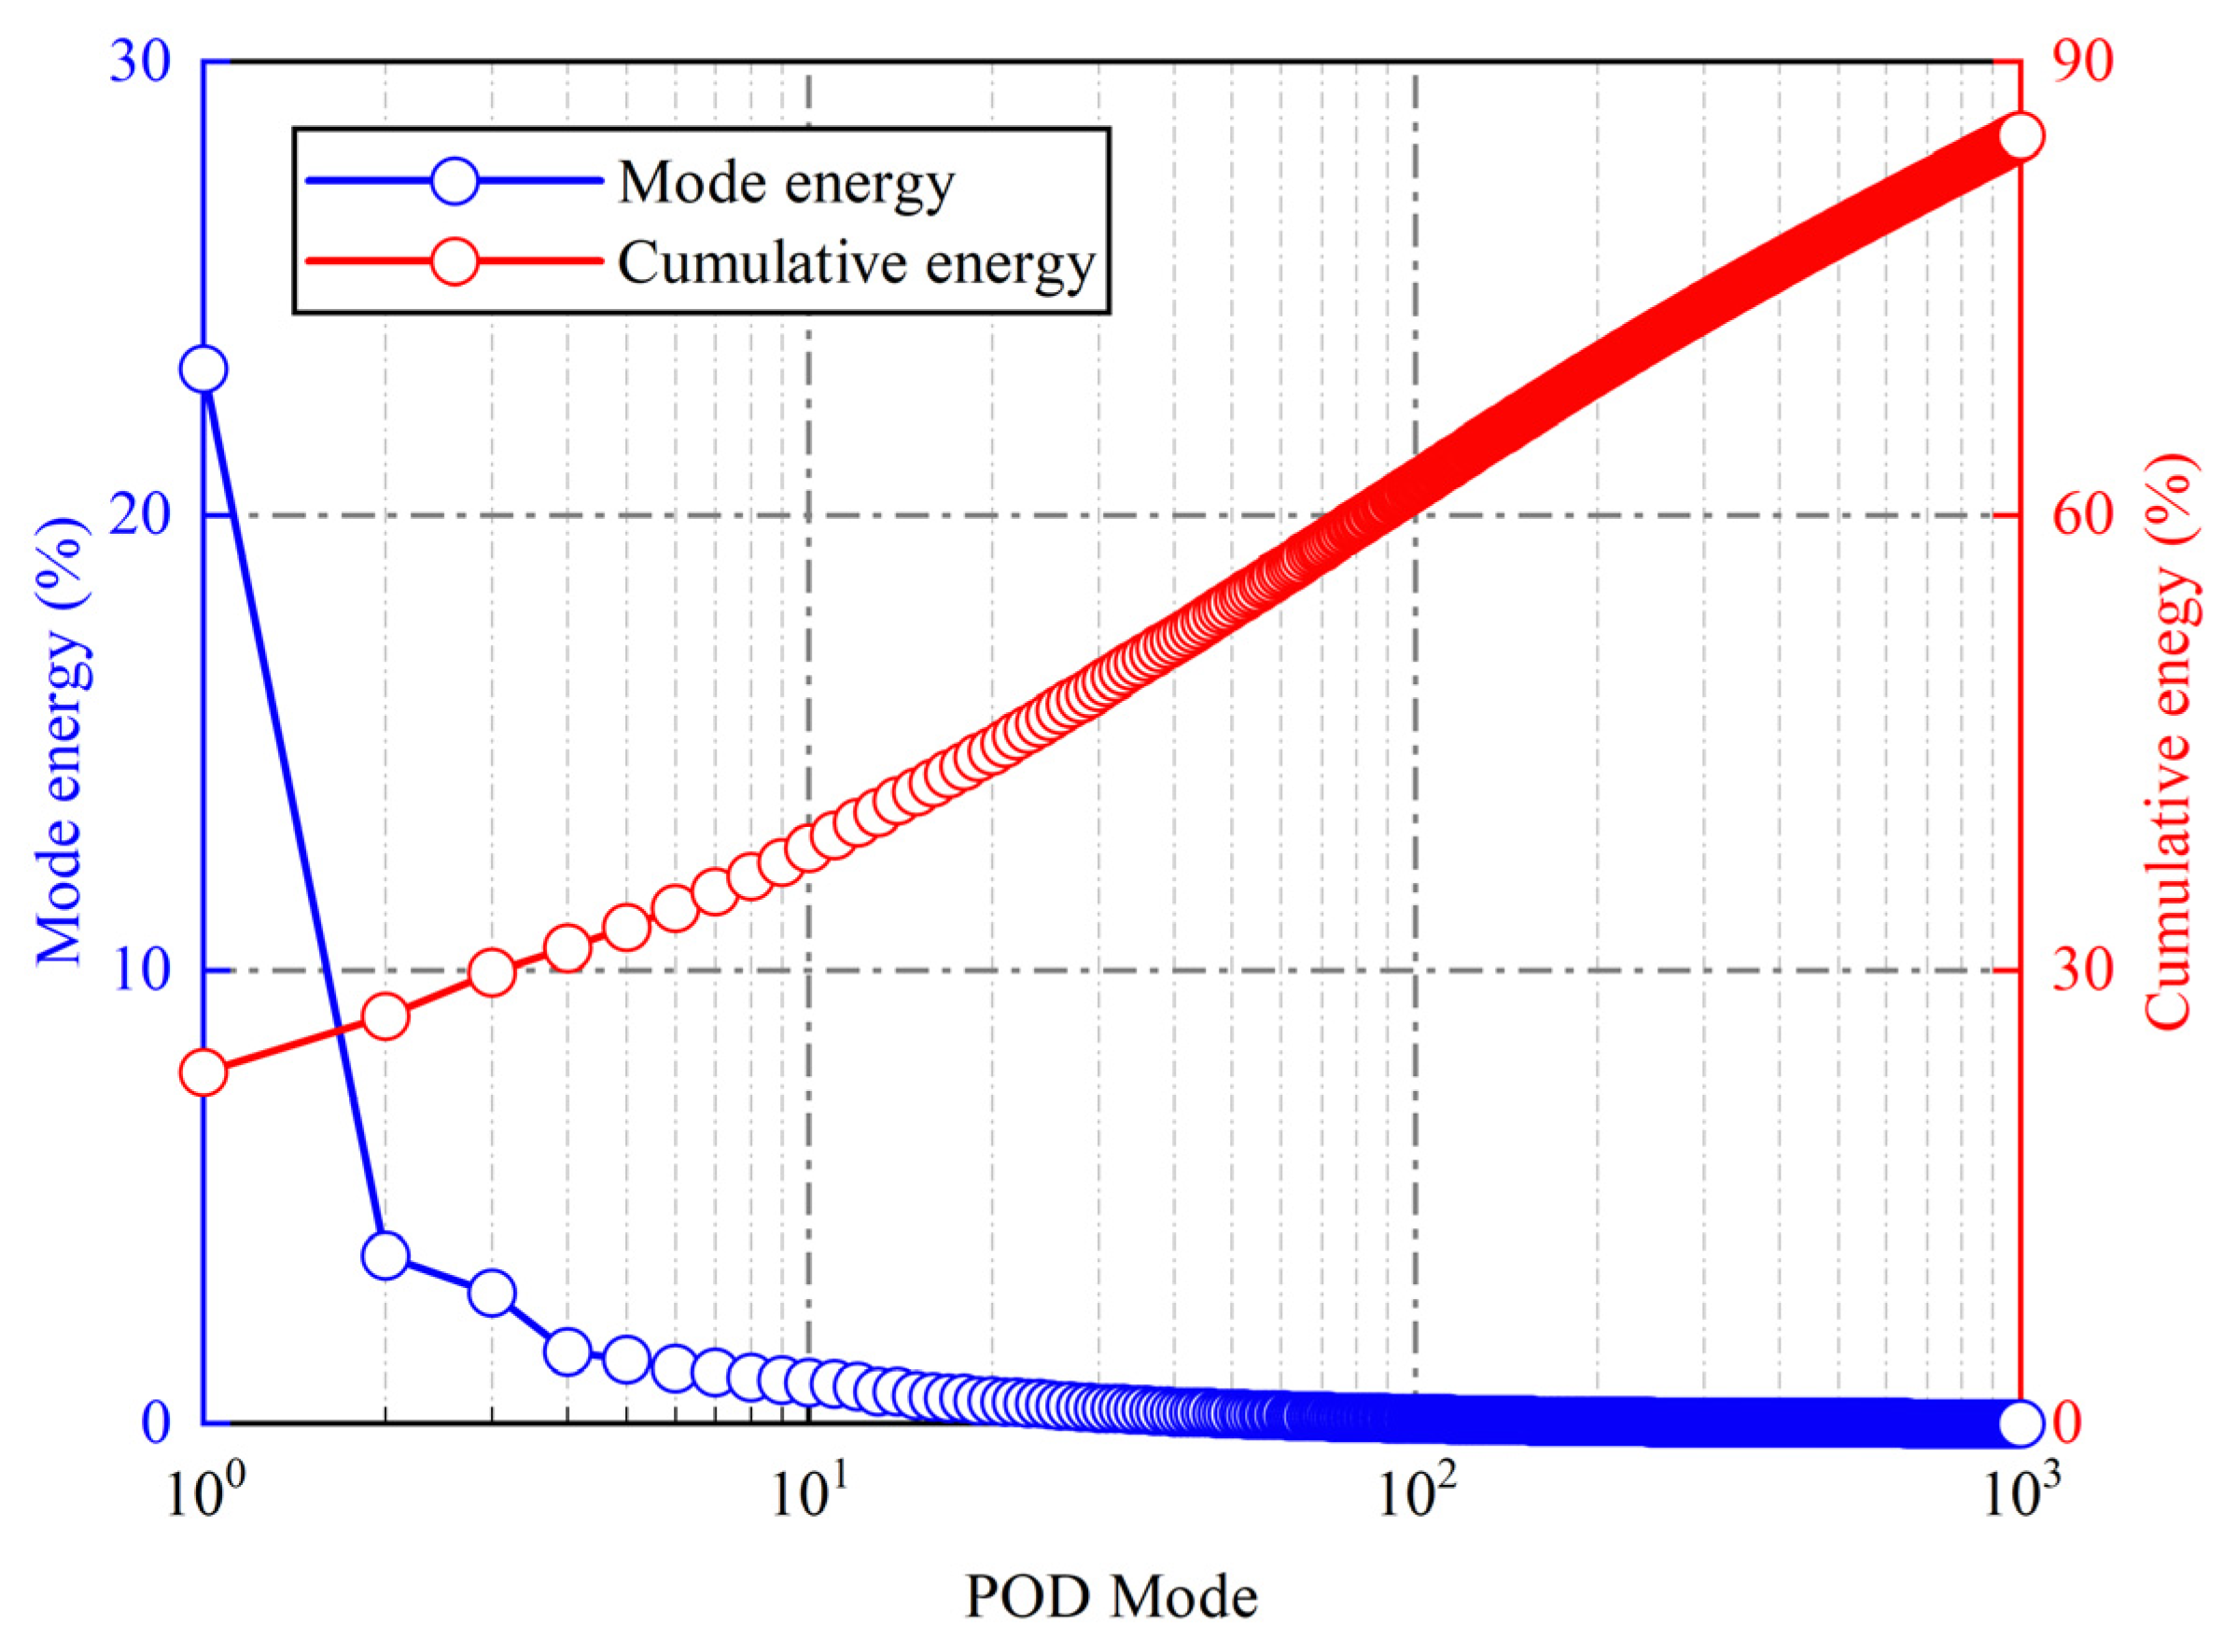
This subsection utilises the results of POD for comparative study and analysis to further compare the advantages and disadvantages of the three DMD sorting criteria applied to the unsteady experimental flow field. The POD modes are orthogonal to each other in the spatial dimension, and each mode can be regarded as a perturbation to the basic flow field (i.e., the mean flow field). Figure 17 presents the energy proportion of each mode and the cumulative energy proportion of modes in the POD for assessing the influence of POD modes on the mean flow field.
The initial modes possess higher energy, with the first mode having the highest energy proportion of 23.2%, which represents the mean flow field. The energy proportions of the second and third modes are 3.7% and 2.9%, respectively, which are significantly higher than those of the subsequent modes. However, as the mode number increases, the energy proportion of each subsequent mode sharply decreases and maintains a lower magnitude. The energy proportion is nearly zero when the mode number exceeds 100. For the cumulative energy proportion of the modes, it gradually increases with the growing number of modes, and the growth rate gradually slows down. At 1000 modes, the cumulative energy proportion reaches 88.6%. The convergence of the energy spectrum indicates that the first few modes can be considered the dominant modes of the flow field. They contribute the vast majority of energy and play a more important role in the evolution of the flow.
Figure 18 presents the PSD of the temporal coefficients for the first three POD modes for the unsteady flow of the spiked-blunt body. Figure 18a represents the first mode, while Figure 18b represents the second and third modes. The PSD of the POD temporal coefficients exhibits multiple frequency peaks, whereas the PSD of the DMD temporal coefficients mentioned earlier has only one characteristic peak. This discrepancy arises because POD is based on the decomposition of second-order statistical data, which utilises time-averaged spatial tensors to obtain coherent structures at different energy levels. By contrast, DMD extracts the dominant coherent structures from a series of instantaneous velocity fields by approximating the linear projection between snapshots. In other words, POD focuses solely on a series of representative bases that are orthogonal in space, while DMD considers temporal orthogonality and spatial orthogonality.
The first POD mode represents the mean flow field of unsteady pulsations, which occupies the highest energy in the flow. Six distinct peaks are observed in the PSD of the temporal coefficients. The corresponding peak frequencies are 348, 750, 1154, 1547, 1833, and 3228 Hz. The peak frequencies at 750 and 3228 Hz align with the main frequencies of the dominant DMD modes obtained through the energy sorting criterion. For the other low-frequency peaks, they are speculated to be background noise from the experiment. They are likely attributed to alternating dark/bright changes between snapshots due to excessively moist air on the day of the experiment. The second and third modes can be regarded as perturbations to the mean flow field, given that they have the highest energy proportion after the mean flow field. The power spectra of temporal coefficients exhibit a similar trend, and both share the same peak frequency of 3228 Hz. This frequency is nearly identical to the principal frequency of modes 2 and 3 in the DMD using the energy sorting criterion. However, it notably differs from the main frequencies of the DMD modes that employ the two other sorting criteria.
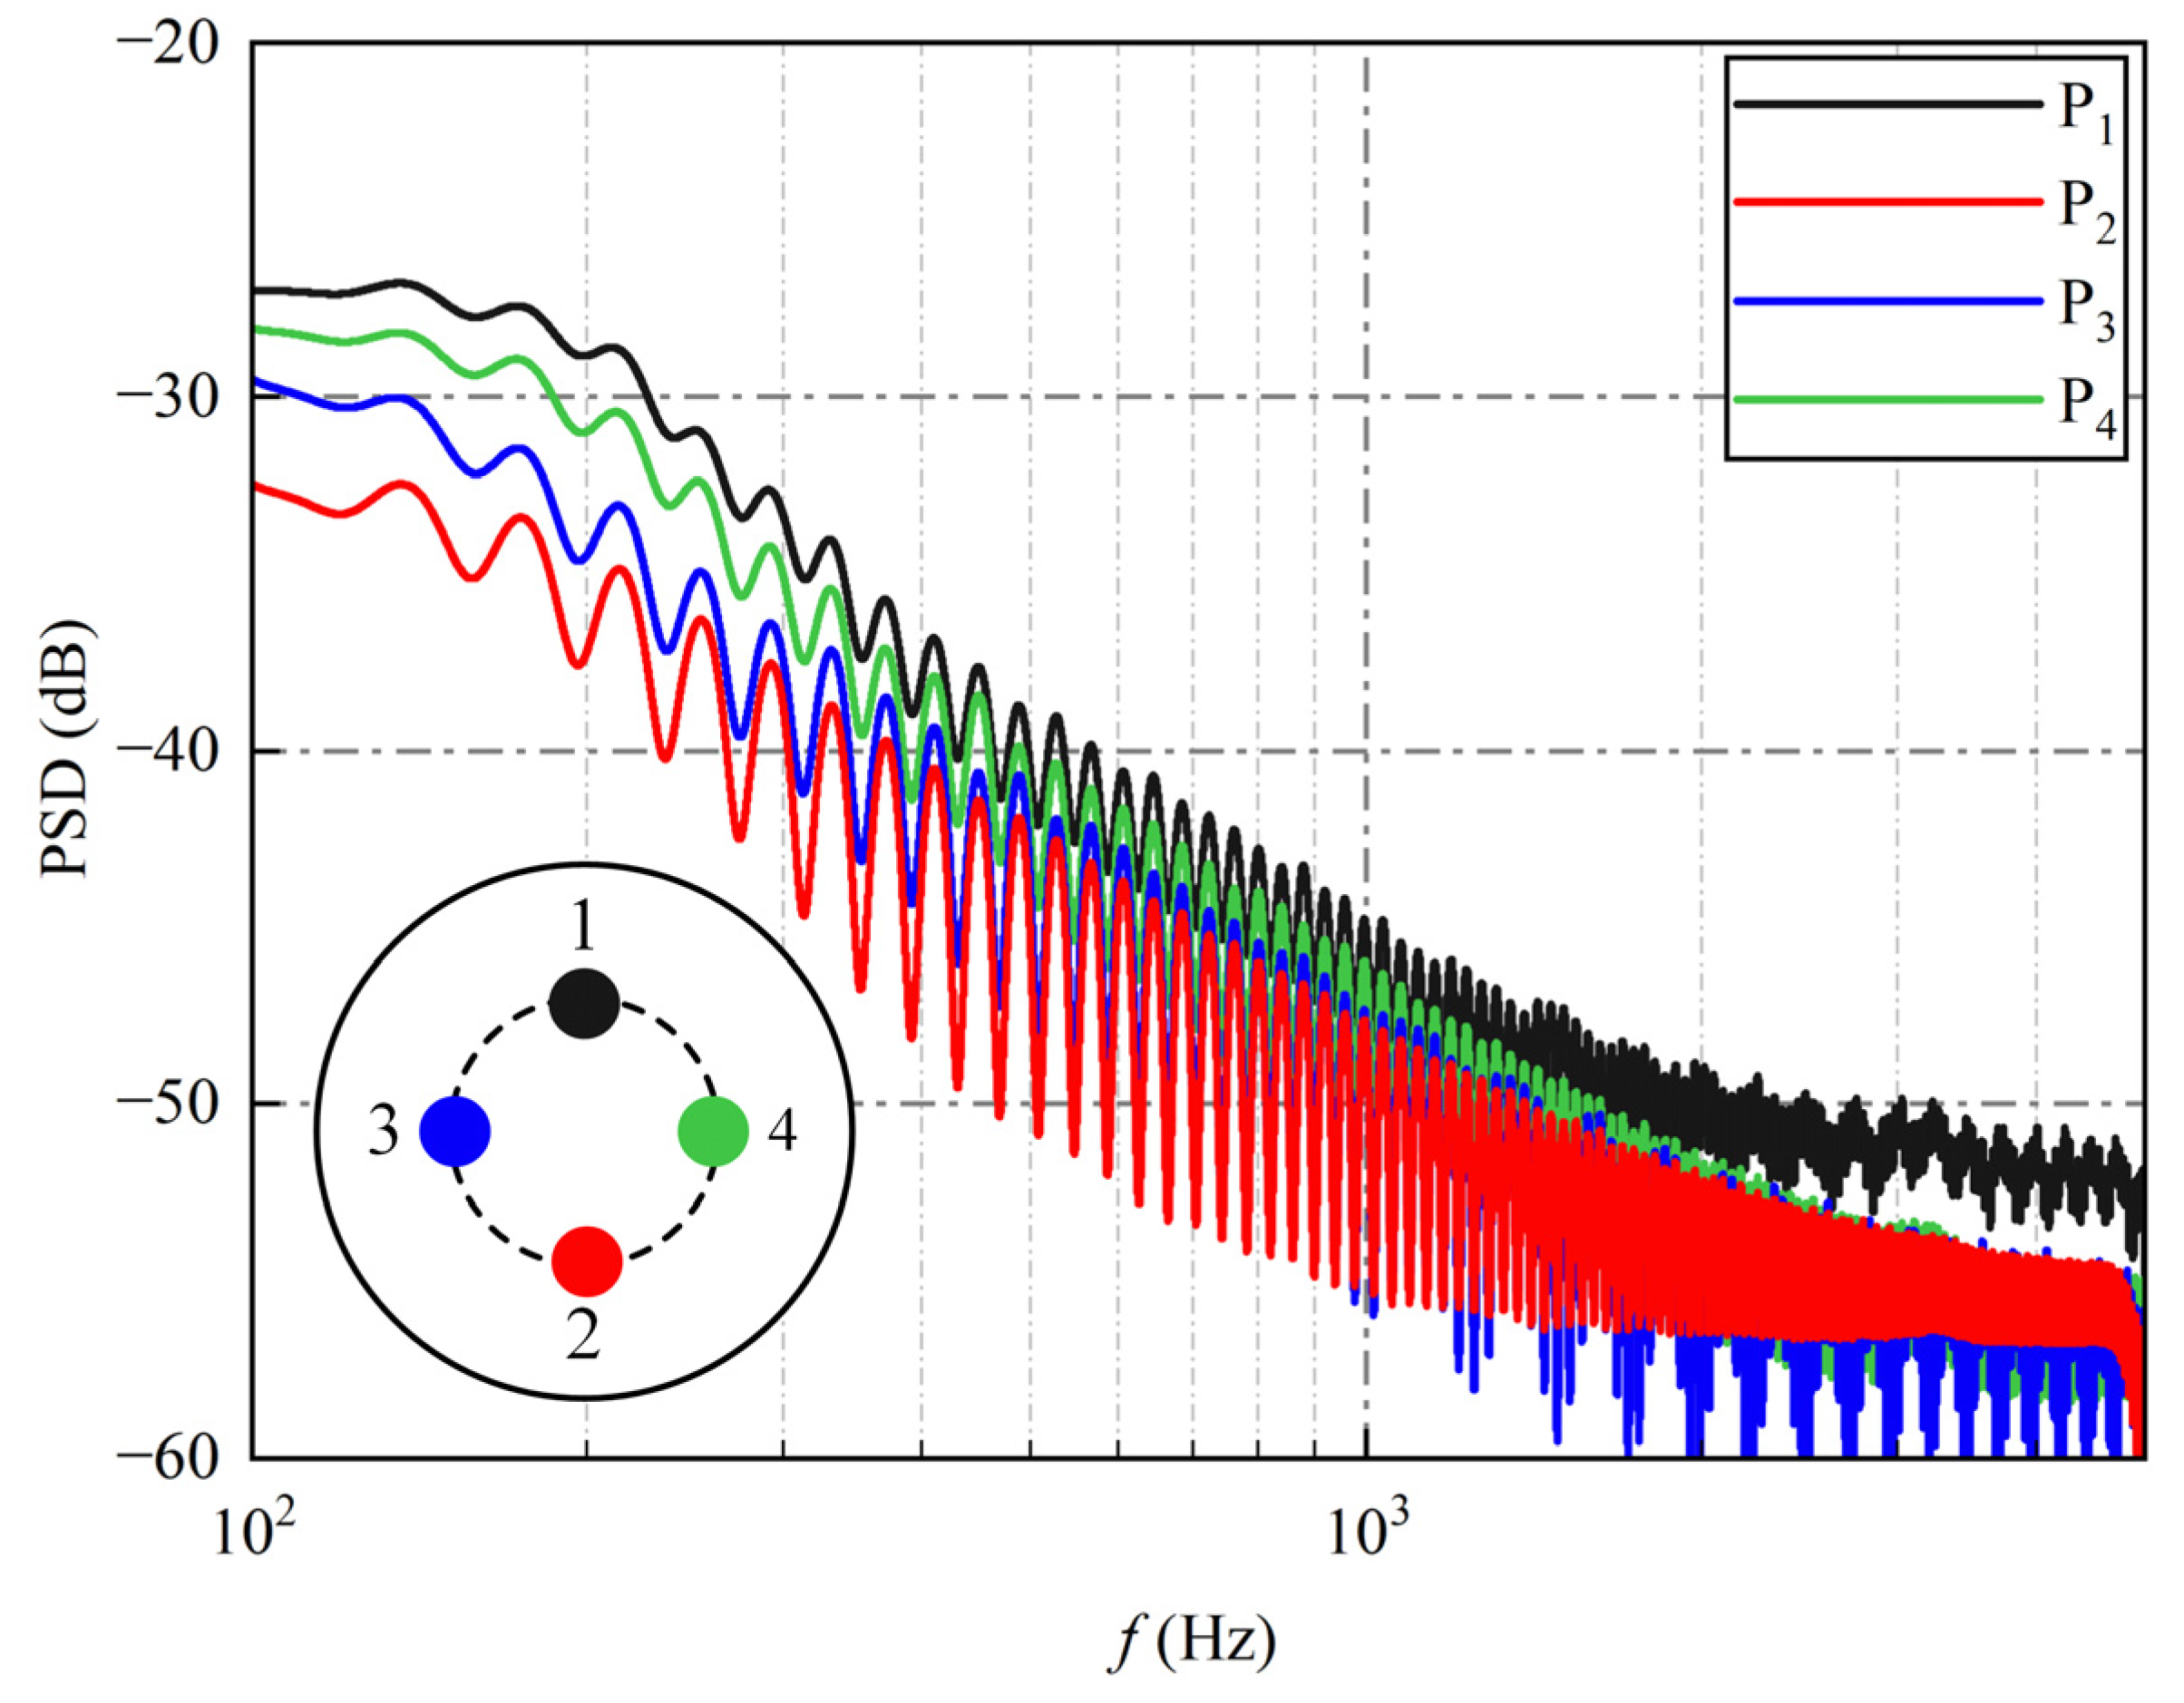
An experiment was conducted to measure the dynamic pressure signals on the windward face of the cylindrical, blunt body. This approach enables a more comprehensive analysis of the spectral characteristics of the unsteady flow field around a spiked-blunt body and highlights the effectiveness of the energy sorting criterion in capturing these spectral features. Figure 19 presents the PSD of the dynamic pressure signals for the spiked-blunt body, with P1 to P4 representing four pressure measurement points distributed circumferentially on the windward face of the cylindrical blunt body. The dynamic pressure sensor used in the experiment operates at a sampling frequency of 10 kHz, which allows it to capture dynamic pressure signals up to 5 kHz according to the Nyquist sampling theorem. The spectra of dynamic pressure signals from the four channels exhibit a high degree of similarity around 3 kHz, with only very minor differences. These slight variations arise from the influence of the three-dimensional effects of the flow field. Simultaneously, this main frequency of 3 kHz closely matches the principal frequency of the dominant modes extracted by POD and DMD using the energy sorting criterion.
The spatial structures of the dominant modes are extracted using POD to conduct a more in-depth comparison and discuss the similarities and differences in the spatial structures of modes extracted by DMD with three sorting criteria. Figure 20 illustrates the flow field structures of the first three modes of the POD for the spiked-blunt body, where Figure 20a–c corresponds to the first, second, and third modes, respectively. The first mode represents the mean flow field of unsteady pulsations, which accounts for 23.2% of the energy. The most prominent features in the spatial structure include the aftershock, recirculation zone, trace of ejected flow mass near the cylinder shoulder, and the interaction zone where the shear layer and aftershock interact. Notably, speckles and streaks are observed in mode 1, which validates that the multiple low-frequency signals present in the PSD of its temporal coefficients are indeed background noise in the flow field.
The second and third modes represent perturbations to the fundamental flow field, which account for 3.7% and 2.9% of the energy, respectively. The background noise of the flow field is no longer present, and their main features both include a single aftershock in front of the cylindrical, blunt body. However, differences are observed between them. In mode 2, the aftershock fully envelops the surface of the cylindrical, blunt body, with the pulsation intensity slightly higher at the shoulder than in the central area. It corresponds to the phase of withholding in the suppressed pulsation mode [53]. In mode 3, the structure of the aftershock is similar to that in the smash phase, but a shallow blue stripe covers the centre of the cylindrical blunt body. This phenomenon is speculated to be an intermittent weak shock wave, and this intermittent weak shock wave reduces the peak frequency in the dynamic pressure signal compared with the peak frequency of the temporal coefficients. Notably, the shock foot is located near the pressure measurement point, and the principal frequency is caused by the continuous pounding of the aftershock on the shoulder of the cylindrical, blunt body.
In summary, the results from the POD and dynamic pressure signals exhibit a high level of agreement with the outcomes of the DMD using the energy sorting criterion in terms of spectral characteristics and spatial structure. The POD and dynamic pressure signals serve as complementary tools that validate the results obtained through DMD using the energy sorting criterion, which further establishes the superiority of this criterion over the two other sorting criteria in the context of unsteady experimental flow fields.
In addition, it is crucial to note that despite the unique advantages of the energy sorting criterion, several limitations and boundaries should be kept in mind in practical applications, and these considerations are essential to ensuring that the results are correctly applied and interpreted.
  • Limited data length: The length of the data series used for DMD affects the accuracy of the decomposition. Insufficient data length may result in an incomplete representation of the dynamics, leading to inaccurate pattern recognition and ordering.
  • Truncation error: When truncating the SVD in DMD, a truncation error occurs, where modes with small singular values are removed. This error affects the accuracy of the decomposition, and the choice of truncation layer should be carefully considered to balance the simplicity and accuracy of the model.
  • Interpretation of modes: The interpretation of the modes obtained from the DMD should be performed with caution. Although the modes represent coherent spatio-temporal patterns, they may not always correspond to physically meaningful structures. The physical interpretation of the modes should be based on domain knowledge, complementary analysis, and validation.

4. Conclusions

This study applies the commonly used amplitude and frequency sorting criteria in conventional DMD, as well as the energy sorting criterion proposed in this study, to process and comparatively analyse the high-dimensional schlieren dataset of the unsteady flow field around a spiked-blunt body under Ma = 2.2 inflow conditions. Furthermore, the study employs POD and dynamic pressure signals to explore the effectiveness of the three criteria in capturing spectral characteristics and spatial structures. This study summarises the characteristics and application scenarios of DMD under each sorting criterion, which sheds light on the primary flow features of the unsteady flow field around the spiked-blunt body in supersonic conditions. The key conclusions are as follows:
  • DMD with the conventional amplitude–frequency sorting criterion presents substantial limitations. DMD using the amplitude sorting criterion can capture structures with large initial amplitudes from the flow field. However, these extracted modes may exhibit excessive decay rates, which make them unable to maintain stability in the flow field over extended periods. DMD using the frequency sorting criterion can extract high- and low-frequency structures from the flow field. However, this criterion has the drawback of limited differentiation amongst the extracted modes. The reason is that they essentially represent similar types of flow field structures, which results in excessive loss of flow field information.
  • DMD, with the energy sorting criterion, can extract the predominant structures of unsteady pulsation in the flow field. This approach simultaneously considers spatial and temporal orthogonality, which effectively avoids the limitations of modes sorted by amplitude with high decay rates and modes sorted by frequency with low differentiation. Compared with the two other sorting criteria, the energy sorting criterion proves more suitable for the experimental dataset of unsteady flow fields.
  • POD can effectively capture dominant coherent structures in the flow field by determining spatially orthogonal bases. The results from POD, along with the spectral characteristics of experimentally measured dynamic pressure signals, exhibit a strong alignment with the DMD results obtained using the energy sorting criterion. This finding substantiates the superiority of the energy sorting criterion over the two other sorting criteria when applied to unsteady experimental flow fields.
  • The spatial composition of the flow field around a hemispherical aerodome and a cylindrical blunt body under supersonic inflow conditions primarily consists of several key elements: the aftershock in front of the cylindrical blunt body, the foreshock in front of the aerodome, and the shear layer and recirculation zone behind the aerodome. The unsteady flow field is predominantly influenced by the pulsation of the aftershock in front of the cylindrical, blunt body. This flow pattern exhibits multi-frequency coupling, with the primary frequency of 3.3 kHz originating from the periodic motion of the aftershock. This reciprocating motion continuously drives the compression and expansion of gas on the surface of the cylindrical, blunt body.

Author Contributions

Conceptualisation, Y.W. and R.G.; methodology, Y.W.; software, Y.W.; validation, J.X. and R.G.; formal analysis, Y.W.; investigation, Y.W.; resources, J.X.; data curation, Q.Q.; writing—original draft preparation, Y.W.; writing—review and editing, J.X. and R.G.; visualisation, Y.W. and L.C.; supervision, J.X. and R.G.; project administration, J.X.; funding acquisition, J.X. All authors have read and agreed to the published version of the manuscript.

Funding

This research was funded by the National Natural Science Foundation of China (Grant No. 12332018), the National Science and Technology Major Project (Grant No. 2019-II-0007-0027), the Defence Industrial Technology Development Programme (Grant No. JCKY2019605D001), and the Interdisciplinary Innovation Fund for Doctoral Students of Nanjing University of Aeronautics and Astronautics (Grant No. KXKCXJJ202309). The authors would like to express their sincere gratitude for the financial support.

Data Availability Statement

The data are not public due to privacy issues. The data presented in this study are available on request from the corresponding author.

Conflicts of Interest

The authors declare no conflicts of interest.

Nomenclature

English symbols:
Asystem matrix of the high-dimensional flow field, (-)
A ˜ low-dimensional similar matrix, (-)
Ctemporal coefficient of DMD mode, (-)
Ddiameter of blunt body, (mm)
Eenergy of DMD mode, (-)
Iidentity matrix, (-)
Llength of blunt body, (mm)
MaMach number, (-)
Nnumber of snapshots, (-)
P1~4pressure monitoring point, (-)
ReReynolds number, (-)
Ttemperature, (K)
U, Vunitary matrix, (-)
X, Yadjacent snapshot matrix, (-)
ddiameter of spike, (mm)
ffrequency, (Hz)
ggrowth rate, (-)
llength of spike, (mm)
ppressure, (Pa)
ttime series, (ms)
xcolumn vector of single flow field snapshot, (-)
Greek symbols:
Λ eigenvector, (-)
Φmatrix of DMD mode, (-)
Σdiagonal matrix, (-)
αamplitude of DMD mode, (-)
λeigenvalue of related DMD mode, (-)
ρdensity, (kg/m3)
σstandard deviation, (-)
ωfrequency of DMD mode, (Hz)
Subscripts:
(∙)Aaerodome
(∙)bback pressure
(∙)eexit condition
(∙)FFrobenius norm
(∙)mtest model
(∙)ttotal parameter

References

  1. Stewartson, K. On the Linearized Potential Theory of Unsteady Supersonic Motion. Q. J. Mech. Appl. Math. 1950, 3, 182–199. [Google Scholar] [CrossRef]
  2. Clemens, N.T.; Narayanaswamy, V. Low-Frequency Unsteadiness of Shock Wave/Turbulent Boundary Layer Interactions. Annu. Rev. Fluid Mech. 2014, 46, 469–492. [Google Scholar] [CrossRef]
  3. Howlett, D.; Hunter, L. A Study of a Supersonic Axisymmetric Spiked Inlet at Angle of Attackusing the Navier-Stokes Equations. In Proceedings of the 24th Aerospace Sciences Meeting, Reno, NV, USA, 6–9 January 1986; American Institute of Aeronautics and Astronautics: Reston, VA, USA, 1986. [Google Scholar]
  4. Sekar, K.R.; Karthick, S.K.; Jegadheeswaran, S.; Kannan, R. On the Unsteady Throttling Dynamics and Scaling Analysis in a Typical Hypersonic Inlet–Isolator Flow. Phys. Fluids 2020, 32, 126104. [Google Scholar] [CrossRef]
  5. Jagadeesh, G.; Hashimoto, T.; Naitou, K.; Sun, M.; Takayama, K. Visualization of Unsteady Shock Oscillations in the High-Enthalpy Flow Field around Double Cones. J. Vis. 2003, 6, 195–203. [Google Scholar] [CrossRef]
  6. Gomes-Fernandes, R. Flow Features around Double Cones at Hypersonic Speed. Aeronaut. J. 2013, 117, 741–748. [Google Scholar] [CrossRef]
  7. Sudarshan, B.; Saravanan, S. Heat Flux Characteristics within and outside a forward Facing Cavity in a Hypersonic Flow. Exp. Therm. Fluid Sci. 2018, 97, 59–69. [Google Scholar] [CrossRef]
  8. Charwat, A.F.; Roos, J.N.; Dewey, F.C.; Hitz, J.A. An Investigation of Separated Flows—Part I: The Pressure Field. J. Aerosp. Sci. 1961, 28, 457–470. [Google Scholar] [CrossRef]
  9. Estruch-Samper, D.; Chandola, G. Separated Shear Layer Effect on Shock-Wave/Turbulent-Boundary-Layer Interaction Unsteadiness. J. Fluid Mech. 2018, 848, 154–192. [Google Scholar] [CrossRef]
  10. Mair, W.A. Experiments on Separation of Boundary Layers on Probes in Front of Blunt-Nosed Bodies in a Supersonic Air Stream. Philos. Mag. J. Sci. 1952, 43, 695–716. [Google Scholar] [CrossRef]
  11. Maull, D.J. Hypersonic Flow over Axially Symmetric Spiked Bodies. J. Fluid Mech. 1960, 8, 584–592. [Google Scholar] [CrossRef]
  12. Panaras, A.G.; Drikakis, D. High-Speed Unsteady Flows around Spiked-Blunt Bodies. J. Fluid Mech. 2009, 632, 69–96. [Google Scholar] [CrossRef]
  13. Guenther, R.A.; Reding, J.P. Fluctuating Pressure Environment of a Drag Reduction Spike. J. Spacecr. Rockets 1977, 14, 705–710. [Google Scholar] [CrossRef]
  14. Ahmed, M.Y.M.; Qin, N. Drag Reduction Using Aerodisks for Hypersonic Hemispherical Bodies. J. Spacecr. Rockets 2010, 47, 62–80. [Google Scholar] [CrossRef]
  15. Sahoo, D.; Das, S.; Kumar, P.; Prasad, J.K. Effect of Spike on Steady and Unsteady Flow over a Blunt Body at Supersonic Speed. Acta Astronaut. 2016, 128, 521–533. [Google Scholar] [CrossRef]
  16. Motycka, D.L.; Murphy, J.B. Experimental Investigation of Inlet-to-Inlet Shock Interference; SAE International: Warrendale, PA, USA, 1965. [Google Scholar]
  17. Farahani, M.; Daliri, A.; Younsi, J.S. Supersonic Inlet Buzz Detection Using Pressure Measurement on Wind Tunnel Wall. Aerosp. Sci. Technol. 2019, 86, 782–793. [Google Scholar] [CrossRef]
  18. D’souza, N.; Molder, S.; Moretti, G. Numerical Method for Hypersonic Internal Flow over Blunt Leading Edges and Two Blunt Bodies. AIAA J. 1972, 10, 617–622. [Google Scholar] [CrossRef]
  19. Ericsson, L.E. Aeroelastic Instability Caused by Slender Payloads. J. Spacecr. Rockets 1967, 4, 65–73. [Google Scholar] [CrossRef]
  20. Tumuklu, O.; Theofilis, V.; Levin, D. On the Unsteadiness of Shock–Laminar Boundary Layer Interactions of Hypersonic Flows over a Double Cone. Phys. Fluids 2018, 30, 106111. [Google Scholar] [CrossRef]
  21. Schuelein, E. Wave Drag Reduction Approach for Blunt Bodies at High Angles of Attack: Proof-of-Concept Experiments. In Proceedings of the 4th Flow Control Conference, Seattle, WA, USA, 23–26 June 2008; American Institute of Aeronautics and Astronautics: Reston, VA, USA, 2008. [Google Scholar]
  22. Jones, J.J. Flow Separation from Rods ahead of Blunt Noses at Mach Number 2.72; Langley Aeronautical Laboratory: Langley Field, VA, USA, 1952.
  23. Wood, C.J. Hypersonic Flow over Spiked Cones. J. Fluid Mech. 1962, 12, 614–624. [Google Scholar] [CrossRef]
  24. Kabelitz, H.-P. Zur Stabilität Geschlossener Grenzschichtablösegebiete an Konischen Drehkörpern bei Hyperschallanströmung; Abt. Wissenschaftliches Berichtswesen der Deutschen Forschungs- und Versuchsanstalt für Luft- und Raumfahrt: Berlin, Germany, 1971. [Google Scholar]
  25. Yamauchi, M.; Fujii, K.; Higashino, F. Numerical Investigation of Supersonic Flows around a Spiked Blunt Body. J. Spacecr. Rockets 1995, 32, 32–42. [Google Scholar] [CrossRef]
  26. Crawford, D.H. Investigation of the Flow over a Spiked-Nose Hemisphere-Cylinder at a Mach Number of 6.8; NASA Technical Note; National Aeronautics and Space Administration: Washington, DC, USA, 1959.
  27. Mehta, R.C. Numerical Analysis of Pressure Oscillations over Axisymmetric Spiked Blunt Bodies at Mach 6.80. Shock Waves 2002, 11, 431–440. [Google Scholar] [CrossRef]
  28. Sahoo, D.; Karthick, S.K.; Das, S.; Cohen, J. Shock-Related Unsteadiness of Axisymmetric Spiked Bodies in Supersonic Flow. Exp. Fluids 2021, 62, 89. [Google Scholar] [CrossRef]
  29. Schmid, P.J.; Sesterhenn, J. Dynamic Mode Decomposition of Numerical and Experimental Data. In Proceedings of the Sixty-First Annual Meeting of the APS Division of Fluid Dynamics, San Antonio, TX, USA, 23–25 November 2008. [Google Scholar]
  30. Schmid, P.J. Dynamic Mode Decomposition of Numerical and Experimental Data. J. Fluid Mech. 2010, 656, 5–28. [Google Scholar] [CrossRef]
  31. Seena, A.; Sung, H.J. Dynamic Mode Decomposition of Turbulent Cavity Flows for Self-Sustained Oscillations. Int. J. Heat Fluid Flow 2011, 32, 1098–1110. [Google Scholar] [CrossRef]
  32. Duke, D.; Soria, J.; Honnery, D. An Error Analysis of the Dynamic Mode Decomposition. Exp. Fluids 2012, 52, 529–542. [Google Scholar] [CrossRef]
  33. Muld, T.W.; Efraimsson, G.; Henningson, D.S. Flow Structures around a High-Speed Train Extracted Using Proper Orthogonal Decomposition and Dynamic Mode Decomposition. Comput. Fluids 2012, 57, 87–97. [Google Scholar] [CrossRef]
  34. Sarmast, S.; Dadfar, R.; Mikkelsen, R.F.; Schlatter, P.; Ivanell, S.; Sørensen, J.N.; Henningson, D.S. Mutual Inductance Instability of the Tip Vortices behind a Wind Turbine. J. Fluid Mech. 2014, 755, 705–731. [Google Scholar] [CrossRef]
  35. Jovanović, M.R.; Schmid, P.J.; Nichols, J.W. Sparsity-Promoting Dynamic Mode Decomposition. Phys. Fluids 2014, 26, 024103. [Google Scholar] [CrossRef]
  36. Sayadi, T.; Schmid, P.J.; Richecoeur, F.; Durox, D. Parametrized Data-Driven Decomposition for Bifurcation Analysis, with Application to Thermo-Acoustically Unstable Systems. Phys. Fluids 2015, 27, 037102. [Google Scholar] [CrossRef]
  37. Chen, K.K.; Tu, J.H.; Rowley, C.W. Variants of Dynamic Mode Decomposition: Boundary Condition, Koopman, and Fourier Analyses. J. Nonlinear Sci. 2012, 22, 887–915. [Google Scholar] [CrossRef]
  38. Wynn, A.; Pearson, D.S.; Ganapathisubramani, B.; Goulart, P.J. Optimal Mode Decomposition for Unsteady Flows. J. Fluid Mech. 2013, 733, 473–503. [Google Scholar] [CrossRef]
  39. Dawson, S.T.M.; Hemati, M.S.; Williams, M.O.; Rowley, C.W. Characterizing and Correcting for the Effect of Sensor Noise in the Dynamic Mode Decomposition. Exp. Fluids 2016, 57, 42. [Google Scholar] [CrossRef]
  40. Leroux, R.; Cordier, L. Dynamic Mode Decomposition for Non-Uniformly Sampled Data. Exp. Fluids 2016, 57, 94. [Google Scholar] [CrossRef]
  41. Bagheri, S. Effects of Weak Noise on Oscillating Flows: Linking Quality Factor, Floquet Modes, and Koopman Spectrum. Phys. Fluids 2014, 26, 094104. [Google Scholar] [CrossRef]
  42. Hemati, M.S.; Williams, M.O.; Rowley, C.W. Dynamic Mode Decomposition for Large and Streaming Datasets. Phys. Fluids 2014, 26, 111701. [Google Scholar] [CrossRef]
  43. Tu, J.H.; Rowley, C.W.; Kutz, J.N.; Shang, J.K. Spectral Analysis of Fluid Flows Using Sub-Nyquist-Rate PIV Data. Exp. Fluids 2014, 55, 1805. [Google Scholar] [CrossRef]
  44. Gueniat, F.; Mathelin, L.; Pastur, L. A Dynamic Mode Decomposition Approach for Large and Arbitrarily Sampled Systems. Phys. Fluids 2015, 27, 025113. [Google Scholar] [CrossRef]
  45. Proctor, J.L.; Brunton, S.L.; Kutz, J.N. Dynamic Mode Decomposition with Control. SIAM J. Appl. Dyn. Syst. 2016, 15, 142–161. [Google Scholar] [CrossRef]
  46. Annoni, J.; Seiler, P. A Method to Construct Reduced-Order Parameter-Varying Models. Int. J. Robust. Nonlinear Control 2017, 27, 582–597. [Google Scholar] [CrossRef]
  47. He, G.; Wang, J.; Pan, C. Initial Growth of a Disturbance in a Boundary Layer Influenced by a Circular Cylinder Wake. J. Fluid. Mech. 2013, 718, 116–130. [Google Scholar] [CrossRef]
  48. Wan, Z.H.; Zhou, L.; Wang, B.F.; Sun, D.J. Dynamic Mode Decomposition of Forced Spatially Developed Transitional Jets. Eur. J. Mech.-B Fluids 2015, 51, 16–26. [Google Scholar] [CrossRef]
  49. Ducoin, A.; Loiseau, J.C.; Robinet, J.C. Numerical Investigation of the Interaction between Laminar to Turbulent Transition and the Wake of an Airfoil. Eur. J. Mech.-B Fluids 2016, 57, 231–248. [Google Scholar] [CrossRef]
  50. Statnikov, V.; Bolgar, I.; Scharnowski, S.; Meinke, M.; Kähler, C.J.; Schröder, W. Analysis of Characteristic Wake Flow Modes on a Generic Transonic Backward-Facing Step Configuration. Eur. J. Mech.-B Fluids 2016, 59, 124–134. [Google Scholar] [CrossRef]
  51. Qin, Q.; Guan, R.; Ma, Z.; Xu, J. Experimental Verification of Pulsation Suppression over Spiked Cylinder Using Standard/Double/Inverse Aerodome. Aerosp. Sci. Technol. 2021, 116, 106848. [Google Scholar] [CrossRef]
  52. Guan, R.; Qin, Q.; Wang, Y.; Xu, J. Experimental Investigation of the Pulsing Flow Field around Four Types of Spiked-Blunt Body at Mach 2.2. Aerosp. Sci. Technol. 2023, 133, 108129. [Google Scholar] [CrossRef]
  53. Guan, R.; Qin, Q.; Wang, Y.; Xu, J. Experimental Investigation of Flow Unsteadiness over Four Types of Spiked-Blunt Body at Mach 2.2. Aerosp. Sci. Technol. 2023, 140, 108468. [Google Scholar] [CrossRef]
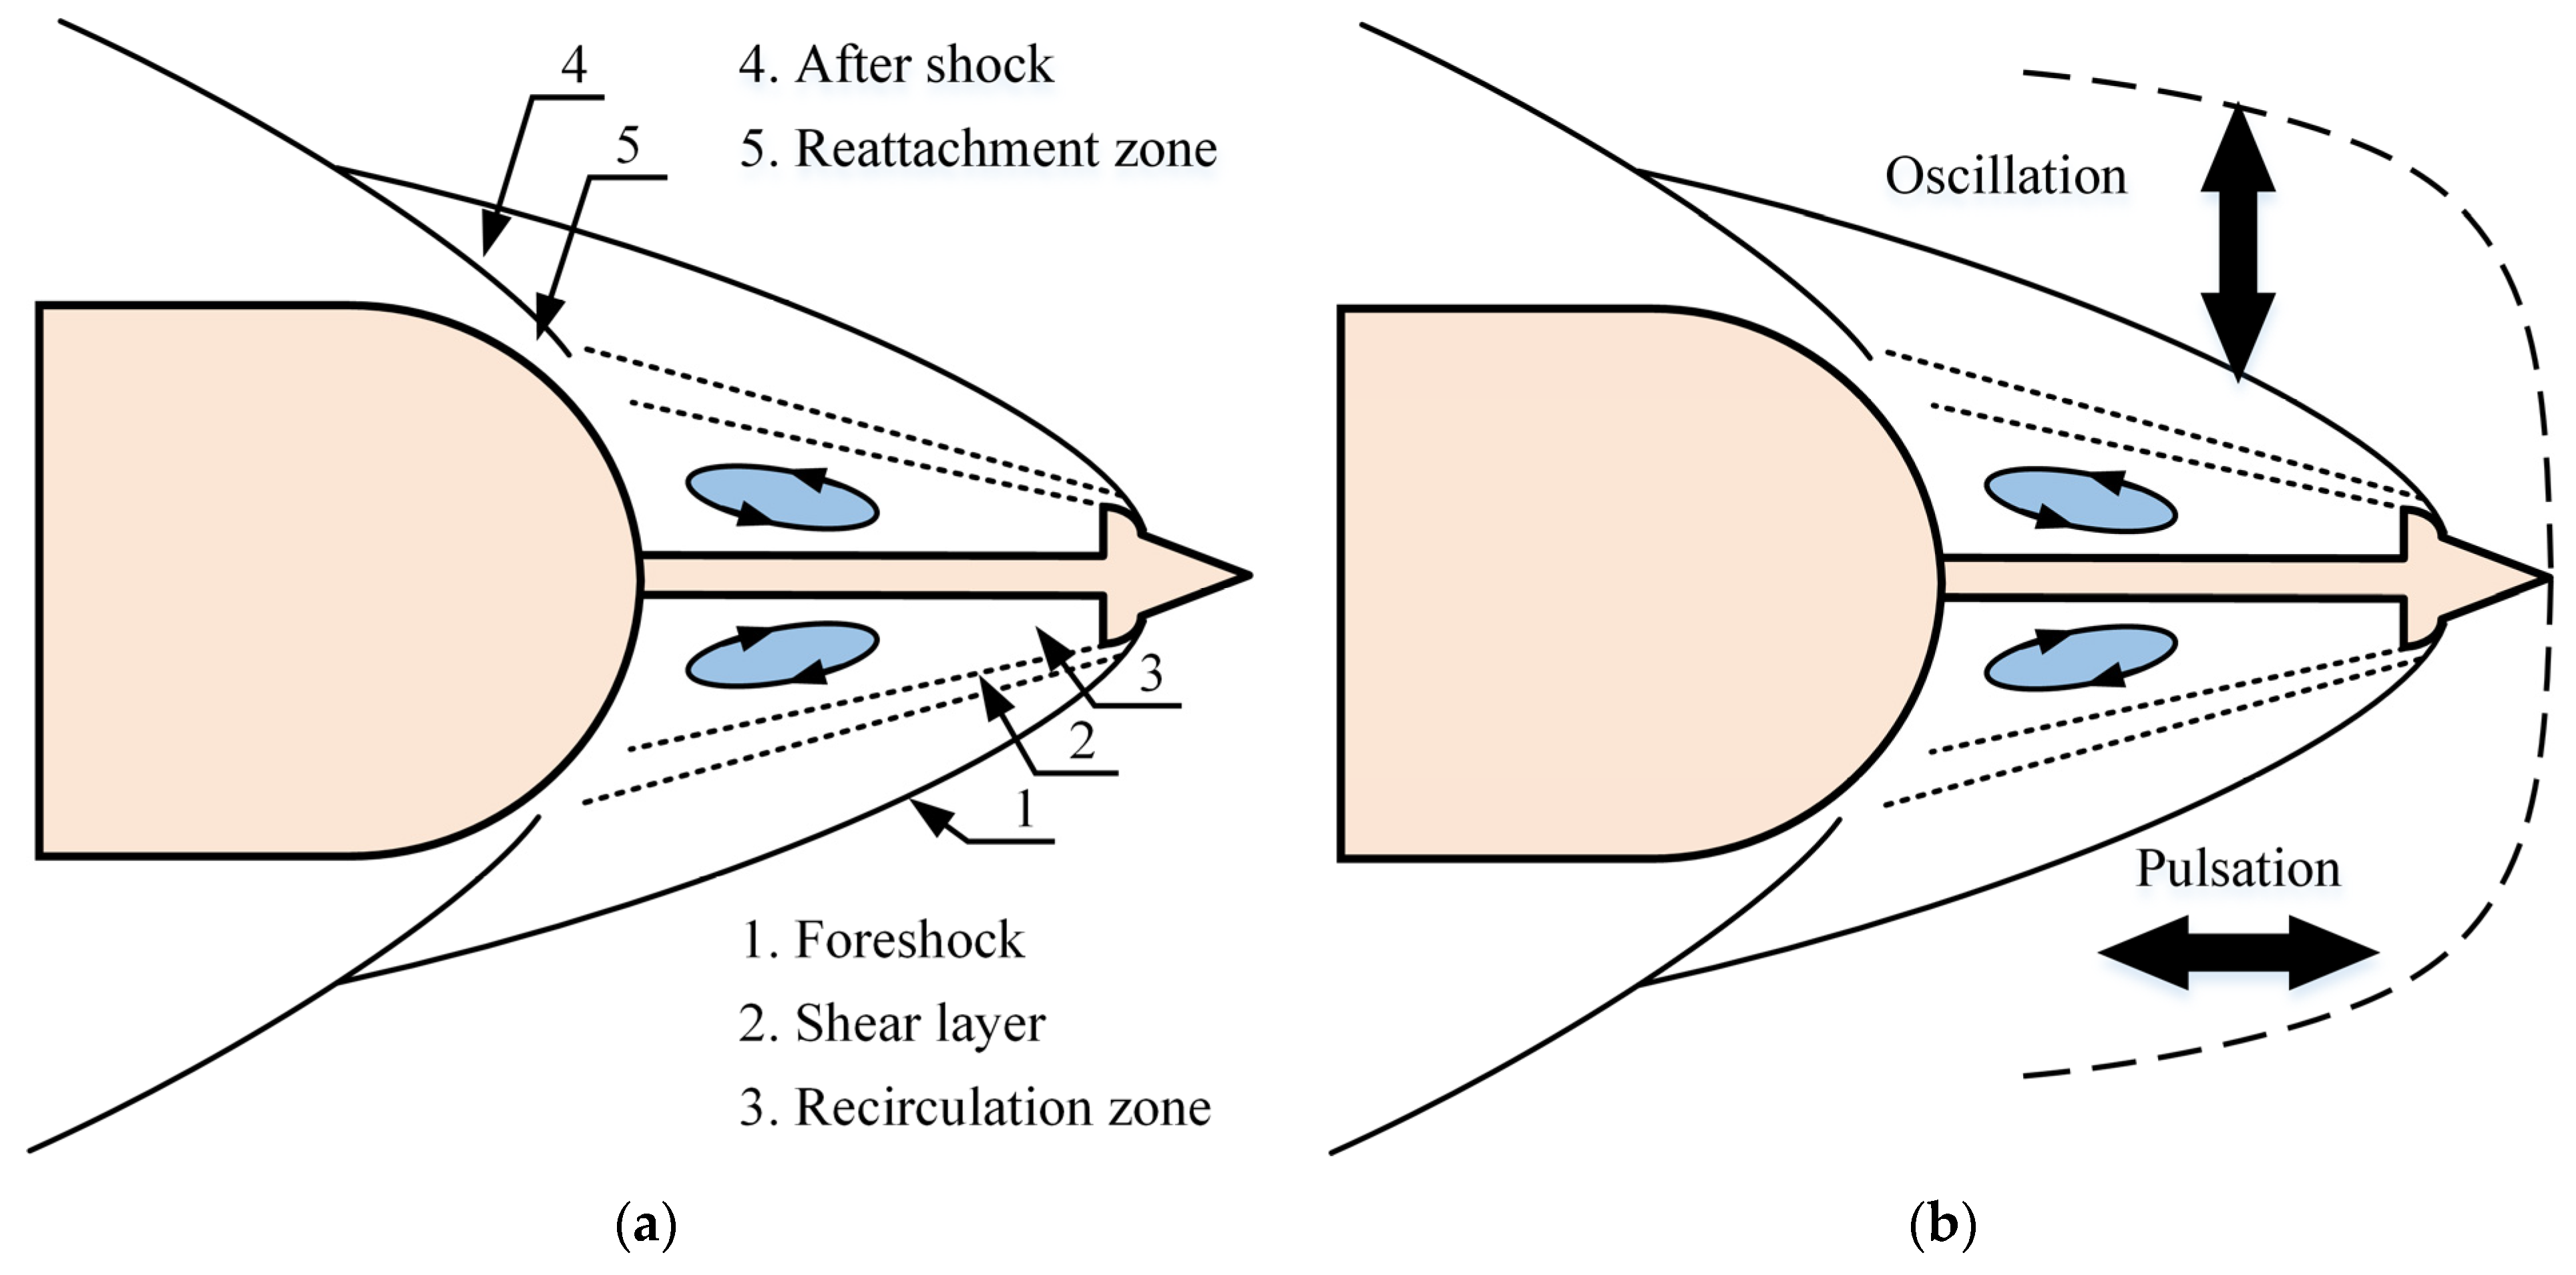
Figure 1. Typical flow field structures over a spiked-blunt body in (a) the steady state and (b) the unsteady state. Although spikes and blunt bodies have different configurations, the fundamental structures of the flow field are similar.
Aerospace 11 00188 g001
Figure 2. Schematic of the SCVT-1 supersonic wind tunnel and the Z-type schlieren system.
Aerospace 11 00188 g002
Figure 3. Schematics of the spiked-blunt body model. (a) Schematic of the geometry of the model. (b) Physical assembly drawing of the model with fixation.
Aerospace 11 00188 g003
Figure 4. Modal eigenvalue analysis of the DMD using the amplitude sorting criterion. (a) Distribution of modal eigenvalues. (b) Relationship between modal growth rate and amplitude. Herein, black circles represent all eigenvalues, while red circles denote the extracted eigenvalues of the first six modes.
Aerospace 11 00188 g004
Figure 5. Evolution of the temporal coefficients amongst the first six modes of the DMD using the amplitude sorting criterion. (a) Real part. (b) Imaginary part.
Aerospace 11 00188 g005
Figure 6. Power spectral density of the temporal coefficients amongst the first six modes of the DMD using the amplitude sorting criterion. (a) Real part. (b) Imaginary part.
Aerospace 11 00188 g006
Figure 7. Flow field structures of the first six modes of the DMD using the amplitude sorting criterion for the spiked-blunt body. Specifically, (ac) represent the real part, while (df) represent the imaginary part.
Aerospace 11 00188 g007
Figure 8. Modal eigenvalue analysis of the DMD using the frequency sorting criterion. (a) Distribution of modal eigenvalues. (b) Relationship between modal growth rate and amplitude. Herein, black circles represent all eigenvalues, while red circles denote the extracted eigenvalues of the first six modes.
Aerospace 11 00188 g008
Figure 9. Evolution of the temporal coefficients amongst the first six modes of the DMD using the frequency sorting criterion. (a) Real part. (b) Imaginary part.
Aerospace 11 00188 g009
Figure 10. Power spectral density of the temporal coefficients amongst the first six modes of the DMD using the frequency sorting criterion. (a) Real part. (b) Imaginary part.
Aerospace 11 00188 g010
Figure 11. Flow field structures of the first six modes of the DMD using the frequency sorting criterion for the spiked-blunt body. Specifically, (ac) represent the real part, while (df) represent the imaginary part.
Aerospace 11 00188 g011
Figure 12. Energy proportion of each mode (left axis) and cumulative energy proportion of modes (right axis) for the first 1000 modes in the DMD using the energy sorting criterion.
Aerospace 11 00188 g012
Figure 13. Modal eigenvalue analysis of the DMD using the energy sorting criterion. (a) Distribution of modal eigenvalues. (b) Relationship between modal growth rate and amplitude. (c) Relationship between modal frequency and amplitude. Herein, black circles represent all eigenvalues, while red circles denote the extracted eigenvalues of the first five modes.
Aerospace 11 00188 g013
Figure 14. Evolution of the temporal coefficients amongst modes 2–3 and 4–5 of the DMD using the energy sorting criterion. (a) Real part. (b) Imaginary part.
Aerospace 11 00188 g014
Figure 15. Power spectral density of the temporal coefficients amongst modes 2–3 and 4–5 of the DMD using the energy sorting criterion. (a) Real part. (b) Imaginary part.
Aerospace 11 00188 g015
Figure 16. Flow field structures of the first five modes of the DMD using the energy sorting criterion for the spiked-blunt body. Specifically, (ac) represent the real part, while (d,e) represent the imaginary part.
Aerospace 11 00188 g016
Figure 17. Energy proportion of each mode (left axis) and cumulative energy proportion of modes (right axis) in the POD for the spiked-blunt body.
Aerospace 11 00188 g017
Figure 18. Power spectral density of the temporal coefficients amongst the first three modes of the POD for the unsteady flow of the spiked-blunt body. (a) Mode 1. (b) Modes 2 and 3.
Aerospace 11 00188 g018
Figure 19. Power spectral density of the dynamic pressure signals for the spiked-blunt body. P1 to P4 represent the locations of dynamic pressure sensors.
Aerospace 11 00188 g019
Figure 20. Flow field structures of the first three modes of the POD for the spiked-blunt body. Specifically, (a) represents the basic flow field (i.e., the mean flow field), while (b,c) depict perturbations to the basic flow field.
Aerospace 11 00188 g020
Table 1. Experimental conditions.
Mae, [-]Tt,e, [K]pt,e, [Pa]pb, [Pa]ReD, [-]
2.23051.01 × 1038.5 × 1032.6 × 105
Table 2. Dimensions of the spiked-blunt body model.
ParameterSymbolValue [mm]
Diameter of blunt bodyD40
Length of blunt bodyL40
Length of spikel40
Diameter of spiked2.6
Diameter of aerodomeDA14.4
Disclaimer/Publisher’s Note: The statements, opinions and data contained in all publications are solely those of the individual author(s) and contributor(s) and not of MDPI and/or the editor(s). MDPI and/or the editor(s) disclaim responsibility for any injury to people or property resulting from any ideas, methods, instructions or products referred to in the content.