1. Introduction
The wing serves as the primary lift-generating component of an aircraft, playing a vital role in both its design and flight performance. The wing’s skin, which interacts directly with the airflow, experiences complex aerodynamic loads during flight, potentially resulting in fatigue deformation, structural damage, and other associated risks. Consequently, conducting stress analysis on the wing skin is essential for maintaining the overall structural integrity of the wing. In contemporary engineering design, particularly within the realm of structural engineering, finite element analysis (FEM) is extensively employed to address intricate stress and deformation challenges [
1,
2]. This approach involves applying various boundary conditions to derive skin stress data and analyze stress distribution under differing operational scenarios. While FEM-based computational methods are capable of accurately simulating airfoil loading, traditional FEM techniques often encounter substantial computational costs and prolonged analysis times, especially in scenarios involving highly nonlinear geometries or dynamic loading conditions [
3,
4]. As the demand for sustainable, high-performance structures escalates, it is imperative for designers to rapidly assess the static stress performance of multiple design alternatives during the preliminary stages. Moreover, the importance of structural health monitoring for airfoils has increased to ensure their safety and reliability over extended usage periods. This evolving landscape has driven researchers to explore efficient predictive methodologies to enhance the design and evaluation processes of airfoils.
With the rapid development of Big Data and Artificial Intelligence technologies, engineers are using data-driven methods to optimize the design process and improve prediction accuracy with the help of massive data and powerful computing power [
5,
6,
7]. Advanced data-driven techniques, such as data mining and deep learning, make it possible to extract valuable information from complex inputs, enabling rapid assessment of structural performance and failure prediction, and driving the design and application of sustainable high-performance structures [
8,
9,
10].
Deep learning, a significant branch of machine learning, has exhibited remarkable capabilities, particularly in the processing of complex tasks such as image recognition, speech analysis, and natural language processing. An increasing number of researchers, both domestically and internationally, are investigating the applications of deep learning within the aviation sector, yielding notable outcomes [
11,
12,
13]. Among these, Convolutional Neural Networks (CNNs) have garnered substantial attention due to their robust abilities in spatial feature extraction and information processing. Researchers have devised various network architectures and models based on CNNs tailored for diverse prediction and classification tasks, thereby offering effective solutions for optimizing the performance of aerostructures and enhancing fault prediction. In conclusion, the integration of deep learning and machine learning technologies not only augments the efficiency of design and analytical processes within engineering but also establishes a foundation for future sustainable development, further advancing the intelligent evolution of structural design and its applications [
14,
15,
16,
17,
18].
Zhang et al. investigated the adaptability of CNNs for aerodynamic metamodeling, designing models tailored to various flow conditions and geometrical configurations. Through the training of multiple CNN architectures, they successfully predicted the lift coefficients of airfoils under diverse conditions, comparing the outcomes with those obtained from a multilayer perceptron (MLP). The findings indicate that the prediction accuracy of the CNN is comparable to that of the MLP, particularly under minimal geometric constraints, thereby demonstrating the efficacy of CNNs in this domain [
19].
Chen et al. emphasize the significance of both symmetric and asymmetric airfoils in aircraft design and manufacturing, highlighting the necessity of acquiring their aerodynamic coefficients. They propose a CNN-based approach for predicting multiple aerodynamic coefficients. This method initially generates a transformed airfoil image (TAI) through fluidic convolution, which is then combined with the original airfoil image to create a composite airfoil image (CAI) for CNN analysis. Using the symmetric airfoil NACA 0012 as a case study for training and testing, the results demonstrate that the CNN method effectively predicts pitching moments, drag, and lift coefficients with a high degree of accuracy [
20].
Bhatnagar’s research presents a CNN-based approximate model designed for predicting flow fields. This model specifically targets the prediction of velocity and pressure fields corresponding to a given pixelated object shape, with an emphasis on Reynolds-averaged Navier–Stokes (RANS) flow solutions over an airfoil. The study demonstrates that the predictive capabilities of the CNN are notably improved through the incorporation of convolutional operations, parameter sharing, and its robustness to noise [
21].
In the realm of stress prediction, CNNs have proven their robust capabilities in feature extraction and spatial information capture. Sepasdar et al. employed a series of CNN architectures to predict post-failure von Mises stress fields and identify failure modes in inelastic composites [
22,
23,
24].
Indrashish’s research investigates the design and analysis of inelastic materials under loading, emphasizing the prediction of their physical responses. To address the high time and computational costs associated with finite element method simulations, a deep learning (DL) framework is proposed for the rapid prediction of micro-scale elastic-plastic strains and stresses in two-phase media. The study introduces a novel two-step training methodology to enhance stress prediction accuracy: initially, the model is trained to predict strain fields, which are then utilized as inputs for stress field predictions. This efficient data-driven approach effectively predicts physical fields in inelastic materials using only microstructural images and load information [
25].
Li et al. proposed a multiscale deep convolutional neural network (MS-DCNN) aimed at enhancing the accuracy of remaining useful life (RUL) assessments, thereby assisting decision-makers in developing effective maintenance strategies to maximize equipment utilization and mitigate costly failures. The MS-DCNN efficiently extracts features through its multiscale architecture, directly establishing a relationship between monitoring data and actual RUL. The results indicate that this method surpasses other network structures in prediction performance while accurately forecasting RUL without increasing computational demands [
26].
Bhaduri’s research investigates the application of deep learning tools for local stress field prediction in fiber-reinforced composite systems, serving as an alternative to traditional finite element methods (FEMs). This methodology effectively reduces computational expenses while preserving the accuracy of the predictions [
27].
Lei et al. proposed a rolling bearing fault diagnosis model that integrates Markov transfer field (MTF) and graph attention networks (GAT). This model leverages MTF to transform one-dimensional signals into two-dimensional feature maps, thereby preserving the temporal correlations inherent in the signals. By training and validating the model with various types of fault signals in a simulated real-world engineering environment, the experimental results demonstrate that the MTF-GAT model can accurately classify faults across diverse environmental conditions. Moreover, it exhibits superior recognition accuracy and generalization performance compared to other deep learning models [
28].
In the aforementioned studies, CNNs have been extensively utilized for the prediction of various domains, showcasing their formidable capacity to process high-dimensional data and capture intricate features. These investigations have established a foundational understanding for implementing data-driven methodologies in engineering contexts. Nevertheless, despite the notable successes of CNNs in specific applications, current models exhibit limitations in accurately predicting both global and local stresses, particularly when confronted with complex geometries and multiscale challenges. Furthermore, there is a relative scarcity of research focusing on the application of deep learning models specifically for structural stress prediction, and existing CNN architectures have not been optimized for this particular task, leading to inadequate prediction accuracy.
To address the aforementioned challenges, this paper introduces a novel multi-scale convolutional neural network model known as the Multi-scale Attention Enhanced Unet (MA-Unet) model. This model integrates multi-scale feature extraction with an attention mechanism, employing multi-scale convolutional kernels to effectively capture the nuances of stress distribution across various levels. Additionally, the attention mechanism allows MA-Unet to adaptively focus on the most critical feature regions, thereby effectively filtering out irrelevant information and enhancing both the accuracy and robustness of the predictions. By leveraging deep learning techniques on wing-specific input parameters, MA-Unet not only adeptly identifies subtle variations in both global and local stress distributions but also demonstrates superior prediction accuracy and speed. This performance aligns with the dual requirements of efficiency and precision in contemporary engineering design.
In this paper, a finite element model is first developed for the wing design of a ventilation aircraft, with the aerodynamic load spectrum on the finite element nodes derived from aerodynamic calculation data and interpolation procedures. The flight parameters of the wing and the aerodynamic loads on the structural nodes are then organized and segmented into training and testing datasets. Finally, MA-Unet is employed to train and predict the dataset, with the results compared against those obtained from commonly used CNN and Unet models, thereby validating the superiority and applicability of the proposed MA-Unet method.
2. Theoretical Principles and Overall Process
2.1. Convolutional Neural Networks and Attention Mechanisms
CNNs were originally designed primarily for image recognition and processing tasks. Their distinctive structure, featuring convolutional and pooling layers, enables them to efficiently capture spatial hierarchies within images. As a result, CNNs have achieved significant success in various domains, including image classification, object detection, and facial recognition.
In a CNN, the operational components of the convolutional layer primarily include the convolutional kernel, stride, and padding. The convolutional kernel slides over the input data at specified intervals, multiplying its elements with the corresponding elements of the input, followed by summation. This process can be viewed as a matrix transformation. For a pressure matrix
obtained after interpolation, let the convolution kernel be
, the stride be
, and the padding be
. The convolution operation can be defined as
where
, denotes the pressure matrix after the convolution operation, and
denotes the matrix size after the operation.
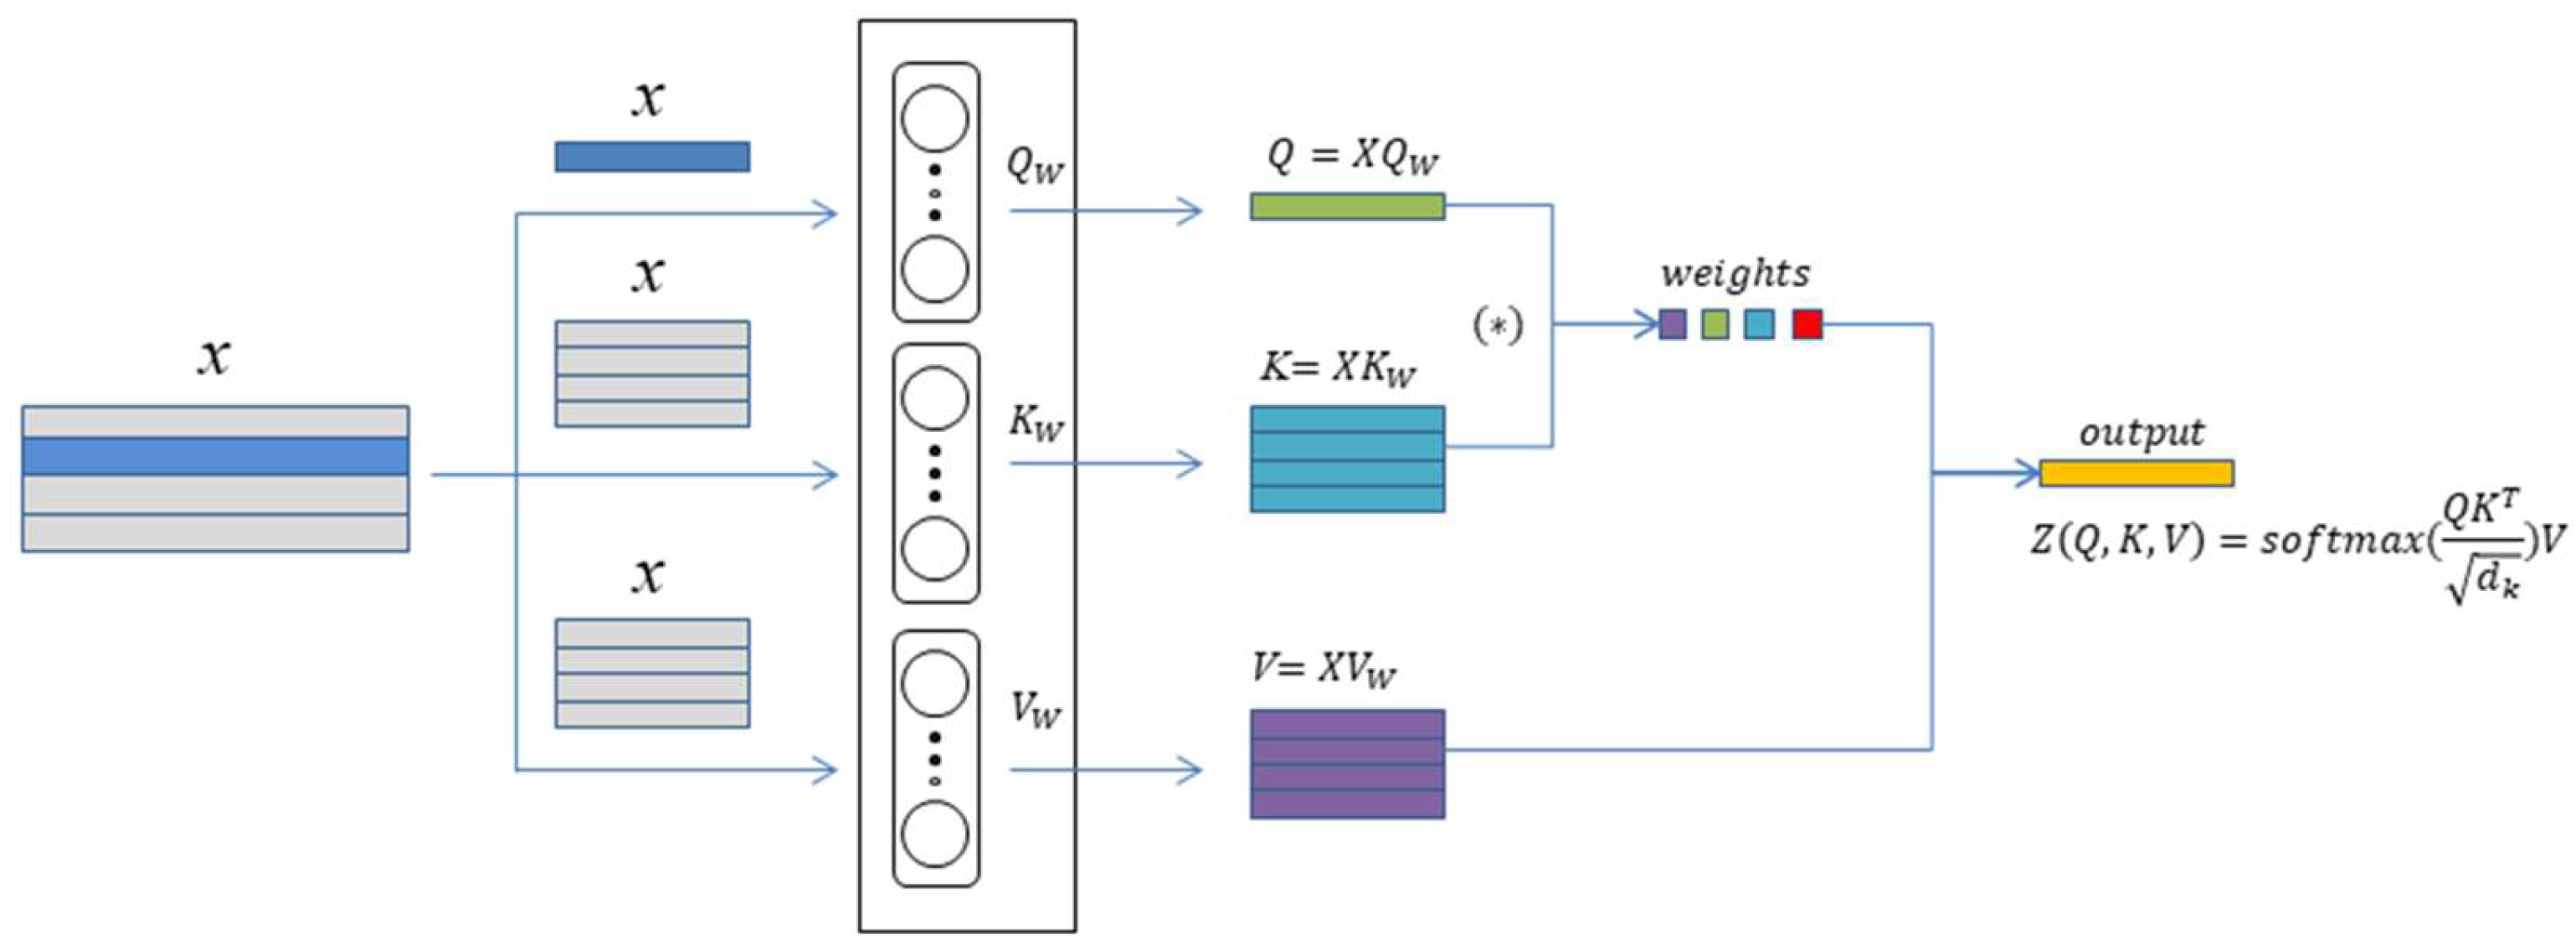
The self-attention mechanism, as improved by Vaswani et al., leverages the principles of attention to associate different positions within a single sequence, allowing for the calculation of representations of that sequence. This mechanism offers superior global modeling capabilities compared to CNNs, enhancing the model’s ability to capture sample features by integrating the strengths of both CNNs and self-attention. The self-attention mechanism is fundamentally comprised of three components: the query vector, the key vector, and the value vector. Its calculation principle is shown in
Figure 1. Its calculation process can be delineated into the following three steps:
- (1)
Assign weights to the input matrix and calculate the value of q, k, v, which is calculated as follows:
where
are initialized learnable weight matrices.
- (2)
Calculate the dot product between q and k and scale the result
where
is the dimension of
Q and
K. Scaling the calculation results prevents clicks from being too large and enhances model fitting.
- (3)
Attentional weights were calculated using the softmax function on the computed results and pointwise multiplied with V to obtain the attentional output.
That is, the final expression is
2.2. Overall Process
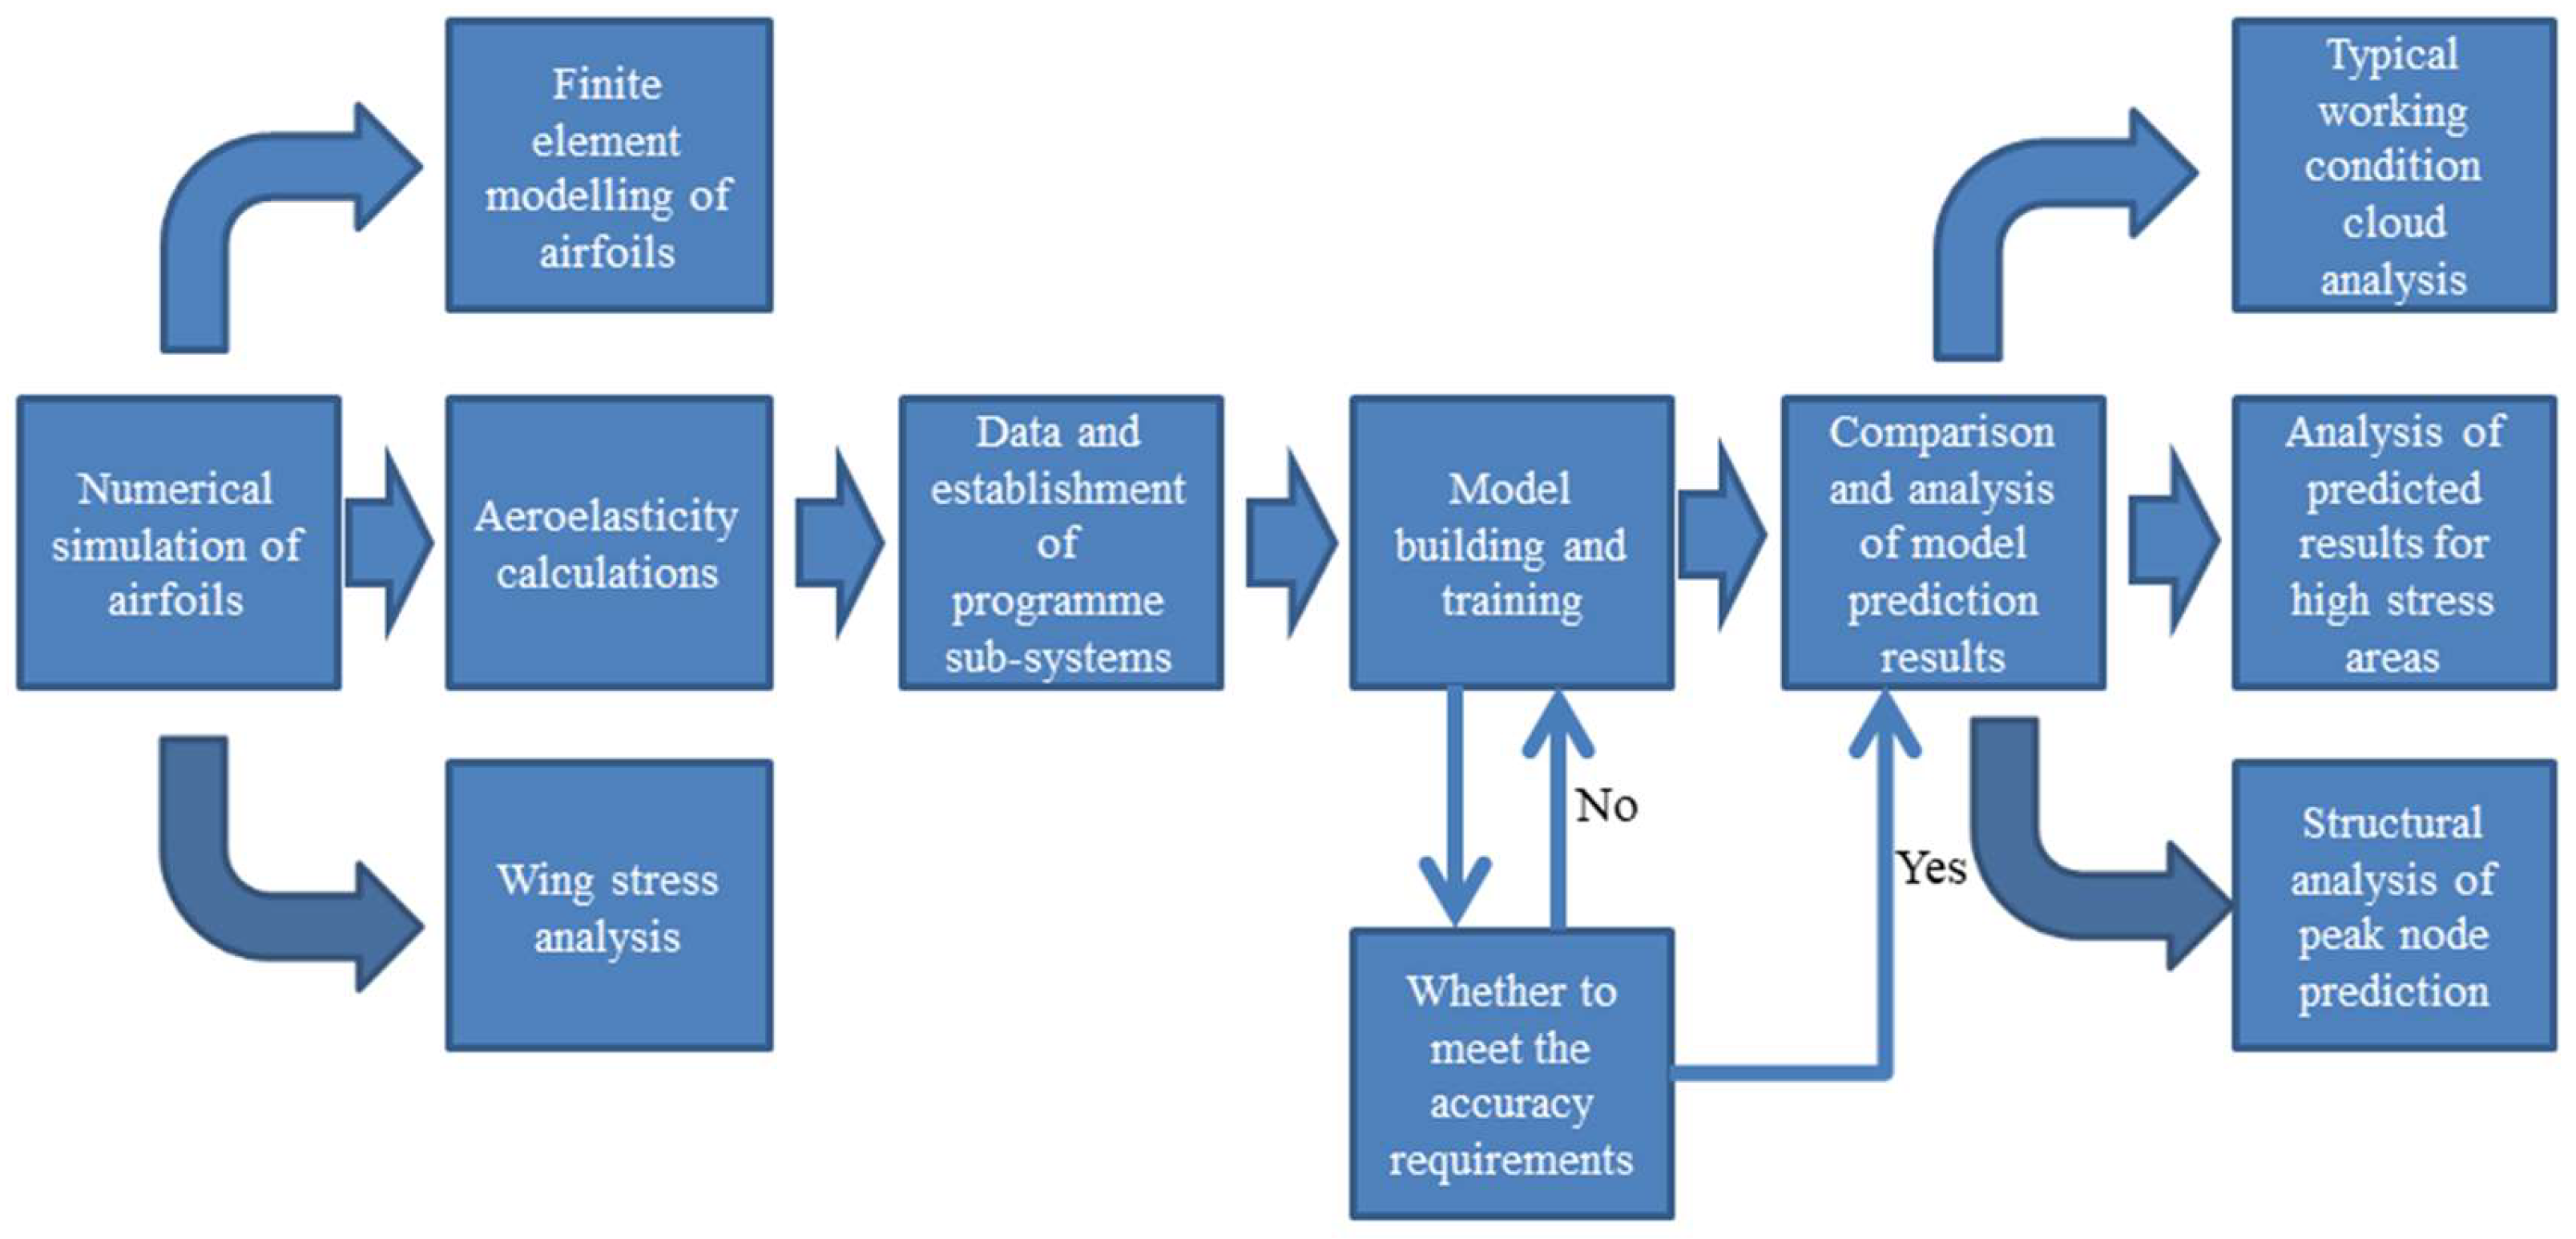
Stress analysis is a critical component of structural analysis, where finite element analysis methods are commonly employed for the stress calculation and analysis of complex structures and material systems. However, traditional multi-scale finite element analysis is frequently burdened by significant computational demands and time expenditures, prompting researchers to explore more efficient, data-driven machine learning approaches as viable alternatives. In response to this challenge, this paper presents a deep learning-based model for stress prediction. The proposed model integrates multi-scale feature extraction alongside an attention mechanism, leveraging the Unet architecture to more effectively capture the complexities inherent in stress distribution features. The methodology is applied to wing skin structures, with the primary workflow for stress prediction illustrated in
Figure 2. The key steps involved are as follows:
- (1)
Numerical Simulation of the Wing and Data Acquisition
Firstly, computational fluid dynamics (CFD) software was used to perform aerodynamic calculations on the wing to obtain the skin aerodynamic load data under different working conditions. These working conditions include different flight parameters and aim to comprehensively reflect the load changes of the wing in actual flight. Subsequently, an interpolation procedure is used to accurately interpolate the CFD calculation results to the finite element nodes of the wing in order to achieve the accurate addition of loads and obtain the interpolated nodal load spectrum. Finally, hydrostatic calculations are performed with the help of finite element calculation software, so as to obtain the corresponding skin stress field data, which provides a solid data base for subsequent model training and validation.
- (2)
Dataset Establishment
After the obtained load spectra and flight parameters have undergone the necessary pre-processing, a multi-channel merger is performed in order to collate samples that meet the model input requirements. This process ensures the high quality and consistency of the data, which can effectively reflect the loading condition of the wing under different operating conditions. According to the design requirements, the final dataset is divided into training, validation, and test sets to facilitate subsequent model training and evaluation. In addition, dividing the dataset into training, validation, and test sets can improve the generalization ability of the model and also provide an objective basis for subsequent performance evaluation.
- (3)
Model Design
A novel deep learning model that can be used for wing skin stress field prediction is proposed based on the skin stress distribution. The model is based on the traditional Unet structure, incorporating multi-scale feature extraction and an attention mechanism. The multi-scale feature extraction enables the model to effectively capture the subtle changes of the stress field at different resolutions, while the attention mechanism enhances the model’s ability to learn global features and improve the model prediction performance.
- (4)
Model Evaluation
To ensure the validity and reliability of the model, the loss function and evaluation indexes commonly used in the field of deep learning are used to systematically evaluate and debug the model. Parameter adjustments are made by setting up model-tuning methods and observing the changes in loss values and evaluation indicators during model training. The model with the relative best performance is finally selected for stress prediction to ensure the effectiveness of the model in practical applications.
- (5)
Analysis of Results
After the training of the model is completed, it is validated and tested using the established dataset, and the prediction results of the model are analyzed in depth. The superiority and applicability of the MA-Unet model in stress analysis is verified by comparing the prediction results with the currently used CNN and Unet models.
3. Numerical Simulation and Stress Field Data Acquisition for Airfoils
In this study, a composite fixed-wing model of a general aviation aircraft, currently in the design phase, is employed for numerical simulations. The wing’s key parameters include a chord length of 1.45 m, a wingspan of 10.46 m, and a total airfoil area of 15.167 square meters. To generate the required training data, the research examines the aircraft’s operation at zero altitude, with flight speeds ranging from 150 to 240 km/h and angles of attack varying from 0 to 9 degrees. For aerodynamic load calculations, the commercial software Fluent is employed for the numerical simulation of the wing.
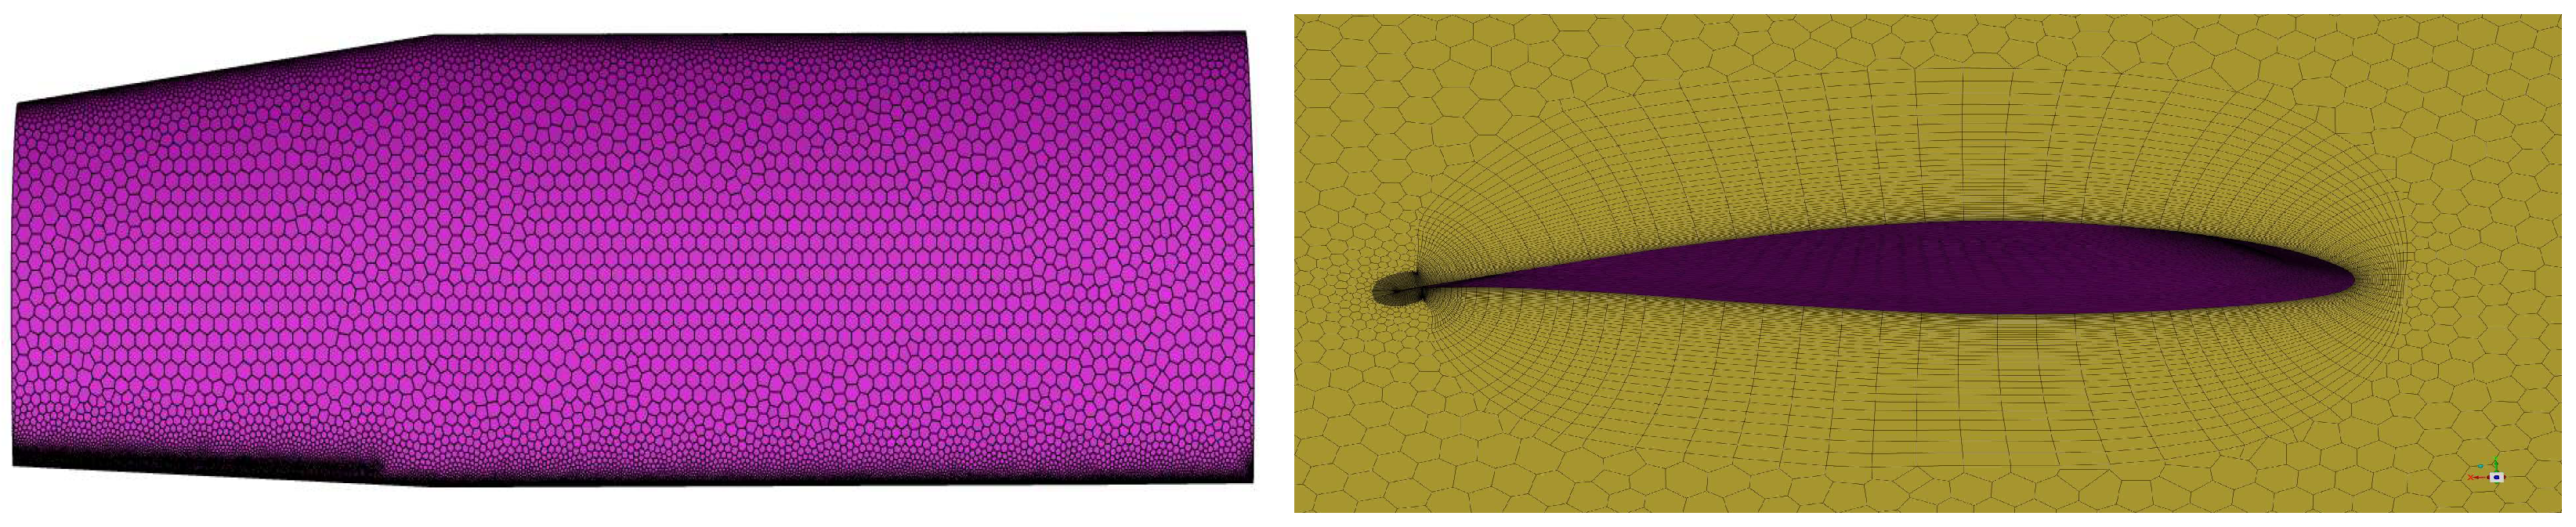
Initially, aerodynamic meshing of the wing geometry model is performed using Fluent Meshing software, employing the Poly-Hexcore body mesh generation method to enhance the number of hexahedral meshes. The aerodynamic mesh schematic of the wing skin and boundary layer is shown in
Figure 3. The overall mesh size of the far field and wing wall is controlled between 0.001 m and 3 m, and the BOI encrypted mesh is set up in the leading and trailing edge regions of the wing, and a 40-layer boundary layer is set up in the wall region, with the initial height of the boundary layer being 0.001 m, and the total number of meshes is 2.75 million. In the watertight workflow, boundary conditions are set with the far-field wing designated as the pressure far-field and the wing model defined as a wall. To enhance solution accuracy, the pressure solver employs a second-order upwind discrete format. The shear stress transport (SST) k-ω model is selected as the turbulence model, with convergence determined when the lift and drag stabilize and the residuals fall below
.
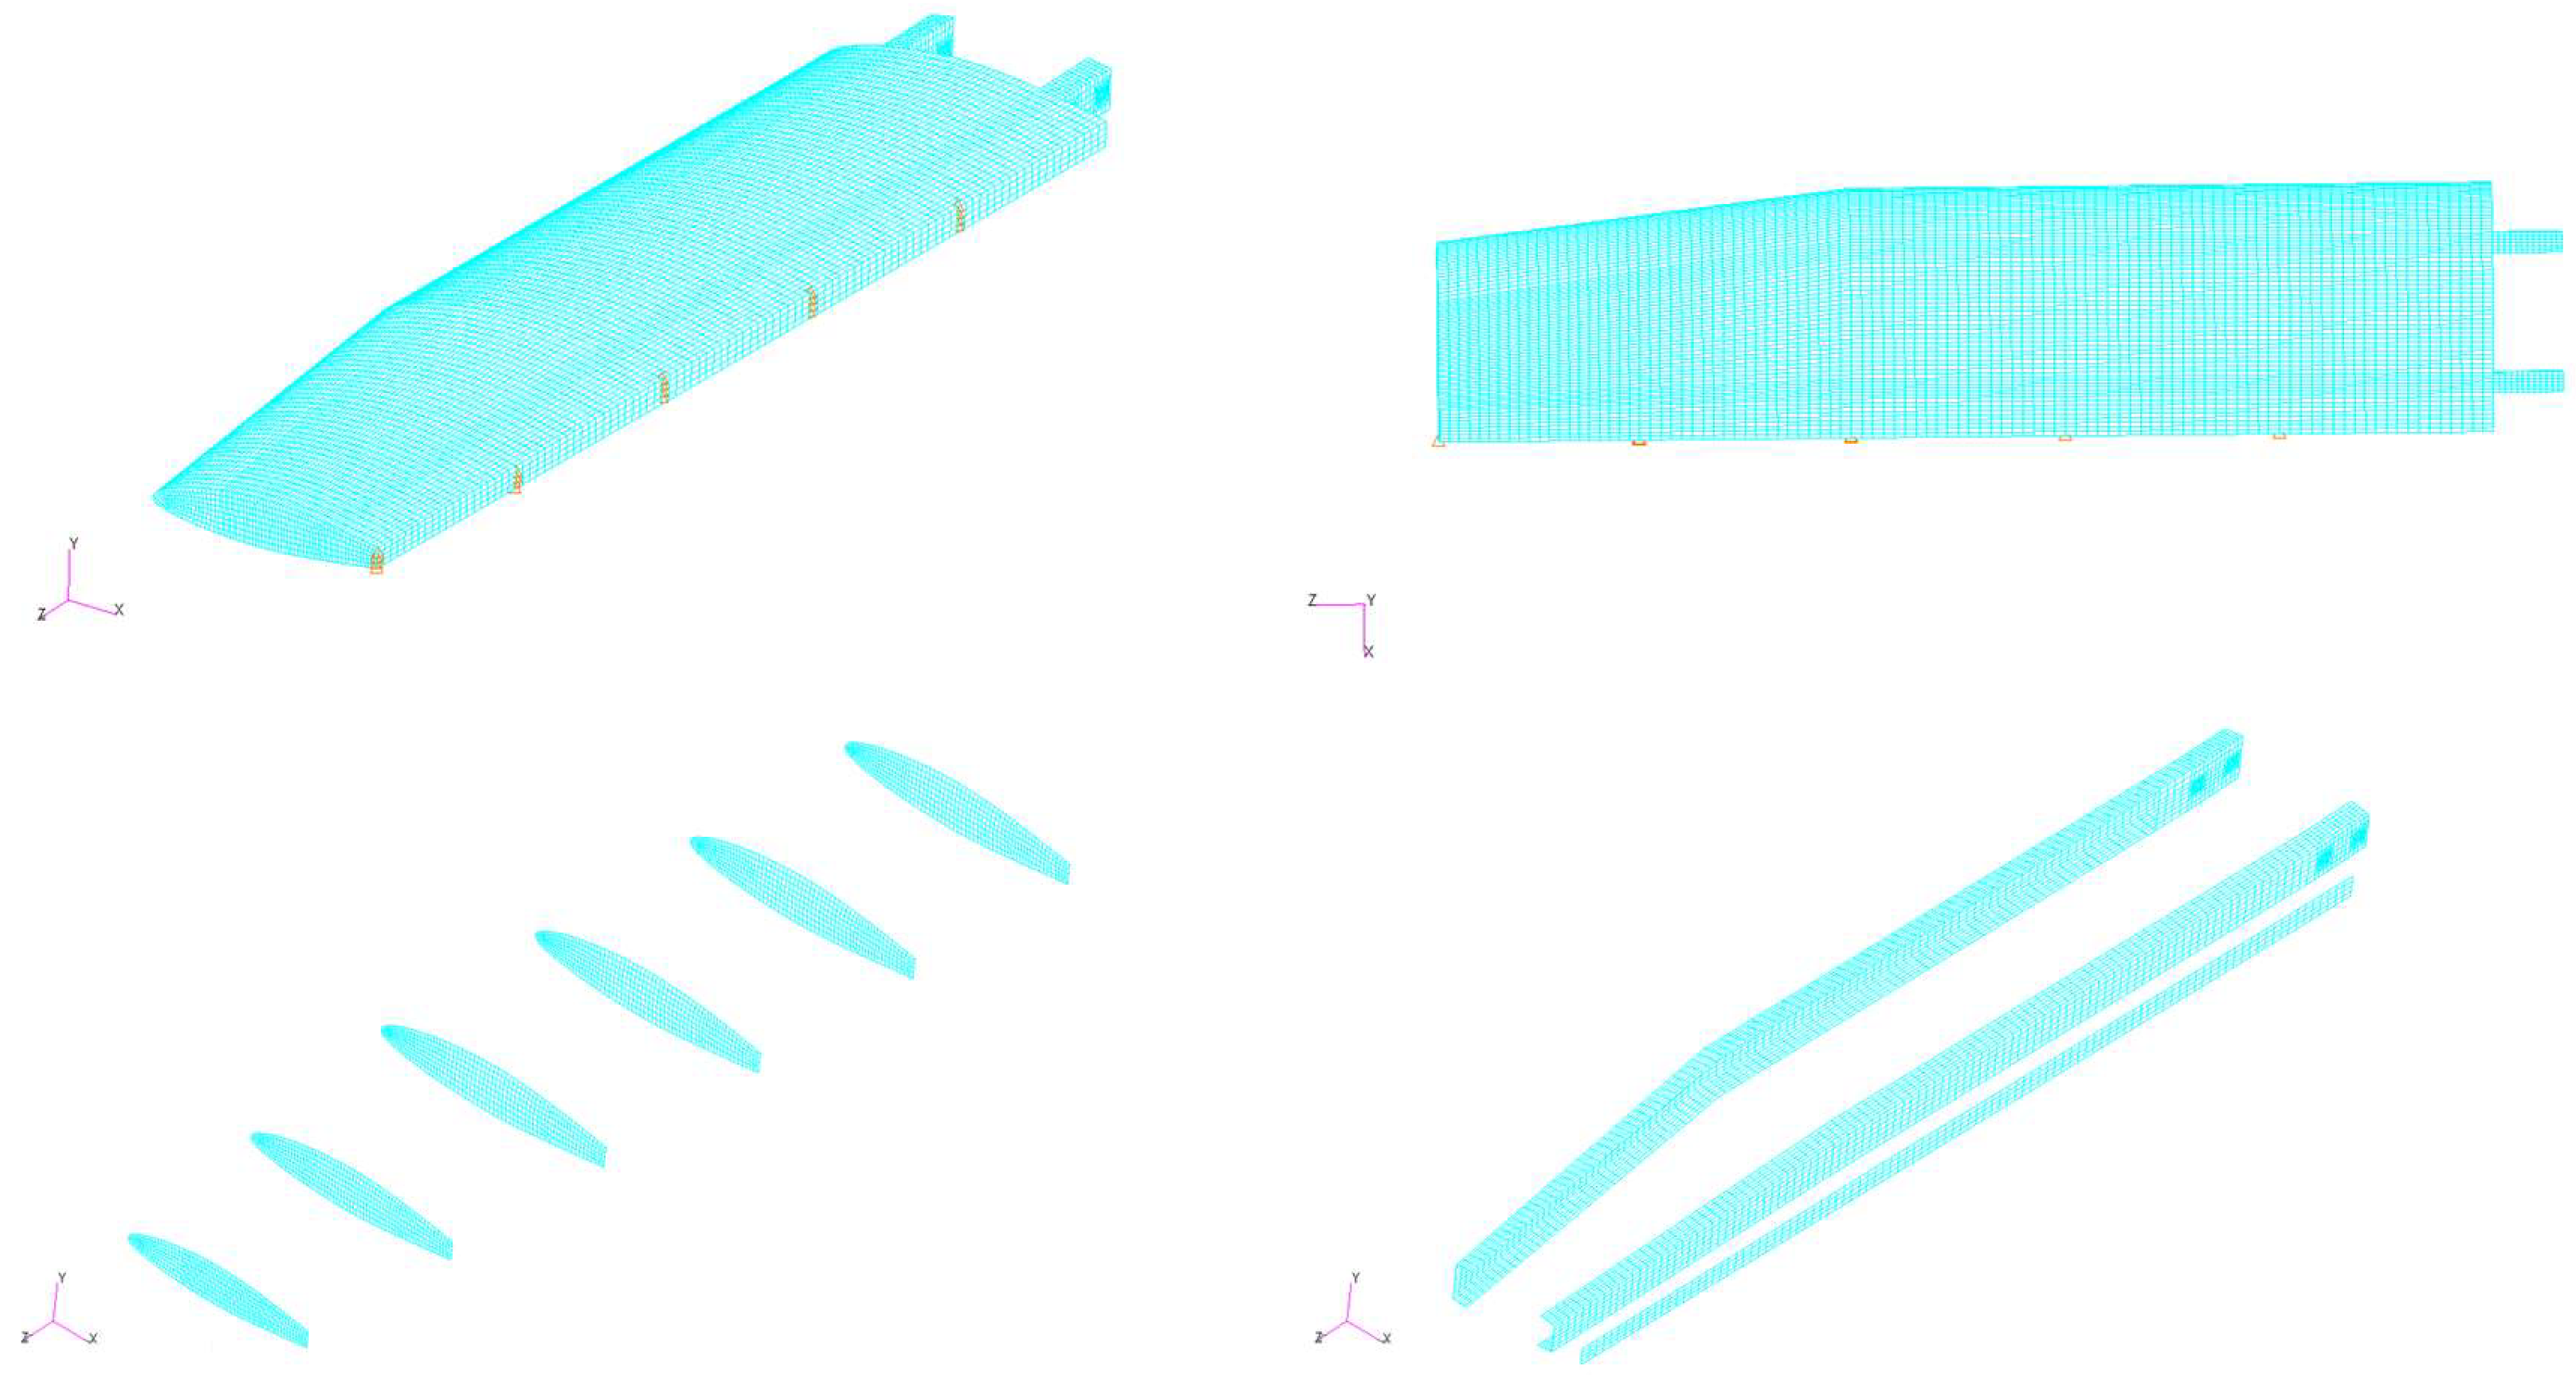
For stress load calculations, finite element modeling and stress analysis of the wing are conducted using the finite element software Nastran [
29].
Figure 4 illustrates the finite element model of the wing. Among them, the girder and ribs are made of glass fiber material, and the skin is made of glass fiber and foam sandwich material. To comply with the design requirements for air-to-air aircraft, certain ultimate load conditions must be met. Specifically, the vertical displacement at the tip of the wing should remain within 6% of the wingspan, and the stress surrounding the bolt holes at the root of the wing beam must not exceed 60% of the material’s compressive strength. Fixed constraints are applied to the bolt holes at the beam’s root. Moreover, the wing structure is represented using quadrilateral shell elements, which encompass the airfoil, wing ribs, and beam components.
To ensure calculation accuracy, grid independence is verified during the early design phase by conducting numerical simulations with 15,000, 20,000, and 23,000 mesh elements, using equivalent stress as the evaluation criterion. Under flight conditions of zero altitude, a speed of 240 km/h, and an angle of attack of 5°, the results of the grid correlation verification are summarized in
Table 1. The results show that the relative error in equivalent stresses from 15,000 to 23,000 grids is below 2%, and a grid-independent solution is considered to have been reached. Considering that 15,000 grids may contain less node information on some critical structures and 23,000 grids may contain too much unnecessary information on some non-critical structures, 20,000 grids were finally selected for subsequent numerical simulations, and the specific number of grid cells is shown in
Table 2. This includes a total of 11,200 grid cells for the skin, 3048 grid cells for the wing ribs, and 5776 grid cells for the beam, with a maximum cell size of 46 mm and a minimum cell size of 1.7 mm throughout the wing grid.
The interpolation procedure is employed to transfer the CFD aerodynamic load calculation data to the finite element nodes, facilitating the addition of loads. The resulting interpolated calculation file is then provided to Nastran for stress analysis. The solution results from typical working conditions are selected for further examination.
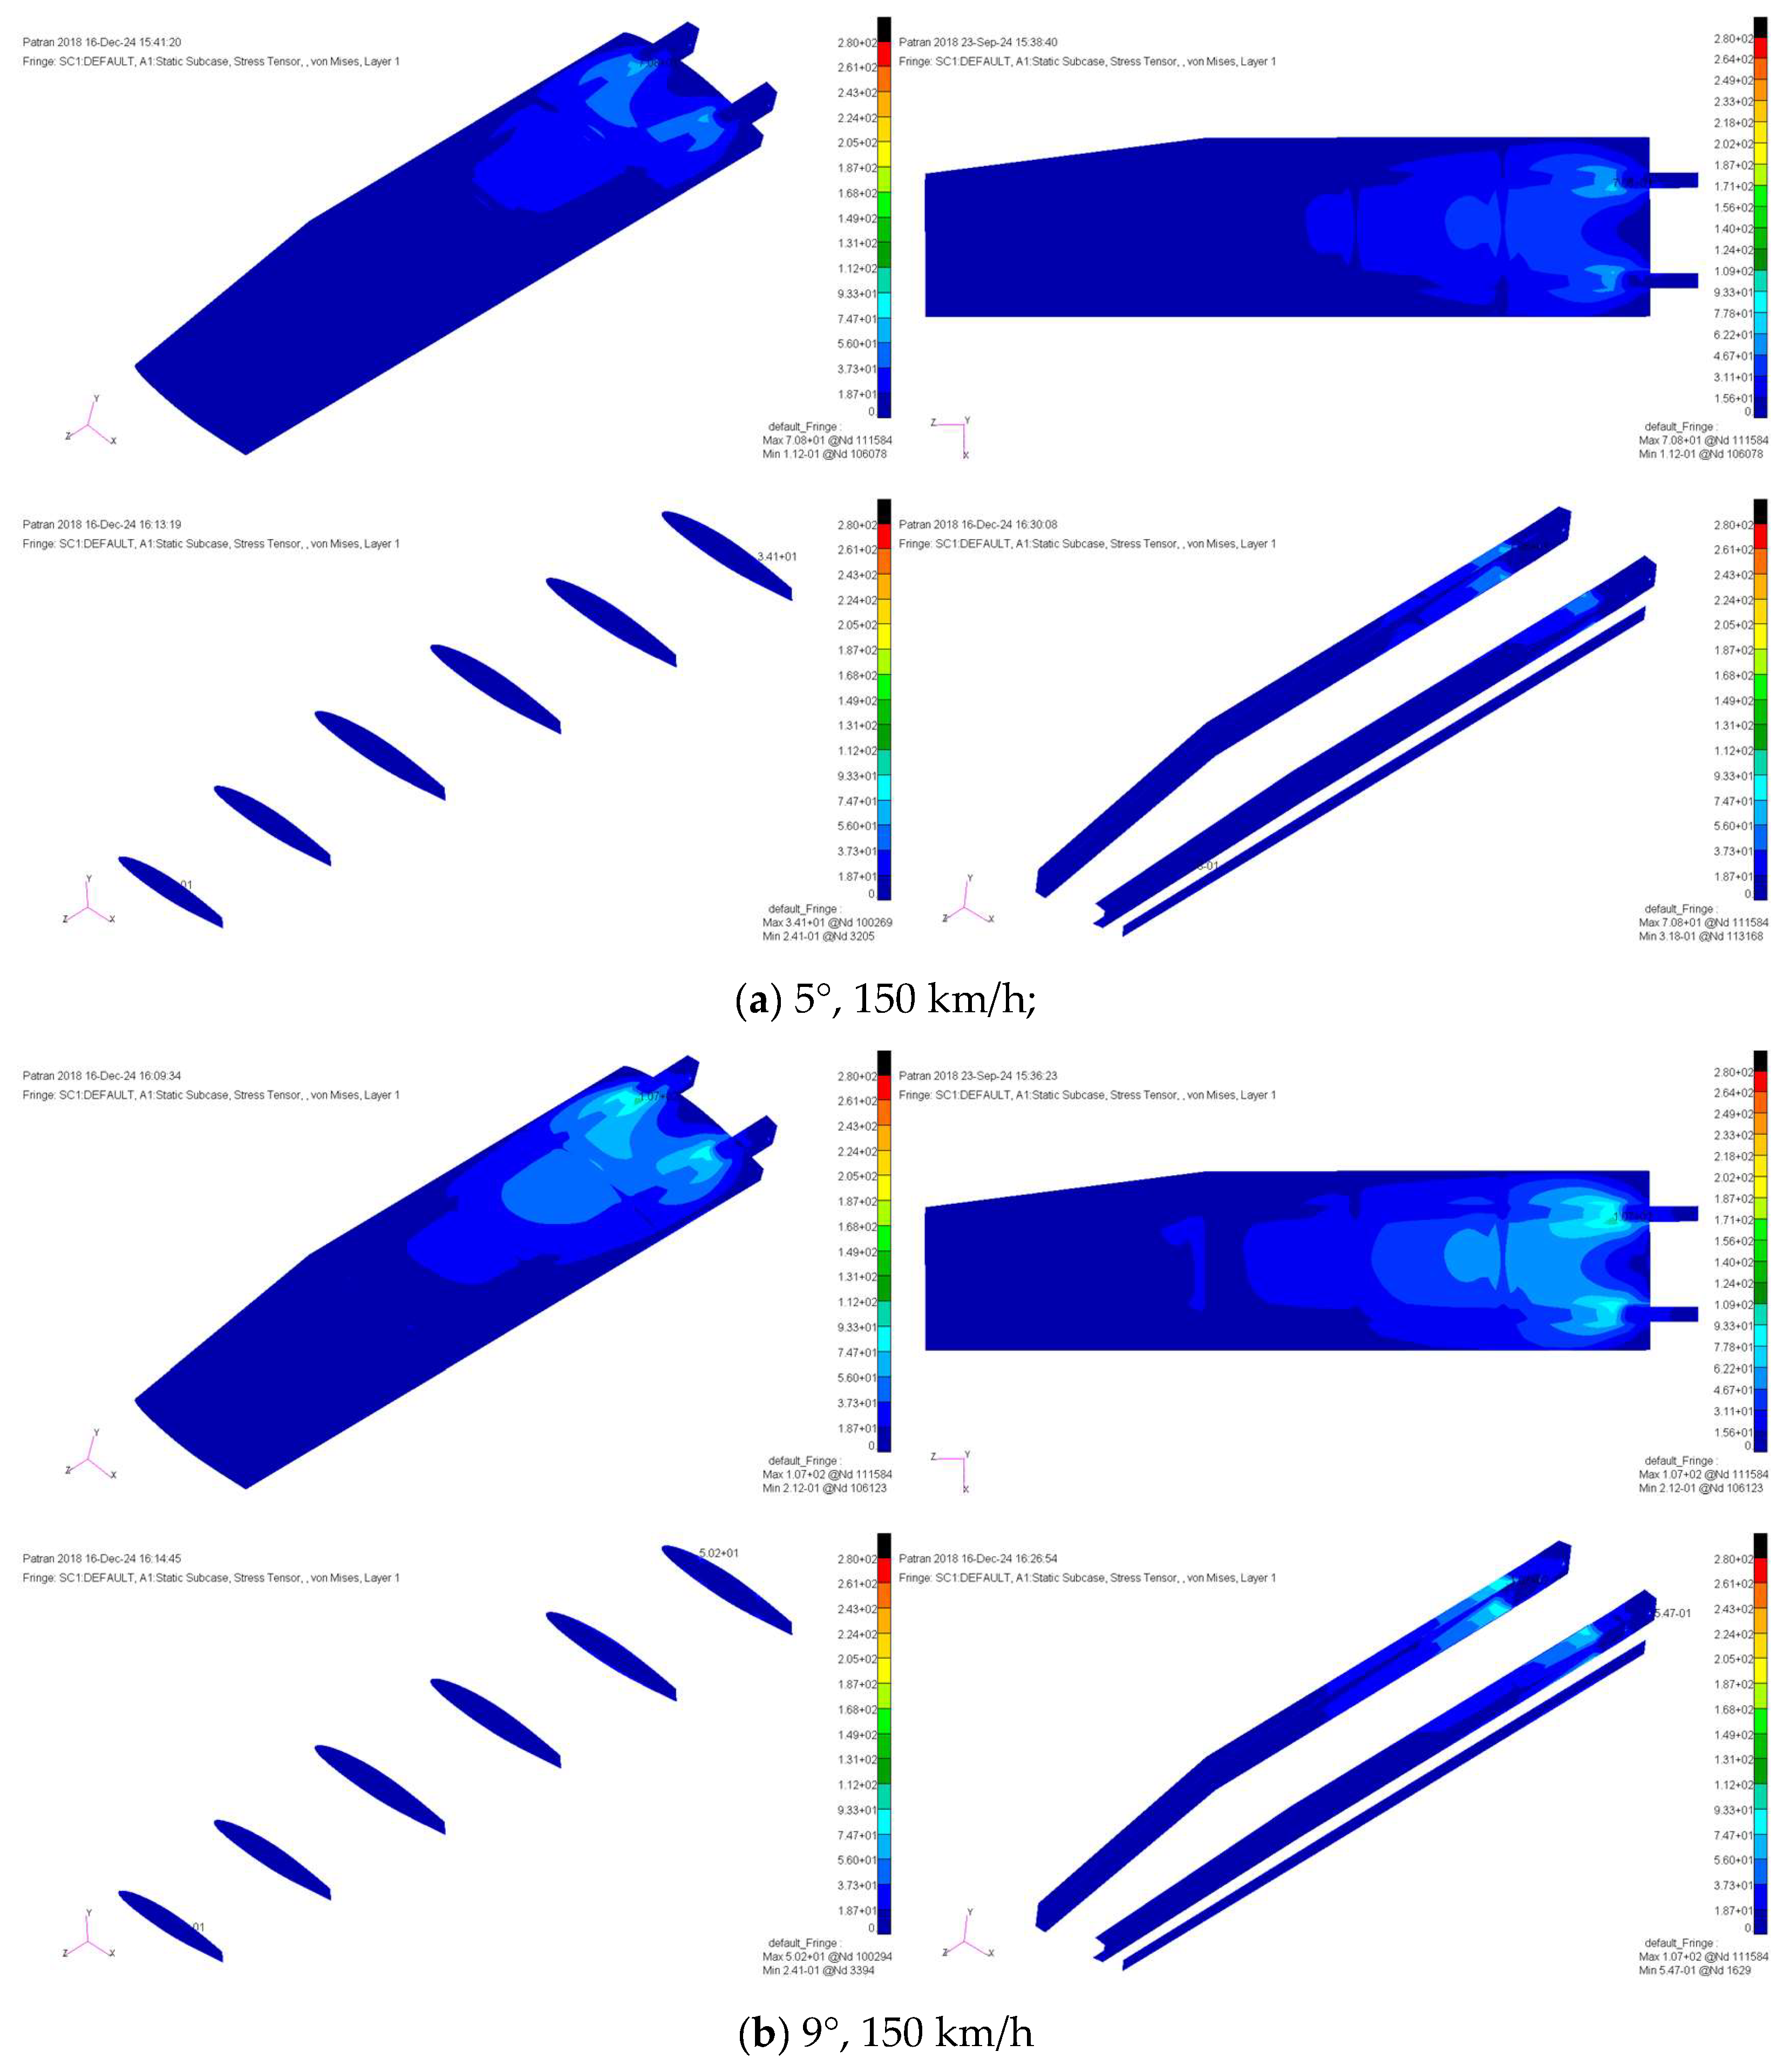
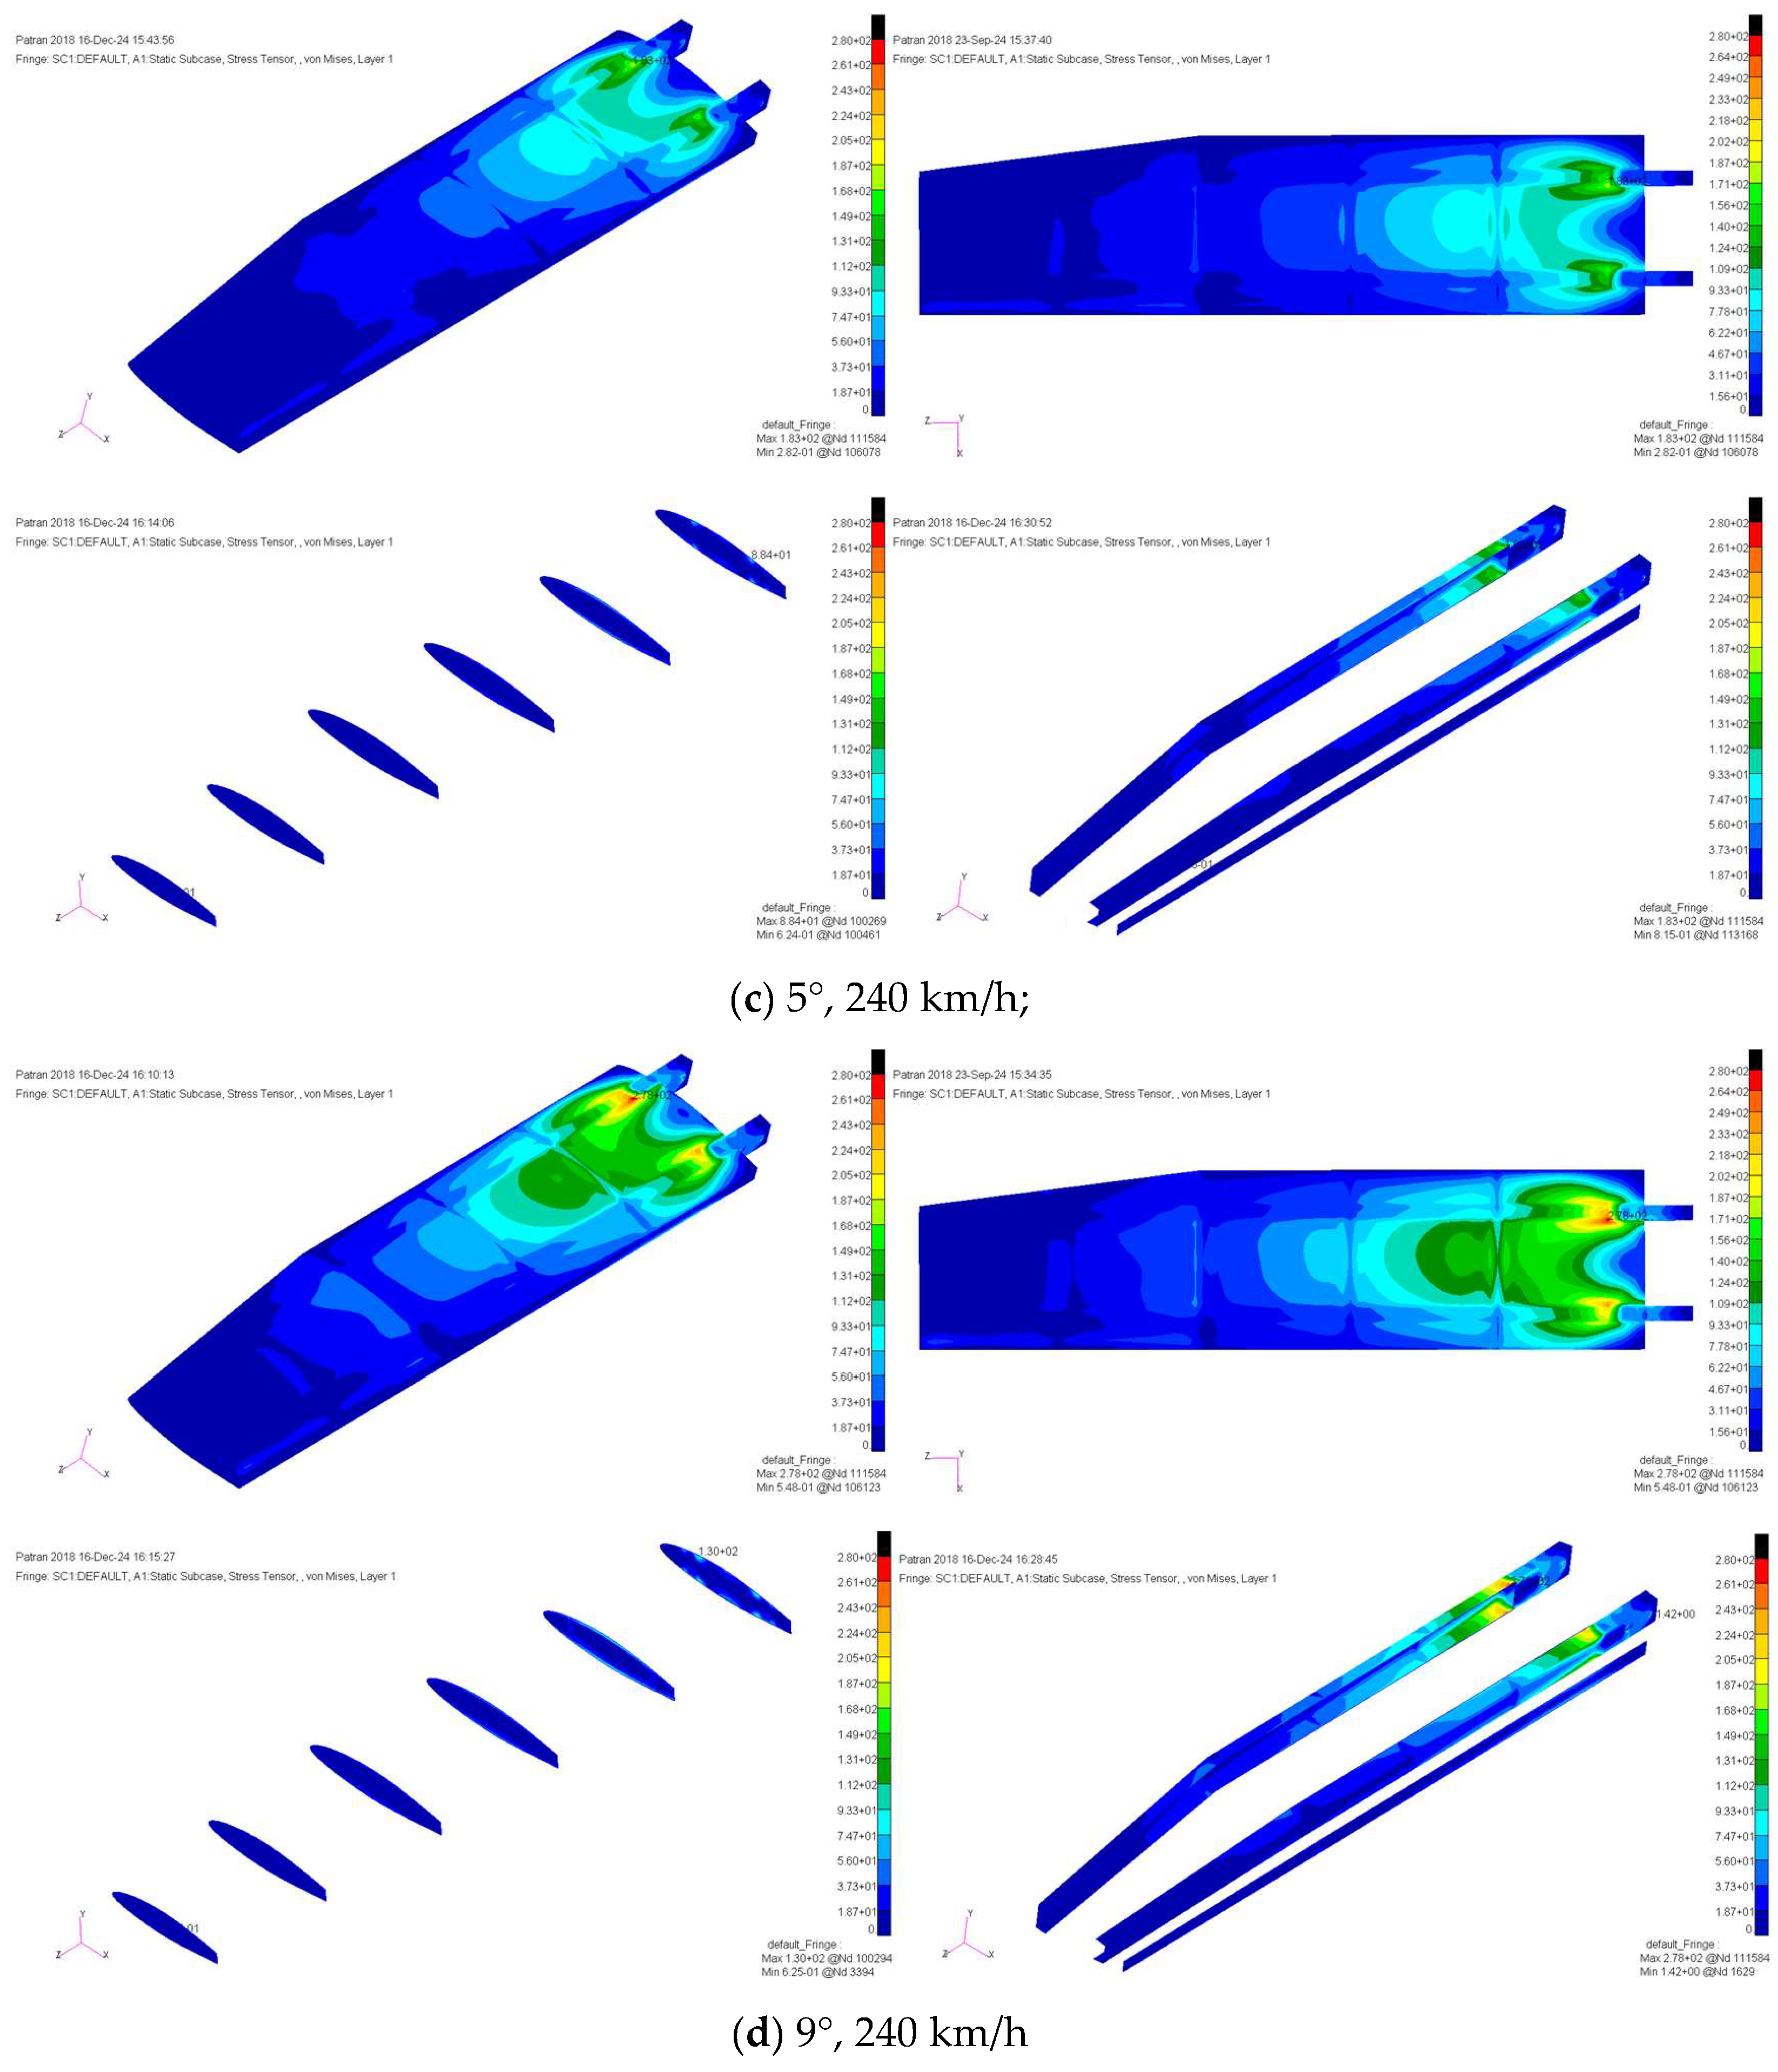
Figure 5 illustrates the equivalent stress distribution under varying angles of attack and flow rates. Notably, changes in the angle of attack and flow velocity have a significant impact on the stress distribution of the skin. Particularly at high angles of attack, the influence of flow velocity on stress becomes pronounced. As the angle of attack and flow velocity vary, equivalent stresses tend to concentrate at structural contact points, such as the skin, beam, and wing rib, with the von Mises stress values in the skin being higher near the wing root.
4. Data Processing and Dataset Creation
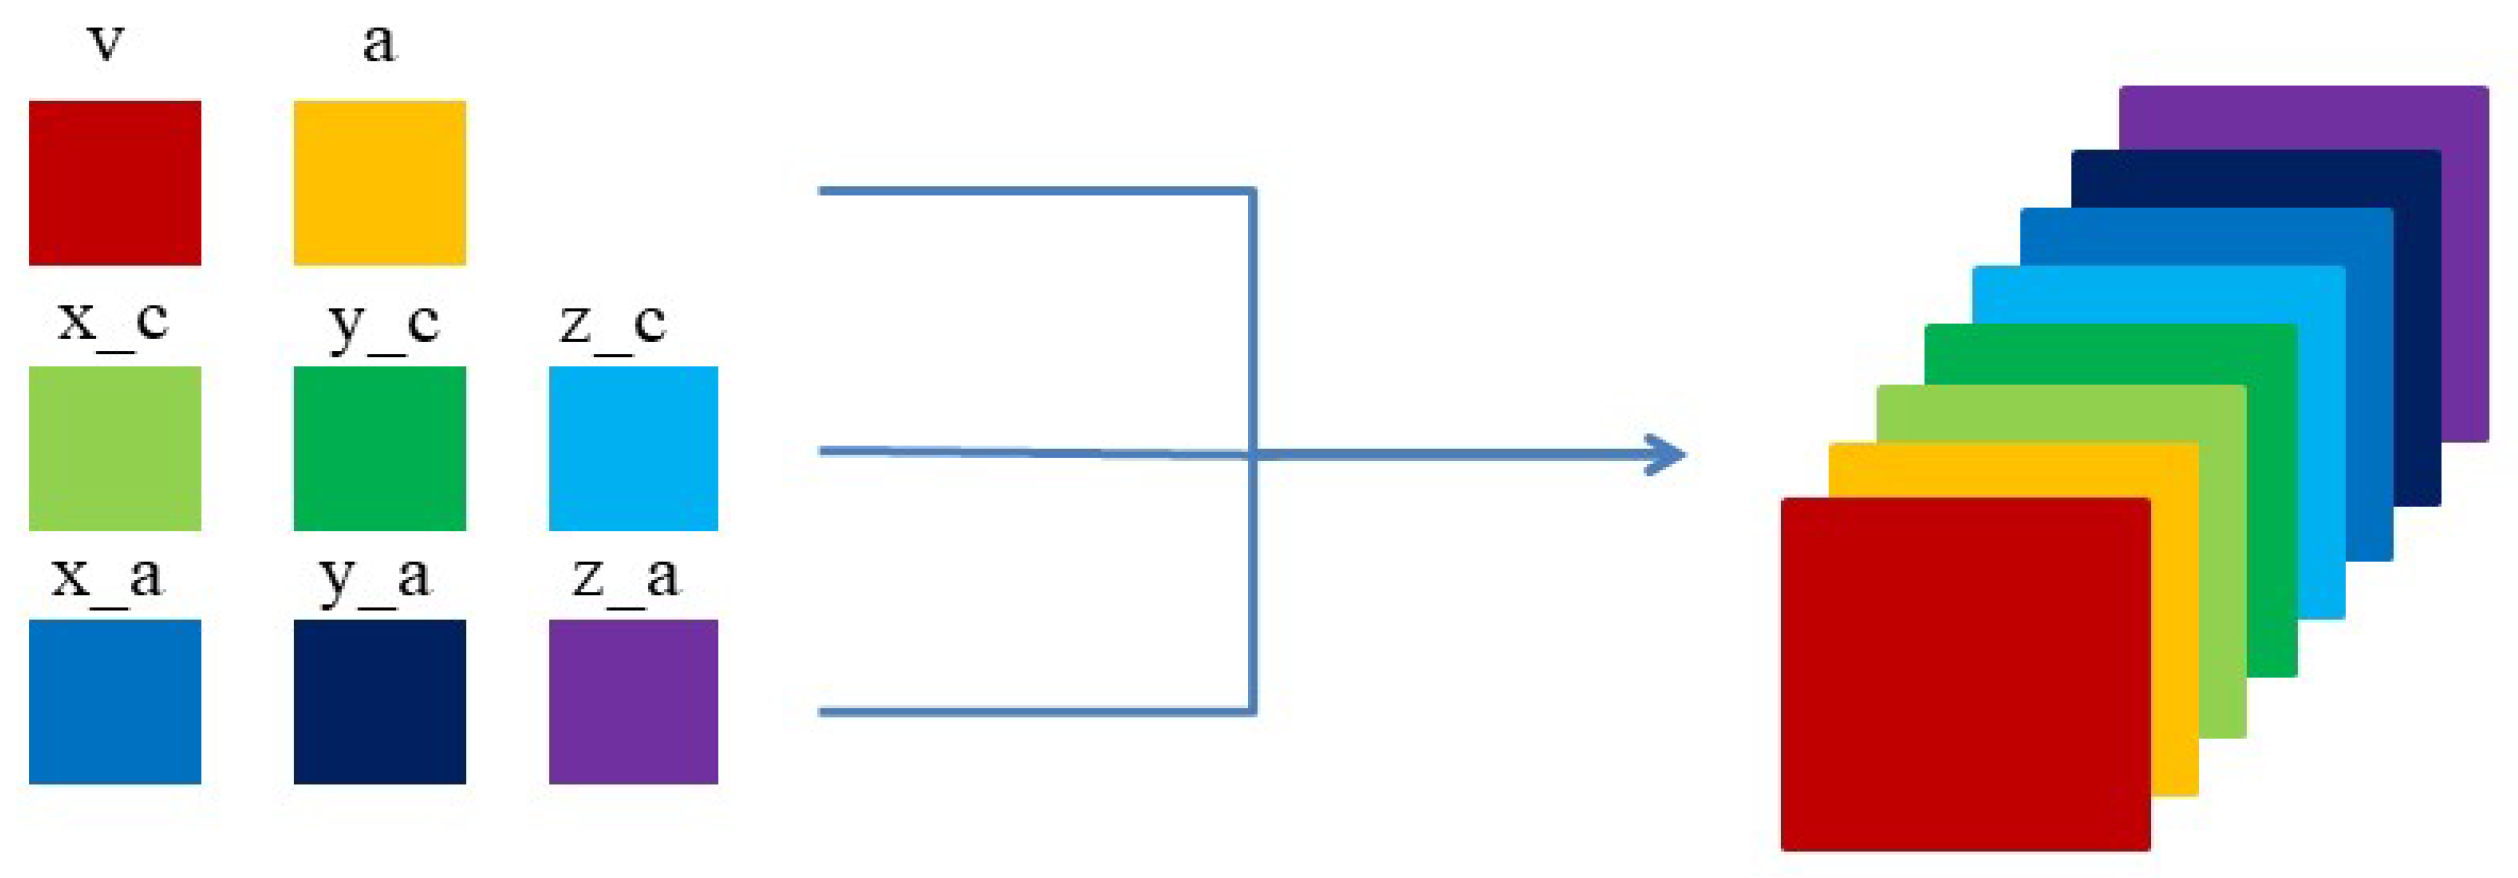
CNNs were originally employed predominantly for image recognition and processing tasks. In this study, the data required transformation into a two-dimensional format to facilitate the input as images. Specifically, we replaced the pixel value of the image with the specific value of the parameter, and then merged the processed two-dimensional data into the model as a sample. To meet the model’s input requirements, the wing skin was partitioned into upper and lower sections, with the model trained and evaluated separately on each segment.
In this paper, the simulation data under 100 flight conditions are processed, and the finite element node load spectrum, node position information, and flight parameters (including angle of attack and inflow velocity) are used as input parameters of the prediction model, while the calculated skin stress field is used as the output parameters.
Figure 6 illustrates the schematic of channel merging, and the specific parameters and their ranges are shown in
Table 3.
A dataset of 100 processed samples was created and split into training, validation, and test sets in an 8:1:1 ratio. The training set and validation set primarily includes operational data with angles of attack between 0 and 7 degrees to capture the effects of angle of attack and inflow velocity on stress magnitude and distribution. To evaluate the model’s performance under different flight conditions, data for angles of attack of 8 and 9 degrees was assigned to the test set, respectively.
5. Stress Prediction Model
5.1. MA-Unet Model
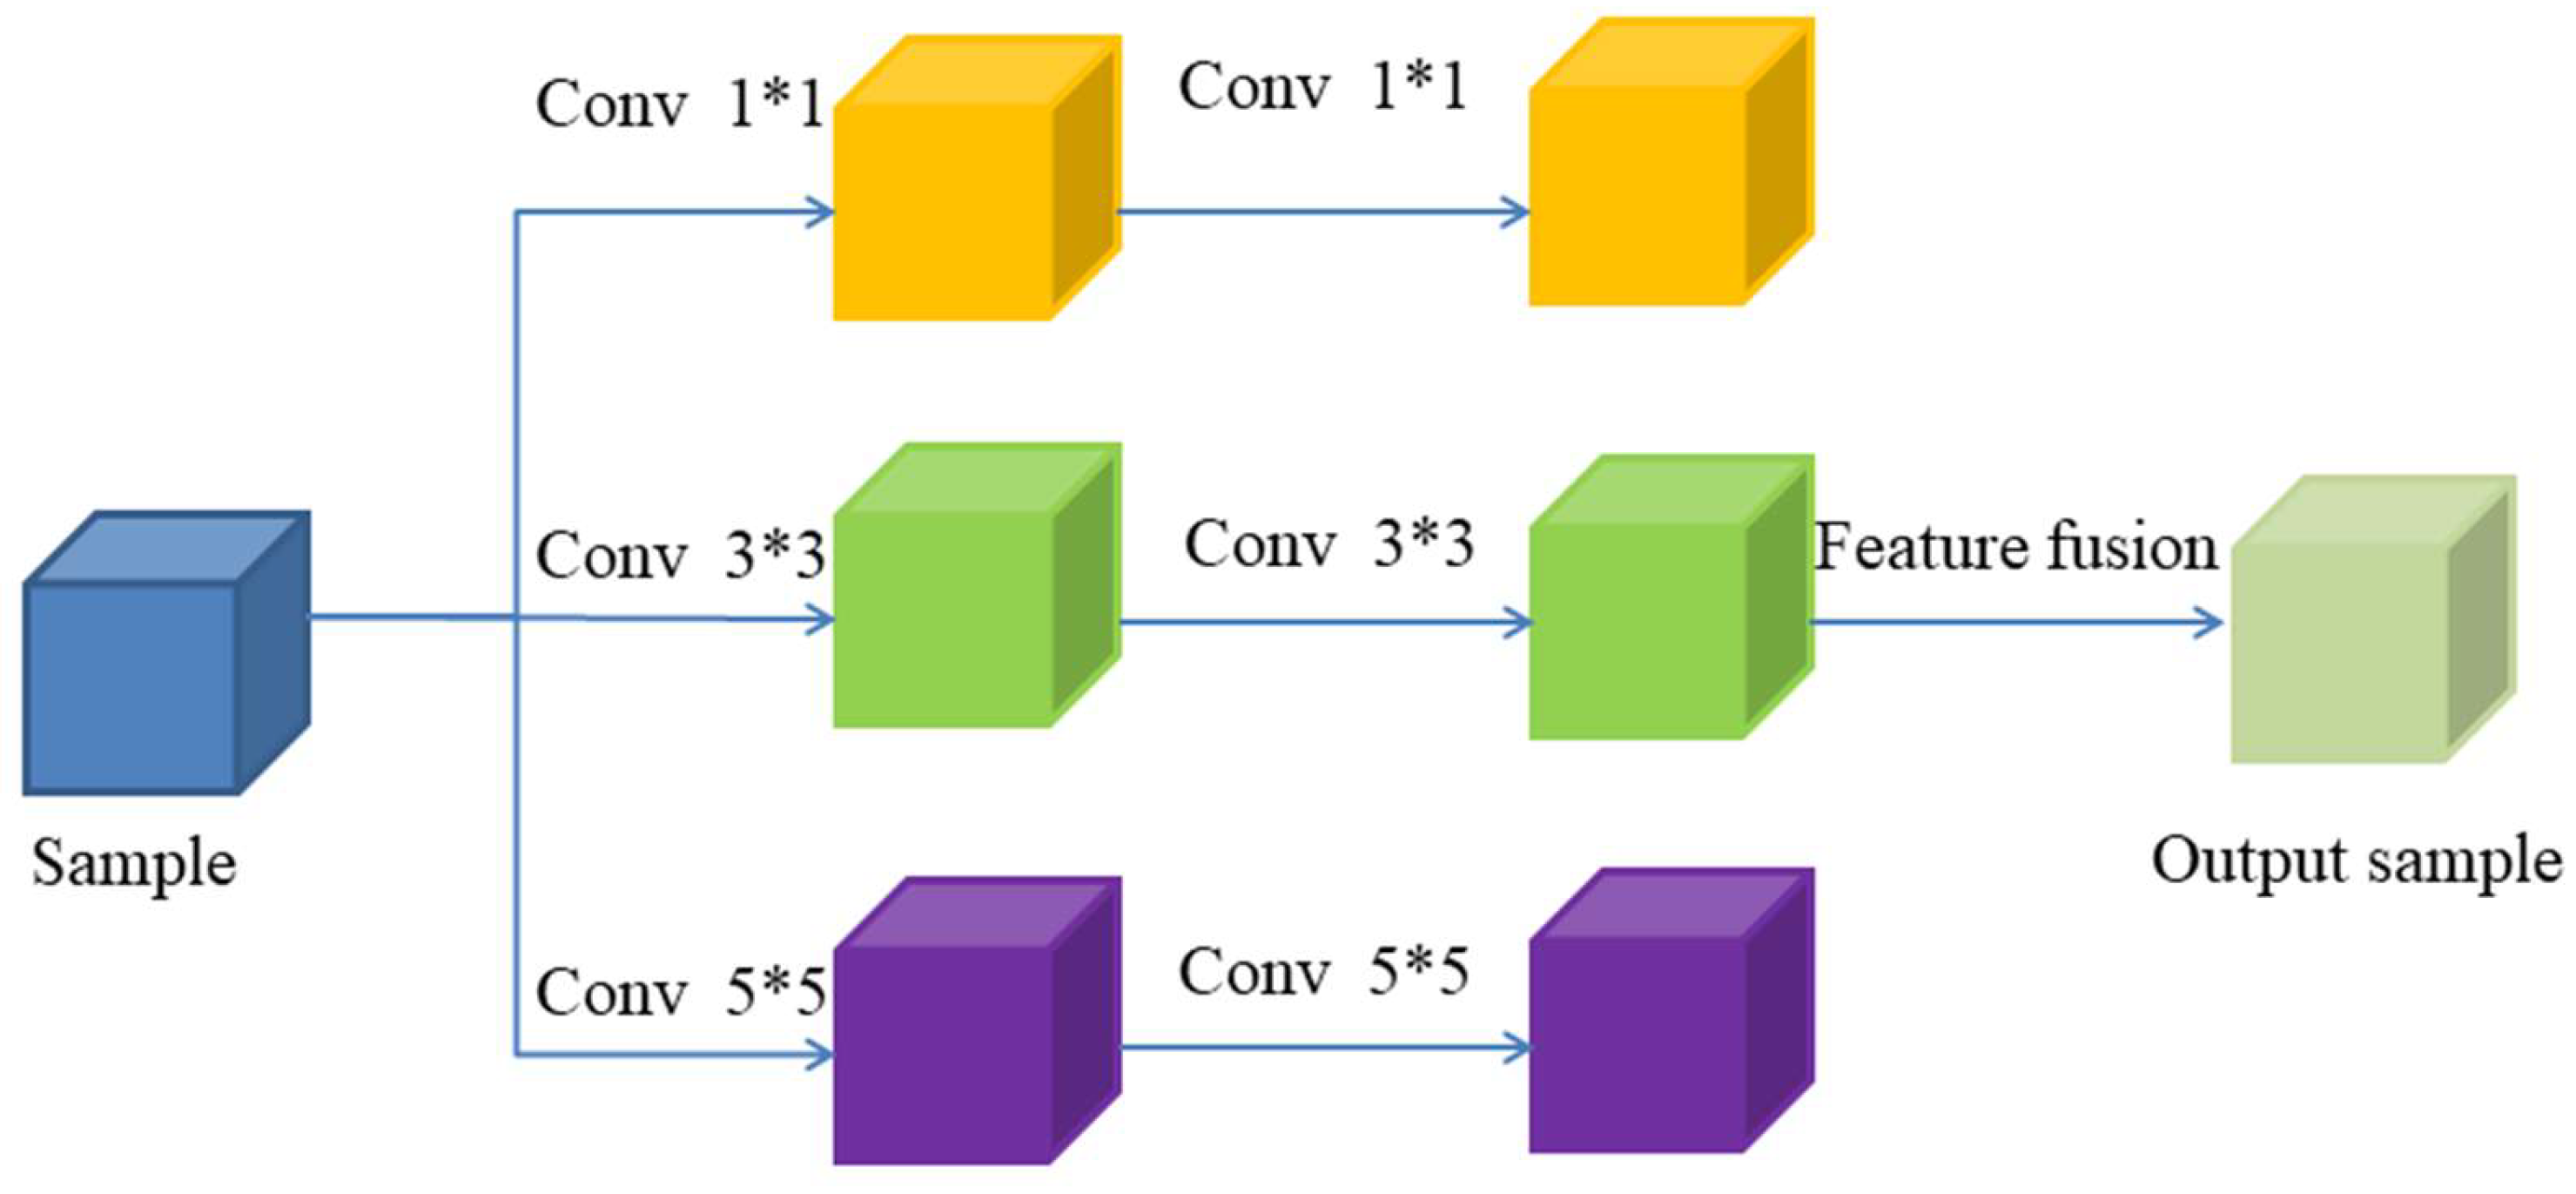
The Unet architecture was originally developed for medical image segmentation, demonstrating exceptional segmentation performance even with a limited number of samples. In recent years, it has proven effective in extracting potential features from various types of images. In this paper, a multi-scale convolutional neural network (MA-Unet) based on the Unet structure incorporating an attention mechanism is proposed, aiming to be used for stress field prediction. The introduction of the attention mechanism significantly enhances the global modelling capability of the model, which allows the model to pay more attention to the important feature regions in the image, thus suppressing the interference of irrelevant information during the feature extraction process and improving the overall accuracy and robustness. Meanwhile, this study also introduces the design of a multi-scale convolution kernel, a design concept that aims to allow the model to extract features at different spatial scales. By using a multi-scale convolution kernel, MA-Unet is able to capture the stress field variations and structural features more comprehensively. Specifically, the multiscale convolution kernel can process the input image through filters of different sizes, capturing multilevel features ranging from local details to global patterns. The structure of the multiscale convolutional layer is shown in
Figure 7. The network’s structure is detailed in
Table 4, and it can be categorized into three components: the encoder, base layer, and decoder.
In the encoder component, the model employs three distinct convolutional kernel sizes (1 × 1, 2 × 2, and 3 × 3) to extract multi-scale features from the input image. Each convolutional kernel size undergoes two convolution operations, and the resultant feature extraction outputs from the different kernel sizes are subsequently merged. To enhance the model’s focus on critical regions, a self-attention layer is incorporated following the first and last hidden layers. Downsampling is then executed via a max pooling layer to reduce the feature map’s dimensions while preserving essential spatial information. The encoder comprises three layers, containing 32, 64, and 128 convolutional kernels, respectively.
The lower section serves as an extension of the encoder, comprising 256 convolutional kernels and utilizing three convolutional kernel sizes for feature fusion. The decoder component employs transposed convolutional layers for upsampling, thereby restoring the spatial resolution of the image. The upsampled feature maps are then concatenated with the corresponding feature maps from the encoder, enabling the retention of more detailed information. The decoder is also organized into three layers, containing 32, 64, and 128 convolutional kernels, respectively. Ultimately, the output layer utilizes 1 × 1 convolutional kernels to produce a single-channel output, representing the stress field predicted by the model.
To thoroughly evaluate the performance of the proposed model, this paper conducts a comparative analysis with the Unet model and a commonly used Convolutional Neural Network (CNN) model. The structures of the relevant models are detailed in
Table 5 and
Table 6. This comparison aims to provide an in-depth analysis of the performance differences among the various models in predicting stress and strain fields, thereby validating the effectiveness and advantages of the proposed model.
5.2. Activation Function
In this study, both the linear function and the Rectified Linear Unit (ReLU) function are employed as activation functions within the network to augment its nonlinear representational capacity. The graphical representation of these functions is illustrated in
Figure 8.
The gradient of the linear function remains constant across the entire input range, which facilitates gradient updating during backpropagation. Conversely, the ReLU function promotes convergence in the training of deep neural networks and mitigates the issue of vanishing gradients.
5.3. Loss Function and Evaluation Index
In this research, the Mean Squared Error (MSE) is employed as the model’s loss function, while the performance and explanatory power of the model are evaluated using three metrics: Mean Absolute Error (MAE), Mean Absolute Percentage Error (MAPE), and the Coefficient of Determination (R
2), with their definitions provided below:
where
represents the predicted value from the model,
denotes the computed value from the FEM,
is the total number of samples, and
denotes the average of the FEM-calculated values.
5.4. Multi-Scale Volume-Based Feature Fusion Approach
Following the multi-scale volume and operations, the extracted feature information from each layer requires fusion. Commonly utilized feature fusion methods include addition, concatenation, and weighted fusion. Addition fusion directly combines information from each convolutional layer by summing the feature maps of different scales, which preserves information strength and suppresses noise, making it suitable for scenarios with high feature similarity and reducing the parameter count. Concatenation fusion connects feature maps of varying scales along the channel axis, thereby retaining rich information; this method is particularly beneficial when input data are diverse and complex, as it enhances model performance and expands the feature space to capture more detailed attributes. Weighted fusion dynamically adjusts the importance of features by assigning different weights to each feature map, thereby enhancing the model’s sensitivity to specific features and improving performance in complex scenarios.
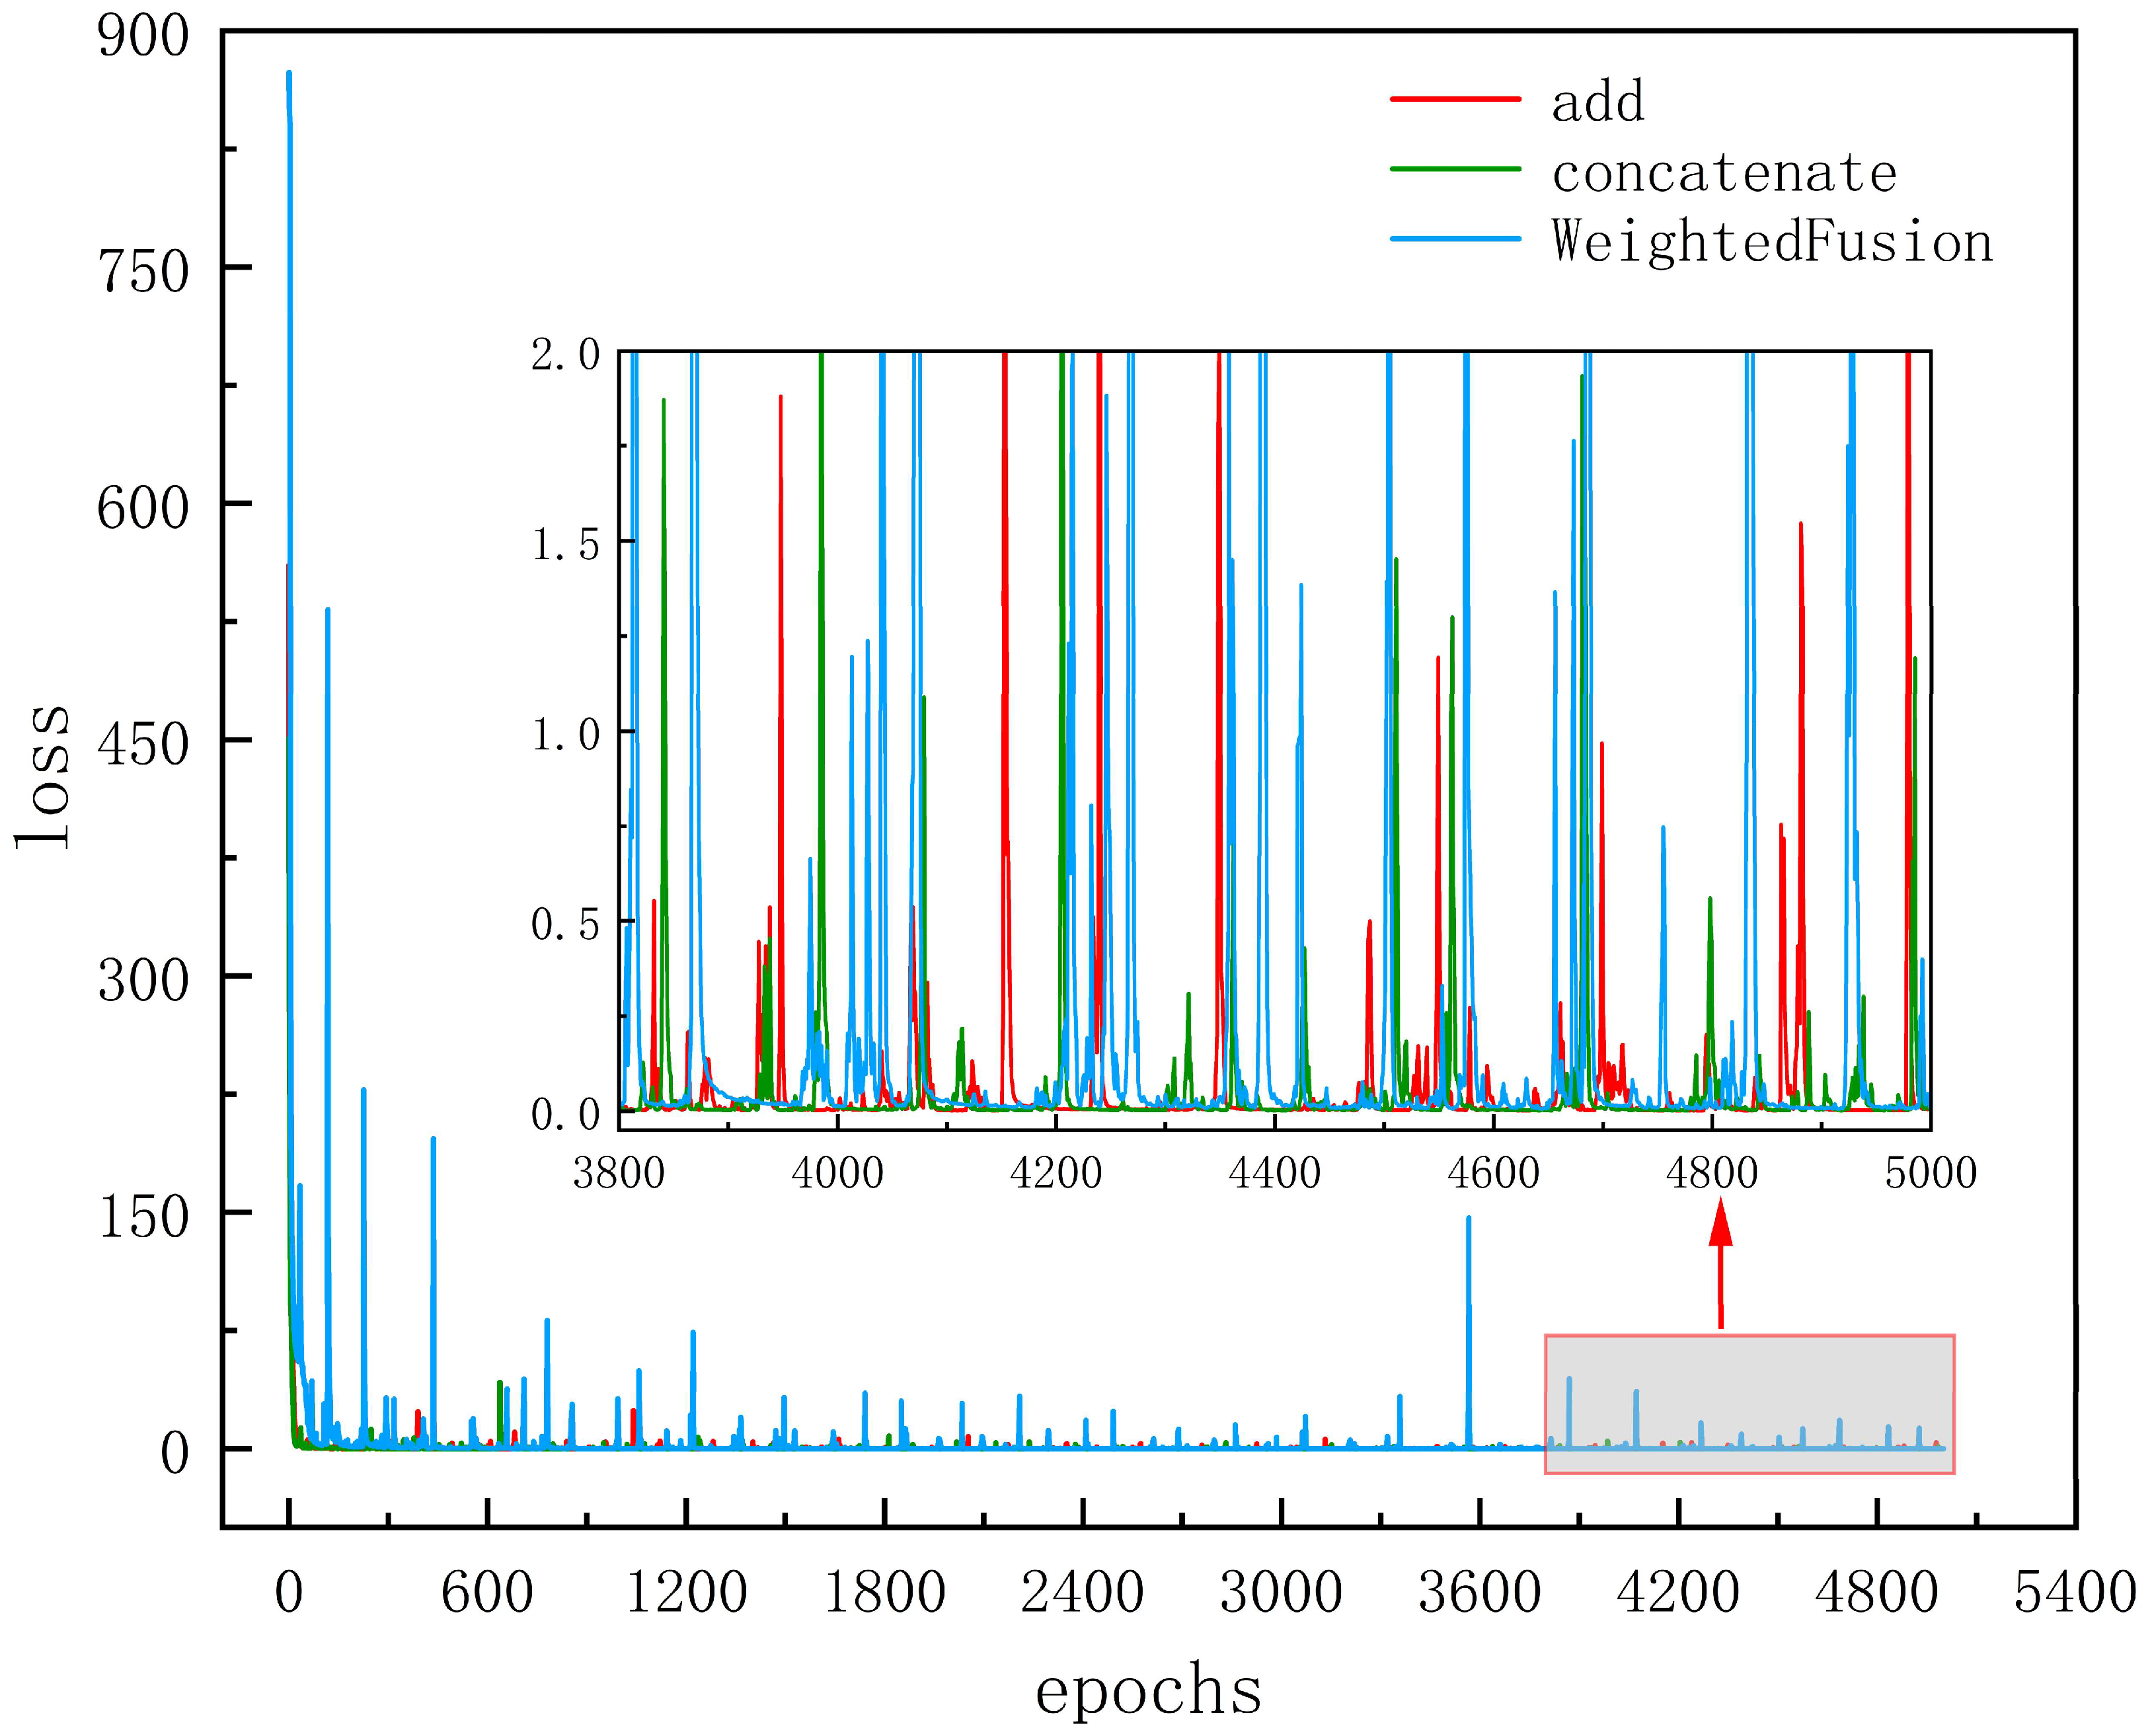
To evaluate the impact of these three feature fusion methods on model performance, each method was trained separately with the number of training iterations fixed at 5000 steps. The ReLU activation function was employed in the multiscale and convolutional layers, while the output layer utilized a linear activation function, with a learning rate set at 0.001. By comparing the performance of these fusion methods in feature extraction and model training, the objective was to identify the most appropriate fusion method for this model.
Table 7 presents the evaluation metric scores for the models on the validation and test sets following training with the three feature fusion methods. The results indicate that both Add fusion and Concatenate fusion exhibit similar performance on the validation set, significantly surpassing Weighted fusion. Notably, Add fusion achieves the lowest MSE and MAE on the test set, demonstrating superior generalization ability on unseen data. In contrast, Concatenate fusion slightly underperforms compared to Add fusion on the test set, while Weighted fusion fails to match the performance of Add and Concatenate fusion across all metrics, particularly exhibiting poor results in MAE and MAPE.
Figure 9 depicts the loss degradation of the three models on the training set. It is evident that Weighted fusion experiences a higher loss in the initial stages, exhibiting greater fluctuations during the training process. In contrast, Additive fusion and Concatenate fusion demonstrate relatively smooth loss fluctuations. Overall, both Additive fusion and Concatenate fusion are more suitable for this task; however, Concatenate fusion generates larger feature maps during the fusion process, resulting in increased computation time. Given that Additive fusion performs slightly better than Concatenate fusion on the test set, it is ultimately selected as the method for fusing the multi-scale information within the model.
Through the comparison of the performance of these fusion methods in feature extraction and model training, along with an evaluation of their impact on overall model performance, this paper identifies the optimal fusion strategy suitable for the proposed model.
6. Analysis of Results
6.1. Analysis of Overall Regional Stress Prediction Results
In this study, the MA-Unet model was developed within a Conda environment using TensorFlow version 2.0. A ReLU activation function was integrated into the Volume Layer to improve the network’s ability to represent nonlinearity, enabling it to effectively capture complex feature relationships. In the output layer, a Linear activation function was used to ensure the model generates continuous stress values, leading to accurate predictions. To enhance the training process, the Adam optimizer was chosen for its excellent convergence properties. This choice significantly enhances the computational efficiency and convergence speed of the network, expediting the process of identifying the optimal solution. The specific parameters were configured as follows: a learning rate of 0.001, a dataset batch size of 6, and a total of 5000 training iterations. To prevent overfitting, a callback function is added during training to ensure that the best model is preserved for stress prediction.
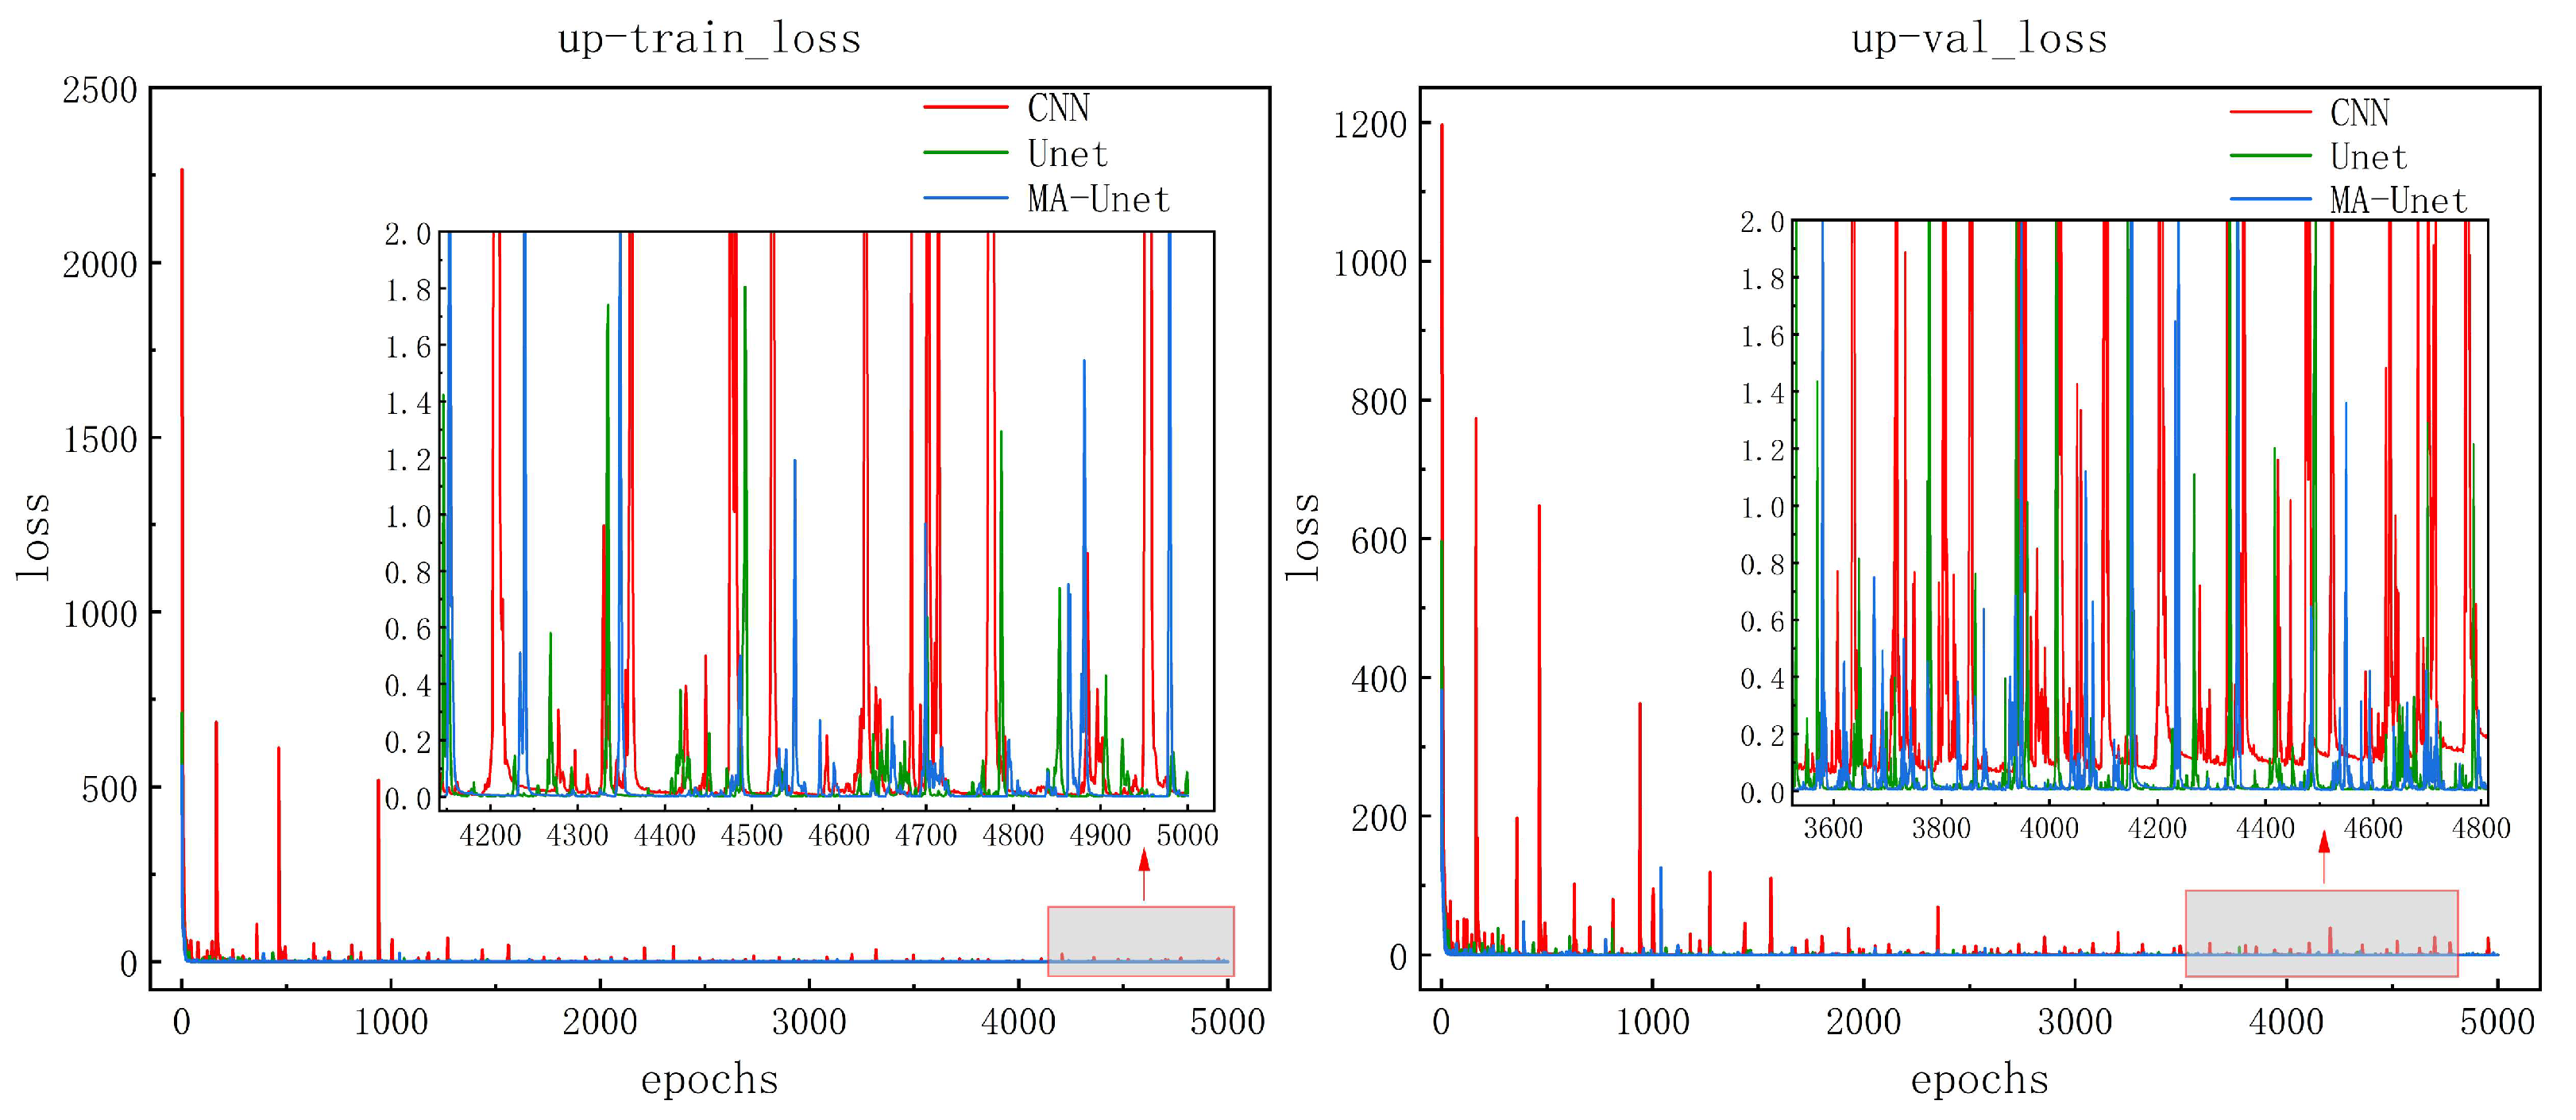
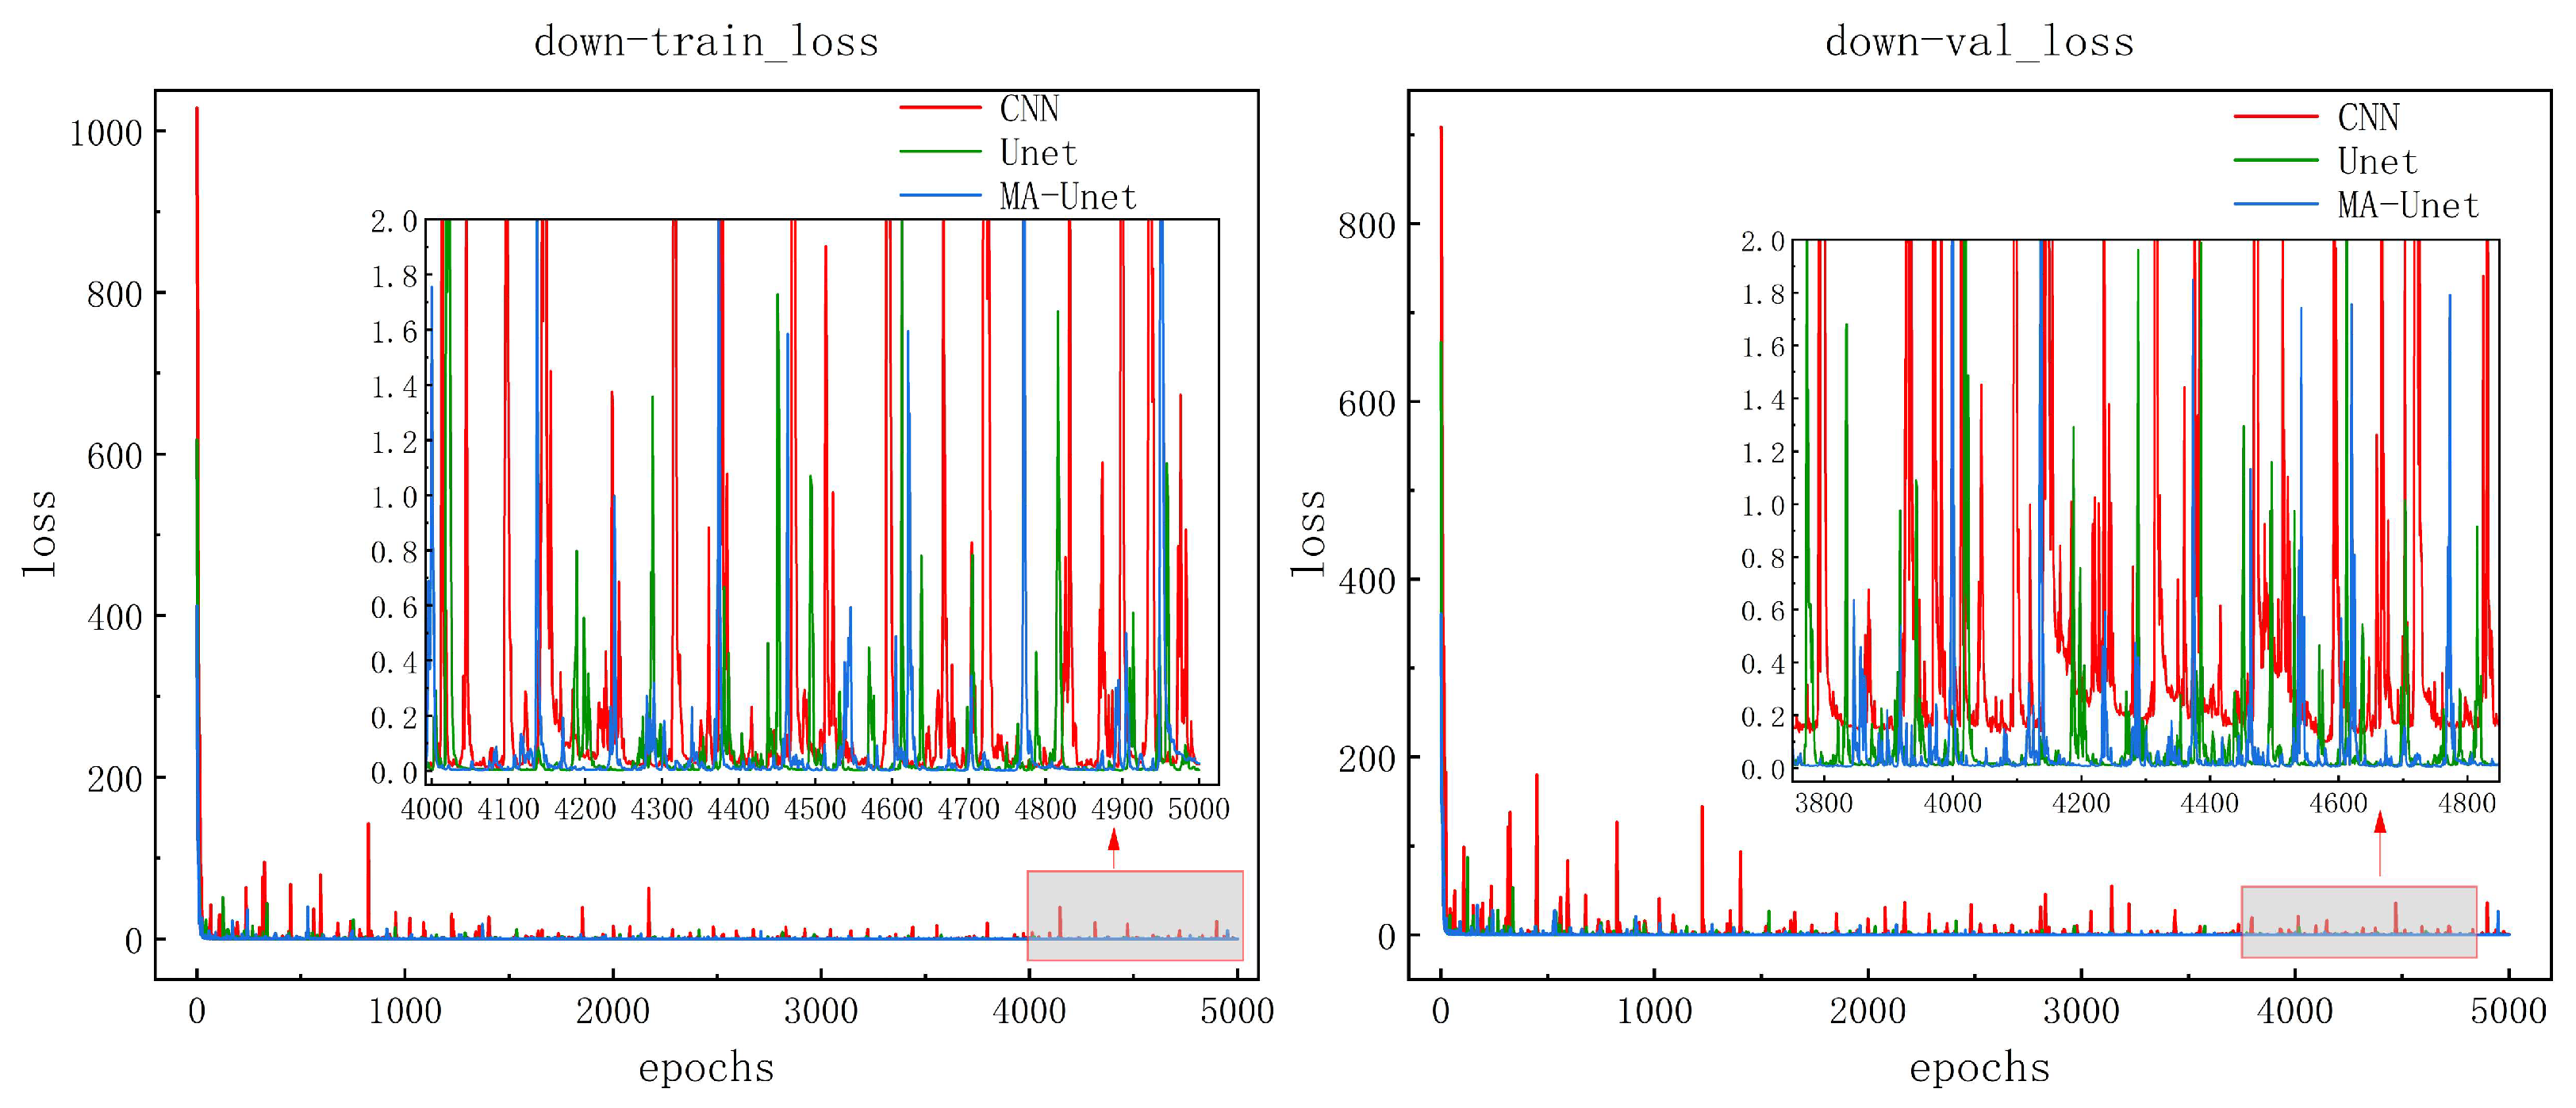
Figure 10 shows the learning curves of the three models on the training and validation sets. The loss values drop sharply at the beginning of training and level off after the number of iterations is 1000 steps, which indicates that the models are able to effectively capture and adapt to the main features in the data. The model is considered to have converged after 4000 iterations when the loss value stays low and does not fluctuate between large orders of magnitude. During the overall training process, the CNN model has a higher number of loss values and a larger range of fluctuations, while the Unet and MA-Unet models have fewer fluctuations and a smaller range of fluctuations, which suggests that these two models are more stable and able to learn more efficiently when dealing with the training data. Meanwhile, the loss values of these two models are lower than those of the CNN model, which further validates their effectiveness in the current task.
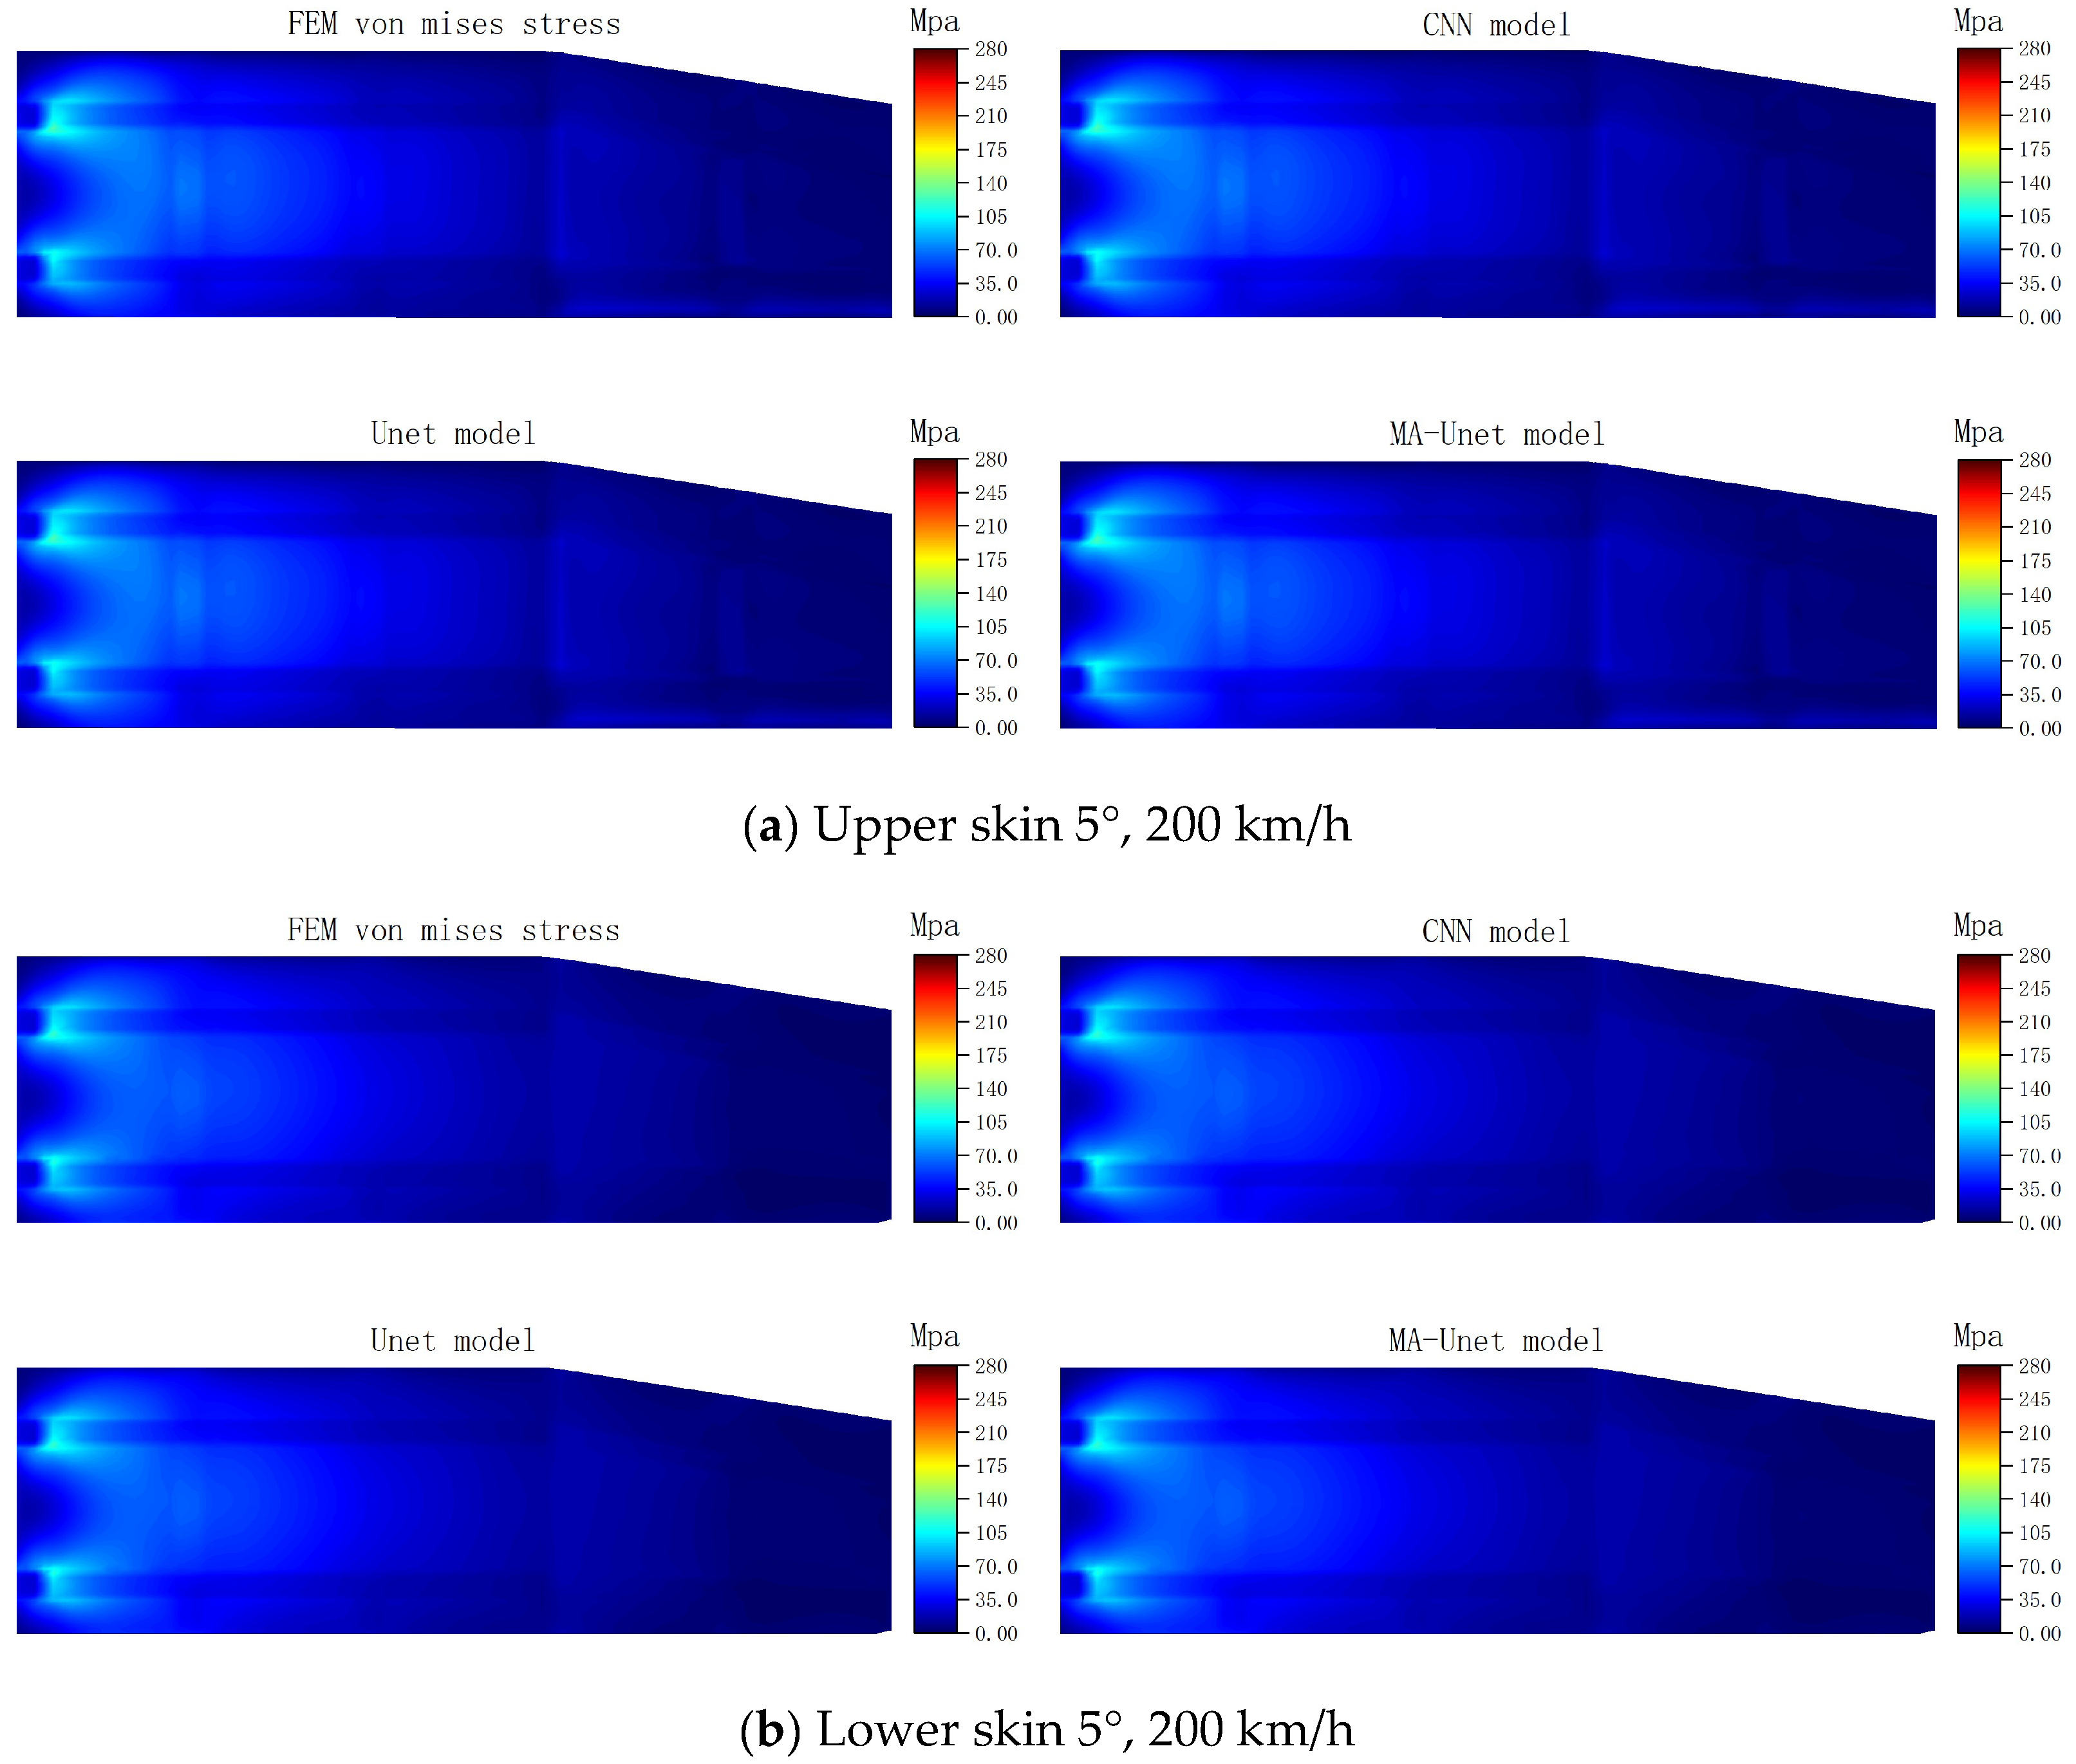
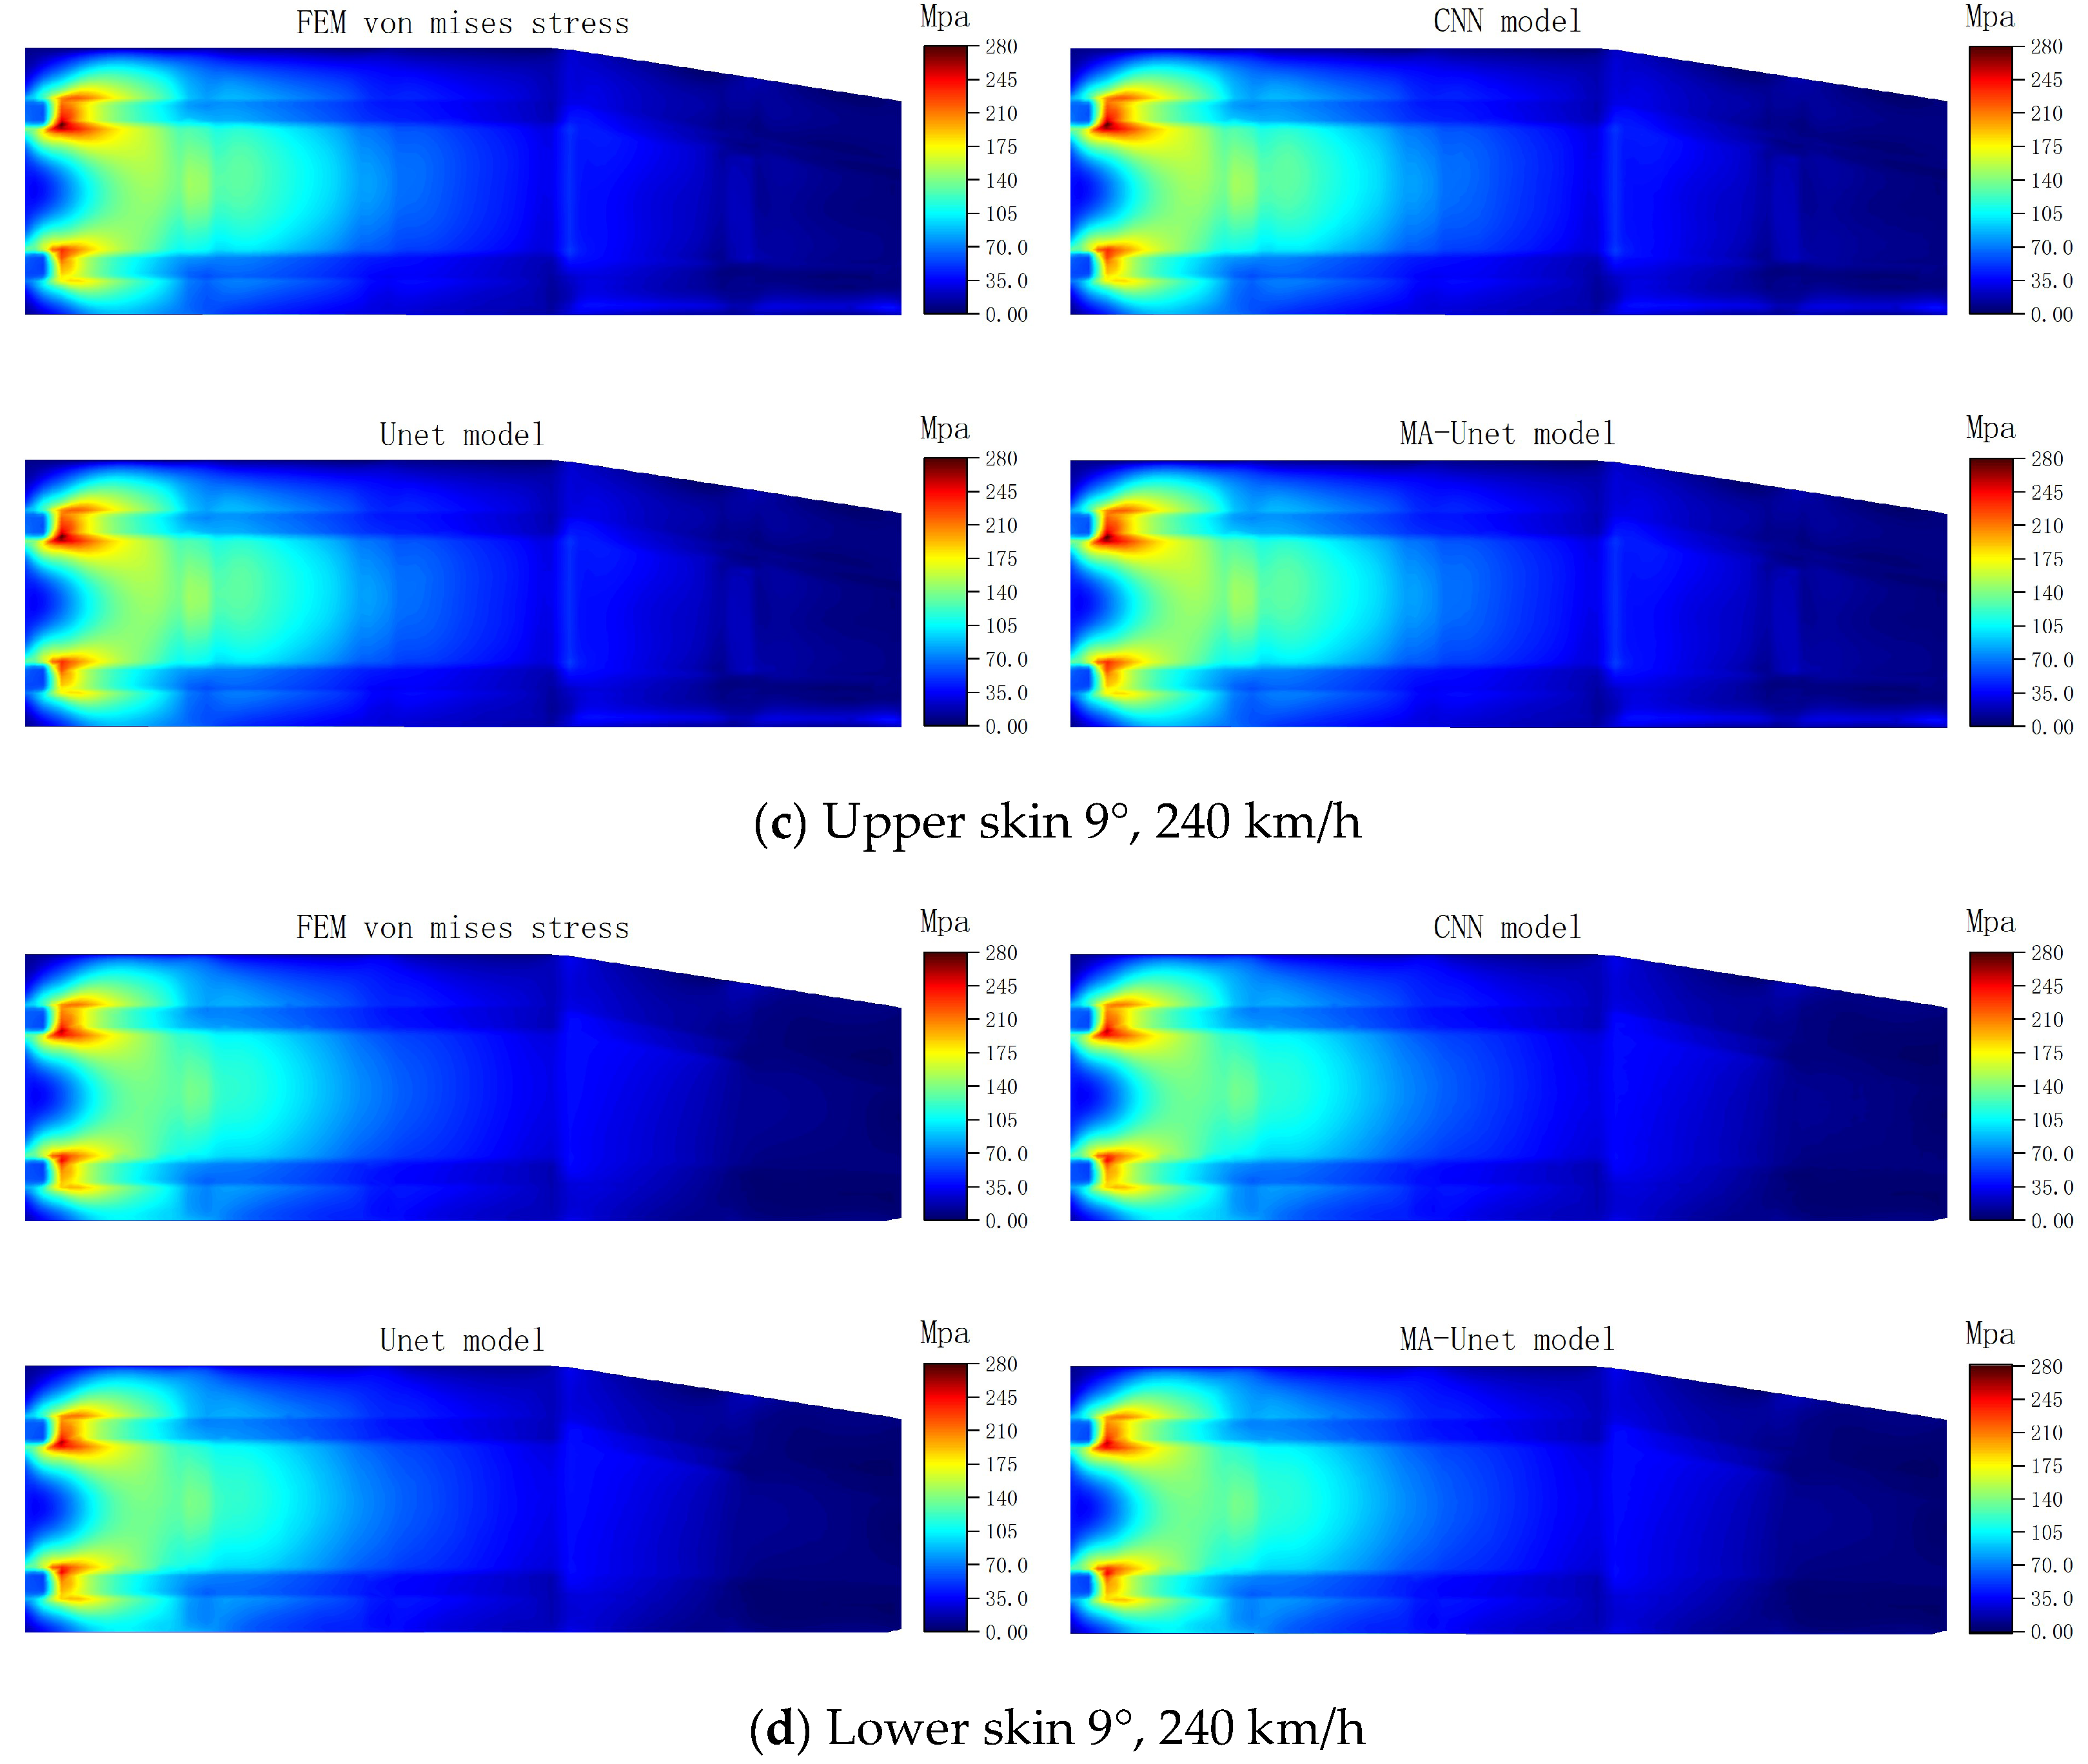
Figure 11 presents the stress prediction cloud diagrams for the upper and lower skins generated by the three models under typical working conditions. A comparison of the stress prediction cloud diagrams from the three models with the results obtained from FEM calculations reveals a high level of consistency in the equivalent stress distribution predictions. This alignment indicates that all three models exhibit a high degree of accuracy in capturing the overall trends of stress distribution.
Table 8 and
Table 9 present the scores of the models on the upper and lower skin validation and test sets across various evaluation metrics. All three models exhibit low loss values and good prediction accuracy for both MSE and MAE metrics. The MA-Unet model demonstrates the best performance on the upper-skinned dataset, achieving an MSE of 0.0044 and an MAE of 0.0429, with an R
2 value approaching 1. This result indicates that the MA-Unet model effectively captures the latent features of the data, showcasing strong generalization and prediction capabilities. The Unet model records an MSE of 0.0051 and an MAE of 0.0489 on the validation set, with both MSE and MAE values on the test set being higher than those of the MA-Unet model, suggesting slightly reduced generalization capability. In comparison, the CNN model exhibits weaker performance on these datasets, with MSE values of 0.0799 and 0.0508, and MAE values of 0.1425 and 0.1570 for the validation and test sets, respectively.
In the lower-skinned dataset, the MA-Unet model continues to demonstrate excellent performance, achieving an MSE of 0.0064 and an MAE of 0.0560 on the validation set, along with an MSE of 0.1023 on the test set. These results indicate that the MA-Unet model is well adapted to the features of the lower-skinned data, effectively reducing prediction errors. The Unet model records a commendable performance on the validation set, with an MSE of 0.0109 and an MAE of 0.0675; however, the MSE rises to 0.1373 on the test set, indicating some volatility. In contrast, the CNN model performs poorly on the lower-skinned dataset, exhibiting an MSE of 0.1452 and an MAE of 0.1761 on the validation set, and an MSE of 0.1412 and an MAE of 0.2865 on the test set, which reflects greater volatility.
In summary, all three models demonstrate improved overall prediction accuracy, with the MA-Unet model exhibiting the best performance in both upper and lower skin prediction tasks. The multi-scale feature extraction approach contributes to higher prediction accuracy and enhanced generalization capabilities across the models.
6.2. Projections for High-Stress Areas
In engineering applications, accurately predicting high-stress areas is crucial, as these regions often represent potential risk points for structural failure. Reliable stress prediction for these areas is essential for ensuring the safety and integrity of the structure, as well as for effectively reducing maintenance costs and extending the service life of the system.
Table 10 and
Table 11 present the prediction metric scores for the three models in high-stress regions. A comparison of the prediction results for the upper and lower skin concentration areas reveals that the MA-Unet model outperforms the others across several assessment metrics. In the validation set for the upper skin concentration region, the MA-Unet achieves an MSE of 0.0138 and an MAE of 0.0841, values that are comparable to those of the Unet model. Although the MA-Unet shows an increased MSE of 0.0451 and an MAE of 0.1587 on the test set, it still demonstrates strong generalization capabilities when confronted with unseen data. Conversely, the CNN exhibits significantly higher MSE and MAE values of 0.1251 and 0.2576, respectively, indicating its limitations in accurately capturing complex stress distributions.
In the lower skin concentration region, the MA-Unet continues to outperform both the CNN and Unet models in the validation set, achieving an MSE of 0.0156 and an MAE of 0.0931. Conversely, the test results indicate that the CNN performs slightly worse than the Unet model, demonstrating a limited ability to generalize complex data. The MA-Unet model, equipped with its unique attention mechanism and multi-scale convolutional kernels, effectively captures key features in high-stress regions, thereby enhancing its adaptability and prediction accuracy for complex structures.
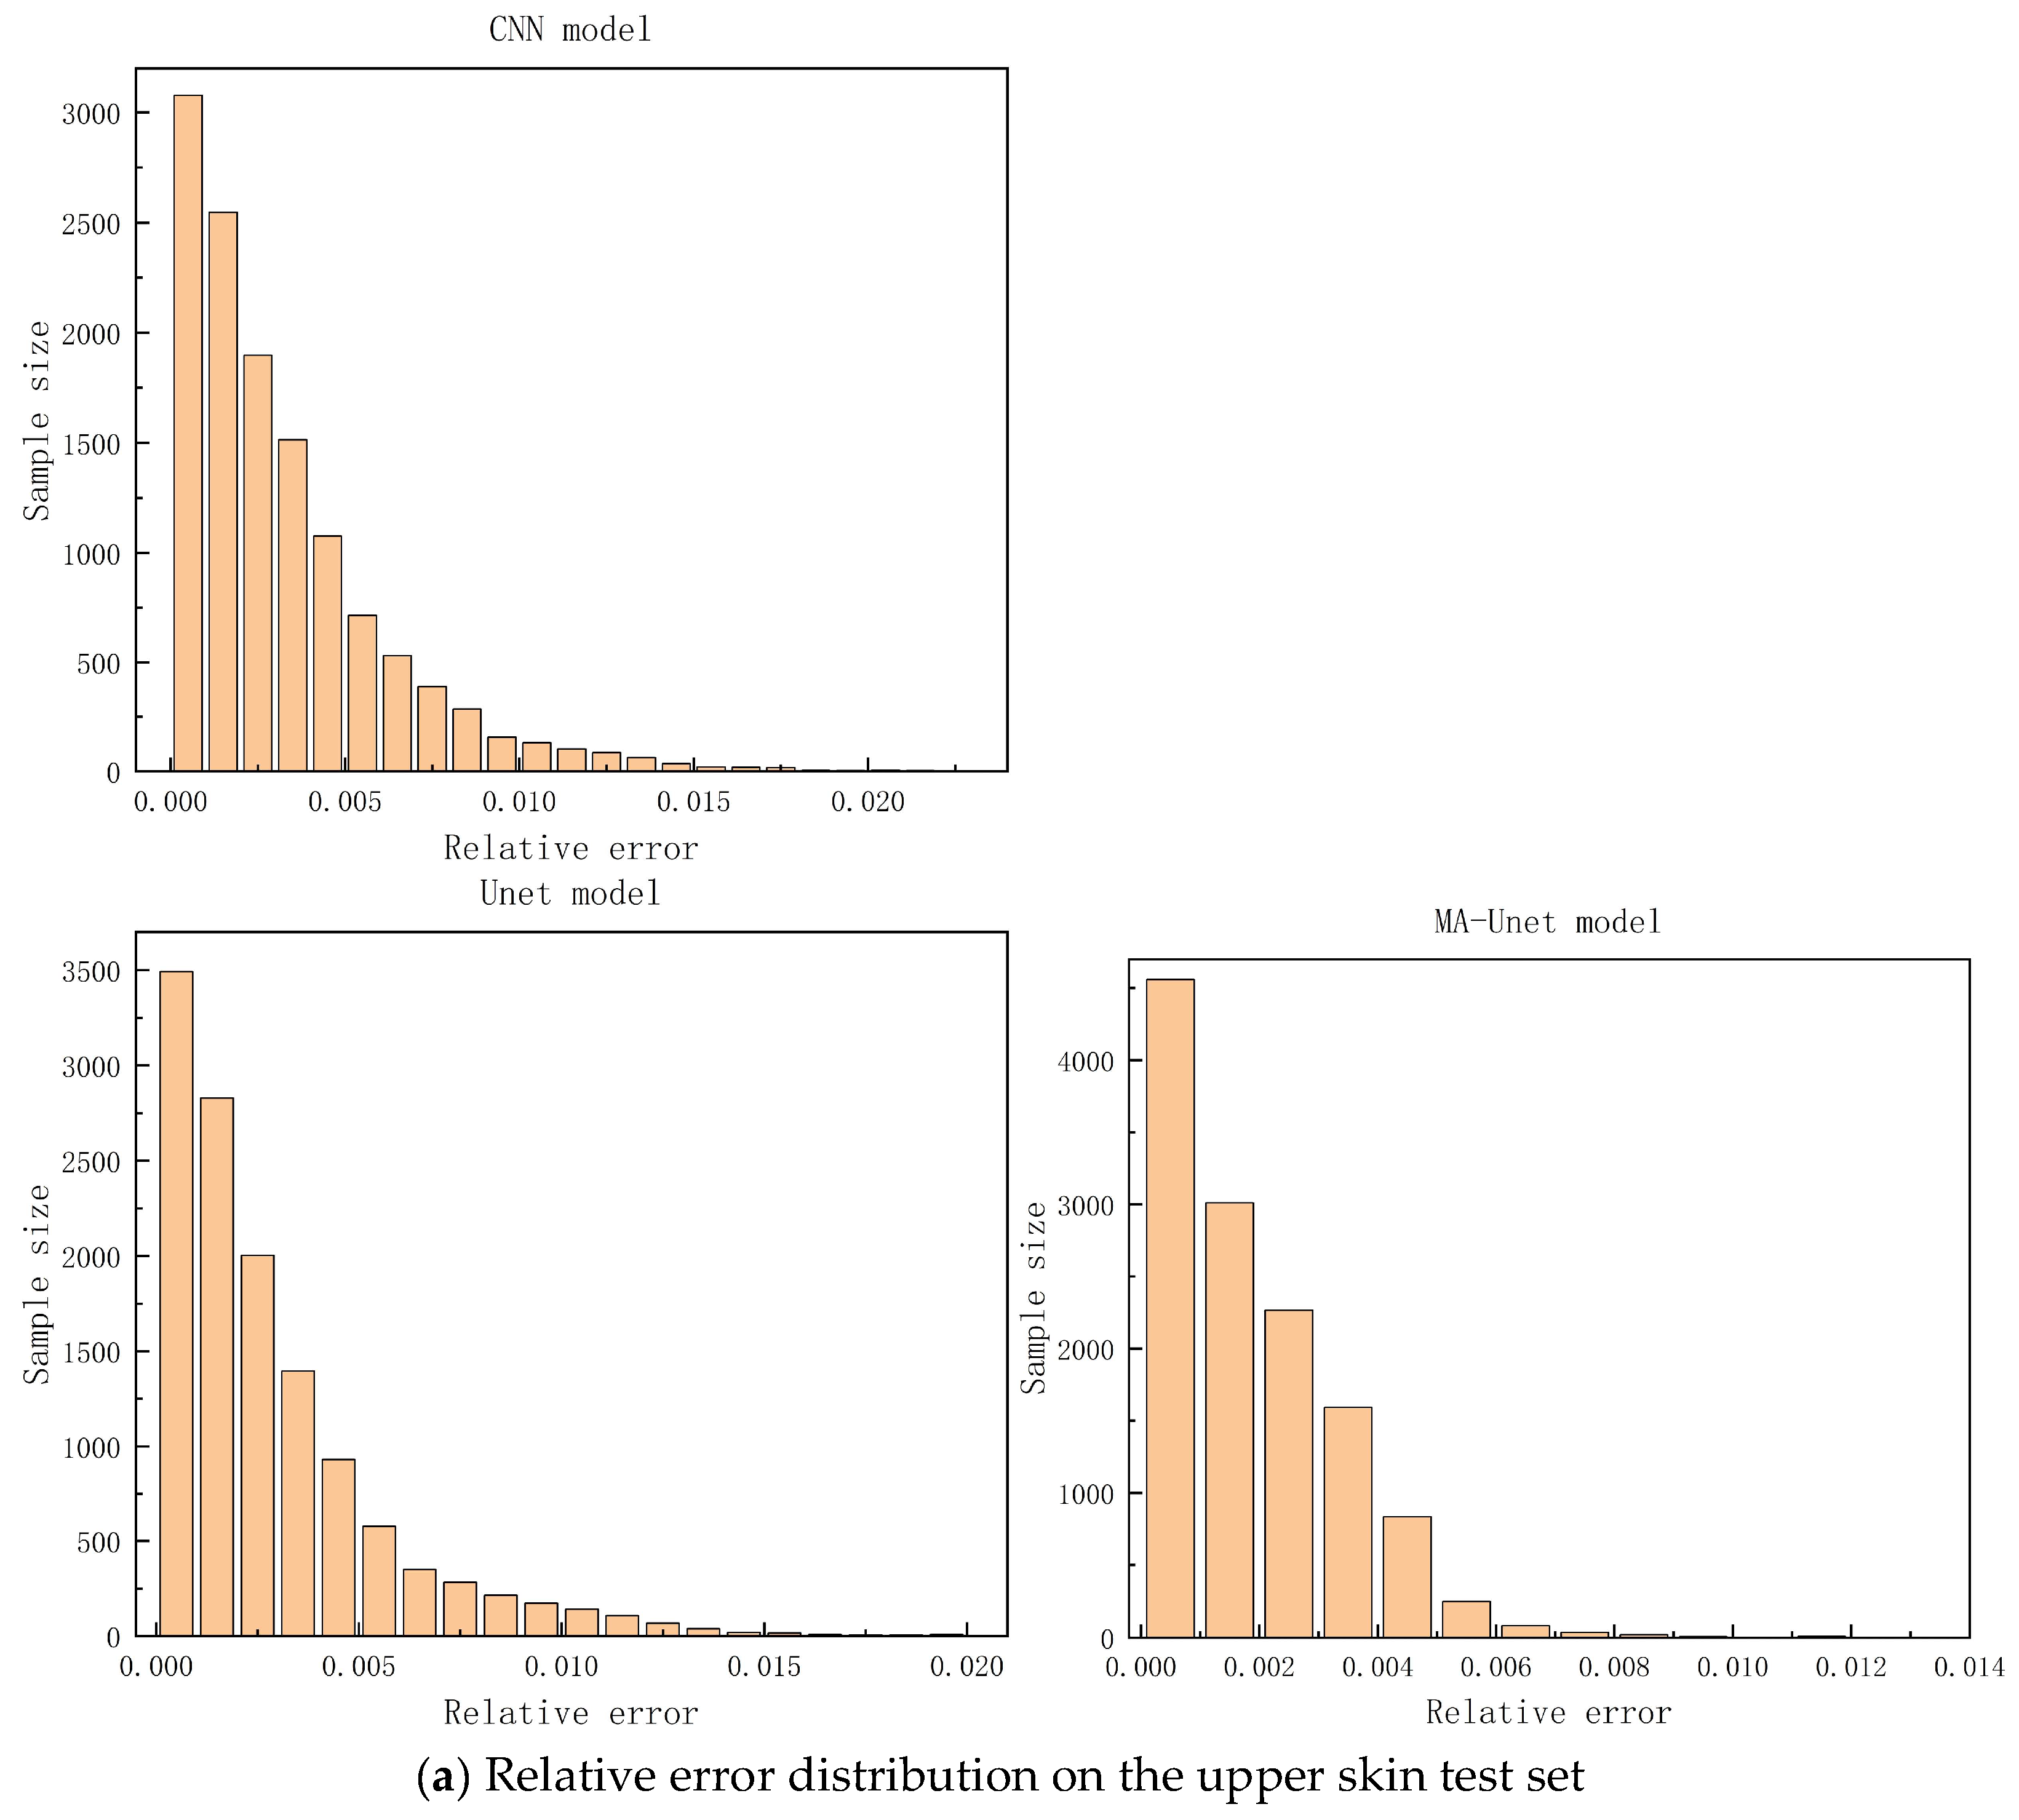
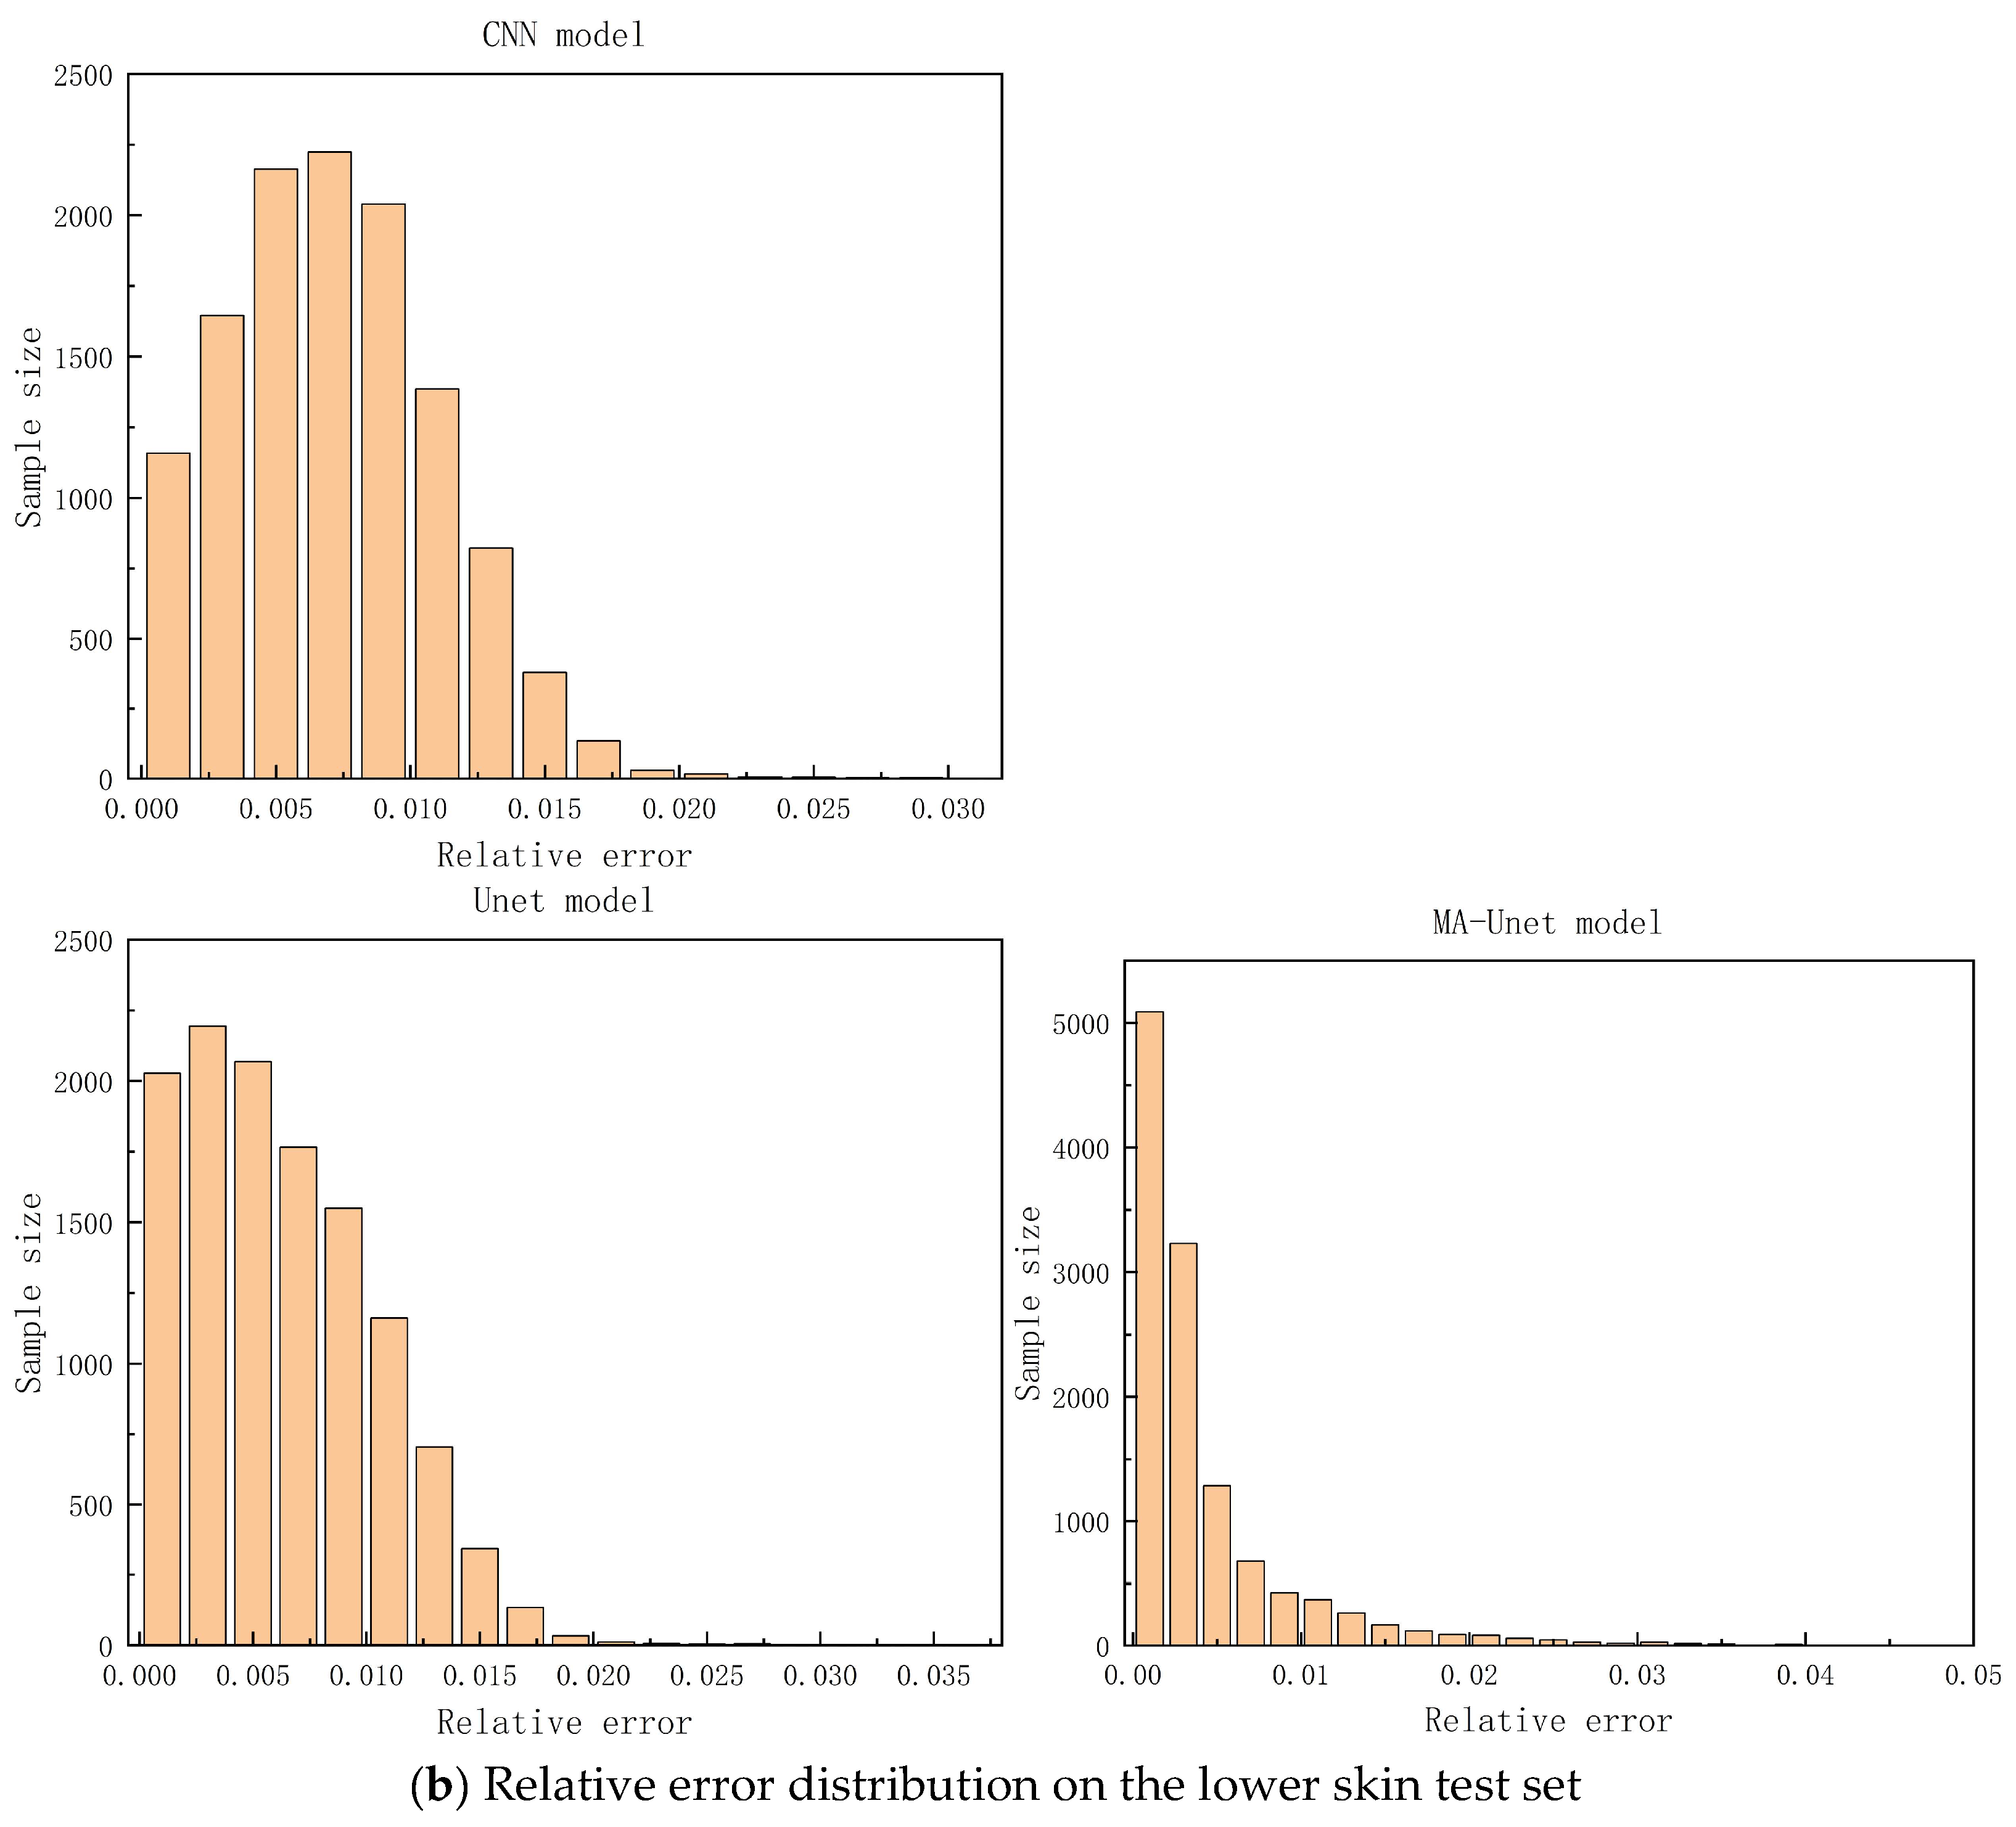
Figure 12 illustrates the relative error distributions of the three models on the upper and lower skin test sets. The MA-Unet model exhibits a more concentrated relative error distribution compared to both the Unet and CNN models across the overall dataset, with 90% of the samples demonstrating a relative error within 1%. In contrast, the relative error distributions of the Unet and CNN models in the lower skin region are primarily concentrated in the interval of [0, 0.02], showing a more uniform spread. The MA-Unet model’s ability to adaptively capture key features in high-stress regions is attributed to its unique attention mechanism and multi-scale convolution kernels, enhancing both adaptability and prediction accuracy for complex structures. This design not only improves the prediction accuracy for high-stress areas but also provides robust support for structural safety, maintenance cost reduction, and service life extension in engineering practice.
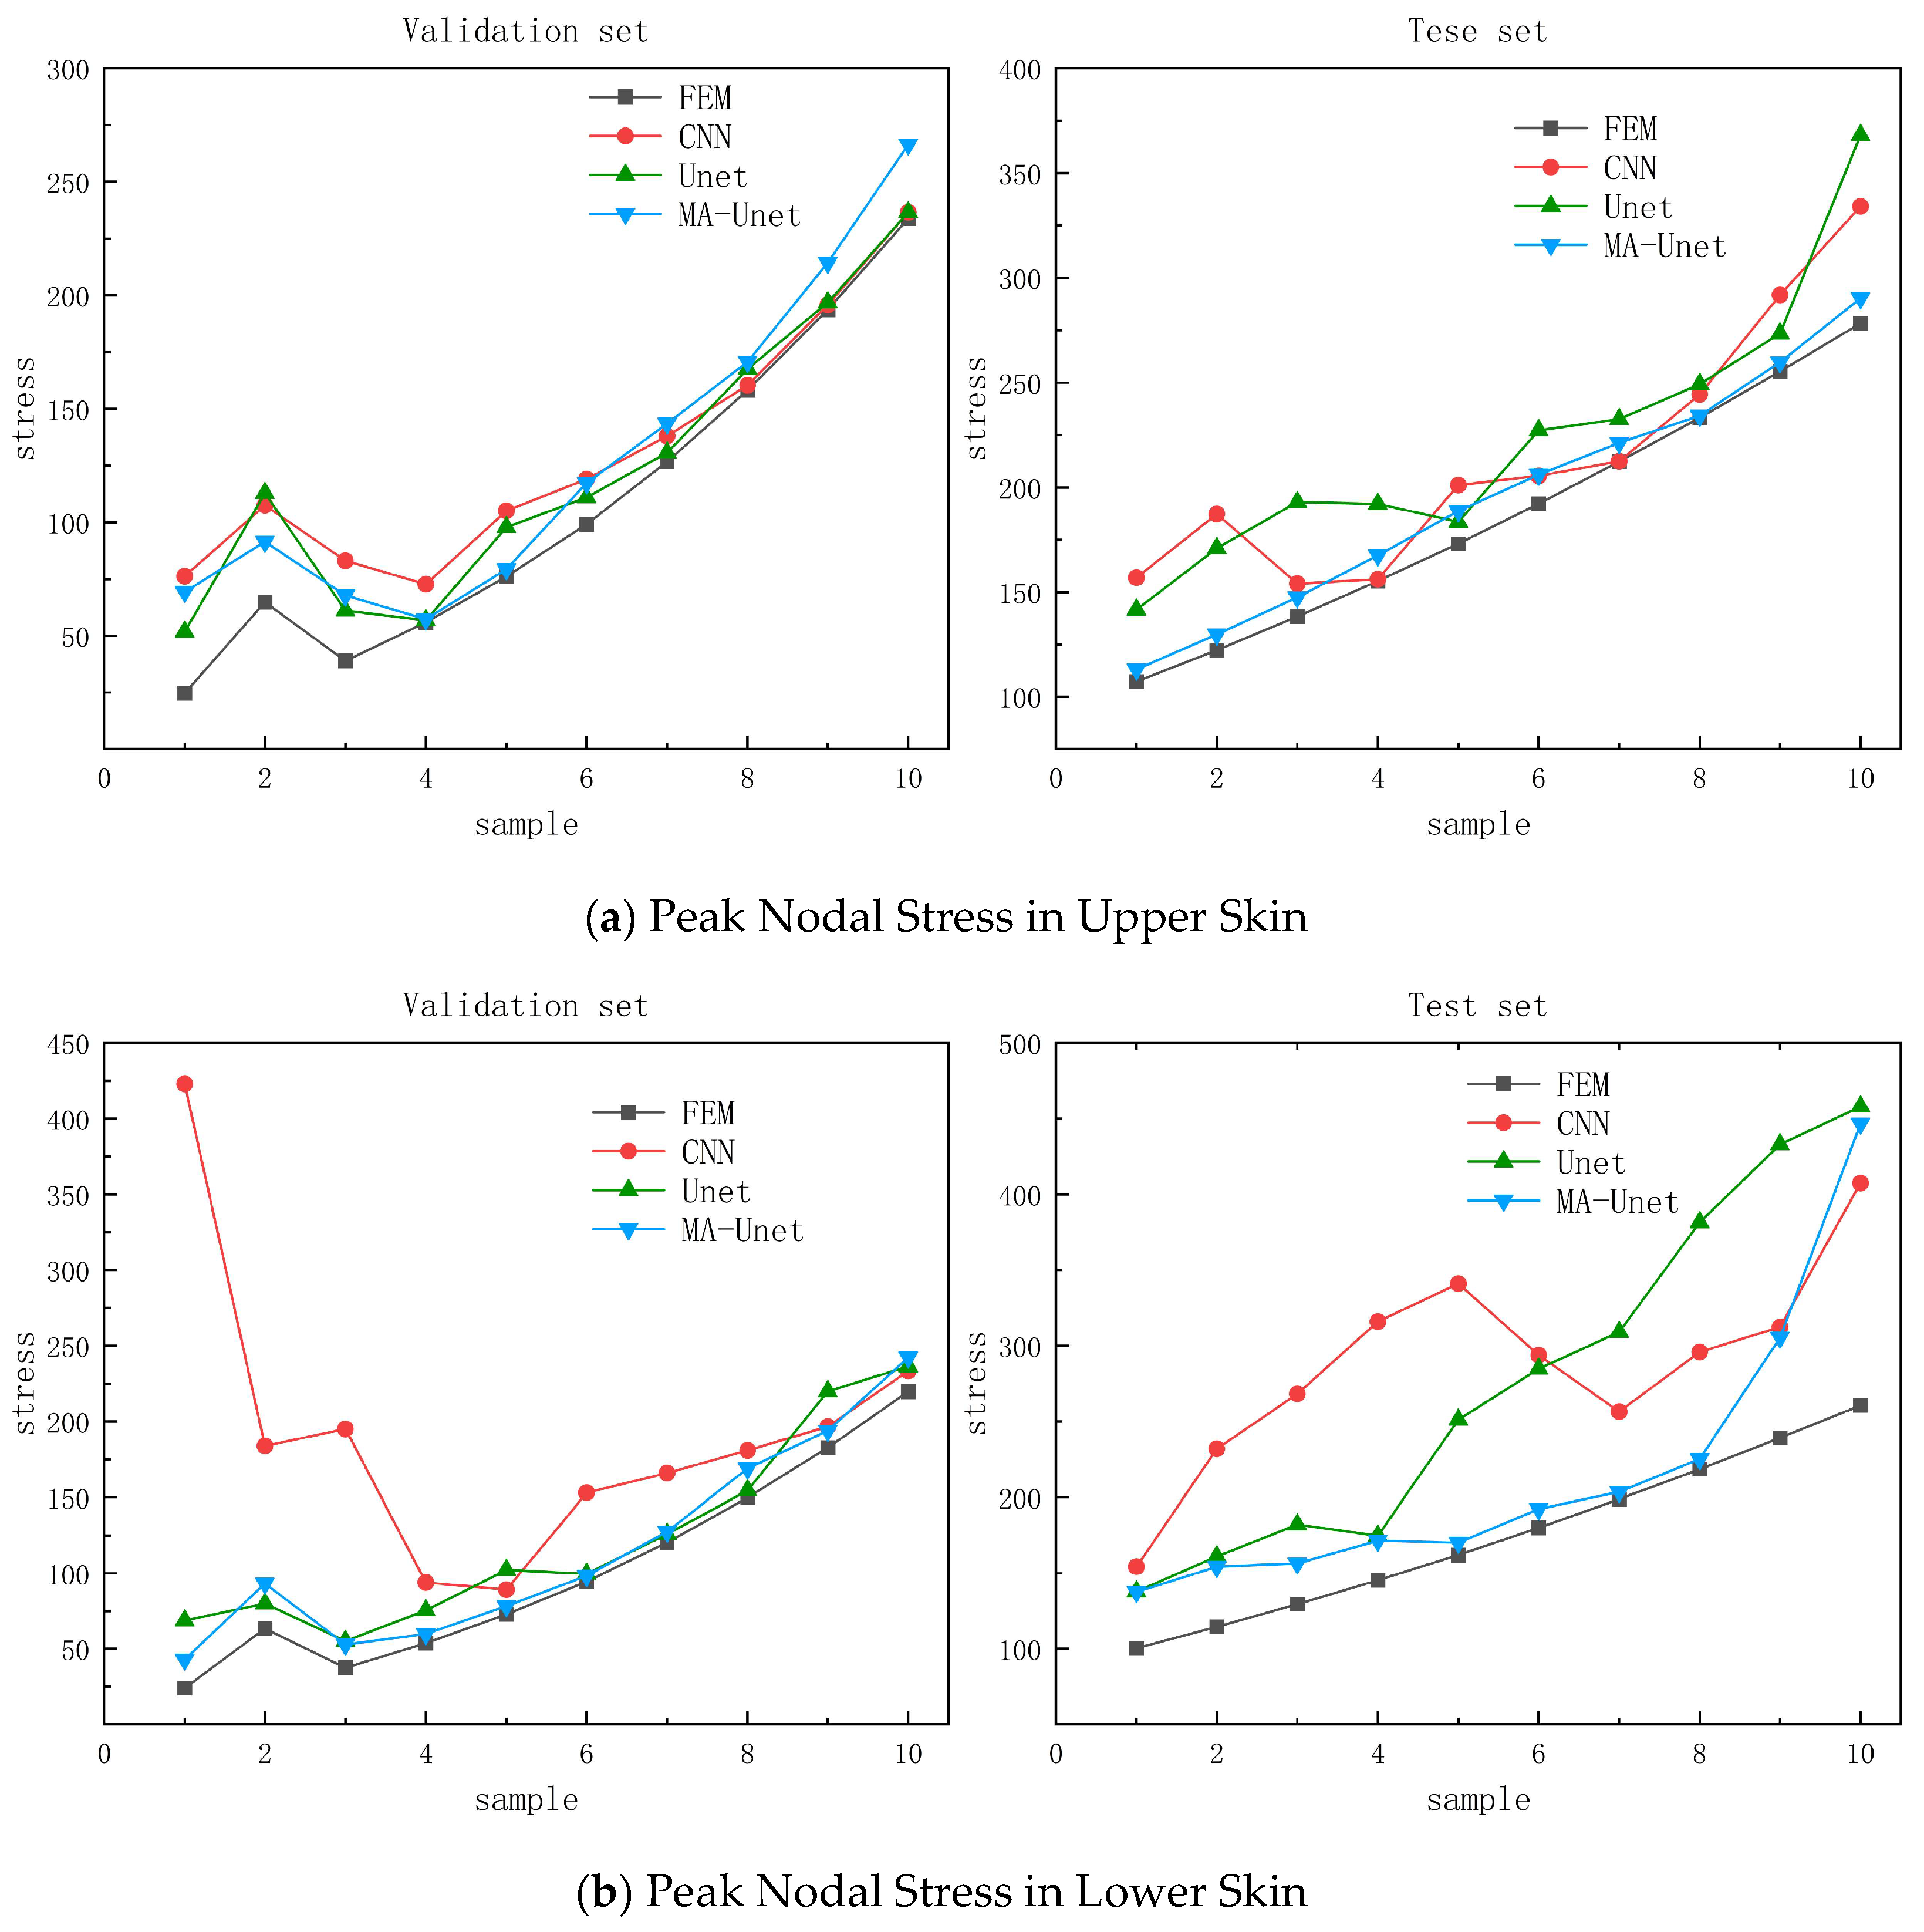
Figure 13 illustrates the predictions of the three models at the stress peak. To more clearly demonstrate the model’s prediction performance for the stress peak, the absolute error of each model’s prediction is magnified by 100 times for comparison with the FEM results. After scaling, the figure reveals that the CNN model exhibits the lowest alignment with the FEM calculation results on both the upper and lower skins of the validation and test sets, particularly on the lower skin data, which show significant fluctuations. This inconsistency may stem from the simpler structure of the CNN model, leading to a slightly weaker ability to capture data features compared to the other two models. The Unet model performs well in peak prediction on the validation set but displays some fluctuations on the test set, indicating limited generalization ability under extreme working conditions. The MA-Unet model seems to have a tendency to move away from the FEM results in the upper skinned validation set, but the overall results are still close to the FEM calculations. One reason for this may be because the validation set has fewer samples and some occasional nodes appeared, and another reason is because the loss function used for training is MSE, and the overall mean-square error is in a very small range, but occasional nodes may have some more significant errors. Overall, MA-Unet performs best on the overall dataset, with the addition of the multi-scale convolution approach and attention resulting in high prediction accuracy and strong generalization in high stress regions.


