Article

Design and Verification of Continuous Tube Forming Process Parameters for PEEK-Based Rod Aimed at Space Manufacturing Applications

1
Mechanical Engineering College, Yanshan University, Qinhuangdao 066004, China
2
Hebei Innovation Center for Equipment Lightweight Design and Manufacturing, Yanshan University, Qinhuangdao 066004, China
3
Beijing Spacecraft Manufacturing Co., Ltd., Beijing 100094, China
*
Authors to whom correspondence should be addressed.
Aerospace 2024, 11(11), 954; https://doi.org/10.3390/aerospace11110954
Submission received: 16 September 2024 / Revised: 6 November 2024 / Accepted: 13 November 2024 / Published: 20 November 2024
(This article belongs to the Special Issue Space Sampling and Exploration Robotics)

Abstract

:
To meet the in-orbit construction needs of super-large spacecraft for ultra-long rod structures, this paper proposes an innovative on-orbit roll forming method for polyetheretherketone (PEEK)-based rod stock. This method ingeniously integrates temperature gradient control into a continuous deformation surface cavity design to achieve an efficient forming of resin rod components. A parametric model of the forming die cavity was established based on the comprehensive bending and downhill methods, and the boundary conditions for the temperature distribution gradient within the cavity were determined. Through the simulation and analysis of the PEEK rod curling and stitching forming process, the influence of the cavity configuration parameters on the forming load was determined. By constructing a test platform for the roll forming characteristics of resin rod components, the effects of different forming methods, stitching temperatures, and feed rates on forming quality and load were verified, and the main factors affecting the width of the welding zone, the roundness of the rod, and the straightness of the weld were analyzed. Experimental results show that the proposed continuous roll forming scheme can achieve an efficient and continuous forming of resin rod structures. When the length of the member is processed to 300 mm, at a formed rod diameter of 20 mm, by employing a cavity deformation zone length of 210 mm, a cavity clearance of 0.1 mm, a sheet width of 61 mm, a feed rate of 1 mm/s, and a sealing zone temperature setting of 335 °C, optimal rod forming quality can be achieved, characterized by a straightness error of 0.0133 ± 0.005 mm and a roundness error of 0.19 ± 0.07 mm. The proposal of this scheme provides a reliable basis for the continuous manufacturing of rod structures in the on-orbit construction of large space structures in terms of both the scheme and the parameter selection.

1. Introduction

The in-orbit construction of ultra-large spacecraft is an inevitable trend toward the large-scale development of spacecraft, such as the synthetic aperture radar (SAR) antenna that utilizes the SAR principle to achieve a high-resolution detection of targets, which typically requires a structural size of hundreds of meters or more. However, due to the current limitations on the envelope size of launch vehicles, directly launching such large-scale structures into space orbits can be a challenge. Given that the main support structure of the SAR antenna often consists of continuous ultra-long rod components, the key to obtaining an ultra-long SAR antenna structure at the scale of hundreds of meters lies in the in-orbit construction of 1D ultra-long rod structures.
As early as the 20th century, Astro Research Corporation had investigated the development of coilable deployment mechanisms [1] that are capable of multiple deployments and retractions. While these mechanisms are primarily applied to the construction of medium-range solar arrays [2,3], they are highly dependent on material properties and do not maximize the utilization of the stowed space, thus gradually increasing the stowed space dimension requirements along with the deployment length. With the emergence of “podded booms” in recent years [4,5], their stowed form, which resembles a rolled material, has greatly improved the deployment-to-stowage ratio of ultra-long rod structures. Nevertheless, the rod structures obtained by these podded booms inherently possess non-uniform radial stiffness, which increases the demands on the subsequent in-orbit service of the rod components. With the advancement of additive manufacturing technology, Tethers Unlimited Inc. in the United States proposed “SpiderFab [6]”, which combines 3D printing with autonomous assembly technologies to manufacture large components, such as antenna reflectors, solar concentrators, and solar sails in orbit. Equipment of the same type also includes the “Archinaut” 3D printer [7] manufactured by Made in Space, which is planned to be installed on a detachable module outside the International Space Station. Utilizing on-orbit 3D printing and assembly technologies, SpiderFab demonstrates the feasibility of the in-orbit manufacturing of large and complex structures and further confirms the viability of the in-orbit fabrication of large-scale truss structures. The in-orbit manufacturing of ultra-long rod structures has also attracted research attention [8,9] in China in recent years. Li Zhanhua et al. [10] examined the forming equipment function and structure of drum-style extendable rods, developed a continuous bending and drawing forming equipment for these rods, and successfully manufactured a 6 m long elastic drum using the developed equipment.
Spacecraft materials typically employ advanced structured metallic materials, such as stainless steel [11], aluminum magnesium alloy [12], and titanium alloy [13], or polymers with excellent physicochemical properties, such as poly ether-ether-ketone (PEEK). This is because PEEK [14,15] possesses radiation resistance and maintains stable physicochemical properties in the space environment [16]. Furthermore, compared with metallic materials [17], polymeric materials have a significantly lower density, meeting the requirements for in-orbit servicing and roll forming [18]. Additionally, scholars both domestically and internationally have a certain research foundation in composite material tube manufacturing technology and PEEK material forming processes [19]. Traditional shaping of PEEK materials is commonly carried out using 3D printing technology [20] or pultrusion methods [21], which offer the advantages of uniform mechanical strength in the shaped parts and high molding precision. Nevertheless, during the shaping process, it is necessary to transform the PEEK material into a viscous flow state for extrusion. The formation of bars requires a forced cooling medium [22,23] (air, coolant), a condition that cannot be met in space. Moreover, the accumulated temperature at the nozzle is not easily cooled, and the solidification rate of molten material in the spatial environment is relatively low, making it difficult to form large truss bar components in orbit. Therefore, this study proposes a continuous on-orbit manufacturing scheme for PEEK material bar structures through rolling forming under localized viscous flow conditions. This scheme has the advantages of fast forming speed and low total heat dissipation, making it suitable for the on-orbit forming process of PEEK-based structural bar components.
The structure of the remainder of this article is as follows. Section 1 introduces the demand for the in-orbit construction of ultra-large spacecraft and highlights the significance of the PEEK-based rod component in-orbit rolling forming scheme. Section 2 details the design of the PEEK-based rod component in-orbit rolling forming scheme and the parametric design of the rolling forming die cavity surface. Section 3 simulates the rolling and stitching behavior of the PEEK rod, while Section 4 verifies the rolling forming load and forming quality. Section 5 concludes this paper.

2. PEEK-Based Rod In-Orbit Rolling Forming Method

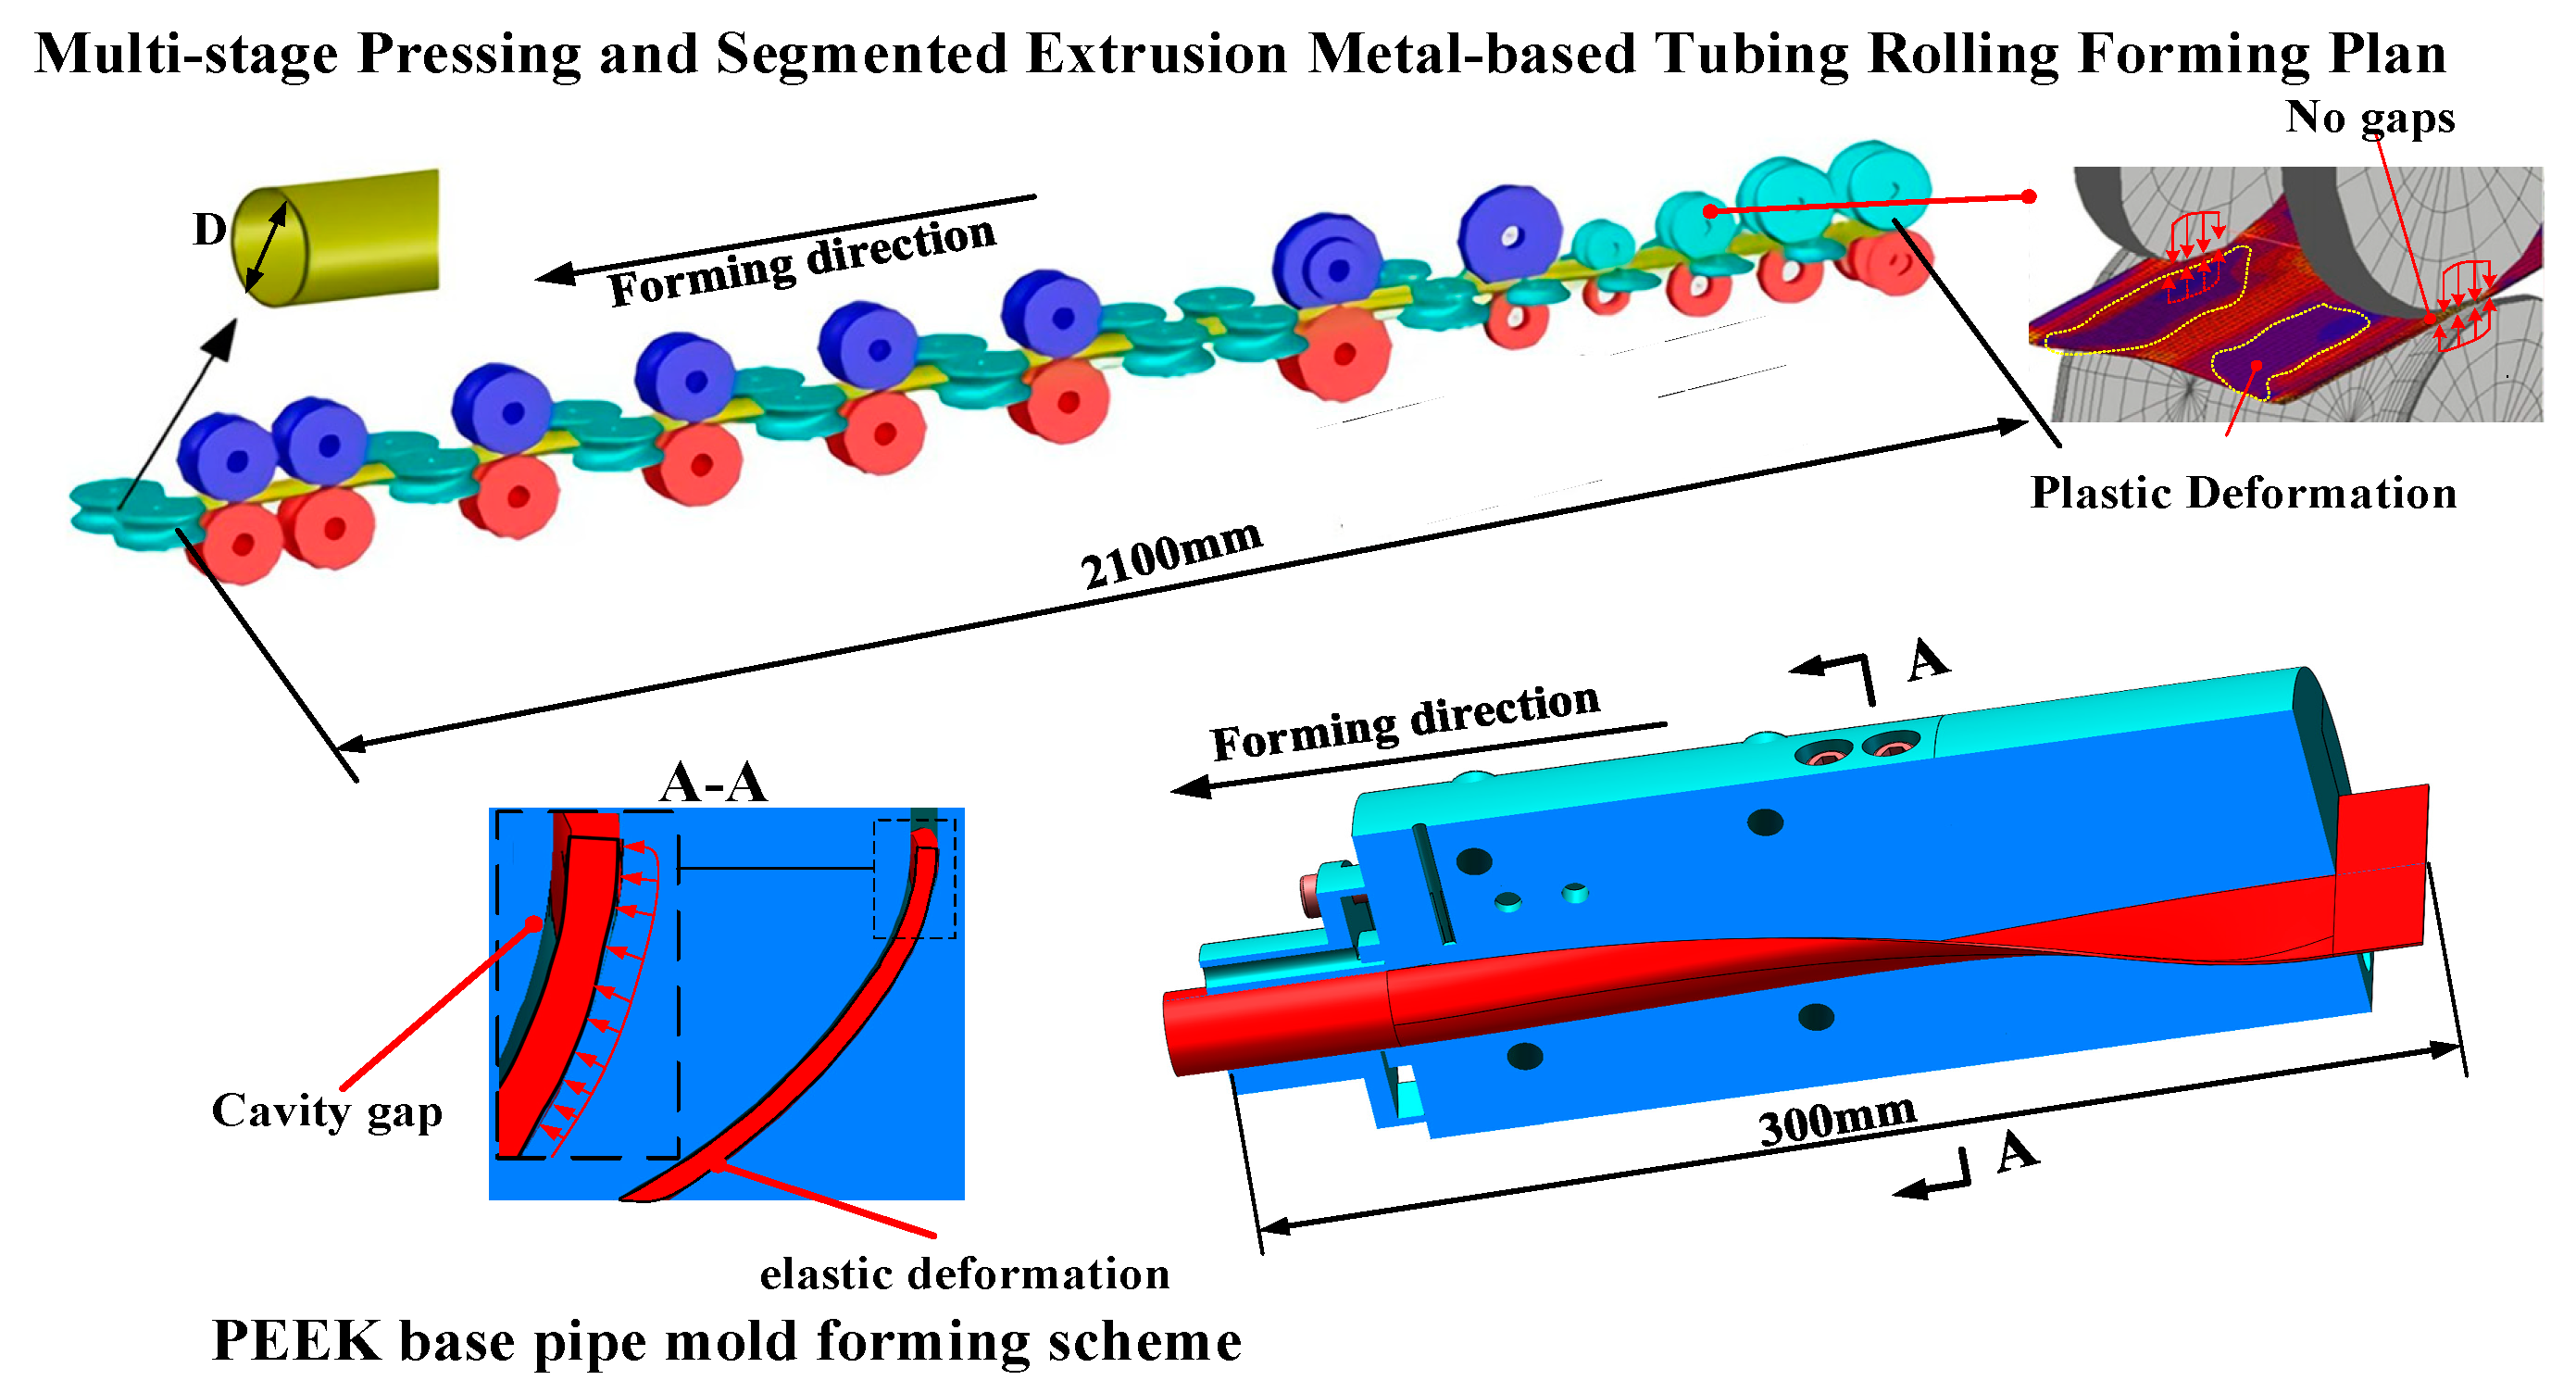
2.1. Design of the In-Orbit Rolling Forming Scheme for PEEK-Based Rod Components

As shown in Figure 1, this paper compares a multi-stage extrusion scheme [24] with a continuous mold forming scheme and finds that using a continuous cavity forming method can significantly reduce the forming length. During the forming process, the strip maintains an elastic deformation state, avoiding the occurrence of material plastic stretching. Based on this, the paper establishes the mold forming process for PEEK-based rod components in orbit, as illustrated in Figure 2. The pre-rolled PEEK strip undergoes unfolding and feeding processes before entering the rolling forming die, which is designed with a continuous deformation surface cavity. Under the constraint of this cavity, the PEEK strip gradually curls inward to form a cylindrical shape, and then undergoes high-temperature melting and fusion at the die exit to form a closed cross-sectional tube. During the forming process, it is necessary to heat the resin strip from the glassy state to the high-elastic state. The deformation of the resin strip during the forming process is an elastic deformation. After curling into a tube, it is cooled and returned to the glassy state to ensure it does not exceed the elastic deformation limit, preventing the occurrence of plastic stretching, thereby solidifying the shape. The end of the die is equipped with a traction wheel and a feed wheel, which operate at the same tangential speed to generate the necessary traction force for the continuous forming process of the strip, and to prevent the strip from stretching due to the traction force generated during the forming process.
The forming die is divided into three zones (i.e., guide, forming, and sealing zones) along the direction of rod component formation. The guide zone ensures that the resin tape enters the forming die with the same posture, the forming zone constrains the resin tape to curl into a tube shape, and the sealing zone melts and presses the edges of the abutting resin tapes together to achieve connection and sealing. The external surface of the forming die is sequentially wrapped with two sets of heating rings and one heating bar to control the temperature of the PEEK tape at different forming stages. During the continuous forming of the PEEK tape, the temperatures of the guide, forming, and sealing zones are set below the glass transition temperature (Tg) of the resin material, between Tg and the resin melting temperature (Tf), and above Tf, respectively. Consequently, the resin tape successively exhibits a glassy state (guide zone), a rubbery state (forming zone), and a local melting state (sealing zone) within the die. Given that the sealing zone is heated by a heating bar, a localized high-temperature area along the circumference of the cavity is formed in this zone to provide the necessary heat for the resin after curling and docking. During its continuous curling and tube forming process, the PEEK tape is placed under the simultaneous action of the die cavity, heating components, and the thermoplastic nature of the resin in a non-equilibrium state of force, heat, and phase. The rational design of the die cavity and the selection of forming process parameters are crucial to the design of the PEEK-based rod component rail rolling and tube forming method.

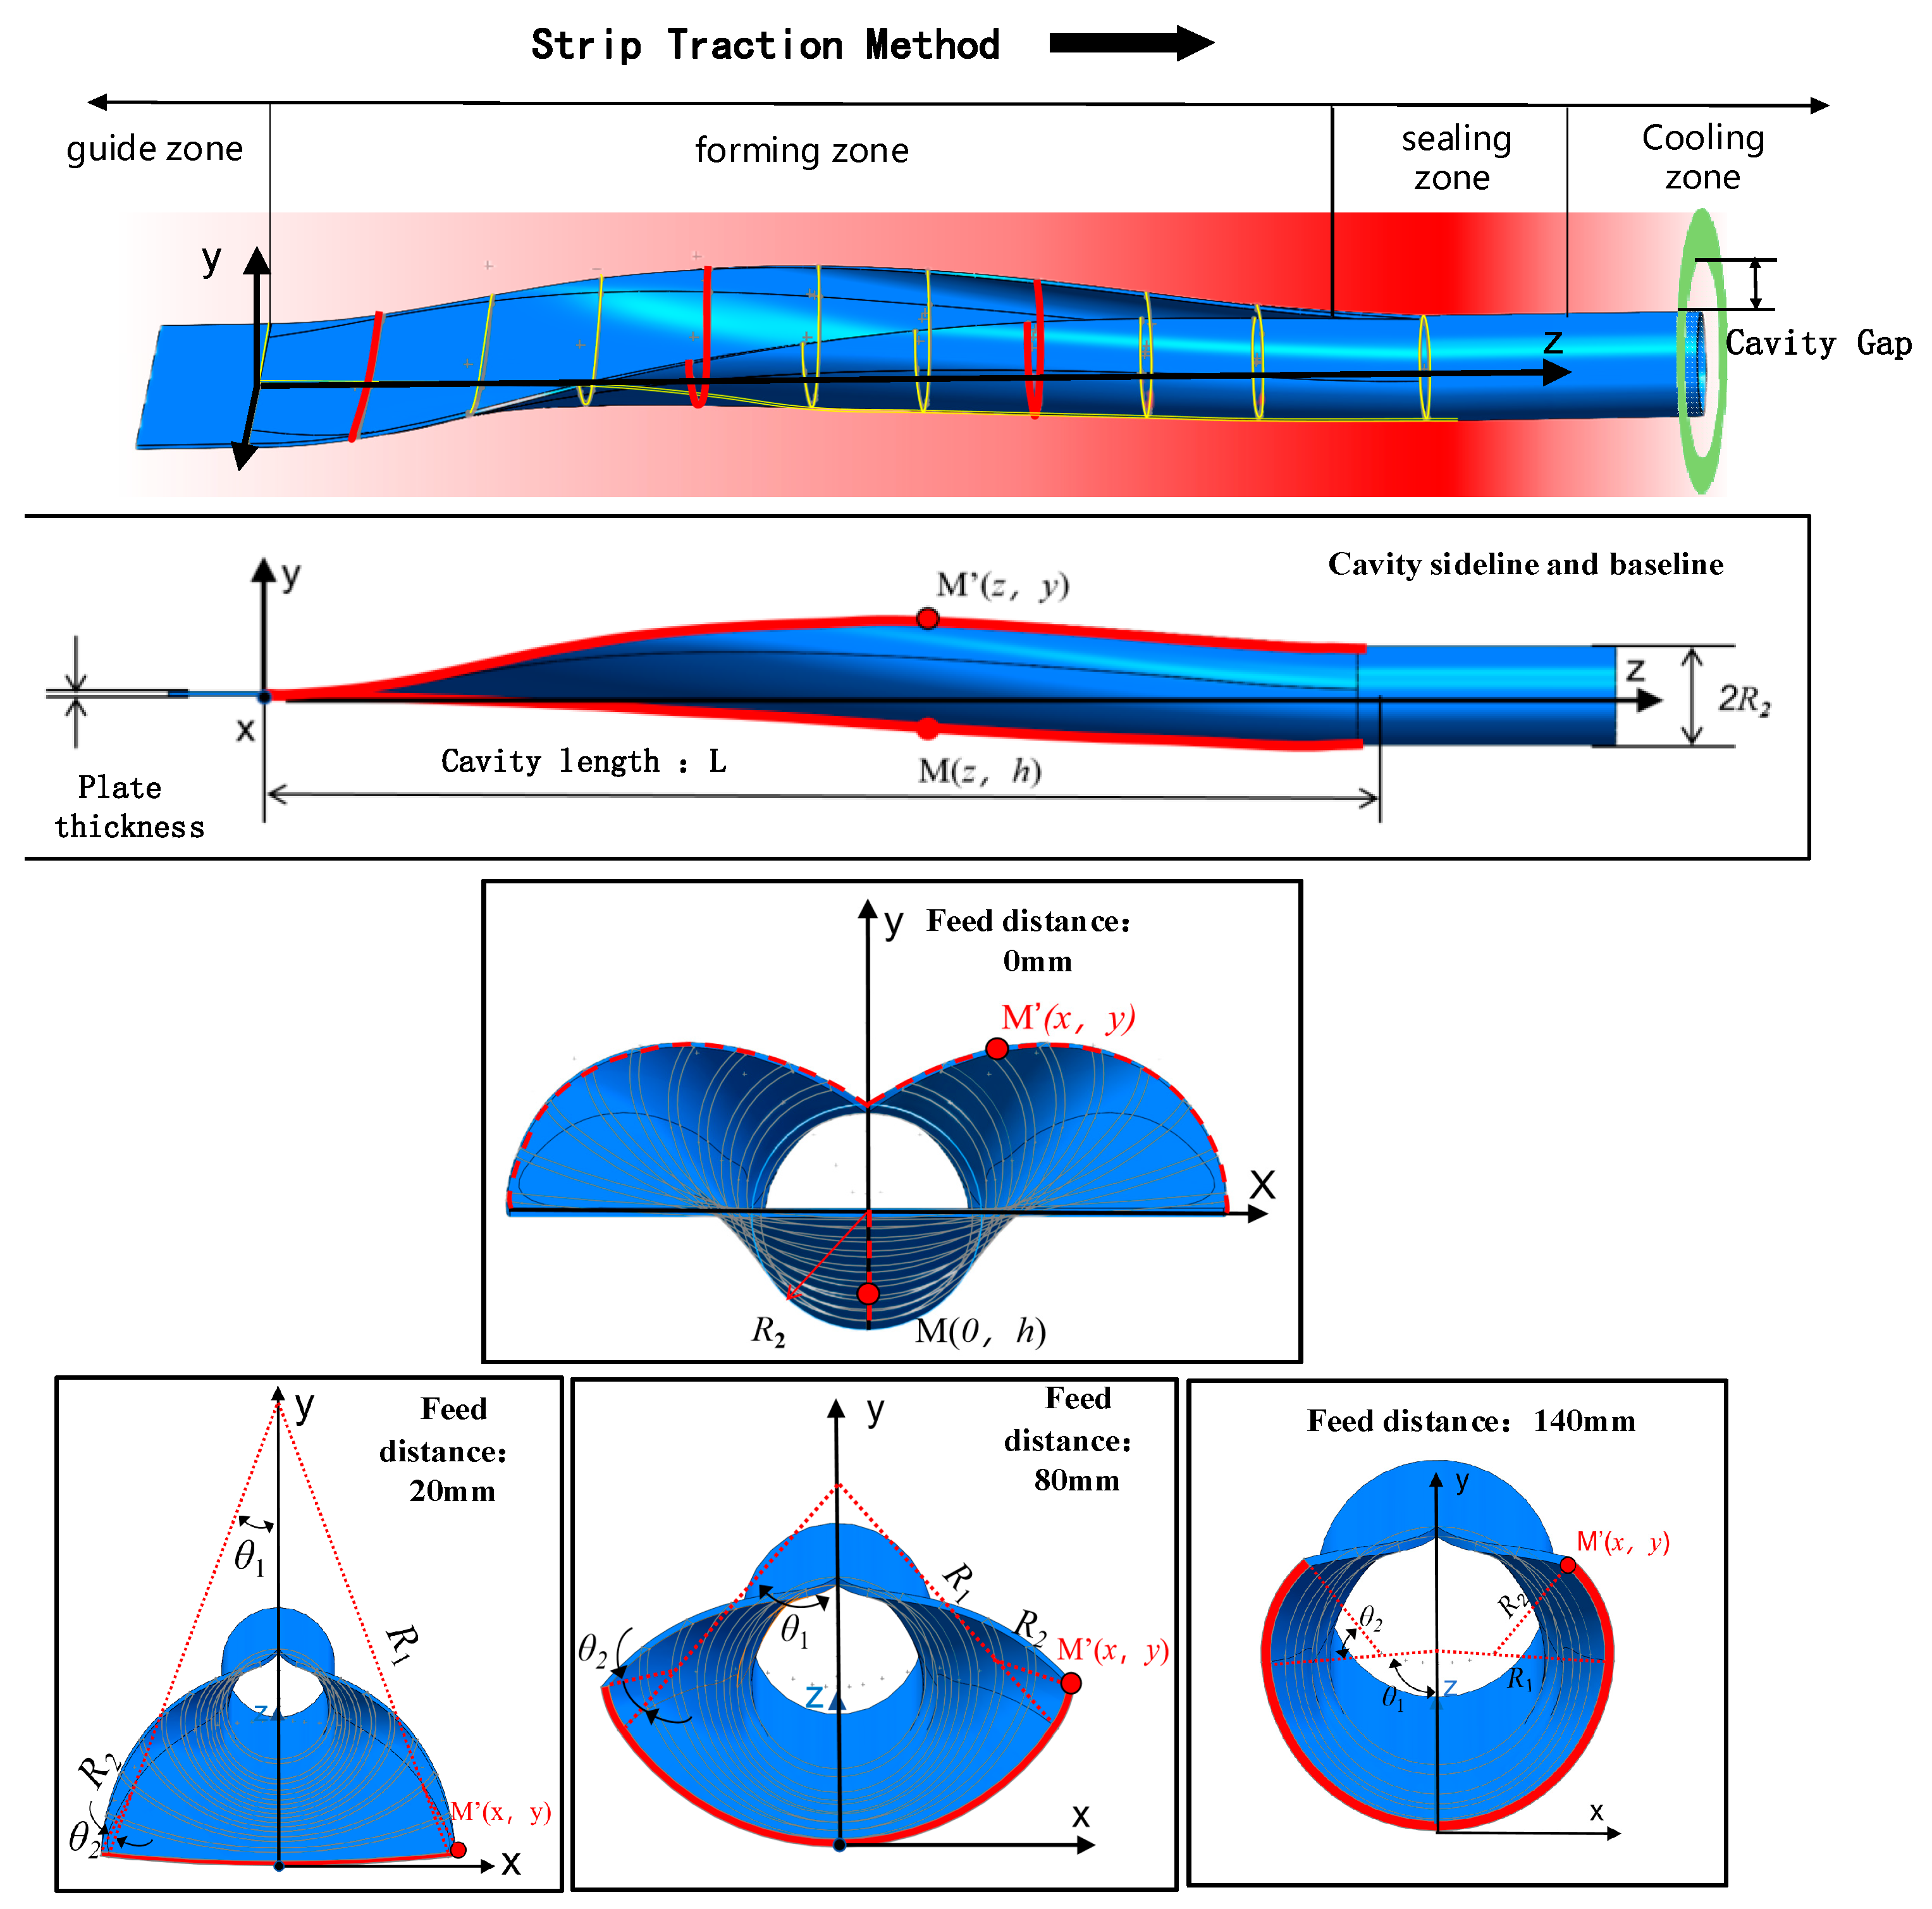
2.2. Parametric Design of the Tube Rolling Forming Die Cavity Surface

2.2.1. Parametric Modeling of the Cavity Configuration Surface

(1)
Design Concept of the Forming Die Cavity.
Apart from meeting the temperature distribution requirements for the resin tape, the forming die cavity must also satisfy the requirements for the continuous forming of the tape, uniform edge deformation, and high precision of the formed tube. Therefore, as shown in Figure 3, the maximum stress of the tape should be reasonably allocated during the forming, plastic deformation, and extension and contraction processes within the cavity to establish a forming surface model. The selection of the forming section and baseline curves is key to influencing the configuration of the forming surface. The forming section curve reflects the gradual transverse bending of the tape during the forming process and represents the arrangement of the tape’s transverse cross-sectional shapes at different forming positions during the tube rolling process. Meanwhile, the forming baseline represents the connection of the lowest points of each forming section during the tube rolling process, determines the extension and contraction of the tape within the cavity, and serves as the prerequisite basis for cavity parameter design.
Tube bending forming typically employs the combined bending method or the circumferential bending method [25]. The “circumferential bending method” involves bending the entire width of the material with a uniform radius of curvature. The “combined bending method” is a bending and shaping process that initiates from both the edge and the center simultaneously. As shown in Figure 4, during circumferential bending, the cross-sectional deformation pattern involves bending the strip as a whole with the same curvature radius across the width of the strip. In the combined bending method, the sheet material begins to bend from the edges, with tube radius R2 as the curvature radius, and then gradually bends toward the center, with the central part bending according to the circumferential bending method where the curvature radius Ri approaches R from infinity. The combined bending method results in a lower edge extension and edge extension stress compared with the circumferential bending method, thereby allowing for higher weld and tube straightness during the forming of long rod components.
The forming baseline of tube materials typically employs the constant forming method, uphill method, and downhill method [26]. The “uphill method” is a forming process where the baseline moves upward during shaping. The “downhill method” is a forming process where the baseline moves downward during shaping. The “constant forming method” is a forming process where the baseline remains horizontal or constant throughout the shaping process. As shown in Figure 5, when comparing the edge arc lengths of the strip in the three baseline forming methods, the uphill method results in the longest edge arc length, followed by the constant forming method, and the downhill method resulting in the shortest edge arc length. During the tube rolling process, a greater edge stretching of the strip corresponds to a higher edge stress. Therefore, the downhill method is chosen for the forming process to achieve a highly uniform edge extension distribution, which is conducive to improving the quality of the formed tube.
(2)
Forming Surface Modeling
Following the above analysis, the tube rolling forming die cavity surface is designed using the combined bending method (referencing the forming section curve) and the downhill method for the baseline. It is noteworthy that the “downhill method” and the “combined bending method” employed in this paper are not entirely identical to existing metal forming techniques. This study utilizes a mold cavity bending approach to minimize uncontrollable elastic–plastic deformation of the material, thereby enhancing the processing accuracy of the tubing. The variation in the forming section curve under the combined bending method is shown in Figure 6. The section deformation pattern begins at the edge, with the tube radius R2 as the curvature radius, and gradually bends to angle θ2. The central part of the bend has a curvature radius R1 that approaches R2 from infinity, and the central deformation angle θ1 increases from 0° to a value that is complementary to θ2. The downhill method of forming ensures that the baseline of the strip gradually descends throughout the forming process. The length of the strip deformation zone is denoted by L. Point M′ on the edge of the strip corresponds to point M on the baseline and to different coordinate values on the downhill and forming section curves, which can be used to determine its spatial position.
The parameters related to the cavity surface are derived as follows. As shown in Figure 7, the radii of the arcs are denoted by R1 and R2, respectively, whose corresponding central angles are θ1 and θ2. Arc AB is tangent to arc BC at point B, line BD is parallel to the x-axis, and line EB is tangent to arc BC at point B. The radius R2 is equal to the finished pipe radius R. The angle ∠CBD is denoted by ψ, and the downhill allowance is denoted by H. By taking point C on the edge of the strip material, the following relationships are obtained: ∠EBD = θ1, ∠CBE = θ2/2, and R1θ1 = (π − θ2) R2. There also exists a relationship between θ2 and ZC given by Lθ2 = πZC, where L is the z-axis coordinate at the end of the deformation zone, and ZC is the z-axis position coordinate of the current local cross-section. Based on these geometric relationships, the following equations can be derived:
C B D = C B E + E B D = θ 1 + θ 2 2
B C = 2 R sin ( θ 2 2 )
Let points A to C be denoted by coordinates (0, YA), (XB, YB), and (XC, YC), respectively, such that:
X B = R 1 sin θ 1 Y B = Y A + R 1 R 1 cos θ 1
X C = | B C | cos ψ = R 1 sin θ 1 + 2 R 2 sin ( θ 2 2 ) cos ( θ 1 + θ 2 2 ) Y C = | B C | sin ψ = Y A + R 1 cos θ 1 + 2 R 2 sin ( θ 2 2 ) sin ( θ 1 + θ 2 2 )
(3)
Solution of the Parametric Equations for the Forming Surface
To further determine the radius of curvature R1 and the bending angle θ1 of the forming segment arc under different cross-sections, a functional relationship should be established between ZC and XC. Let the edge horizontal projection equation be a cubic equation:
X C = k A Z C L 3 + k B Z C L 2 + k C Z C L + k D
where kA, kB, kC, and kD are the coefficients to be determined. The horizontal projection of the strip edge at the entrance and exit of the cavity deformation zone must be continuous and tangent to the forming direction. In other words, XC = Rπ and d X c d Z c = 0 when ZC = 0, and XC = 0 and d X c d Z c = 0 when ZC = L. Substituting these conditions into Equation (5) yields the following horizontal projection equation of the strip edge:
X C = 2 π R 2 Z C L 3 3 π R 2 Z C L 2 + π R 2
By combining the strip edge endpoint Equation (5) and the horizontal projection Equation (6), the following system of equations can be obtained:
X C = R 1 sin θ 1 + 2 R 2 sin ( θ 2 2 ) cos ( θ 1 + θ 2 2 ) X C = 2 π R 2 Z C L 3 3 π R 2 Z C L 2 + π R 2
The values of θ1 and R1 for the center bending section of the strip at a certain cross-sectional position ZC can be calculated by substituting R1θ1 = (π − θ2) R2 into Equation (7). A coordinate system is then established in the yOz plane, and a cubic function relationship is constructed between different cross-sections ZC and the baseline coordinate YA while taking the center of the mold entrance as the coordinate origin O (0, 0) and point A (0, YA).
In this context, the cubic function relationship can be represented as:
Y A = k a Z C L 3 + k b Z C L 2 + k c Z C L + k d
where ka, kb, kc, and kd are the coefficients to be determined. The strip baseline at the entrance and exit of the cavity must be continuous and tangent to the forming direction. In other words, YA = 0 and d X A d Z A = 0 when ZA = 0, and XA = −H and d X A d Z A = 0 when ZA = Z. Substituting these conditions into Equation (8) yields the following baseline equation of the cross-section:
Y A = 2 H Z C L 3 3 H Z C L 2
Given that the tube forming radius is R2 = 10 mm and considering the magnitude of the forming force, the length of the forming zone is taken as L = 210 mm, and the reduction in height is taken as half the diameter of the tube, that is, H = 10 mm. With these parameters, the cavity cross-sectional equation for ZC in the range of 0 mm to 210 mm can be determined as follows:
R 1 = R 2 π θ 2 θ 1 θ 2 = π Z C L Y A = 2 H Z C L 3 3 H Z C L 2 X c = 2 π R 2 Z C L 3 3 π R 2 Z C L 2 + π R 2 = R 1 sin θ 1 + 2 R 2 sin ( θ 2 2 ) cos ( θ 1 + θ 2 2 ) Y c = Y A + R 1 cos θ 1 + 2 R 2 sin ( θ 2 2 ) sin ( θ 1 + θ 2 2 )

2.2.2. Temperature Gradient Boundary Conditions of the Cavity

The overall temperature distribution of the cavity is shown in Figure 8. Given that the extension of the strip edge during the forming process is mainly reflected in the longitudinal elongation and shortening of the sheet, the edge projection curve of the sheet during the forming process is equivalent to the edge curve. The arc length function L(Z) of this curve is calculated, and the arc length growth rate LV(Z) is obtained by differentiating the arc length function with respect to Z. Given that L(Z) is a continuous and differentiable function, to determine the position where the maximum edge stretching occurs, this function can be transformed into finding the corresponding position where the derivative of LV(Z) is zero.
By performing a coordinate transformation using Equation (6) and substituting the coordinates of point B, the projection curve of the strip edge can be transformed as follows:
x = 3 π R 2 z 2 2 π R 2 z 3
By integrating to find the edge arc length L(Z):
L ( z ) = L 1 d s = R 2 0 z 1 + ( 6 π z 6 π z 2 ) 2 d z
Taking the derivative of L(Z) yields the rate of increase in arc length, Lv(Z):
L v ( z ) = R 2 1 + ( 6 π z 6 π z 2 ) 2
Differentiating Lv(Z) yields:
L v ( z ) = R 2 36 π z 2 ( 1 z ) ( 1 2 z ) 1 + 36 π z 2 ( 1 z )
When z ( 0 , 1 2 S ) in Equation (14), L v ( x ) > 0 ; x ( 1 2 S , S ) , L v ( x ) < 0 . That is, at z = 1 2 S , the rate of arc length increase and the edge stretching of the tape are maximized. The length of the deformation zone under this cavity configuration is denoted by SS, where the maximum edge stretching occurs at z = 1 2 S . The initial temperature of the cavity is set to 30 °C above the glass transition temperature, that is, T a = T g + 30 . The starting point temperature of the cavity is set to be 30 °C higher than the glass transition temperature (i.e., T a = T g + 30 ), while the temperature of the strip material at the midpoint z = 1 2 S of the cavity is set to the mid-temperature of the material’s high-elastic state (i.e., T b = T g + 1 2 ( T f T g ) ). To facilitate the completion of the tape melting and seam welding at the roll position Z = S, the temperature is set to be 20 °C below the transition temperature to the melt flow state (i.e., T c = T f 20 ).
To ensure a uniform temperature distribution in the tube rolling area, a first-order function is used to allocate temperatures between the low- and high-temperature tube rolling zones, with T 1 = k 1 z + b 2 and T 2 = k 2 z + b 2 , where k1, k2, b1, and b2 are the coefficients to be determined. The temperature distribution functions T1 and T2 are then solved as follows:
T 1 = 2 T b T a s z + T a T 2 = 2 T c T b s z + 2 T b T c

3. Simulation Analysis of PEEK Rod Curling and Sewing Behavior

3.1. Establishment of Simulation Models

The continuous coiling process can be primarily divided into the curling and sewing steps, with each step focusing on different physical phenomena and model settings in the simulation. The sewing process focuses on simulating heat conduction, melt flow, and solid–liquid phase transitions, while the coiling process focuses on simulating structural mechanics, material deformation, and contact heat transfer. Therefore, these two processes should be modeled separately.

3.1.1. Simulation Model of the Curling Forming Process

The Johnson–Cook model is used to simulate the mechanical behavior of PEEK as a function of temperature variation. Based on this model, a constitutive model is established for PEEK in different states, and this constitutive model fits well with the experimental curves. The constitutive model for the glassy state of the PEEK material is established as follows:
σ = [ A + B ( ε p ) n ] [ 1 + C ln ( ε ˙ p ε ˙ ref p ) ] ( 1 λ e T T g e T room T g e e T room T g )
where σ represents the flow stress with the unit of MPa, σ represents the glassy flow stress of PEEK material with the unit MPa, and σ represents the rubbery flow stress of PEEK material with the unit MPa. ε p is the equivalent plastic strain, C is the empirical strain rate sensitivity coefficient, ε ˙ p is the equivalent strain rate with the unit of s−1, ε ˙ ref p is the equivalent strain rate with the unit of s−1, λ is a dimensionless material parameter, Tg is the glass transition temperature with the unit of °C, T is temperature with the unit of °C, and Troom is room temperature with the unit of °C.
The mechanical test parameters obtained for PEEK material under glassy state temperature conditions and rubbery state temperature conditions are as follows: The values of A are 132 and 70, respectively. The values of B are 10 and 6.17, respectively. The values of n are 1.2 and 0.61, respectively. The values of C are both 0.034. The values of λ are 0.412 and 2.35, respectively. Substituting these values into Equation (16), the constitutive models for PEEK material at glassy state temperature and rubbery state temperature are derived as follows:
σ = [ 132 + 10 ( ε p ) 1.2 ] [ 1 + 0.034 ln ( ε ˙ p 10 3 ) ] ( 1 0.412 e T 143 e 23 143 e e 23 143 ) σ = [ 70 + 6.17 ( ε p ) 0.61 ] [ 1 + 0.034 ln ( ε ˙ p 10 3 ) ] ( 1 2.35 e T 143 e 23 143 e e 23 143 )
Given that PEEK is in a viscous flow state above its melting point, the solid material constitutive model becomes ineffective, and the flow state parameters should be determined. The viscosity values of PEEK corresponding to different set temperatures are calculated as follows [27]:
η = 1.13 exp ( 19123 T ) × 10 10
where η represents the viscosity of the PEEK material with the unit of Pa·s.
To simulate the phase transformation of PEEK material under the influence of high temperatures, the relevant parameters are determined by consulting the literature [28], as shown in Table 1.
ANSYS Workbench 2024 is used for the simulation. Based on the previously established parametric model of the cavity configuration surface and the temperature gradient boundary conditions of the cavity, a thermo-mechanical coupled field simulation model of PEEK composite material is established, and a finite element analysis of the coiling forming process is conducted. The tape used for the cavity design has a thickness of 0.8 mm. The forming and sewing stages are modeled using 3D modeling software (SOLIDWORKS 2024), as shown in Figure 9. The tape advances and curls into a tube within the cavity, with a natural transition of the overall cavity curvature. The cavity mesh size is set to 3 mm, the tape mesh size is set to 1.5 mm, and the number of elements is 276,113. In the simulation, the cavity is subjected to fixed constraints, the tape advances at a speed of 1 mm/s, the cavity temperature is assigned according to the function calculated above, a contact relationship is established between the tape and the cavity, the contact friction coefficient is set to 0.3, the contact heat transfer coefficient between the tape and the cavity is set to 0.3 W/m °C, and the self-contact is set at the positions where the tape is sewn on both sides.

3.1.2. Simulation Model of the Butt Sewing Process

During the final sewing stage of the pipe material, the sides of the curled tape converge at the butt joint where a localized high-temperature heat source is used to treat the joint area and to heat the edges of the PEEK material to a viscous flow state, eventually leading to melting fusion. As the pipe material continuously advances, the molten area rapidly cools and solidifies and eventually forms a seamless integrated pipe material. For the welding area, dedicated solid modeling and meshing processes are carried out to accurately simulate the phase change and fluid flow behavior of the PEEK material. A model is then constructed using a tape with a thickness of 0.8 mm, and a finite element analysis software is applied using tetrahedral meshes for the fine discretization of the welding part. The complete model of the welding area and its meshing situation are shown in Figure 10.
A thermo fluid–solid coupled simulation analysis of the sewing process is then performed using Fluent fluid simulation software in workbench 2024. During the simulation, a point heat source is set on the upper surface of the welding section (the distribution of the heat source is determined according to the thermodynamic simulation structure), the tape advances at a speed of 1 mm/s, the time step is set to 0.002 s with 10,000 analysis steps, and the total simulation duration is 20 s. The welding pressure is set between the tape and the cavity and between the tapes, and the thermodynamic simulation of the cavity heat source distribution and the welding pressure during the sewing process are determined, as shown in Figure 11. The seam area length is set to 20mm, and the maximum temperature of the seam area mold is set to 340 °C. The results of the temperature settings for the welding section are shown in Figure 12.

3.2. Finite Element Simulation Analysis of the Coiling Forming Process

Referring to the same forming rod diameter and mold length, the forming mold cavity configuration is initially constructed using the circumferential bending method section and the downhill method baseline, and the strain change trend of the PEEK coiling forming process is obtained under the combined bending and circumferential bending methods, as shown in Figure 13. Experimental results indicate that the combined bending method gradually increases the feed distance of the tape, thereby allowing the material to experience a process from initial elastic deformation to uniform strain distribution within the mold cavity. As the feed distance increases, the sides of the tape are initially subjected to elastic deformation, which is followed by the appearance of strain in the middle. The overall strain distribution eventually becomes uniform, with the maximum strain being maintained within a reasonable range (0.183 mm). The circumferential bending method also achieves the bending forming of the tape, but after the tape enters the sewing stage, stress concentration occurs, which has a certain impact on the forming effect. Therefore, the combined bending method can effectively control the elastic deformation of the material and avoid the problems of excessive local stress or uneven strain. This method also ensures a highly uniform strain distribution throughout the entire forming process of the tape, thereby significantly reducing the excessive local stress and uneven strain. This method also enhances the quality of the forming effect and strengthens the overall mechanical properties of the coiling product.
The coordinates of edge point A, center point B, and arbitrary intermediate point C under the combined bending method are extracted, and their changes with feed distance are shown in Figure 14. The smooth transition of the curves for points A and C indicates that the tape does not slip or vibrate within the mold cavity, hence leading to the excellent surface quality of the formed pipe. According to the curve of node A, when the tape feed distance is less than 126 mm, the tape edge shows an upward movement trend. After reaching its highest point, the tape edge begins moving downward, indicating that the tape edge contracts inward and that the pipe is preliminarily formed. Upon descending to about 10 mm, the tape edge reaches its lowest point, indicating that the tape has completely curled into a pipe, with a downhill amount of 10 mm and a diameter of 20 mm, which match the theoretical calculations. After the forming process, the tape edge rises by 10 mm for a certain distance and then begins to rise again because point A (the tape edge) exits the mold cavity and tends to undergo elastic recovery after losing the constraint of the mold cavity. The subsequent sewing process welds the tape into a single entity and eliminates the internal stress of the pipe through heating.
The elastic stress at the edge nodes of the tape is presented in Figure 15. When the feed distance ranges between 0 m and 80 mm, the elastic stress initially increases along with feed distance in the growth interval. When the feed distance reaches 81 mm, the elastic stress enters the peak stress interval, which lasts until the feed distance reaches 156 mm. The elastic stress then enters the descending interval, where it decreases along with an increasing feed distance until reaching zero because the finished pipe length is the same as the raw material tape length, and its edge rebounds after stretching. Given that the rebound elastic deformation is zero, the elastic stress eventually reduces to zero. By increasing the length of the interval where the maximum elastic strain occurs, the maximum forming stress is reduced, the force on the tape during the forming process is improved, and the forming quality is enhanced. The bottom line of the tape forming, which is located in the middle of the tape, is only slightly affected by longitudinal stretching, and the elastic stress during the forming process is generally at a low order of magnitude and only has a slight impact on the overall forming quality.
The distribution of material deformation during the sewing process is shown in Figure 16. Figure 16a shows the material distribution when the sheet initially enters the sewing section. At this time, given that the sheet has not yet been heated to the viscous flow state, the sheet boundary remains linear. Figure 16b shows the material distribution when the sheet has entered the sewing section by 0.2 mm. At this point, due to the heating effect of the welding cavity, the sheet is heated to the viscous flow state, the straight line boundary on the sheet surface is disrupted, and, under the action of fluid viscosity and tension, some materials adhere to the cavity surface as the sheet advances. Figure 16c,d show the material distribution when the sheet has entered the sewing section by 0.4 mm and 0.5 mm, respectively. Under the push of the sheet, the sewing part continues moving forward as a whole, the irregularity of the sheet boundary lines becomes increasingly pronounced without any material breakage, and the sheet remains a continuous entity during the sewing process, thereby confirming the feasibility of the sewing process.

3.3. Optimization of Key Cavity Parameters in the Forming Process

3.3.1. Analysis of the Impact of Forming Method and Tape Thickness on Forming Quality

The load and strain changes in the forming process of different tape thicknesses using the combined bending and circumferential bending methods are illustrated in Figure 17. The load and strain patterns obtained using the combined bending method are similar, with the forming load slowly increasing along with feed distance, rapidly increasing after the feed distance reaches 150 mm, and stabilizing around a certain value after the feed distance reaches about 210 mm. Meanwhile, the maximum forming stress increases along with feed distance and eventually stabilizes. A greater tape thickness corresponds to greater forming load and forming strain. The circumferential bending method shows the same trend as the combined bending method, but the forming load and forming strain are higher under the same tape thickness, thereby hindering the curling process. In this case, the combined bending method is more suitable than the circumferential bending method for the construction of high-quality PEEK-based ultra-long rod components.

3.3.2. Analysis of the Impact of Cavity Length on the Forming Process

To investigate the influence of other process parameters in the integrated bending method, the relationship of the cavity length in the forming area with the maximum forming load and maximum strain is analyzed, as shown in Figure 18. As the length of the cavity deformation zone increases, the maximum forming strain decreases, but the associated benefits become minimal beyond 260 mm. The maximum forming load is essentially unaffected because the required pressure is constant. In consideration of load stability, the diminishing marginal returns of strain reduction, and overall size, a cavity deformation zone length of 210 mm is considered optimal.

3.3.3. Analysis of the Impact of Cavity Clearance on the Forming Process

The influence of different cavity clearances on the forming process is illustrated in Figure 19. Figure 19A shows that the load decreases with increasing clearance under different cavity clearance conditions, and the trend change is approximately similar. To identify the appropriate clearance parameters, when the clearance is 0, Figure 19B,C show that extrusion and friction lead to high loads and large strains. Increasing the clearance improves extrusion, and the load and strain stabilize after exceeding 0.1 mm. Consequently, a cavity clearance of 0.1 mm between the PEEK tape material and the forming die cavity is considered optimal.

3.3.4. Analysis of the Impact of Tape Width on the Forming Process

The impact of different tape widths on the forming process is illustrated in Figure 20. When the clearance is 0, increasing the tape width increases the forming load, strain, butt pressure, and constraint pressure but exerts a minimal effect on strain. A wider tape enlarges the butt area, enhances the weld fusion and tube strength, but also increases the load and constraint pressure, thereby reducing efficiency. In consideration of the equipment load and seam requirements, a tape width of 61 mm to 61.5 mm is considered optimal.

3.3.5. Analysis of the Impact of Seam Temperature and Melting Depth

The impact of different seam temperatures on melting depth is depicted in Figure 21. The melting depth increases with temperature, but the rate of increase gradually decelerates due to the low thermal conductivity of PEEK and time constraints. Considering the power capacity of the existing equipment, to deepen the melting and enhance the fusion quality, the seam temperature for subsequent experiments is set at 365 °C.

3.3.6. Analysis of the Impact of Seam Pressure on Melting Depth

The impact of various seam pressures on the melting depth of the tube material is analyzed by plotting the maximum values of melting depth after seam formation, as shown in Figure 22. The seam depth increases with pressure. At the dashed lines in the figure, reaches its maximum at 5 MPa, and then levels off because pressure promotes the intermingling of molten materials. However, beyond a certain value, the unmelted portions provide support that limits the increase in depth. Considering the impact of tape width, a 61 mm wide tape material is selected to optimize the seam pressure parameters.

4. Verification of Roll Forming Load and Forming Quality

4.1. Construction of the Filament Winding Pipe Forming Characteristic Test Platform

To verify the impact of different process parameters on the roll forming quality in finite element analysis, a ground verification test bench is prepared, as shown in Figure 23. This test setup mainly consists of an unwinding device, a traction and pushing device, and a curling forming device. The test procedure includes mold preheating, tape feeding and curling, and seam formation. Considering the complexity of the forming process and its susceptibility to multiple parameters, the test focuses on the impact of feed rate, cavity configuration, and seam temperature on the forming process and quality. During the sewing test, it is necessary to add a sewing die at the exit of the finished pipe to perform the final sewing of the pipe. The sewing die is positioned with the rear die using a flange. The overall forming process uses three temperature control modules to regulate the cavity temperature. The forming section employs two external heating rings to heat the mold in segments, with thermocouples detecting and controlling the temperature distribution of the front and rear dies, respectively. The sewing section uses a heating rod to achieve localized high temperature, causing the materials at the weld to melt and fuse together. To verify the influencing factors for each process parameter, the test scheme is planned and designed as shown in Table 2. This study compares the effects of sheet thickness on forming quality through experiments 1#, 2#, 5#, 12#, and 14#, the effects of cavity patterns on forming quality through experiments 12#, 13#, 14#, and 15#, the effects of feed rate on forming quality through experiments 2#, 3#, and 4#, and the effects of welding temperature on forming quality through experiments 5#, 8#, 9#, 10#, and 11#. It also verifies the reliability of the theoretical models and limited experiments discussed earlier in the text by examining the trends observed.

4.2. Verification Analysis of Temperature Distribution

During the forming process, the PEEK material should be formed under a high-elastic state to improve quality and reduce load. A thermal imaging camera, Fluke TiX580 (Fluke Corporation, Everett, WA, USA), is used to monitor the temperature distribution throughout this process. The tape exhibits a gradient temperature distribution within the cavity, which is mainly controlled by the design of two sets of heating rings. The front mold temperature is set at 180 °C, and the rear mold temperature is set at 270 °C, as shown in Figure 24A. This setup meets the requirements for high-elastic state forming. The low-temperature error between the set and experimental values is 14.4%, and the high-temperature error is 6.67%. The temperature control generally meets the forming requirements. The seam forming mold is heated with a set temperature of 350 °C, as shown in Figure 24B. The highest temperature of the seam forming mold is 350.36 °C, which slightly differs from the set temperature, thereby indicating good temperature control. The overall temperature of the seam forming mold ranges from 33.2 °C to 159.3 °C, with only local high temperatures at the sewing position, which is consistent with the theoretical design of temperature distribution.

4.3. Impact of Cavity Design Parameters on the Forming Process

4.3.1. Curled Effect Analysis

To determine the tape deformation under different cavity constraints and forming qualities, the tape distribution inside the cavity should be examined. However, due to the opacity of the cavity mold, the tape deformation under cavity constraints cannot be directly observed. Therefore, during normal testing, the tape is fed into the cavity to a preset depth (210 mm). Heating is then immediately terminated, and the tape is allowed to cool naturally from the high-elastic state to the glassy state to fix its shape. Afterward, the mold is opened, and a coordinate measuring machine, optical collimator, and cylindrical degree measuring instrument are used to measure the shape and the changes in the shape, straightness, and roundness of the tape inside the cavity, as shown in Figure 25. The analysis focuses on the deformation of the tape’s baseline and cross-section. A reference coordinate system is constructed with the cavity entrance as the origin, and the “downhill amount” of the tape at different positions (i.e., vertical displacement) is measured.
As shown in Figure 26, to quantify and compare the impact of different design parameter cavities on the cross-sectional deformation of the tape, the formed tape is cut at certain lengths, and the displacement distance of the tape edges toward the center at each section is measured. Although various cavity designs lead to specific differences in deformation, the overall deformation pattern of the tape remains consistent; that is, as the tape is fed in, the edges gradually converge toward the center. Compared with the peripheral bending method cavity, the comprehensive bending method cavity has a smaller deviation in the central projection distance (11% and 4%, respectively), and is closer to the simulation prediction results. By comparing the edge curves of the circumferential bending and comprehensive bending methods, the former method shows less edge deformation and lower stress in the front section (0 mm–52 mm). Meanwhile, in the middle section from 52 mm to 195 mm, the edges quickly converge toward the center with a significant deformation and a fast rate, thereby significantly increasing stress. In the end section from 198 mm to 210 mm, the edge positions of these two methods tend to be similar given that the entire process is in a high-elastic state and because the internal stress is similar under the same temperature conditions.

4.3.2. Forming Load Analysis

As shown in Figure 27, the large edge variation rate of the circumferential bending method results in high forming stress and load, and the comprehensive bending method can effectively prevent the weld seam from twisting, thus showing a significant advantage in actual production. The comprehensive bending method has a steady acceleration, while the circumferential bending method is fast at the beginning and slow at the end, thus reflecting a difference in their deformation rates. From the end of forming to the seam section from 210 mm to 270 mm, the load surges due to the tight pressure of the seam mold and the melting and adhesion of the material, and the experimental and simulation load trends are similar. However, the relative error between the experimental forming load and the simulation results is relatively high (more than 15%); the main reason being that, during the forming process, the friction coefficient also changes with the increase in temperature of the strip, while the change in friction coefficient is not considered in the finite element simulation.

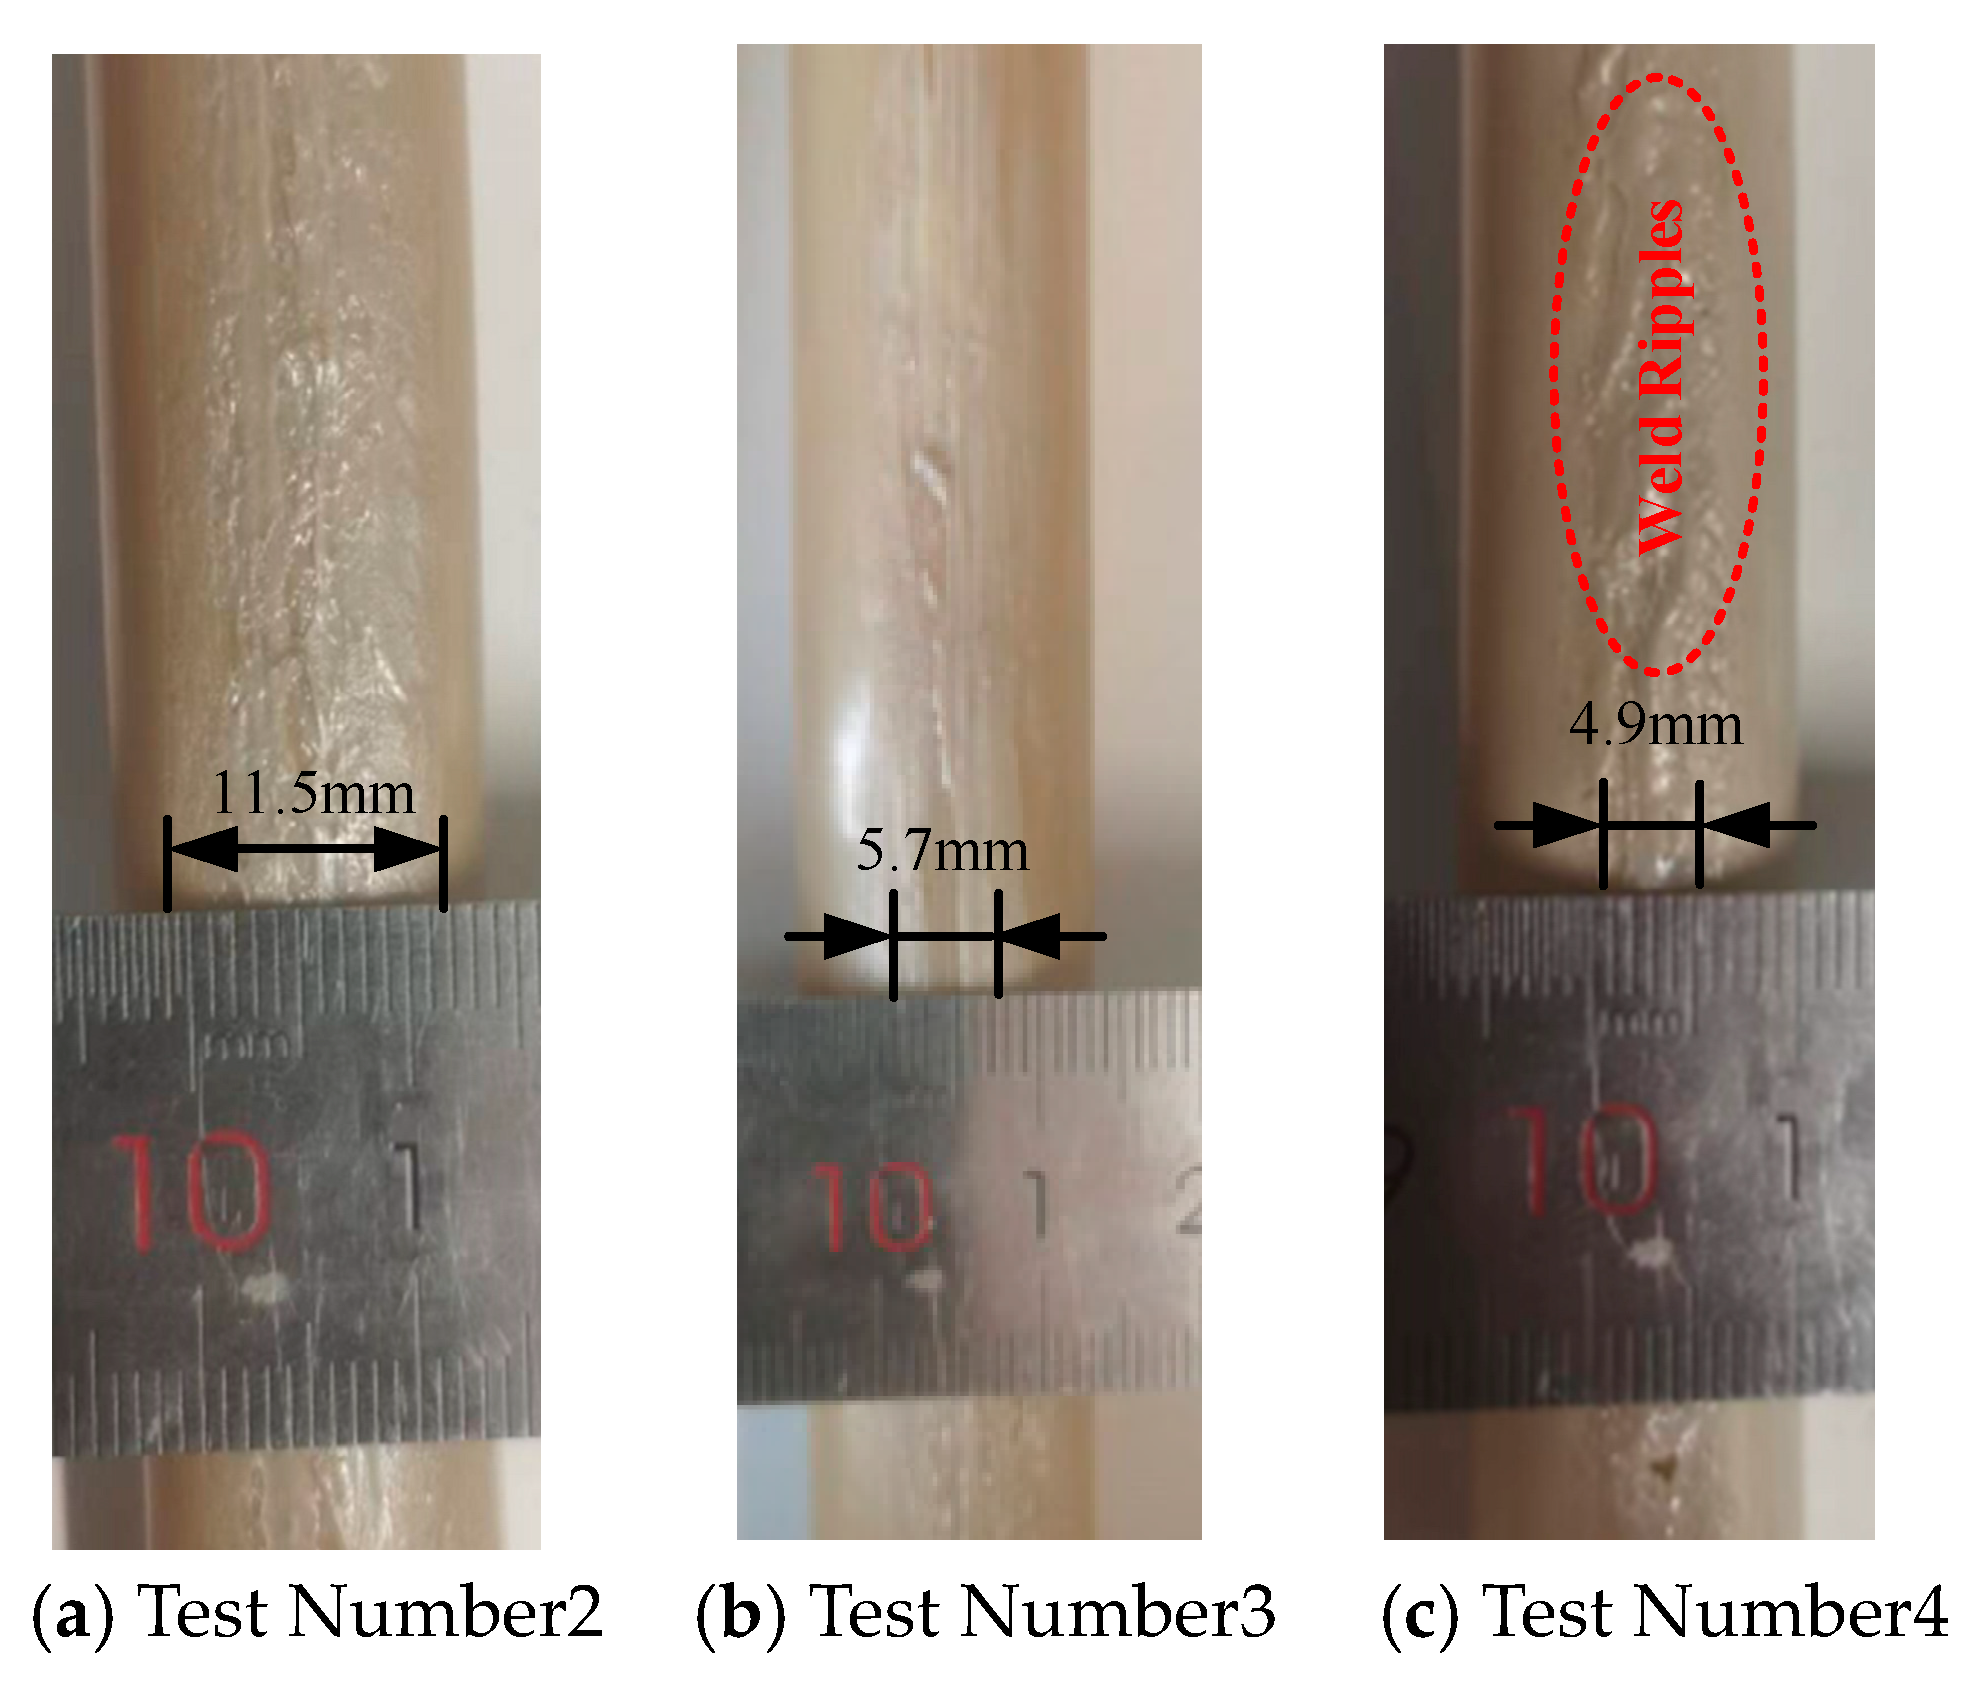
4.4. Impact of Forming Process Parameters on Quality

As shown in Figure 28, the variation in feed rate affects the width of the melting zone: at 1 mm/s, the melting zone is 11.5 mm wide; when increased to 1.3 mm/s, the melting zone narrows to approximately 5.7 mm; further increasing to 1.6 mm/s, although theoretically it should be narrower, slight undulations due to insufficient cooling are observed, resulting in a melting length of 4.9 mm. As depicted in Figure 28, a moderate feed rate is required to balance the width of the melting zone with the forming quality, and after comprehensive consideration, a feed rate of 1.3 mm/s is selected as the optimal speed. Estimation based on the principle of volume equivalence, processing a tube with a length of 300 mm, a diameter of 20 mm, and a wall thickness of 1 mm at this speed takes only 230.77 s, whereas 3D printing [19] under the same conditions requires 10,295.08 s. This represents nearly a 45-fold advantage in efficiency, which is particularly crucial for the in situ manufacturing of large spatial structures in space.
The impact of seam temperature on the forming process and the quality of the formed product is explored, with the experimental results shown in Figure 29. The seam temperature significantly affects the quality of the seam in the tube material. When the temperature is set to 325 °C, an unsealed area is observed due to insufficient temperature. At 335 °C, the stitching quality is excellent, with the weld being uniform and smooth. At 340 °C, the melting area expands, and granular protrusions and flat surfaces appear at the weld, with an increase in roundness error. At 350 °C, excessive melting leads to holes and significant depressions. However, under the same conditions, the minimum temperature for additive manufacturing of PEEK material is 390 °C [29,30]. Therefore, compared with additive manufacturing, the method used in this study generates less heat, making it more suitable for material processing in the vacuum environment of on-orbit conditions.
As shown in Figure 30, the influence of seam temperature on the welding area, straightness, and roundness of the tube is investigated via an experimental analysis. Figure 31 shows that the width of the welding area increases along with temperature and becomes stable after reaching a certain value. A lower seam temperature corresponds to better roundness and straightness of the tube and higher tube quality because a lower seam temperature corresponds to a smaller temperature difference in the cross-sectional direction of the tube material after seam formation, thereby resulting in lower thermal stress and internal stress after cooling and increasing the roundness and straightness errors of the tube. When the component is machined to a length of 300 mm, the seam temperature is set to 335 °C, at which the straightness error of the tube material is 0.013 ± 0.005 mm and the roundness error is 0.19 ± 0.07 mm. Under the same conditions, the processing precision of the roll forming process is comparable to that of 3D printing [31] and pultrusion [32] under terrestrial conditions (3D printing: roundness error of 0.05 to 0.25 mm; pultrusion: roundness deviation of 0.07 to 0.21 mm). However, the cooling and curing efficiency of the tube material after roll forming is significantly higher than that of 3D printing and pultrusion. The above temperature detection error is ±5 °C. This is particularly important for the advancement of rapid forming technologies for large structures.

5. Conclusions

This study designs and verifies the process parameters for the continuous roll forming method of PEEK rod components. The key conclusions are summarized as follows:
(1)
A continuous roll forming scheme for PEEK rod components aimed at in-orbit manufacturing is proposed. By controlling the temperature gradient and designing the continuous deformation surface cavity, the material properties of PEEK tape are matched with the forming process. The cavity section and baseline configuration parameters are determined through scheme selection.
(2)
A simulation analysis model of the continuous roll forming and stitching process for the structure of PEEK rod components is established. The impact of the cavity and tape configuration parameters on the forming process is analyzed. The combined bending method is more effective in controlling material deformation compared with the circumferential bending method. Increasing the length of the cavity deformation zone can effectively reduce the maximum strain of the PEEK tape, and its forming load fluctuates within a certain range. Reducing the gap between the tape and the cavity will significantly increase the forming load, and increasing the width and thickness of the tape will increase the forming load and strain. When the rod diameter is 20 mm, selecting a cavity deformation zone length of 210 mm, cavity gap of 0.1 mm, and plate width of 61 mm can improve the rod forming quality.
(3)
The influence of the forming process parameters on the roundness and straightness of the tube material is verified. Increasing the feed rate and welding temperature reduces the roundness and straightness of the rod components to some extent. Experimental results show that the rod forming quality can be improved by using the “combined bending section + downhill baseline” with a feed rate of 1 mm/s and cavity starting, cavity midpoint, and stitching temperatures of 173 °C, 242 °C, and 343 °C, respectively.

Author Contributions

P.L.: conceptualization, methodology, data curation, writing—original draft, editing, supervision, writing—review and editing. S.T.: formal analysis, conceptualization, writing—original draft, visualization and validation. Y.D.: investigation, writing—original draft, writing—review and editing. J.Y.: methodology. L.Z.: funding acquisition. All authors have read and agreed to the published version of the manuscript.

Funding

This work was funded by the Science Research Project of Hebei Education Department (CXY2023015), the Basic Innovation and Scientific Research Cultivation Project of Yanshan University (2023LGZD005), the “Thirteenth Five-Year” Science and Technology Project of Jilin Provincial Department of Education (JJKH20200036KJ).

Data Availability Statement

The original contributions presented in this study are included in the article, further inquiries can be directed to the corresponding authors.

Conflicts of Interest

Authors Jiayong Yan and Lixin Zhang were employed by the company Beijing Spacecraft Manufacturing Co., Ltd. The remaining authors declare that the research was conducted in the absence of any commercial or financial relationships that could be construed as a potential conflict of interest.

References

  1. Jiayong, Y.; Baorong, L.; Kai, Y.; Hanliang, L.; Bin, Z.; Lixin, Z.; Cunyi, W. Research of Materials and Manufacturing Technology System for on-Orbit Manufacturing. E3S Web Conf. 2023, 385, 1015. [Google Scholar] [CrossRef]
  2. Yan, Y.; Li, J.; Huang, H.; Wang, C.; Li, P.; Mei, J.; Cheng, B.; Zhang, D. Design and Investigation of Flexible Solar Wing: In-Plane Dynamics. Int. J. Mech. Sci. 2024, 283, 109673. [Google Scholar] [CrossRef]
  3. Son, M.Y.; Chae, B.G.; Sung, H.M.; Oh, H.U. Numerical Investigation on the Thermal Characteristics of Lightweight Metal Mesh-Based Reflector Antenna with various Knitting Conditions. Aerospace 2024, 11, 780. [Google Scholar] [CrossRef]
  4. Qi, R.; Wang, L.; Zhou, X.; Xue, J.; Jin, J.; Yuan, L.; Shen, Z.; Deng, G. Embedded Piezoelectric Actuation Method for Enhanced Solar Wings Vibration Control. Int. J. Mech. Sci. 2024, 274, 109271. [Google Scholar] [CrossRef]
  5. Yu, Y.; Fu, T.; Wang, S.; Yang, C. Dynamic Response of Novel Sandwich Structures with 3D Sinusoid-Parallel-Hybrid Honeycomb Auxetic Cores: The Cores Based on Negative Poisson’s Ratio of Elastic Jump. Eur. J. Mech. A Solids 2025, 109, 105449. [Google Scholar] [CrossRef]
  6. Jorgensen, G.; Bains, E. SRMS History, Evolution and Lessons Learned. In Proceedings of the AIAA SPACE 2011 Conference & Exposition, Long Beach, CA, USA, 27–29 September 2011; pp. 3–5. [Google Scholar]
  7. Stieber, E.M.; Hunter, G.D.; Abramovici, A. Overview of the Mobile Servicing System for theInternational Space Station. Artif. Intell. Robot. Autom. Space 1999, 440, 37. [Google Scholar]
  8. Xie, C.; Zhang, E.; Yan, B.; Gao, F.; Yang, J.; Fang, G.; Wang, Z. Configuration Design and Verification of Space Deployable Membrane Array Antenna. J. Mech. Eng. 2024, 60, 11–19. [Google Scholar]
  9. Han, J.; Yang, X.; Ma, X. A System and Method for Cold and Hot Compound Forming of Spiral Ducts with a Biting Mechanism. Patent CN114101375B, 27 September 2024. [Google Scholar]
  10. Li, Z.H.; Han, J.T.; Zhang, Y.F.; Lu, R.L. Continuous Stretch Bending Forming Equipment for One-Dimensional Linear Reel-Type Boom Used in Aerospace. Forg. Stamp. Technol. 2022, 47, 208–215. [Google Scholar] [CrossRef]
  11. Fish, J. Preface: Revolutionizing Engineering Practice Bymultiscale Methods. Int. J. Multiscale Comput. Eng. 2021, 19, v–vi. [Google Scholar] [CrossRef]
  12. Chen, J.; Chen, B. Progress in Additive Manufacturing of Magnesium Alloys: A Review. Materials 2024, 17, 3851. [Google Scholar] [CrossRef]
  13. Anil Kumar, V.; Gupta, R.K.; Prasad, M.J.N.V.; Narayana Murty, S.V.S. Recent Advances in Processing of Titanium Alloys and Titanium Aluminides for Space Applications: A Review. J. Mater. Res. 2021, 36, 689–716. [Google Scholar] [CrossRef]
  14. Wang, Z.; Chen, X.; Chen, X.; Liang, J.; Zeng, D.; Gan, Y. Effect of Moisture Content in Polyether-Ether-Ketone (PEEK) Filament on 3D Printed Parts. SN Appl. Sci. 2024, 6, 394. [Google Scholar] [CrossRef]
  15. Francis, J.N.; Banerjee, I.; Chugh, A.; Singh, J. Additive Manufacturing of Polyetheretherketone and its Composites: A Review. Polym. Compos. 2022, 43, 5802–5819. [Google Scholar] [CrossRef]
  16. Chen, Y.; Shan, Z.; Yang, X.; Song, Y.; Zou, A. Preparation of CCF/PEEK Filaments Together with Property Evaluation for Additive Manufacturing. Compos. Struct. 2022, 281, 114975. [Google Scholar] [CrossRef]
  17. Khatri, B.; Roth, M.F.; Balle, F. Ultrasonic Welding of Additively Manufactured PEEK and Carbon-Fiber-Reinforced PEEK with Integrated Energy Directors. J. Manuf. Mater. Process. 2023, 7, 2. [Google Scholar] [CrossRef]
  18. Xia, Y.; Jiang, L.; Chen, Y.; Zhao, Y.; Yang, L.; Ge, D. Bidirectional-Reinforced Carbon Fiber/Polyether-Ether-Ketone Composite Thin-Walled Pipes Via Pultrusion-Winding for on-Orbit Additive Manufacturing. Materials 2024, 17, 293. [Google Scholar] [CrossRef]
  19. Geng, P.; Zhao, J.; Wu, W.; Ye, W.; Wang, Y.; Wang, S.; Zhang, S. Effects of Extrusion Speed and Printing Speed on the 3D Printing Stability of Extruded PEEK Filament. J. Manuf. Process. 2019, 37, 266–273. [Google Scholar] [CrossRef]
  20. Oladapo, B.I.; Zahedi, S.A.; Ismail, S.O.; Omigbodun, F.T. 3D Printing of PEEK and its Composite to Increase Biointerfaces as a Biomedical Material—A Review. Colloids Surf. B Biointerfaces 2021, 203, 111726. [Google Scholar] [CrossRef] [PubMed]
  21. Lapointe, F.; Lebel, L.L. Fiber Damage and Impregnation during multi-die Vacuum Assisted Pultrusion of carbon/PEEK Hybrid Yarns. Polym. Compos. 2019, 40, E1015–E1028. [Google Scholar] [CrossRef]
  22. Lee, Y.; Park, S.; Byun, C.; Lee, S.-K. Liquid Cooling of Laser-Driven Head Light Employing Heat Spreader Manufactured by 3D Metal Printing. Int. J. Precis. Eng. Manuf. -Green Technol. 2018, 5, 295–301. [Google Scholar] [CrossRef]
  23. Yang, X.; Sun, S.; Zhou, Z.; Chen, X.; Chen, G. Continuous Extrusion Forming Technology of Magnesium Alloy Thin-Walled Tubules. Materials 2023, 16, 5803. [Google Scholar] [CrossRef] [PubMed]
  24. Cao, J.; Wang, X.; Ruan, K.; Cheng, J.; Wei, Z.; Zhao, R. Numerical Simulation Research on UDF Flexible Roll Forming of Multi-Specification Thin-Walled Circular Tubes. Int. J. Adv. Manuf. Technol. 2023, 127, 4503–4517. [Google Scholar] [CrossRef]
  25. Åström, B.T.; Larsson, P.H.; Pipes, R.B. Development of a facility for pultrusion of thermoplastic-matrix composites. Compos. Manuf. 1991, 2, 114–123. [Google Scholar] [CrossRef]
  26. Cao, G.F. Re-understanding of the Baseline for Uphill Forming in High-Frequency Longitudinal Welded Pipe. Steel Pipe 2018, 47, 59–63. [Google Scholar]
  27. Ye, L.; Friedrich, K.; Cutolo, D.; Savadori, A. Manufact. of CF/PEEK composites from powder/sheath fibre preforms. Compos. Manuf. 1994, 5, 41–50. [Google Scholar] [CrossRef]
  28. Jin, S.Z. Structural Design of CCF/PEEK Composite Tubes and Simulation Study on the Extrusion Process of PEEK Sheets; Jilin University: Changchun, China, 2020. [Google Scholar] [CrossRef]
  29. Pulipaka, A.; Gide, K.M.; Beheshti, A.; Bagheri, Z.S. Effect of 3D Printing Process Parameters on Surface and Mechanical Properties of FFF-Printed PEEK. J. Manuf. Process. 2023, 85, 368–386. [Google Scholar] [CrossRef]
  30. Yang, C.; Tian, X.; Li, D.; Cao, Y.; Zhao, F.; Shi, C. Influence of Thermal Processing Conditions in 3D Printing on the Crystallinity and Mechanical Properties of PEEK Material. J. Mater. Process. Technol. 2017, 248, 1–7. [Google Scholar] [CrossRef]
  31. Sano, J.; Matsuzaki, R. High Accuracy 3D Printing of Composite Materials using CNT Yarns. Compos. Struct. 2023, 325, 117577. [Google Scholar] [CrossRef]
  32. Zhu, C.J.; Nan, F.Q.; Liang, Y. Numerical Simulation of Extrusion Molding of Single—Hole Propellant. Mater. Sci. Forum 2018, 917, 269–275. [Google Scholar]
Figure 1. Comparison of forming plans.
Aerospace 11 00954 g001
Figure 2. In-orbit forming scheme for PEEK-based rod stock materials.
Aerospace 11 00954 g002
Figure 3. Continuous gradient bending cavity for PEEK strip materials.
Aerospace 11 00954 g003
Figure 4. Comparison of formed cross-sectional curves.
Aerospace 11 00954 g004
Figure 5. Comparison of forming baseline schemes.
Aerospace 11 00954 g005
Figure 6. Variation trends of forming die cavity cross-sectional curve and profile curve. (A) Own hill method baseline. (B) Formed cross-sectional curves.
Aerospace 11 00954 g006
Figure 7. Analytical model of arbitrary cross-sectional curve and profile curve for cavity mold. In the figure, point A is the intersection of the section with the baseline. Point B is the tangency point between arc AB and arc BC. Point C is the outer edge point of the strip material. Point D is a point on the line BD, which is parallel to the x-axis. Point E is a point on the tangent line BE.
Aerospace 11 00954 g007
Figure 8. Boundary conditions for the temperature. Distribution gradient within the cavity.
Aerospace 11 00954 g008
Figure 9. Schematic of forming cavity for PEEK-based strip materials.
Aerospace 11 00954 g009
Figure 10. Overall model of the welded portion.
Aerospace 11 00954 g010
Figure 11. Parameter settings for the stitching process.
Aerospace 11 00954 g011
Figure 12. Basis for determining parameters in the stitching process. (A) Sheet butt joint pressure during the coiling forming process. (B) Die temperature distribution during the sewing process.
Aerospace 11 00954 g012
Figure 13. Comparison of PEEK sheet strain in tubing forming under different cavity cross-sections. (A) Circumferential bending method; (B) combined bending method.
Aerospace 11 00954 g013
Figure 14. Variation trend of node displacement with sheet material. (A) Diagram of node coordinates varying with feeding distance. (B) Node position.
Aerospace 11 00954 g014
Figure 15. Variation of node strain during the forming process. (A) Graph of node coordinates varying with feeding distance. (B) Node position.
Aerospace 11 00954 g015
Figure 16. Deformation patterns of sheet materials during the stitching process.
Aerospace 11 00954 g016
Figure 17. Analysis of the influence of sheet thickness on the forming process.
Aerospace 11 00954 g017
Figure 18. Analysis of the influence of different lengths of cavity deformation zones on the forming process.
Aerospace 11 00954 g018
Figure 19. The influence patterns of different cavity clearances on the forming process.
Aerospace 11 00954 g019
Figure 20. Variation patterns of the forming process under different sheet widths.
Aerospace 11 00954 g020
Figure 21. Influence relationship between welding temperature and fusion depth.
Aerospace 11 00954 g021
Figure 22. Influence relationship between welding time and fusion depth.
Aerospace 11 00954 g022
Figure 23. Testing platform for tubing forming characteristics of resin rods.
Aerospace 11 00954 g023
Figure 24. Temperature. Distribution of strip material. (A) Roll forming temperature distribution cloud map. (B) Welding temperature distribution cloud map.
Aerospace 11 00954 g024
Figure 25. Sheet deformation under different cavity conditions. (A) Combined bending method; (B) circumferential bending method.
Aerospace 11 00954 g025
Figure 26. Comparison of sheet forming results. (A) Comprehensive bending method tape deformation diagram for various sections. (B) Circumferential bending method tape deformation diagram for various sections. (C) Comparison of central projection distance.
Aerospace 11 00954 g026
Figure 27. Comparison of forming load.
Aerospace 11 00954 g027
Figure 28. Effect of suture temperature on pipe suture quality.
Aerospace 11 00954 g028
Figure 29. Influence of feed rate on quilting width, straightness, and roundness chart.
Aerospace 11 00954 g029
Figure 30. Comparison of suture effects.
Aerospace 11 00954 g030
Figure 31. Influence of welding temperature on quilting width, straightness, and roundness chart.
Aerospace 11 00954 g031
Table 1. Material parameters of PEEK.
ParameterPhysical QuantityValue RangeUnit
Densityρ1095.8kg/m3
Specific Heat Capacityc2124J/kg °C
Thermal Conductivityk0.321W/m °C
Reference Shear Stressτ0124,139Pa
Coefficient of Thermal Expansionα0.000011/°C
Glass Transition TemperatureTg143°C
Viscous Flow TemperatureTf343°C
Low-Temperature Curling Zone TemperatureT1173–242°C
High-Temperature Curling Zone TemperatureT2242–343°C
Fusion Seam TemperatureT3343°C
Table 2. Comparative experimental parameter design table.
Test NumberTape Thickness (mm)Forming Section CurveFeed Rate (mm/s)Seam Temperature (°C)
11combined bending 1335
20.8combined bending 1335
30.8combined bending 1.3335
40.8combined bending 1.6335
50.6combined bending 1335
60.6combined bending 1.3335
70.6combined bending 1.6335
80.6combined bending 1325
90.6combined bending 1335
100.6combined bending 1340
110.6combined bending 1350
120.4circumferential bending 1335
130.4combined bending 1335
140.2circumferential bending 1335
150.2combined bending 1335
Disclaimer/Publisher’s Note: The statements, opinions and data contained in all publications are solely those of the individual author(s) and contributor(s) and not of MDPI and/or the editor(s). MDPI and/or the editor(s) disclaim responsibility for any injury to people or property resulting from any ideas, methods, instructions or products referred to in the content.

