Article

Optimization of Thermal Management for the Environmental Worthiness Design of Aviation Equipment Using Phase Change Materials

Avic China Aero-Polytechnology Establishment, Beijing 100028, China
*
Author to whom correspondence should be addressed.
Aerospace 2024, 11(11), 943; https://doi.org/10.3390/aerospace11110943
Submission received: 16 August 2024 / Revised: 4 November 2024 / Accepted: 14 November 2024 / Published: 15 November 2024
(This article belongs to the Special Issue Aerospace Human–Machine and Environmental Control Engineering)

Abstract

:
A phase change materials (PCM)-based heat sink is an effective way to cool intermittent high-power electronic devices in aerospace applications such as airborne electronics and aircraft external carry. Optimizing the heat sink is significant in designing a compact and efficient system. This paper proposes an optimization procedure for the PCM/expanded graphite (EG)-based heat sink to minimize the temperature of the heat source. The numerical model is built to estimate the thermal response, and a surrogate model is fitted using the Kriging model. An optimization algorithm is constructed to predict the optimum parameters of the heat sink, and the effects of heat sink volume, heat flux, and working time on the optimal parameters of the heat sink are investigated. This shows that the numerical results agree well with the experimental data, and the proposed optimization method effectively obtains the optimal EG mass fraction and the geometric dimensions of the PCM enclosure. The optimal EG mass fraction increases with the rise in heat sink volume and decreases with the increase in heat flux and working time. The optimal ratio of the height to the length of the heat sink is 0.43. This study provides practical guidance for the optimal design of a PCM/EG-based heat sink.

1. Introduction

Thermal energy storage plays an important role in the thermal management of electronics in aerospace applications such as airborne electronics and aircraft external carry by absorbing heat dissipation [1]. Generally, thermal energy storage is categorized into sensible heat storage, latent heat storage, and thermochemical heat storage [2]. Due to the high energy storage capacity and the ability to absorb and release heat at a near-constant temperature, phase change materials (PCM) are widely used in thermal energy storage, thermal management, and waste heat utilization [3].
The integration level and functionalities of electronic equipment increase rapidly with the fast development of electronic technology, which inevitably leads to large heat dissipation requirements. If the heat cannot be dissipated timely, the temperature of the electronic devices will increase rapidly and result in a rapid decrease in reliability and efficiency [4]. Due to the high energy storage density of PCM can absorb large amounts of heat when melting and PCM-based heat sinks are extensively used in thermal management [5]. For many electronic devices, high-power working conditions are intermittent, such as the IR model of a radar, or the high-power devices working for a short period of time like electronics in rockets and satellites. When electronic devices are working in high-power conditions, PCM can absorb lots of heat in the melting process [6]. When electronic devices are working in low-power conditions or not working, PCM can release heat to the surrounding environment in the solicitation process, maintaining the heat source temperature within a suitable range [7]. In recent years, the application of PCM to control the battery operation temperature has attracted wide attention [8]. Jiang et al. [9] experimentally evaluated the performance of PCM on battery pack thermal management and showed that PCM could significantly reduce battery temperature during the discharge process.
The low thermal conductivity of PCM seriously impedes heat conduction in PCM and reduces their capacity of thermal management. The main measures to enhance the thermal conductivity of PCM are as follows: (1) Doping highly conductive nanoparticles and carbon fibers into PCM [10]. Hasadi. et al. [11] developed a numerical model considering the solid–liquid interface, distribution of the particle concentration, as well as the thermosolutal convection during solidification of colloidal suspensions. This showed that the solid–liquid interface changed its morphology from a planar shape to a dendritic one as the solidification process proceeded. (2) Impregnation of metal foam and expanded graphite (EG) into PCM. The thermal conductivity of PCM is enhanced because metal foam and EG are porous structures and can form fast heat transfer networks. Qu et al. [12] demonstrated that the effect of metal foam on thermal conductivity enhancement exceeded the level of natural convection. Sar et al. [13] proved that EG could remarkably enhance the thermal conductivity of PCM and prevent the leakage of melted PCM. (3) Insertion of high conductive fins or heat pipes. Zhao et al. [14] concluded that when fin pitch increases, the optimal fin length for aluminum fins increases while the opposite is true for a stainless-steel fin under the same condition. (4) Encapsulation of PCM. Zhang et al. [15] proved that the microcapsule shell could provide sufficient surface for PCM to enhance thermal conductivity. Among various thermal conductivity enhancement methods, EG has an ultra-high porosity and a large surface area, and the added EG can effectively adsorb the melted PCM through capillary force [16]. Therefore, by impregnating EG into PCM, the composite can not only significantly enhance the thermal conductivity but also prevent the leakage of liquid PCM, which is essential in electronic thermal management. Consequently, this paper selects the PCM/EG composite for electronic thermal management.
Optimizing the thermal management system is significant in designing a compact and efficient system. However, due to the moving boundary of the solid and liquid PCM, the phase change process exhibits strong nonlinearity, and thus, finding the global optimal design parameters is an important but difficult task. In recent years, many researchers have proposed some optimization methods to obtain the optimal parameters for PCM-based heat sinks.
Khanna et al. [17] presented a simulation study to optimize the PCM heat sink used to cool photovoltaic systems. The variations in the temperature with time for various parameters were calculated and the optimal parameters were concluded. Yang et al. [18] used the numerical method to find the optimal design parameters of the thermal management system. The influence of the geometric dimensions on the performance of the PCM-based heat sink was investigated and the optimal geometric parameters were concluded. Although the optimal designation can be obtained by analyzing the influence of various parameters, the computational costs may exceed the acceptable limits if there are too many parameters. In order to reduce computational costs in solving the optimization problem, Sciacovelli et al. [19] used the response surface method to build a model for a latent thermal storage system. Alayil et al. [20] built a model of PCM-based heat sink using an artificial neural network and obtained the optimized dimensions of the heat sink using a genetic algorithm. Augspurger et al. [21] constructed a response surface using dynamic Kriging and obtained the optimal design points using the direct searching method. Pizzolato et al. [22] presented a topological optimization approach to identify the optimal fin design. This showed that topology optimization can find the optimal design with a thermal resistance reduction of up to 13.6%. Jiang et al. [23] experimentally investigated the thermal performance of the PCM/EG composite and proposed an EG mass fraction between 16% and 20%. Although many attempts have been made, obtaining the optimal objective goal is still time-consuming in the optimization procedure, and it is beneficial to propose an acceptable optimization method to find the optimal parameters of the PCM-based heat sink.
In this paper, an optimization method for the PCM/EG-based heat sink is proposed. The optimization objective is to minimize the average temperature of the heat source. The heat sink model and the numerical model are built, and then the optimization method using the Kriging model is presented. The optimal results and the influence of the heat sink volume, heat flux, and the working time on the optimization results are discussed.

2. Physical Model and Numerical Method

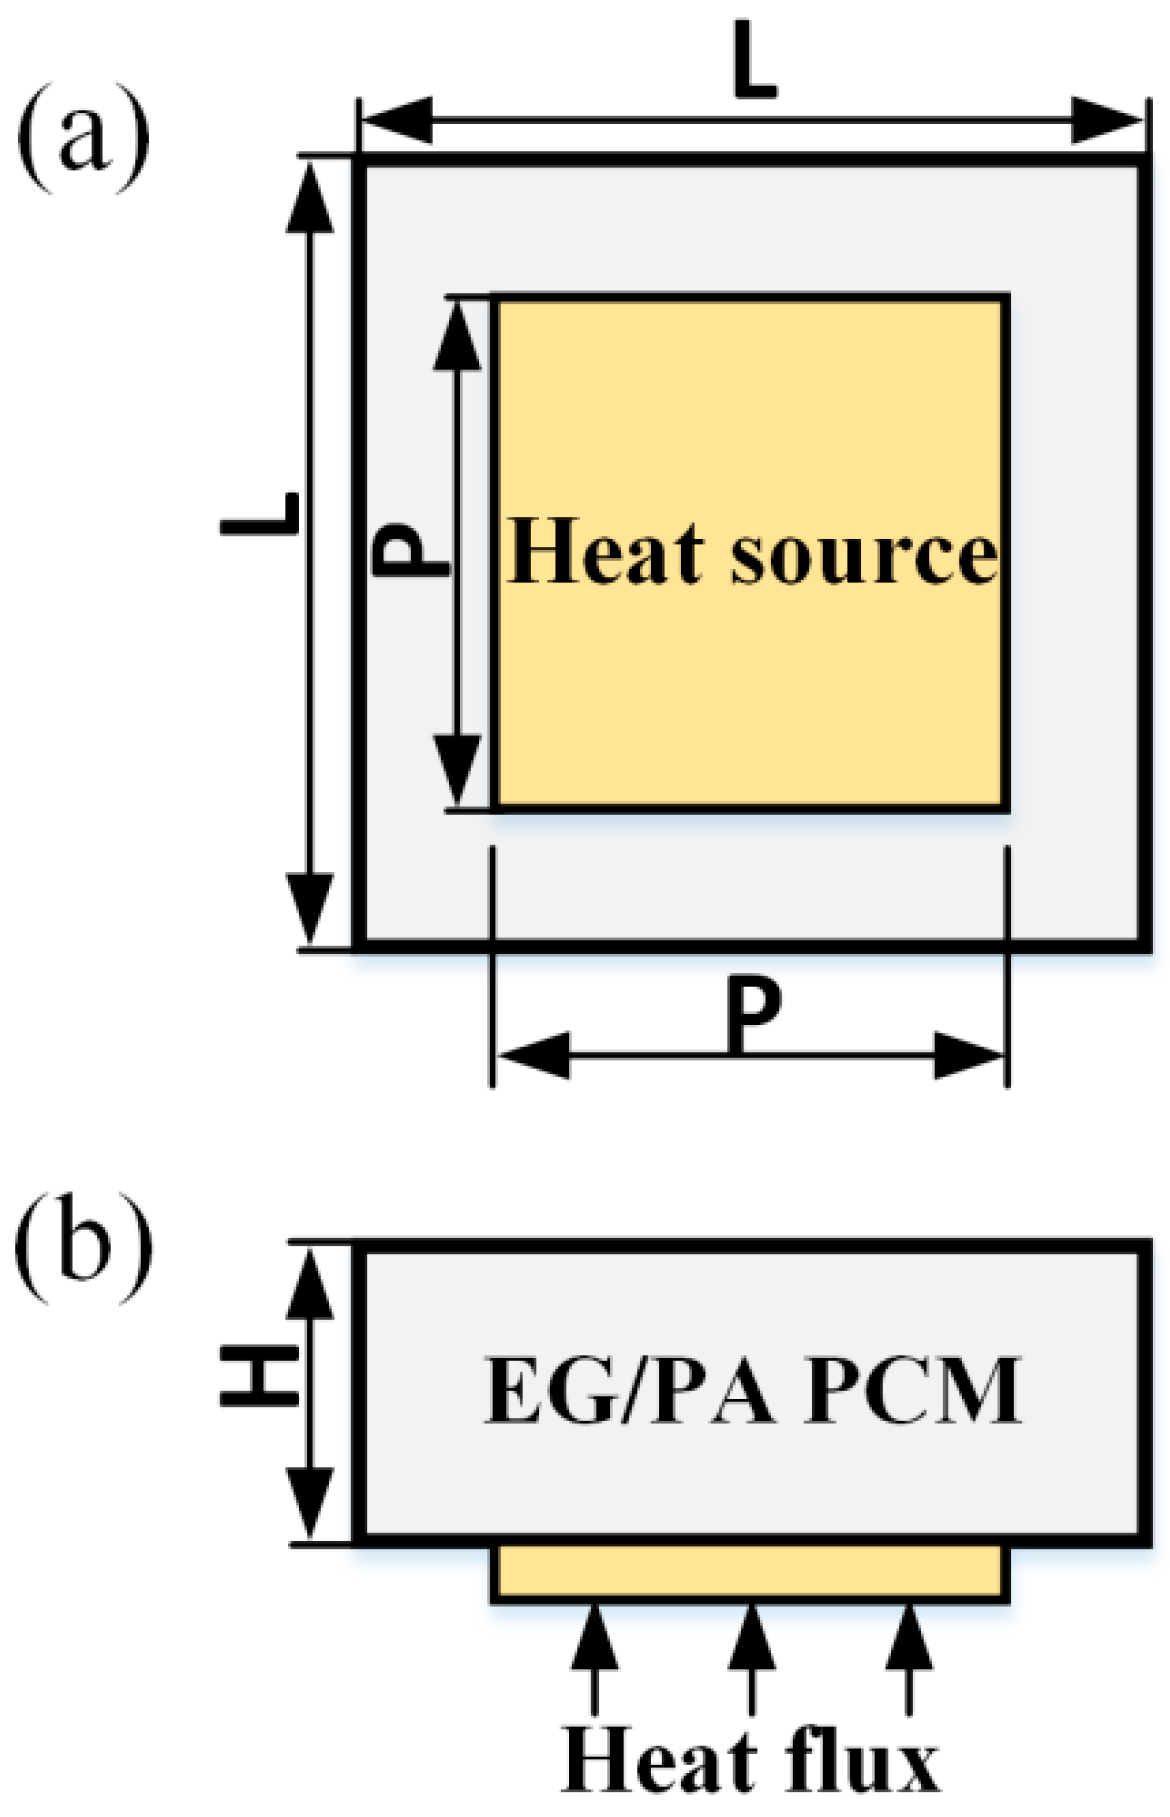
2.1. Physical Model Description

A schematic drawing of the PCM/EG-based heat sink is shown in Figure 1. The heat sink has the shape of cuboid, with a PCM/EG composite-filled interior. The dimensions of the heat sink are H × L × L , where H and L are the height and the side length of the heat sink, respectively. The square heat source is located at the center of the heat source with the side length of P . In this paper, P is set as 5 cm.

2.2. Numerical Model

In the PCM/EG composite, the highly conductive EG is randomly distributed inside the composite and forms a highly conductive network. Since the EG thermal conductivity is much higher than that of PCM; the thermal conductivity of PCM is ignored.
Take a cuboid PCM/EG unit with a cross-section area of A and a height of h as the benchmark. According to Fourier’s law, with the same heat transfer power and temperature gradient d T , the effective thermal conductivity of the composite satisfies the following equation:
q = k c A d T d h
where k c is the thermal conductivity of the PCM/EG composite and A is its cross-section area. The EG mass fraction is expressed as follows:
α = ρ E G ρ c
where ρ E G is the density of EG and ρ c is the density of the composite. According to Equations (1) and (2), the thermal conductivity of the PCM/EG is expressed as follows [5]:
k c = k E G ρ c α ρ E G
Since the predictions of Equation (3) fit well with the experimental data for various ρ c [24] and α [25], this paper uses Equation (3) to predict the thermal conductivity of the PCM/EG composite. The thermal-physical properties of PCM and EG used in this paper are given in Table 1.
The specific heat capacity of the PCM is set as 2 kJ/(kg·K) and the density of the composite is set as 900 kg/m3, considering air bubbles in the composite.
The assumptions of the numerical model are listed as follows: (1) the PCM/EG composite is homogenous and isotropic; (2) the natural convection of liquid PCM is ignored since EG has a porous structure and the motion of the PCM is obstructed; (3) the volume of the PCM/EG is constant during the phase change process.
The energy conservation equation of the PCM/EG composite is expressed as follows:
( ρ c E ) t = k c ( 2 T x 2 + 2 T y 2 + 2 T z 2 )
where t is the time, T is the temperature, and E is the enthalpy, including sensible enthalpy E s and latent heat E l , as follows:
E = E s + E l
The sensible enthalpy can be defined as follows:
E s = E r e f + T r e f T c p d T
where E r e f is the enthalpy at the reference temperature T r e f and c p is the specific heat capacity. The latent heat is expressed as follows:
E l = γ L
where L is the latent heat of the solid PCM and γ is the liquid fraction, which is expressed as follows:
γ = 0   if   T < T s o l i d u s
γ = 1   if   T > T l i q u i d u s
γ = T T s o l i d u s T l i q u i d u s T s o l i d u s   if   T s o l i d u s T T l i q u i d u s
The initial condition is expressed as follows:
T ( x , y , z ) = T 0 ,   t = 0
where T 0 is the initial temperature. In this paper, T 0 is set as 45 °C. The boundary condition at the contact surface between the heat source and the heat sink is as follows:
k c T n = q
where q is the heat flux of the heat source and n is the normal direction. The boundary condition between the heat sink and the environment is adiabatic.
Commercial software ANSYS (2024 R1) is used to solve the numerical model. The iterations are forced to continue until the value of energy residual reaches 10−8, and the time step is adjusted by the software in the range of 0.01 s to 20 s. The numerical model is coded by APDL language, which is a parametric design language in the ANSYS software.
Assuming that the height and the length of the heat sink are 3.5 cm and 6.5 cm, respectively, and the heat flux is 4 W/cm2, the heat source temperature with the grid size of 1 mm, 2 mm, and 3 mm are compared in Figure 2. This shows that there is almost no discrepancy for different grid sizes. Thus, a grid size of 2 mm is implemented.

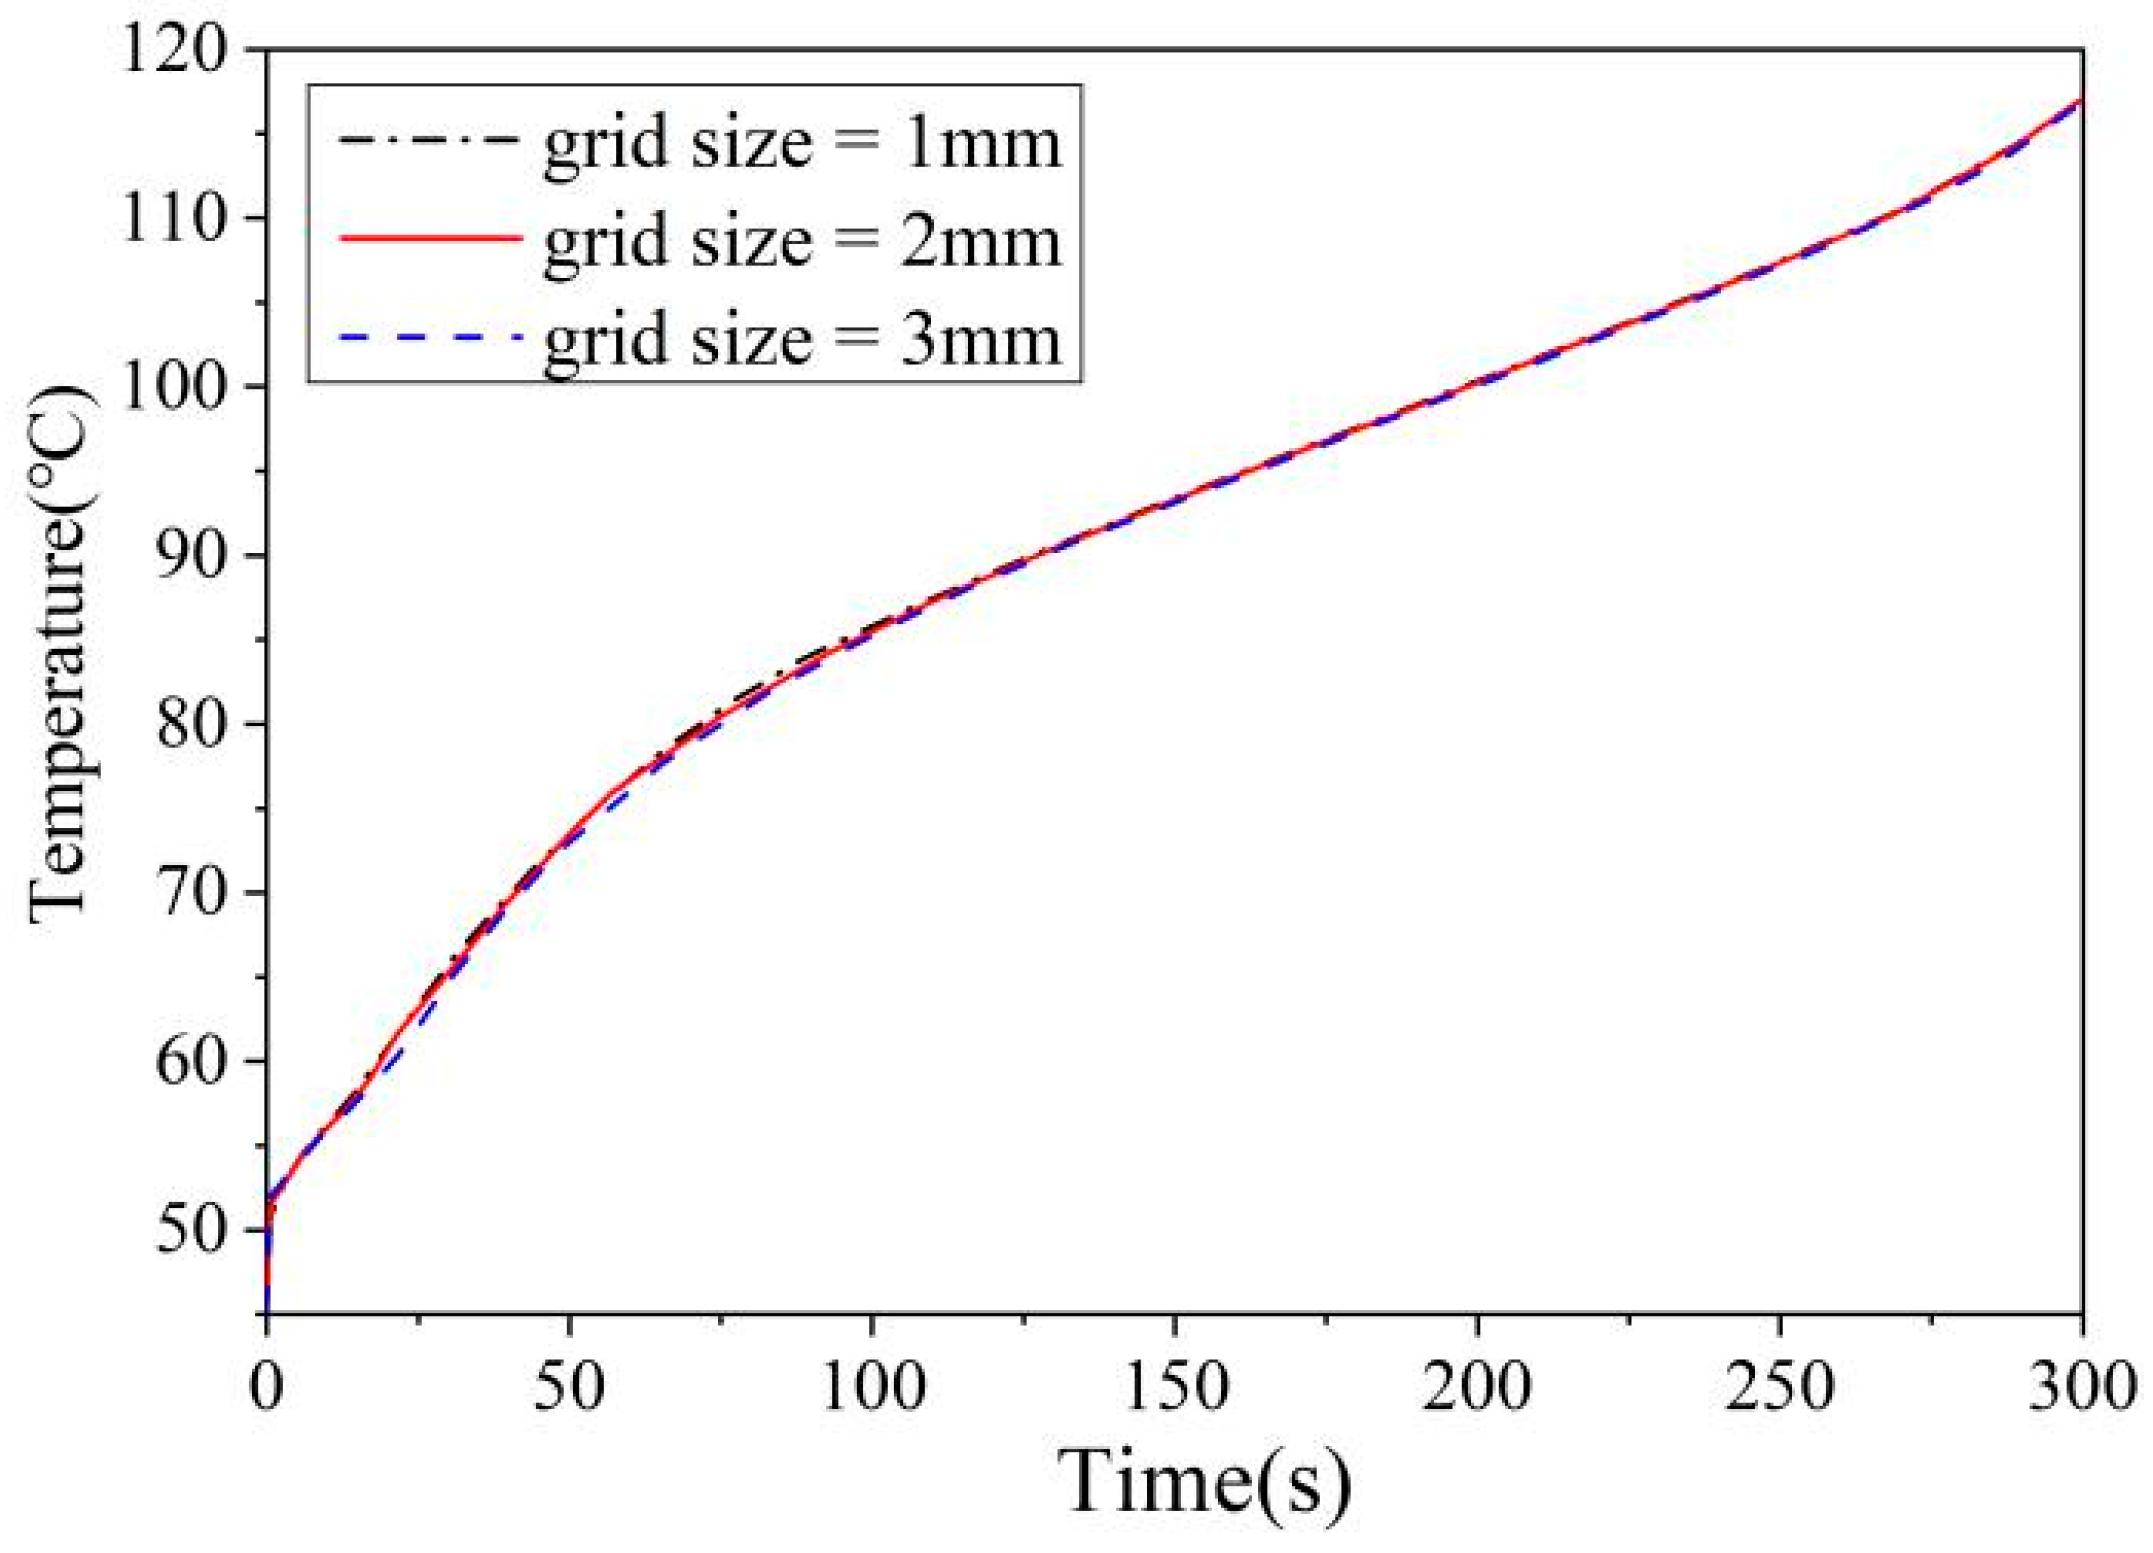
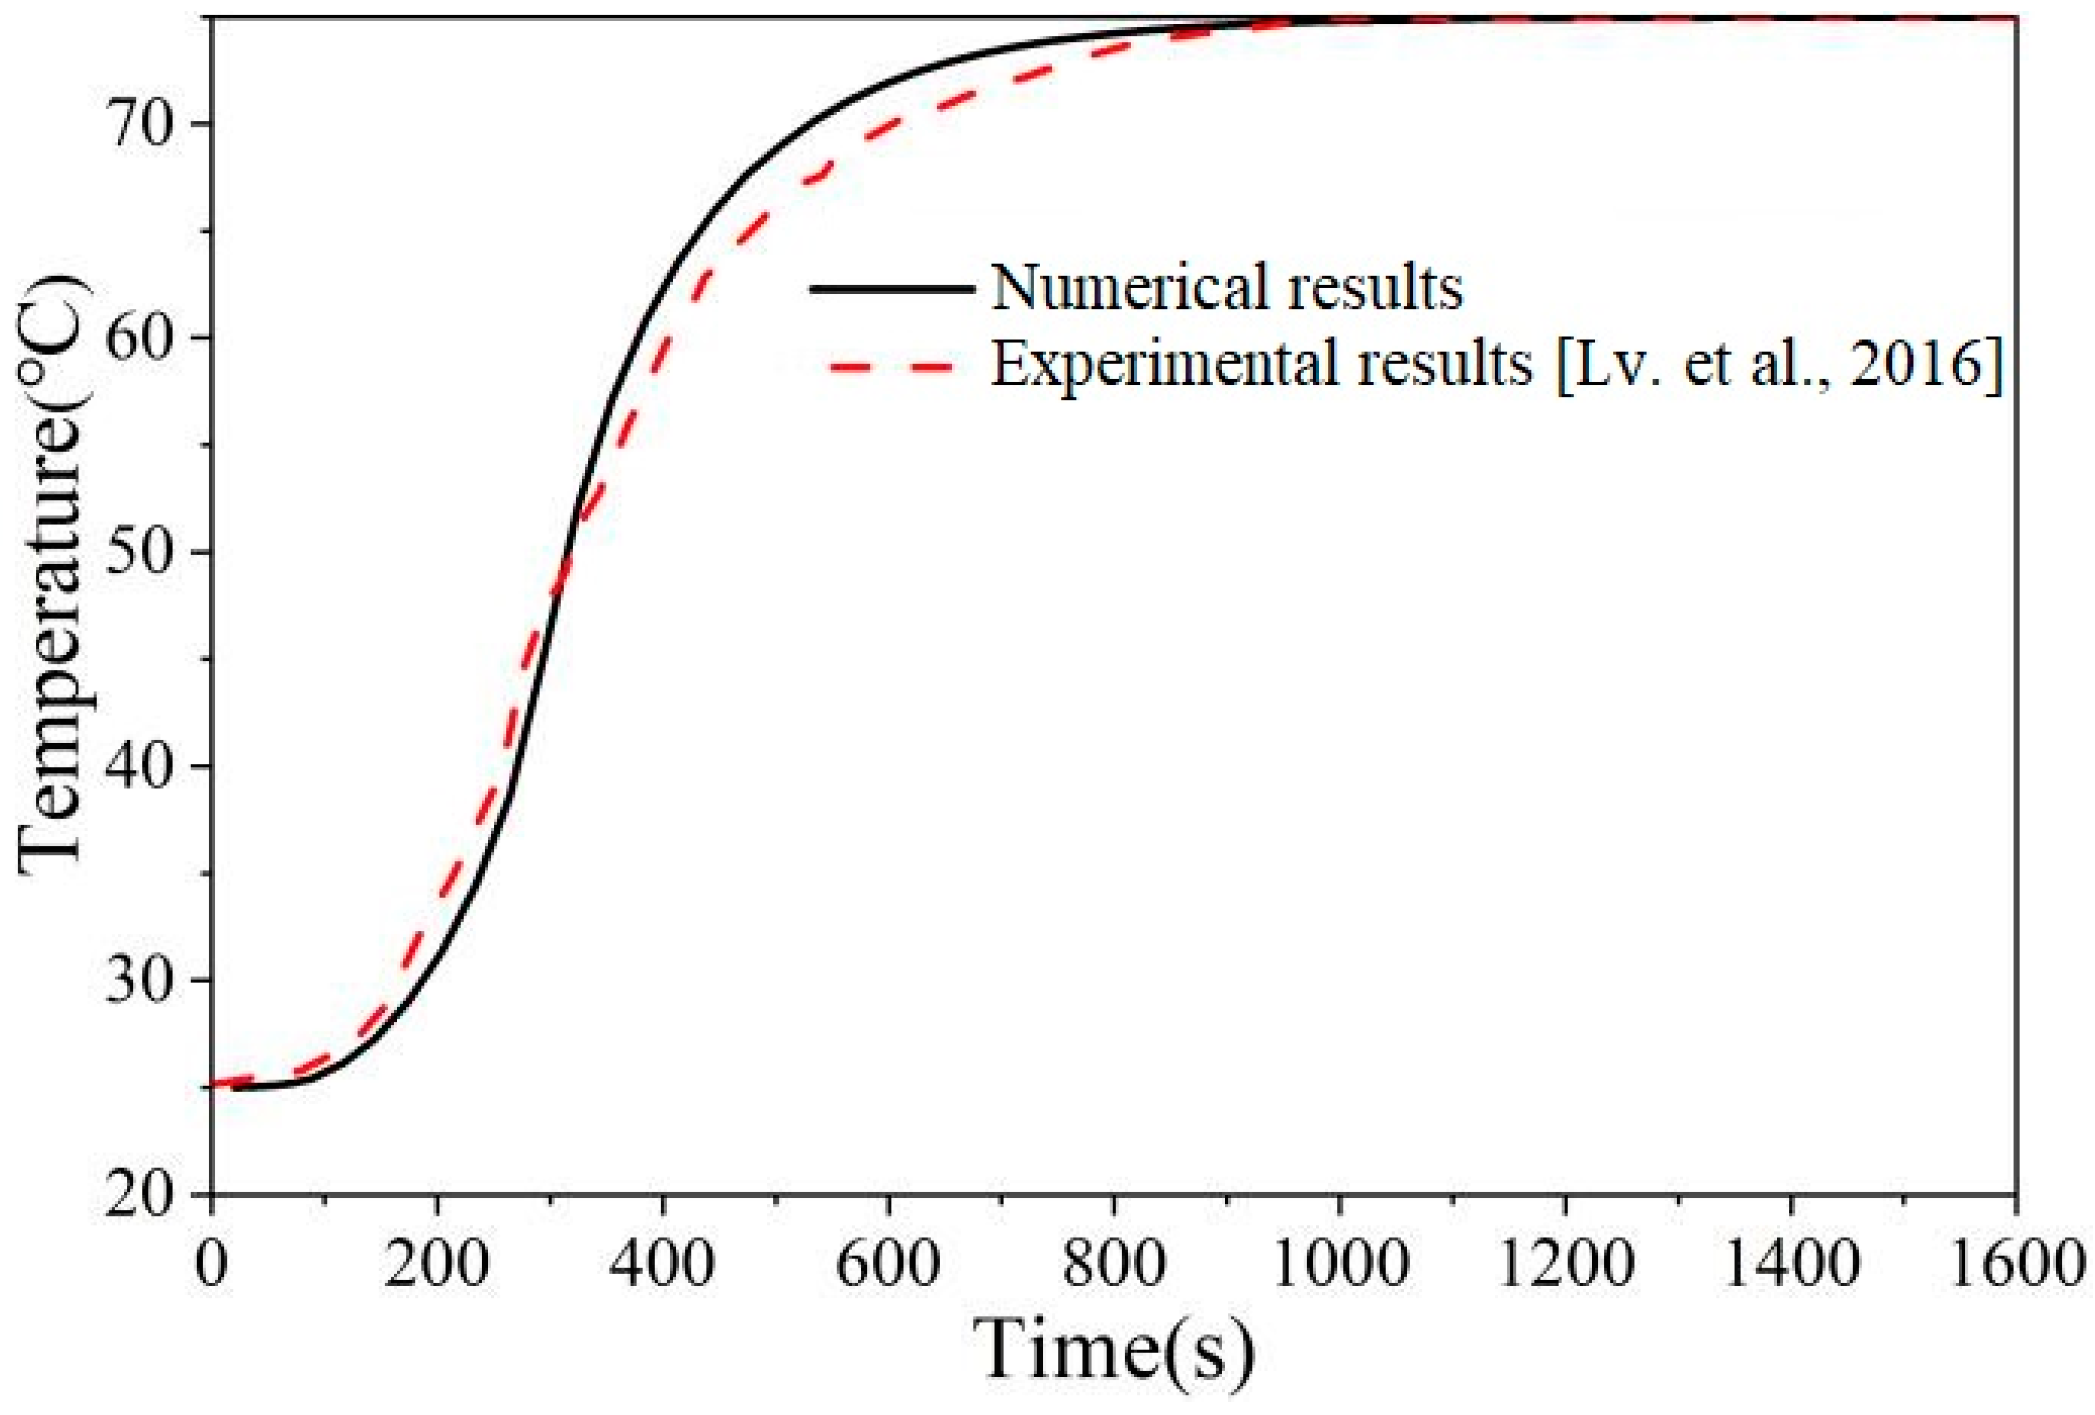
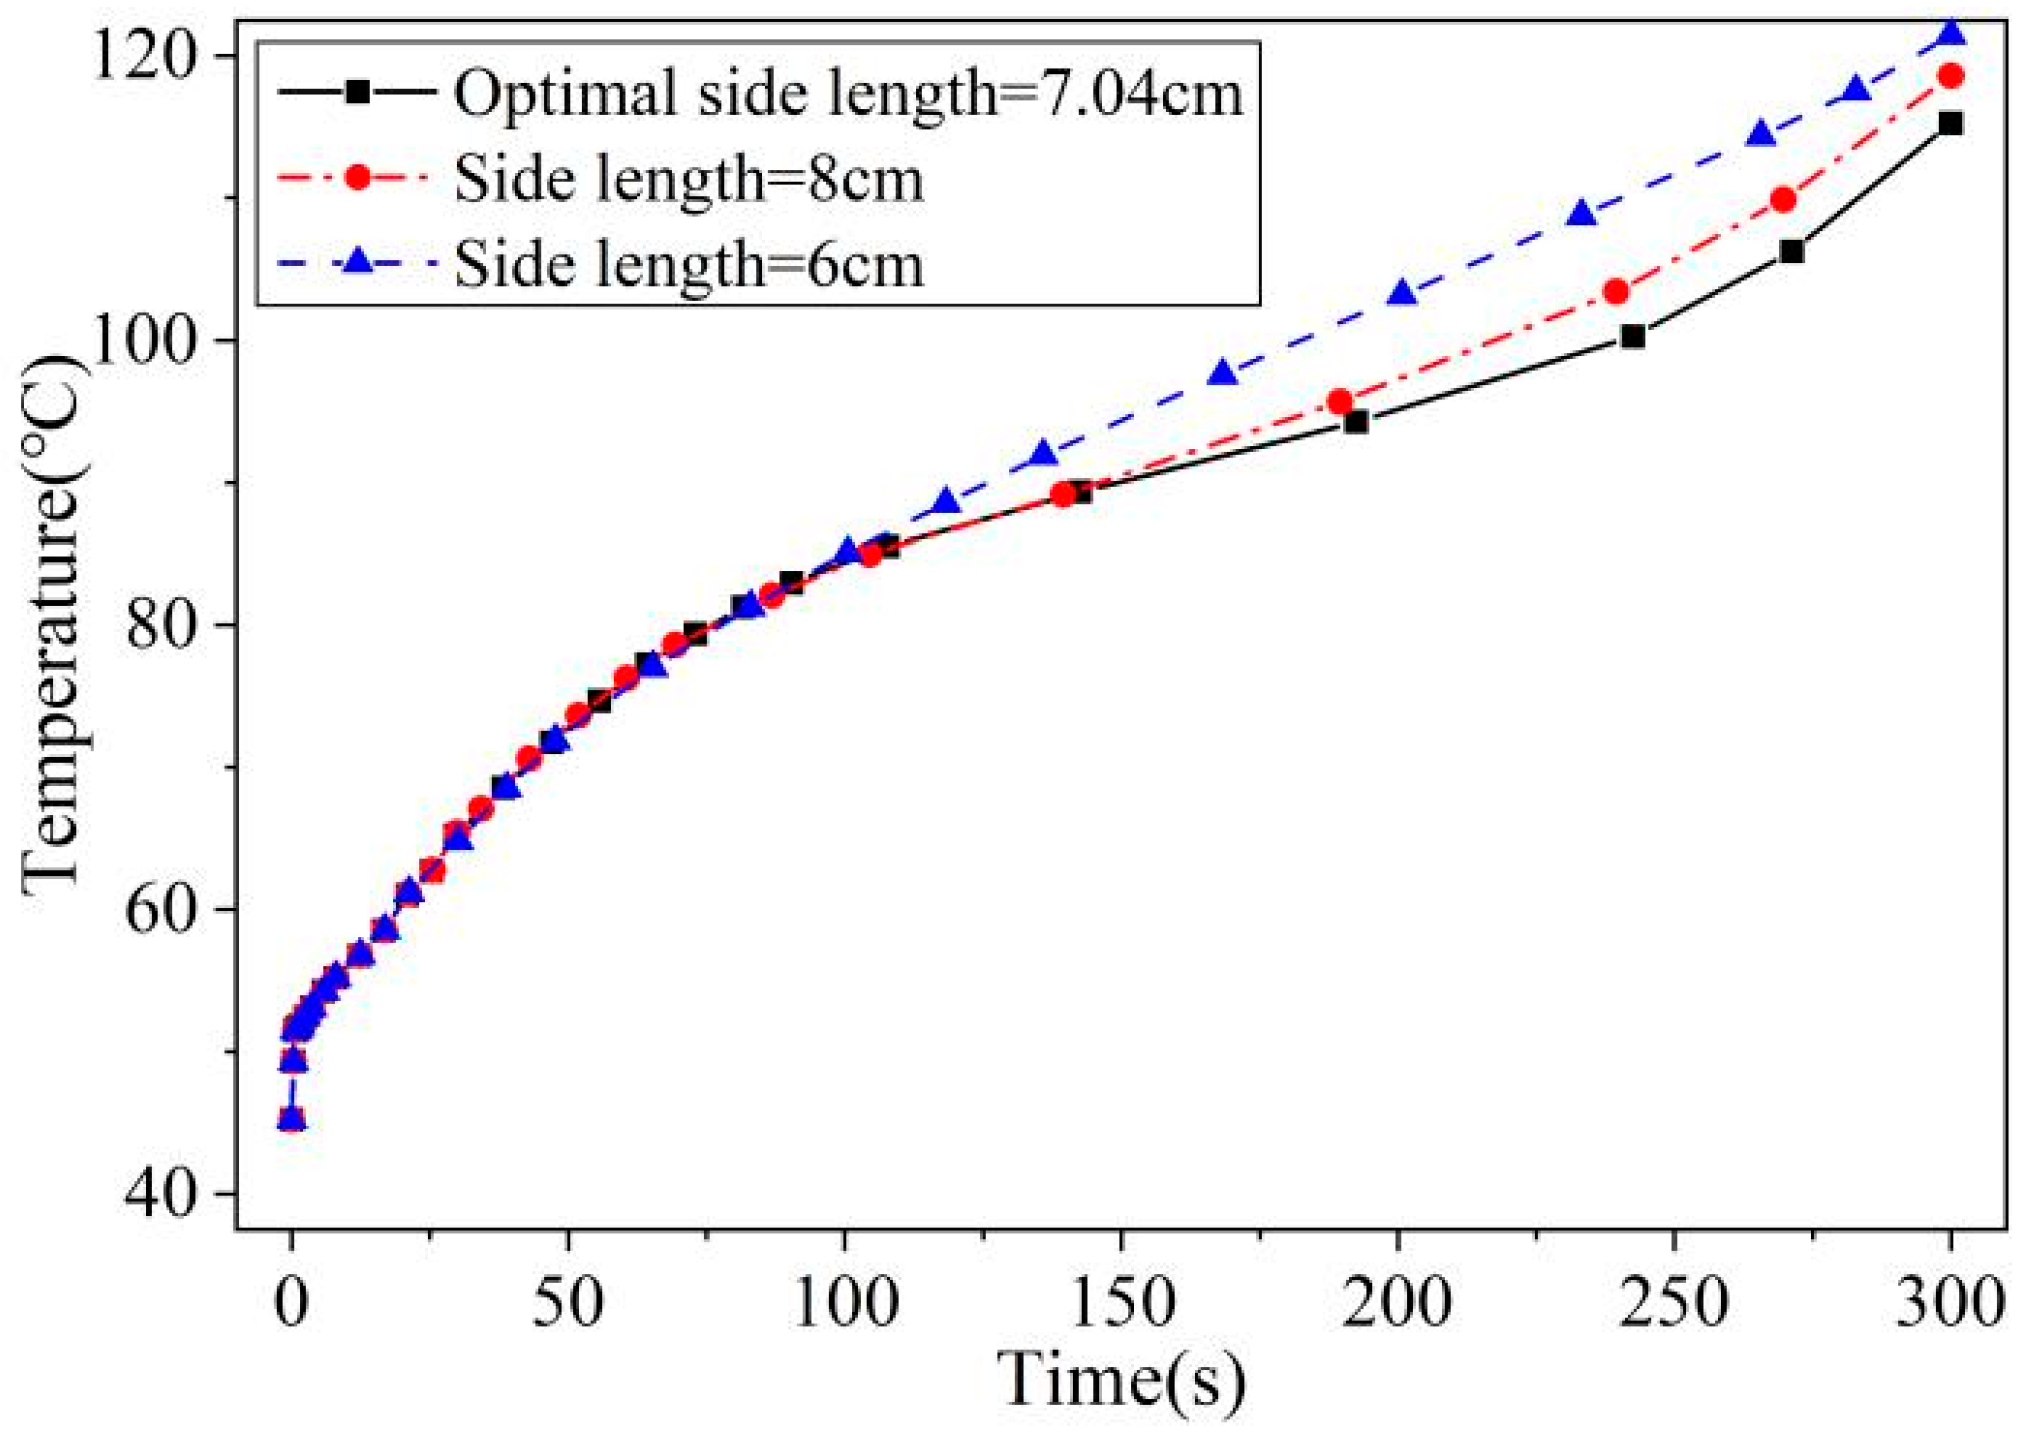
2.3. Model Validation

The comparison of the PCM temperature with time between the numerical results and the experimental data published by Lv et al. [27] is shown in Figure 3. The container with the polyethylene glycol/EG composite filled inside was first kept at 25 °C, it then was put into a hot water bath of 75 °C. Figure 3 shows that the numerical results agree well with the published experimental data, with differences within ±2.5 °C.

3. Optimization Method

3.1. Problem Description

The optimization goal is to minimize the heat source temperature at the end of the working time. The optimization problem is formulated as follows: min T h s ( H , L , α ) at t = t , subject to V = c o n s t and 0 < α 0.5 .
In the optimization problem, T h s ( H , L , α ) represents the temperature of the heat source and t is the working time. The two following constraints should be satisfied:
(1)
The volume of the heat sink is fixed.
(2)
The EG mass fraction α is in the interval [0, 0.5].

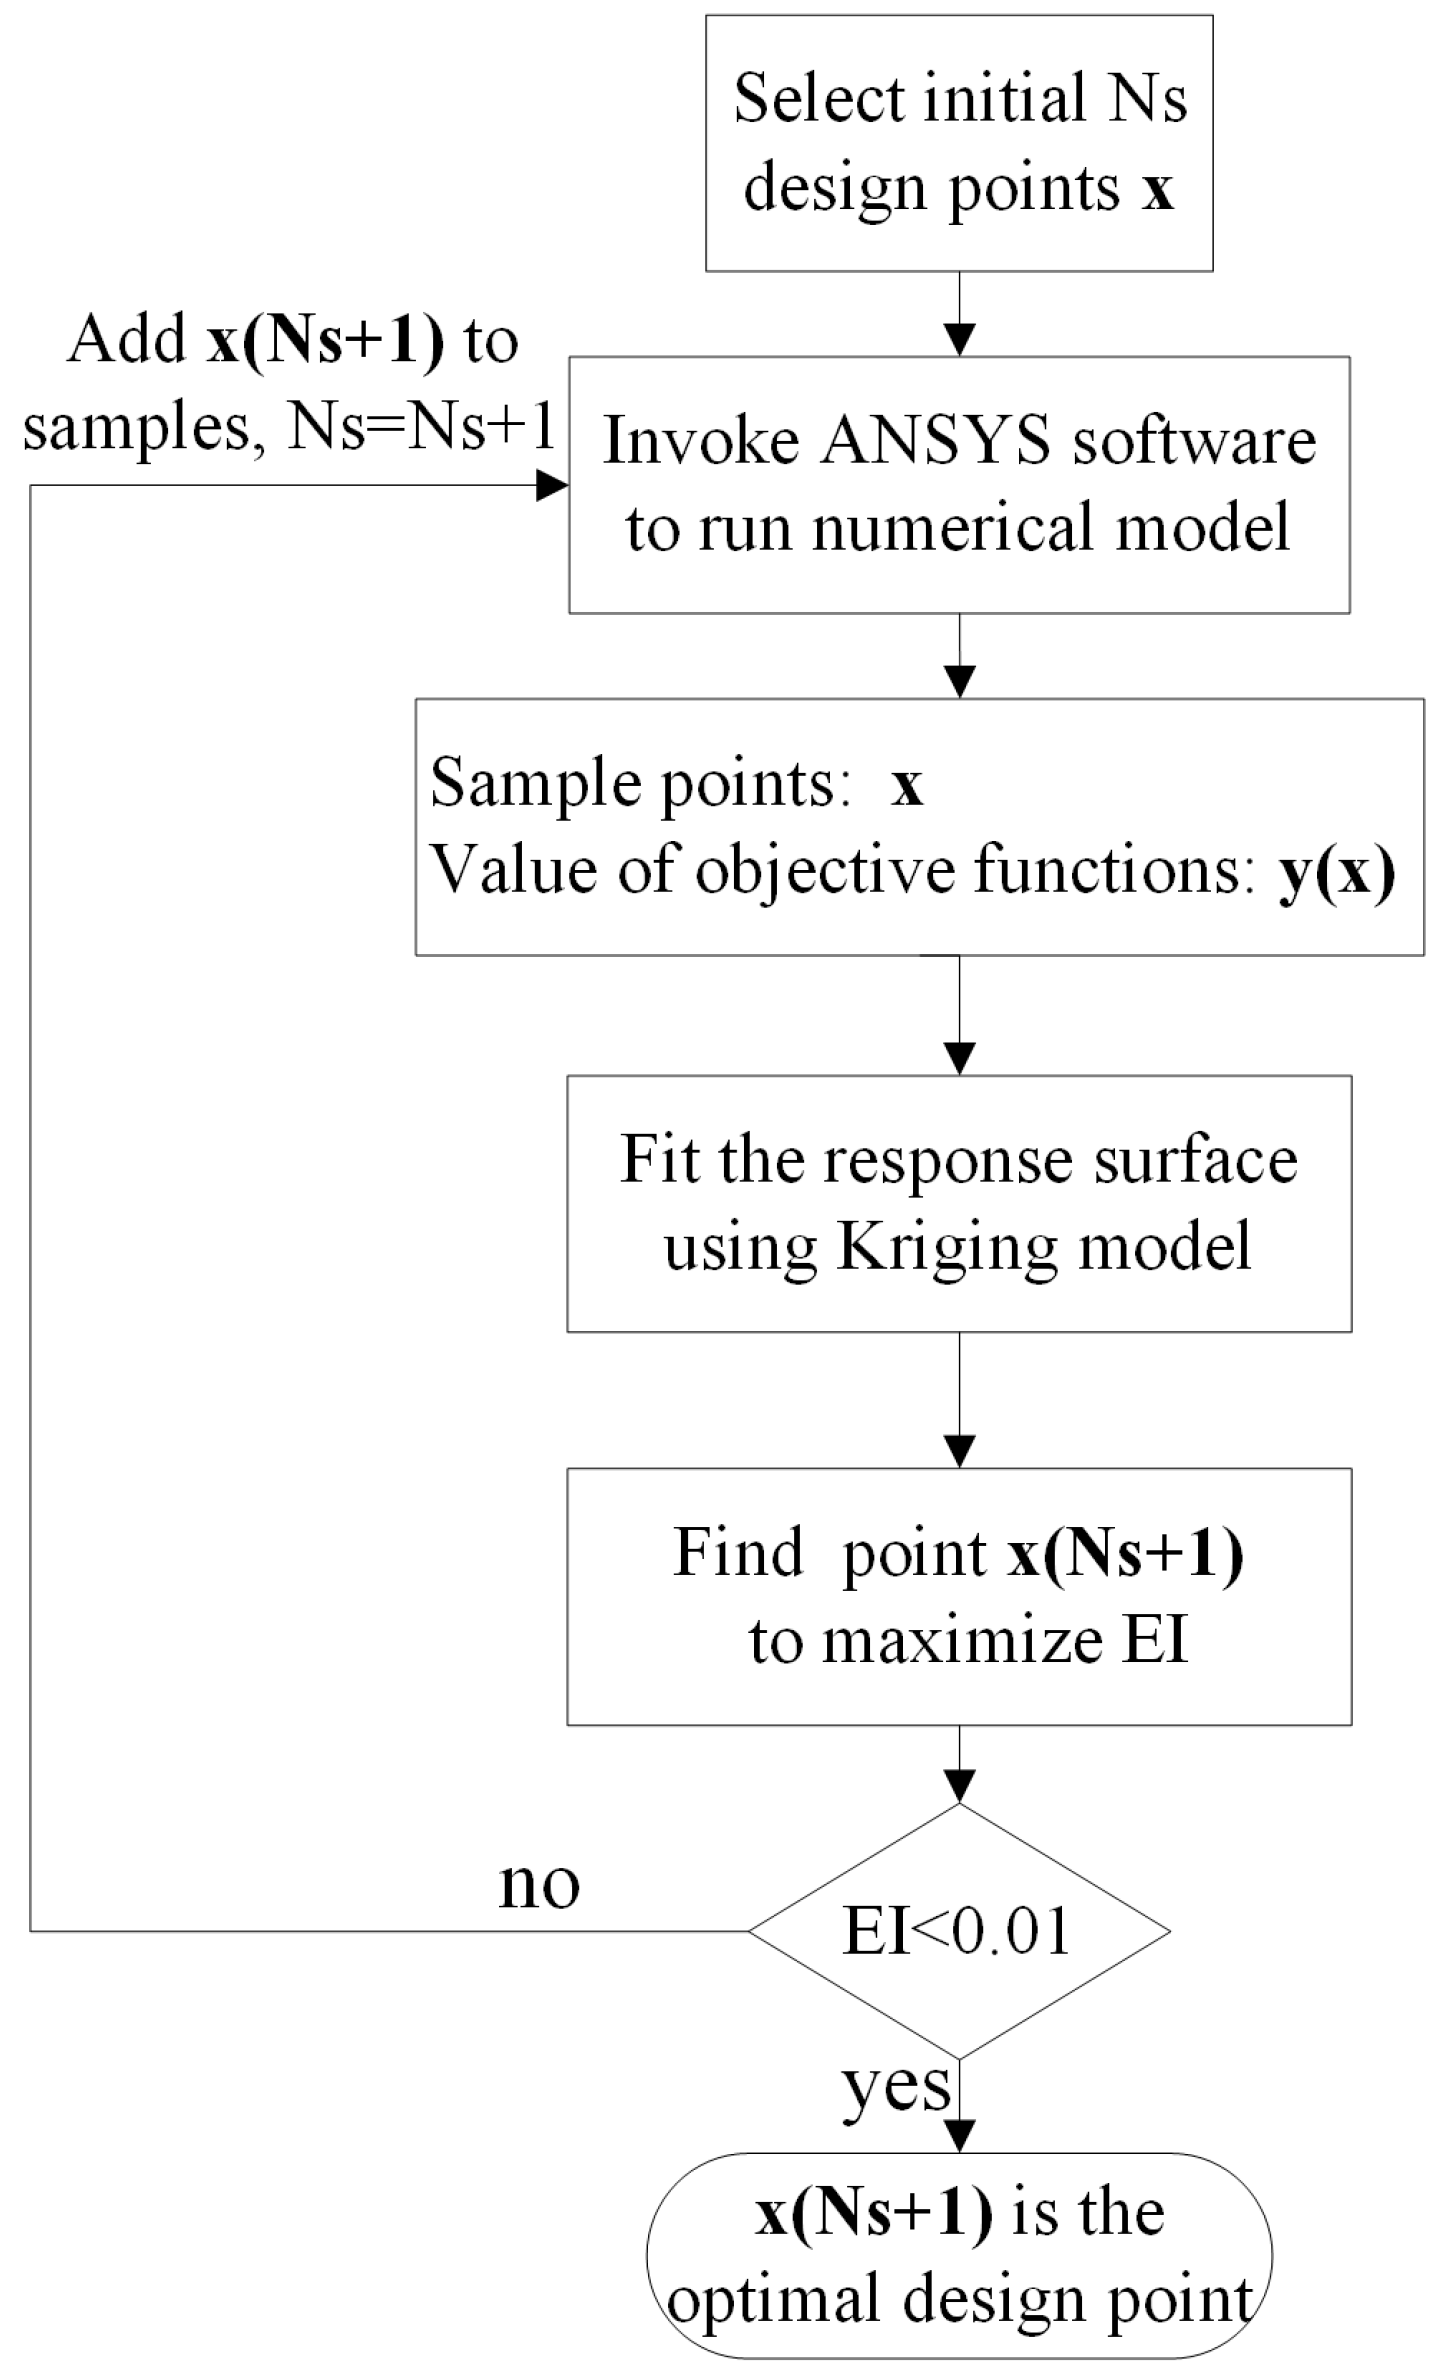
3.2. The Efficient Global Optimization (EGO) Method Using the Kriging Model

Instead of repeatedly conducting expensive computation, one alternative is to build an approximate model of the numerical model.
Kriging is an interpolation method that considers spatial correlation. It is superior to traditional methods, such as the least squares method, and can provide the best linear unbiased interpolation and estimate the interpolation variance. Therefore, the Kriging model is a response surface model that represents a relation between the function evaluations and the variables [28]. Because the Kriging model requires the fewest function evaluations of all competing methods, the Kriging model is used [29].
In the Kriging method, the response is considered as a realization of a stochastic process in a regression model [30] as follows:
y ( x ) = f T ( x ) β + Z ( x )
where f ( x ) is a polynomial regression of input x , β is the regression coefficient, and Z ( x ) is a stochastic process. The covariance can be expressed as follows:
C o v [ Z ( x i ) , Z ( x j ) ] = σ 2 R ( θ , x i , x j )
where σ 2 is the process variance, θ is the coefficient parameter defined as θ = ( θ 1 , , θ N ) T , and N is the number of variables. The subscripts i and j describe the i th and j th sampling points. R ( θ , x i , x j ) is expressed as follows:
R ( θ , x i , x j ) = l = 1 N exp [ θ l ( x i l x j l ) 2 ]
Using response y s = { y ( x 1 ) , , y ( x N s ) } at the given sampling points S = { x 1 , , x N s } , the mean squared error at an untried point x should be minimized, and Equation (13) is then expressed as follows:
y ^ ( x ) = f T ( x ) β ^ + r T ( x ) R 1 ( y s F β ^ )
where R is the correlation matrix and r ( x ) is the vector of correlations:
r ( x ) = [ R ( x 1 , x ) , , R ( x N s , x ) ] T
and
F = [ f ( x 1 ) , , f ( x N s ) ] T
The maximum likelihood estimations of β and σ 2 are as follows:
β ^ = ( F T R 1 F ) 1 F T R 1 y s
σ ^ 2 = ( y s F β ) T R 1 ( y s F β ) N s
The estimation of θ is given as follows:
θ ^ = min { ( R ) 1 / N s σ ^ 2 }
Efficient global optimization iteratively adds points to improve the current best sample y ( x ) . The improvement at a point x is as follows:
I ( x ) = max ( y ( x ) y ^ ( x ) , 0 )
The improvement is a random variable, thus, the expectation of I ( x ) can be given as follows:
E I x = y x * y ^ x Φ y x * y ^ x σ ^ 2 + σ ^ 2 ϕ y x * y ^ x σ ^ 2
where Φ ( ) is the cumulative density function, ϕ ( ) is the probability density function, and y ( x ) is the current best sample. In order to find the global optimal x to maximize the expected improvement in Equation (23), a scatter search method is used [31]. The optimization algorithm iterates until the expected improvement is less than 0.01.
The flow chart of the efficient global optimization algorithm is presented in Figure 4. The algorithm begins by selecting initial N s points using Latin hypercubes. Then, the optimization process utilizes ANSYS software to read the APDL code and the parameters of the initial points, and it evaluates the heat source temperature. Then, a response surface is fitted using the Kriging model and a new point is concluded by maximizing the expected improvement. If the expected improvement is larger than 0.01, the selected point is added to the samples. If the expected improvement is less than 0.01, the algorithm stopped and the added point is the optimal design point.

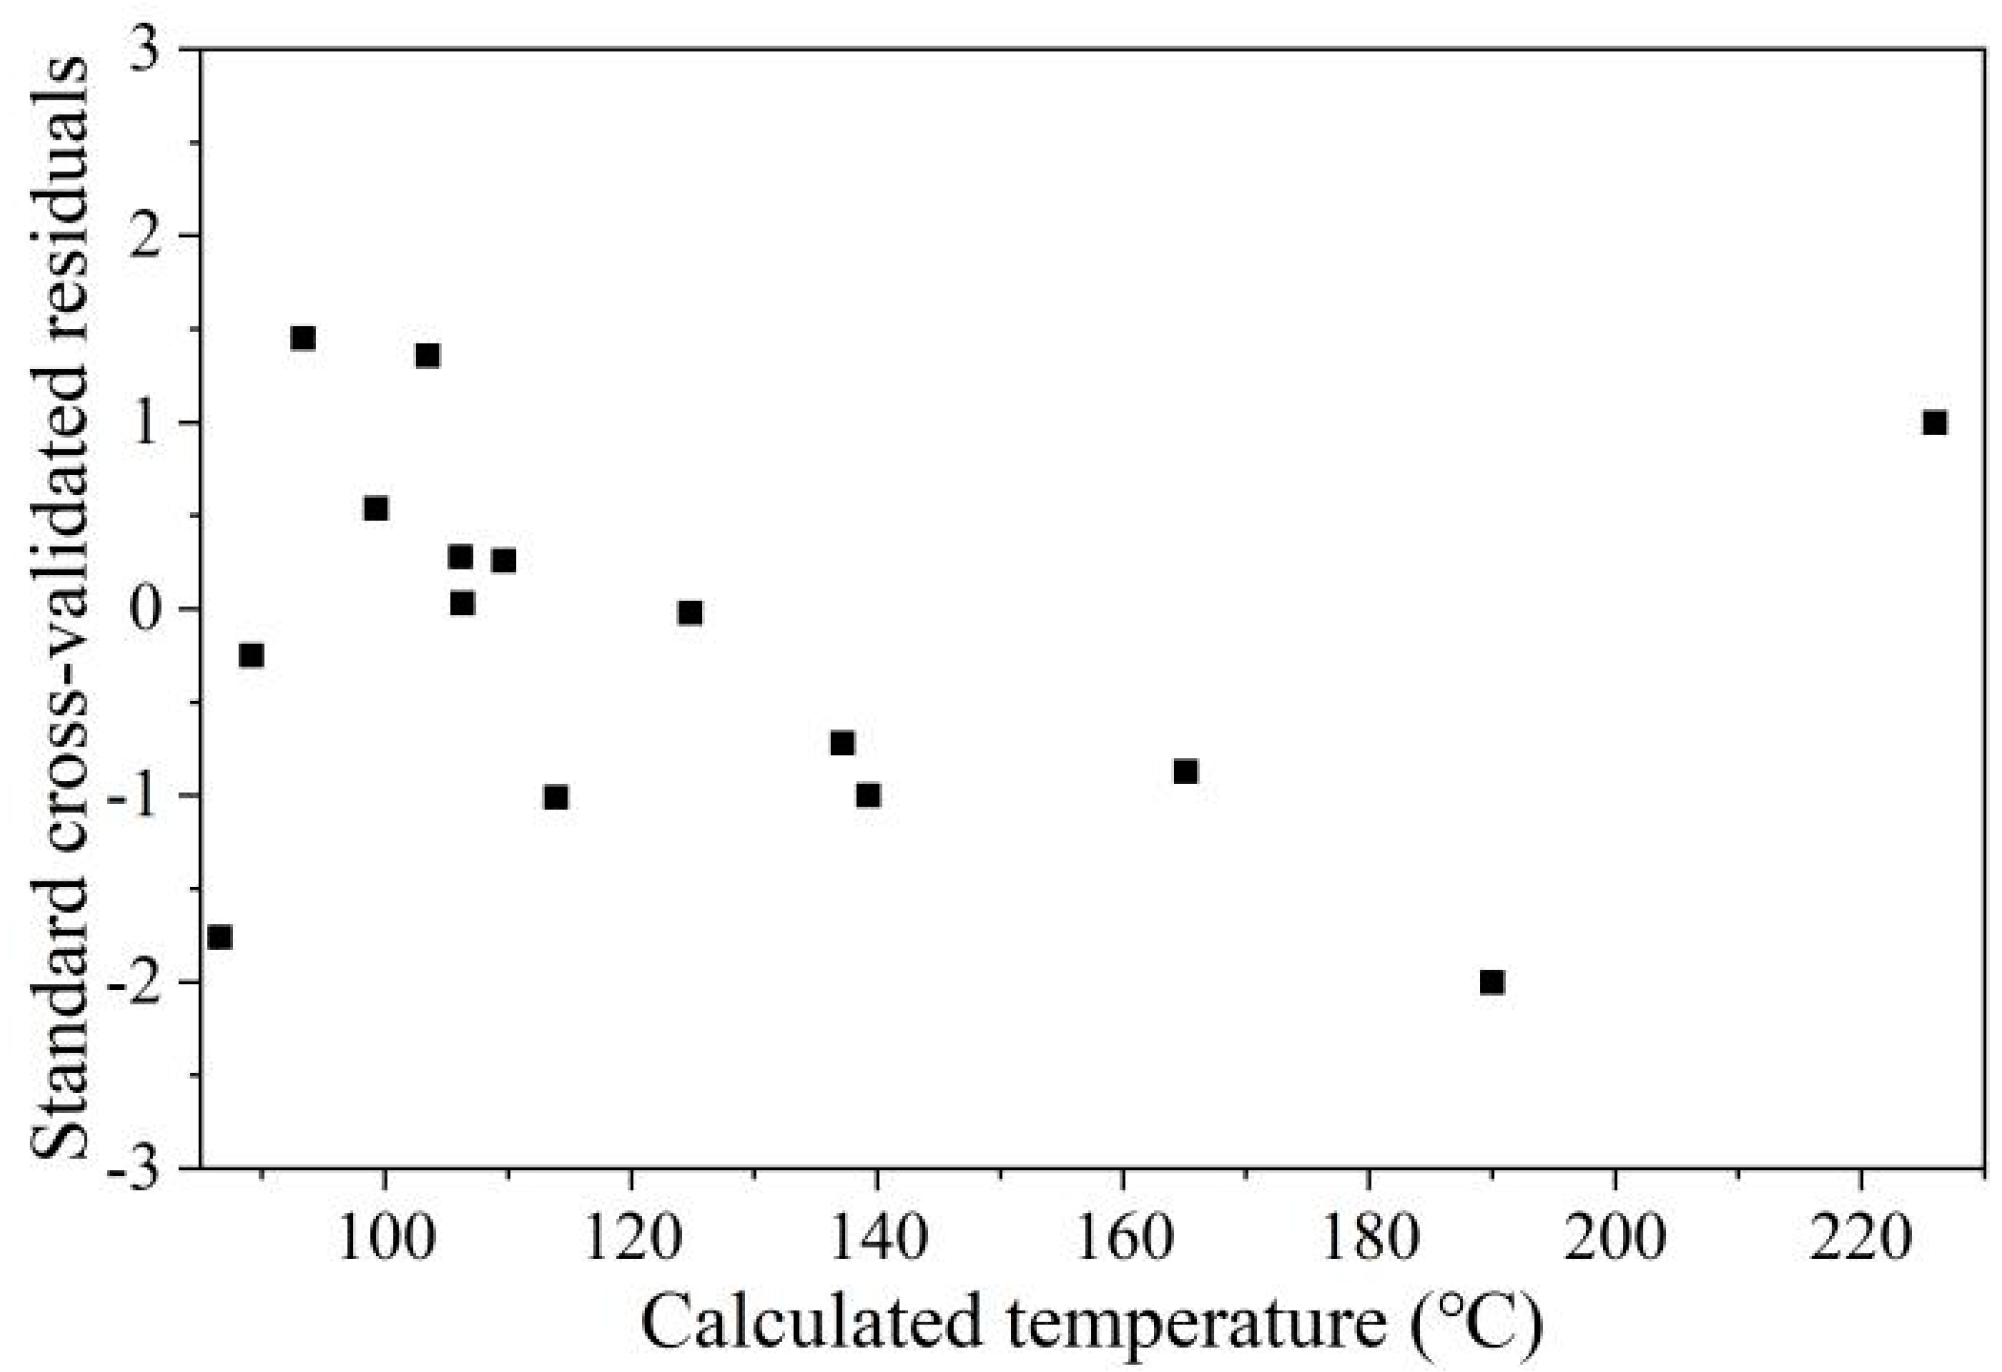
3.3. Precision of the Kriging Model

Cross-validation is used to examine the precision of the Kriging model. The objective of the cross-validation is to predict y ( x i ) based only on the N s 1 remaining points [29]. The predicted value is denoted by y ^ i ( x i ) , and the root mean squared error is denoted by s i ( x i ) . The subscript i emphasizes that the observation y ( x i ) is not used in making predictions. The standardized cross-validated residuals between the actual value and the predicted value can be expressed as follows:
y ( x i ) y ^ i ( x i ) s i ( x i )
If the model is accurate, the standardized cross-validated residuals should be roughly within the interval [−3, +3]. Assuming the heat sink volume is 250 cm3, the heat flux is 4 W/cm2, and the working time is 300 s because the working time of the aviation equipment is 300 s in the engineering application. A total of 15 points are selected to build the initial Kriging model, the standardized cross-validated residual of the 15 points, and the corresponding calculated heat source temperatures are plotted in Figure 5.
It shows that the standardized cross-validated residuals are in the interval [−3, +3], which means that the Kriging model can achieve a good prediction accuracy with just 15 evaluations.

4. Results and Discussion

4.1. Results of the Optimal Design

Assuming that the heat sink volume is 150 cm3, the heat flux is 4 W/cm2, and the working time is 300 s, the optimal length of the heat sink is 7.04 cm, and the optimal EG mass fraction is 0.32, using the optimization method in this study. To analyze whether the proposed method can obtain the optimal solution, the comparison of the temporal variation in the heat source temperature under the optimal solution and the parameters near the optimal solution is conducted in this section.
The comparison of the heat source temperature corresponding to the EG mass fraction of 0.32 (the optimal parameter), 0.4, and 0.24 is shown in Figure 6. It shows that the heat source temperature corresponding to the optimal EG mass fraction is the lowest at the end of the working time. If the EG mass fraction is larger than the optimal value ( α = 0 . 40 ), although the temperature is lower before 275 s due to the higher thermal conductivity, the temperature becomes larger than that at the optimal α . The reason is that since the latent heat of the PCM is insufficient to absorb the heat, the temperature of the heat source increases rapidly at the end of the working time. For the lower EG mass fraction ( α = 0 . 24 ), the heat source temperature is higher due to the low thermal conductivity of the PCM composite.
The comparison of the heat source temperature corresponding to the heat sink side with a length of 7.04 cm (the optimal parameter), 8 cm, and 6 cm is shown in Figure 7. This shows that the heat source temperature with different side lengths is the same before 100 s. However, the temperature at the optimal side length achieves the lowest value afterwards. From the above discussion, it can be inferred that the optimization method can achieve the optimal parameters for the PCM-based heat sink.

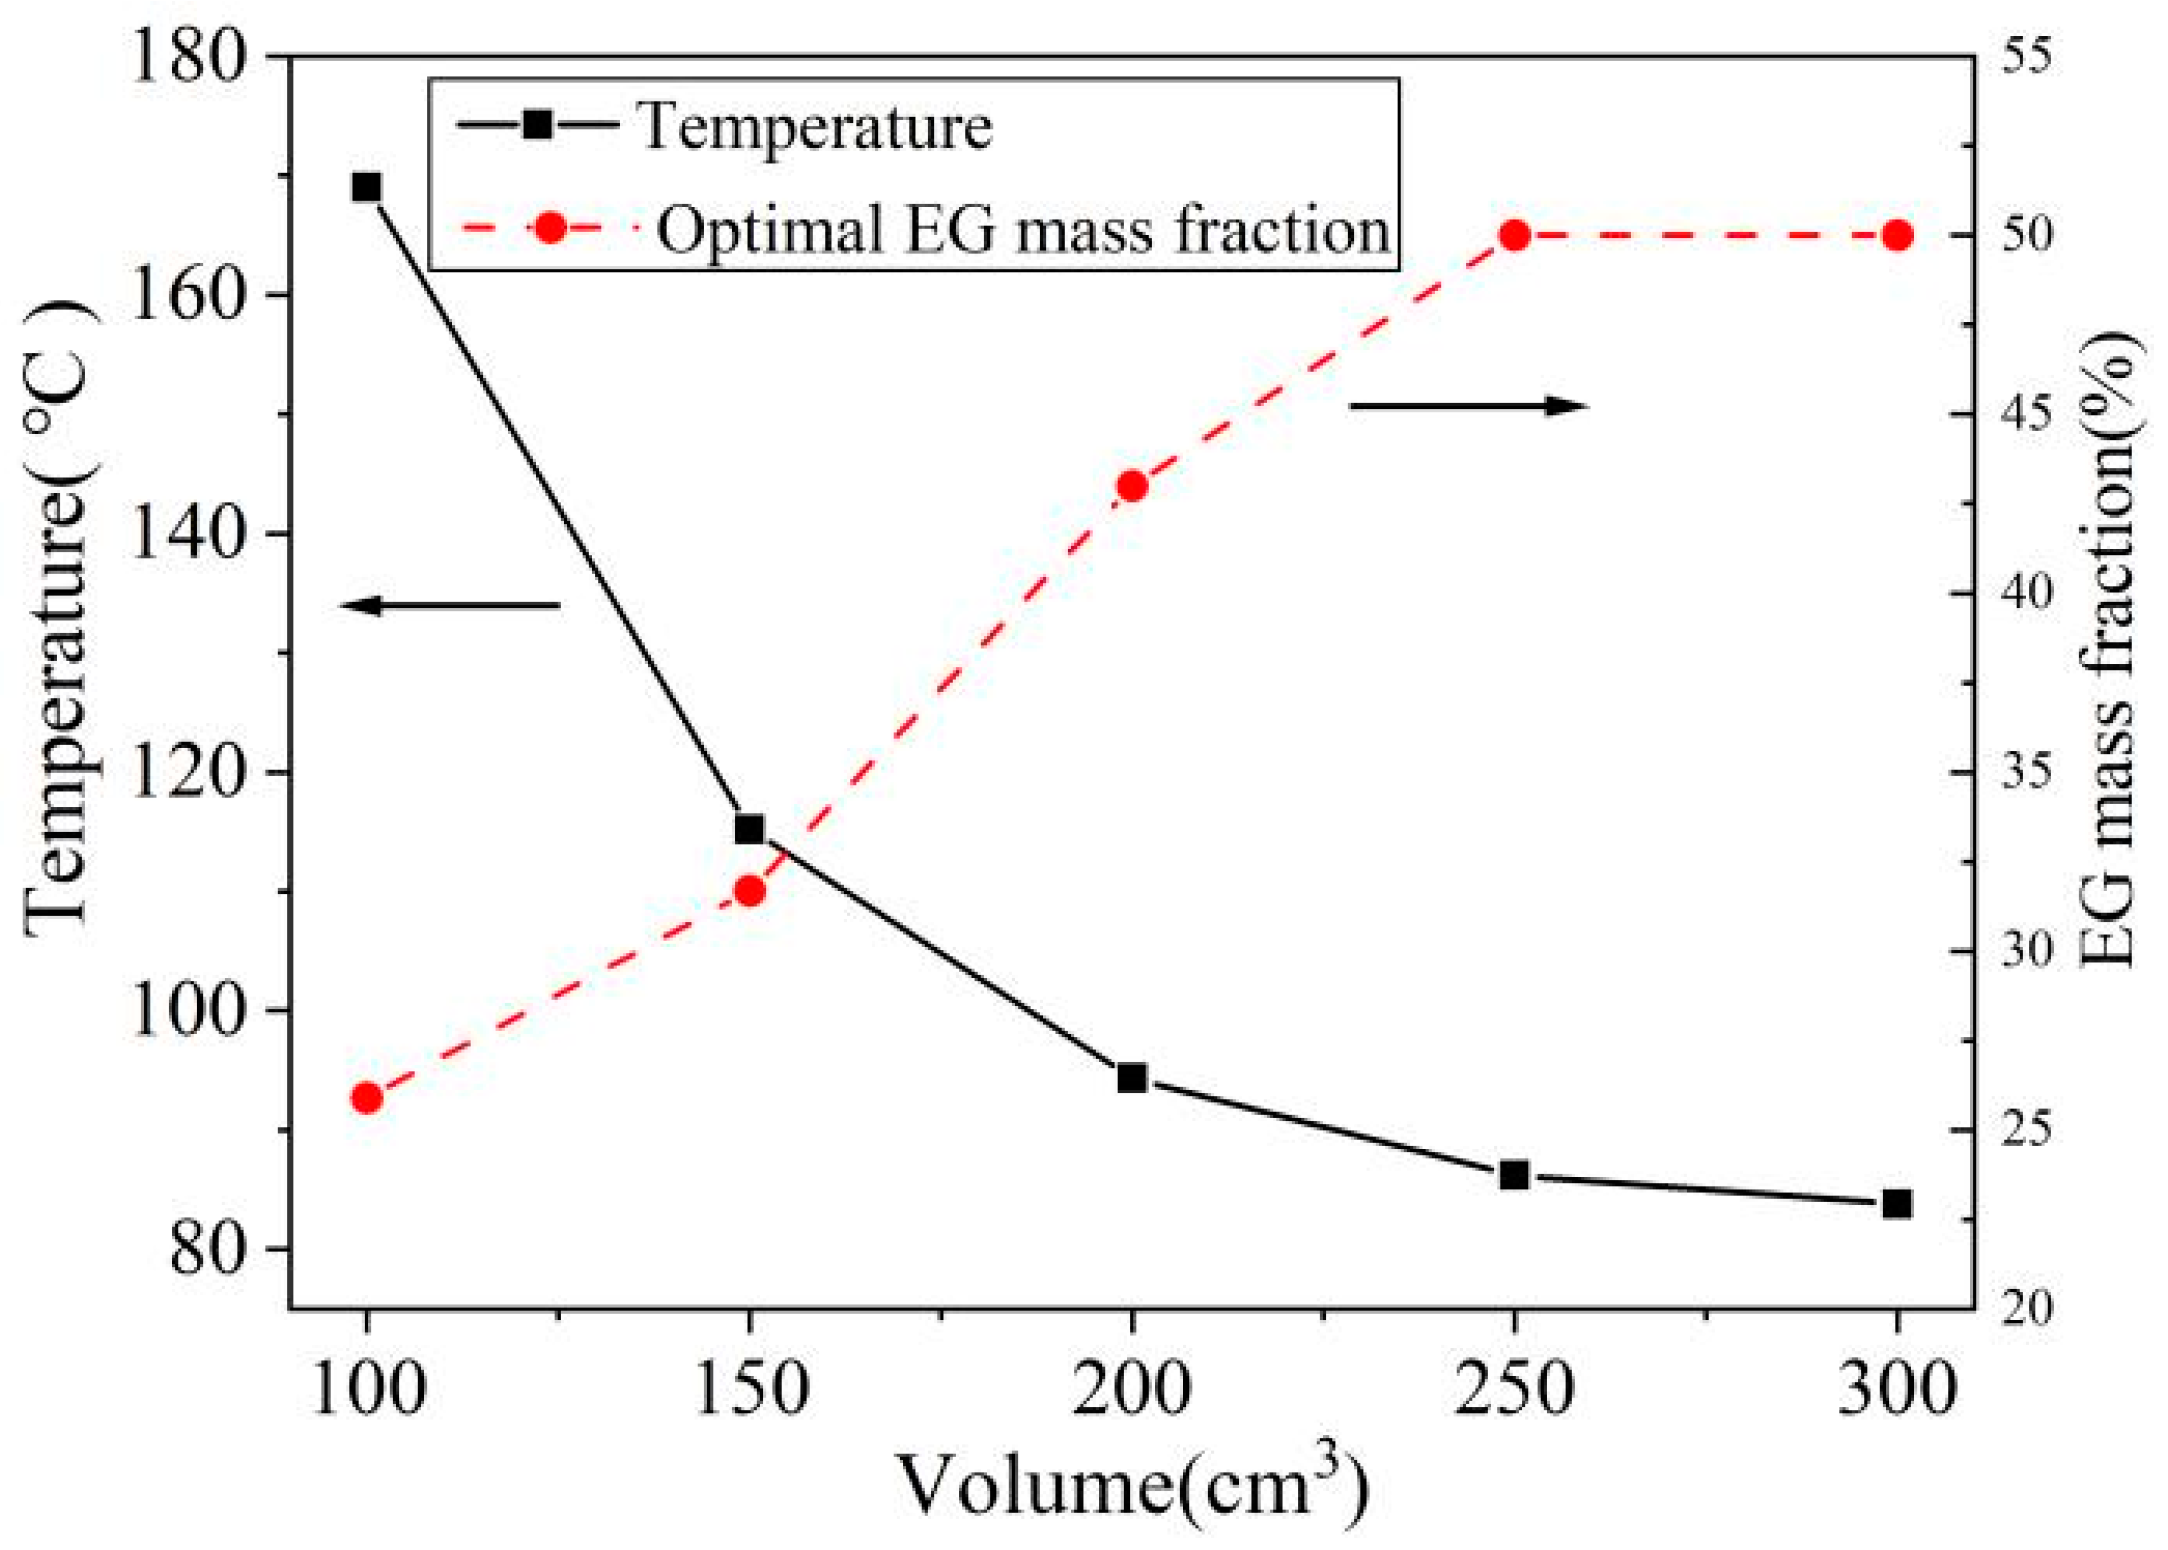
4.2. Effect of Heat Sink Volume on Optimal Parameters

The effect of the heat sink volume on the optimal EG mass fraction and the heat source temperature is shown in Figure 8. The heat flux is set as 4 W/(cm2), and the working time is 300 s.
Figure 8 shows that as the heat sink volume increases from 100 cm3 to 300 cm3, the optimal EG mass fraction rises from 25.9% to the upper limit, while the heat source temperature decreases from 169 °C to 84 °C. This can be explained since with the increase in the heat sink volume, the capability of absorbing heat becomes larger, and the optimal EG mass fraction also becomes larger to improve the thermal diffusion ability, leading to the lower heat source temperature. The optimal dimensions of the heat sink with different heat sink volumes are shown in Table 2. This shows that the optimal height and length of the heat sink increases with the rise in the volume, while the ratio of the height to the length of the heat sink ( H / L ) changes in a narrow range. The optimal ratio of the height to the length of the heat sink is 0.43.

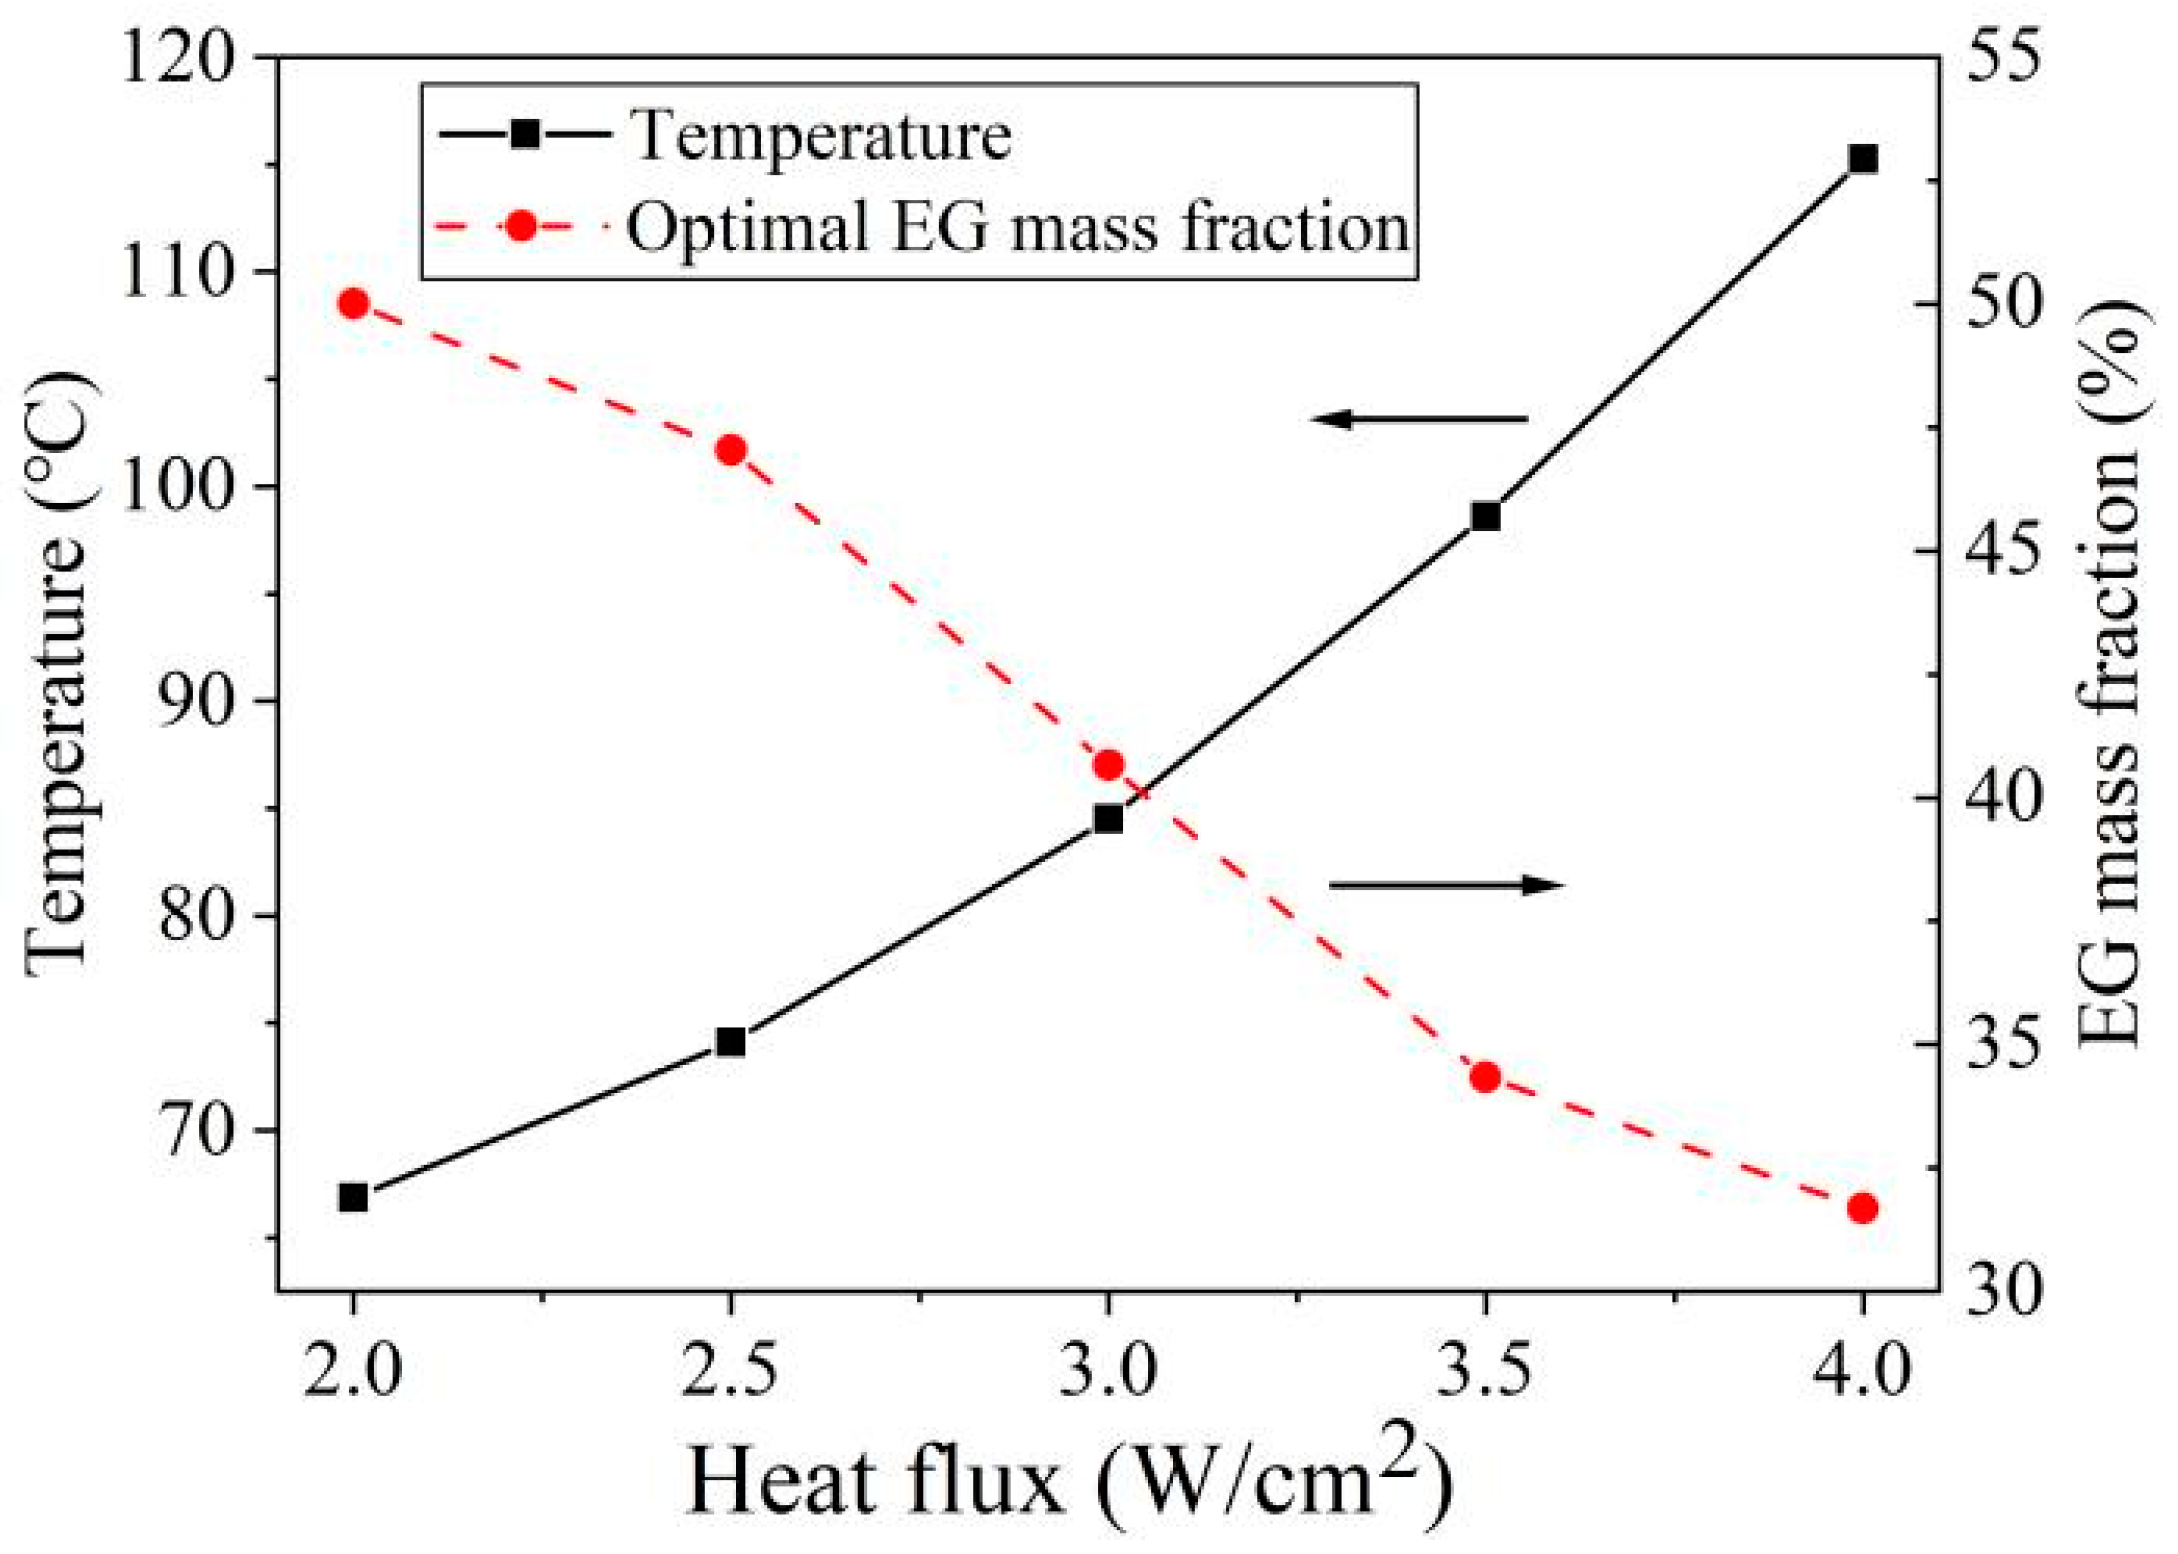
4.3. Effect of Heat Flux on Optimal Parameters

The effect of the heat flux on the optimal EG mass fraction and the heat source temperature is plotted in Figure 9. The heat sink volume is 150 cm3, and the working time is 300 s.
Figure 9 shows that as the heat flux increases from 2 W/(cm2) to 4 W/(cm2), the optimal EG mass fraction decreases from 0.5 to 0.31, and the heat source temperature increases from 67 °C to 115 °C. It can be explained that with the increase in the heat flux, the heat needed to be absorbed increases, leading to the decrease in the optimal EG mass fraction. The decrease in EG mass fraction restricts the spread of heat in PCM and leads to an increase in the heat source temperature. The optimal dimensions of the heat sink for different heat fluxes are shown in Table 3.
Table 3 shows that the heat flux has a very limited influence on the optimal geometric dimensions of the heat sink, and the optimal ratio of the height to the length of the enclosure is 0.43.

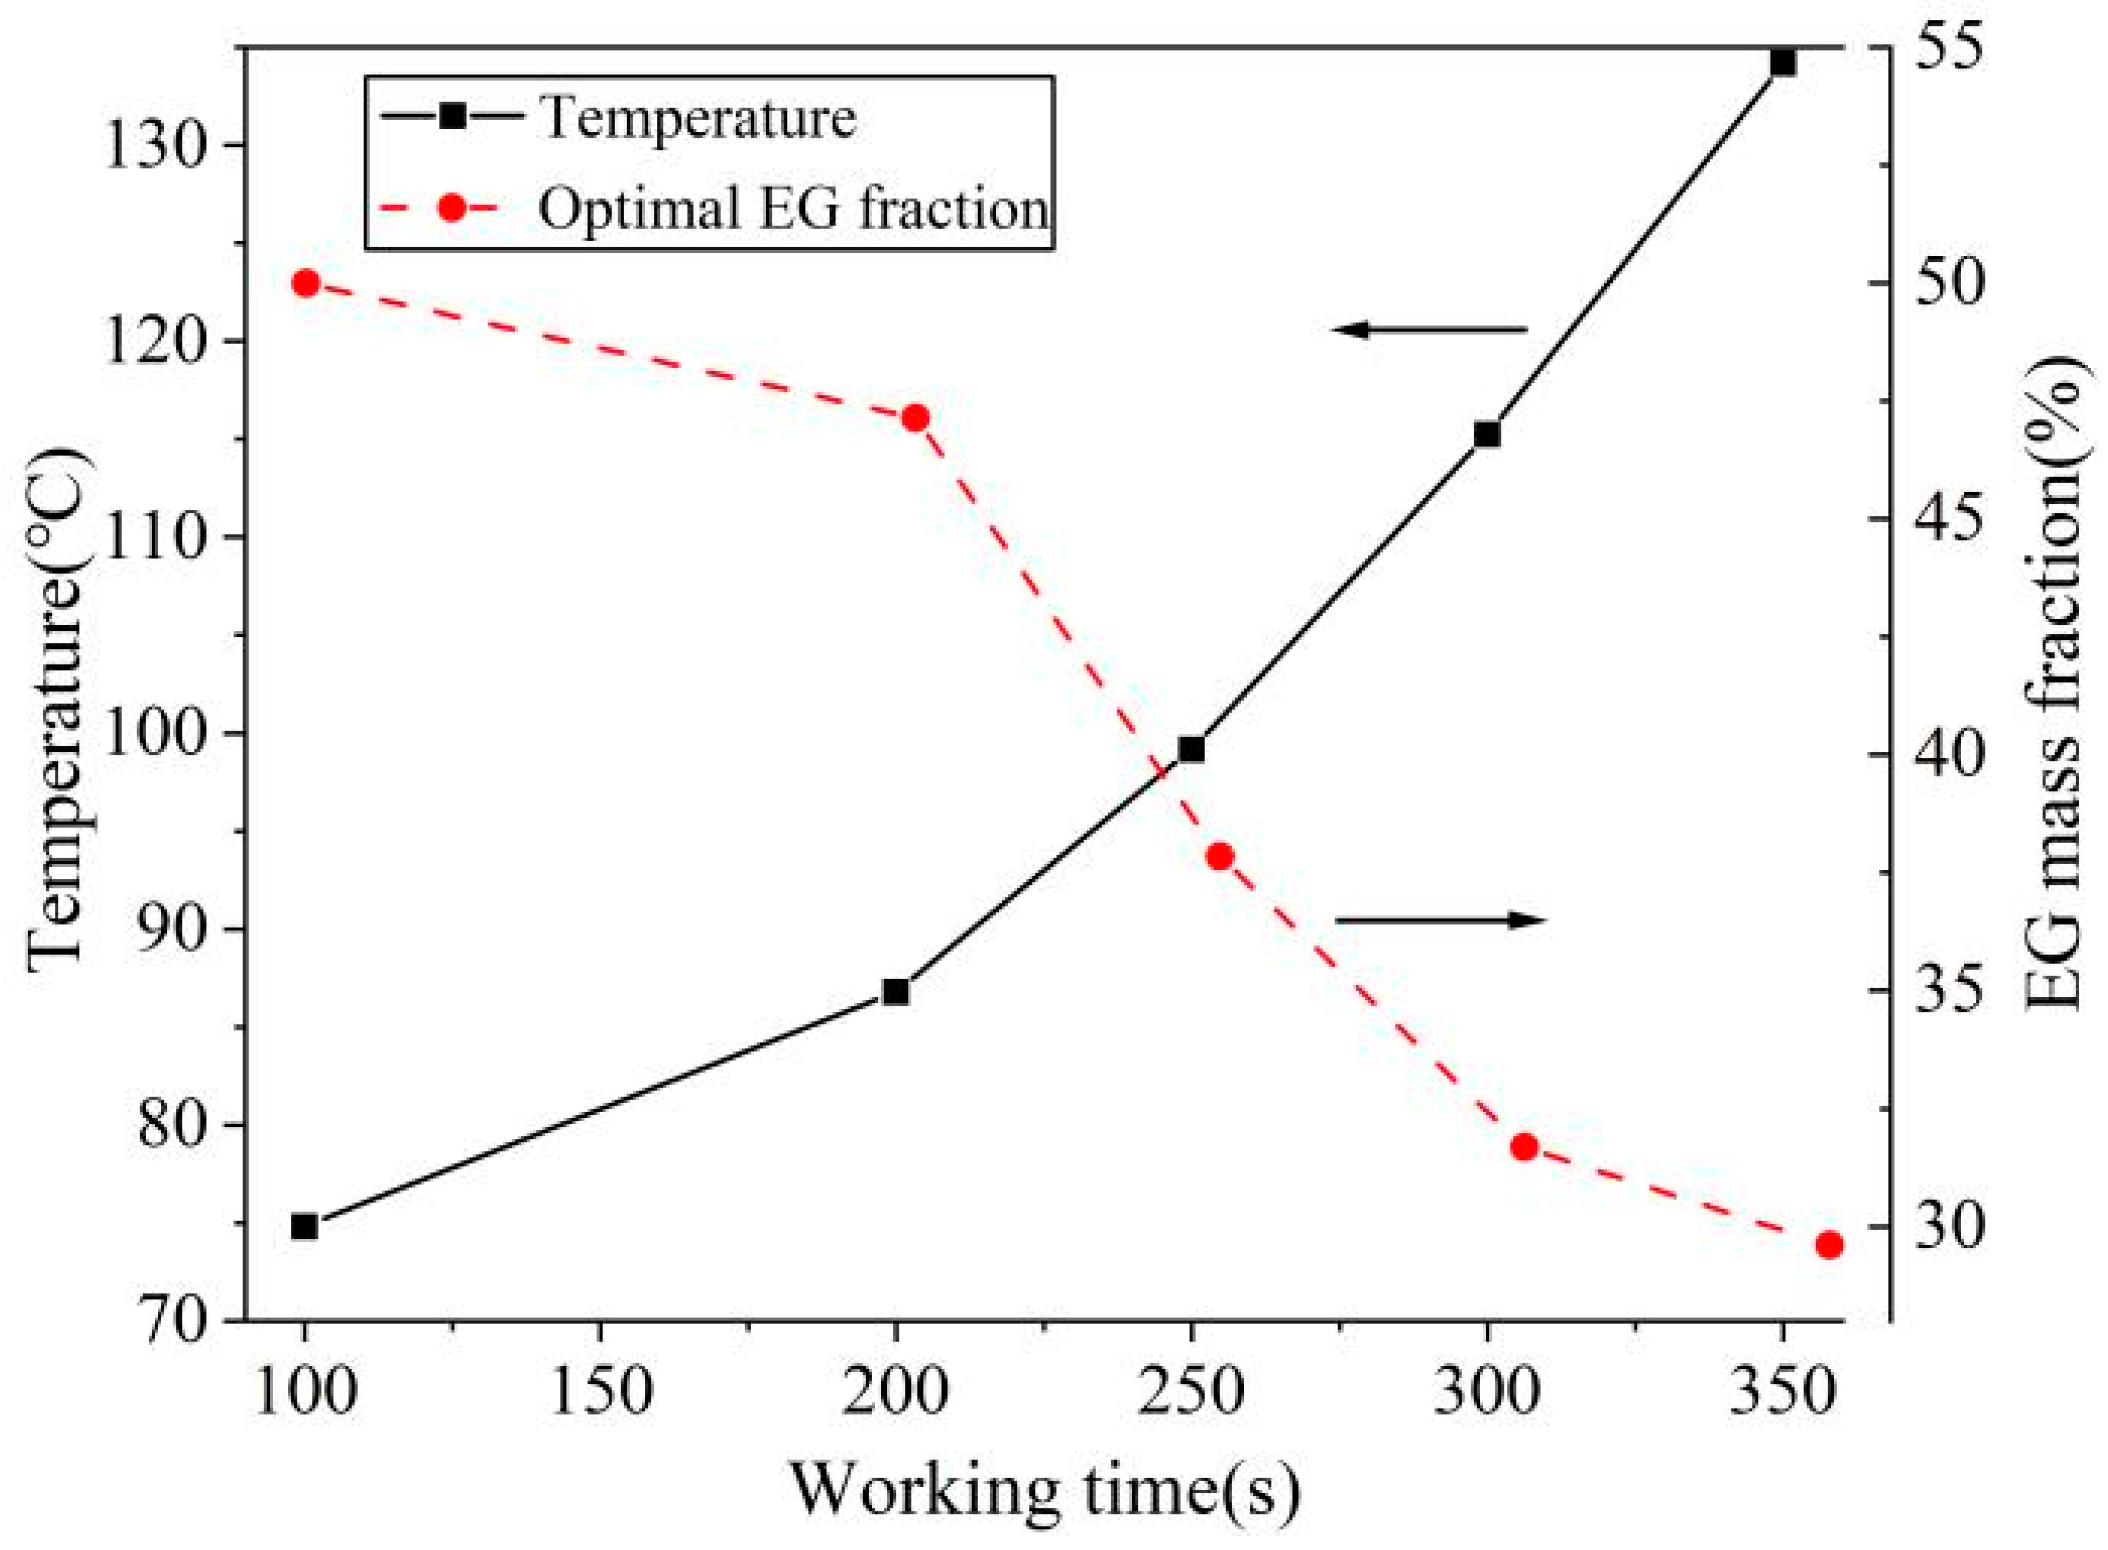
4.4. Effect of Working Time on Optimal Parameters

The effects of working time on the optimal EG mass fraction and the heat source temperature are shown in Figure 10. The heat sink volume is 150 cm3, and the heat flux is 4 W/(cm2).
Figure 10 shows that as the working time increases from 100 s to 350 s, the optimal EG mass fraction decreases from the upper limit to 0.29, while the heat source temperature increases from 75 °C to 134 °C. This can be explained since with the rise in the working time, the heat needed to be absorbed increases, and thus the optimal EG mass fraction becomes lower, leading to the decrease in thermal conductivity. As a result, the heat source temperature becomes higher. The optimal dimensions of the heat sink for different working times are shown in Table 4.
Table 4 indicates that the working time has little effect on the optimal geometric dimensions of the heat sink, and the optimal ratio of the height to the length of the enclosure is 0.43.

5. Conclusions

Phase change materials play an important role in the thermal management of electronics in aerospace applications such as airborne electronics and aircraft external carry. An optimization method has been developed for the PCM/EG-based heat sink. The numerical model is built and validated by comparing the numerical results with the experimental data. The prediction accuracy of the Kriging model is also verified using cross-validation. The effects of the heat sink volume, heat flux, and working time on the optimal results have been analyzed. The main conclusions are as follows:
(1)
The proposed optimization method is efficiently finds the optimal parameters of the heat sink without a lot of time-consuming numerical processes.
(2)
The optimal EG mass fraction increases with the rise in heat sink volume and decreases with the increase in heat flux and working time.
(3)
The optimal ratio of the height to the length of the heat sink is 0.43.

Author Contributions

Methodology, H.L.; Software, M.L.; Validation, Y.F.; Resources, L.C.; Supervision, J.Z. All authors have read and agreed to the published version of the manuscript.

Funding

This work was supported by the Technology Basic Research Project of the State Administration of Science, Technology and Industry for the National Defense of China (JSHS2020205B001).

Data Availability Statement

Data will be made available on request.

Conflicts of Interest

Authors were employed by Avic China Aero-Polytechnology Establishment. The remaining authors declare that the re-search was conducted in the absence of any commercial or financial relationships that could be construed as a potential conflict of interest.

References

  1. Ruoji, Z.; Zhang, J.; Zhang, J. The Impact of In-Flight Acceleration Environments on the Performance of a Phase-Change Heat Exchanger Unit with Layered Porous Media. Aerospace 2024, 11, 335. [Google Scholar] [CrossRef]
  2. Jouhara, H.; Żabnieńska-Góra, A.; Khordehgah, N.; Ahmad, D.; Lipinski, T. Latent thermal energy storage technologies and applications: A review. Int. J. Thermofluids 2020, 5, 100039. [Google Scholar] [CrossRef]
  3. Ding, C.; Zhang, C.; Ma, L.; Sharma, A. Numerical investigation on melting behaviour of phase change materials/metal foam composites under hypergravity conditions. Appl. Therm. Eng. 2022, 207, 118153. [Google Scholar] [CrossRef]
  4. Levin, P.P.; Shitzer, A.; Hetsroni, G. Numerical optimization of a PCM based heat sink with internal fins. Int. J. Heat Mass Transf. 2013, 61, 638–645. [Google Scholar] [CrossRef]
  5. Ling, Z.; Zhang, Z.; Shi, G.; Fang, X.; Wang, L.; Gao, X.; Fang, Y.; Xu, T.; Wang, S.; Liu, X. Review on thermal management systems using phase change materials for electronic components, Li-ion batteries and photovoltaic modules. Renew. Sustain. Energy Rev. 2014, 31, 427–438. [Google Scholar] [CrossRef]
  6. Jaguemont, J.; Omar, N.; den Bossche, P.; Mierlo, J. Phase-change materials (PCM) for automotive applications: A review. Appl. Therm. Eng. 2018, 132, 308–320. [Google Scholar] [CrossRef]
  7. Tomizawa, Y.; Sasaki, K.; Kuroda, A.; Takeda, R.; Kaito, Y. Experimental and numerical study on phase change material (PCM) for thermal management of mobile devices. Appl. Therm. Eng. 2016, 98, 320–329. [Google Scholar] [CrossRef]
  8. Huang, R.; Li, Z.; Hong, W.; Wu, Q.; Yu, X. Experimental and numerical study of PCM thermophysical parameters on lithium-ion battery thermal management. Energy Rep. 2020, 6, 8–19. [Google Scholar] [CrossRef]
  9. Jiang, G.; Huang, J.; Liu, M.; Cao, M. Experiment and simulation of thermal management for a tube-shell Li-ion battery pack with composite phase change material. Appl. Therm. Eng. 2017, 120, 1–9. [Google Scholar] [CrossRef]
  10. Sami, S.; Etesami, N. Heat transfer enhancement of microencapsulated phase change material by addition of nanoparticles for a latent heat thermal energy storage system. Energy Rep. 2021, 7, 4930–4940. [Google Scholar] [CrossRef]
  11. EL Hasadi, Y.M.F.; Khodadadi, J.M. Numerical simulation of solidification of colloids inside a differentially heated cavity. J. Heat Transf. 2015, 137, 072301. [Google Scholar] [CrossRef]
  12. Qu, Z.; Li, W.; Wang, J.; Tao, W. Passive thermal management using metal foam saturated with phase change material in a heat sink. Int. Comm. Heat Mass Transf. 2012, 39, 1546–1549. [Google Scholar] [CrossRef]
  13. Sar, A.; Karaipekli, A. Preparation, thermal properties and thermal reliability of palmitic acid/expanded graphite composite as form-stable PCM for thermal energy storage. Sol. Energy Mater. Sol. Cells 2009, 93, 571–576. [Google Scholar] [CrossRef]
  14. Zhao, C.; Wang, J.; Sun, Y.; He, S.; Hooman, K. Fin design optimization to enhance PCM melting rate inside a rectangular enclosure. Appl. Energy 2022, 321, 119368. [Google Scholar] [CrossRef]
  15. Zhang, Y.; Wang, X.; Wu, D. Microencapsulation of n-dodecane into zirconia shell doped with rare earth: Design and synthesis of bifunctional microcapsules for photoluminescence enhancement and thermal energy storage. Energy 2016, 97, 113–126. [Google Scholar] [CrossRef]
  16. Ao, C.; Yan, S.; Zhao, S.; Hu, W.; Zhao, L.; Wu, Y. Stearic acid/expanded graphite composite phase change material with high thermal conductivity for thermal energy storage. Energy Rep. 2022, 8, 4834–4843. [Google Scholar] [CrossRef]
  17. Khanna, S.; Reddy, K.S.; Mallick, T.K. Optimization of solar photovoltaic system integrated with phase change material. Sol. Energy 2018, 163, 591–599. [Google Scholar] [CrossRef]
  18. Yang, X.-H.; Tan, S.-C.; He, Z.-Z. Evaluation and optimization of low melting point metal PCM heat sink against ultra-high thermal shock. Appl. Therm. Eng. 2017, 119, 34–41. [Google Scholar] [CrossRef]
  19. Sciacovelli, F.; Gagliardi, V.; Verda, V. Maximization of performance of a PCM latent heat storage sys-tem with innovative fins. Appl. Energy 2015, 137, 707–715. [Google Scholar] [CrossRef]
  20. Alayil, R.; Balaji, C. Conjugate Heat Transfer in Latent Heat Thermal Storage System With Cross Plate Fins. J. Heat Transf. 2015, 137, 102302. [Google Scholar] [CrossRef]
  21. Augspurger, M.; Choi, K.K.; Udaykumar, H.S. Optimizing fin design for a PCM-based thermal storage device using dynamic Kriging. Int. J. Heat Mass Transf. 2018, 121, 290–308. [Google Scholar] [CrossRef]
  22. Pizzolato, A.; Sharma, A.; Maute, K.; Sciacovelli, A.; Verda, V. Topology optimization for heat transfer enhancement in latent heat thermal energy storage. Int. J. Heat Mass Transf. 2017, 113, 875–888. [Google Scholar] [CrossRef]
  23. Jiang, G.; Huang, J.; Fu, Y.; Cao, M.; Liu, M. Thermal optimization of composite phase change material/expanded graphite for Li-ion battery thermal management. Appl. Therm. Eng. 2016, 108, 1119–1125. [Google Scholar] [CrossRef]
  24. Wang, S.; Qin, P.; Fang, X.; Zhang, Z.; Wang, S.; Liu, X. A novel sebacic acid/expanded graphite composite phase change material for solar thermal medium-temperature applications. Sol. Energy 2014, 99, 283–290. [Google Scholar] [CrossRef]
  25. Li, Z.; Sun, W.G.; Wang, G.; Wu, Z.G. Experimental and numerical study on the effective thermal conductivity of paraffin/expanded graphite composite. Sol. Energy Mater. Sol. Cells 2014, 128, 447–455. [Google Scholar] [CrossRef]
  26. Ling, Z.; Chen, J.; Xu, T.; Fang, X.; Gao, X.; Zhang, Z. Thermal conductivity of an organic phase change material/expanded graphite composite across the phase change temperature range and a novel thermal conductivity model. Energy Convers. Manag. 2015, 102, 202–208. [Google Scholar] [CrossRef]
  27. Lv, Y.; Zhou, W.; Jin, W. Experimental and numerical study on thermal energy storage of polyethylene glycol/expanded graphite composite phase change material. Energy Build. 2016, 111, 242–252. [Google Scholar] [CrossRef]
  28. Jeong, S.; Murayama, M.; Yamamoto, K. Efficient Optimization Design Method Using Kriging Model. J. Aircr. 2005, 42, 413–420. [Google Scholar] [CrossRef]
  29. Jones, D.R.; Schonlau, M.; Welch, W.J. Efficient global optimization of expensive black-box functions. J. Glob. Optim. 1998, 13, 455–492. [Google Scholar] [CrossRef]
  30. Fan, L.; Xiang, Z.; Xue, M.; Cen, Z. Robust Optimization of Thermal–Dynamic Coupling Systems Using a Kriging Model. J. Spacecr. Rocket. 2010, 47, 1029–1037. [Google Scholar] [CrossRef]
  31. Ugray, Z.; Lasdon, L.; Plummer, J.; Glover, F.; Kelly, J.; Martí, R. Scatter Search and Local NLP Solvers: A Multistart Framework for Global Optimization. Inf. J. Comput. 2007, 19, 328–340. [Google Scholar] [CrossRef]
Figure 1. Schematic drawing of the PCM/EG-based heat sink and the heat source. (a) Front view; (b) Top view.
Aerospace 11 00943 g001
Figure 2. Heat source temperature versus time for different grid sizes.
Aerospace 11 00943 g002
Figure 3. Comparisons between the numerical and experiment results [27].
Aerospace 11 00943 g003
Figure 4. Flow chart of the optimization algorithm.
Aerospace 11 00943 g004
Figure 5. Standardized cross-validated residuals versus calculated temperature.
Aerospace 11 00943 g005
Figure 6. Variation in the heat source temperature with time corresponding to various EG mass fractions.
Aerospace 11 00943 g006
Figure 7. Variation in the heat source temperature with time corresponding to various side lengths of the heat sink.
Aerospace 11 00943 g007
Figure 8. Variation in the optimal EG mass fraction and heat source temperature with heat sink volume.
Aerospace 11 00943 g008
Figure 9. Variation in the optimal EG mass fraction and heat source temperature with heat flux.
Aerospace 11 00943 g009
Figure 10. Variations in the optimal EG mass fraction and heat source temperature with working time.
Aerospace 11 00943 g010
Table 1. Thermal-physical properties of PCM and EG [26].
MaterialPCMEG
Density (kg/m3)9142333
Thermal conductivity (W/(m·K))0.305129
Latent heat (kJ/kg)226.1-
Solidus temperature (°C)49.7-
Liquidus temperature (°C)55.8-
Table 2. Optimal dimensions of the heat sink with various heat sink volumes.
Heat Sink Volume (cm3)100150200250300
Height (cm)2.523.033.393.613.75
Length (cm)6.307.047.688.328.95
H / L 0.40.430.440.430.42
Table 3. Optimal dimensions of the heat sink for different heat fluxes.
Heat Flux (W/cm2)22.533.54
Height (cm)2.893.013.043.043.03
Length (cm)7.217.067.027.037.04
H / L 0.400.430.430.430.43
Table 4. Optimal dimensions of the heat sink for different working times.
Working Time (s)100200250300350
Height (cm)2.973.113.023.032.98
Length (cm)7.116.947.057.047.10
H / L 0.420.450.430.430.42
Disclaimer/Publisher’s Note: The statements, opinions and data contained in all publications are solely those of the individual author(s) and contributor(s) and not of MDPI and/or the editor(s). MDPI and/or the editor(s) disclaim responsibility for any injury to people or property resulting from any ideas, methods, instructions or products referred to in the content.

