Article

Situation Awareness Discrimination Based on Physiological Features for High-Stress Flight Tasks

1
School of Aeronautic Science and Engineering, Beihang University, Beijing 100191, China
2
Tianmushan Laboratory, Hangzhou 311312, China
3
Shenyang Aircraft Design & Research Institute, Shenyang 110035, China
*
Author to whom correspondence should be addressed.
Aerospace 2024, 11(11), 897; https://doi.org/10.3390/aerospace11110897
Submission received: 20 September 2024 / Revised: 26 October 2024 / Accepted: 30 October 2024 / Published: 31 October 2024
(This article belongs to the Special Issue Aerospace Human–Machine and Environmental Control Engineering)

Abstract

:
Situation awareness (SA) discrimination is significant, allowing for the pilot to maintain task performance and ensure flight safety, especially during high-stress flight tasks. Although previous research has attempted to identify and classify SA, existing SA discrimination models are predominantly binary and rely on traditional machine learning methods with limited physiological modalities. The current study aimed to construct a triple-class SA discrimination model for pilots facing high-stress tasks. To achieve this, a flight simulation experiment under typical high-stress tasks was carried out and deep learning algorithms (multilayer perceptron (MLP) and the attention mechanism) were utilized. Specifically, eye-tracking (ET), heart rate variability (HRV), and electroencephalograph (EEG) modalities were chosen as the model’s input features. Comparing the unimodal models, the results indicate that EEG modality surpasses ET and HRV modalities, and the attention mechanism structure has advantageous implications for processing the EEG modalities. The most superior model fused the three modalities at the decision level, with two MLP backbones and an attention mechanism backbone, achieving an accuracy of 83.41% and proving that the model performance would benefit from multimodal fusion. Thus, the current research established a triple-class SA discrimination model for pilots, laying the foundation for the real-time evaluation of SA under high-stress aerial operating conditions and providing a reference for intelligent cockpit design and dynamic human–machine function allocation.

1. Introduction

Identification of the human state, such as mental workload, situation awareness (SA), pressure and fatigue, is crucial in intelligent human–machine systems [1]. It allows machines to recognize the state of personnel, adapt to human needs, and optimize machine functions, which is a prerequisite for achieving the reasonable allocation of human–machine functions [2]. Traditionally, direct measurements of human states commonly rely on subjective assessment after tasks while failing to provide continuous and timely feedback [3,4]. On the other hand, human states can be reflected and measured by multiple physiological signals, as proved by numerous studies [5,6,7]. Physiological features such as electroencephalogram (EEG), heart rate variability (HRV), eye-tracking (ET), electromyogram (EMG), and galvanic skin response (GSR) are widely used [8]. Further, researchers have proposed identifying the human state based on physiological features; thus, the use of machine learning algorithms has been explored to address the challenge of deriving patterns from high-dimensional physiological data to understand an individual’s states [9].
Among human state identification, SA discrimination is of great significance when focusing on the aviation domain and pilot status monitoring. Generally, SA is defined as the perception of the elements in the environment within a specific time and space, the comprehension of their meaning, and the projection of their status in the near future [10]. In aviation mishaps, 80–85% of accidents are attributed to human error, with 88% being related to the pilot’s SA issues [11]. Specifically, in high-stress flight tasks, the narrowing of attention and the deterioration of decision-making would directly affect the perception and projection of the pilot, resulting in a reduced SA [12]. The consequences of a decreased SA are particularly severe under high-stress environments, as these tasks are often critical, and any cognitive error can significantly amplify the risk of accidents [13,14]. Therefore, sustaining a decent situation awareness is vital for pilot to maintain task performance and ensure flight safety, especially under high-stress task conditions [15,16,17]. The usage of physiological features in monitoring and classifying the pilot’s SA can improve the understanding of changes in pilot’s state during flight. Further, the pilot’s SA discrimination can also guide pilot training, enhance pilot operation capabilities, and provide a reference for the dynamic human–machine function distribution and intelligent cockpit design, which are particularly essential and valuable during high-stress tasks.
The most commonly used physiological features for assessing an operator’s SA are ET and HRV, followed by EEG and electrodermal activity (EDA) [18]. Researchers have proved the validity of these biometric measurements and have made positive strides in developing SA classification models. Previous studies initially focused on implementing a binary classification of SA. For instance, Feng et al. examined the EEG features that were sensitive to SA and subsequently classified SA levels based on them using the multi-attribute task battery (MATB) II, achieving an accuracy of 92% [19]. In contrast, other researchers have invested in the application of multimodal physiological features and deep learning algorithms in SA classification. Yang et al. proposed a neural network for two-class SA recognition in autonomous driving, which achieved the highest accuracy of 90.6% by utilizing 11 EEG and ET features [20]. Afterward, studies shifted their focus to SA multiclassification and further discussed the combination of diverse physiological features. For example, Li et al. proposed a two-phase analytical methodology to identify neuro-physiological patterns related to SA and to hierarchically recognize air traffic controllers’ (ATCOs’) SA loss and workload concerns. The models used EEG and eye-tracking features and employed the SVM-R to initially classify SA in a binary manner, achieving an accuracy of 76.1%, and then identified the high workload related to the low SA state with the linear regression (LR) classifier, achieving an accuracy of 82.7%. Although the models were primarily binary classification models for SA and workload, they provided a new perspective on personnel state recognition [21]. To increase the classification precision, Zheng et al. developed a prediction framework to identify the driver’s SA in non-driving-related tasks (NDRT) on four levels; the XGBoost classifier achieved an accuracy of 82.5%. In more detail, the research utilized the driver’s ET, vehicle parameters, and traffic conditions features as inputs. The consideration of environmentally relevant features in the model input is one of the highlights of the study [22].
SA identification is a subset of human state identification. By broadening the research perspective beyond the constraints of SA, insights from related areas, such as workload or stress recognition, can provide valuable guidance for developing methods to process multimodal data and construct effective model structures [23,24]. First, in the context of feature selection, the consideration of multimodal features is advantageous. Previous research has pointed out that integrating various modal data could mitigate the shortcomings of using a single data source and provide more comprehensive information [9]. Moreover, feature extraction methods are worth deliberation. Leveraging signals based on time windows could alleviate the issue of small sample sizes in ergonomics experiments [25,26] and thus enhance model reliability and accuracy. For instance, the stress detection study by Finseth et al. suggested that models personalized with time-series intervals could classify the three stress levels more accurately [27]. Furthermore, selecting appropriate model structures with customized backbones is essential for strengthening the connections between input features and their respective targets. For complex modalities like EEG, different indicators and model structures could be taken into consideration [28]. For example, Wang et al. advocated for a transformer-based model based on EEG features, which enhanced transformer structures’ ability to capture EEG feature associations, improving their emotion recognition accuracy [29]. Additionally, in terms of multimodal fusion, employing various fusion techniques, especially decision-level fusion, could enrich the understanding of human states by amalgamating various features collected across multiple modalities, which has been proven to be effective in uncovering comprehensive indicators of human emotion and cognitive load [30,31].
In former attempts to classify SA, certain limitations came to light. Primarily, the research has concentrated on the vehicular domain, which has significantly overshadowed the field of aviation and pilots as operators. While the studies by Feng et al. investigated SA discrimination using aviation-related experimental tasks, there remains a significant gap between the simulation fidelity of these experimental environments and real-flight scenarios [19,32]. Consequently, existing models exhibit limited migration capabilities when applied to aviation tasks, especially in high-stress situations. Given the complexity of flight tasks and the stringent safety requisites, there is a pressing need for research aimed explicitly at assessing pilots’ SA [33]. Furthermore, most of the existing research is still focused on SA binary classification, with classification precision falling short of practical requirements. Conversely, the use of more classification categories sacrifices model accuracy, indicating room for further improvement. The above limitation may be traced to the fact that the methodological approaches used appear rudimentary, predominantly relying on one or two types of physiological modalities as input [34,35,36] and utilizing traditional machine learning algorithms (LR, decision tree, SVM, etc.) [21,32]. Additionally, the handling of multimodal features mainly remained at data-level and feature-level fusion [21,22]. Referring to relevant studies on personnel state discrimination, it is evident that SA models could greatly benefit from exploring more sophisticated algorithms to achieve a higher classification precision and accuracy.
The primary objective of this research is to develop a multi-level SA discrimination model for pilots facing high-stress flight tasks. To achieve this, this current study conducted an experiment on a fighter simulator and induced different SA levels among participants. During the experiment, participants’ situation awareness was quantified, and their physiological signals, including eye movement, PPG, and EEG, were collected. Based on the experimentally collected data, a sample set was constructed, and deep learning methods (multilayer perceptron (MLP) and attention mechanism) were employed for modeling. According to the evaluation and comparison of the unimodal and multimodal models of ET, HRV, and EEG features, the results revealed that the three-modality model, which integrates MLP and attention mechanism backbones, demonstrated a superior performance. Ultimately, the study established a triple-level SA discrimination model for pilots, utilizing the features mentioned above and providing a foundational framework for the real-time evaluation of SA under high-stress aerial operating conditions.

2. Methodology

An outline of the SA discrimination model is demonstrated in Figure 1, which consists of four parts: the flight simulation experiment, data acquisition and preprocessing, modal fusion and model construction, and a visualization of the results and performance evaluation. The simulated experiment recorded the Situation Awareness Global Assessment Technique (SAGAT) and Three-Dimensional Situation Awareness Rating Technique (3-D SART) results for the SA post-evaluation, along with the simultaneously collected physiological data (eye movement, PPG, and EEG signals). A two-phase data analysis process was conducted in the present study: participants’ SA was firstly leveled using the SAGAT and 3-D SART results, and then ET (from eye movement), HRV (from PPG signals), and EEG frequency band (from EEG signals) features were extracted. After data processing, the features were applied in the three-level SA discrimination model construction using supervised algorithms, and different modalities and structures were attempted during the process. Eventually, the model performance was evaluated, compared, and visualized using evaluation metrics such as accuracy and Receiver Operating Characteristic (ROC) curves to obtain the optimal SA discrimination model.

2.1. Flight Simulation Experiment

2.1.1. Apparatus

The experiment was implemented on a high-fidelity fighter simulator, which is capable of simulating regular flight tasks (e.g., take-off, climb, cruise, approaching, and landing) and typical combat tasks (e.g., target detection, air-to-air combat, air-to-ground combat, and evasion). The simulator provides an authentic and realistic simulation of the aircraft and tasks. As shown in Figure 1, the simulator consists of a cockpit hardware system, flight simulation software, and a measurement and control system. The cockpit hardware system comprises a high-resolution screen for visual simulation, a seat, a set of joystick and throttle, and pedals. The software can simulate various flight conditions (e.g., daytime and nighttime) and accurately display the cockpit interface from the pilot’s perspective. The cockpit interface contains the Head-Up Display (HUD) and Multi-Function Displays (MFDs), providing the necessary information for participants to execute the experimental tasks.

2.1.2. Experimental Design and Task

The experiment utilized a single-factor, three-level, within-subjects design. The independent variable was the amount of accessible information, which could be controlled by adjusting the quantity of task-relevant information provided to the participants and the difficulties of information acquisition in the day/night environments. The design aimed to induce different levels of situation awareness among the participants [37]. The dependent variables were participants’ SA, eye-tracking, HRV, and EEG indicators.
Specifically, three scenarios, with different amounts of accessible information for flight task completion, were adopted in this study: the Sufficient amount of Information (SI) scenario, the Moderate amount of Information (MI) scenario, and the Lack of Information (LI) scenario. In the SI scenario, the participant operates during the daytime and is aware of the location and number of targets. In the MI scenario, the participant operates during the nighttime and is aware of the location and number of targets. In the LI scenario, the participant operates during nighttime without being aware of the location and number of targets. The high-stress flight tasks employed in the current study were air-to-air and air-to-ground combat missions due to their complicated and rapidly changing circumstances, along with their high time pressure [38]. In these missions, participants were required to select the appropriate flight mode, choose a suitable weapon, detect and lock onto the target, fire the weapon, and ultimately assess the damage inflicted on the target. The operational environment and target location for air-to-air combat and air-to-ground combat missions in different scenarios are shown schematically in Figure 2.

2.1.3. Participants

Twelve graduate students (nine males, mean age: 25.58, SD: 1.71) from the School of Aeronautic Science and Engineering, Beihang University, were recruited in the experiment, with professional knowledge and rich experience in flight simulator operation. All participants were right-handed, without color blindness or color deficiency, and possessed normal or corrected-to-normal vision. The day before the experiment, participants all maintained a healthy state, guaranteed they had sufficient rest, and avoided strenuous exercise. Informed consent forms were signed by participants before the formal experiment, and the study was approved by the Biological and Medical Ethics Committee of Beihang University (Approval No: BM20240281).

2.1.4. Procedure

Participants received adequate flight simulation training until they were able to hit the target during the simulation before starting the formal experiment. Each participant was required to complete the flight tasks under three experimental scenarios, and each task lasted no more than 10 min. During air-to-air combat and air-to-ground combat tasks, the simulation was frozen so that the participant could answer the SAGAT questions. After each task, the participant was required to complete the 3-D SART scale. Eye movement was measured, and neural activities measured by EEG and PPG were recorded throughout the experiment. To reduce the fatigue effect, participants rested for 5 min between tasks. To balance the impact of practice, the experimental sequence adopted a Latin square design.

2.2. Data Acquisition and Preprocessing

The experiment involved 12 participants, with each completing six flight simulation tasks (two tasks each in three scenarios), resulting in a total of 72 task records. The participants’ SA level was considered to remain consistent within each task completed in each scenario. Meanwhile, a 30 s time window was selected for feature extraction from continuous physiological signals. The selection considered the characteristics of different physiological features and the requirement for a sufficient sample size in the training set. A 30 s time window is commonly used to extract EEG frequency bands [39], which was proven effective in relevant research [40]. A shorter time window may not fully characterize the physiological features, while a longer time window may reduce the sample size. In total, 592 samples were collected; each piece of data contained the feature results and their corresponding SA label over a 30 s period.

2.2.1. SA Measurement and Labeling

SA was assessed using the classical SAGAT questions and 3-D SART scale. The combination of both measurements can encompass various aspects of the SA evaluation, offering a comprehensive and objective approach [41]. The SAGAT quantifies the subject’s SA based on the percentage of correct responses, i.e., SAGAT accuracy [42]. The 3-D SART assessed SA from the perspective of the demands (D) on attentional resources, the supply (S) of attentional resources, and the understanding (U) of the situation. Accordingly, SA score was calculated using the formula SA = U − (D − S) [4]. After obtaining the quantitative SA assessment results, the SAGAT accuracies and SART scores were standardized using the max–min method. After this, they were combined to grade the participants’ SA level using the entropy weight method, since this assigns weights objectively based on the inherent characteristics of the data [43]. Specifically, according to the calculation based on the entropy weight method, the weight of SAGAT’s accuracy was 57.26%, and the SART scale score was 42.74%. The participants’ SA levels were categorized as high SA (HSA), moderate SA (MSA), and low SA (LSA) according to their combined SA scores, ranging from highest to lowest. Out of the 72 task records, there were 27 pieces of LSA records, 22 pieces of MSA records, and 23 pieces of HSA records. Corresponding to the 592 pieces of data, there were 187 pieces of HSA samples, 167 pieces of MSA samples, and 238 pieces of LSA samples.

2.2.2. Physiological Measurement and Feature Extraction

The physiological signals (eye movement video, PPG signal, and EEG signal) of each participant were recorded continuously during each task in each scenario. These three modalities were chosen for their wide usage in existing studies and strong correlation with SA [18].
Eye-Tracking Features. Eye movements were tracked with a sampling rate of 50 Hz via a wearable eye-tracking system (Tobii Glass 2, Tobii Technology, Stockholm, Sweden). The raw eye-tracking data were processed using Tobii Pro Lab software (version 1.123) to extract eye-tracking features. The eye-tracking features are summarized in Table 1, including fixation-based metrics, saccade-based metrics, and blink-based metrics.
HRV Features. The PPG signal was recorded by a wearable PPG sensor (Ergolab portable physiological device, Kingfar International, Beijing, China) with a sampling rate of 64 Hz, which detected blood volume changes in the tissue’s microvascular bed. The Python Toolbox NeuroKit2 (version 0.2.10) [44] was used for signal filtering, QRS detection, and spectrum analysis. HRV features were calculated in the time, frequency, and non-linear domains, as shown in Table 2. The power spectral density of the interbeat intervals was estimated with Welch’s method to extract frequency domain features, and the Poincaré analysis calculated non-linear domain features. Notably, the low-frequency (LF) components, which fall within the range of 0.04 to 0.5 Hz, should ideally be extracted from a minimum time window of 2 min. Given that a 30 s time window was utilized in the current study, the LF and LF/HF features were not applicable.
EEG Features. A Neuroscan Nuamps amplifier (Compumedics Limited, Victoria, Australia) was utilized to acquire EEG signals from 32 channels, including F7, FT7, T3, TP7, T5, A1, FP1, F3, FC3, C3, CP3, P3, O1, FZ, FCZ, CZ, CPZ, PZ, OZ, FP2, F4, FC4, C4, CP4, P4, O2, F8, FT8, T4, TP8, T6, and A2. All electrodes used Ag/Agcl with a recording bandwidth of 0–200 Hz and a sampling rate of 1000 Hz. The right mastoid A2 was used as the reference point. Nine channels in three brain regions (frontal: F3, FZ, F4; central: C3, CZ, C4; parietal: P3, PZ, P4) were considered for the analysis of EEG spectral features, as they were proved to be closely connected with the process of SA construction [45,46].
MNE-Python (version 1.6.1) [47] was applied for EEG signal processing and feature extraction. Initially, a band-pass filter and Independent Component Analysis (ICA) were applied to remove noise and artifacts (such as eye movements and muscle activity) from the brain-related components. After ICA decomposition, the power spectral density (PSD) of the EEG signals was computed using the Welch method [48] in typical frequency bands: the θ (4–7 Hz), α (8–13 Hz), and β (13–30 Hz) bands. Afterward, two typical slow-wave/fast-wave (SW/FW) metrics, including (θ + α)/β and (θ + α)/(α + β), were further computed to better characterize the participant’s SA [32,49]. In conclusion, a total of 18 EEG features (2 SW/FW features × 9 EEG channels) were extracted for further SA discrimination.
In summary, 6 ET features, 5 HRV features, and 18 EEG features were extracted every 30 s to represent participants’ physiological activities.

2.3. Deep Learning Models and Methods

After initial tests with traditional machine learning methods, such as RF, SVM, and KNN, which demonstrated unsatisfactory performance (with the highest accuracy reaching only 64.36% in unimodal and 71.11% in multimodal contexts), deep learning algorithms emerged as a promising alternative. As deep learning algorithms can learn and extract patterns from high-dimensional and non-linear features, they are well-suited for distinguishing individual states based on physiological features. Therefore, the current study applied artificial neural networks to achieve SA discrimination in high-stress flight tasks. Firstly, MLP was employed to construct SA discrimination models based on a single physiological modality corresponding to Model A1 (ET), Model A2 (HRV), and Model A3 (EEG). A multi-head self-attention mechanism, denoted as Model B, was introduced into the EEG modality. The mechanism is expected to learn discriminative spatial information hierarchically from the electrode to brain-region levels and enhance accuracy [29,50]. Further, considering that different physiological modalities can provide information from different perspectives, a feature layer fusion method was introduced to construct multi-physiological modality-based SA discrimination models, corresponding to Models C1 and C2. The input features of the six models are summarized in Table 3.

2.3.1. Model Architecture

Model A. All three single-modal models, named Model A (including Model A1, Model A2, Model A3), utilize the MLP structure, with the corresponding physiological features being used as inputs, as shown in Figure 3. The input layer connects with hidden layers (three layers for ET and HRV; two layers for EEG), and each layer is followed by batch normalization (BN) and the Parametric ReLU (PReLU) activation function. This aims to enhance the model’s stability and introduce nonlinearity, allowing the neural network to learn and represent complex non-linear relationships. PReLU was chosen to reduce the risk of neurons becoming inactive and help the network to better fit the data. Also, dropout was used to help prevent reliance on specific neurons and promote robustness.
Model B. Model B is configured with a multi-head self-attention mechanism; the model structure is shown in Figure 4. To introduce sufficient awareness of the discriminative spatial information transported across electrodes to the brain-region level in EEG features, the sin and cos functions with different frequencies were implemented for positional encoding (PE). PE is calculated with Equations (1) and (2), where p o s is the position index, i is the dimension index, and d m o d e l is the total dimension of the model [51].
P E p o s , 2 i = sin p o s 10000 2 i d m o d e l
P E p o s , 2 i + 1 = cos p o s 10000 2 i d m o d e l
The self-attention mechanism operates by first projecting the input embeddings into three distinct linear transformations, queries (Q), keys (K), and values (V), as in Equations (3) and (4), where d k is the dimension of the K matrix, X is the intermediate variable obtained by the linear embedding mapping of the input vector, and W is the weight matrix.
A t t e n t i o n Q , K , V = S o f t m a x Q K T d k V
Q = W Q X ,   K = W K X ,   V = W V X
To ensure that the model can focus on all types of information simultaneously, multiple sets of W Q ,   W K ,   W V are established, and their outputs are concatenated. This multiple attention mechanism can be represented by Equations (5) and (6), where h e a d i is the output of the i-th attention head, and Z is the output matrix. In this work, Model B employed eight parallel attention heads and six layers of self-attention mechanism.
h e a d i = A t t e n t i o n Q , K , V i
Z = M u l t i H e a d Q , K , V = C o n c a t h e a d 1 , h e a d 2 , , h e a d n W Z
Additionally, residual connection and layer normalization are utilized to ensure information transfer and retention in each sublayer. The structure helps to retain information and ensure model performance, allows the network to focus only on the current difference, and helps to accelerate the convergence process. In the encoder architecture, dropout is applied to the outputs of the attention layers and the feed-forward layers to prevent overfitting.
In addition, Model B incorporates a one-dimensional convolutional neural network into the attention mechanism structure. This combination leverages CNN’s strength in capturing local features and the attention mechanism’s ability to model sequential data, resulting in an improvement in model performance. The convolutional layer utilizes a 3 × 3-sized convolutional kernel for the operation, with padding at the edges and ELU serving as the activation function.
Model C. As the multimodal model, Model C (including Model C1 and Model C2) utilizes decision-level fusion on physiological features from different modalities, as shown in Figure 5. Decision-level fusion is opted due to its advantage in extracting the unique information inherent in each modality. In the current research, different physiological modalities indicate the distinct physical meanings and perspectives of the physiological activity; thus, it is reasonable to utilize individualized processing through different backbones [52]. Features are extracted independently from each source and passed to their respective classification modules for individual outputs. In Models C1 and C2, the ET and HRV modalities are both processed with the MLP backbone, as in Models A1 and A2. The primary difference between Model C lies in the processing structure of the EEG modality before concatenation. In Model C1, the EEG features are processed using the MLP backbone (Model A3), whereas in Model C2, the EEG features undergo processing through an attention mechanism backbone (Model B). Subsequently, the fusion module is represented by an MLP with two hidden layers and one output layer. This consolidates these individual outputs to yield a final classification outcome, followed by a SoftMax layer for the final classification output. In addition, dropout was used to help prevent overfitting.

2.3.2. Model Processing and Evaluation

Data normalization and outlier handling. To eliminate the influence of differing physiological features scales on the feature values, each input feature underwent Z-score normalization along its dimension. Z-score normalization preserves the original distributional characteristics of the data and ensures that each feature contributes equally to the model, which is particularly beneficial when dealing with features of different scales [53]. Considering the above advantages and the common use of Z-score normalization in related studies [26,34], it was employed in the current dataset. Z-score normalization is calculated as described by Equation (7), where x represents the input data, μ is the average value, and σ is the standard deviation. To mitigate outliers’ impact on the model, the 3σ-rule was employed for outlier detection, filtering, and replacement. The normalization and outliner handling declined the influence of extreme values and ultimately enhanced the robustness and reliability of the model.
z = x μ σ
Cross Validation. Cross-validation reduces the risk of overfitting and offers a reliable estimate of the model’s generalization capability. In the current study, five-fold cross-validation was performed on the dataset to optimize the hyperparameters of each model. Specifically, the dataset was split into five folds. During training, the model was trained on four of these folds and tested on the remaining fold. This training process was repeated five times, with each fold being utilized as the test set exactly once. Subsequently, the results from these iterations were averaged to acquire a final performance metric. Across the five folds, the model that demonstrates the best average performance was then selected as the ultimate model.
Loss function and optimizer. The Cross-Entropy Loss function was utilized in the models, as it is well-suited to multi-class classification tasks. The loss value is calculated by Equations (8) and (9), where x is the input, y is the target, w is the class weight, C is the number of classes, and n denotes the minibatch dimension in the N-dimensional case.
l x , y = n = 1 N 1 n = 1 N ω y n l n
l n = ω y n log e x p ( x n , y n ) c = 1 C e x p ( x n , c )
The optimizer was chosen based on the model’s architecture. The stochastic gradient descent (SGD) is preferred for MLP due to its simplicity, stability, and efficiency in optimizing relatively lower complex models. Thus, it was implemented for Model A and Model C1 with a momentum of 0.9 and a learning rate of 0.01. On the other hand, the Adam optimizer was used for models with the attention mechanism, as in Model B and Model C2, as it is better suited to handling the complexities of deep and intricate architectures, providing adaptive learning rates and faster convergence. The learning rate used for the Adam optimizer was 1 × 10⁻⁴. Furthermore, a cosine learning rate scheduler was implemented in conjunction with the Adam optimizer to enhance the training stability.
Evaluation and Visualization. Four key performance metrics were utilized to assess the model’s effectiveness, including accuracy, precision, recall, and F1 score. Accuracy offers a broad assessment of the model’s performance, precision evaluates the accuracy of positive predictions, recall measures the model’s ability to correctly identify all actual positive instances, and the F1 score balances precision and recall to provide a single measure that accounts for both false positives and false negatives. Due to the uneven sample size of the three SA categories in the training set, the metrics were calculated with a weighted average across classes. Additionally, the models’ performance was visualized with confusion matrixes and ROC curves. The confusion matrix offers a comprehensive view of the model’s performance across all classes. The ROC curve plots the true positive rate (sensitivity) against the false positive rate (1-specificity) at various threshold settings, which provides an insight into the trade-off between sensitivity and specificity. The Area Under the Curve (AUC) of the ROC curve serves as a single metric summarizing the model’s overall performance. Values closer to 1 indicate better discrimination. The confusion matrix provides a complete view of the model’s performance across all classes.

3. Results

3.1. General Results

The models’ classification performances are listed in Table 4, including accuracy, precision, recall, and F1 score, as well as the AUC for the ROC curves of category LSA, category MSA, and category HSA. To guarantee reproducibility, the random seed was set 20 times during model training and testing. The values reported in this Table represent the average results with standard deviations across these 20 runs.
Model performance metrics were compared using analysis of variance (ANOVA), with Tukey’s HSD correction applied for post hoc comparisons, as shown in Figure 6. Initially, for the unimodal models, the ANOVA results revealed significant differences in accuracy (F(3, 76) = 2648, p < 0.001) and F1 Score (F(3, 76) = 2529, p < 0.001). The post hoc comparisons for accuracy and F1 score indicated significant differences among all unimodal model pairs (p < 0.001), except for the comparison between Model A3 and Model B (Accuracy: p = 0.074, F1 Score: p = 0.081). Furthermore, when comparing the highest-performing unimodal model, Model B, with the multimodal models (Model C), the ANOVA results indicated significant differences in accuracy (F(2, 57) = 368, p < 0.001) and F1 scores (F(2, 57) = 362, p < 0.001). Post hoc comparisons for both accuracy and F1 scores showed significant differences among all model pairs (p < 0.001).

3.2. Unimodal Models

Figure 7 shows the confusion matrixes for Model A and Model B, with the highest accuracy, and Figure 8 shows the ROC curves. When using the MLP structure, Model A3 demonstrated the best performance, with the highest average accuracy (76.59% compared to 60.62% and 57.47% in Models A1 and A2, respectively). When the attention mechanism structure is applied to the EEG modality, the performance of Model B is further improved compared to that of Model A3, with an average accuracy of 77.10%.
In general, Model B obtained the best performance, with the highest AUC in the LSA category (0.93), MSA category (0.91), and HSA category (0.91). Model A3 (EEG modality) ranked second, with specific AUC values of 0.90, 0.90, and 0.91 for the LSA, MSA, and HSA categories, respectively. Model A1 (ET modality) achieved the third-best performance, with specific AUC values of 0.78, 0.75, and 0.76 for the LSA, MSA, and HSA categories, respectively. Model A2 (HRV modality) had the lowest AUC in the LSA category, at 0.75, the lowest AUC in the MSA category, at 0.74, and the lowest AUC in the HSA category, at 0.75.

3.3. Multimodal Models

The confusion matrixes for Model C with the highest accuracy are shown in Figure 9, and the ROC curves are shown in Figure 10. Both models achieved an accuracy higher than 80%, and Model C2 performed better than Model C1. Model C2 achieved an average accuracy of 83.41%, a precision of 0.8347, a recall of 0.8341, and an F1 score of 0.8341, with specific AUC values of 0.94, 0.95, and 0.94 for the LSA, MSA, and HSA categories, respectively. Model C1 obtained an average accuracy of 81.45%, a precision of 0.8155, a recall of 0.8145, and an F1 score of 0.8146, with AUC values of 0.93, 0.92, and 0.93 for the LSA, MSA, and HSA categories, respectively.

4. Discussion

This study aimed to construct a pilot SA discrimination model based on physiological features facing high-stress flight tasks, which is expected to support further research on human–machine function allocation in intelligent cockpits. Specifically, a flight simulation experiment was conducted, and typical high-stress flight scenarios were designed to fully induce different SA levels in the participants. Throughout the experiment, the participant’s SA was directly quantified, labeled with SAGAT and 3-D SART methods, and monitored via physiological measurement. Subsequently, physiological features (i.e., ET, HRV, and EEG) were obtained and leveraged to construct models for differentiating SA levels via supervised learning. For ET and HRV features, a multilayer perceptron was employed, while an attention mechanism was applied to the EEG features, demonstrating notable effectiveness. In addition, a comparison of the unimodal and multimodal models indicates that the model combining MLP and attention mechanisms across the three modalities achieved an average accuracy of 83.41% in triple-SA classification.
In the comparison of unimodal models employing the same MLP structure (Model As), it is evident that the EEG modality model (Model A3) significantly the surpassed ET and HRV modalities (Model A1 and Model A2), with 76.59% accuracy, an F1 score of 0.7712, and a micro-average AUC of 0.90 (p < 0.001). Additionally, the ROC curves intuitively indicate that Model A3 has the best ability to make a balanced classification. This superiority indicates the probable closer association of EEG signals with changes in SA compared to other physiological characteristics. This connection likely arises from the fact that EEG signals reflect attention and memory, which play a key role in the perception and maintenance of situation-relevant information, both of which are essential for accurate SA [54]. For instance, the activities at the α wave were correlated with attentional requirements and working memory [55]; the β wave, which is linked to active thinking and alertness, has been employed in SA classification [19]; the θ wave was demonstrated to be closely associated with memory processing [56]. In a similar study by Yang et al., the comparison of models with EEG and ET features yielded similar accuracy, potentially due to their use of the absolute and relative power of α, β, and θ as inputs [20]. The above results indicate that the EEG features (i.e., SW/FW features in frontal, parietal, and central) chosen for Model A3 offer richer feature information on SA compared to the absolute and relative power features. Moreover, the performance of Model A1 based on ET features (with an average accuracy of 60.62%) significantly (p < 0.001) surpasses that of Model A2, based on HRV features (with an average accuracy of 57.47%). This outcome may be attributed to the fact that the ET features better reflect the operator’s information perception and attention [57], while the HRV features better reflect the operator’s workload and tension [58].
Inspired by similar studies [59], an attention mechanism was introduced into the processing of EEG features to improve its ability to distinguish different SA levels. The attention mechanism is believed to be effective in capturing important features when processing high-dimensional and complex data [29]. The study compares Model B, which uses the attention mechanism, with Model A3, an MLP structure with the same EEG features. The results show that Model B outperformed Model A3 in terms of SA classification, achieving 76.59% accuracy and a 0.92 micro-average AUC, while Model A3 achieved 77.10% accuracy and a 0.90 micro-average AUC. Compared with similar studies utilizing SW/FW features, Model B demonstrated a higher accuracy than the SA binary discrimination model (70.8% by Feng et al.) [32]. Moreover, Model C2 performed significantly better than Model C1 (p < 0.001). According to the ROC curves, Model C2 shows an improvement over Model C1, particularly in its ability to distinguish MSA samples, with AUC values of 0.95 and 0.92, respectively. This suggests that the attention mechanism backbone is advantageous for the more efficient processing of EEG features. EEG signals are recorded from multiple electrodes on the scalp, capturing electrical activity from different brain regions over time and thus providing valuable spatial information [55,60]. Accordingly, the attention mechanism enhances the SA-discrimination capability of the EEG features by incorporating spatial patterns containing relevant information from channel locations through position encoding [61], which is challenging to accomplish with the traditional MLP structure. The result provides new insights into using EEG features for SA discrimination, showing the attention mechanism’s advantages. Future research can further optimize the design of the attention mechanism and validate its advantage in processing EEG features; for example, by adopting more complex coding strategies or combining other deep learning methods.
Multimodal fusion, specifically decision-level fusion in the current study, effectively increased the SA model’s discrimination accuracy. Sharing the same backbone, Model C1 improved its performance compared to the unimodal Model A, boosting its accuracy to 81.45% from the unimodal baseline, with a micro-average AUC value of 0.93. Similarly, Model C2 outperformed Model B, enhancing its accuracy to 83.41% and achieving a micro-average AUC of 0.95. This is due to the fact that different modalities contain varying physiological information and reflect changes in personnel status from different perspectives. Decision-level fusion enabled individualized processing through different backbones, which more effectively extracted unique information. By combining data from these different modalities, the model can comprehensively discriminate SA and improve accuracy [52]. In addition to the intuitive advantages of the enhanced accuracy, multimodal fusion can reduce the biases and limitations that may be introduced by single-modal data and enhance the robustness and generalization ability of the model. Therefore, multimodal fusion not only improves classification accuracy but also paves the way for the development of more intelligent SA monitoring systems in the future [62].
The present study has several limitations that are worth noting. First and foremost, the experiment was conducted on a flight simulator, with participants possessing professional aviation knowledge but lacking actual flight experience as pilots. Despite the use of a high-fidelity simulator and the realistic design of the simulation tasks in this study, there are still gaps compared to actual flight scenarios. In future research, pilots’ involvement in real flight environments could undoubtedly provide more valuable insights. Furthermore, the limited number of participants may lead to individual differences influencing the discrimination model and the dataset had a relatively small sample size for deep learning, thereby introducing the probable crisis of overfitting. Further verification could be carried out on larger and more diverse datasets. Additionally, more attempts could be made to further improve the model’s performance. For instance, future research could explore a broader range of physiological features (e.g., ERPs, GSR, and EMG), which could provide additional insights into the assessment of SA. Moreover, different feature extraction time windows could be further tested, and hyperparameter optimization techniques and hybrid fusion could be employed to assess potential improvements in the model. Additional metrics, such as precision–recall curves, Kappa statistics, and SHAP values, could be utilized to provide a more comprehensive assessment of model performance. In addition, although the features are extracted from the 30 s time window, enabling the model to discriminate SA in the short-term, real-time discrimination of SA has not been realized in the application of this study. Thus, in future studies, real-time SA monitoring could be conducted based on the current model, wherein physiological features are extracted from sliding time windows.

5. Conclusions

The current study carried out an experiment on a fighter simulator, induced different levels of situation awareness among participants during typical high-stress tasks, and subsequently established an SA discrimination model for pilots based on ET, HRV, and EEG features. Based on the results, the following conclusions can be obtained:
(1)
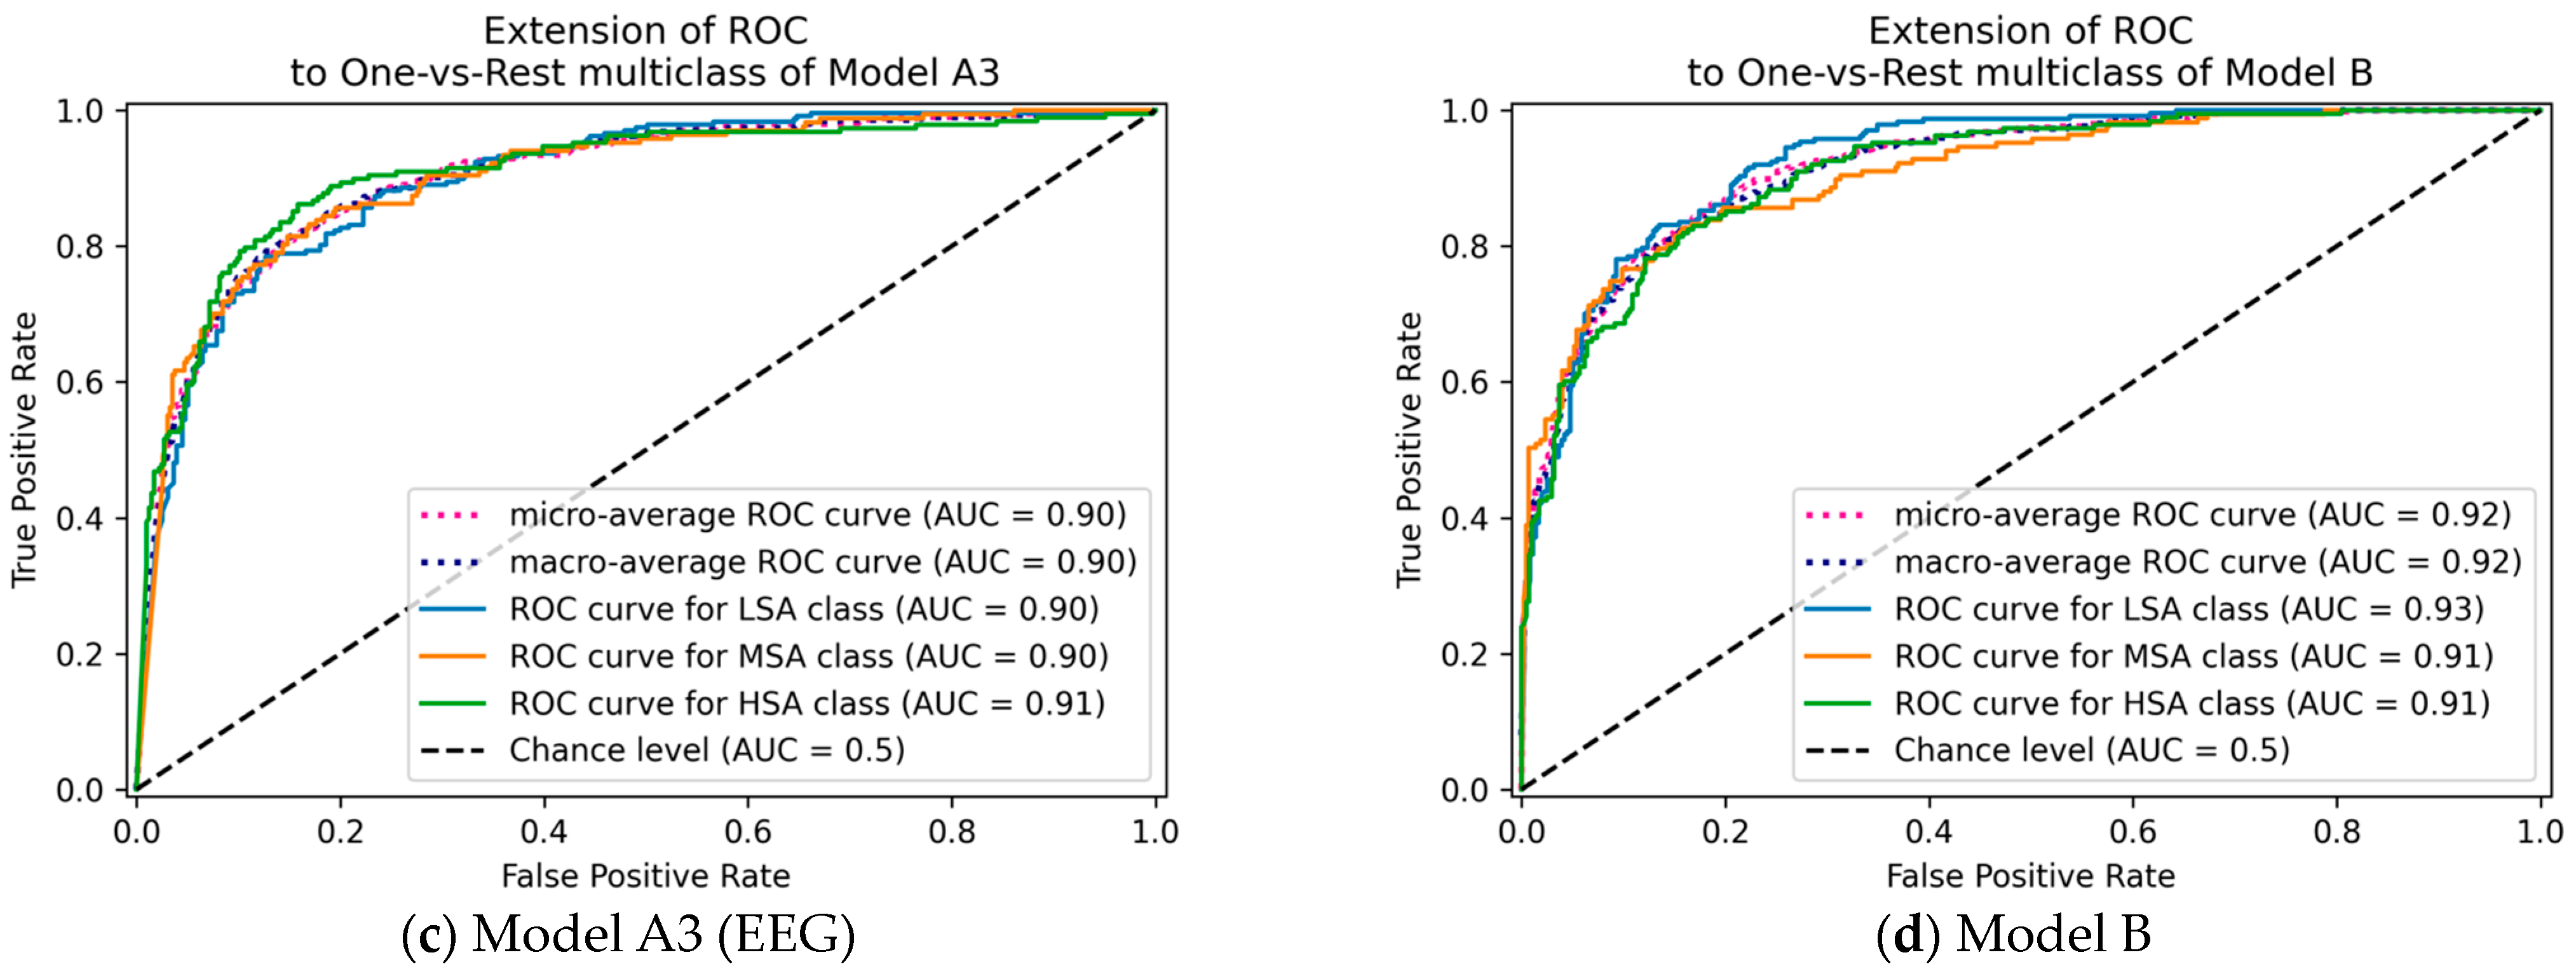
The EEG modality and SW/FW features demonstrate promising potential in SA discrimination, as evidenced by the unimodal model comparison, where the EEG modality model outperformed the ET and HRV modalities.
(2)
The attention mechanism improves the SA discrimination capability of the EEG features compared to the MLP structure by efficiently incorporating relevant information from channel locations.
(3)
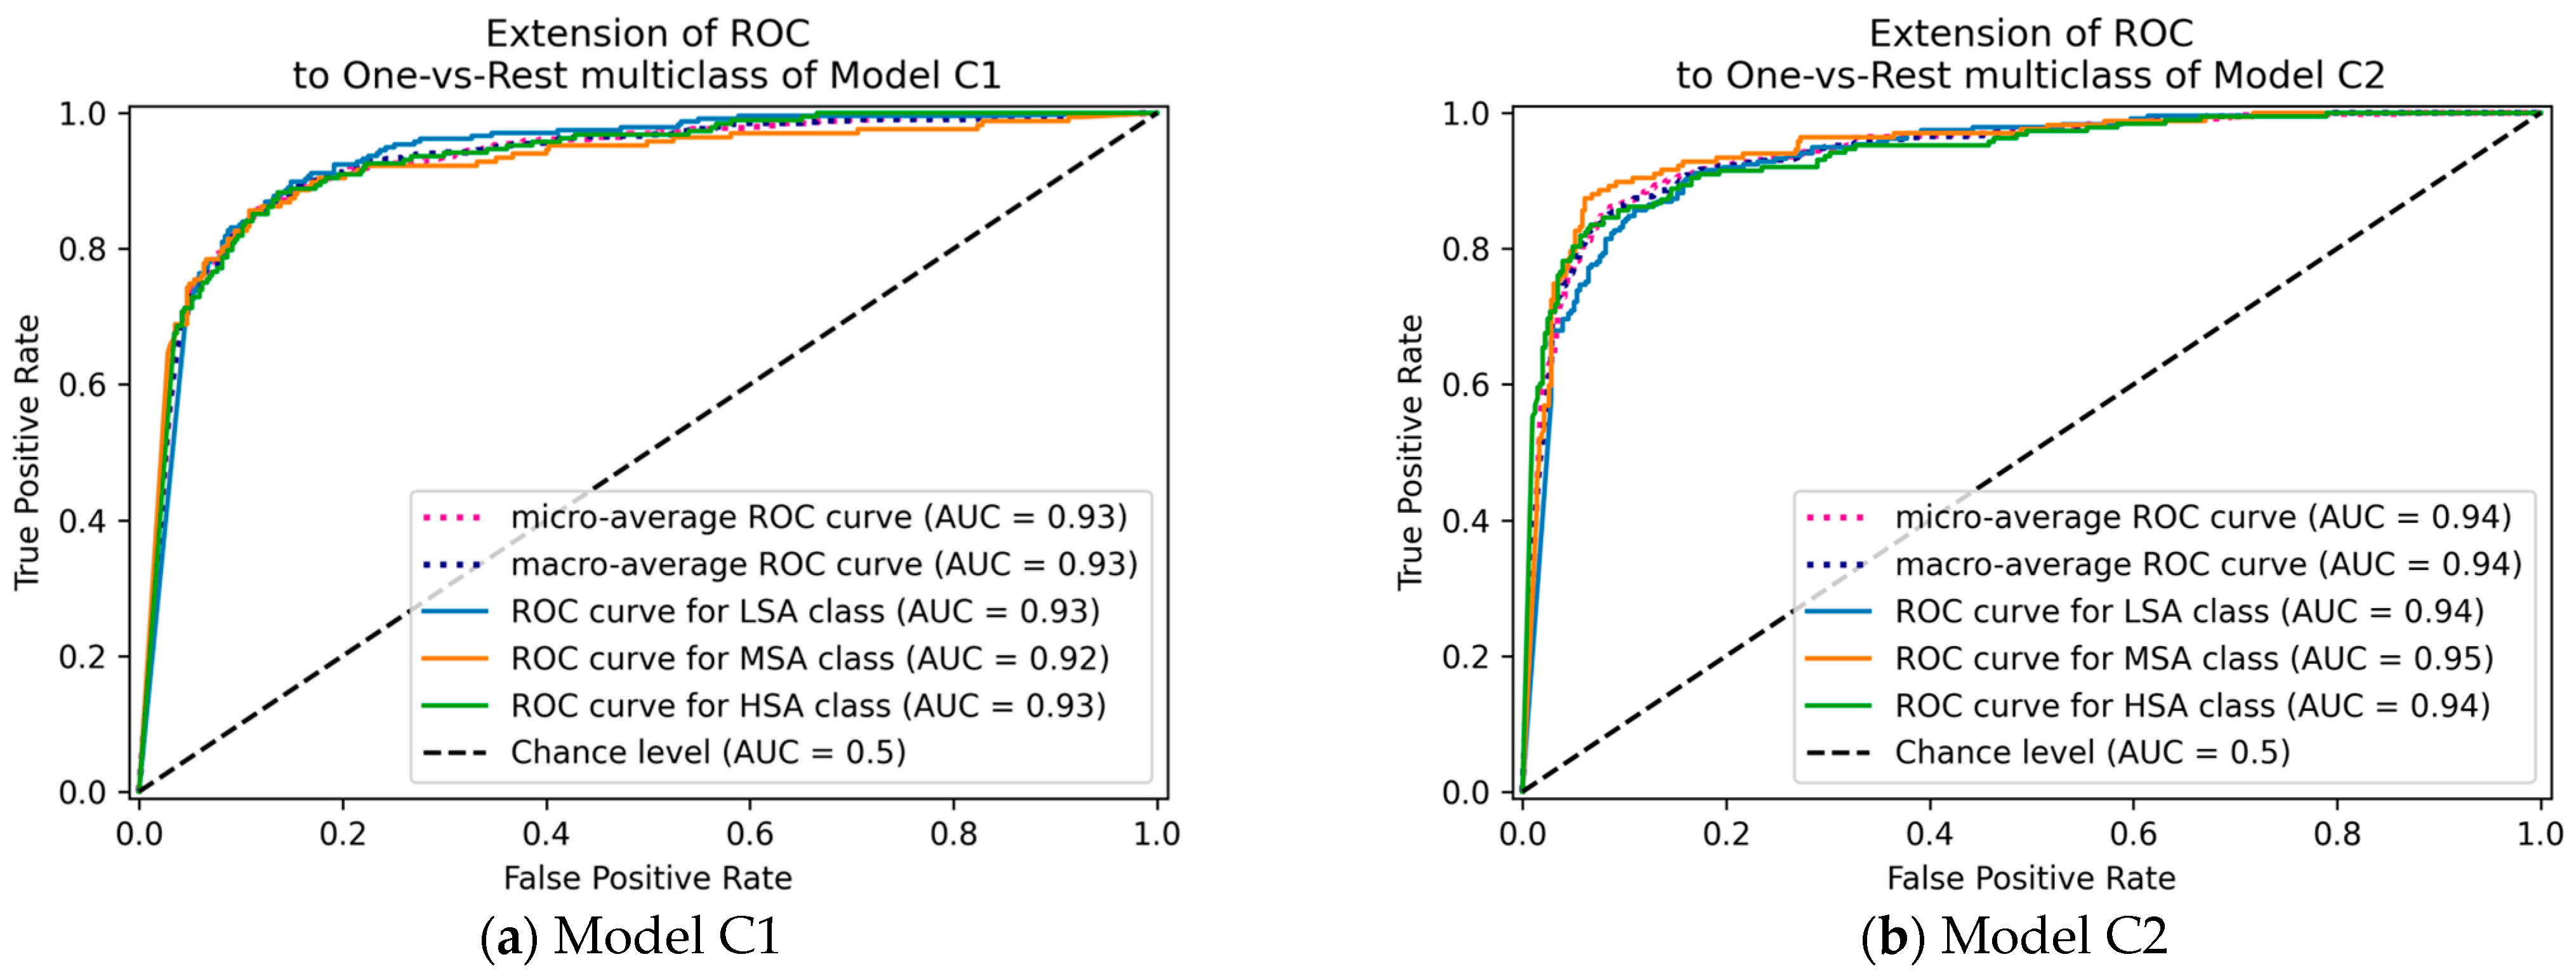
Decision-level fusion integrates unique information from multimodal features and effectively increases the accuracy of the SA model, achieving a best accuracy of 83.41% in triple-class SA discrimination.
Thus, the current research laid the groundwork for the real-time evaluation of SA under high-stress aerial operating conditions. Using the foundation provided by existing models, future research could drive the development of intelligent cockpit systems that dynamically adapt to changing flight conditions and pilot states, reducing flight accidents caused by compromised SA and enhancing overall safety. Furthermore, these improvements could inspire an aerospace human–machine function allocation strategy and pave the way for smarter, more responsive aviation technologies that prioritize both flight safety and operational efficiency.

Author Contributions

Conceptualization, investigation, methodology, formal analysis, validation, visualization, and writing—original draft preparation, C.Q.; conceptualization, formal analysis, investigation, methodology, and resources, S.L.; conceptualization, data curation, funding acquisition, methodology, project administration, resources, supervision, and writing—review and editing, X.W.; investigation, methodology, and funding acquisition, C.F.; investigation and resources, Z.L.; investigation and project administration, W.S.; investigation, methodology, and visualization, Y.W. All authors have read and agreed to the published version of the manuscript.

Funding

This research was funded by the National Natural Science Foundation of China (No. 52402507) and the Aeronautical Science Foundation of China (No. 201813300002).

Data Availability Statement

The data presented in this study are available upon request from the corresponding author. Due to privacy concerns, they are not publicly available.

Acknowledgments

The authors gratefully acknowledge the agencies NSFC and ASFC for the financial support. In addition, the authors acknowledge the subjects for their participation.

Conflicts of Interest

The authors declare no conflicts of interest.

References

  1. Lagomarsino, M.; Lorenzini, M.; Balatti, P.; De Momi, E.; Ajoudani, A. Pick the Right Co-Worker: Online Assessment of Cognitive Ergonomics in Human–Robot Collaborative Assembly. IEEE Trans. Cogn. Dev. Syst. 2022, 15, 1928–1937. [Google Scholar] [CrossRef]
  2. Wang, R.; Zhao, D.; Min, B.-C. Initial Task Allocation for Multi-Human Multi-Robot Teams with Attention-Based Deep Reinforcement Learning. In Proceedings of the 2023 IEEE/RSJ International Conference on Intelligent Robots and Systems (IROS), Detroit, MI, USA, 1–5 October 2023; IEEE: Piscataway, NJ, USA, 2023; pp. 7915–7922. [Google Scholar]
  3. Bolton, M.L.; Biltekoff, E.; Humphrey, L. The Level of Measurement of Subjective Situation Awareness and Its Dimensions in the Situation Awareness Rating Technique (SART). IEEE Trans. Hum. Mach. Syst. 2021, 52, 1147–1154. [Google Scholar] [CrossRef]
  4. Taylor, R.M. Situational Awareness Rating Technique (SART): The Development of a Tool for Aircrew Systems Design. In Situational Awareness; Routledge: London, UK, 2017; pp. 111–128. [Google Scholar]
  5. Liu, S.; Wanyan, X.; Zhuang, D. Modeling the Situation Awareness by the Analysis of Cognitive Process. Biomed. Mater. Eng. 2014, 24, 2311–2318. [Google Scholar] [CrossRef] [PubMed]
  6. Liang, N.; Yang, J.; Yu, D.; Prakah-Asante, K.O.; Curry, R.; Blommer, M.; Swaminathan, R.; Pitts, B.J. Using Eye-Tracking to Investigate the Effects of Pre-Takeover Visual Engagement on Situation Awareness during Automated Driving. Accid. Anal. Prev. 2021, 157, 106143. [Google Scholar] [CrossRef] [PubMed]
  7. Mehta, R.K.; Peres, S.C.; Shortz, A.E.; Hoyle, W.; Lee, M.; Saini, G.; Chan, H.-C.; Pryor, M.W. Operator Situation Awareness and Physiological States during Offshore Well Control Scenarios. J. Loss Prev. Process Ind. 2018, 55, 332–337. [Google Scholar] [CrossRef]
  8. Wang, R.; Jo, W.; Zhao, D.; Wang, W.; Gupte, A.; Yang, B.; Chen, G.; Min, B.-C. Husformer: A Multi-Modal Transformer for Multi-Modal Human State Recognition. IEEE Trans. Cogn. Dev. Syst. 2024, 16, 1374–1390. [Google Scholar] [CrossRef]
  9. Debie, E.; Fernandez Rojas, R.; Fidock, J.; Barlow, M.; Kasmarik, K.; Anavatti, S.; Garratt, M.; Abbass, H.A. Multimodal Fusion for Objective Assessment of Cognitive Workload: A Review. IEEE Trans. Cybern. 2021, 51, 1542–1555. [Google Scholar] [CrossRef]
  10. Endsley, M.R. Toward a Theory of Situation Awareness in Dynamic Systems. Hum. Factors 1995, 37, 32–64. [Google Scholar] [CrossRef]
  11. Endsley, M.R. A Taxonomy of Situation Awareness Errors. Hum. Factors Aviat. Oper. 1995, 3, 287–292. [Google Scholar]
  12. Hidalgo-Muñoz, D.; Matton, D.; El-Yagoubi, D. Influence of Anxiety and Mental Workload on Flight Performance in a Flight Simulator. In Proceedings of the 1st International Conference on Cognitive Aircraft Systems—ICCAS 2020, Toulouse, France, 18–19 March 2020. [Google Scholar]
  13. Masi, G.; Amprimo, G.; Ferraris, C.; Priano, L. Stress and Workload Assessment in Aviation—A Narrative Review. Sensors 2023, 23, 3556. [Google Scholar] [CrossRef]
  14. Villafaina, S.; Dr Fuentes-García, J.P.; Gusi, N.; Tornero-Aguilera, J.F.; Clemente-Suárez, V.J. Psychophysiological Response of Military Pilots in Different Combat Flight Maneuvers in a Flight Simulator. Physiol. Behav. 2021, 238, 113483. [Google Scholar] [CrossRef] [PubMed]
  15. Brennan, P.A.; Holden, C.; Shaw, G.; Morris, S.; Oeppen, R.S. Leading Article: What Can We Do to Improve Individual and Team Situational Awareness to Benefit Patient Safety? Br. J. Oral Maxillofac. Surg. 2020, 58, 404–408. [Google Scholar] [CrossRef] [PubMed]
  16. Zhao, Z.; Niu, Y.; Shen, L. Adaptive Level of Autonomy for Human-UAVs Collaborative Surveillance Using Situated Fuzzy Cognitive Maps. Chin. J. Aeronaut. 2020, 33, 2835–2850. [Google Scholar] [CrossRef]
  17. Endsley, M.R. Designing for Situation Awareness in Complex Systems. In Proceedings of the Second International Workshop on Symbiosis of Humans, Artifacts and Environment, Kyoto, Japan, 12 November 2001; pp. 1–14. [Google Scholar]
  18. Zhang, T.; Yang, J.; Liang, N.; Pitts, B.J.; Prakah-Asante, K.; Curry, R.; Duerstock, B.S.; Wachs, J.P.; Yu, D. Physiological Measurements of Situation Awareness: A Systematic Review. Hum. Factors 2023, 65, 737–758. [Google Scholar] [CrossRef]
  19. Feng, C.; Liu, S.; Wanyan, X.; Dang, Y.; Wang, Z.; Qian, C. β-Wave-Based Exploration of Sensitive EEG Features and Classification of Situation Awareness. Aeronaut. J. 2024, early access, 1–16. [Google Scholar] [CrossRef]
  20. Yang, J.; Liang, N.; Pitts, B.J.; Prakah-Asante, K.O.; Curry, R.; Blommer, M.; Swaminathan, R.; Yu, D. Multimodal Sensing and Computational Intelligence for Situation Awareness Classification in Autonomous Driving. IEEE Trans. Hum. Mach. Syst. 2023, 53, 270–281. [Google Scholar] [CrossRef]
  21. Li, Q.; Ng, K.K.H.; Yu, S.C.M.; Yiu, C.Y.; Lyu, M. Recognising Situation Awareness Associated with Different Workloads Using EEG and Eye-Tracking Features in Air Traffic Control Tasks. Knowl. Based Syst. 2023, 260, 110179. [Google Scholar] [CrossRef]
  22. Zheng, H. An Interpretable Prediction Framework for Multi-Class Situational Awareness in Conditionally Automated Driving. Adv. Eng. Inform. 2024, 62, 102683. [Google Scholar] [CrossRef]
  23. Heard, J.; Harriott, C.E.; Adams, J.A. A Survey of Workload Assessment Algorithms. IEEE Trans. Hum. Mach. Syst. 2018, 48, 434–451. [Google Scholar] [CrossRef]
  24. Nath, R.K.; Thapliyal, H.; Caban-Holt, A.; Mohanty, S.P. Machine Learning Based Solutions for Real-Time Stress Monitoring. IEEE Consum. Electron. Mag. 2020, 9, 34–41. [Google Scholar] [CrossRef]
  25. Chen, J.; Xue, L.; Rong, J.; Gao, X. Real-Time Evaluation Method of Flight Mission Load Based on Sensitivity Analysis of Physiological Factors. Chin. J. Aeronaut. 2022, 35, 450–463. [Google Scholar] [CrossRef]
  26. Han, L.; Zhang, Q.; Chen, X.; Zhan, Q.; Yang, T.; Zhao, Z. Detecting Work-Related Stress with a Wearable Device. Comput. Ind. 2017, 90, 42–49. [Google Scholar] [CrossRef]
  27. Finseth, T.T.; Dorneich, M.C.; Vardeman, S.; Keren, N.; Franke, W.D. Real-Time Personalized Physiologically Based Stress Detection for Hazardous Operations. IEEE Access 2023, 11, 25431–25454. [Google Scholar] [CrossRef]
  28. Zhou, Y.; Huang, S.; Xu, Z.; Wang, P.; Wu, X.; Zhang, D. Cognitive Workload Recognition Using EEG Signals and Machine Learning: A Review. IEEE Trans. Cogn. Dev. Syst. 2022, 14, 799–818. [Google Scholar] [CrossRef]
  29. Wang, Z.; Wang, Y.; Hu, C.; Yin, Z.; Song, Y. Transformers for EEG-Based Emotion Recognition: A Hierarchical Spatial Information Learning Model. IEEE Sens. J. 2022, 22, 4359–4368. [Google Scholar] [CrossRef]
  30. He, Z.; Li, Z.; Yang, F.; Wang, L.; Li, J.; Zhou, C.; Pan, J. Advances in Multimodal Emotion Recognition Based on Brain-Computer Interfaces. Brain Sci. 2020, 10, 687. [Google Scholar] [CrossRef]
  31. Brouwer, A.-M.; Hogervorst, M.A.; Oudejans, B.; Ries, A.J.; Touryan, J. EEG and Eye Tracking Signatures of Target Encoding during Structured Visual Search. Front. Hum. Neurosci. 2017, 11, 264. [Google Scholar] [CrossRef]
  32. Feng, C.; Liu, S.; Wanyan, X.; Chen, H.; Min, Y.; Ma, Y. EEG Feature Analysis Related to Situation Awareness Assessment and Discrimination. Aerospace 2022, 9, 546. [Google Scholar] [CrossRef]
  33. Martins, A.P.G. A Review of Important Cognitive Concepts in Aviation. Aviation 2016, 20, 65–84. [Google Scholar] [CrossRef]
  34. Kästle, J.L.; Anvari, B.; Krol, J.; Wurdemann, H.A. Correlation between Situational Awareness and EEG Signals. Neurocomputing 2021, 432, 70–79. [Google Scholar] [CrossRef]
  35. Zhou, F.; Yang, X.J.; de Winter, J.C.F. Using Eye-Tracking Data to Predict Situation Awareness in Real Time During Takeover Transitions in Conditionally Automated Driving. IEEE Trans. Intell. Transp. Syst. 2022, 23, 2284–2295. [Google Scholar] [CrossRef]
  36. Li, R.; Wang, L.; Sourina, O. Subject Matching for Cross-Subject EEG-Based Recognition of Driver States Related to Situation Awareness. Methods 2022, 202, 136–143. [Google Scholar] [CrossRef] [PubMed]
  37. Wickens, C.D. Situation Awareness and Workload in Aviation. Curr. Dir. Psychol. Sci. 2002, 11, 128–133. [Google Scholar] [CrossRef]
  38. Highland, P.; Schnell, T.; Woodruff, K.; Avdic-McIntire, G. Towards Human Objective Real-Time Trust of Autonomy Measures for Combat Aviation. Int. J. Aerosp. Psychol. 2023, 33, 1–34. [Google Scholar] [CrossRef]
  39. Truong, N.D.; Nguyen, A.D.; Kuhlmann, L.; Bonyadi, M.R.; Yang, J.; Ippolito, S.; Kavehei, O. Convolutional Neural Networks for Seizure Prediction Using Intracranial and Scalp Electroencephalogram. Neural Netw. 2018, 105, 104–111. [Google Scholar] [CrossRef]
  40. Gjoreski, M.; Kolenik, T.; Knez, T.; Luštrek, M.; Gams, M.; Gjoreski, H.; Pejović, V. Datasets for Cognitive Load Inference Using Wearable Sensors and Psychological Traits. Appl. Sci. 2020, 10, 3843. [Google Scholar] [CrossRef]
  41. Endsley, M.R.; Selcon, S.J.; Hardiman, T.D.; Croft, D.G. A Comparative Analysis of SAGAT and SART for Evaluations of Situation Awareness. In Proceedings of the Human Factors and Ergonomics Society Annual Meeting, Santa Monica, CA, USA, 5–9 October 1998; SAGE Publications: Los Angeles, CA, USA, 1998; Volume 42, pp. 82–86. [Google Scholar]
  42. Endsley, M.R. A Systematic Review and Meta-Analysis of Direct Objective Measures of Situation Awareness: A Comparison of SAGAT and SPAM. Hum. Factors 2021, 63, 124–150. [Google Scholar] [CrossRef]
  43. Saus, E.-R.; Johnsen, B.H.; Eid, J.; Riisem, P.K.; Andersen, R.; Thayer, J.F. The Effect of Brief Situational Awareness Training in a Police Shooting Simulator: An Experimental Study. Mil. Psychol. 2006, 18, S3–S21. [Google Scholar] [CrossRef]
  44. Makowski, D.; Pham, T.; Lau, Z.J.; Brammer, J.C.; Lespinasse, F.; Pham, H.; Schölzel, C.; Chen, S.H.A. NeuroKit2: A Python Toolbox for Neurophysiological Signal Processing. Behav. Res. Methods 2021, 53, 1689–1696. [Google Scholar] [CrossRef]
  45. Wanyan, X.; Zhuang, D.; Lin, Y.; Xiao, X.; Song, J.-W. Influence of Mental Workload on Detecting Information Varieties Revealed by Mismatch Negativity during Flight Simulation. Int. J. Ind. Ergon. 2018, 64, 1–7. [Google Scholar] [CrossRef]
  46. Trapsilawati, F.; Herliansyah, M.K.; Nugraheni, A.S.A.N.S.; Fatikasari, M.P.; Tissamodie, G. EEG-Based Analysis of Air Traffic Conflict: Investigating Controllers’ Situation Awareness, Stress Level and Brain Activity during Conflict Resolution. J. Navig. 2020, 73, 678–696. [Google Scholar] [CrossRef]
  47. Gramfort, A.; Luessi, M.; Larson, E.; Engemann, D.A.; Strohmeier, D.; Brodbeck, C.; Goj, R.; Jas, M.; Brooks, T.; Parkkonen, L. MEG and EEG Data Analysis with MNE-Python. Front. Neurosci. 2013, 7, 70133. [Google Scholar] [CrossRef]
  48. Welch, P. The Use of Fast Fourier Transform for the Estimation of Power Spectra: A Method Based on Time Averaging over Short, Modified Periodograms. IEEE Trans. Audio Electroacoust. 1967, 15, 70–73. [Google Scholar] [CrossRef]
  49. Fernandez Rojas, R.; Debie, E.; Fidock, J.; Barlow, M.; Kasmarik, K.; Anavatti, S.; Garratt, M.; Abbass, H. Electroencephalographic Workload Indicators during Teleoperation of an Unmanned Aerial Vehicle Shepherding a Swarm of Unmanned Ground Vehicles in Contested Environments. Front. Neurosci. 2020, 14, 40. [Google Scholar] [CrossRef]
  50. Chen, J.; Jiang, D.; Zhang, Y. A Hierarchical Bidirectional GRU Model with Attention for EEG-Based Emotion Classification. IEEE Access 2019, 7, 118530–118540. [Google Scholar] [CrossRef]
  51. Vaswani, A.; Shazeer, N.; Parmar, N.; Uszkoreit, J.; Jones, L.; Gomez, A.N.; Kaiser, Ł.; Polosukhin, I. Attention Is All You Need. arXiv 2017, arXiv:1706.03762. [Google Scholar]
  52. Ramachandram, D.; Taylor, G.W. Deep Multimodal Learning: A Survey on Recent Advances and Trends. IEEE Signal Process. Mag. 2017, 34, 96–108. [Google Scholar] [CrossRef]
  53. Singh, D.; Singh, B. Investigating the Impact of Data Normalization on Classification Performance. Appl. Soft Comput. 2020, 97, 105524. [Google Scholar] [CrossRef]
  54. Sohn, Y.W.; Doane, S.M. Memory Processes of Flight Situation Awareness: Interactive Roles of Working Memory Capacity, Long-Term Working Memory, and Expertise. Hum. Factors 2004, 46, 461–475. [Google Scholar] [CrossRef]
  55. van Moorselaar, D.; Foster, J.J.; Sutterer, D.W.; Theeuwes, J.; Olivers, C.N.; Awh, E. Spatially Selective Alpha Oscillations Reveal Moment-by-Moment Trade-Offs between Working Memory and Attention. J. Cogn. Neurosci. 2018, 30, 256–266. [Google Scholar] [CrossRef]
  56. Mitchell, D.J.; McNaughton, N.; Flanagan, D.; Kirk, I.J. Frontal-Midline Theta from the Perspective of Hippocampal “Theta”. Prog. Neurobiol. 2008, 86, 156–185. [Google Scholar] [CrossRef] [PubMed]
  57. Radhakrishnan, V.; Louw, T.; Cirino Gonçalves, R.; Torrao, G.; Lenné, M.G.; Merat, N. Using Pupillometry and Gaze-Based Metrics for Understanding Drivers’ Mental Workload during Automated Driving. Transp. Res. Part F Traffic Psychol. Behav. 2023, 94, 254–267. [Google Scholar] [CrossRef]
  58. Shaffer, F.; Ginsberg, J.P. An Overview of Heart Rate Variability Metrics and Norms. Front. Public Health 2017, 5, 258. [Google Scholar] [CrossRef]
  59. Li, C.; Zhang, Z.; Zhang, X.; Huang, G.; Liu, Y.; Chen, X. EEG-based Emotion Recognition via Transformer Neural Architecture Search. IEEE Trans. Ind. Inform. 2023, 19, 6016–6025. [Google Scholar] [CrossRef]
  60. Zhang, D.; Yao, L.; Chen, K.; Monaghan, J. A Convolutional Recurrent Attention Model for Subject-Independent EEG Signal Analysis. IEEE Signal Process. Lett. 2019, 26, 715–719. [Google Scholar] [CrossRef]
  61. Tao, W.; Li, C.; Song, R.; Cheng, J.; Liu, Y.; Wan, F.; Chen, X. EEG-Based Emotion Recognition via Channel-Wise Attention and Self Attention. IEEE Trans. Affect. Comput. 2020, 14, 382–393. [Google Scholar] [CrossRef]
  62. Gedam, S.; Paul, S. A Review on Mental Stress Detection Using Wearable Sensors and Machine Learning Techniques. IEEE Access 2021, 9, 84045–84066. [Google Scholar] [CrossRef]
Figure 1. Overview of the experimental environment construction and data processing flow.
Aerospace 11 00897 g001
Figure 2. The operational environment and target location for (a) air-to-air combat missions and (b) air-to-ground combat missions. In order from left to right, the scenarios are as follows: (1) HI scenario, (2) MI scenario, and (3) LI scenario.
Aerospace 11 00897 g002
Figure 3. Models A1, A2, and A3, utilizing the MLP structure.
Aerospace 11 00897 g003
Figure 4. Model B with a multi-head self-attention mechanism.
Aerospace 11 00897 g004
Figure 5. Model Cs utilizing decision-level fusion.
Aerospace 11 00897 g005
Figure 6. ANOVA and post hoc comparison results of model performance metrics for unimodal models and multimodal models.
Aerospace 11 00897 g006
Figure 7. The confusion matrixes with the highest accuracy for (a) Model A1, with ET features as input; (b) Model A2, with HRV features as input; (c) Model A3, with EEG features as input; (d) Model B, with EEG features as input.
Aerospace 11 00897 g007
Figure 8. The ROC curves for Model A and Model B, including the micro-average AUC, macro-average AUC, and the AUC for the ROC curves of category LSA, category MSA, and category HSA.
Aerospace 11 00897 g008aAerospace 11 00897 g008b
Figure 9. The confusion matrixes with the highest accuracy for (a) Model C1; (b) Model C2.
Aerospace 11 00897 g009
Figure 10. The ROC curves for Model C1 and Model C2, including micro-average AUC, macro-average AUC, and AUC for the ROC curves of the LSA, MSA, and HSA categories.
Aerospace 11 00897 g010
Table 1. Eye-tracking features extracted based on eye movements.
Eye MovementET FeaturesUnitDescription
FixationAverage duration of fixations[ms]The average duration of the fixations in the interval.
Fixation frequency[N/min]Numbers of fixations every minute.
SaccadeAverage peak velocity of saccades[deg/s]The average peak velocity of all saccades in the interval.
Average amplitude of saccades[deg]The average amplitude of all saccades in the interval.
Saccade frequency[N/min]Numbers of saccades in every minute.
BlinkBlink frequency[N/min]Numbers of blinks in every minute.
Table 2. HRV features in the time, frequency, and non-linear domains.
DomainHRV FeaturesUnitDescription
Time domainHR[N/min]Number of heartbeats each minute.
SDNN[ms]The standard deviation of the RR intervals.
RMSSD[ms]The square root of the mean of the squared successive differences between adjacent RR intervals.
Frequency domainHFnNo unitThe normalized spectral power of high frequencies (0.15 to 0.4 Hz).
Non-linear domainSD1/SD2No unitRatio of SD1 (standard deviation perpendicular to the line of identity) to SD2 (standard deviation along the identity line). Describes the ratio of short-term to long-term variations in HRV.
Table 3. Input features of models.
ModelsInput FeaturesFeature Size
Model A1ET features6
Model A2HRV features5
Model A3/Model BEEG features18
Model C1/Model C2ET, HRV, and EEG features29
Table 4. Comparison of the performance of the six proposed models. The bold values highlight the models with the best performance in the single-modality model and multi-modality model, respectively.
ModelAccuracyPrecisionRecallF1 ScoreAUC
LSA MSA HSA
Model A10.6062 ± 0.00790.6194 ± 0.01900.6062 ± 0.00790.6081 ± 0.00920.78 ± 0.020.75 ± 0.010.76 ± 0.02
Model A20.5747 ± 0.01140.5907 ± 0.02470.5747 ± 0.01140.5778 ± 0.01060.75 ± 0.010.74 ± 0.010.75 ± 0.01
Model A30.7659 ± 0.01000.7729 ± 0.00790.7659 ± 0.01000.7661 ± 0.00990.90 ± 0.010.90 ± 0.010.91 ± 0.01
Model B0.7710 ± 0.00580.7727 ± 0.00600.7710 ± 0.00580.7712 ± 0.00580.93 ± 0.010.91 ± 0.010.91 ± 0.01
Model C10.8145 ± 0.01010.8155 ± 0.01010.8145 ± 0.01010.8146 ± 0.01010.93 ± 0.010.92 ± 0.010.93 ± 0.01
Model C20.8341 ± 0.00590.8347 ± 0.00590.8341 ± 0.00590.8341 ± 0.00590.94 ± 0.010.95 ± 0.010.94 ± 0.01
Disclaimer/Publisher’s Note: The statements, opinions and data contained in all publications are solely those of the individual author(s) and contributor(s) and not of MDPI and/or the editor(s). MDPI and/or the editor(s) disclaim responsibility for any injury to people or property resulting from any ideas, methods, instructions or products referred to in the content.

