
Impact of Target Surface Building Direction on the Heat Transfer Characteristics of Additive Manufactured Impingement Systems


Abstract
1. Introduction
2. Test Articles
3. Experimental Methodology
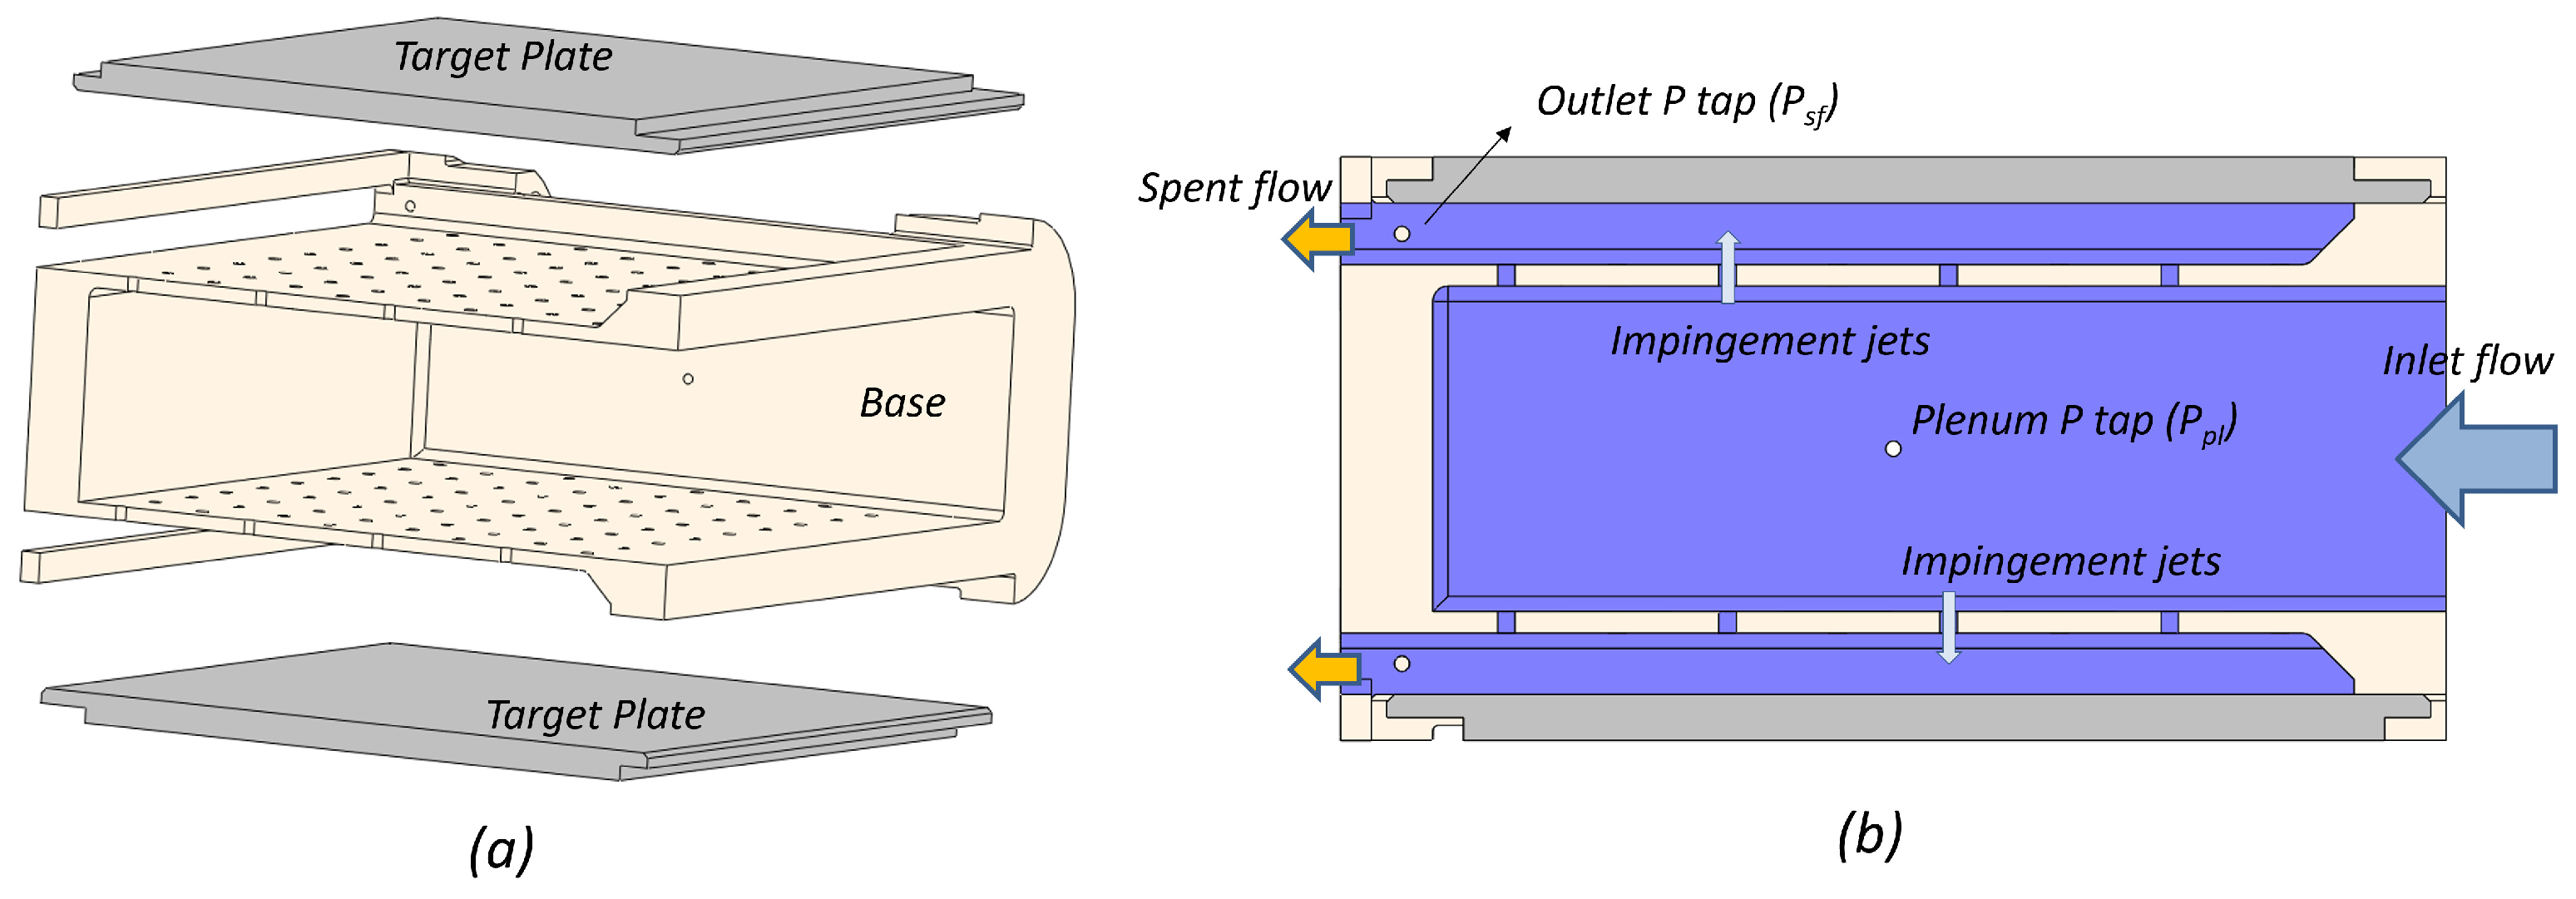
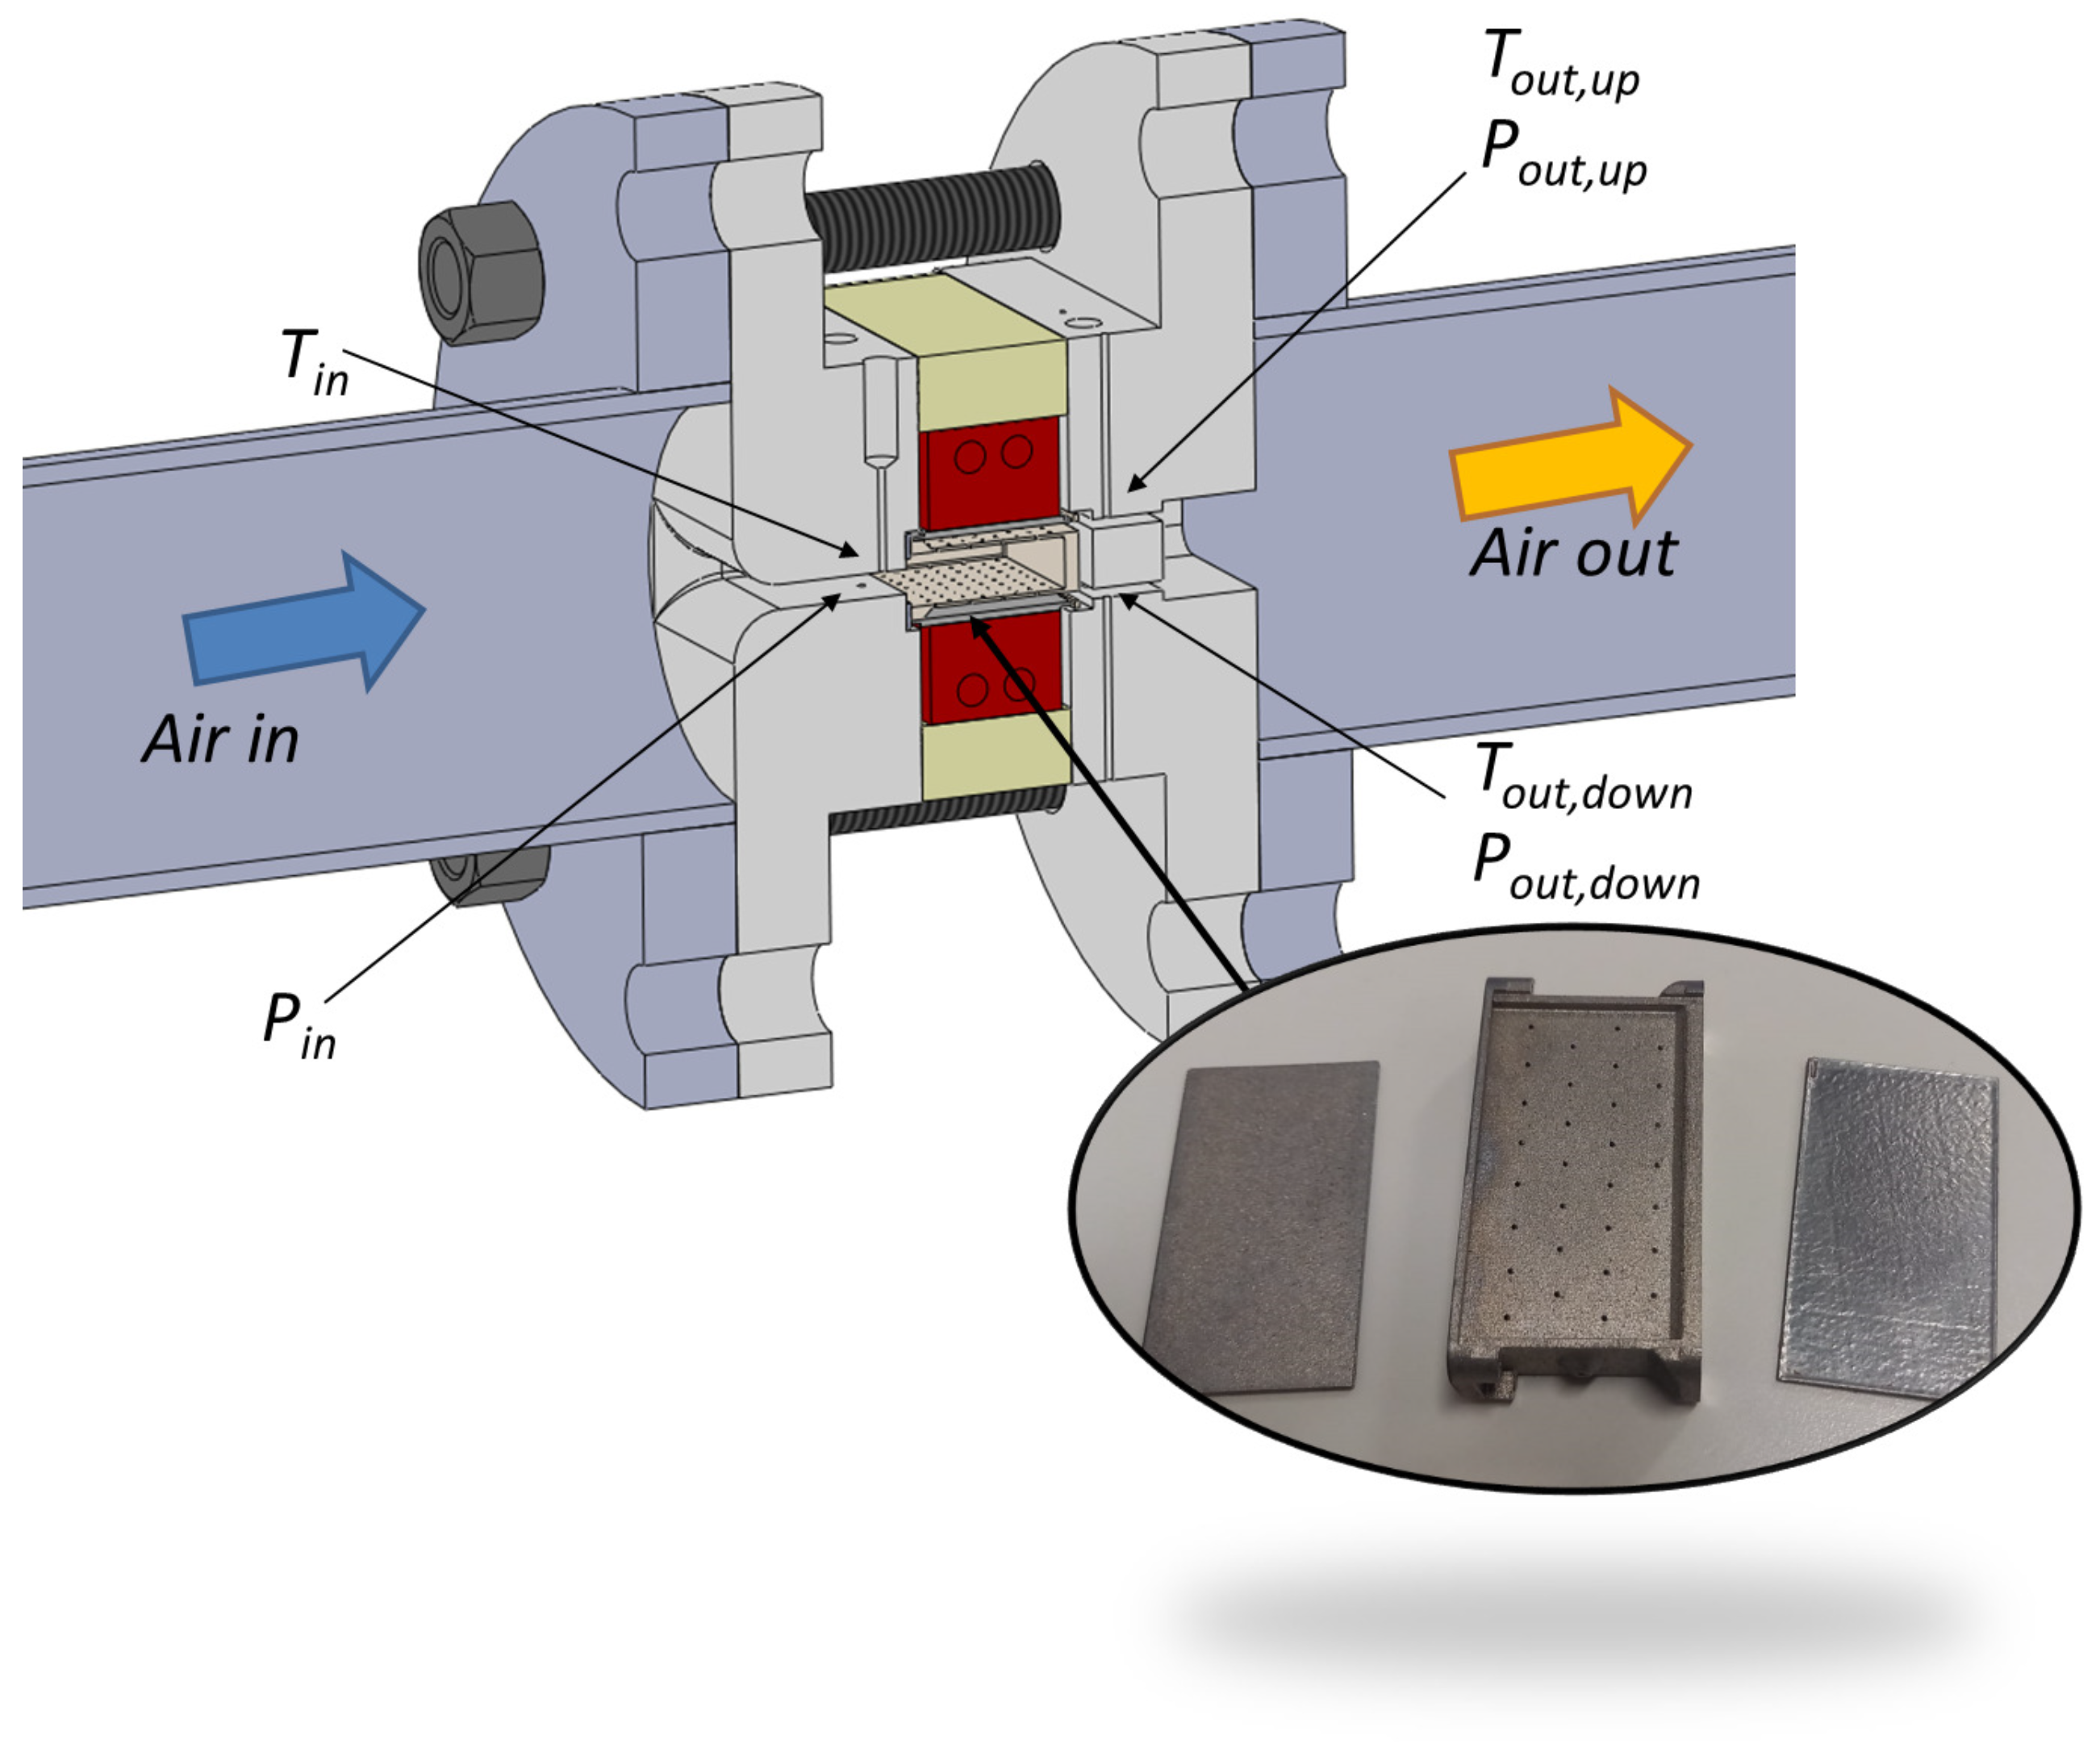
3.1. Test Rig
3.2. Measurement Technique
3.3. Operating Conditions
4. AM Parts Characterization
5. Experimental Results
5.1. Pressure Losses
5.2. Heat Transfer
6. Conclusions
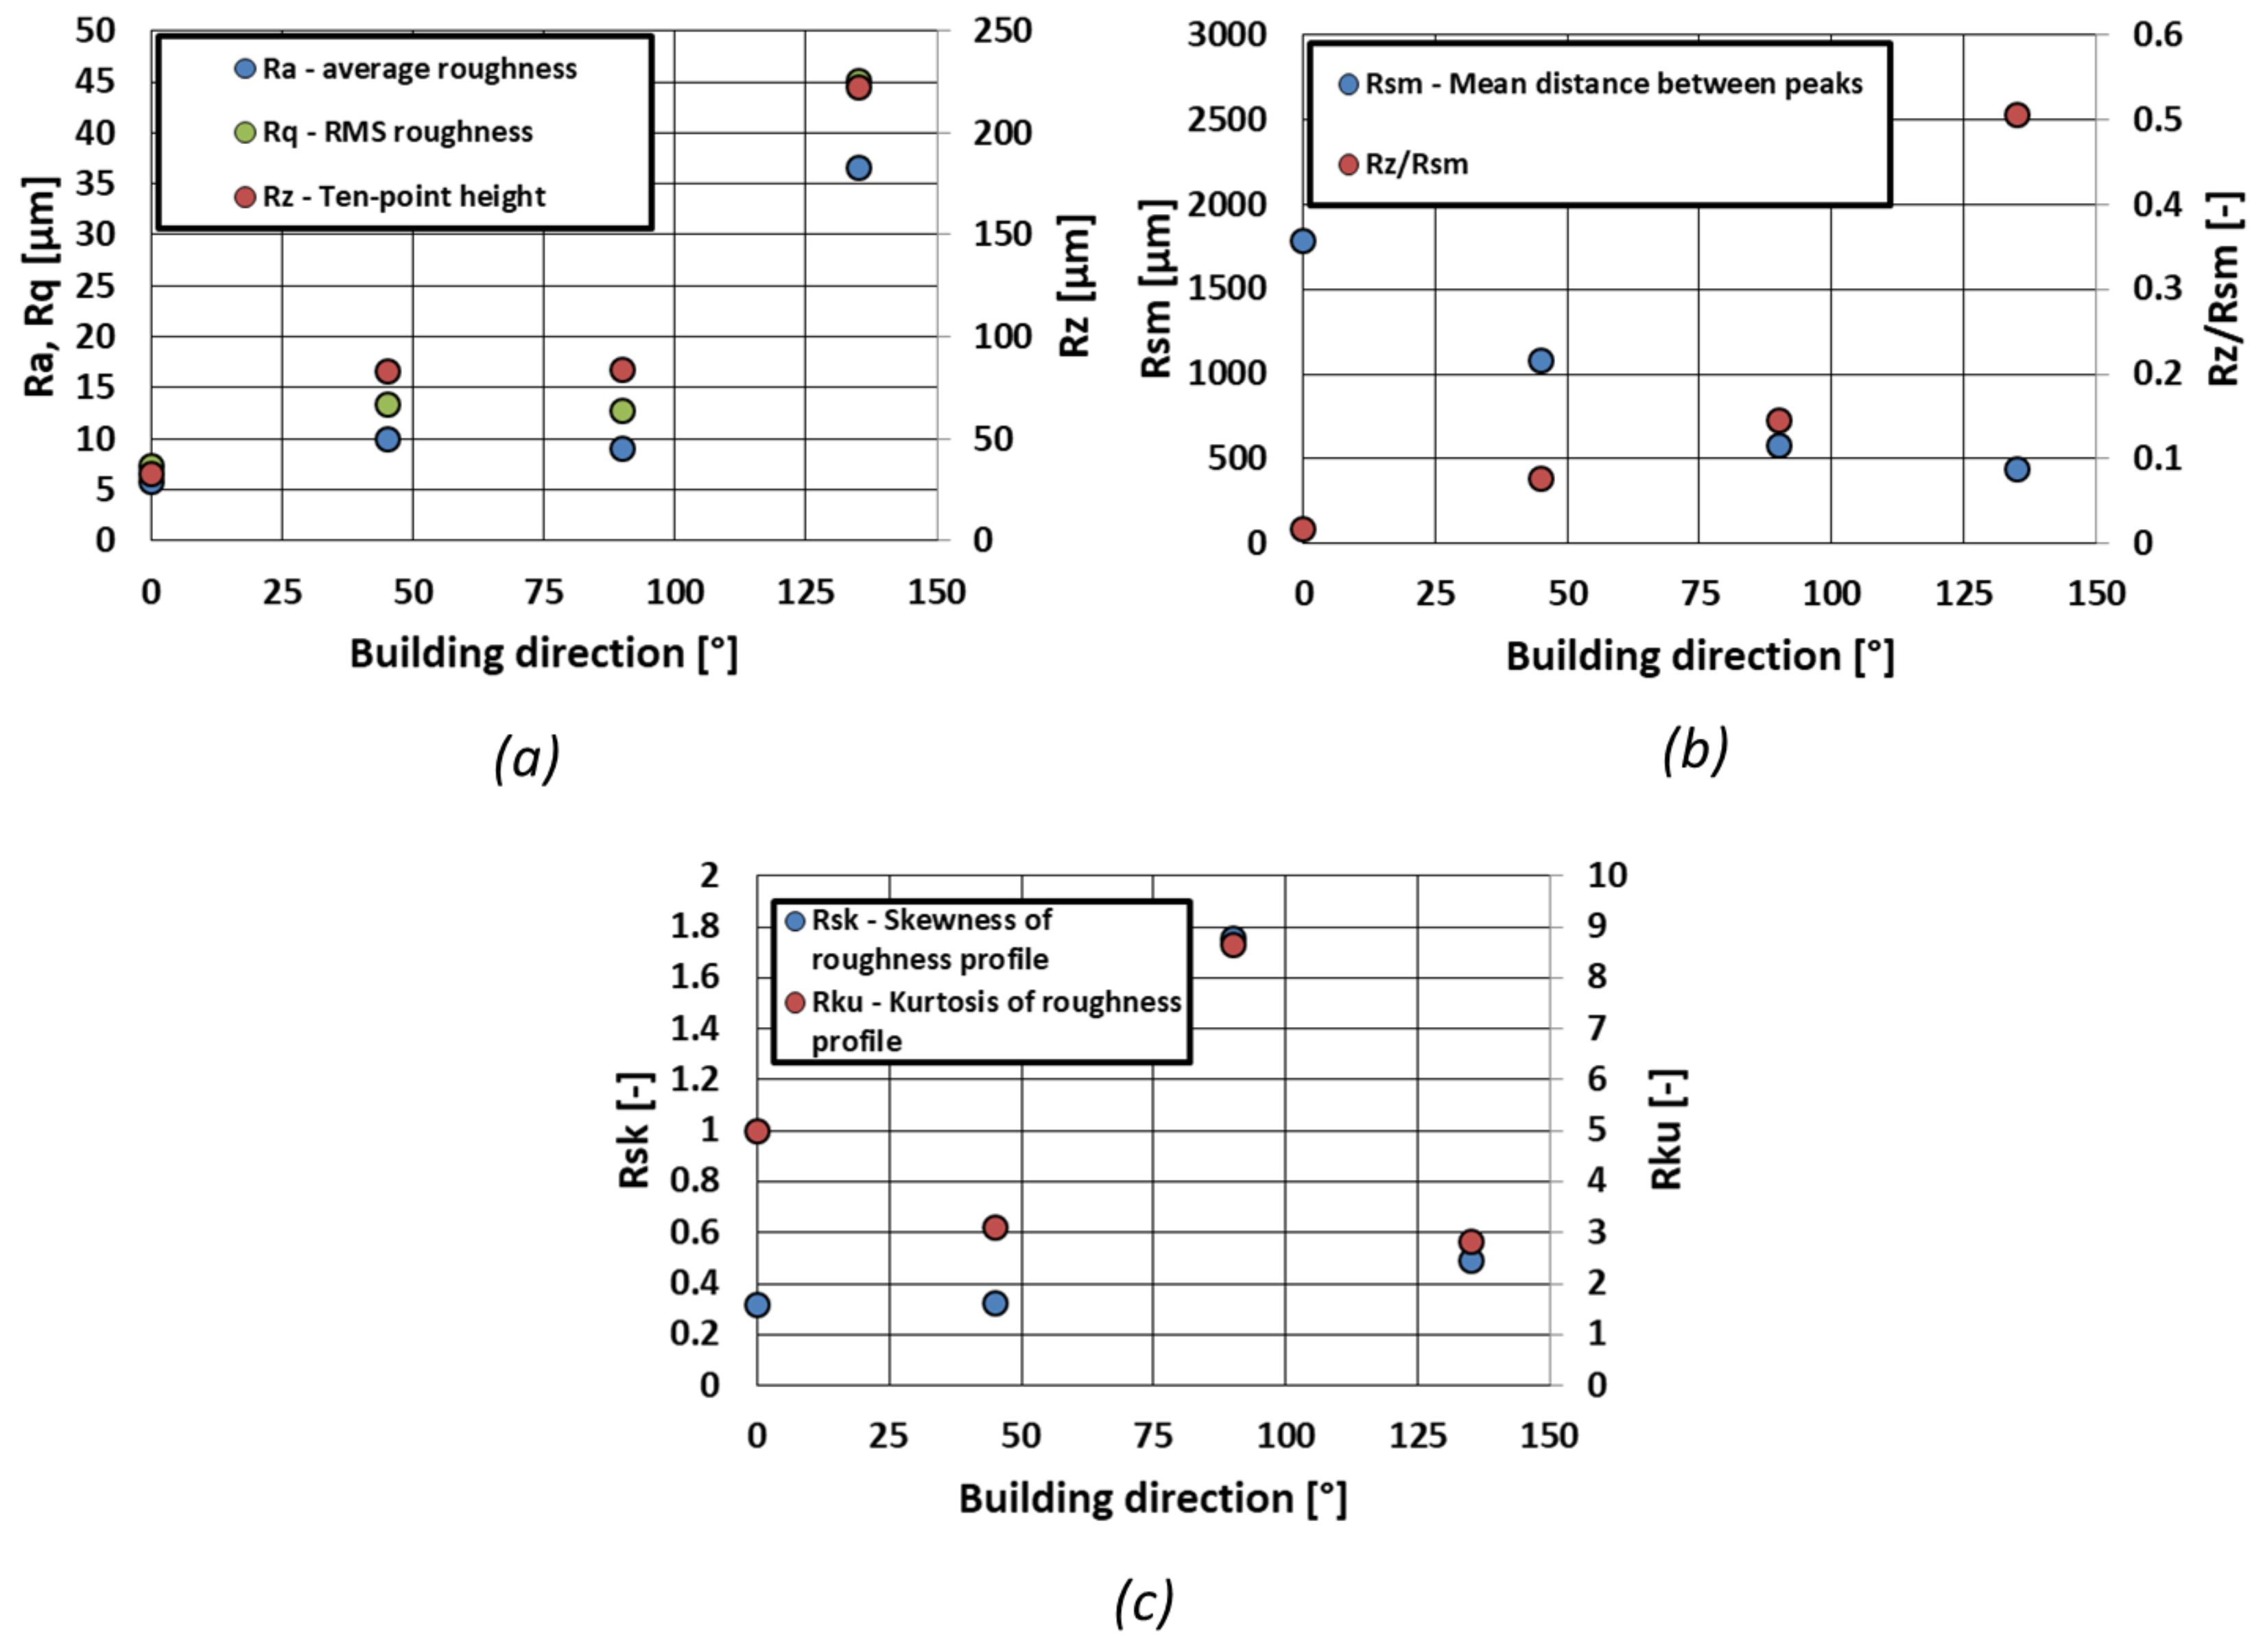
- The as-built surface roughness on the target surfaces, as expected, increases moving from upskin configurations, to vertical, to downskin ones; nevertheless, a significant reduction in the average distance between roughness peaks () occurs at the same time.
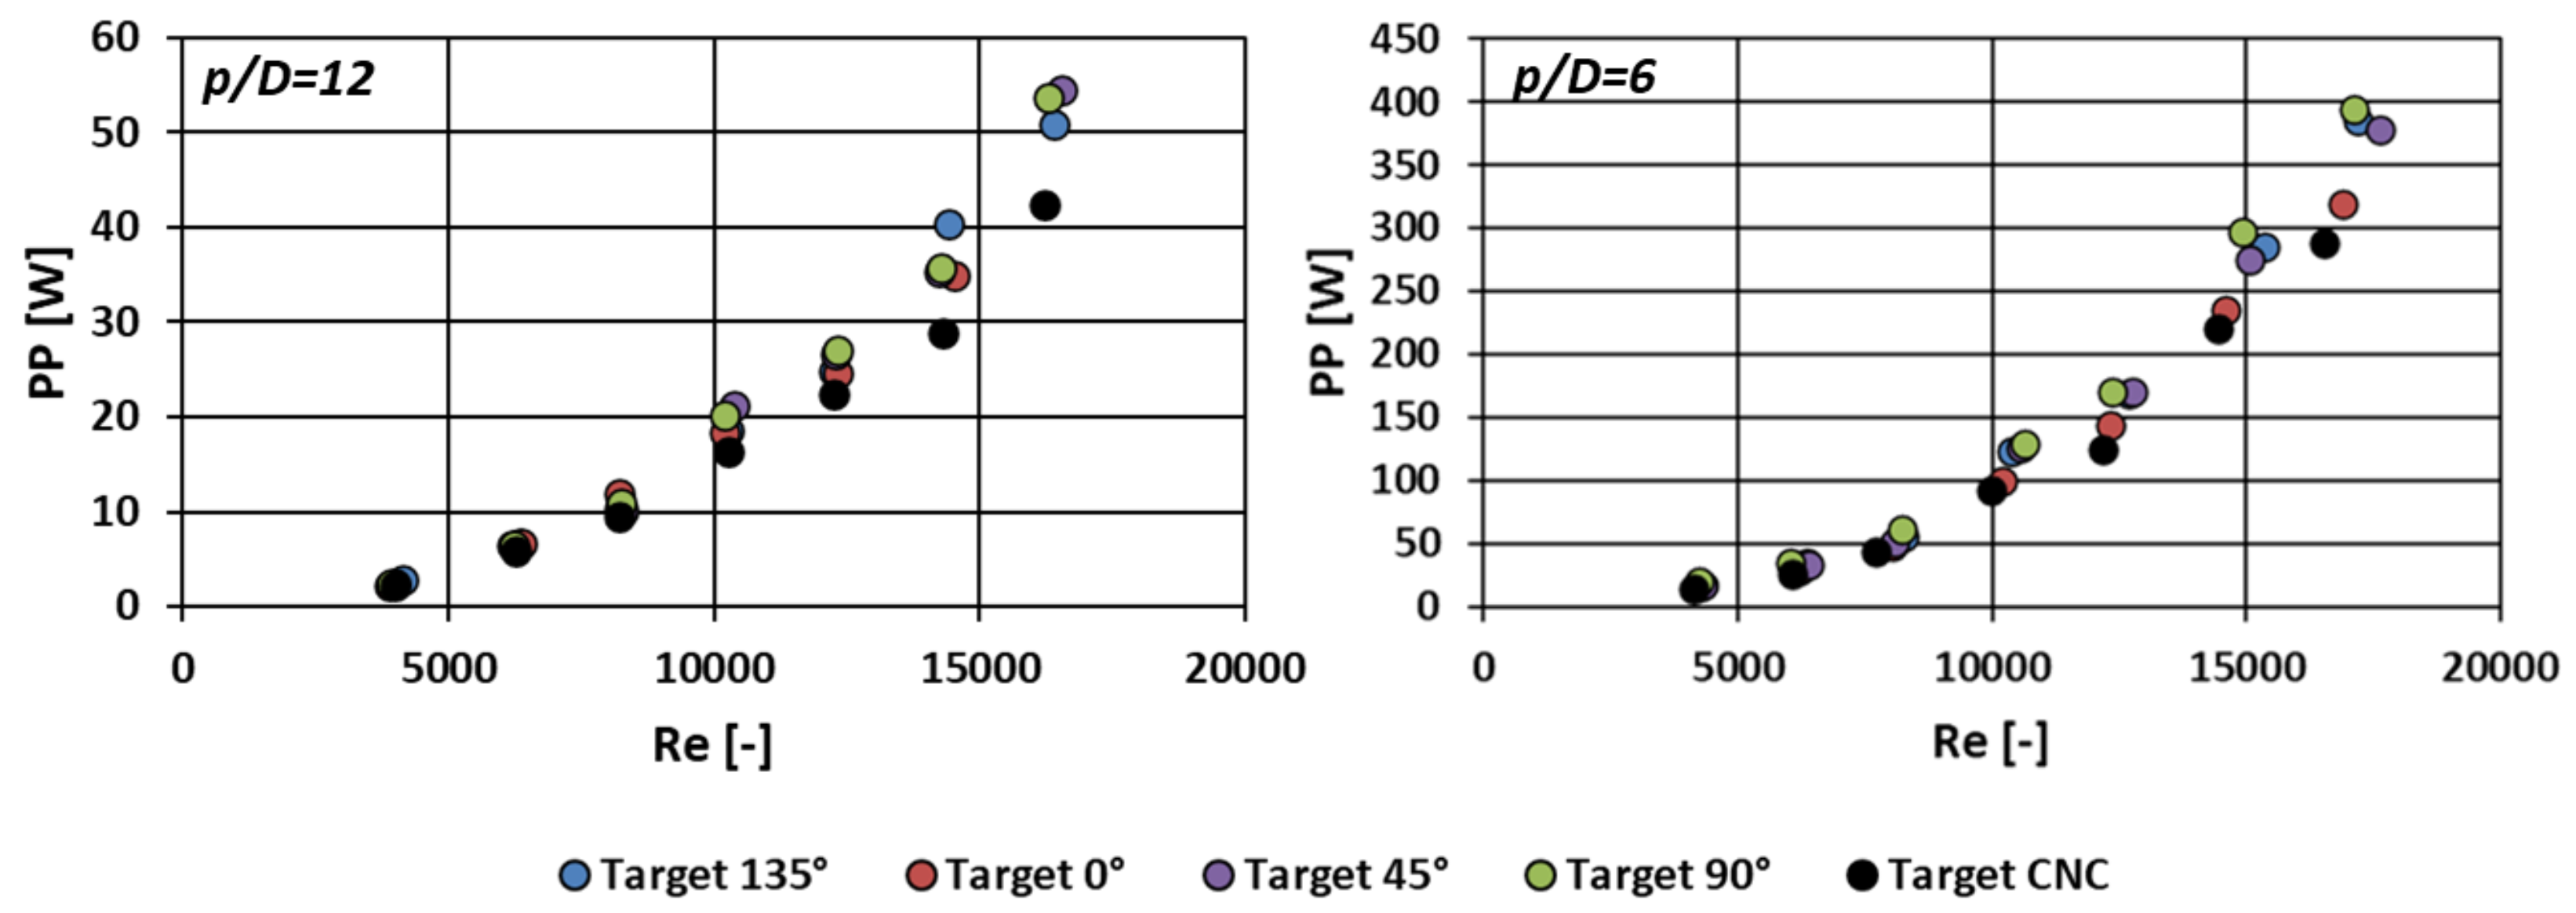
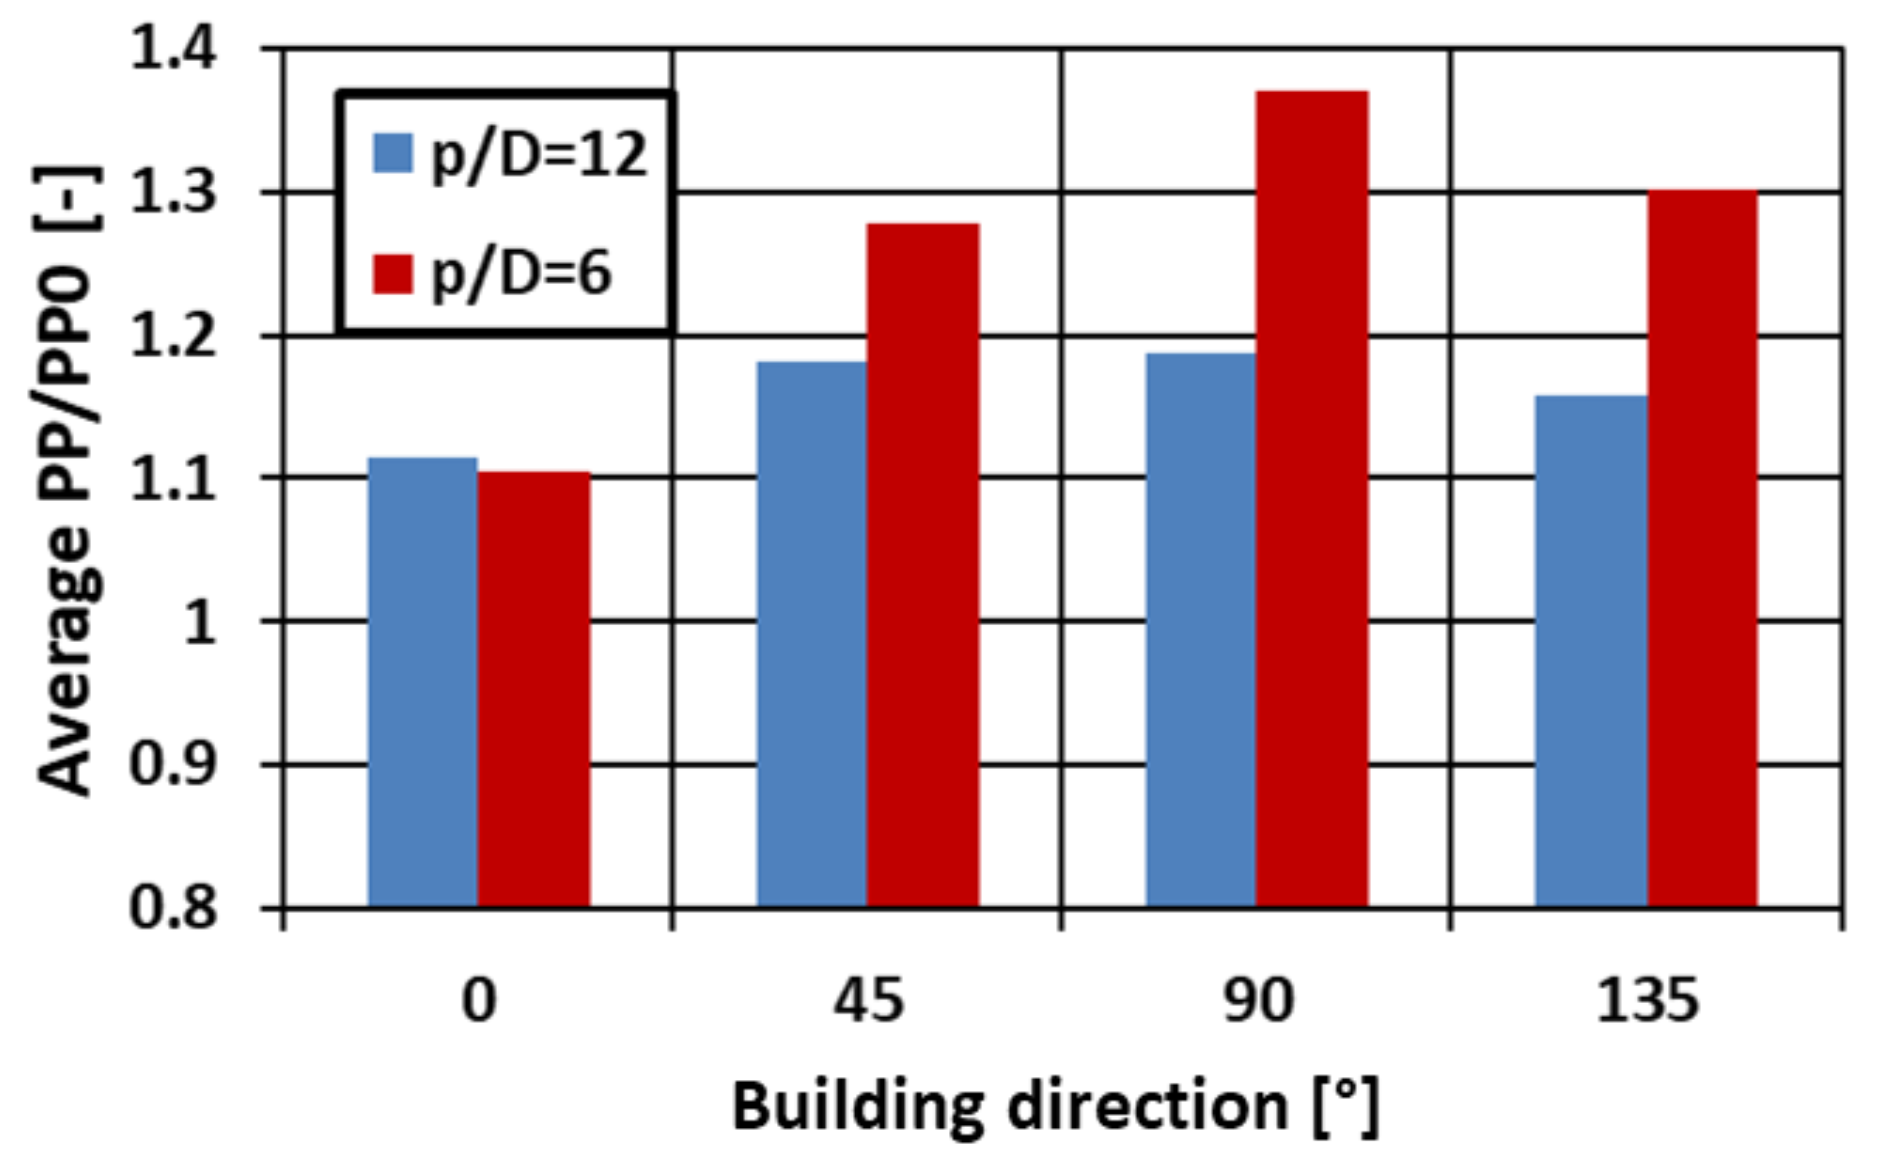
- The increase in surface roughness results in an increase in pressure losses or required pumping power. If a fixed pumping power is considered, a limited, but not completely negligible reduction in the mass flow rate is enforced, mostly around 10%.
- A heat transfer enhancement is also achieved, as expected. This is higher for reduced jet spacing, since a thinner thermal boundary layer is achieved, thus maximizing the effect of roughness. The maximum enhancement is achieved for the vertical plate configuration.
- Downskin surfaces with significantly higher roughness, do not achieve higher heat transfer enhancement. By comparing the measured roughness parameters, the reason seems to stay in the fact that the increase in comes with a relevant reduction in , which compromises the actual heat transfer coefficient, as also suggested by other studies. The impact of the roughness shape (skewness, kurtosis) does not seem to be responsible for this specific behavior.
- The trend of with a maximum between 45 and 90° is not described by any single standard parameter used to characterize the roughness. This highlights the difficulty in scaling the heat transfer enhancement with respect to the roughness geometry, demanding for further experimental investigations and, in general, complex relations considering multiple roughness parameters.
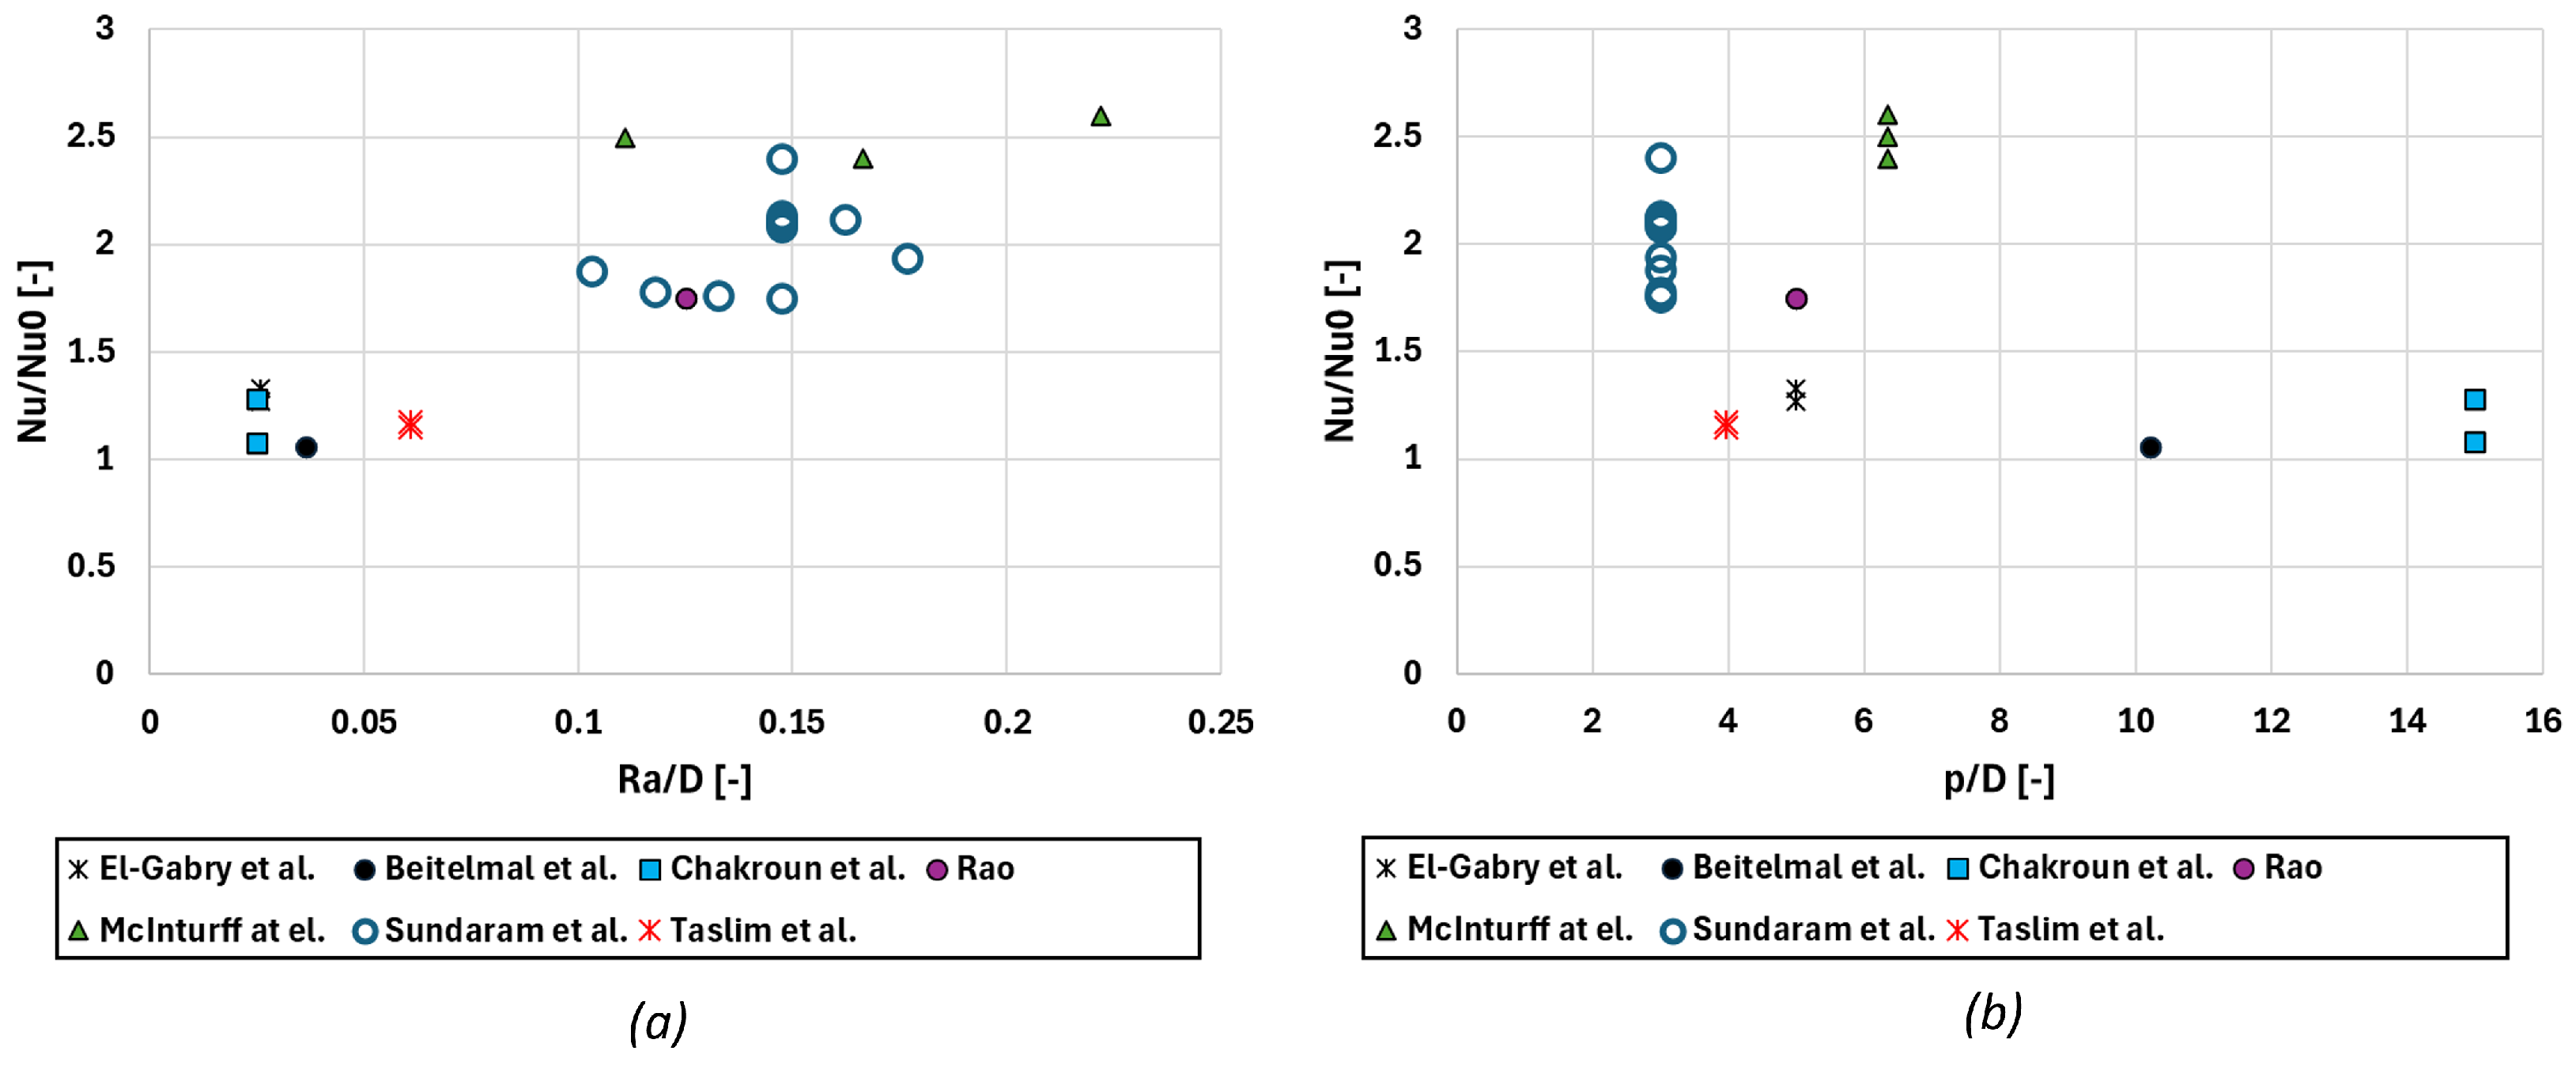
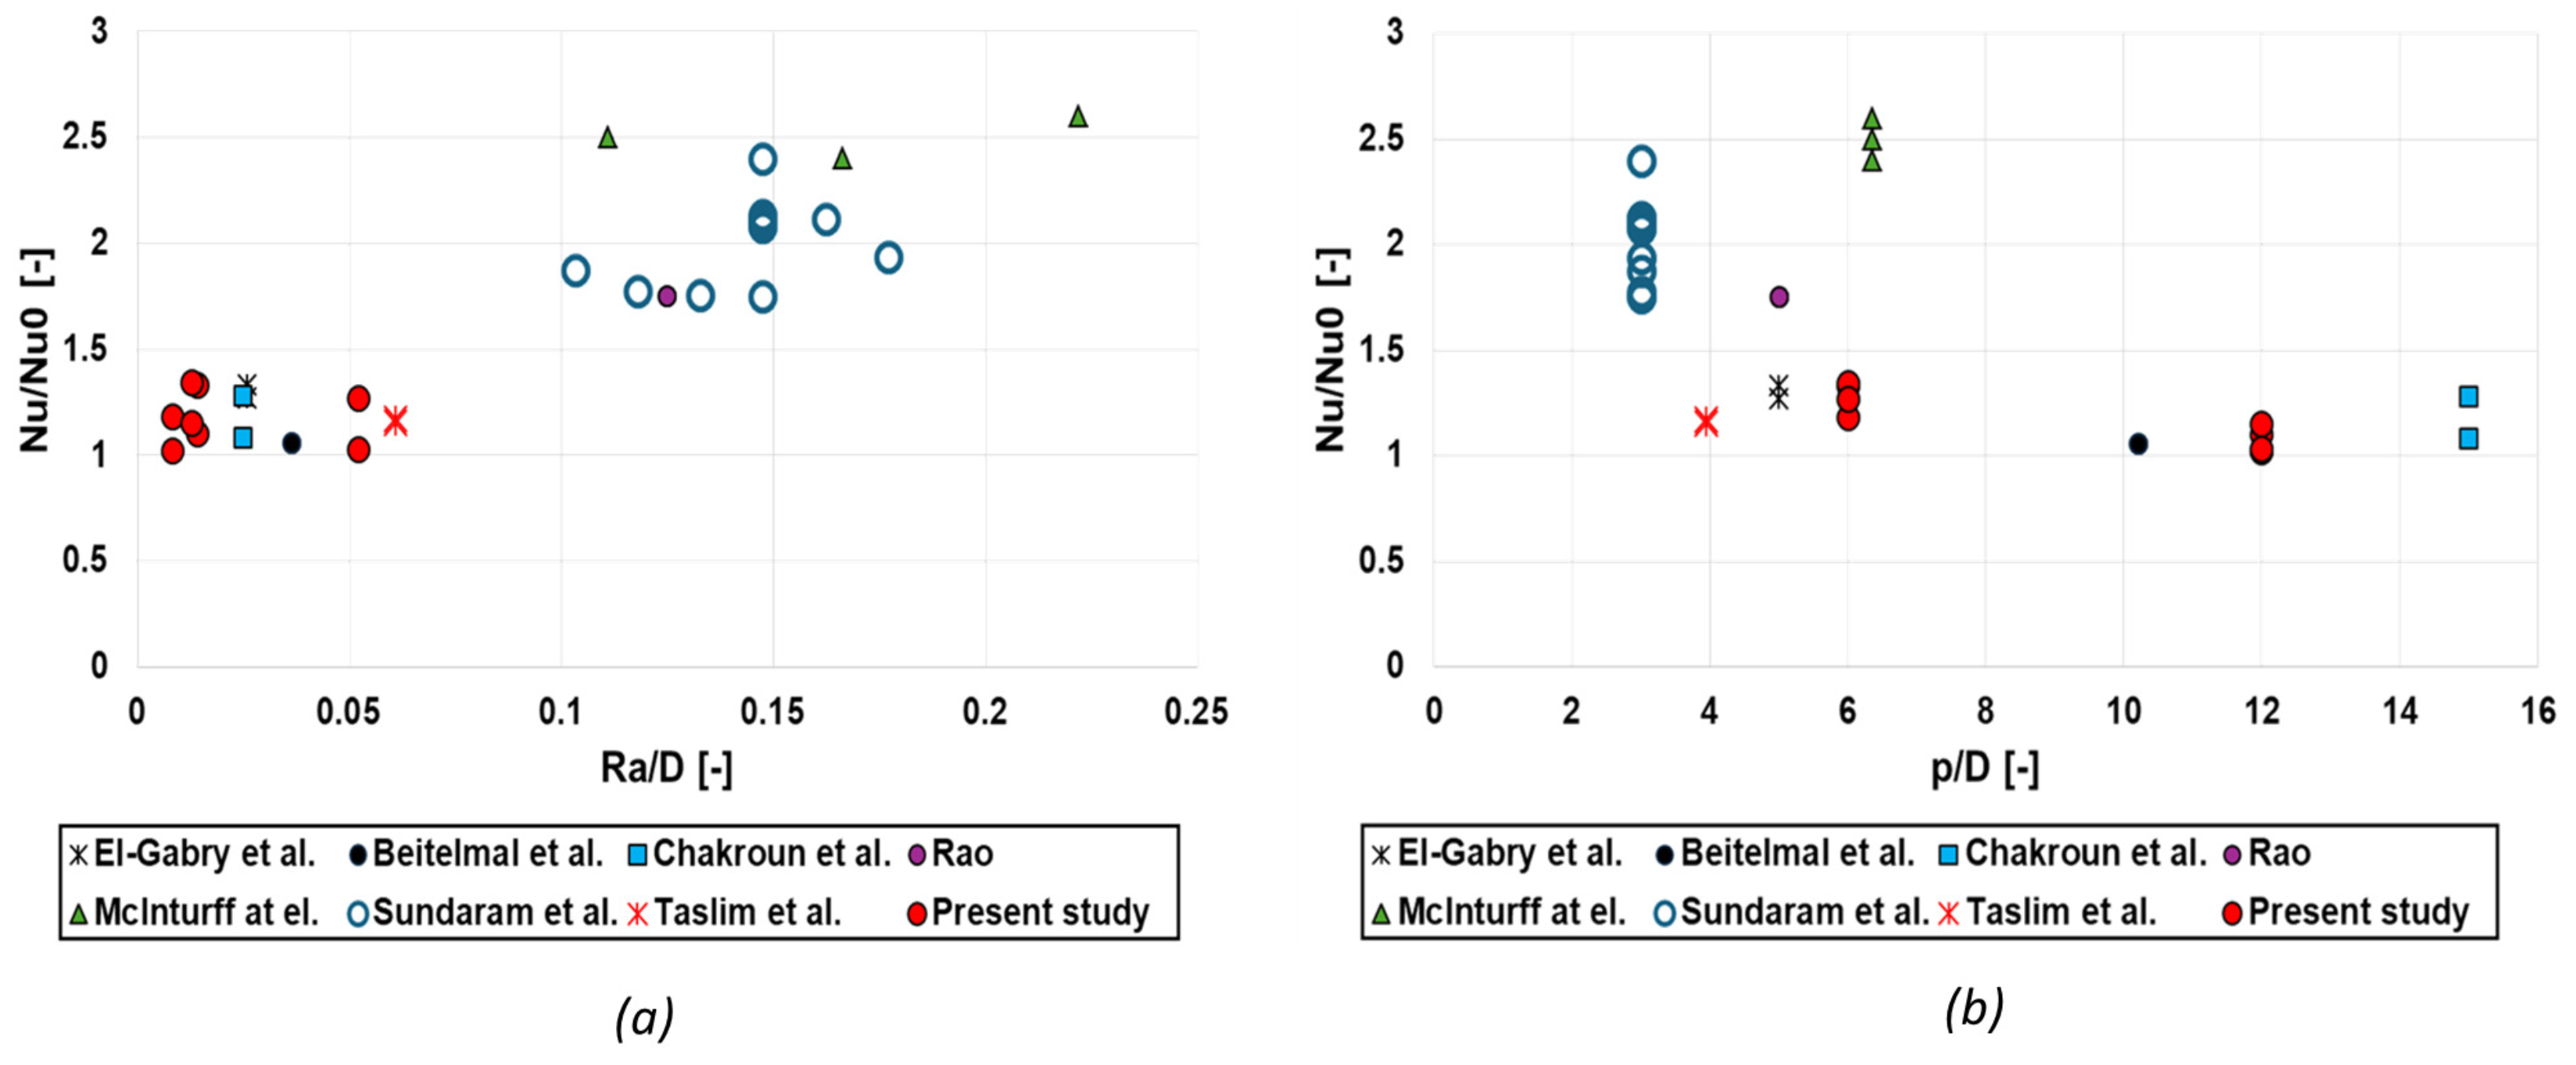
- AM roughness impact on heat transfer is in line with literature results with distributed roughness achieved with dedicated processes. On the other hand, it is not able to reach the very high enhancements achieved with specifically designed features with higher equivalent . Additional AM configurations could be evaluated, with the aim of increasing without significantly compromising (e.g., increased laser hatching).
- Despite the fact that the measured heat transfer enhancement does not reach the highest values reported in literature, non-negligible increases up to more than 30% has been highlighted. This, together with the fact that this value significantly changes with building direction, suggests that the heat transfer enhancement due to surface roughness must be accurately considered, in the view of designing an AM cooled component, not to incur in efficiency detrimental over-cooled surfaces or dangerous underestimation of the component’s operating temperature.
Author Contributions
Funding
Data Availability Statement
Acknowledgments
Conflicts of Interest
Abbreviations
| A | Target surface area | |
| D | Impingement diameter | |
| E | Voltage | |
| I | Current | |
| k | Thermal conductivity | |
| L | Impingement hole length | |
| Nu | Nusselt number | |
| P | Pressure | |
| p | Impingement holes pitch | |
| Convective heat flux | ||
| Joule heat flux | ||
| Heat losses | ||
| R | Thermal resistance | |
| Ra | Average roughness | |
| Re | Reynolds number | |
| Rku | Kurtosis of roughness profile | |
| Rq | RSM roughness | |
| Rsm | Roughness mean distane between peaks | |
| Rsk | Skewness of roughness profile | |
| Rz | Roughness ten-point height | |
| T | Temperature | |
| Coupon surface temperature | ||
| V | Velocity | |
| z | Jet-to-target distance | |
| Greeks letters | ||
| Dynamic viscosity | ||
| Kinematic viscosity | ||
| Density | ||
| Subscripts | ||
| 0 | Smooth (reference) | |
| c | Coupon | |
| cr | Crossflow | |
| Cu | Copper | |
| imp | Impingement | |
| j | Jet | |
| pl | Plenum | |
| sf | Spent flow | |
| Acronyms | ||
| AM | Additive Manufacturing | |
| CNC | Computer Numerical Control | |
| HTC | Heat Transfer Coefficient | |
| PP | Pumping Power |
References
- Bunker, R. Gas turbine cooling: Moving from macro to micro cooling. In Proceedings of the ASME Turbo Expo 2013: Turbine Technical Conference and Exposition, San Antonio, TX, USA, 3–7 June 2013. [Google Scholar]
- Bunker, R. Evolution of turbine cooling. In Proceedings of the ASME Turbo Expo 2017: Turbomachinery Technical Conference and Exposition, Charlotte, NC, USA, 2–30 June 2017. [Google Scholar]
- Schurb, J.; Etter, T.; Urban, K.; Hobel, M. Additive manufacturing for hot gas path parts. In Proceedings of the 8th International Gas Turbine Conference, Brussels, Belgium, 12–13 October 2016. [Google Scholar]
- Schlichting, H. Experimental Investigation of the Problem of Surface Roughness; NASA Technical Memo1936819930094593; NASA Technical Reports Server: Cleveland, OH, USA, 1936.
- Flack, K.; Schultz, M.; Volino, R. The effect of a systematic change in surface roughness skewness on turbulence and drag. Int. J. Heat Fluid Flow 2020, 85, 108669. [Google Scholar] [CrossRef]
- Kuwata, Y.; Nagura, R. Direct numerical simulation on the effects of surface slope and skewness on rough-wall turbulence. Phys. Fluid 2020, 32, 105113. [Google Scholar] [CrossRef]
- Wildgoose, A.; Thole, K.; Tuneskog, T.; Wang, L. Roughness Related to Cooling Performance of Channels Made Through Additive Manufacturing. In Proceedings of the ASME Turbo Expo 2023: Turbomachinery Technical Conference and Exposition, Boston, MA, USA, 26–30 June 2023. [Google Scholar]
- Bons, J.; Taylor, R.; McClain, S.; Rivir, R. The Many Faces of Turbine Surface Roughness. ASME J. Turbomach. 2001, 123, 739. [Google Scholar] [CrossRef]
- Bons, J. A Review of Surface Roughness Effects in Gas Turbines. ASME J. Turbomach. 2010, 132, 021004. [Google Scholar] [CrossRef]
- Bons, J. St and cf Augmentation for Real Turbine Roughness with Elevated Freestream Turbulence. ASME J. Turbomach. 2002, 124, 632–644. [Google Scholar] [CrossRef]
- Kuwata, Y.; Yagasaki, W.; Suga, K. Effects of steepness on turbulent heat transfer over sinusoidal rough surfaces. Int. J. Heat Fluid Flow 2024, 109, 109537. [Google Scholar] [CrossRef]
- Garg, H.; Wang, L.; Fureby, C. Heat transfer enhancement with additively manufactured rough surfaces: Insights from large-eddy simulations. Phys. Fluids 2024, 36, 025109. [Google Scholar] [CrossRef]
- Garg, H.; Sahut, G.; Tuneskog, E.; Nogenmyr, K.J.; Fureby, C. Large Eddy Simulations of Flow over Additively Manufactured Surfaces: Impact of Roughness and Skewness on Turbulent Heat Transfer. Phys. Fluids 2024, 36, 085143. [Google Scholar] [CrossRef]
- Kadivar, M.; Tormey, D.; McGranaghana, G. A review on turbulent flow over rough surfaces: Fundamentals and theories. Int. J. Thermofluids 2021, 10, 100077. [Google Scholar] [CrossRef]
- Thole, K.; Lynch, S.; Wildgoose, A. Review of advances in convective heat transfer developed through additive manufacturing. Adv. Heat Transf. 2021, 153, 249–325. [Google Scholar]
- Sundaram, R.; Madhavan, S.; Singh, P.; Ekkad, S. Enhanced fin-effectiveness of micro-scale concentric-shape roughened target surface subjected to array jet impingement. Int. J. Heat Mass Transf. 2021, 173, 121148. [Google Scholar] [CrossRef]
- Azad, G.; Huang, Y.; Han, J. Impingement Heat Transfer on Dimpled Surfaces Using a Transient Liquid Crystal Technique. Int. J. Rotating Mach. 2002, 8, 161–173. [Google Scholar] [CrossRef]
- Son, C.; Daley, G.; Ireland, P.; Gillespie, D. An Investigation of the Application of Roughness Elements to Enhance Heat Transfer in an Impingement Cooling System. In Proceedings of the ASME Turbo Expo 2005: Power for Land, Sea, and Air, Reno, NV, USA, 6–9 June 2005. [Google Scholar]
- Ekkad, S.; Singh, P. A Modern Review on Jet Impingement Heat Transfer Methods. ASME J. Heat Transf. 2021, 143, 064001. [Google Scholar] [CrossRef]
- Chakroun, W.; Abdel-Rahman, A.; Al-Fahed, S. Heat transfer augmentation for air jet impinged on a rough surface. Appl. Therm. Eng. 1998, 18, 1225–1241. [Google Scholar] [CrossRef]
- Beitelmal, A.; Saad, M.; Patel, C. Effects of surface roughness on the average heat transfer of an impinging air jet. Int. Comm. Heat Mass Transf. 2000, 27, 1–12. [Google Scholar] [CrossRef]
- Taslim, M.; Setayeshgar, L.; Spring, S. An Experimental Evaluation of Advanced Leading Edge Impingement Cooling Concepts. ASME J. Turbomach. 2001, 123, 147. [Google Scholar] [CrossRef]
- El-Gabry, L.; Kaminsky, D. Experimental Investigation of Local Heat Transfer Distribution on Smooth and Roughened Surfaces Under an Array of Angled Impinging Jets. ASME J. Turbomach. 2005, 127, 532. [Google Scholar] [CrossRef]
- McInturff, P.; Suzuki, M.; Ligrani, P.; Nakamata, C.; Lee, D. Effects of hole shape on impingement jet array heat transfer with small-scale, target surface triangle roughness. Int. J. Heat Mass Transf. 2018, 127, 585–597. [Google Scholar] [CrossRef]
- Rao, Y. Jet Impingement Heat Transfer in Narrow Channels with Different Pin Fin Configurations on Target Surfaces. ASME J. Heat Transf. 2018, 140, 072201. [Google Scholar] [CrossRef]
- Singh, P.; Zhang, M.; Ahmed, S.; Ramakrishnan, K.; Ekkad, S. Effect of micro-roughness shapes on jet impingement heat transfer and fin-effectiveness. Int. J. Heat Mass Transf. 2019, 132, 80–95. [Google Scholar] [CrossRef]
- Castelli, N.; Sandri, U.; Picchi, A.; Facchini, B.; Morante, F.; Cubeda, S. Experimental Analysis of Additive Manufactured Latticework Coupons. ASME J. Turbomach. 2023, 146, 061001. [Google Scholar] [CrossRef]
- Bacci, T.; Picchi, A.; Castelli, N.; Facchini, B.; Morante, F.; Innocenti, L. Assessment of Additive Manufactured Micro-Channel Characteristics: Impact of Hydraulic Diameter Evaluation. In Proceedings of the ASME Turbo Expo 2024: Turbomachinery Technical Conference and Exposition, London, UK, 24–28 June 2024. [Google Scholar]
- ASME. Measurement uncertainty. In Instrument and Apparatus, Vol. ANSI/ASME PTC 19.1-1985 of Performance Test Code; ASME: Houston, TX, USA, 1985. [Google Scholar]
- Kline, S.J.; McClintock, F.A. Describing uncertainties in single sample experiments. Mech. Eng. 1963, 75, 3–8. [Google Scholar]
- Florschuetz, L.; Truman, C.; Metzger, D. Streamwise flow and heat transfer distributions for jet array impingement with crossflow. ASME J. Heat Transf. 1981, 103, 337–342. [Google Scholar] [CrossRef]
- Gadelmawla, E.; Koura, M.; Maksoud, T.; Elewa, I.; Soliman, H. Roughness parameters. J. Mater. Process. Technol. 2002, 123, 133–145. [Google Scholar] [CrossRef]
- Florshuetz, L.; Metzger, D.E. Heat transfer characteristics for jet array impingement with initial crossflow. J. Heat Transf. 1984, 106, 34–41. [Google Scholar] [CrossRef]
- Rhee, D.; Yoon, P.H.; Choo, H. Local heat/mass transfer and flow characteristics of array impinging jets with effusion holes ejecting spent air. Int. J. Heat Mass Transf. 2003, 46, 1049–1061. [Google Scholar] [CrossRef]


| Base Components | D [mm] | p/D [-] | z/D [-] | L/D [-] | Manufacturing |
|---|---|---|---|---|---|
| Base 6 | 0.7 | 6 | 3.3 | 1.2 | AM |
| Base 12 | 0.7 | 12 | 3.3 | 1.2 | AM |
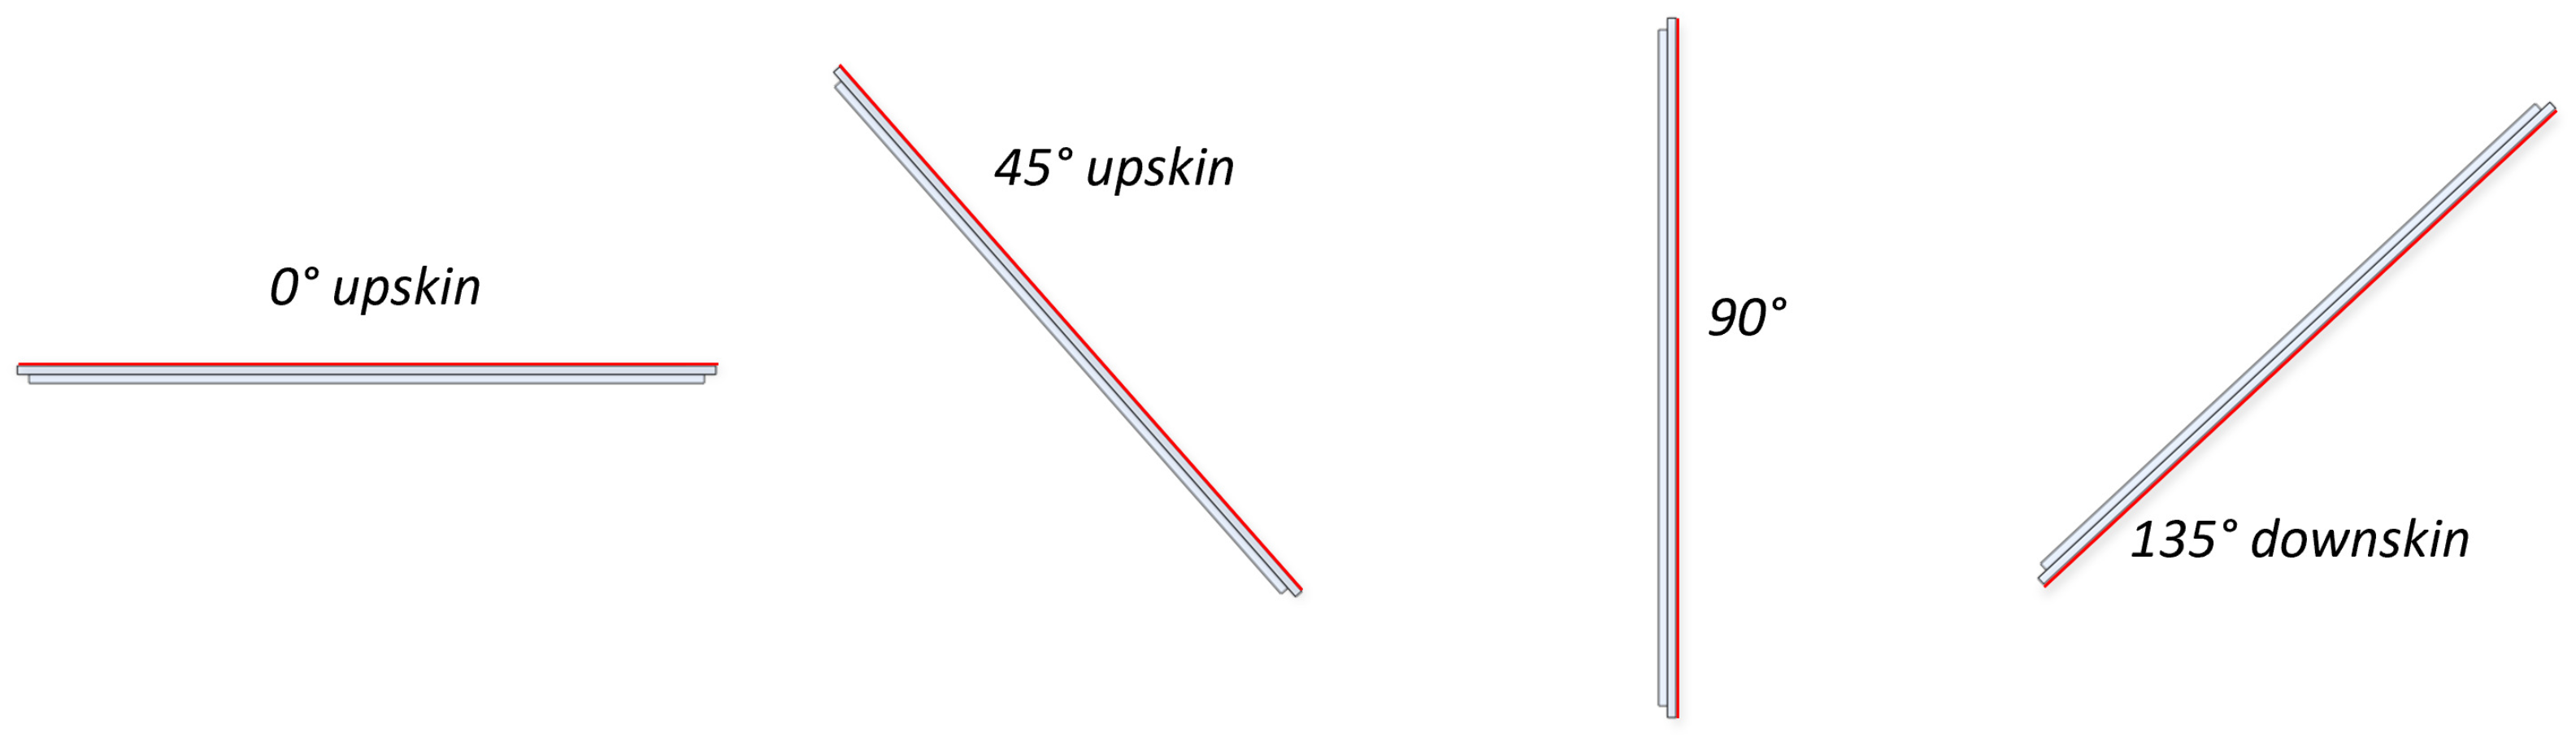
| Target plates | Manufacturing | Printing angle [°] | |||
| Target-0 | AM | 0 (upskin) | |||
| Target-45 | AM | 45 (upskin) | |||
| Target-90 | AM | 90 (vertical) | |||
| Target-135 | AM | 135 (downskin) | |||
| Target CNC | CNC | - |
Disclaimer/Publisher’s Note: The statements, opinions and data contained in all publications are solely those of the individual author(s) and contributor(s) and not of MDPI and/or the editor(s). MDPI and/or the editor(s) disclaim responsibility for any injury to people or property resulting from any ideas, methods, instructions or products referred to in the content. |
© 2024 by the authors. Licensee MDPI, Basel, Switzerland. This article is an open access article distributed under the terms and conditions of the Creative Commons Attribution (CC BY) license (https://creativecommons.org/licenses/by/4.0/).
Share and Cite
Bacci, T.; Picchi, A.; Innocenti, L.; Morante, F.; Facchini, B. Impact of Target Surface Building Direction on the Heat Transfer Characteristics of Additive Manufactured Impingement Systems. Aerospace 2024, 11, 944. https://doi.org/10.3390/aerospace11110944
Bacci T, Picchi A, Innocenti L, Morante F, Facchini B. Impact of Target Surface Building Direction on the Heat Transfer Characteristics of Additive Manufactured Impingement Systems. Aerospace. 2024; 11(11):944. https://doi.org/10.3390/aerospace11110944
Chicago/Turabian StyleBacci, Tommaso, Alessio Picchi, Luca Innocenti, Francesco Morante, and Bruno Facchini. 2024. "Impact of Target Surface Building Direction on the Heat Transfer Characteristics of Additive Manufactured Impingement Systems" Aerospace 11, no. 11: 944. https://doi.org/10.3390/aerospace11110944
APA StyleBacci, T., Picchi, A., Innocenti, L., Morante, F., & Facchini, B. (2024). Impact of Target Surface Building Direction on the Heat Transfer Characteristics of Additive Manufactured Impingement Systems. Aerospace, 11(11), 944. https://doi.org/10.3390/aerospace11110944