Article

Research on the Criteria for Determining the Starting Performance of an Inward-Turning Inlet by Integrating the Concept of the Equivalent Contraction Ratio

1
School of Mechanical and Materials Engineering, North China University of Technology, Beijing 100144, China
2
College of Energy and Power, Nanjing University of Aeronautics and Astronautics, Nanjing 210016, China
3
China Academy of Launch Vehicle Technology, Beijing 100076, China
*
Author to whom correspondence should be addressed.
Aerospace 2024, 11(11), 941; https://doi.org/10.3390/aerospace11110941
Submission received: 13 October 2024 / Revised: 7 November 2024 / Accepted: 11 November 2024 / Published: 13 November 2024
(This article belongs to the Special Issue Innovations in Hypersonic Propulsion Systems)

Abstract

:
The prediction of hypersonic inlet starting performance is crucial for the successful ignition of the combustion chamber, directly impacting the overall performance of the propulsion system. This challenge arises especially when freestream conditions vary. Therefore, this paper proposes the concept of the equivalent contraction ratio, and establishes and analyzes the intrinsic correlation between the geometric contraction ratio and angle of attack on the starting performance of three-dimensional inward-turning inlet. The results indicate the following: (1) The startability index can be applied to determine the start boundary of the three-dimensional inward-turning inlet under conditions of the freestream Mach number of 6.0 and an altitude of 27 km, with a deviation of no more than 6.6% from the optimal SI = 0.087 criterion; (2) The start boundary after applying the equivalent contraction ratio shows deviations not exceeding 4.0% under positive angle-of-attack conditions compared to the startability index, while the deviation is larger under negative angle-of-attack conditions, reaching a maximum of 13.3%. After applying a correction formula, the deviations can be reduced to within 2.0%; (3) For the same equivalent contraction ratio, the differences in starting performance between different positive and negative angle-of-attack conditions may fundamentally arise from the degree of compression of the inlet. Finally, the equivalent contraction ratio theory is proven to be able to quickly and easily predict the accurate starting performance of the inward-turning inlet at different angles of attack, improving the breadth and efficiency of engineering predictions.

1. Introduction

The inlet is a critical aerodynamic component that provides low-speed and stable airflow for air-breathing hypersonic ramjet engines [1], directly affecting whether the fuel inside the engine can fully combust or even ignite, and ultimately influencing the performance of the entire aircraft [2]. In particular, the starting performance of the inlet directly determines whether the engine can function properly. The failure of the propulsion system in the U.S. X-51A aircraft was due to the inlet not starting, leading to a failed flight test [3].
Extensive research has been conducted on factors that induce an inlet unstart. Liang [4], through studies on two-dimensional inlets, determined that the contraction ratio, flight altitude, and inflow angle of attack influence hypersonic starting performance, with altitude and angle of attack affecting the boundary-layer thickness and, thus, startability. Li [5] studied the mechanism of inlet startability, linking the angle of attack and Mach number to the starting performance, and proposed their comparability. Xu and Wang [6] studied the phenomenon of a hypersonic inlet not starting at high angles of attack, and found that the throat generates a high-pressure zone due to an airflow blockage and moves upstream, inducing a large-scale separation zone that causes the inlet unstart. The primary factors influencing inlet starting performance include the inflow Mach number [7], inlet contraction ratio [8], angle of attack, and downstream back pressure [9,10]. The main manifestation of unstart is the shock/boundary-layer interaction causing a separation bubble in front of the inlet, blocking airflow [11,12]. One of the key purposes of analyzing unstart is to predict the start range.
Extensive theoretical and experimental research has also been carried out on predicting inlet starting performance. The earliest widely recognized start boundary theory was proposed by Kantrowitz [13], based on the quasi-steady, inviscid, compressible one-dimensional flow assumption. The theory links the inlet contraction ratio to the freestream Mach number. If the contraction ratio is less than the Kantrowitz boundary, the inlet will start. If the ratio exceeds the Isentropic boundary, the inlet will not start. If it lies between the two, startability cannot be determined. Van et al. [14], using two-dimensional inlets, developed an empirical formula for maximum starting limits based on experimental data under real flow conditions. Mölder [15], building on Kantrowitz’s criterion, introduced the concept of a startability index (SI), which quantifies the starting performance of various types of inlets. The concept was validated using Prandtl–Meyer inlets, with the essence being a linear interpolation between the Isentropic and Kantrowitz boundaries. The better the start boundary, the closer it is to the Isentropic boundary, and vice versa. Flock [16] conducted experimental studies on three-dimensional inlets under varying angles of attack and sideslip angles, finding that an increased angle of attack worsens startability, with the angle of attack having a more significant impact than the sideslip angle. Flock [17] also proposed empirical formulas and semi-empirical formulas considering shock losses for certain Mach number ranges. Many domestic scholars have also conducted extensive research based on Kantrowitz’s theory. Sun and Zhang [18] compiled startability data for two-dimensional, side-compression, and internal contraction inlets, obtaining empirical start boundaries under real flow conditions. Xie et al. [19] compared flow blockages along the flow path in two-dimensional and axisymmetric inlets, proposing a prediction model considering the shock/boundary-layer interaction and fluid viscosity. Shi et al. [20], based on Kantrowitz’s theory, introduced new theoretical criteria considering incident shock losses and spillage at low Mach numbers, incorporating total pressure recovery and mass flow coefficients into the model to predict the startability of two-dimensional inlets. Yue et al. [21] simplified a two-dimensional hypersonic inlet model using dimensionless parameters and proposed a general empirical starting equation, considering shock-wave/boundary-layer interactions (SWBLI).
The theoretical prediction of starting performance has gradually evolved from an ideal, inviscid, one-dimensional state to a practical, viscous, multi-dimensional state, encompassing the starting performance under various conditions of the inlet. However, there is limited research on whether there exists an intrinsic connection among the effects of these various conditions on inlet starting performance. If multiple factors affecting the starting of a hypersonic inlet can be unified and interconnected, it would significantly enhance the efficiency of starting performance predictions and provide more meaningful guidance for studying the starting mechanisms of the inlet.
Compared to traditional configurations like two-dimensional inlets, an inward-turning inlet offers considerable advantages in terms of compression efficiency and flow capture [22,23,24], maximizing the performance of the propulsion system. Given its promising development prospects, this paper focuses on an inward-turning inlet. To reveal the quantitative rules and intrinsic mechanisms of start for an inward-turning inlet under different conditions, a systematic numerical investigation was conducted for an inlet with a varying geometric contraction ratio, angles of attack, and inflowing Mach number. Section 2 provides a detailed introduction to the physical model of the inlet and the numerical simulation method. In Section 3, the concept of an equivalent contraction ratio is introduced, and starting criteria applicable to the current start boundary are discussed. Additionally, a correction function is applied to further improve the accuracy of the start boundary predictions. The aim is to offer an engineering prediction method that allows for the simple and rapid prediction of the accurate starting performance of an inward-turning inlet at various angles of attack. Finally, the mechanism underlying the differences in predictive accuracy of the equivalent contraction ratio at different angles of attack is analyzed. Section 4 summarizes the research content.

2. Design and Calculation Method of the Inward-Turning Inlet

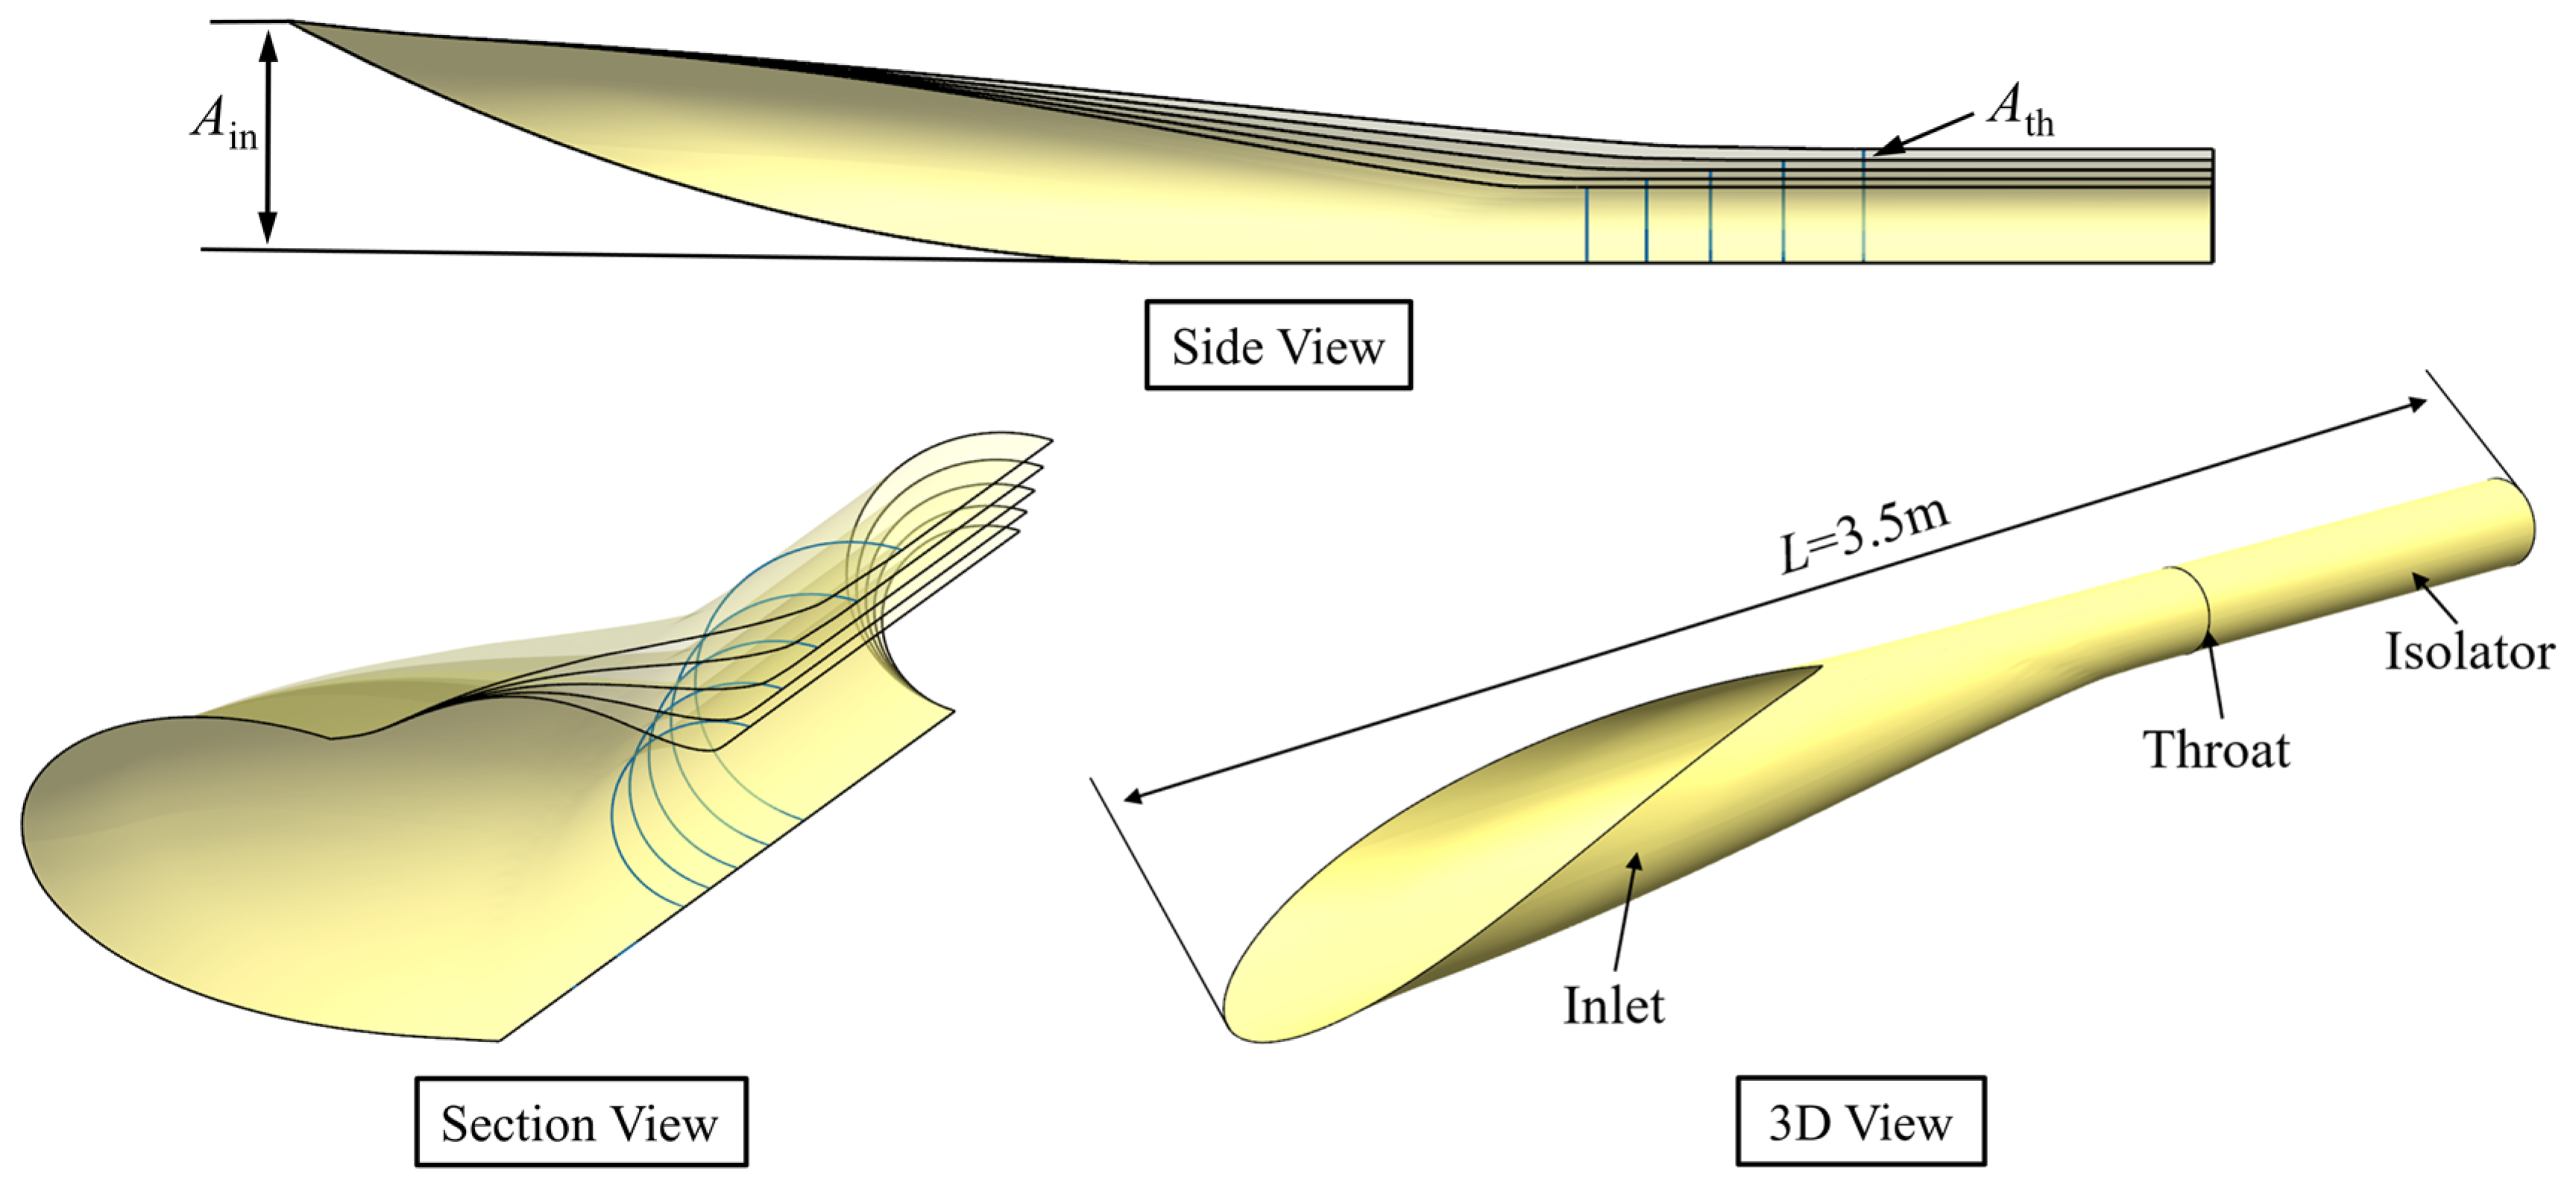
2.1. Design of the Inward-Turning Inlet

This paper uses the ICFC (Internal Conical Flow C) flow field as the reference flow field to design an inward-turning inlet (ITI). The ICFC flow field is a new type of basic flow field obtained by geometrically concatenating the incident shock wave of the ICFA (Internal Conical Flow A) flow field with the reflected shock wave of the truncated Busemann flow field [25]. This reference flow field is widely used in the design of an inward-turning inlet, as shown in Figure 1. The ICFC flow field is roughly composed of ICFA incident shock waves, ICFA and Busamann flow fields reflected shock waves, and are simply divided into an ICFA compression zone and Busamann compression zone. In Figure 2, A’B’C’D’E represents the circular inlet profile of the ITI, while ABCDE represents the circular outlet profile of the ITI. Using point E as the compression center, the non-viscous configuration of the ITI is generated by the program using the theory of tangential axis symmetry and streamline tracking technology. The three-dimensional inward-turning-inlet configuration is then obtained through shoulder smoothing and viscous correction.
As is shown in Figure 3, this paper designs three-dimensional inward-turning-inlet models with various geometric contraction ratios (CRgeo), ensuring that the inlet area of the inlet is the same and only the area of the throat position is changing. It should be clarified that the geometric contraction ratio is the ratio of the projected area of the inlet to the throat area, independent of the inflow state, as shown in Equation (1). Currently, this definition is used in engineering [26]. All ITIs are designed under the same inflow conditions: the inflowing Mach number (Ma) is 6.0, static temperature (T) is 223.54 K, and static pressure (p) is 1.88 kPa, which is suitable for the cruising flight conditions of most hypersonic aircraft [27,28,29]. Due to the aerodynamic design of the inlet, the Busemann compression profile changes accordingly, and the throat position (indicated by the blue solid line) is also inconsistent. Therefore, this paper sets up a straight isolation section with an equal cross-section to maintain the overall length of the intake system at 3.5 m. The detailed dimensions are shown in Table 1, where
C R geo = A in A th

2.2. Numerical Calculation Method

2.2.1. Numerical Details

The numerical calculation is carried out using ANSYS CFX 2019 R3 software based on the finite volume method to discretize the RANS (Reynolds Average Navier Stokes) equation. The design point of the inlet has a Mach number (Ma) of 6.0 and a height (H) of 27 km. The static pressure (p) at the inlet boundary of the velocity inlet is 1.88 kPa, and the static temperature (T) is 223.5 K. Due to its balance of computational efficiency, stability, and sensible exactness, the standard k-ε turbulence model is widely applicable to engineering models [30,31]. Therefore, the standard k-ε turbulence model is employed in this paper. The convection term of the control equation is solved using a high-resolution scheme based on MUSCL (Monotonic Upwind Scheme for Conservation Laws) interpolation. The time advance is solved using a point implicit method [32,33]. The near-wall region is treated using the wall function method, and the gas is an ideal gas with a specific heat ratio of 1.4. The viscosity is calculated using the Sutherland formula, and the heat transfer method is total energy transfer. Steady-state numerical simulations have been performed on the physical model, and it has been determined that the calculation results converged when the flow rate at the ITI outlet becomes stable and all residual values have decreased by at least three orders of magnitude [34,35].

2.2.2. Validation of Turbulence Models

This paper uses the Ames All body model from NASA’s Ames Research Center to conduct turbulence model validation work [36]. The Ames Research Center has conducted comprehensive wind tests on the model, and most CFD research on hypersonic aircraft currently uses this model as a benchmark for verifying the corresponding turbulence model.
Figure 4 is a schematic of the Ames All body model, with specific dimensions: the total length of the model is 0.9144 m, and the sweep angle of the delta wing is 75° (in top view). The model is divided into two parts along the 2/3 position of the flow direction, the forebody, and the afterbody, and each cross-sectional shape is composed of an ellipse. The ratio of the major and minor axes of the forebody cross-section ellipse is 4.0, and the height of the minor axis of the afterbody gradually decreases from the boundary line until the height at the trailing edge becomes zero. Ames All body blowing test conditions: freestream Mach number is 7.4, Reynolds number (Re, L) is 1.5 × 10⁷ (length is 0.9144 m), attack angles (α) are 0°, 5°, and 10°, freestream static temperature is 62 K, and wall temperature (Tw) is 300 K.
Figure 5 compares the wind tunnel test results provided by the Ames Center with the numerical simulation results based on the k-ε turbulence model. The curve in the figure represents the numerical simulation results, and the scatter points represent the wind tunnel test results. By comparing the pressure ratio distribution of the centerline on the windward/leeward side of the model, the following results can be obtained: (1) The pressure ratio from the numerical simulation matches well with the experimental results at regions of smooth surface, while at the surface inflection point (x is about 0.6 m), there is a more significant variation. The pressure ratio from the numerical simulation is, on average, about 3.6% higher than the experimental results, but overall, it still be consistent with the wind tunnel test results; (2) Within a small angle-of-attack range (α < 10°), the numerical simulation results show a high degree of agreement with the wind tunnel test results. However, at larger angles of attack (α > 10°), the agreement between the two is lower. Specifically, the static pressure distribution on the windward side of the numerical simulation is about 5.1% lower than the experimental results, while on the leeward side, it is about 7.3% higher. The deviation is attributed to the fact that the k-ε turbulence model provides reasonable results as an averaged simulation for extreme pressure gradients, vigorous flow deflection, whirl, and circulation, which lead to discrepancies with the experimental data. Nevertheless, the overall error remains within an acceptable range. These results indicate that the numerical simulation method based on the k-ε turbulence model can be used to assess the aerodynamic characteristics of hypersonic aircraft.

2.2.3. Grid Independence Research

Due to the analysis of the internal flow field of the inlet, all ITIs are surrounded by a far-field cylinder with a diameter approximately 7.3 times the inlet diameter of the ITI, as shown in Figure 6a. Multiple grids adopt a 3D hexahedral O-shaped mesh topology structure, and mesh refinement is carried out near the wall and inlet of the ITI to capture the impact cone shock wave. The outlet of the ITI and the outlet of the far-field cylinder are set as supersonic outlet boundaries, the cowl and far-field wall are set as adiabatic free slip boundaries, and the other wall surfaces are configured with adiabatic no slip and solid boundary conditions. The grid meets the requirements of the k-ε model with y+ = 15, corresponding to a first layer grid of approximately 0.12 mm and a grid growth rate of 1.2. Under the condition of ensuring the constant density of the boundary layer, three 3D hexahedral structural grids were studied to eliminate the influence of the grids on the results. The coarse, medium, and fine grids are 2.13 million, 5.68 million, and 8.25 million blocks, respectively. The pressure distribution along the upper and lower surfaces of the ITI is shown in Figure 6b,c. The pressure distribution along the middle and fine grids is basically the same, but differs significantly from that of the coarse grid. At the same time, the relevant internal flow performance at the throat of the ITI under different grid densities was also obtained, including the Mach number ( M a t h ), the compression ratio ( π t h ), the mass capture ratio (φ), the total pressure recovery ( σ t h ), and the kinetic energy efficiency ( η K E ). Among them:
π = p p
σ = p p
φ = m act m ˙ = m act K p T A q ( M a )
η K E = 1 σ 1 γ γ 1 γ 1 2 M a 2
p and p are the total pressure and static pressure within the inlet. p , T , and p are the total pressure, total temperature, and static pressure of the freestream. mact is the actual captured mass of the inlet, K = 0.040 414 (s K /m), and q(Ma) is the flow function corresponding to the freestream Mach number. π, φ and σ reflect the compression capacity, flow capture efficiency, and degree of energy loss during the airflow passing through the inlet, respectively. Among them, η K E represents the ratio of the equivalent kinetic energy of the local airflow after isentropic expansion to freestream to its kinetic energy in freestream, which better reflects the energy loss caused by the leading edge shock wave than σ.
Table 2 reveals that the difference in inlet performance between the medium grid and fine grid is not very significant, but the performance difference between the medium grid and coarse grid is relatively large. Especially in terms of pressure ratio, compared to fine grids, the deviation of coarse grids exceeds 0.7%, while the deviation of medium grids is 0.1%, which is within an acceptable accuracy range. Hence, upon completing the grid independence verification, it can be concluded that once the grid size exceeds 5.68 million, the impact on the inlet’s performance becomes negligible. Therefore, this paper adopts a grid density of 5.68 million for all models. In summary, from the perspectives of calculation accuracy and grid independence, the numerical simulation method chosen in this paper is feasible.

3. Results

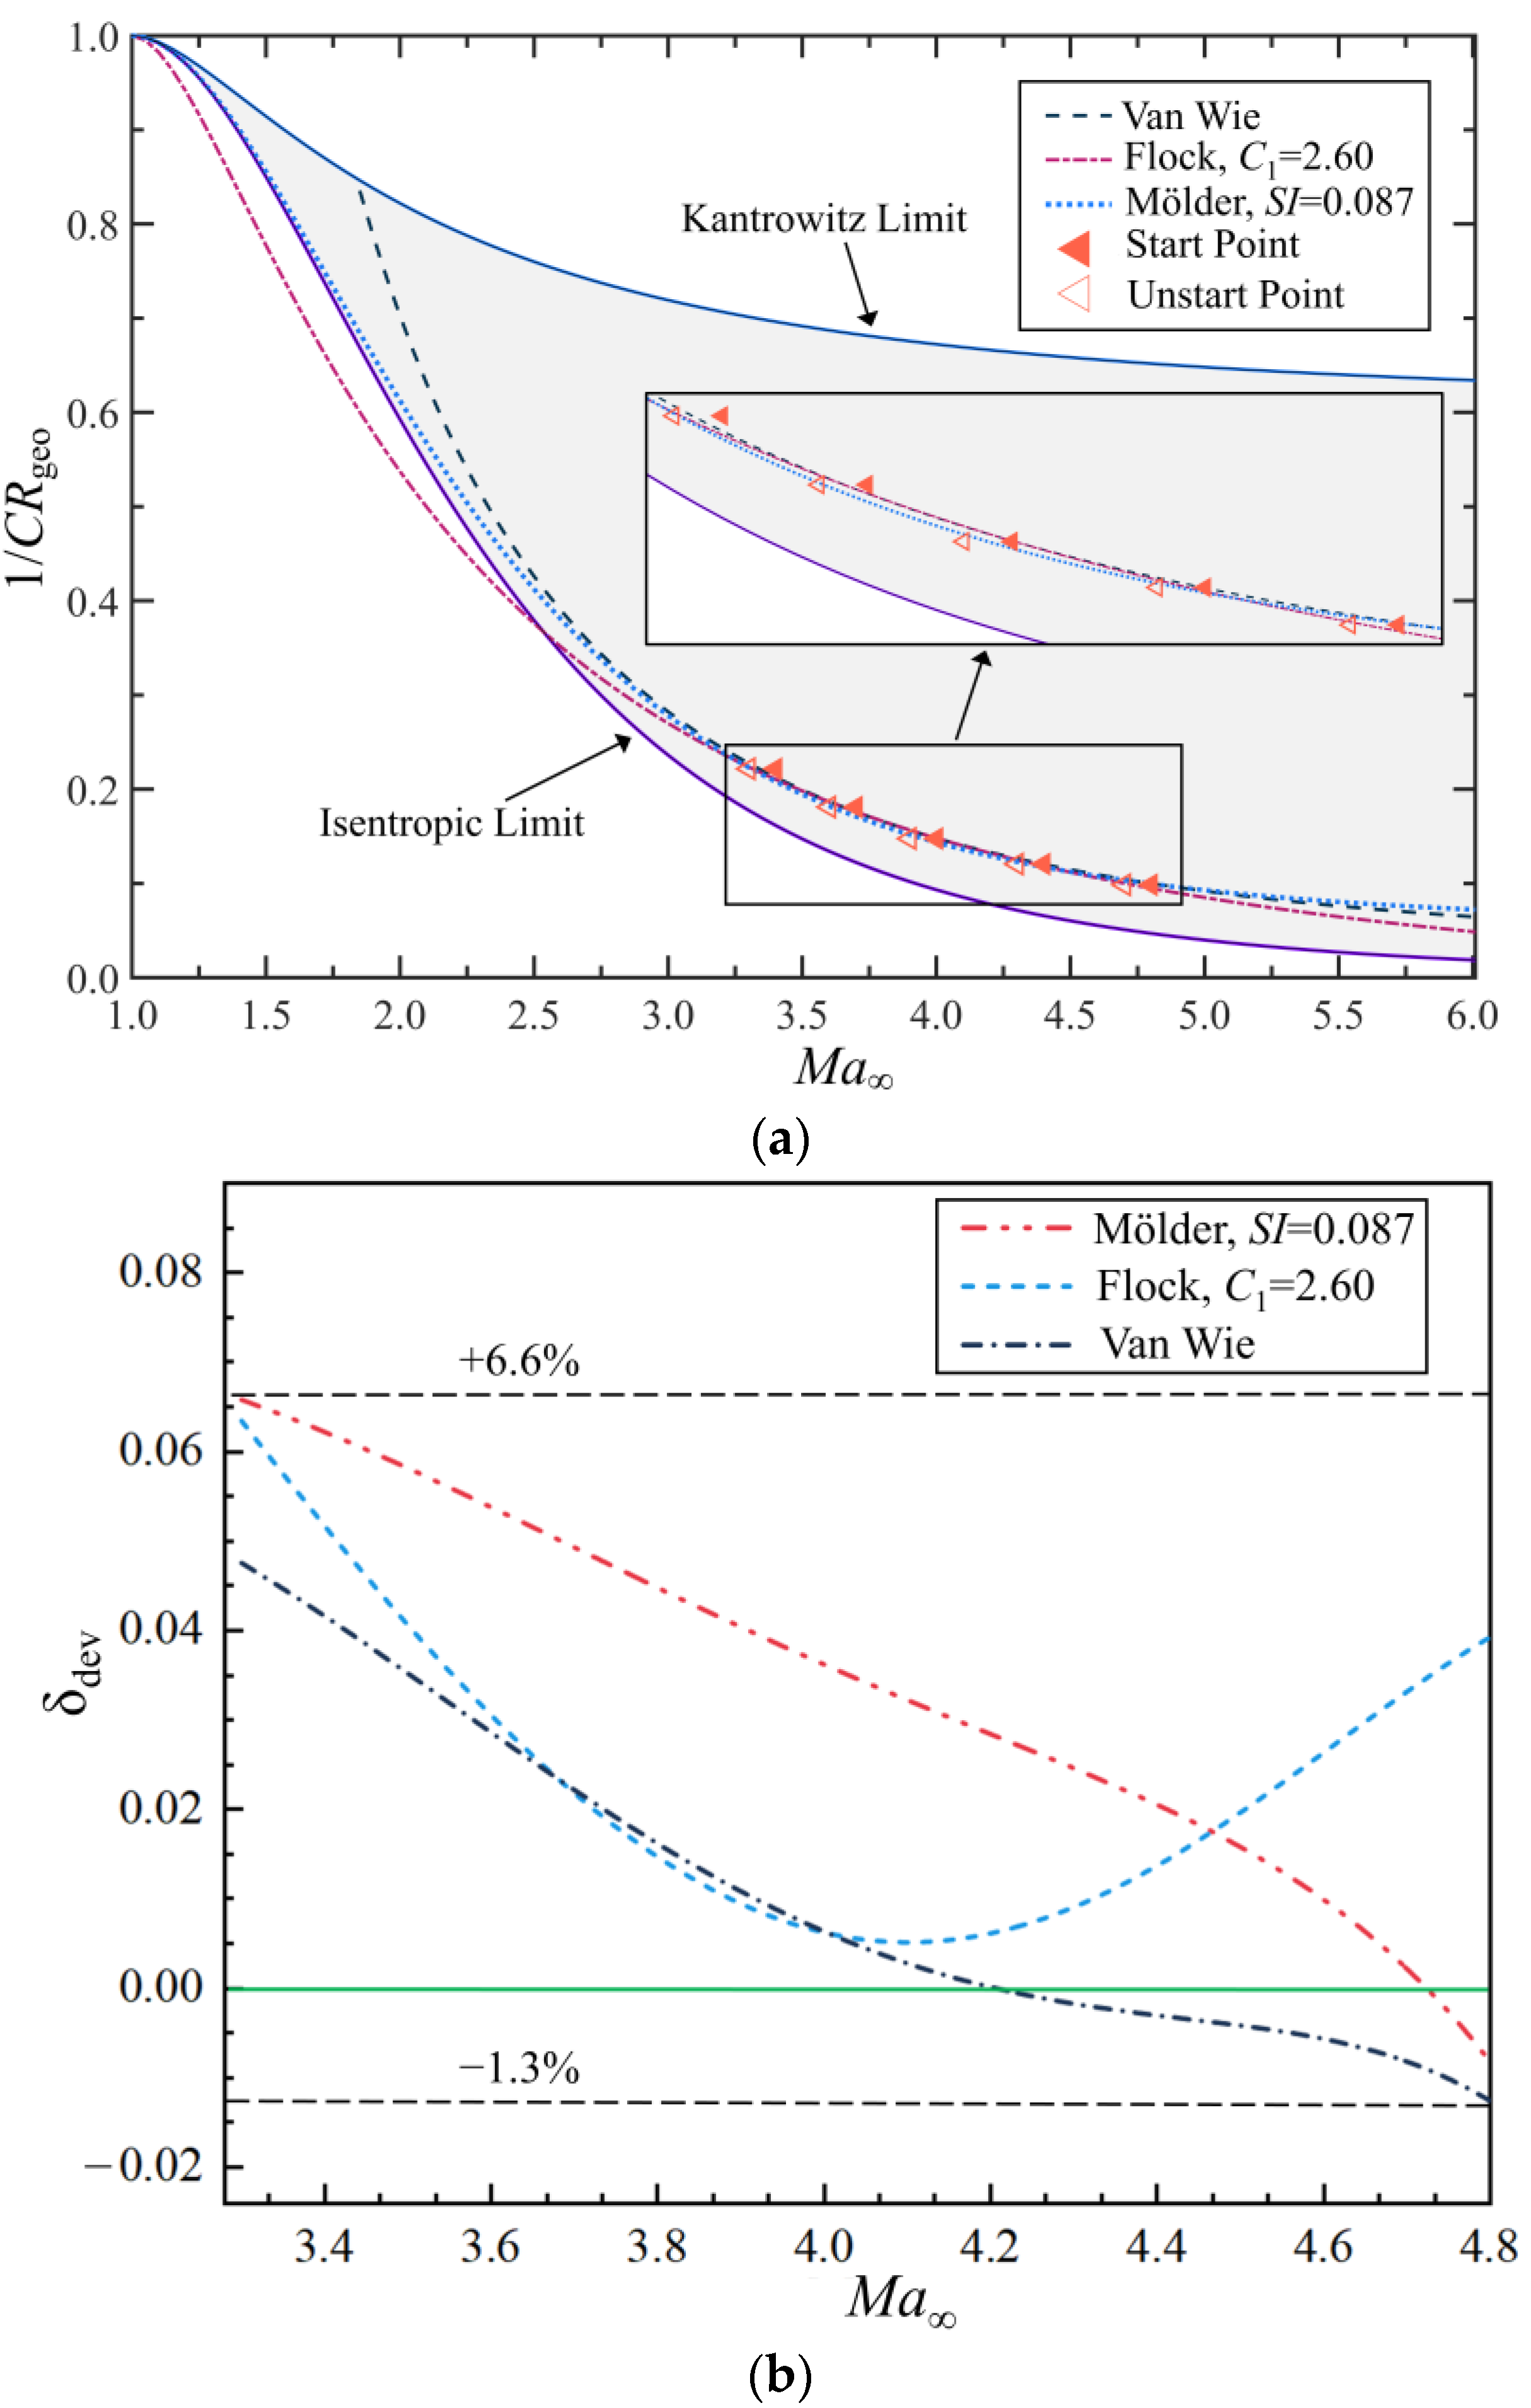
3.1. Prediction Method for Starting Performance of the Inward-Turning Inlet

3.1.1. Analysis of the Start Boundary for the Inward-Turning Inlet

Taking the ITI with CRgeo = 8.29 and α = 0° as an example in Figure 7, as the freestream Mach number gradually decreases from 6.0 to 4.4, it can be clearly observed that the angle of the oblique shock wave at the leading edge of the inlet gradually increases, resulting in a deterioration in the contact between the shock wave and the leading edge of the inlet, and an increase in overflow. The position of the first reflected shock wave in contact with the wall gradually deviates from the shoulder point, moves towards the interior of the compression zone, and the angle between it and the wall gradually increases. The number of reflected shock waves inside the isolation section gradually increases, and under Mach 4.4 conditions, the reflected shock waves in the isolation section area gradually weaken to disappear. In addition, the separation zone generated by shock waves/boundary layers is simply represented by the region with a Mach number less than 1.0 [21]. It can be seen that as the Mach number decreases, the interaction between reflected shock waves and boundary layers gradually increases, and the separation zone also gradually increases. When the freestream Mach number exceeds 4.4, a flat separation region forms between the shock wave and the boundary layer, without impeding the flow of gases. When the freestream Mach number drops to 4.3, the ITI is blocked by larger separation bubbles and the inlet does not start. Therefore, it can be concluded that the actual minimum start Mach number of the inlet is 4.4. Due to the minimum-start Mach number resolution of 0.1 in this paper, the results within the resolution can be considered accurate.
Figure 8 shows that the flow coefficient and Mach number at the throat of the inlet with CRgeo = 8.29 decrease linearly as the freestream Mach number decreases; The total pressure recovery and kinetic energy efficiency remain basically unchanged; The compression ratio at the throat increases first, then decreases, and then increases again; but overall, it shows an increasing trend. In the Mach 4.4 state, all parameters undergo a sudden change, resulting in a sharp decline in performance, which indicates the unstart state of the inlet from the performance perspective.
The ITI contains three-dimensional curved shock waves instead of normal shock waves, which is inconsistent with Kantrowitz’s quasi one-dimensional steady model assumption. Therefore, the prediction of Kantrowitz’s criterion is not applicable, and it can only make conservative predictions for the starting performance of an ITI. Due to the lack of a widely applicable theory for predicting the starting performance of a three-dimensional ITI, Figure 9a establishes the relationship between the freestream Mach number and the contraction ratio of the ITI based on existing empirical prediction models in the public literature. This includes the startability index proposed by Mölder [15], the empirical formula of Folck [17], and the empirical maximum contraction ratio limit formula of the inlet obtained through empirical fitting after considering shock waves and viscous losses by Van [14]. The relevant definition formula is as follows:
CR I = 1 M a 1 γ + 1 1 + γ 1 2 M a   2 γ + 1 2 γ 1
C R K = γ + 1 M a   2 γ 1 M a   2 + 2 1 2 γ + 1 M a   2 M a + γ 1 1 ( γ + 1 )
S I = 1 / C R theor . - 1 / C R I 1 / C R K - 1 / C R I
C R emp . = C R K C 1 + C R K ( 1 C 1 )
1 C R max = 0.05 0.52 M a + 3.65 M a 2 ,   ( 2 . 5 < M a < 10 )
CRI and CRK represent the Isentropic limit and the Kantrowitz limit, respectively, while CRtheor., CRemp., and CRmax correspond to the maximum geometric contraction ratio boundaries predicted by Mölder, Flock, and Van, respectively. SI and C1 are parameter variables that vary with different types of inlet. Figure 9a takes the start boundary of the ITI with different geometric contraction ratios at a 0° angle of attack as the reference, and obtains the most suitable parameter values (SI = 0.087, C1 = 2.60) within the start boundary region (the area between the minimum start boundary and the maximum unstart boundary), which are all above the unstart boundary. Figure 9b illustrates the deviation distribution between the predicted model and the actual start boundary within the Mach number range of Mach 3.3 to Mach 4.8. The deviations are all within the range of −1.3% to +6.6%. The f ( M a ) represents the relationship between the actual geometric contraction ratio and the freestream Mach number, while CRmodel denotes the different criterion models.
1 f M a = 0.0172 M a 3 + 0.2521 M a 2 + 1.2785 M a + 2.3312
δ dev = 1 / C R model 1 / f M a 1 / f M a
Among them, Van’s empirical formula is relatively the most consistent, but it is a fixed boundary and cannot be applied to other types of inlet. The deviation between the Flock empirical relation and the actual start boundary first decreases and then increases, and is closest near Mach 4.1, but it has already deviated from its actual physical meaning in the low Mach number range (Mach < 2.5). The startability index of Mölder gradually decreases in deviation from the actual start boundary as the Mach number increases, and can be applied to different types of inlet. It can be considered that the startability index (SI = 0.087) is suitable for describing the start boundary of an ITI.

3.1.2. Definition of the Equivalent Contraction Ratio

Table 3 shows the minimum-start Mach numbers for an ITI under different geometric contraction ratios and angles of attack, collectively forming the start boundary. If the start boundaries of inlets under various conditions are plotted on a single SI curve, as seen in Figure 10, it can be observed that as the angle of attack decreases, and the minimum-start Mach number of the inlet gradually decreases, indicating that the starting performance gradually improves. Conversely, as the angle of attack increases, the starting performance of the inlet gradually deteriorates. Although the start boundaries at different angles of attack still resemble the startability index, assuming a sufficiently large negative angle of attack that shifts the start boundary to the left, would cause the start boundary to exceed the Isentropic boundary. This is not physically reasonable; hence, a simple relationship between the geometric contraction ratio and the freestream Mach number cannot be established.
Therefore, this paper proposes the concept of an equivalent contraction ratio (CRe), which can unify the contraction ratio of the inlet under different angle of attack conditions. It is defined as the ratio of the projected area of the ITI’s inlet facing the reverse flow direction to the area of the throat. Unlike the geometric contraction ratio (CRgeo), CRe varies with changes in the freestream flow conditions. Figure 11 illustrates the equivalent contraction ratio corresponding to different angles of attack.
C R e = A A th
Figure 12 demonstrates that in the positive angle-of-attack state, the deviation of the equivalent contraction ratio from the SI = 0.087 is confined within a margin of ±4.0%. Compared to C1 = 2.60, the deviation oscillates between −7.0% and +2.0%. Relative to the maximum empirical start boundary, the deviation floats within a range of −2.0% to +3.0%. However, under negative angle-of-attack conditions, the equivalent contraction ratio exhibits its maximum deviation of up to 13.3% compared to SI = 0.087, 17.0% when compared to C1 = 2.60, and 12.0% when contrasted with the maximum empirical start boundary. It can be determined that under positive angle-of-attack conditions, the equivalent start boundary aligns well with the starting criteria; whereas under negative angle-of-attack conditions, there is a significant discrepancy between the two.
Of course, the concept of the equivalent contraction ratio demonstrates high accuracy under positive angle-of-attack conditions. However, for negative angle-of-attack conditions that exhibit significant deviations, a fitting correction formula is proposed as follows:
1 T ( M a ) = 1 f ( M a ) g ( M a ,   α )  
g ( M a ,   α ) = A ( α ) M a 2 + B ( α ) M a + C ( α )
A ( α ) = 0.0010 α 3 0.0056 α 2 + 0.0235 α + 0.0702
B ( α ) = 0.0091 α 3 + 0.0429 α 2 0.2070 α 0.5163
C ( α ) = 0.0210 α 3 0.0835 α 2 + 0.4648 α + 1.8955
The g ( M a ,   α )   represents the correction function associated with the Mach number and angle of attack, while f ( M a ) and T ( M a ) correspond to the relationships between the original and corrected equivalent contraction ratios and the freestream Mach number, respectively. After correction, the deviation of the start boundary from SI = 0.087 is within ±2.0%, improving the accuracy of the prediction. The differences exhibited by positive and negative angles of attack will be analyzed in detail in the following section.

3.2. Performance Analysis of Inward-Turning Inlet

The concept of the equivalent contraction ratio involves two variables: the geometric contraction ratio and the angle of attack. However, when analyzed together, it is not possible to clearly understand the underlying causes. Therefore, this section will first analyze the impact of the geometric contraction ratio and angle of attack on the inlet performance separately, before conducting a unified analysis.

3.2.1. Inlet Performance with Different Geometric Contraction Ratios

Under the condition of Ma = 6.0 and α = 0°, as the geometric contraction ratio increases from 4.51 to 10.14, the Mach number of the airflow through the leading edge oblique shock wave remains essentially at 5.0, but there is a noticeable deceleration after passing through the isentropic compression section, with the throat Mach number decreasing from 4.0 to 3.0, as seen in Figure 13. This means that with the increase in the geometric contraction ratio, the intensity of the inlet’s oblique shock wave remains essentially unchanged, while the compression capability of the Busemann compression section is enhanced. There is no significant change in the flow field structure within the compression section, and the expansion area of the inlet is gradually decreasing. Regarding the isolation section area, the larger the geometric contraction ratio, the thicker the boundary layer. This is because the inlet with a larger geometric contraction ratio has a stronger compression capability; hence, its reflected shock wave is also stronger, and its interaction with the boundary layer is more pronounced. The flow separation at the shoulder point is more evident, leading to the gradual growth of the boundary layer.
Figure 14 displays the distribution of the total pressure recovery at the throat and exit sections. It can be observed that the upper half of the inlet at the throat is enclosed by a thicker boundary layer, while the lower half has a thinner boundary layer, but there is a noticeably depressed low-energy area at the bottom. At the exit position, the boundary layer and the depressed low-energy area further expand, which is the result of the compression waves in the inlet converging towards the compression center and interacting with the lower boundary layer. With the increase in the geometric contraction ratio, there is no significant change in the flow field structure at the throat of the inlet, but the high total pressure area at the exit gradually decreases, mainly appearing in the upper half of the region.
Table 4 and Figure 15 show that under the same freestream conditions, as the geometric contraction ratio increases, the total pressure recovery at the throat of the inlet gradually decreases, but the overall change is minor, remaining at around 0.7; the pressure ratio increases approximately linearly, reaching up to 50 times the freestream static pressure at CRgeo = 10.14; the Mach number decreases approximately linearly, dropping to 2.6 at CRgeo = 10.14; the flow capture capability is essentially consistent, approaching full flow capture. The isolation section leads to further enhancement of the compression capability but it also results in an increase in total pressure loss along the flow direction; the larger the geometric contraction ratio, the more significant the effect, which is consistent with the results of the flow field analysis.

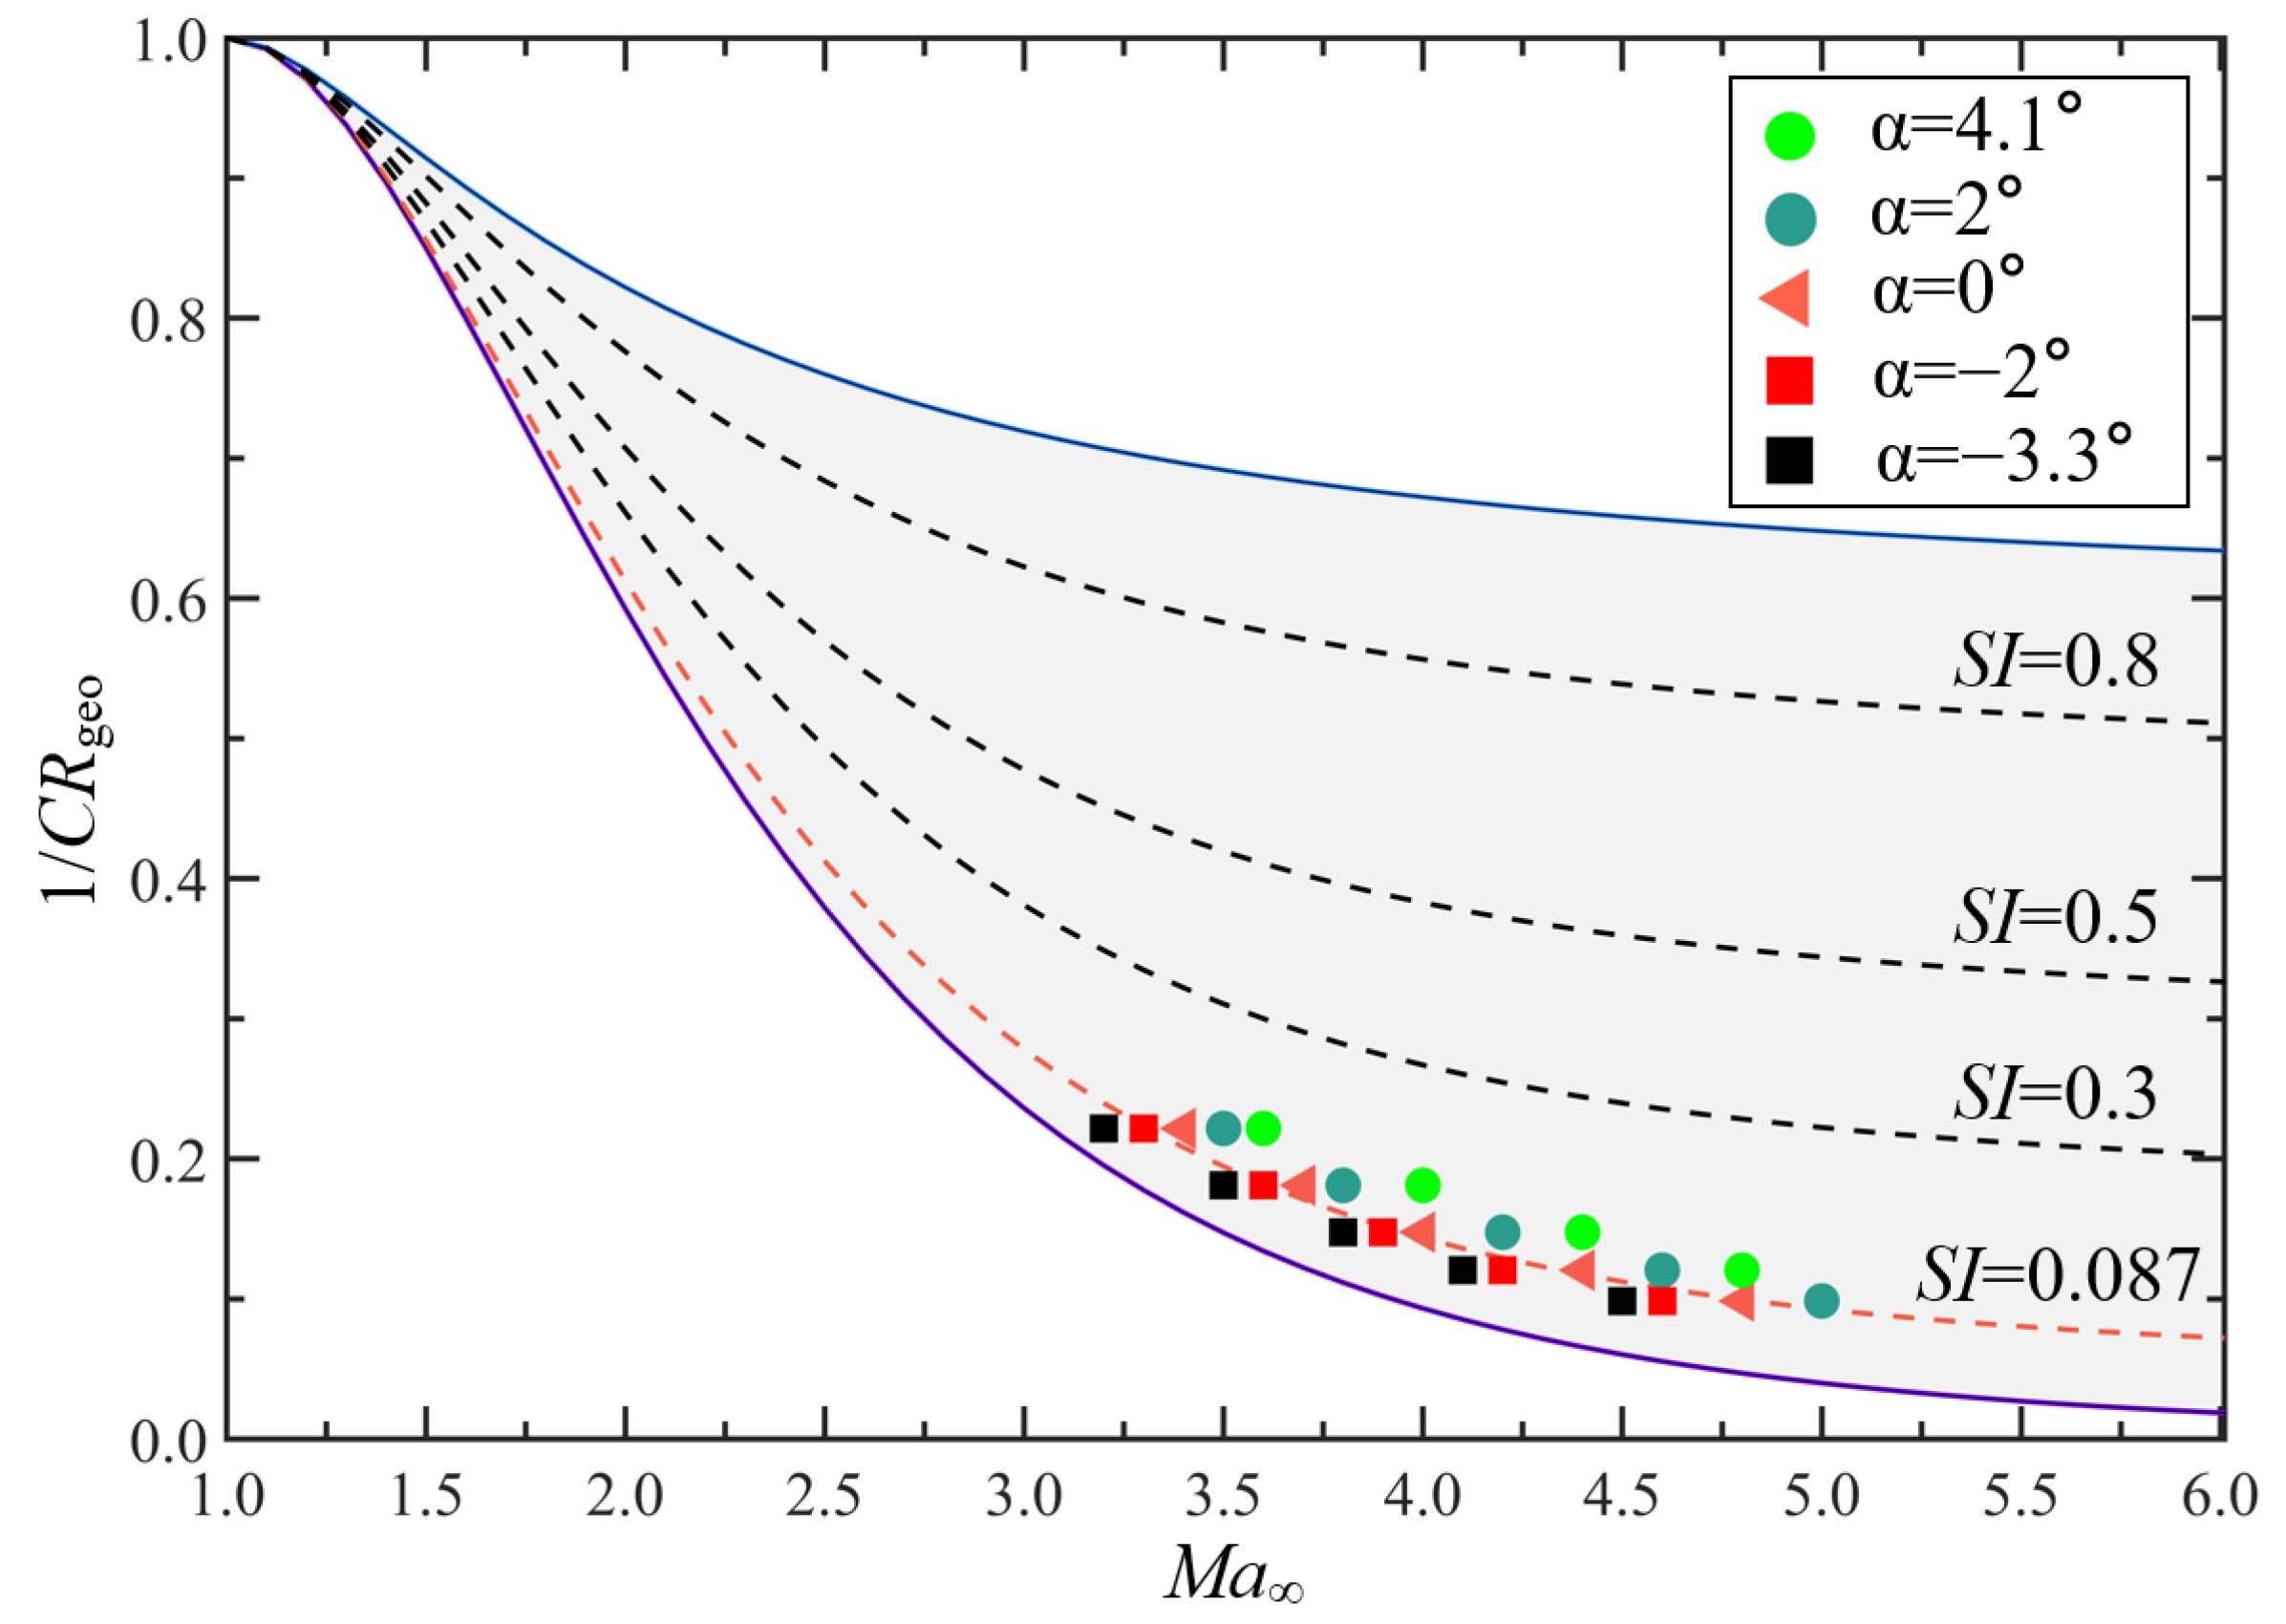
3.2.2. Inlet Performance with Different Angles of Attack

Figure 16 demonstrates that, under conditions of a positive angle of attack, the inlet lip achieves effective flow attachment without observable spillage, and the expansion region consequently disappears. At an angle of attack of 4.1°, a strong interaction between the incident shock wave and the boundary layer is clearly evident at the lip, leading to rapid boundary-layer growth. In contrast, under a negative angle of attack, a noticeable increase in flow spillage from the inlet occurs progressively as the angle of attack decreases.
Table 5 and Figure 17 show that as the angle of attack increases, the total pressure recovery at the inlet throat gradually decreases, with significant total pressure loss observed at an angle of attack of 4.1°. The pressure ratio exhibits a nearly linear increase, reaching up to approximately 38 times the freestream static pressure at 4.1°. The Mach number decreases almost linearly, while the flow capture capability gradually improves, achieving full flow capture under a positive angle of attack. The isolator section similarly increases the compression capability and total pressure loss, but its impact does not vary with the angle of attack.

3.2.3. Inlet Performance Under the Same Equivalent Contraction Ratio

Figure 18 illustrates the pressure ratio and total pressure recovery along the centerline of the inlet at an equivalent contraction ratio (CRe = 6.77). Under a Mach 6.0 freestream, the airflow experiences a sudden pressure increase and significant total pressure loss as it passes through the leading edge oblique shock. In the truncated Busemann compression section, the pressure increases substantially without a notable rise in total pressure loss. As the airflow passes through the series of reflected shocks, the pressure fluctuates periodically, again without significant total pressure loss. At an angle of attack of 4.1°, the oblique shock and the first reflected shock are stronger compared to the other cases, with fewer reflected shocks observed. For the inlet at a −3.3° angle of attack, compression mainly relies on the truncated Busemann section, resulting in minimal total pressure loss. However, a sudden drop in the total pressure coefficient occurs in the isolator section, attributed to the thick boundary layer extending to the center of the inlet. Under a Mach 4.1 freestream (close to the unstart Mach number), the overall trend is similar to that under Mach 6.0, but the inlet at a −3.3° angle of attack exhibits a stronger compression capability. When the airflow passes through the reflected shocks (around x = 2.3 m), the pressure is noticeably higher than in the other cases.
The internal performance of the inlet at Mach 4.1 and Mach 6.0 is shown in Table 6. It can be analyzed that the inlet with CRgeo = 8.29 exhibits a relatively high pressure ratio and total pressure loss, indicating a stronger compression capability, with a pressure ratio of approximately 31.4 times the freestream static pressure. In contrast, the compression capabilities of the inlets with CRgeo = 6.77 and CRgeo = 5.53 are nearly similar. As the angle of attack decreases, the intensity of the leading edge oblique shock weakens, resulting in a corresponding reduction in total pressure loss. Figure 19 shows the internal flow of the ITI, where the initial shock wave at a positive angle of attack fits well with the upper part of the leading edge, while there is a clear overflow area in the lower part, resulting in similar flow capture capabilities of the three inlets.
Based on the above analysis, it can be concluded that the increase in the angle of attack is primarily reflected in the enhancement of the intensity of the leading edge oblique shock, without significantly affecting the overall structure of the flow field. The increase in the geometric contraction ratio is mainly manifested in the enhanced compressibility of the truncated Busemann compression section. Both factors contribute to a linear increase in the compression performance of the inlet and a decrease in starting performance. The angle of attack and geometric contraction ratio establish a relationship through the inlet’s compression performance, making the concept of an equivalent contraction ratio feasible from a mechanistic perspective. Under the same equivalent contraction ratio conditions, inlets with positive angles of attack and low contraction ratios exhibit significant similarities in compression performance, starting performance, and design state, while inlets with negative angles of attack and high contraction ratios show notable differences only in compression and starting performance. Therefore, compression performance may be a key factor contributing to the differences in starting performance between positive and negative angles of attack. In other words, excessively high compression performance of the inlet can lead to a weakened starting performance.
The equivalent contraction ratio theory is derived from results within a small angle-of-attack range (α = −3.3°~4.1°), hence its applicability for larger angles of attack and sideslip angles still needs to be verified. However, unlike previous studies that only predicted the starting performance under the inlet’s design conditions, the equivalent contraction ratio theory has expanded the breadth of prediction. Based on this theory, a limited number of numerical simulations can quickly and simply predict the accurate start boundaries of an inward-turning inlet at various angles of attack, thereby saving a significant amount of computational resources and time.

4. Conclusions

This study investigates the starting performance of three-dimensional inward-turning inlet under different contraction ratios and angle-of-attack conditions. Based on the start boundary defined by the startability index, the concept of the equivalent contraction ratio is proposed, distinguishing it from the geometric contraction ratio. This allows for a unified definition of inlets under different angle-of-attack conditions, enabling the accurate and direct prediction of starting performance for various states. The main conclusions are as follows:
(1)
The start boundary of the inward-turning inlet in the design state can be predicted using the startability index (SI = 0.087) proposed by Mölder, with a maximum error of approximately 6.6%, which is consistent with the maximum geometric contraction ratio boundary summarized by Van.
(2)
By incorporating the angle of attack into the geometric contraction ratio, the concept of the equivalent contraction ratio is introduced and compared with the startability index. Predictions under positive angle-of-attack conditions are relatively accurate, with an error not exceeding 4.0%; however, under negative angle-of-attack conditions, the deviation is larger at 13.3%. After applying a fitting function correction, the deviation can be reduced to within 2.0%. This theory allows for the rapid and straightforward determination of the accurate inlet start boundaries at different angles of attack, making it suitable for engineering estimates and saving computational resources.
(3)
The effects of the Mach number, angle of attack, and geometric contraction ratio on the performance of the inlet are analyzed. A decrease in the Mach number leads to an expanding separation zone, ultimately resulting in the inlet failing to start. An increase in the angle of attack enhances the strength of the oblique shock at the inlet’s leading edge. Increasing the geometric contraction ratio strengthens the compressibility of the internal compression region. The combined effects of the angle of attack and geometric contraction ratio ultimately unify into the inlet’s compression strength. The differences in prediction accuracy between positive and negative angle of attack conditions are attributed to the internal pressure of the inlet at negative angles being significantly higher than that at positive angles and the design state, resulting in a poorer starting performance.

Author Contributions

Conceptualization, F.M., Z.Y. and X.H.; methodology, F.M. and Z.Y.; software, F.M. and Z.Y.; validation, F.M.; formal analysis, F.M. and Z.Y.; investigation, F.M.; resources, F.M., Z.Y., X.H., B.J. and Z.C.; data curation, F.M.; writing—original draft preparation, F.M. and Z.Y.; writing—review and editing, F.M. and Z.Y.; visualization, F.M.; supervision, Z.Y., W.Y. and Z.Z.; project administration, Z.Y.; funding acquisition, Z.Y., X.H., B.J. and Z.C. All authors have read and agreed to the published version of the manuscript.

Funding

This research is supported by CALT Funding (CALT2023-07); National Natural Science Foundation of China (12002162); Yuxiu Innovation Project of NCUT (Project No. 2024NCUTYXCX106).

Data Availability Statement

Data are contained within the article.

Conflicts of Interest

Authors Xiaolong He and Zheng Chen were employed by the company China Academy of Launch Vehicle Technology. The remaining authors declare that the re-search was conducted in the absence of any commercial or financial relationships that could be construed as a potential conflict of interest.

References

  1. Liu, X.; Yang, H. Development of hypersonic inlet. Aerosp. Technol. 2022, 3, 62–70. [Google Scholar]
  2. Smart, M.K. How much compression should a scramjet inlet do? AIAA J. 2012, 50, 610–619. [Google Scholar] [CrossRef]
  3. Bai, Y.; Bai, Y. Failure Analysis of the X-51A Aircraft Flight Test. Aeronaut. Missile J. 2012, 3, 27–30+46. [Google Scholar]
  4. Liang, D.; Yuan, H.; Zhang, X. Research on the Effects of Start Ability of Hypersonic Inlet. J. Astronaut. 2006, 4, 714–719. [Google Scholar]
  5. Guo, S.; Li, Z.; Gao, W.; Yang, J. Analogy Between Effects of Attack Angle and Mach Number on Inlet Starting. J. Propul. Technol. 2017, 38, 983–991. [Google Scholar]
  6. Xu, S.; Wang, Y.; Wang, Z.; Fan, X.; Xiong, B. Unsteady behavior of hypersonic inlet unstart caused by high angle of attack. Aerosp. Sci. Technol. 2022, 130, 107884. [Google Scholar] [CrossRef]
  7. Hillier, R. Shock-wave/expansion-wave interactions and the transition between regular and mach reflection. J. Fluid Mech. 2007, 575, 399–424. [Google Scholar] [CrossRef]
  8. Devaraj, M.K.K.; Jutur, P.; Rao, S.M.; Jagadeesh, G.; Anavardham, G.T. Investigation of local unstart in a hypersonic scramjet intake at a mach number of 6. Aerosp. Sci. Technol. 2021, 115, 106789. [Google Scholar] [CrossRef]
  9. Chen, H.; Tan, H.J. Buzz flow diversity in a supersonic inlet ingesting strong shear layers. Aerosp. Sci. Technol. 2019, 95, 105471. [Google Scholar] [CrossRef]
  10. Chang, J.; Li, N.; Xu, K.; Bao, W.; Yu, D. Recent research progress on unstart mechanism, detection and control of hypersonic inlet. Prog. Aerosp. Sci. 2017, 89, 1–22. [Google Scholar] [CrossRef]
  11. Saravanan, R.; Desikan, S.; Francise, K.; Kalimuthu, R. Experimental investigation of start/unstart process during hypersonic intake at mach 6 and its control. Aerosp. Sci. Technol. 2021, 113, 106688. [Google Scholar] [CrossRef]
  12. Tang, X.; Xiong, B.; Fan, X.; Liu, J.; Zhao, J. Experimental research on the flow mechanism of dual-separation unstart phenomenon in hypersonic inlet. Aerosp. Sci. Technol. 2024, 150, 109189. [Google Scholar] [CrossRef]
  13. Kantrowitz, A.; Donaldson, C. Preliminary Investigation of Supersonic Diffusers; National Advisory Committee for Aeronautics: Washington, DC, USA, 1945; p. 336. [Google Scholar]
  14. Van Wie, D.; Kwok, F.; Walsh, R. Starting characteristics of supersonic inlets. In Proceedings of the 32nd Joint Propulsion Conference and Exhibit, Lake Buena Vista, FL, USA, 1–3 July 1996. [Google Scholar]
  15. Molder, S.; Timofeev, E.; Tahir, R. Flow starting in high compression hypersonic air inlets by mass spillage. In Proceedings of the 40th AIAA/ASME/SAE/ASEE Joint Propulsion Conference and Exhibit, Fort Lauderdale, FL, USA, 11–14 July 2004. [Google Scholar]
  16. Flock, A.K.; Gülhan, A. Experimental investigation of the starting behavior of a three-dimensional scramjet intake. AIAA J. 2015, 53, 2686–2693. [Google Scholar] [CrossRef]
  17. Flock, A.K.; Guelhan, A. Modified kantrowitz starting criteria for mixed compression supersonic intakes. AIAA J. 2019, 57, 2011–2016. [Google Scholar] [CrossRef]
  18. Sun, B.; Zhang, K.Y. Empirical equation for self-starting limit of supersonic inlets. J. Propul. Power 2010, 26, 874–875. [Google Scholar] [CrossRef]
  19. Xie, W.Z.; Ma, G.F.; Guo, R.W.; Chen, H.; Wen, Y.F.; Guo, S.M. Flow-based prediction for self-starting limit of two-dimensional hypersonic inlets. J. Propul. Power 2016, 32, 463–471. [Google Scholar] [CrossRef]
  20. Pan, J.; Shi, C.; Li, Y.; You, Y.; Chen, R. A New Understanding of Hypersonic Inlets’ Startability Criterion. J. Propul. Technol. 2016, 37, 2039–2047. [Google Scholar]
  21. Tong, X.T.; Yue, L.J.; Chen, H.; Zhang, Q.F.; He, C.M. Similarity analysis on two-dimensional hypersonic inlets unstart. AIAA J. 2023, 61, 555–572. [Google Scholar] [CrossRef]
  22. You, Y.C. An overview of the advantages and concerns of hypersonic inward turning inlets. In Proceedings of the 17th AIAA International Space Planes and Hypersonic Systems and Technologies Conference, San Francisco, CA, USA, 11–14 April 2011. [Google Scholar]
  23. Nan, X.; Zhang, K.; Jin, Z.; Sun, B. Numerical and experimental investigation of hypersonic inward turning inlets with rectangular to circular shape transition. Acta Aeronaut. Astronaut. Sin. 2011, 32, 988–996. [Google Scholar]
  24. Huang, H.; Huang, G.; Yu, Z.; Qiao, W. The design of internal waverider hypersonic inlet with high ratio of external compression. J. Eng. Thermophys. 2015, 36, 1233–1237. [Google Scholar]
  25. Guo, J.; Huang, G.; You, Y.; Liang, D. Study of internal compression flow field for improving the outflow uniformity of internal waverider inlet. J. Astronaut. 2009, 30, 1934–1940+1952. [Google Scholar]
  26. Wang, Y. Investigation on the Starting Characteristics of Hypersonic Inlet. Doctor’s Thesis, National University of Defense Technology, Changsha, China, 2008. [Google Scholar]
  27. Musa, O.; Huang, G.; Yu, Z. Evaluation of the pressure-corrected osculating axisymmetric flows method for designing hypersonic wavecatcher intakes with shape transition. J. Aerosp. Eng. 2024, 37, 04024023. [Google Scholar] [CrossRef]
  28. Hao, C.; Luo, W.; Yu, Z.; Zhu, J.; You, Y. Novel design method for inward-turning inlets with non-uniform inflow. Aerosp. Sci. Technol. 2024, 148, 109098. [Google Scholar] [CrossRef]
  29. Yuan, H.; Li, Z.; Zhang, J.; Wang, X. Experimental and numerical research on a three-dimensional inward-turning inlet. J. Aerosp. Eng. 2023, 36, 04023008. [Google Scholar] [CrossRef]
  30. Panchal, S.; Gudlanarva, K.; Tran, M.-K.; Herdem, M.S.; Panchal, K.; Fraser, R.; Fowler, M. Numerical simulation of cooling plate using k-epsilon turbulence model to cool down large-sized graphite/lifepo4 battery at high c-rates. World Electr. Veh. J. 2022, 13, 138. [Google Scholar] [CrossRef]
  31. Liu, J.; Wang, D.; Huang, X. Investigation of turbulence models for aerodynamic analysis of a high-pressure-ratio centrifugal compressor. Phys. Fluids 2023, 35, 106108. [Google Scholar] [CrossRef]
  32. Hua, Z.; Yuan, H.; Wang, J.; Chen, W. Effects of swept lip on starting characteristies of 2-D hypersonic inlet. J. Propul. Technol. 2017, 38, 241–248. [Google Scholar]
  33. De Vanna, F.; Bof, D.; Benini, E. Multi-objective rans aerodynamic optimization of a hypersonic intake ramp at mach 5. Energies 2022, 15, 2811. [Google Scholar] [CrossRef]
  34. Li, Y.; Shi, C.; Zhu, C.; You, Y. Aerodynamic combination design concept for hypersonic waverider forebody and inward turning inlet. J. Propul. Technol. 2018, 39, 2320–2328. [Google Scholar]
  35. Hao, C.; Huang, G.; Yu, Z. Numerical study on effects of typical characteristic parameters on flight performance for rapid turning APU inlet. J. Propul. Technol. 2022, 43, 151–162. [Google Scholar]
  36. Lockman, W.K.; Lawrence, S.L.; Cleary, J.W. Flow over an all-body hypersonic aircraft-experiment and computation. J. Spacecr. Rockets. 1992, 29, 7–15. [Google Scholar] [CrossRef]
Figure 1. Schematic of ICFC basic flow field.
Aerospace 11 00941 g001
Figure 2. The sketch of theoretical design for inlet and outlet of inward-turning inlet.
Aerospace 11 00941 g002
Figure 3. Schematic of inward-turning-inlet configurations with different geometric contraction ratios.
Aerospace 11 00941 g003
Figure 4. Schematic of Ames all body model: 3D view(top); left view (bottom).
Aerospace 11 00941 g004
Figure 5. Pressure ratio distribution on the centerline of the Ames all body model: (a) windward side and (b) leeward side.
Aerospace 11 00941 g005
Figure 6. (a) The adopted boundary conditions and structured mesh; (b) wall pressure ratio on lower surfaces; (c) wall pressure ratio on upper surfaces.
Aerospace 11 00941 g006
Figure 7. Pressure and Mach number contour plots along the inlet’s longitudinal section during the unstart process.
Aerospace 11 00941 g007
Figure 8. Performance parameter variations during the inlet unstart process.
Aerospace 11 00941 g008
Figure 9. Comparison of the starting region of ITI with different starting criteria: (a) the relationship between the freestream Mach number and the contraction ratio under different starting criteria; (b) the deviation between the start boundary and the starting criteria (the green line is the baseline with zero deviation).
Aerospace 11 00941 g009
Figure 10. The relationship between the start boundary and the geometric contraction ratio varies under different angles of attack (the orange dashed line represents the most suitable SI, while the black dashed line is only for reference).
Aerospace 11 00941 g010
Figure 11. Schematic diagram of the inlet’s equivalent contraction ratio: positive angle of attack (top); design condition (middle); negative angle of attack (bottom).
Aerospace 11 00941 g011
Figure 12. (a) Equivalent positive angle-of-attack start boundary; (b) equivalent negative angle-of-attack start boundary; (c) deviation of equivalent boundary from SI = 0.087; (d) deviation of equivalent boundary from C1 = 2.60; (e) deviation of equivalent boundary from empirical maximum contraction ratio boundary.
Aerospace 11 00941 g012
Figure 13. Mach number contour plots of the inlet’s longitudinal section at different geometric contraction ratios.
Aerospace 11 00941 g013
Figure 14. Contour plots of the total pressure recovery across the inlet’s cross-section at various geometric contraction ratios: the throat section (left); the exit section (right).
Aerospace 11 00941 g014
Figure 15. Under various geometric contraction ratios, the performance patterns of the inlet’s cross-section at Ma = 6.0 and α = 0° are depicted (circles represent the throat section, and triangles represent the exit section).
Aerospace 11 00941 g015
Figure 16. Mach number contour of the longitudinal section of the inlet at different angles of attack (the black arrow in the figure represents the streamline).
Aerospace 11 00941 g016
Figure 17. Performance curves of the inlet at different angles of attack (circles represent the throat, triangles represent the exit).
Aerospace 11 00941 g017
Figure 18. Distribution of the performance parameters along the inlet under the same equivalent contraction ratio: (a) under Mach 6.0 freestream conditions; (b) under Mach 4.1 freestream conditions (in the data plots, solid lines represent the pressure ratio, while dashed lines indicate the total pressure recovery. In the pressure ratio contour plot, solid lines represent pressure sampling lines, the black dashed lines serve as vertical auxiliary lines, and the black arrow represents the streamline).
Aerospace 11 00941 g018
Figure 19. Three-dimensional flow field of inlets with same equivalent contraction ratio: (a) pressure ratio contour distribution of the inlet; (b) Mach number contour distribution of the inlet.
Aerospace 11 00941 g019
Table 1. Geometric parameters of the inlet.
CRgeoAin (m2)Ath (m2)Lth (m)
4.510.15290.033842.864
5.530.15290.027612.719
6.770.15290.022562.587
8.290.15290.018452.471
10.140.15290.015082.363
Table 2. Inlet performance under different grid densities.
ParametersNodes (million)Mathπthσthφη
Coarse2.133.05524.3380.70999.50%0.986
Medium5.683.05124.4860.70599.59%0.985
Fine8.253.05324.5130.70699.61%0.985
Table 3. Starting performance of inlet under different states.
CRgeoα (°)
4.120−2−3.3
4.51Ma 3.6Ma3.5Ma 3.4Ma 3.3Ma 3.2
5.53Ma 4.0Ma 3.8Ma 3.7Ma 3.6Ma 3.5
6.77Ma 4.4Ma 4.2Ma 4.0Ma 3.9Ma 3.8
8.29Ma 4.8Ma 4.6Ma 4.4Ma 4.2Ma 4.1
10.14 Ma 5.0Ma 4.8Ma 4.6Ma 4.5
Table 4. Performance of internal flow under conditions of Ma = 6.0, α = 0° at various geometric contraction ratios.
Maα (°)CRgeoMathπthσthMaoπoσom (kg/s)φ
6.004.513.47813.0610.7143.37113.7590.6648.01699.54%
6.005.533.26017.8130.7083.12019.0650.6398.02199.60%
6.006.773.05124.4890.7052.85427.9400.6178.02099.59%
6.008.292.83134.2640.6992.63937.5470.5928.01599.53%
6.0010.142.60448.8930.6932.35156.0590.5578.01699.54%
Table 5. Inlet internal flow performance at different angles of attack under the conditions of Ma = 6.0 and α = 0°.
α (°)CRgeoMaMathπthσthMaoπoσom (kg/s)φ
4.16.776.02.687 37.731 0.597 2.525 39.853 0.519 9.844 99.93%
26.776.02.894 29.827 0.666 2.710 33.364 0.583 8.929 99.92%
06.776.03.052 24.516 0.706 2.858 27.875 0.619 8.016 99.51%
−26.776.03.221 19.757 0.740 3.012 22.432 0.644 7.008 97.87%
−3.36.776.03.326 17.235 0.756 3.104 19.443 0.651 6.363 96.76%
Table 6. Internal flow performance of the inlet under the same equivalent contraction ratio.
Maα (°)CRgeoMathπthσthMaoπoσom (kg/s)φ
4.14.15.531.55528.7000.7061.45231.1530.6295.99489.14%
4.106.771.59727.7560.7371.44731.3660.6644.88388.78%
4.1−3.38.291.49331.3930.7291.31935.6750.6294.02089.40%
6.0 4.15.532.95425.2710.6212.79027.8720.5529.84299.91%
6.0 06.773.05224.5160.7062.85827.8750.6198.01699.51%
6.0 −3.38.293.07524.1130.7322.87825.9710.6216.36696.80%
Disclaimer/Publisher’s Note: The statements, opinions and data contained in all publications are solely those of the individual author(s) and contributor(s) and not of MDPI and/or the editor(s). MDPI and/or the editor(s) disclaim responsibility for any injury to people or property resulting from any ideas, methods, instructions or products referred to in the content.

