Author Contributions
Conceptualization, J.W. and W.X.; data curation, J.W., W.X., M.L. and S.Z.; formal analysis, W.X., S.Z. and X.S.; funding acquisition, M.L. and S.Z.; investigation, J.W., Y.K., D.G. and X.H.; methodology, J.W., M.L. and S.Z.; resources, J.W., Y.K. and D.G., software, J.W. and W.X.; validation, J.W., W.X., Y.K., X.S. and X.H.; writing—original draft preparation, J.W.; writing—review and editing, J.W., M.L., S.Z. and X.S.; visualization, J.W. and W.X. All authors have read and agreed to the published version of the manuscript.
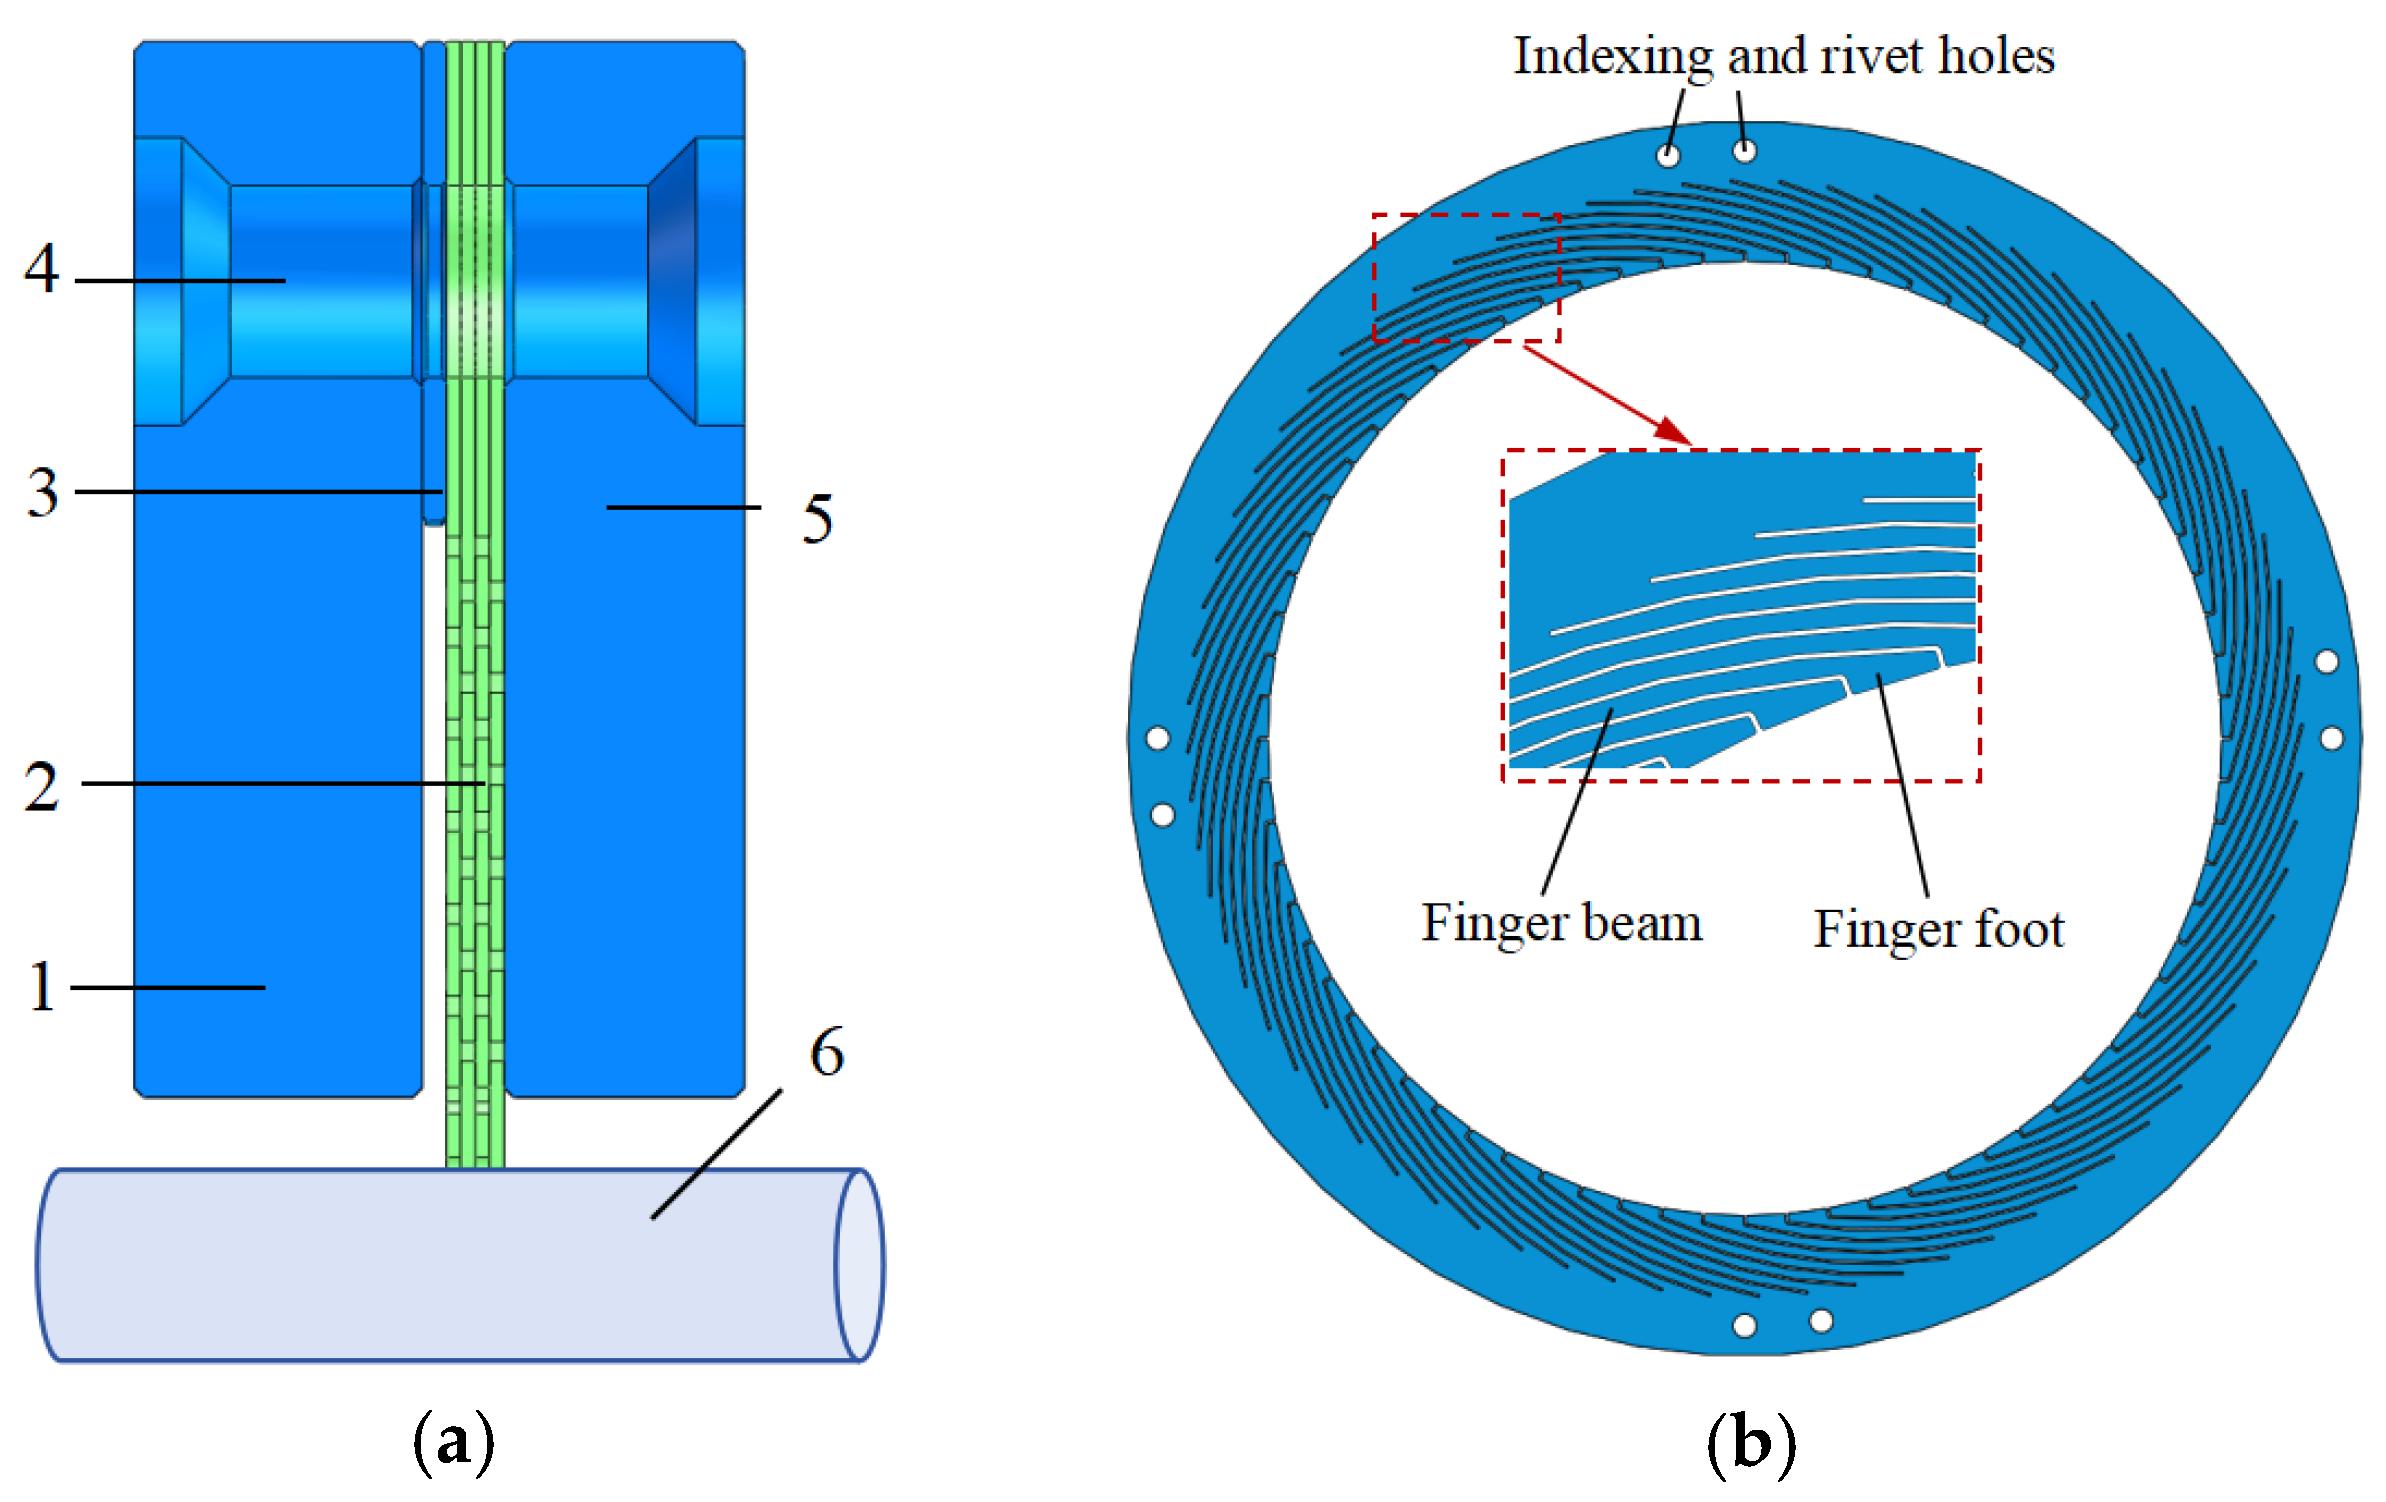
Figure 1.
Schematic diagram of finger seal structure. (a) Schematic diagram of two-dimensional structure of finger seal; (b) Schematic diagram of finger element structure.
Figure 1.
Schematic diagram of finger seal structure. (a) Schematic diagram of two-dimensional structure of finger seal; (b) Schematic diagram of finger element structure.
Figure 2.
Schematic diagram of traditional two-stage finger seal structure.
Figure 2.
Schematic diagram of traditional two-stage finger seal structure.
Figure 3.
Two-dimensional structure diagram of traditional two-stage finger seal.
Figure 3.
Two-dimensional structure diagram of traditional two-stage finger seal.
Figure 4.
Schematic diagram of main structural parameters of finger seal.
Figure 4.
Schematic diagram of main structural parameters of finger seal.
Figure 5.
Calculation area of finger seal.
Figure 5.
Calculation area of finger seal.
Figure 6.
Fluid model of traditional two-stage finger seal.
Figure 6.
Fluid model of traditional two-stage finger seal.
Figure 7.
Heat transfer diagram of two-stage finger seal.
Figure 7.
Heat transfer diagram of two-stage finger seal.
Figure 8.
Overall grid diagram of traditional two-stage finger seal calculation area.
Figure 8.
Overall grid diagram of traditional two-stage finger seal calculation area.
Figure 9.
Comparison diagram between numerical and experimental calculations.
Figure 9.
Comparison diagram between numerical and experimental calculations.
Figure 10.
Grid independence verification.
Figure 10.
Grid independence verification.
Figure 11.
Effect of front plate protection height on pressure drop ratio of two-stage finger seal.
Figure 11.
Effect of front plate protection height on pressure drop ratio of two-stage finger seal.
Figure 12.
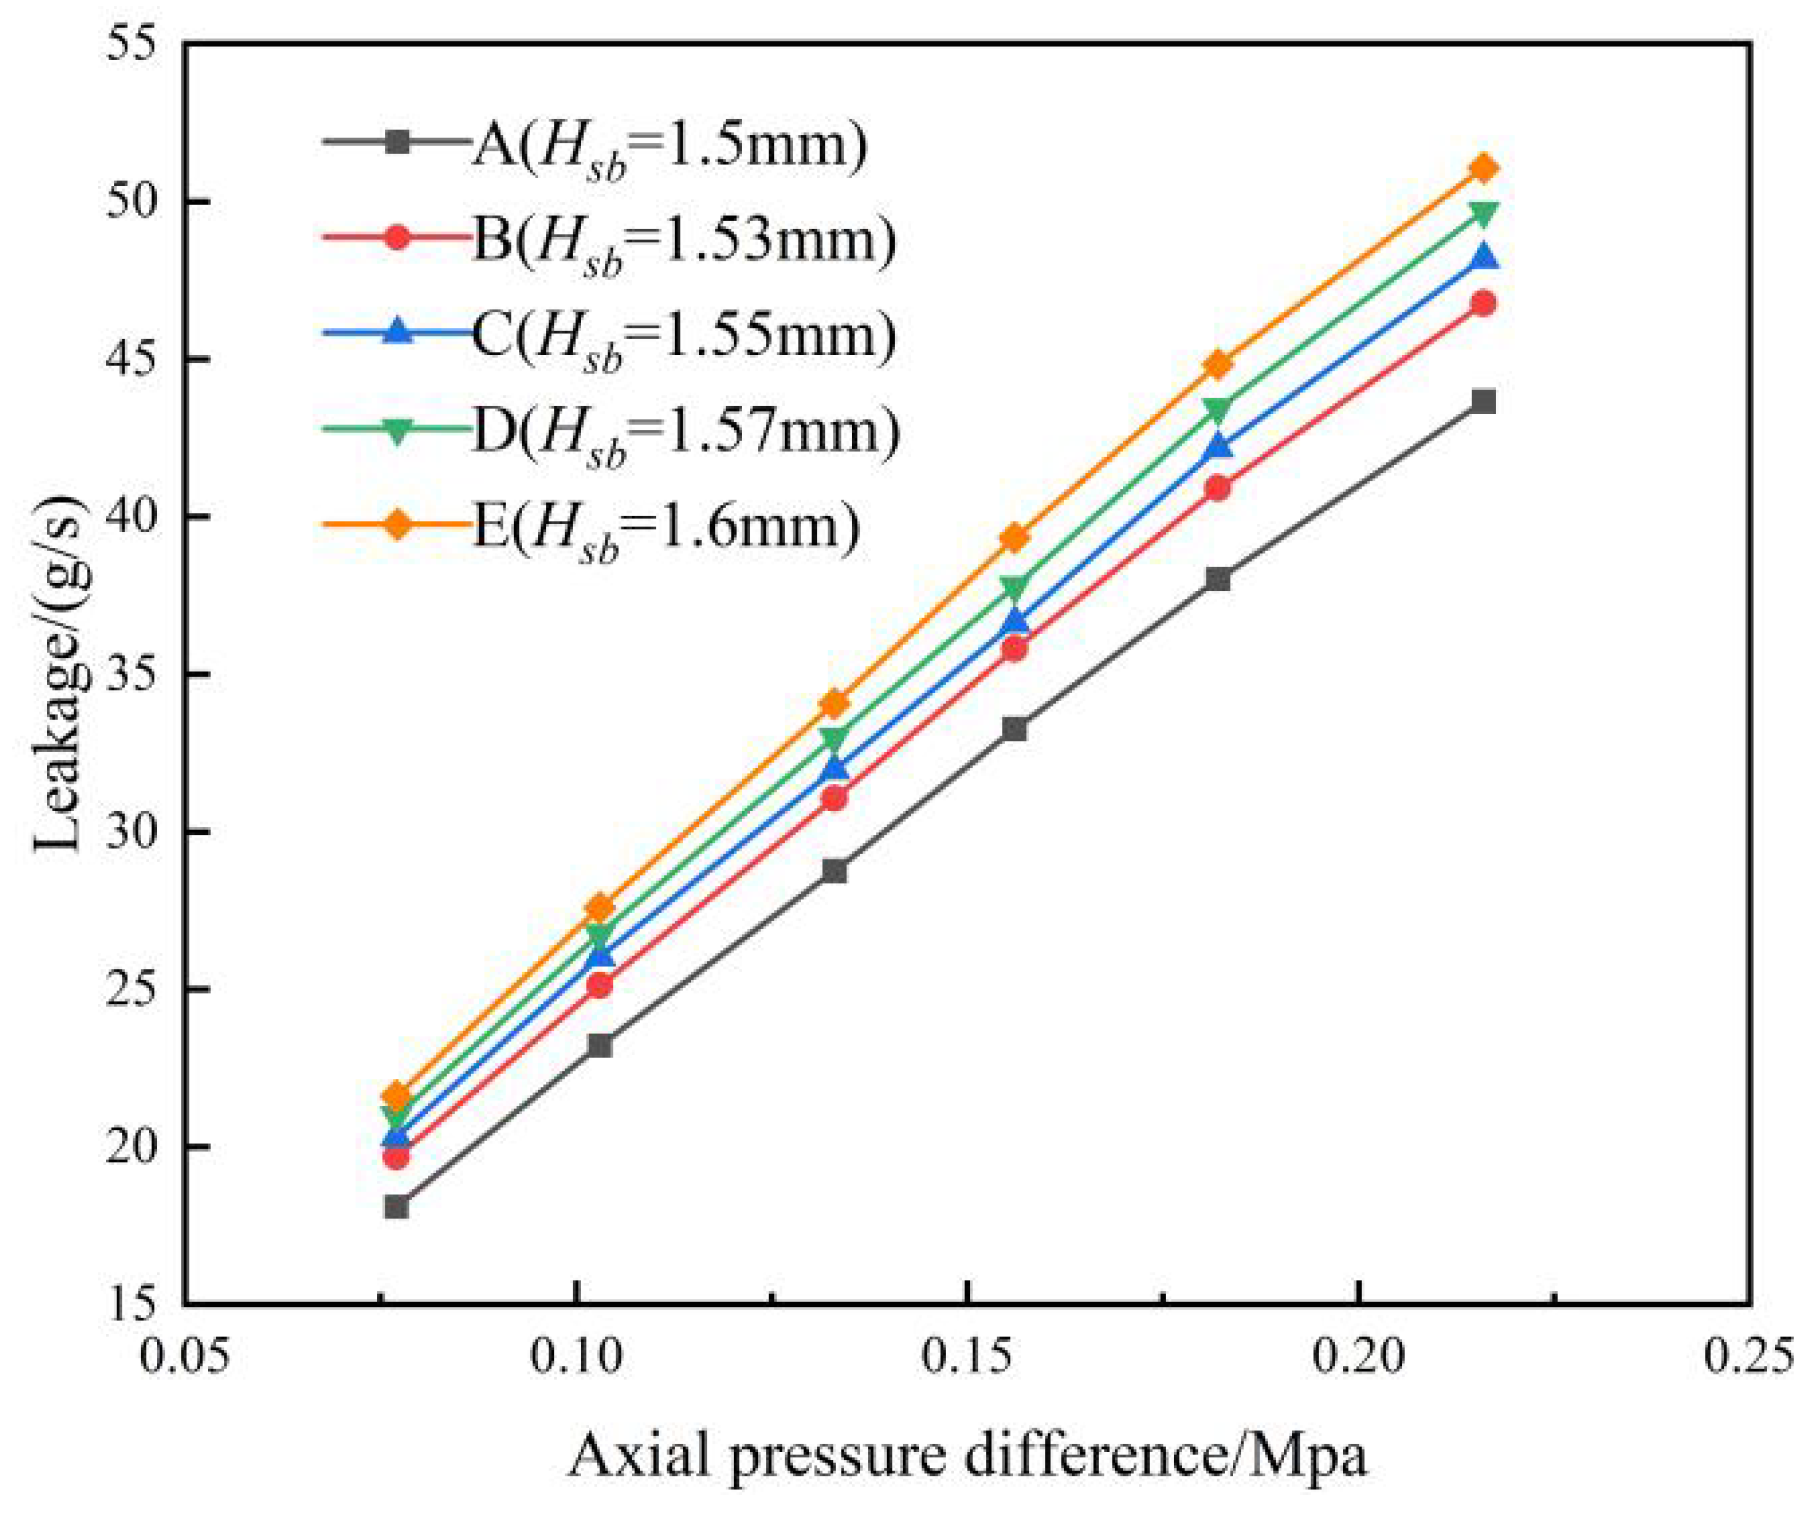
Effect of front plate protection height on leakage of two-stage finger seal.
Figure 12.
Effect of front plate protection height on leakage of two-stage finger seal.
Figure 13.
Schematic diagram of fluid parameters of two-stage finger seal.
Figure 13.
Schematic diagram of fluid parameters of two-stage finger seal.
Figure 14.
Volume flow rate of each section of two-stage finger seal.
Figure 14.
Volume flow rate of each section of two-stage finger seal.
Figure 15.
Schematic diagram of two-stage finger seal.
Figure 15.
Schematic diagram of two-stage finger seal.
Figure 16.
Pressure equalization coefficient of two-stage finger seals with different structures.
Figure 16.
Pressure equalization coefficient of two-stage finger seals with different structures.
Figure 17.
The proportion of interstage pressure drop of two-stage finger seals with different structures.
Figure 17.
The proportion of interstage pressure drop of two-stage finger seals with different structures.
Figure 18.
Influence of protection height of second stage back plate on the leakage of two-stage finger seal.
Figure 18.
Influence of protection height of second stage back plate on the leakage of two-stage finger seal.
Figure 19.
Comparison of leakage between single-stage and two-stage finger seals.
Figure 19.
Comparison of leakage between single-stage and two-stage finger seals.
Figure 20.
Velocity cloud map of the second stage rear bezel before and after improvement. (a) Traditional two-stage finger seal (A structure) velocity cloud map; (b) Speed cloud map of two-stage pressure equalizing finger seal (D structure).
Figure 20.
Velocity cloud map of the second stage rear bezel before and after improvement. (a) Traditional two-stage finger seal (A structure) velocity cloud map; (b) Speed cloud map of two-stage pressure equalizing finger seal (D structure).
Figure 21.
Temperature cloud map of the second stage back plate before and after improvement. (a) Temperature cloud map of traditional two-stage finger seal (A structure); (b) Temperature cloud map of two-stage pressure equalizing finger seal (D structure).
Figure 21.
Temperature cloud map of the second stage back plate before and after improvement. (a) Temperature cloud map of traditional two-stage finger seal (A structure); (b) Temperature cloud map of two-stage pressure equalizing finger seal (D structure).
Figure 22.
Schematic diagram of the two-stage pressure equalizing finger seal with grate teeth (F structure).
Figure 22.
Schematic diagram of the two-stage pressure equalizing finger seal with grate teeth (F structure).
Figure 23.
D structure, F structure leakage.
Figure 23.
D structure, F structure leakage.
Figure 24.
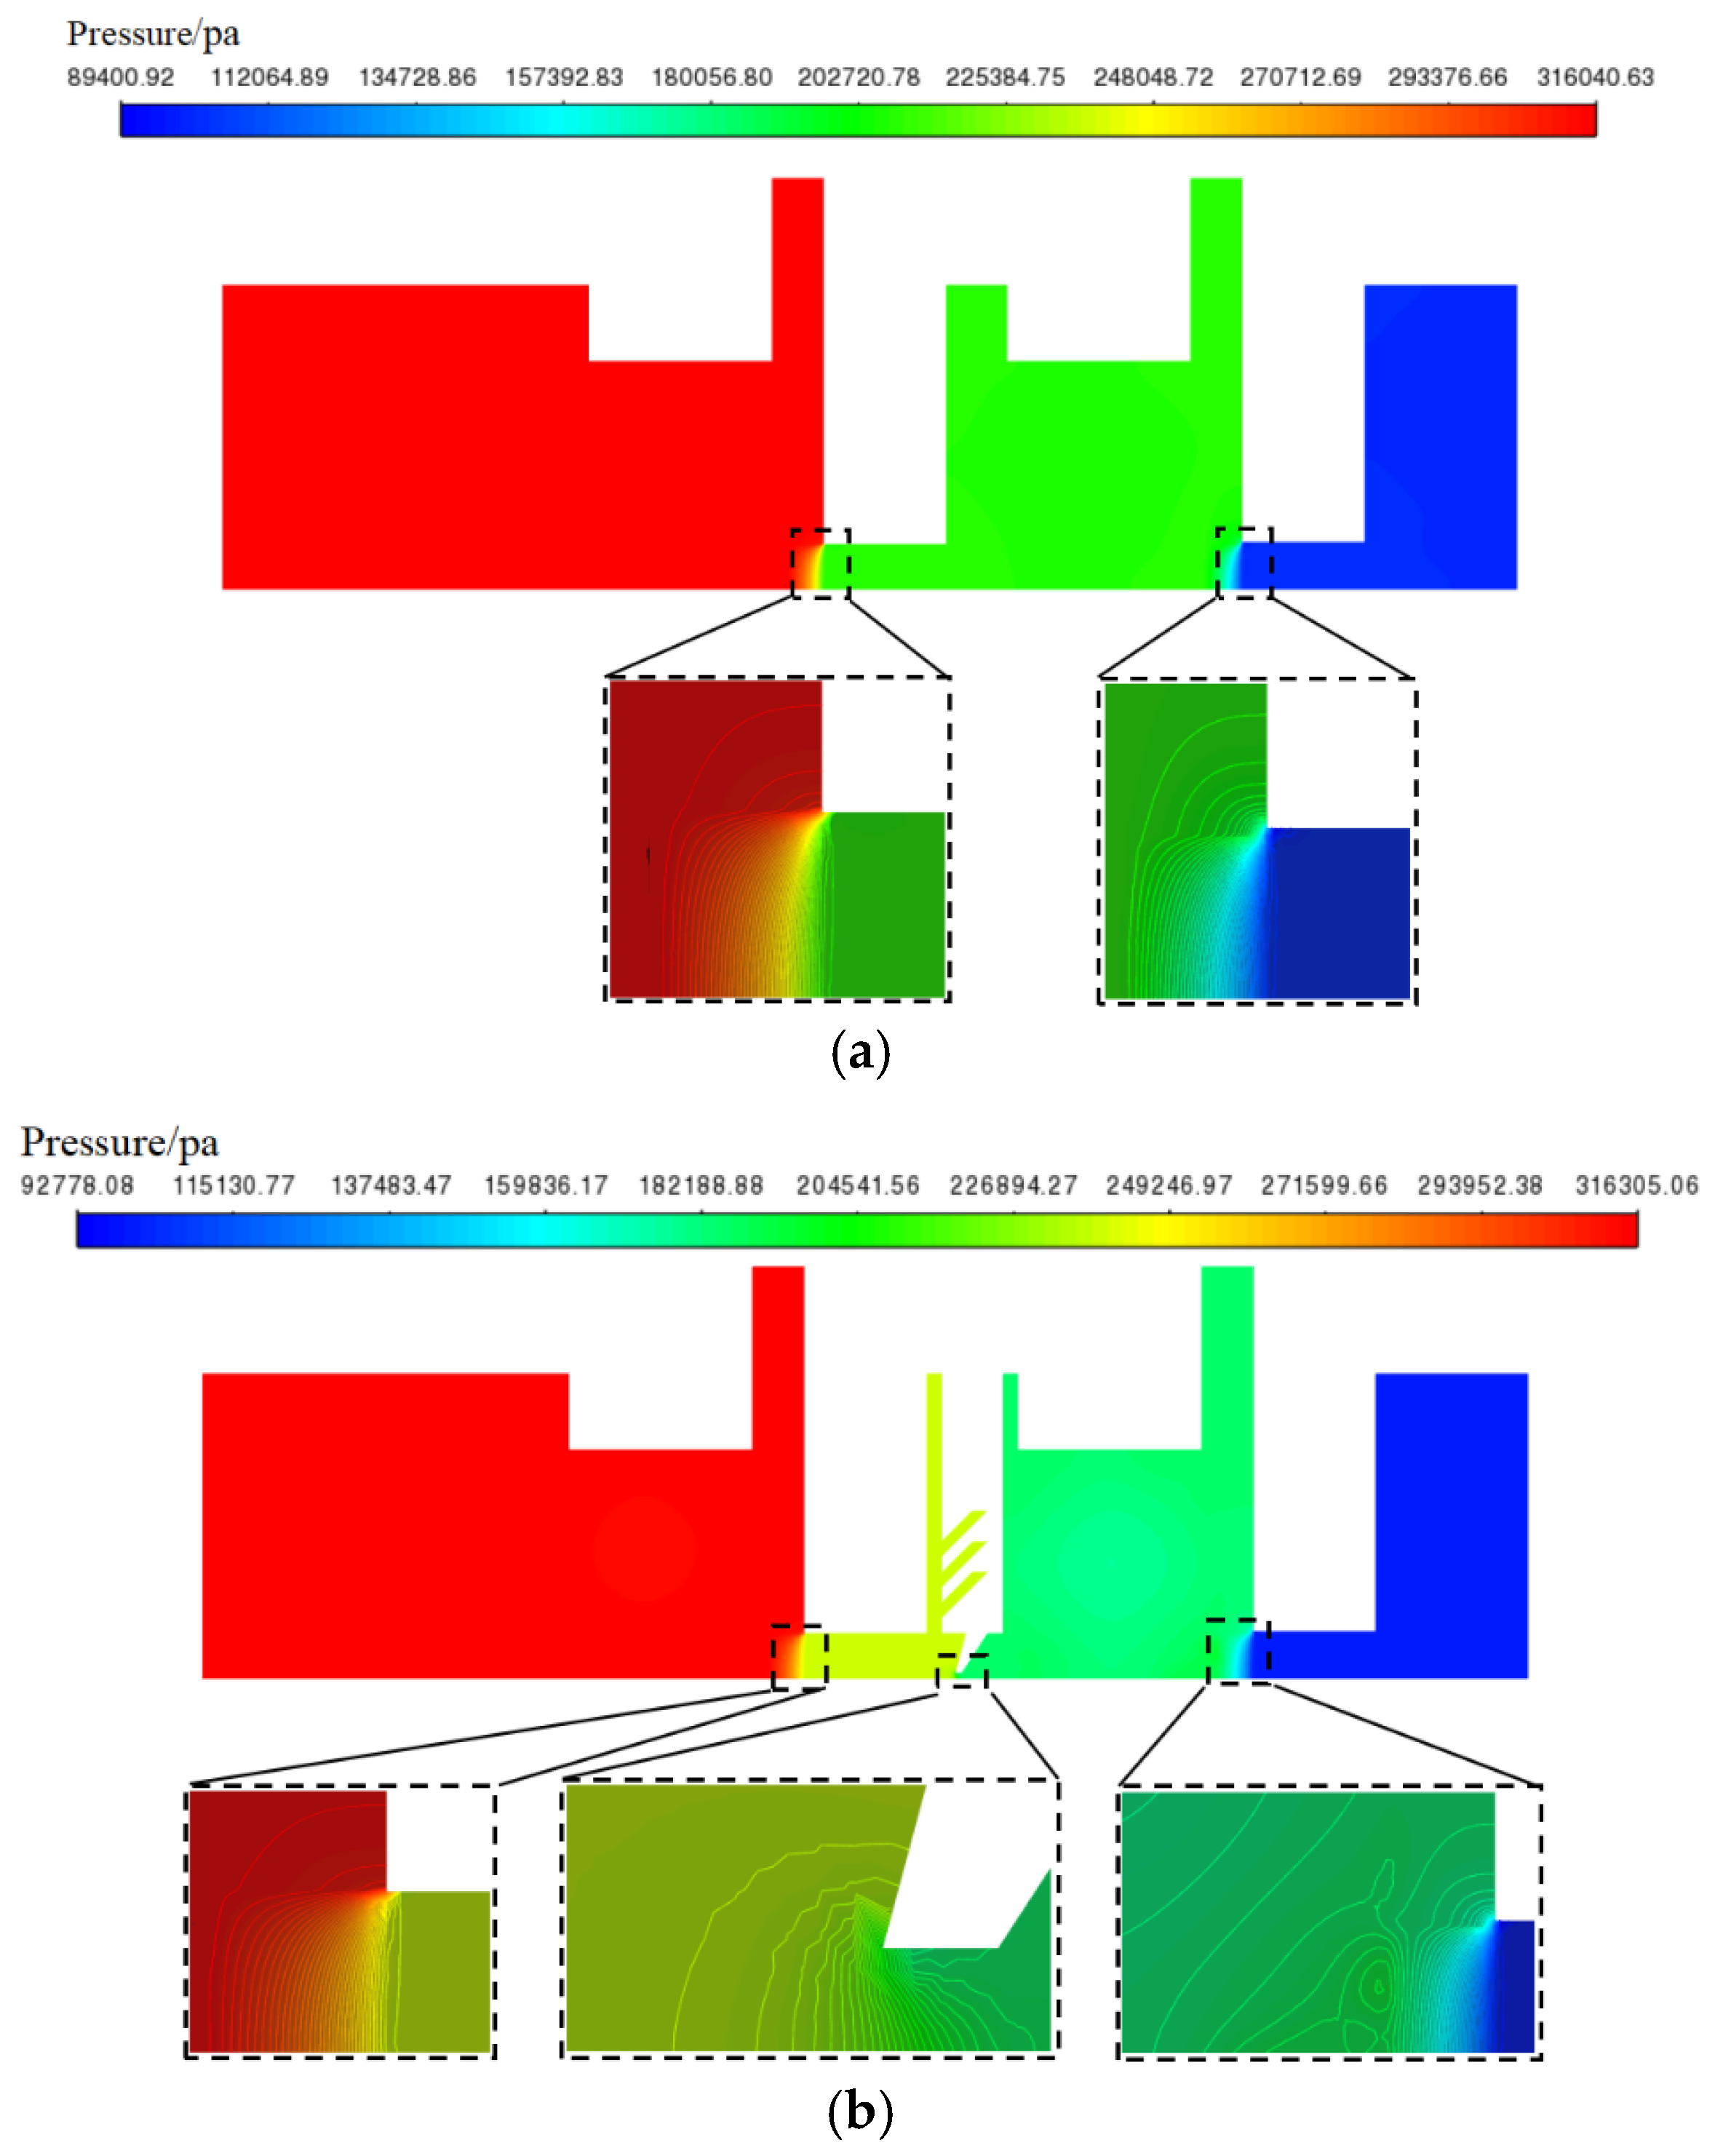
Pressure distribution cloud map of D structure and F structure. (a) Cloud map of axial pressure distribution of D structure; (b) Cloud map of axial pressure distribution of F structure.
Figure 24.
Pressure distribution cloud map of D structure and F structure. (a) Cloud map of axial pressure distribution of D structure; (b) Cloud map of axial pressure distribution of F structure.
Figure 25.
Influence of pressure drop ratio at all levels of D structure and F structure.
Figure 25.
Influence of pressure drop ratio at all levels of D structure and F structure.
Figure 26.
Cloud map of velocity distribution of F structure.
Figure 26.
Cloud map of velocity distribution of F structure.
Figure 27.
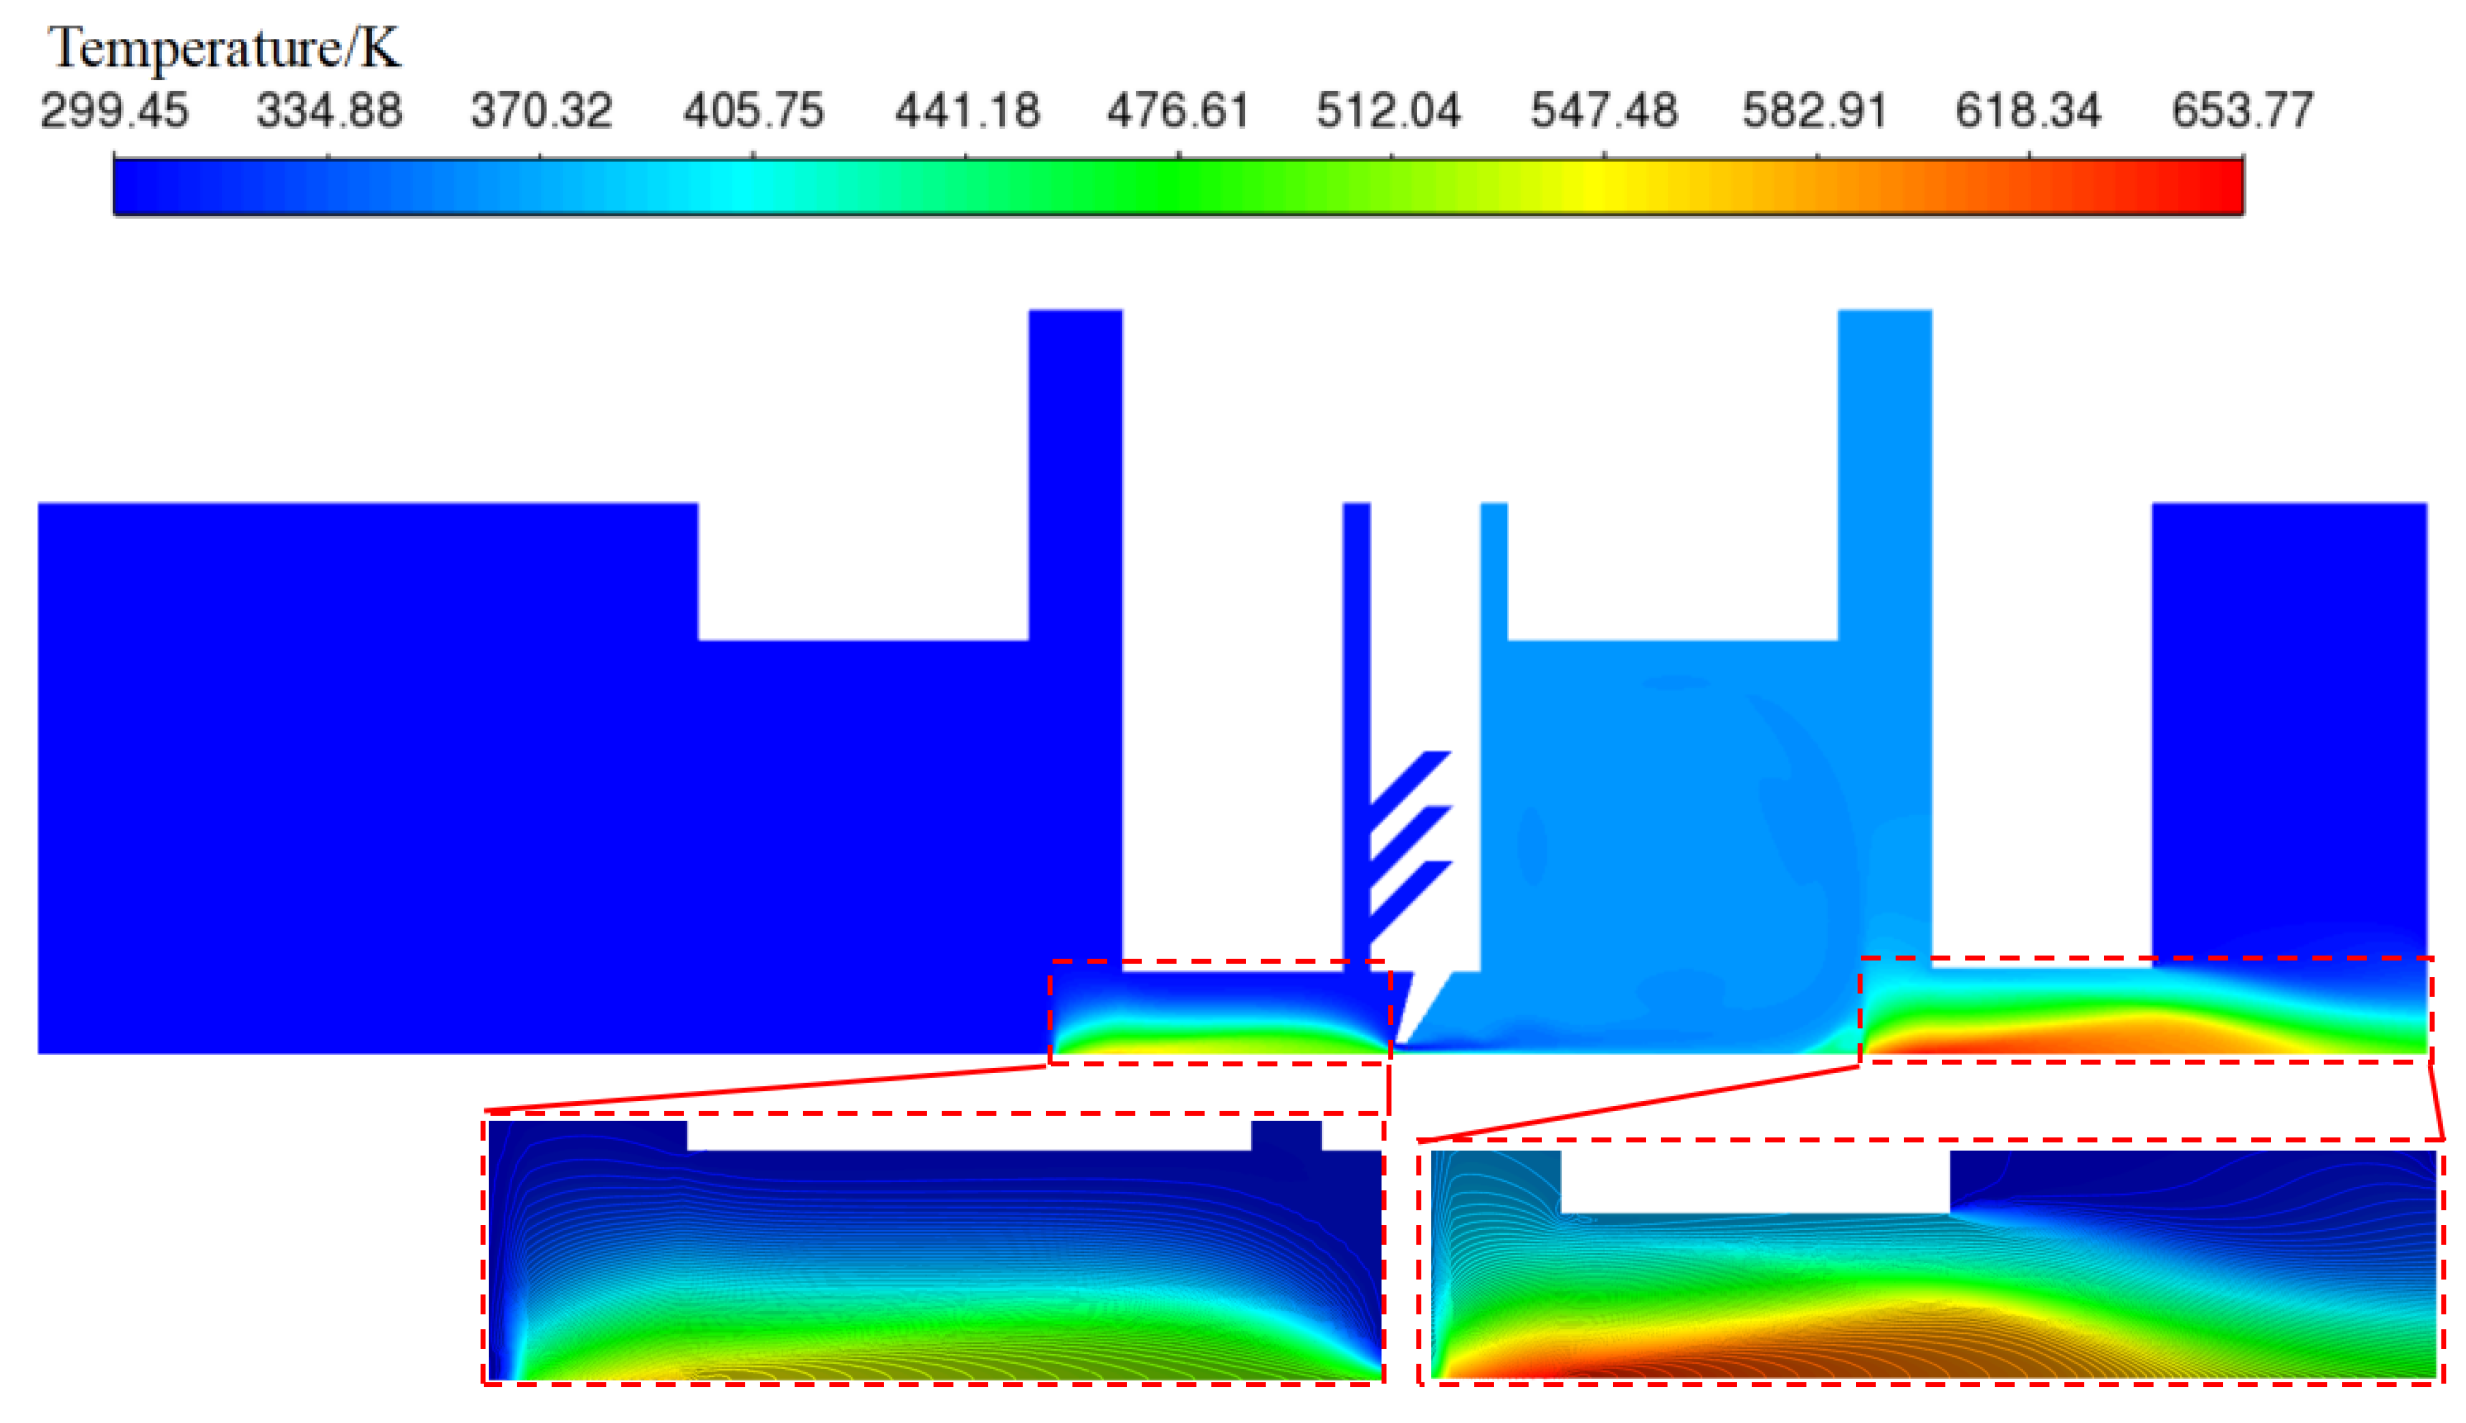
Cloud map of temperature distribution of F structure.
Figure 27.
Cloud map of temperature distribution of F structure.
Figure 28.
Influence of protection height of second stage back plate and grate teeth structure on axial pressure distribution of two-stage finger seal.
Figure 28.
Influence of protection height of second stage back plate and grate teeth structure on axial pressure distribution of two-stage finger seal.
Figure 29.
Pressure drop ratio diagram of A, D, F, and G structures at all levels.
Figure 29.
Pressure drop ratio diagram of A, D, F, and G structures at all levels.
Figure 30.
Leakage of A, D, F, and G structures.
Figure 30.
Leakage of A, D, F, and G structures.
Figure 31.
Velocity cloud map of differential multi-stage finger seal (G structure).
Figure 31.
Velocity cloud map of differential multi-stage finger seal (G structure).
Figure 32.
Cloud map of temperature distribution of differential multi-stage finger seal.
Figure 32.
Cloud map of temperature distribution of differential multi-stage finger seal.
Figure 33.
Maximum temperature at all levels for A, D, F, and G structures.
Figure 33.
Maximum temperature at all levels for A, D, F, and G structures.
Table 1.
Main structural parameters of finger seal.
Table 1.
Main structural parameters of finger seal.
| Structural Parameters | Numerical Value |
|---|
| Base circle diameter | | 43 |
| Inner diameter of seal | | 160 |
| Diameter of upper end of finger foot | | 163 |
| Diameter of root circle of finger beam | | 187 |
| Installation hole uniformly distributed circumferential diameter | | 197 |
| Outer diameter of finger seal | | 207 |
| Arc radius of finger beam | | 85 |
| The angle occupied by a single finger | | 5 |
| Circumferential angle of finger foot | | 4.7 |
| Finger thickness | | 0.3 |
| Width of finger beam gap | | 0.4 |
| Diameter of mounting hole | | 4 |
| Thickness of two-stage spacer ring | | 2 |
| Front plate protection height | | 1.5 |
| Back plate protection height | | 1.5 |
| Number of finger beams | | 72 |
Table 2.
Two-stage finger seals with five different back plate protection heights.
Table 2.
Two-stage finger seals with five different back plate protection heights.
| Sealing Structure | First Stage Finger Seal Back Plate Protection Height/mm | Second Stage Finger Seal Back Plate Protection Height/mm |
|---|
| A | 1.5 | 1.50 |
| B | 1.5 | 1.53 |
| C | 1.5 | 1.55 |
| D | 1.5 | 1.57 |
| E | 1.5 | 1.60 |
Table 3.
Maximum velocity leakage flow of finger seals before and after the improvement of the second stage back plate.
Table 3.
Maximum velocity leakage flow of finger seals before and after the improvement of the second stage back plate.
| Sealing Structure | The Maximum Velocity of Leakage Flow of the First Stage/(m/s) | The Maximum Velocity of Leakage Flow of the Second Stage/(m/s) |
|---|
| Traditional two-stage finger seal (A structure) | 29.41 | 75.40 |
| Two-stage pressure equalizing finger seal (D structure) | 34.20 | 142.48 |
Table 4.
Maximum gas temperature at all levels before and after the improvement of the second stage back plate.
Table 4.
Maximum gas temperature at all levels before and after the improvement of the second stage back plate.
| Sealing Structure | The Maximum Temperature of the First Stage Finger Seal (K) | Maximum Temperature of Second Stage finger Seal (K) |
|---|
| Traditional two-stage finger seal (A structure) | 560 | 636 |
| Two-stage pressure equalizing finger seal (D structure) | 541 | 658 |
Table 5.
Maximum Velocity of Leakage Flow at Different Levels of D Structure and F Structure.
Table 5.
Maximum Velocity of Leakage Flow at Different Levels of D Structure and F Structure.
| Sealing Structure | The Maximum Velocity of Leakage Flow of the First Stage/(m/s) | The Maximum Velocity of Leakage Flow of the Second Stage/(m/s) | The Maximum Velocity of Leakage Flow of the Grate Class/(m/s) |
|---|
| Two-stage pressure equalizing finger seal (D structure) | 34.20 | 142.48 | / |
| Two-stage pressure equalizing finger seal with grate teeth (F structure) | 21.68 | 118.26 | 197.11 |
Table 6.
Effect of grate structure on the maximum temperature of two-stage pressure equalizing finger seal.
Table 6.
Effect of grate structure on the maximum temperature of two-stage pressure equalizing finger seal.
| Sealing Structure | The Maximum Temperature of the First Stage Finger Seal (K) | Maximum Temperature of Second Stage Finger Seal (K) |
|---|
| Two-stage pressure equalizing finger seal (D structure) | 541 | 658 |
| Two-stage pressure equalizing finger seal with grate teeth (F structure) | 557 | 646 |
Table 7.
Maximum velocity of leakage flow at all levels of A, D, F, and G structures.
Table 7.
Maximum velocity of leakage flow at all levels of A, D, F, and G structures.
| Sealing Structure | The Maximum Velocity of Leakage Flow of the First Stage/(m/s) | The Maximum Velocity of Leakage Flow of the Second Stage/(m/s) | The Maximum Velocity of Leakage Flow of the Grate Class/(m/s) |
|---|
| Traditional two-stage finger seal ( A structure) | 29.41 | 75.40 | / |
| Two-stage pressure equalizing finger seal (D structure) | 34.20 | 142.48 | / |
| Two-stage pressure equalizing finger seal with grate teeth (F structure) | 21.68 | 118.26 | 197.11 |
| Differential multi-stage finger seal (G structure) | 28.98 | 124.21 | 207.01 |


 ,
, 


